Article

Will Biochar Suppress or Stimulate Greenhouse Gas Emissions in Agricultural Fields? Unveiling the Dice Game through Data Syntheses

Department of Civil Engineering, California State Polytechnic University, Pomona, CA 91768, USA
*
Author to whom correspondence should be addressed.
Soil Syst. 2022, 6(4), 73; https://doi.org/10.3390/soilsystems6040073
Submission received: 6 August 2022 / Revised: 17 September 2022 / Accepted: 18 September 2022 / Published: 20 September 2022

Abstract

:
With the increasing popularity of biochar as a soil amendment worldwide in recent years, a question of concern arises as to whether the application of biochar would suppress or stimulate greenhouse gas (GHG) emissions. In this study, published data extracted from independent individual studies were systematically selected, statistically processed, graphically presented and critically analyzed to understand biochar’s influences on the emissions of CO2, CH4 and N2O—the three major GHGs emitted in agricultural fields. The results revealed not only the significant importance of biochar’s pyrolysis temperature for its impacts on GHG emissions, but also the dissimilar influences on the generations of different GHGs. The application of biochar, in general, stimulated the emissions of CO2 and CH4 to various extents. With biochar pyrolyzed under relatively lower temperatures (e.g., <500 °C), higher application rates generally resulted in more stimulated CO2 and CH4 emissions; whereas those pyrolyzed under relatively higher temperatures (e.g., >550 °C) became less stimulative (and sometimes even suppressive) for CO2 and CH4 emissions, especially when applied at higher rates. Nevertheless, the response of N2O emission to biochar application contrasted with those of CO2 and CH4. The results may contribute to better regulations for biochar application in combating GHG emissions in agriculture.

1. Introduction

The impacts of climate change occur nearly everywhere around the world. Extreme temperature changes [1], more frequent and drastic weather events [2] and rising sea levels [3] are displacing people, endangering the health of ecosystems [4] and threatening global economies [5]. In recent years, it has been agreed by an increasing number of world leaders that urgent actions need to be taken to tackle the rising challenges resulting from climate change before the tipping point [6,7].
The continuous anthropogenic emissions of greenhouse gases (GHGs), such as CO2, CH4 and N2O, have been identified as the main cause of today’s climate change [8]. According to the data estimated by the U.S. Environmental Protection Agency (USEPA) in 2020, a large portion of the total emissions of GHGs (approximately 11%) was attributed to agricultural activities, especially due to poor soil management practices [9].
As a soil amendment, biochar—a charcoal-like carbonaceous material produced by heating carbon-rich biomass under an oxygen-absent environment—has been widely applied in agricultural fields in many different countries [10,11]. Many previous studies have characterized biochar’s unique physicochemical properties, including but not limited to its large specific surface area (SSA), abundant hydrophilic surface functional groups, high liming capacity and large cation exchange capacity (CEC) [12,13,14]. In light of biochar’s many beneficial physicochemical properties, it has been broadly reported that the application of biochar in agricultural fields would generally improve soil oxygen availability, water and nutrient retention abilities, moderate soil pH and enhance soil health and fertility [15].
However, unlike the above benefits that are often found for biochar-amended soils, biochar’s effects on GHG emissions in agricultural fields have been controversial for decades [16,17,18]. In some studies, biochar could effectively suppress GHG emissions [19,20,21]; in other studies, increased GHG emissions were consistently measured [22,23,24,25]. The different observational results were likely to be predominantly influenced by the different feedstock types and pyrolysis temperatures used for biochar’s production, as well as the complex interactions between biochar, soil microorganisms, soil air, water and available nutrients [26,27,28]. A previously published meta-analysis investigated the different influences of biochar on N2O emissions in response to different H:C ratio of the applied biochar [29]. Nevertheless, this study did not consider the impacts of application rates or pyrolysis temperatures used for biochar production.
By synthesizing published data extracted from independent refereed papers, a recent quantitative review examined the effects of feedstock type and pyrolysis temperature on a variety of biochar properties, including pH, CEC, SSA, ash content, volatile matter content and elemental compositions [30]. When the same type of feedstock was discussed, strong correlations were observed between the pyrolysis temperatures and the above properties. Moreover, there were significant differences between high-temperature and low-temperature biochars [30]. Due to the different physicochemical properties, the functions of biochar usually differ [31,32]. Li et al. reported that, given the same environmental conditions (e.g., soil N content, moisture dynamics and soil type), N2O emission could be either suppressed or stimulated after applying biochar in fields, largely depending on the specific characteristics of the added biochar [30].
Our study hypothesized that (1) pyrolysis temperature may considerably shape biochar’s physicochemical properties and subsequently affect biochar’s effects on GHG emissions in agricultural fields, (2) biochar’s effects on the emissions of different GHGs may be dissimilar and (3) low-temperature biochar’s effects on GHG emissions may contrast with those produced under high-temperature conditions. As a matter of fact, although the charcoal-like materials added to agricultural fields in all the investigated previous studies share the same name “biochar”, they may end up functioning in completely different manners and lead to contradictory consequences. Understanding the actual influences of biochar on GHG emissions may contribute to regulating biochar applications in the near future, especially in the face of deteriorating climate change.

2. Methodologies

2.1. Screening Published Articles as Data Sources

The data used in this study were collected from 82 independent peer-reviewed research articles published prior to 1 May 2022. The keywords “biochar”, “pyrolysis temperature” and at least the three GHGs (i.e., “CO2”, “CH4”, or “N2O”) were simultaneously entered for literature search. The databases used include Web of Science, Science Direct and JSTOR. Because of the high volume of research on biochar published over recent years, articles containing obsolete information were manually removed from the search results and most of the articles selected for further processing were those published within the last decade. As a parameter that is often used to reflect the rigor of a research paper, the journal’s SCI impact factor were taken into consideration while filtering articles [33,34,35]. Although low-quality research can also be found in a journal with a high SCI impact factor, the probability of such situation is generally low [34].
In light of the relatively larger number of studies published online, articles focusing on the biochar produced from woody materials through slow pyrolysis (300–500 °C) were finally determined as the data sources for data collection. Besides feedstock type and pyrolysis temperature, various other factors may also affect biochar’s effects on GHG emissions, including pyrolysis residence time, biochar application rate and soil type. To minimize the number of variables, when selecting articles for data collection, biochar was produced through a pyrolysis residence time of ~2 h in the studies and subsequently applied to sandy soil. In addition, all the selected studies were conducted with biochar as the sole additive to the soil.

2.2. Collecting Quantitative Data

Quantitative data were collected from the selected articles with the purpose of understanding how biochar’s application rate in agricultural fields would affect the emissions of CO2, CH4 and N2O, respectively. For each type of biochar (categorized by its pyrolysis temperature) applied to sandy soil, 30-day cumulative GHG emissions were analyzed at different application rates. Articles that provided cumulative GHG emissions over time were directly read. However, when only GHG emission fluxes were provided, ImageJ, a Java-based image processing program developed by the National Institutes of Health (NIH), was used to calculate the area under the emission flux vs. time curves. A pixel aspect ratio was first determined to account for the different scales on each axis, followed by the drawing of a polyline to obtain measurements from the figures.

2.3. Processing Data from Different Articles

Various data collected from different articles often did not contain the same units. Therefore, these different units must be converted to be consistent before any comparisons can be made. For example, the application rates were found to be reported in % (w/w) in most studies. However, the other unit “metric ton per hectare” (t/ha) was also used in some studies. To convert t/ha into % (w/w), a common soil bulk density of 1.2 g/cm3 and a soil depth of 10 cm were assumed. In the studies selected for the data syntheses, biochar application depths vastly varied from 10 to 15 cm. In general, soil from the 0–10 cm layer contains significantly higher soil organic matter (SOM), ammonium (NH4+-N) and nitrate (NO3-N) than those from the deeper layers [36]. As a result, the 0–10 cm layer is mainly responsible for the emissions of GHGs (e.g., CO2, CH4 and N2O) and is the most affected when biochar is applied. When converting biochar application rate unit from t/ha to % (w/w), using a deeper soil depth (e.g., 15 cm) is neither necessary nor appropriate.
In order to evaluate the effects of biochar on GHG emissions, the percentage change in cumulative GHG emissions (% Change) over time were determined by comparing the cumulative emissions with biochar application and those without (i.e., control), as shown in Equation (1).
%   Change = Cumulative   Emissions biochar Cumulative   Emissions control Cumulative   Emissions control
Positive changes imply stimulated emissions with biochar, while negative changes indicate suppressed emissions. When the percentage change between the biochar impacted emission and the control emission was insignificant (regardless of the different numerical value), the percentage change is considered as zero (i.e., 0%).

2.4. Statistical Analyses

To ascertain the significance of the observed changes in GHG emissions after biochar application, different statistical analyses were performed using the R software package version 3.4.1 (R Core Team, 2021). Nonparametric tests were adopted because the data distributions might be slightly skewed. To demonstrate the uncertainties associated with the syntheses, a 95% confidence interval and a 95% prediction interval were developed for each nonlinear regression data synthesis, respectively. When running an analysis of co-variance (ANCOVA) for the examination of statistical significance, the criterion was set as p-value < 0.05. The Monte Carlo propagation method was used to incorporate uncertainties in the original studies into the data synthesis.

3. Results

3.1. Effects of Biochar on CO2 Emissions

As a soil additive that possesses very different characteristics from the receiving soils, biochar is expected to alter the soil environment and subsequently affect microbial activities that are responsible for CO2 emissions [15,22,37]. As shown in Figure 1, CO2 emissions in agricultural fields were significantly influenced after the application of biochar. Nevertheless, the effects on CO2 emissions varied considerably, largely depending on the specific pyrolysis temperature used for biochar production.
For woody biochar produced at 300 °C, increasing the application rate continuously stimulated CO2 emissions, as compared with the control emissions (in which no additives were applied) (Figure 1a). A nearly linear trend was found for the relationship between percentage change in CO2 emissions and biochar application rates. Finally, the CO2 emissions in biochar-amended agricultural fields were nearly doubled (i.e., close to +100% as change) when high application rates (e.g., 15%) were adopted (Figure 1a). Although woody biochar produced at 500 °C also promoted CO2 emissions, the influences seemed to be much milder (Figure 1b). Further increase in the application rate (e.g., >10%) did not continue increasing CO2 emissions (Figure 1b). When higher-temperature biochar (produced at 550 °C or above) was added at application rates smaller than 5%, CO2 emissions were slightly stimulated; however, with a higher application rate (e.g., >10%), the presence of biochar in the fields started to suppress CO2 emissions (Figure 1c).

3.2. Effects of Biochar on CH4 Emissions

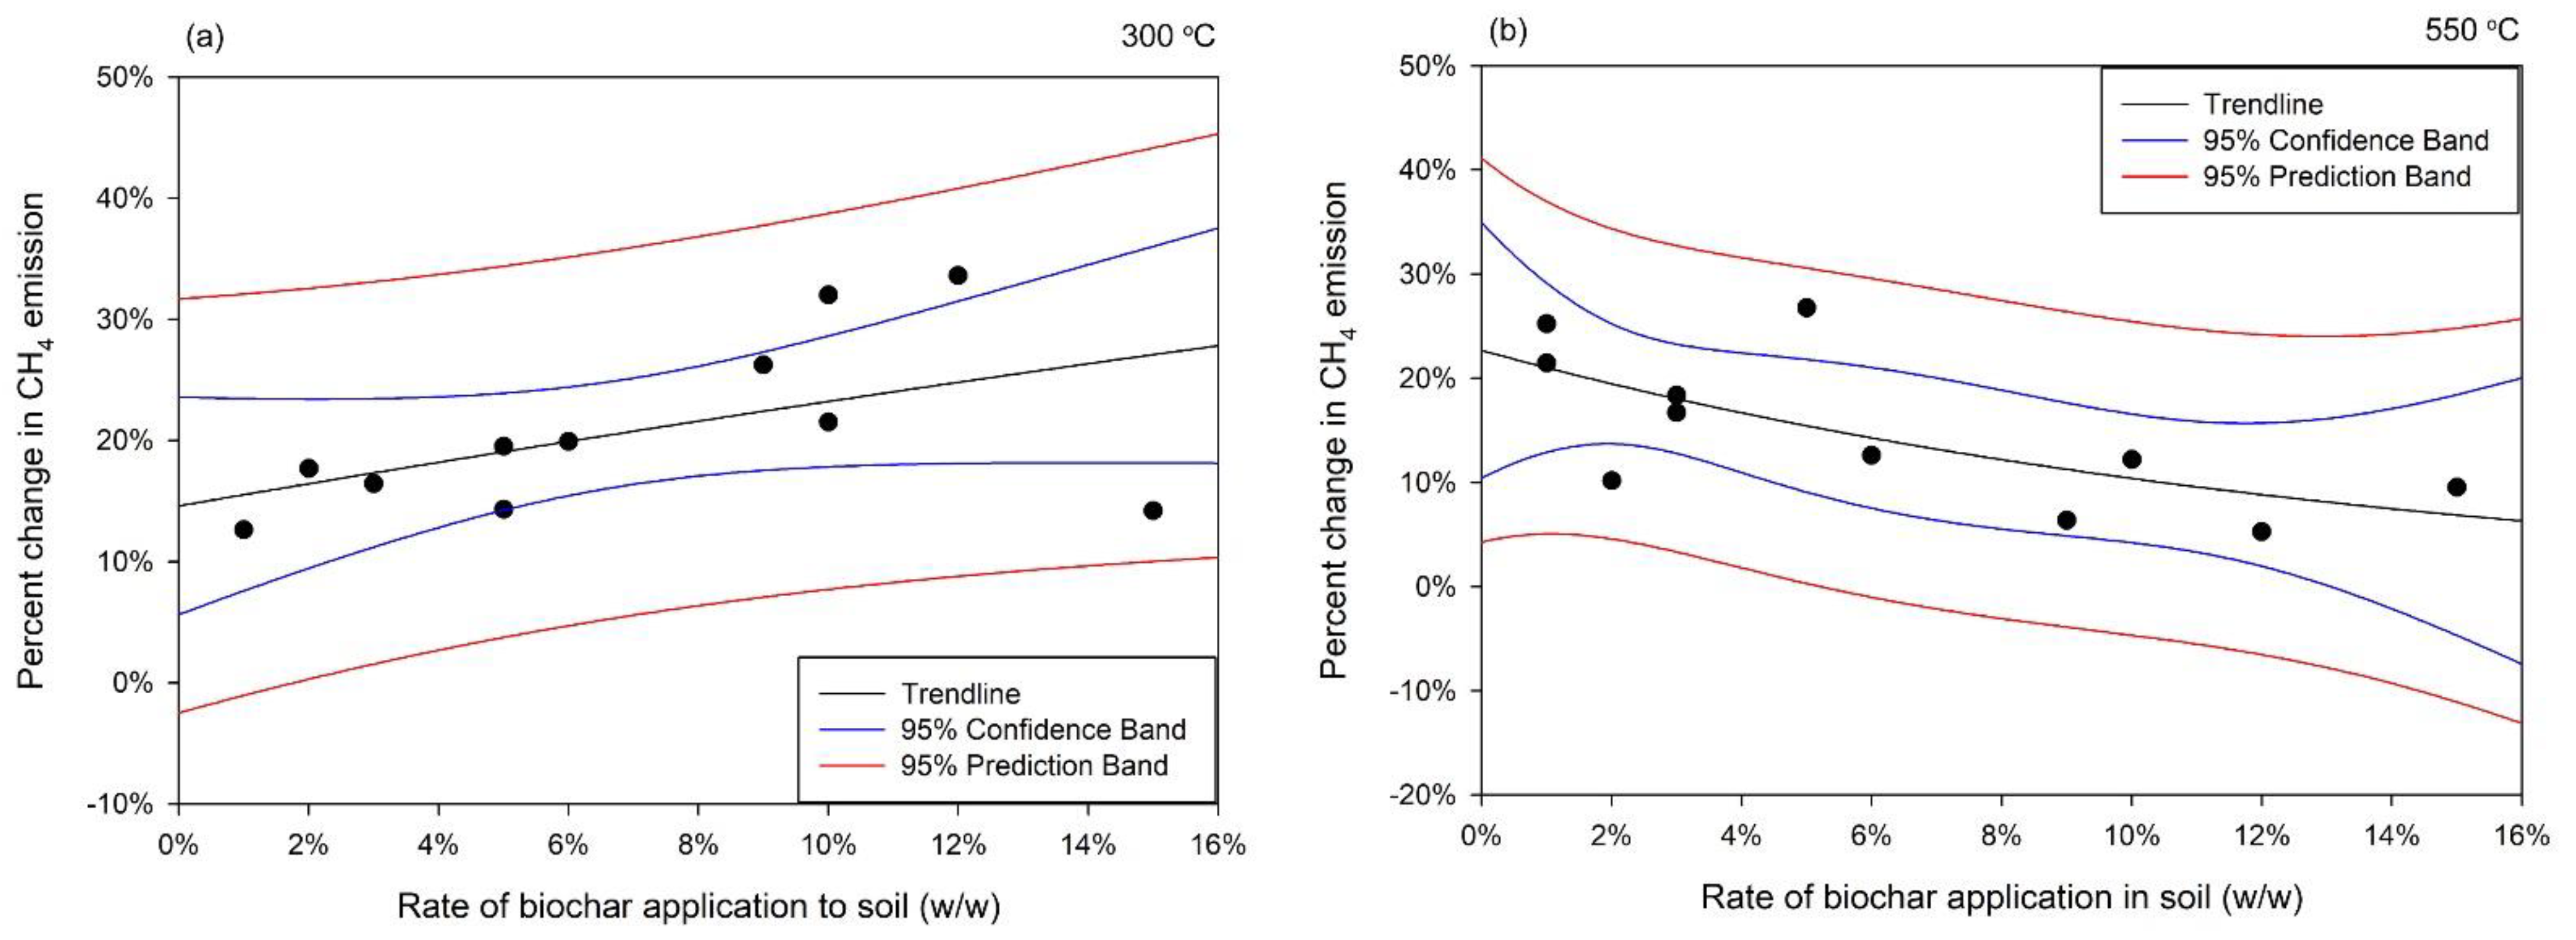
According to the data synthesis, by increasing the amount of low-temperature biochar (produced around 300 °C) applied to the fields (mostly paddy soils but also a few forest soils), CH4 emissions were raised by up to 10–40% (Figure 2a). Similar to biochar’s effects on CO2 emissions, the biochar produced at higher temperatures (e.g., 550 °C or above) also stimulated more CH4 emissions at lower application rates, but the stimulative effect gradually weakened at higher application rates (Figure 2b).

3.3. Effects of Biochar on N2O Emissions

The effects of biochar application on N2O emissions were contradictory to those on CO2 and CH4 emissions (Figure 3). When low-temperature biochar (pyrolyzed at 300 °C) was applied, there were more suppressive effects than stimulative effects and the suppression on N2O emissions became increasingly significant with the increase in the application rate of biochar (Figure 3a). However, adding higher-temperature biochar (pyrolyzed at 500 °C) to agricultural fields seemed to have suppressive effects on N2O emissions at lower application rates (e.g., smaller than 4%) but stimulative effects at higher application rates (e.g., greater than 4%), as shown in Figure 3b. The higher application rate used, the more N2O emissions stimulated. At a high application rate of 15%, the N2O emissions were reported to be nearly doubled (i.e., close to +100% as the change) when compared with the control (Figure 3b).

4. Discussion

4.1. Influences of Pyrolysis Temperature and Application Rate of Biochar on CO2 Emissions

Due to the relatively small heat flows through the feedstock, thermal decomposition is often incomplete in low-temperature biochar (e.g., 300 °C). As a result, some biochemically decomposable organic materials (i.e., liable carbon), either on the surface or in the pores of biochar, could remain [38,39]. As a higher biochar application rate was used in the fields, the amount of biodegradable organic compounds would also increase proportionally. The biodegradable organic compounds provided more carbon sources for CO2-emitting metabolic activities [40,41], which consequently contributed to increasing CO2 emissions (Equation (2)), especially when these compounds are near the ground surface for aerobic decomposition.
Aerobic   conditions :   CH 2 O + H 2 O + O 2 CO 2 + 2 H 2 O + energy
Besides, low-temperature biochar is also known for having abundant hydrophilic surface functional groups and high cation exchange capacities (CECs) [12,13,30]. These additional features could attract water, minerals and other necessary nutrients that are beneficial for microbial activities [42,43].
Unlike low-temperature biochar, when produced at 500 °C biochar generally contains very few biodegradable organics (if not none); at the same time, its surface functional groups become more aromatic [12]. Therefore, higher application rates may not be favorable for CO2 emissions. However, the highly porous surface of biochar with many macropores (>50 nm) and mesopores (size 2–50 nm) could provide niches for microorganisms to flourish [44]. These pores are usually partially saturated with a good mixture of soil water and air, which are necessary for aerobic decomposition that generates CO2 [45,46]. It was possible that, when the application rate was 10% (w/w) and above, the benefits introduced by biochar (e.g., O2, water, minerals and nutrients) were approaching their maximums. Since little liable carbon were able to be added by increasing the amount of biochar, there was no further stimulation for CO2 emissions.
Higher-temperature biochar (produced at 550 °C) is very resistant to biodegradation [30,47]. Therefore, the application of biochar in the fields could not increase the amount of liable carbon to be decomposed. Besides, micropores (<2 nm) begin to dominate rather than macropores and mesopores, so very few niches for microorganisms could be introduced through biochar application [48]. The stimulated CO2 emissions at lower application rates were likely to be a result of the improved water, O2 and nutrient availability brought about by the high-temperature biochar [45,46]. However, because higher-temperature biochar itself is recalcitrant and has very strong adsorptions for water, O2 and nutrients [13,45], when applied to the fields at higher rates, besides decreasing the content of liable carbon in soil, recalcitrant biochar also started competing for various metabolic necessities against soil microorganisms [49]. As liable carbon, water, O2 and/or nutrients all became less available to microorganisms growing in the surrounding soils, CO2-generating metabolic activities of these soil microorganisms weakened [50].

4.2. Influences of Pyrolysis Temperature and Application Rate of Biochar on CH4 Emissions

Due to the remaining undecomposed organic compounds on the surface and/or in the pores of low-temperature biochar (300 °C), adding more biochar may also introduce more liable carbon to the soil [41,51]. Under oxygen-limited circumstances (e.g., below soil surface), these additional liable carbon could generate more CH4 through anaerobic decomposition [41]. During anaerobic decomposition of these organics, CO2 was also generated as a byproduct or intermediate product (Equations (3) and (4)):
Anaerobic   conditions :   2 CH 2 O + H 2 O CH 4 + CO 2 + H 2 O + energy
CO 2 + 4 H 2 CH 4 + 2 H 2 O + energy
Besides, the applied biochar could also improve the retention of water, minerals and necessary nutrients near the rhizosphere [45], thus strengthening relevant metabolic activities of soil microorganisms.
Higher-temperature biochar (e.g., 550 °C) is different low-temperature biochar (e.g., 300 °C). The stimulated CH4 emissions by biochar produced around 550 °C at lower application rates was probably due to the optimized water and nutrients in the soil owing to the enhanced retention by biochar [13,45]. However, when the application rate was too high (e.g., >10% w/w), the introduction of a large amount of recalcitrant biochar decreased the content of liable carbon in the soil. Therefore, the organic C available for CH4 generation became limited [41]. At the same time, the strong adsorption by these nonbiodegradable biochar might also compete for dissolved nutrients against nearby microorganisms [49]. As a result of the decreases in liable carbon and available nutrients, the populations and activities of the soil microorganisms were negatively impacted. Eventually, CH4 emissions could be mitigated if the application rate was further increased.

4.3. Influences of Pyrolysis Temperature and Application Rate of Biochar on N2O Emissions

When low-temperature biochar (300 °C) was applied, the suppression of N2O emissions at lower application rates might be due to the O2 introduced [20,45], while the simulation at higher application rates was hypothesized to be a result of the attraction and accumulation of mobile NO3 from the surrounding soils [13]. High-temperature biochar would possess a strong ability to retain NO3 and other N-containing ions (e.g., NO2 and NH4+) [13,30]. As more NO3 and NO2 became available for the denitrification process (Equation (5)), more N could join microbial metabolisms for N2O generation. On the other hand, increasing application rate might also increase O2 in biochar-amended soil, which would be unfavorable for the denitrification process—the major process for N2O generation [52], as shown in Equation (5):
Anaerobic   conditions :   2 NO 3 2 NO 2 2 NO N 2 O
In addition to the increased O2 due to biochar application, a previous study concluded that biochar could function as an “electron shuttle” to facilitate the last step of denitrification (i.e., from N2O to N2), thus reducing the emissions of N2O by 10–90% [53]. This was consistent with the suppressive effects of biochar when low-temperature biochar was applied.
The increasingly simulative effect of high-temperature biochar (500 °C) at higher application rates was hypothesized to be a result of the attraction and accumulation of mobile NO3 from the surrounding soils [13]. High-temperature biochar is often characterized for its strong ability to retain NO3 and other N-containing ions (e.g., NO2 and NH4+) [13,30]. As more NO3 and NO2 became available for the denitrification process (Equation (5)), more N could join microbial metabolisms for N2O generation.

4.4. Effects of the Same Biochar on the Emissions of Different GHGs

As per the results in this study, the effects of biochar application on GHG emissions cannot be simply summarized without specifying which GHG is being discussed. For example, for the same type of low-temperature biochar (pyrolyzed at 300 °C), when added to agricultural fields at different application rates, the stimulative effects on CO2 and CH4 emissions increased (Figure 1a and Figure 2a); nevertheless, the simulative effects on N2O emissions diminished until it became suppressive effects (Figure 3a). Likewise, when higher-temperature biochar (pyrolyzed at 500 °C) was applied, CO2 and N2O emissions were more stimulated at higher biochar application rates (Figure 1b and Figure 3b), while CH4 responded differently (Figure 2b). The emissions of different GHGs were resulted from different soil microbial activities [22,54]. When biochar was added to agricultural soils, it altered the soil environments for microorganisms to metabolize [15,48]. Because the microorganisms responsible for different GHGs are mostly different [49], it is important to focus on the impacts of biochar on a specific GHG at a time. In addition, the added biochar may be able to suppress the emissions of one GHG but at the same time stimulate the emissions of other GHGs. To minimize the impacts of the emitted GHGs on climate change, the emission rates and global warming potentials (GWPs) of the GHGs should be analyzed in a matrix to weigh the overall hazards.

4.5. Effects of Different Biochars on the Emissions of the Same GHG

When biochars are produced through different pyrolysis conditions and using different feedstocks, their final physicochemical properties generally differ [30]. As a result, the effects of different biochars on the emissions of even the same GHG would not be the same, as shown in Figure 1, Figure 2 and Figure 3, respectively. In those individual studies selected for the data syntheses, the biochar added was all produced from woody materials but under different pyrolysis temperatures. The results demonstrated that the specific pyrolysis temperature used for biochar production played a predominant role in how biochar application would affect GHG emissions. Therefore, in order to use biochar for the mitigation of GHG emissions in agricultural fields, it is particularly important to produce the biochar under the most appropriate conditions for the specific tasks. Such conditions must be further investigated for each feedstock type and the results from these investigations should be shared by the biochar manufacturers for better guidance on product use. Additionally, biochar produced using certain feedstock and at some pyrolysis temperatures may significantly stimulate the emissions of more than one GHG within a broad range of application rate. It is alarming because, unlike most people’s impression (or expectation), adding biochar to agricultural fields does not guarantee the mitigation of GHG emissions. Sometimes it may actually do the opposite work. The success of using biochar for GHG emission control heavily relies on choosing the “correct” biochar as the soil amendment to be applied. Biochar manufacturers may focus on collecting relevant data for their products and use this information to provide more specific recommendations to optimize the effectiveness of each biochar product.

4.6. Future Research Directions

The results in this study indicate that biochar’s pyrolysis temperature has a significant influence on biochar’s effects on the emissions of each specific type of GHG. However, many other relevant factors, such as biochar’s production methods, production conditions, feedstock types and feedstock pretreatments, may also have considerable influences on GHG emissions in biochar-amended soils. Future research could scrutinize the effects of each of these factors on GHG emissions. In addition, the co-influences of several factors should be discussed through factorial experiments (i.e., multiple-factor experiments). However, conducting these experiments systematically can be prohibitory in terms of the associated expenses. It would be more economically feasible to work on their data syntheses beforehand. Another limitation of this study is the lack of literature data on biochar produced at temperatures above 600 °C. Biochar produced at such higher temperatures (e.g., 600–1000 °C) are highly recalcitrant. They may have different influences on GHG emissions from amended soils. More field experiments need to be carried out using higher-temperature biochar to explore the potential differences.

Author Contributions

Conceptualization, S.L.; methodology, S.L. and C.Y.C.; software, C.Y.C.; validation, S.L. and C.Y.C.; formal analysis, S.L. and C.Y.C.; investigation, C.Y.C.; resources, S.L.; data curation, C.Y.C.; writing—original draft preparation, C.Y.C.; writing—review and editing, S.L.; visualization, S.L.; supervision, S.L.; project administration, S.L.; funding acquisition, S.L. All authors have read and agreed to the published version of the manuscript.

Funding

This research was funded by USDA-NIFA HSI Education Program, grant number 2020-38422-32253. Besides, this research is also supported by the Research, Scholarship and Creative Activity (RSCA) Program of the California State Polytechnic University, Pomona, account code 44900-POS0560130310050202.

Institutional Review Board Statement

Not applicable.

Informed Consent Statement

Not applicable.

Data Availability Statement

Not applicable.

Conflicts of Interest

The authors declare no conflict of interest. The funders had no role in the design of the study; in the collection, analyses, or interpretation of data; in the writing of the manuscript; or in the decision to publish the results.

References

  1. Astrom, D.O.; Forsberg, B.; Ebi, K.L.; Rocklov, J. Attributing Mortality from Extreme Temperatures to Climate Change in Stockholm, Sweden. Nat. Clim. Chang. 2013, 3, 1050–1054. [Google Scholar] [CrossRef]
  2. Stott, P. How Climate Change Affects Extreme Weather Events. Science 2016, 352, 1517–1518. [Google Scholar] [CrossRef] [PubMed]
  3. van Koningsveld, M.; Mulder, J.P.M.; Stive, M.J.F.; van der Valk, L.; van der Weck, A.W. Living with Sea-Level Rise and Climate Change: A Case Study of the Netherlands. J. Coast. Res. 2008, 242, 367–379. [Google Scholar] [CrossRef]
  4. Chiabai, A.; Quiroga, S.; Martinez-Juarez, P.; Higgins, S.; Taylor, T. The Nexus between Climate Change, Ecosystem Services and Human Health: Towards a Conceptual Framework. Sci. Total Environ. 2018, 635, 1191–1204. [Google Scholar] [CrossRef]
  5. Tol, R.S.J. The Economic Impacts of Climate Change. Rev. Environ. Econ. Policy 2018, 12, 4–25. [Google Scholar] [CrossRef]
  6. Campbell, B.; Hansen, J.; Rioux, J.; Stirling, C.M.; Twomlow, S.; Wollenberg, E. Urgent Action to Combat Climate Change and Its Impacts (SDG 13): Transforming Agriculture and Food Systems. Curr. Opin. Environ. Sustain. 2018, 34, 13–20. [Google Scholar] [CrossRef]
  7. Turney, C.; Ausseil, A.G.; Broadhurst, L. Urgent Need for an Integrated Policy Framework for Biodiversity Loss and Climate Change. Nat. Ecol. Evol. 2020, 4, 996. [Google Scholar] [CrossRef]
  8. Montzka, S.A.; Dlugokencky, E.J.; Butler, J.H. Non-CO2 Greenhouse Gases and Climate Change. Nature 2011, 476, 43–50. [Google Scholar] [CrossRef]
  9. USEPA. Sources of Greenhouse Gas Emissions. Available online: https://www.epa.gov/ghgemissions/ (accessed on 5 August 2022).
  10. Li, S.; Chen, G. Contemporary Strategies for Enhancing Nitrogen Retention and Mitigating Nitrous Oxide Emission in Agricultural Soils: Present and Future. Environ. Dev. Sustain. 2019, 22, 2703–2741. [Google Scholar] [CrossRef]
  11. Oni, B.A.; Oziegbe, O.; Olawole, O.O. Significance of Biochar Application to the Environment and Economy. Ann. Agric. Sci. 2019, 64, 222–236. [Google Scholar] [CrossRef]
  12. Li, S.; Chen, G. Thermogravimetric, Thermochemical, and Infrared Spectral Characterization of Feedstocks and Biochar Derived at Different Pyrolysis Temperatures. Waste Manag. 2018, 78, 198–207. [Google Scholar] [CrossRef] [PubMed]
  13. Li, S.; Barreto, V.; Li, R.W.; Chen, G.; Hsieh, Y.P. Nitrogen Retention of Biochar Derived from Different Feedstocks at Variable Pyrolysis Temperatures. J. Anal. Appl. Pyrolysis 2018, 133, 136–146. [Google Scholar] [CrossRef]
  14. Gezahegn, S.; Sain, M.; Thomas, S.C. Variation in Feedstock Wood Chemistry Strongly Influences Biochar Liming Potential. Soil Syst. 2019, 3, 26. [Google Scholar] [CrossRef]
  15. Zhang, Y.; Wang, J.; Feng, Y. The Effects of Biochar Addition on Soil Physicochemical Properties: A Review. CATENA 2021, 202, 105284. [Google Scholar] [CrossRef]
  16. Rogovska, N.; Laird, D.; Cruse, R.; Fleming, P.; Parkin, T.; Meek, D. Impact of Biochar on Manure Carbon Stabilization and Greenhouse Gas Emissions. Soil Biol. Biochem. 2011, 75, 871–879. [Google Scholar] [CrossRef]
  17. Fidel, R.B.; Laird, D.; Parkin, T. Effect of Biochar on Soil Greenhouse Gas Emissions at the Laboratory and Field Scales. Soil Syst. 2019, 3, 8. [Google Scholar] [CrossRef]
  18. Wang, J.; Pan, X.; Liu, Y.; Zhang, X.; Xiong, Z. Effects of Biochar Amendment in Two Soils on Greenhouse Gas Emissions and Crop Production. Plant Soil 2012, 360, 287–298. [Google Scholar] [CrossRef]
  19. Mandal, S.; Sarkar, B.; Bolan, N.; Novak, J.; Ok, Y.S.; van Zwieten, L.; Singh, B.P.; Kirkham, M.B.; Choppala, G.; Spokas, K.; et al. Designing Advanced Biochar Products for Maximizing Greenhouse Gas Mitigation Potential. Crit. Rev. Environ. Sci. Technol. 2016, 46, 1367–1401. [Google Scholar] [CrossRef]
  20. Case, S.D.C.; McNamara, N.P.; Reay, D.S.; Stott, A.W.; Grant, H.K.; Whitaker, J. Biochar Suppresses N2O Emissions While Maintaining N Availability in a Sandy Loam Soil. Soil Biol. Biochem. 2015, 81, 178–185. [Google Scholar]
  21. Deng, W.; van Zwieten, L.; Lin, Z.; Liu, X.; Sarmah, A.K.; Wang, H. Sugarcane Bagasse Biochars Impact Respiration and Greenhouse Gas Emissions from a Latosol. J. Soils Sediments 2016, 17, 632–640. [Google Scholar] [CrossRef]
  22. Yoo, G.; Kang, H. Effects of Biochar Addition on Greenhouse Gas Emissions and Microbial Responses in a Short-Term Laboratory Experiment. J. Environ. Qual. 2012, 41, 1193–1202. [Google Scholar] [CrossRef] [PubMed]
  23. Guo, F.; Zhang, J.; Yang, X.; He, Q.; Ao, L.; Chen, Y. Impact of Biochar on Greenhouse Gas Emissions from Constructed Wetlands under Various Influent Chemical Oxygen Demand to Nitrogen Ratios. Bioresour. Technol. 2020, 303, 122908. [Google Scholar] [CrossRef] [PubMed]
  24. Zheng, N.; Yu, Y.; Li, Y.; Ge, C.; Chapman, S.J.; Yao, H. Can Aged Biochar Offset Soil Greenhouse Gas Emissions from Crop Residue Amendments in Saline and Non-Saline Soils under Laboratory Conditions? Sci. Total Environ. 2022, 806, 151256. [Google Scholar] [CrossRef] [PubMed]
  25. Verhoeven, E.; Six, J. Biochar Does Not Mitigate Field-Scale N2O Emissions in a Northern California Vineyard: An Assessment across Two Years. Agric. Ecosyst. Environ. 2014, 191, 27–38. [Google Scholar] [CrossRef]
  26. Schimmelpfennig, S.; Muller, C.; Grunhage, L.; Koch, C.; Kammann, C. Biochar, Hydrochar and Uncarbonized Feedstock Application to Permanent Grassland—Effects on Greenhouse Gas Emissions and Plant Growth. Agric. Ecosyst. Environ. 2014, 191, 39–52. [Google Scholar] [CrossRef]
  27. Brickler, C.A.; Wu, Y.; Li, S.; Anandhi, A.; Chen, G. Comparing Physicochemical Properties and Sorption Behaviors of Pyrolysis-Derived and Microwave-Mediated Biochar. Sustainability 2021, 13, 2359. [Google Scholar] [CrossRef]
  28. Wu, Y.; Brickler, C.A.; Li, S.; Chen, G. Synthesis of Microwave-Mediated Biochar-Hydrogel Composites for Enhanced Water Absorbency and Nitrogen Release. Polym. Test. 2021, 93, 106996. [Google Scholar] [CrossRef]
  29. Cayuela, M.L.; Jeffery, S.; van Zwieten, L. The Molar H:Corg Ratio of Biochar Is a Key Factor in Mitigating N2O Emissions from Soil. Agric. Ecosyst. Environ. 2015, 202, 135–138. [Google Scholar] [CrossRef]
  30. Li, S.; Harris, S.; Anandhi, A.; Chen, G. Predicting Biochar Properties and Functions Based on Feedstock and Pyrolysis Temperature: A Review and Data Syntheses. J. Clean. Prod. 2019, 215, 890–902. [Google Scholar] [CrossRef]
  31. Luo, Y.; Yu, Z.; Zhang, K.; Xu, J.; Brookes, P.C. The Properties and Functions of Biochars in Forest Ecosystems. J. Soils Sediments 2016, 16, 2005–2020. [Google Scholar] [CrossRef]
  32. Ajayi, A.E.; Holthusen, D.; Horn, R. Changes in Microstructural Behaviour and Hydraulic Functions of Biochar Amended Soils. Soil Tillage Res. 2016, 155, 166–175. [Google Scholar] [CrossRef]
  33. Menke, J.; Roelandse, M.; Ozyurt, B.; Martone, M.; Bandrowski, A. The Rigor and Transparency Index Quality Metric for Assessing Biologicla and Medical Science Methods. iScience 2020, 23, 101698. [Google Scholar] [CrossRef] [PubMed]
  34. Opthof, T. Sense and Nonsense about the Impact Factor. Cardiovasc. Res. 1997, 31, 1–7. [Google Scholar] [CrossRef]
  35. Simons, K. The Misused Impact Factor. Science 2008, 322, 165. [Google Scholar] [CrossRef]
  36. Mangalassery, S.; Sjogersten, S.; Sparkes, D.L.; Sturrock, C.J.; Craigon, J.; Mooney, S.J. To What Extent Can Zero Tillage Lead to a Reduction in Greenhouse Gas Emissions from Temperate Soils? Sci. Rep. 2014, 4, 4586. [Google Scholar] [CrossRef]
  37. Smith, P. Soil Carbon Sequestration and Biochar as Negative Emission Technologies. Glob. Chang. Biol. 2016, 22, 1315–1324. [Google Scholar] [CrossRef]
  38. Pereira, R.C.; Kaal, J.; Camps Arbestain, M.; Pardo Lorenzo, R.; Aitkenhead, W.; Hedley, M.; Macia, F.; Hindmarsh, J.; Macia-Agullo, J.A. Contribution to Characterisation of Biochar to Estimate the Labile Fraction of Carbon. Org. Geochem. 2011, 42, 1331–1342. [Google Scholar] [CrossRef]
  39. Mukome, F.N.D.; Six, J.; Parikh, S.J. The Effects of Walnut Shell and Wood Feedstock Biochar Amendments on Greenhouse Gas Emissions from a Fertile Soil. Geoderma 2013, 200–201, 90–98. [Google Scholar] [CrossRef]
  40. Ohde, S.; Woesik, V. Carbon Dioxide Flux and Metabolic Processes of a Coral Reef, Okinawa. Bull. Mar. Sci. 1999, 65, 559–576. [Google Scholar]
  41. Girkin, N.T.; Dhandapani, S.; Evers, S.; Ostle, N.; Turner, B.L.; Sjogersten, S. Interactions between Labile Carbon, Temperature and Land Use Regulate Carbon Dioxide and Methane Production in Tropical Peat. Biogeochemistry 2020, 147, 87–97. [Google Scholar] [CrossRef]
  42. Miransari, M. Soil Microbes and the Availability of Soil Nutrients. Acta Physiol. Plant. 2013, 35, 3075–3084. [Google Scholar] [CrossRef]
  43. Manzoni, S.; Schimel, J.P.; Porporato, A. Responses of Soil Microbial Communities to Water Stress: Results from a Meta-Analysis. Ecology 2012, 93, 930–938. [Google Scholar] [CrossRef] [PubMed]
  44. Leng, L.; Xiong, Q.; Yang, L.; Li, H.; Zhou, Y.; Zhang, W.; Jiang, S.; Li, H.; Huang, H. An Overview on Engineering the Surface Area and Porosity of Biochar. Sci. Total Environ. 2021, 763, 144204. [Google Scholar] [CrossRef]
  45. Amoakwah, E.; Frimpong, K.A.; Okae-Anti, D.; Arthur, E. Soil Water Retention, Air Flow and Pore Structure Characteristics after Corn Cob Biochar Application to a Tropical Sandy Loam. Geoderma 2017, 307, 189–197. [Google Scholar] [CrossRef]
  46. Garg, A.; Huang, H.; Kushvaha, V.; Madhushri, P.; Kamchoom, V.; Wani, I.; Koshy, N.; Zhu, H.H. Mechanism of Biochar Soil Pore–Gas–Water Interaction: Gas Properties of Biochar-Amended Sandy Soil at Different Degrees of Compaction using KNN Modeling. Acta Geophys. 2020, 68, 207–217. [Google Scholar] [CrossRef]
  47. Ameloot, N.; Graber, E.R.; Verheijen, F.G.A.; De Neve, S. Interactions between Biochar Stability and Soil Organisms: Review and Research Needs. Eur. J. Soil Sci. 2013, 64, 379–390. [Google Scholar] [CrossRef]
  48. Jaafar, N.M.; Clode, P.L.; Abbott, L.K. Soil Microbial Responses to Biochars, Varying in Particle Size, Surface and Pore Properties. Pedosphere 2015, 25, 770–780. [Google Scholar] [CrossRef]
  49. Bamminger, C.; Poll, C.; Sixt, C.; Hogy, P.; Wust, D.; Kandeler, E.; Marhan, S. Short-Term Response of Soil Microorganisms to Biochar Addition in a Temperate Agroecosystem under Soil Warming. Agric. Ecosyst. Environ. 2016, 233, 308–317. [Google Scholar] [CrossRef]
  50. Sinsabaugh, R.L.; Hill, B.H.; Follstad Shah, J.J. Ecoenzymatic Stoichiometry of Microbial Organic Nutrient Acquisition in Soil and Sediment. Nature 2009, 462, 795–798. [Google Scholar] [CrossRef]
  51. Zornoza, R.; Moreno-Barriga, E.; Acosta, J.A.; Munoz, M.A.; Faz, A. Stability, Nutrient Availability and Hydrophobicity of Biochars Derived from Manure, Crop Residues, and Municipal Solid Waste for Their Use as Soil Amendments. Chemosphere 2016, 144, 122–130. [Google Scholar] [CrossRef]
  52. Zhu-Barker, X.; Burger, M.; Horwath, W.R.; Green, P.G. Direct Green Waste Land Application: How to Reduce Its Impacts on Greenhouse Gas and Volatile Organic Compound Emissions? Waste Manag. 2016, 52, 318–325. [Google Scholar] [CrossRef] [PubMed]
  53. Cayuela, M.L.; Sanchez-Garcia, M.; Roig, A.; Hanley, K.; Enders, A.; Lehmann, J. Biochar and Denitrification in Soils: When, How Much and Why Does Biochar Reduce N2O Emissions? Sci. Rep. 2013, 3, 1732. [Google Scholar] [CrossRef] [PubMed] [Green Version]
  54. Liu, Y.; Tang, H.; Muhammad, A.; Huang, G. Emission Mechanism and Reduction Countermeasures of Agricultural Greenhouse Gases—A Review. Greenh. Gases Sci. Technol. 2019, 9, 160–174. [Google Scholar] [CrossRef]
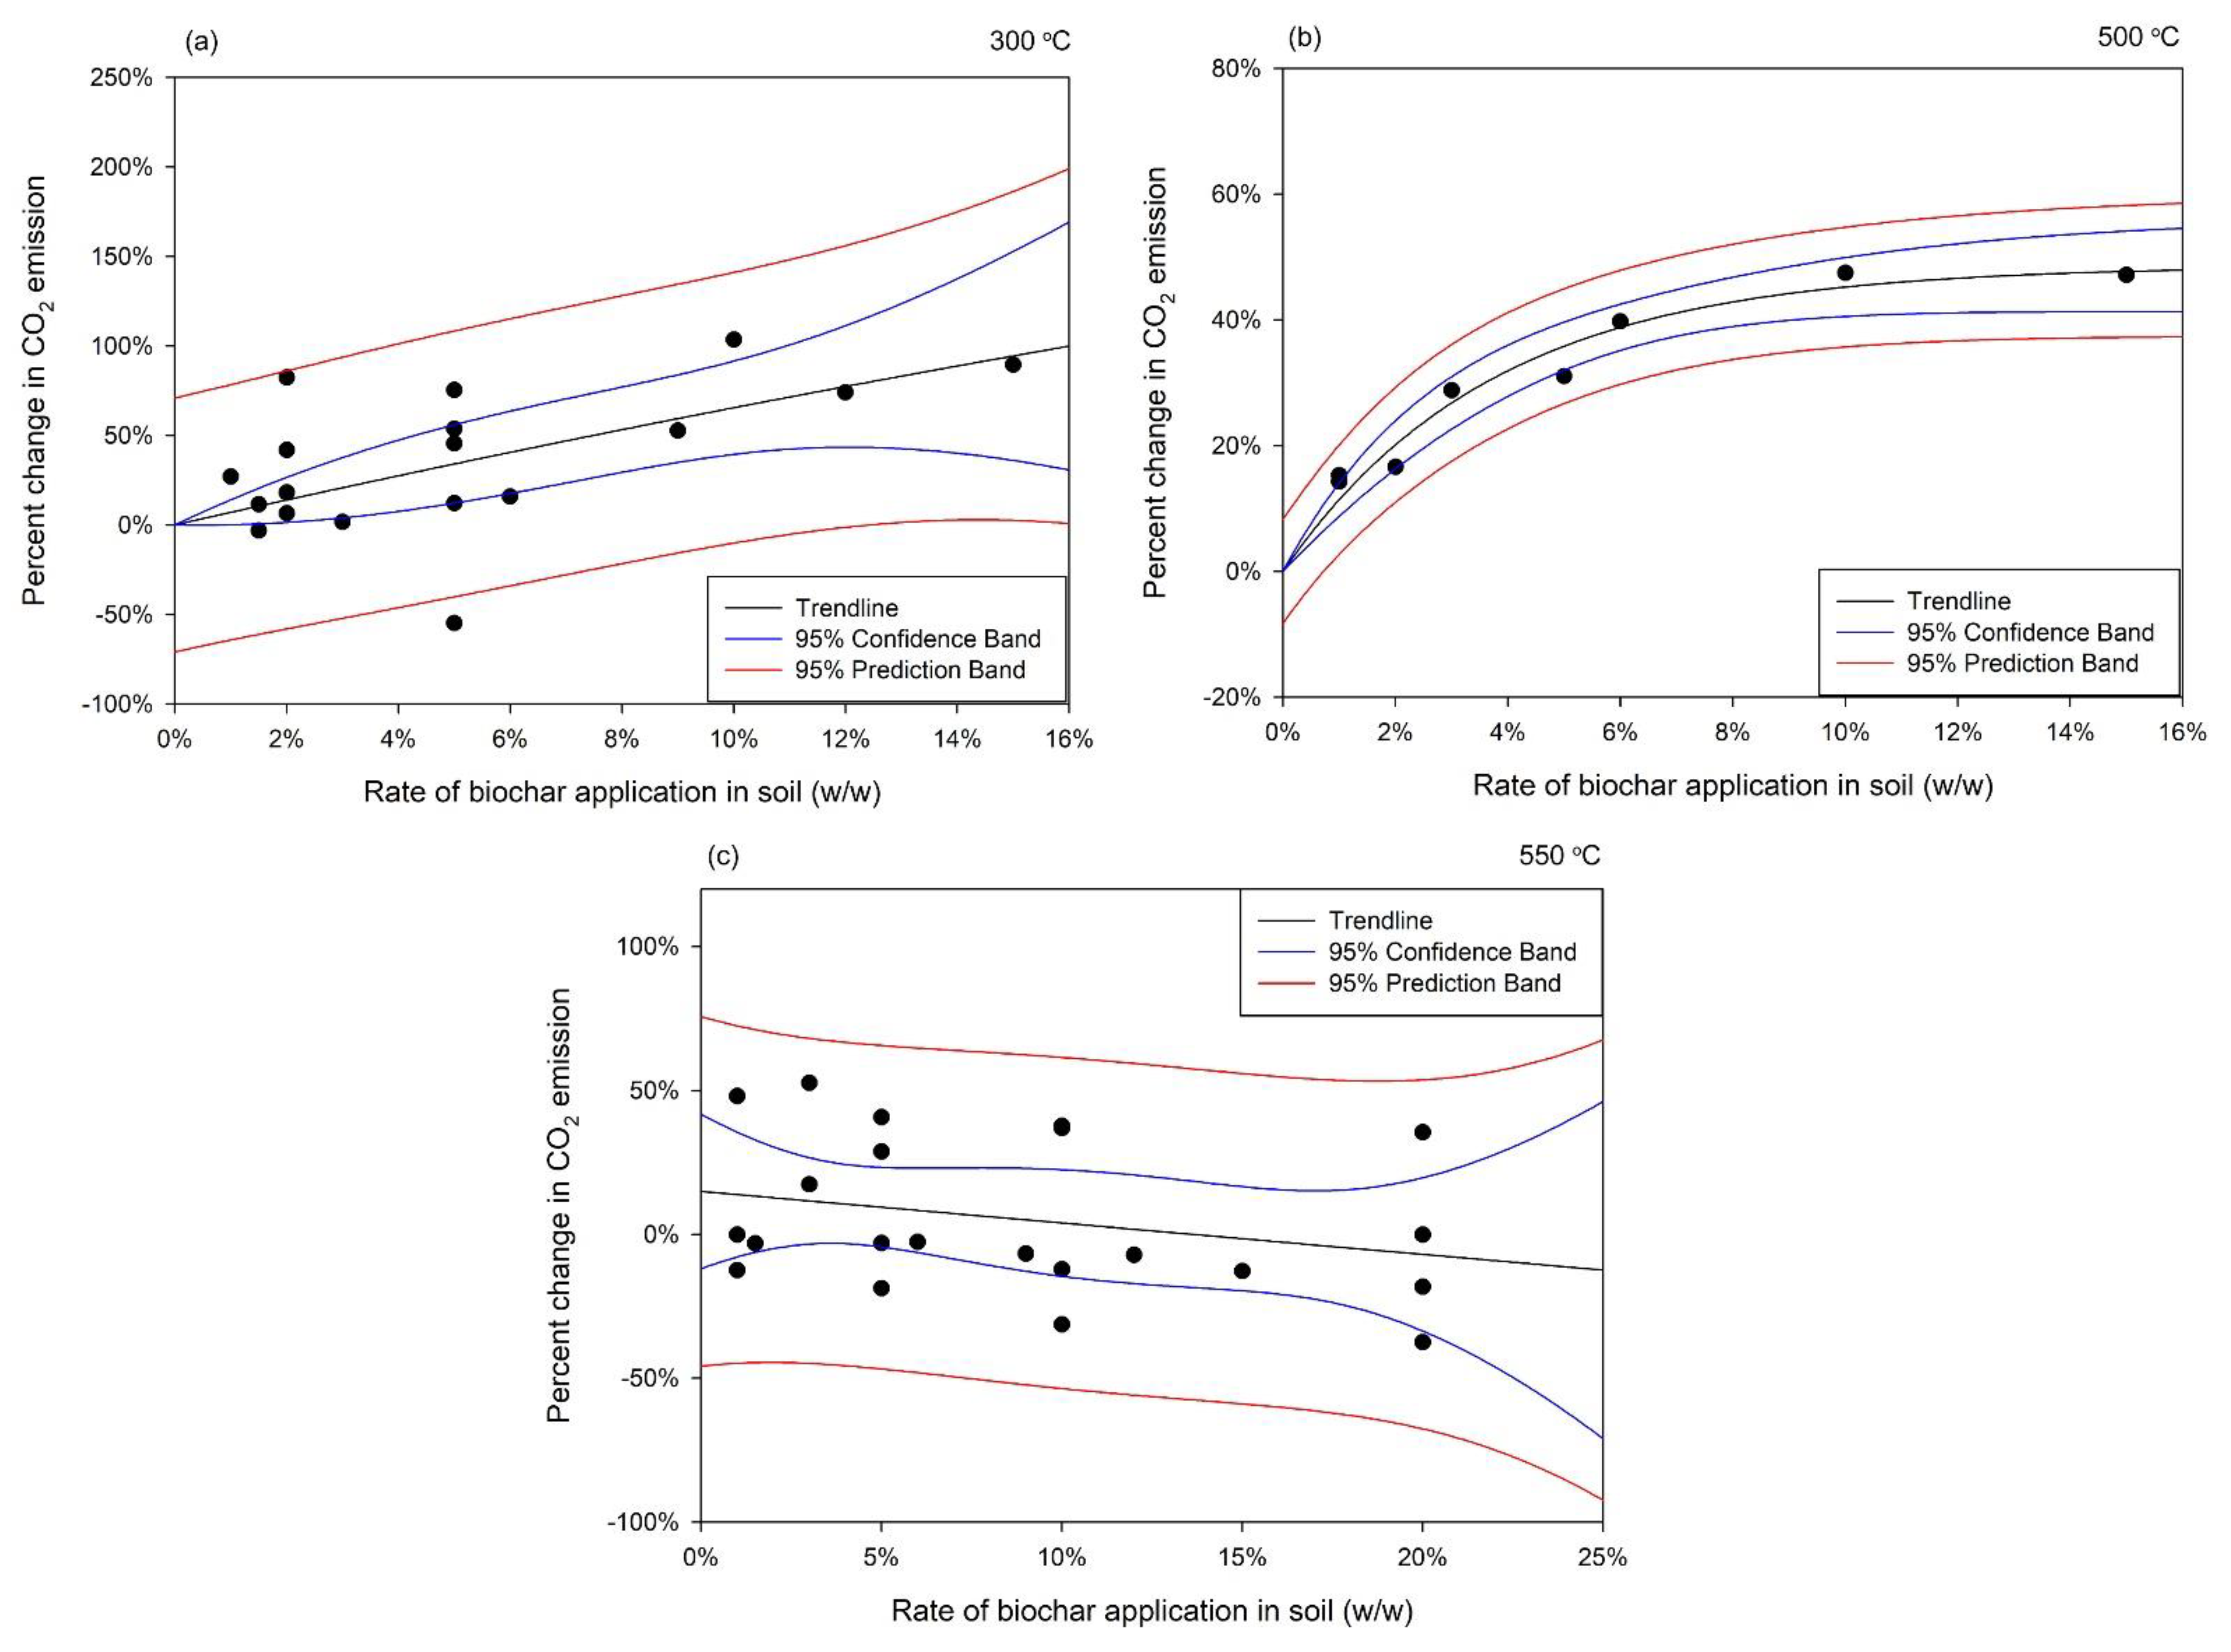
Figure 1. Percentage change in CO2 emissions as affected by biochar applications at different application rates (w/w): (a) applied biochar was produced at approximately 300 °C, (b) applied biochar was produced at approximately 500 °C and (c) applied biochar was produced at approximately 550 °C. Woody materials were used as feedstock for biochar production via slow pyrolysis. Note: Different units for biochar application rates were all converted into weight percentage, calculated using the mass of applied biochar divided by the mass of impacted soil; the 0% (x-axis) refers to the control soil with no biochar added.
Soilsystems 06 00073 g001
Figure 2. Percentage change in CH4 emissions as affected by biochar applications at different application rates (w/w): (a) applied biochar was produced at approximately 300 °C and (b) applied biochar was produced at approximately 550 °C. Note: Different units for biochar application rates were all converted into weight percentage, calculated using the mass of applied biochar divided by the mass of impacted soil; the 0% (x-axis) refers to the control soil with no biochar added.
Soilsystems 06 00073 g002
Figure 3. Percentage change in N2O emissions as affected by biochar applications at different application rates (w/w): (a) applied biochar was produced at approximately 300 °C and (b) applied biochar was produced at approximately 500 °C. Note: Different units for biochar application rates were all converted into weight percentage, calculated using the mass of applied biochar divided by the mass of impacted soil; the 0% (x-axis) refers to the control soil with no biochar added.
Soilsystems 06 00073 g003
Publisher’s Note: MDPI stays neutral with regard to jurisdictional claims in published maps and institutional affiliations.