
Characteristics of Andisols Developed from Andesitic and Basaltic Volcanic Ash in Different Agro-Climatic Zones


Abstract
:1. Introduction
2. Materials and Methods
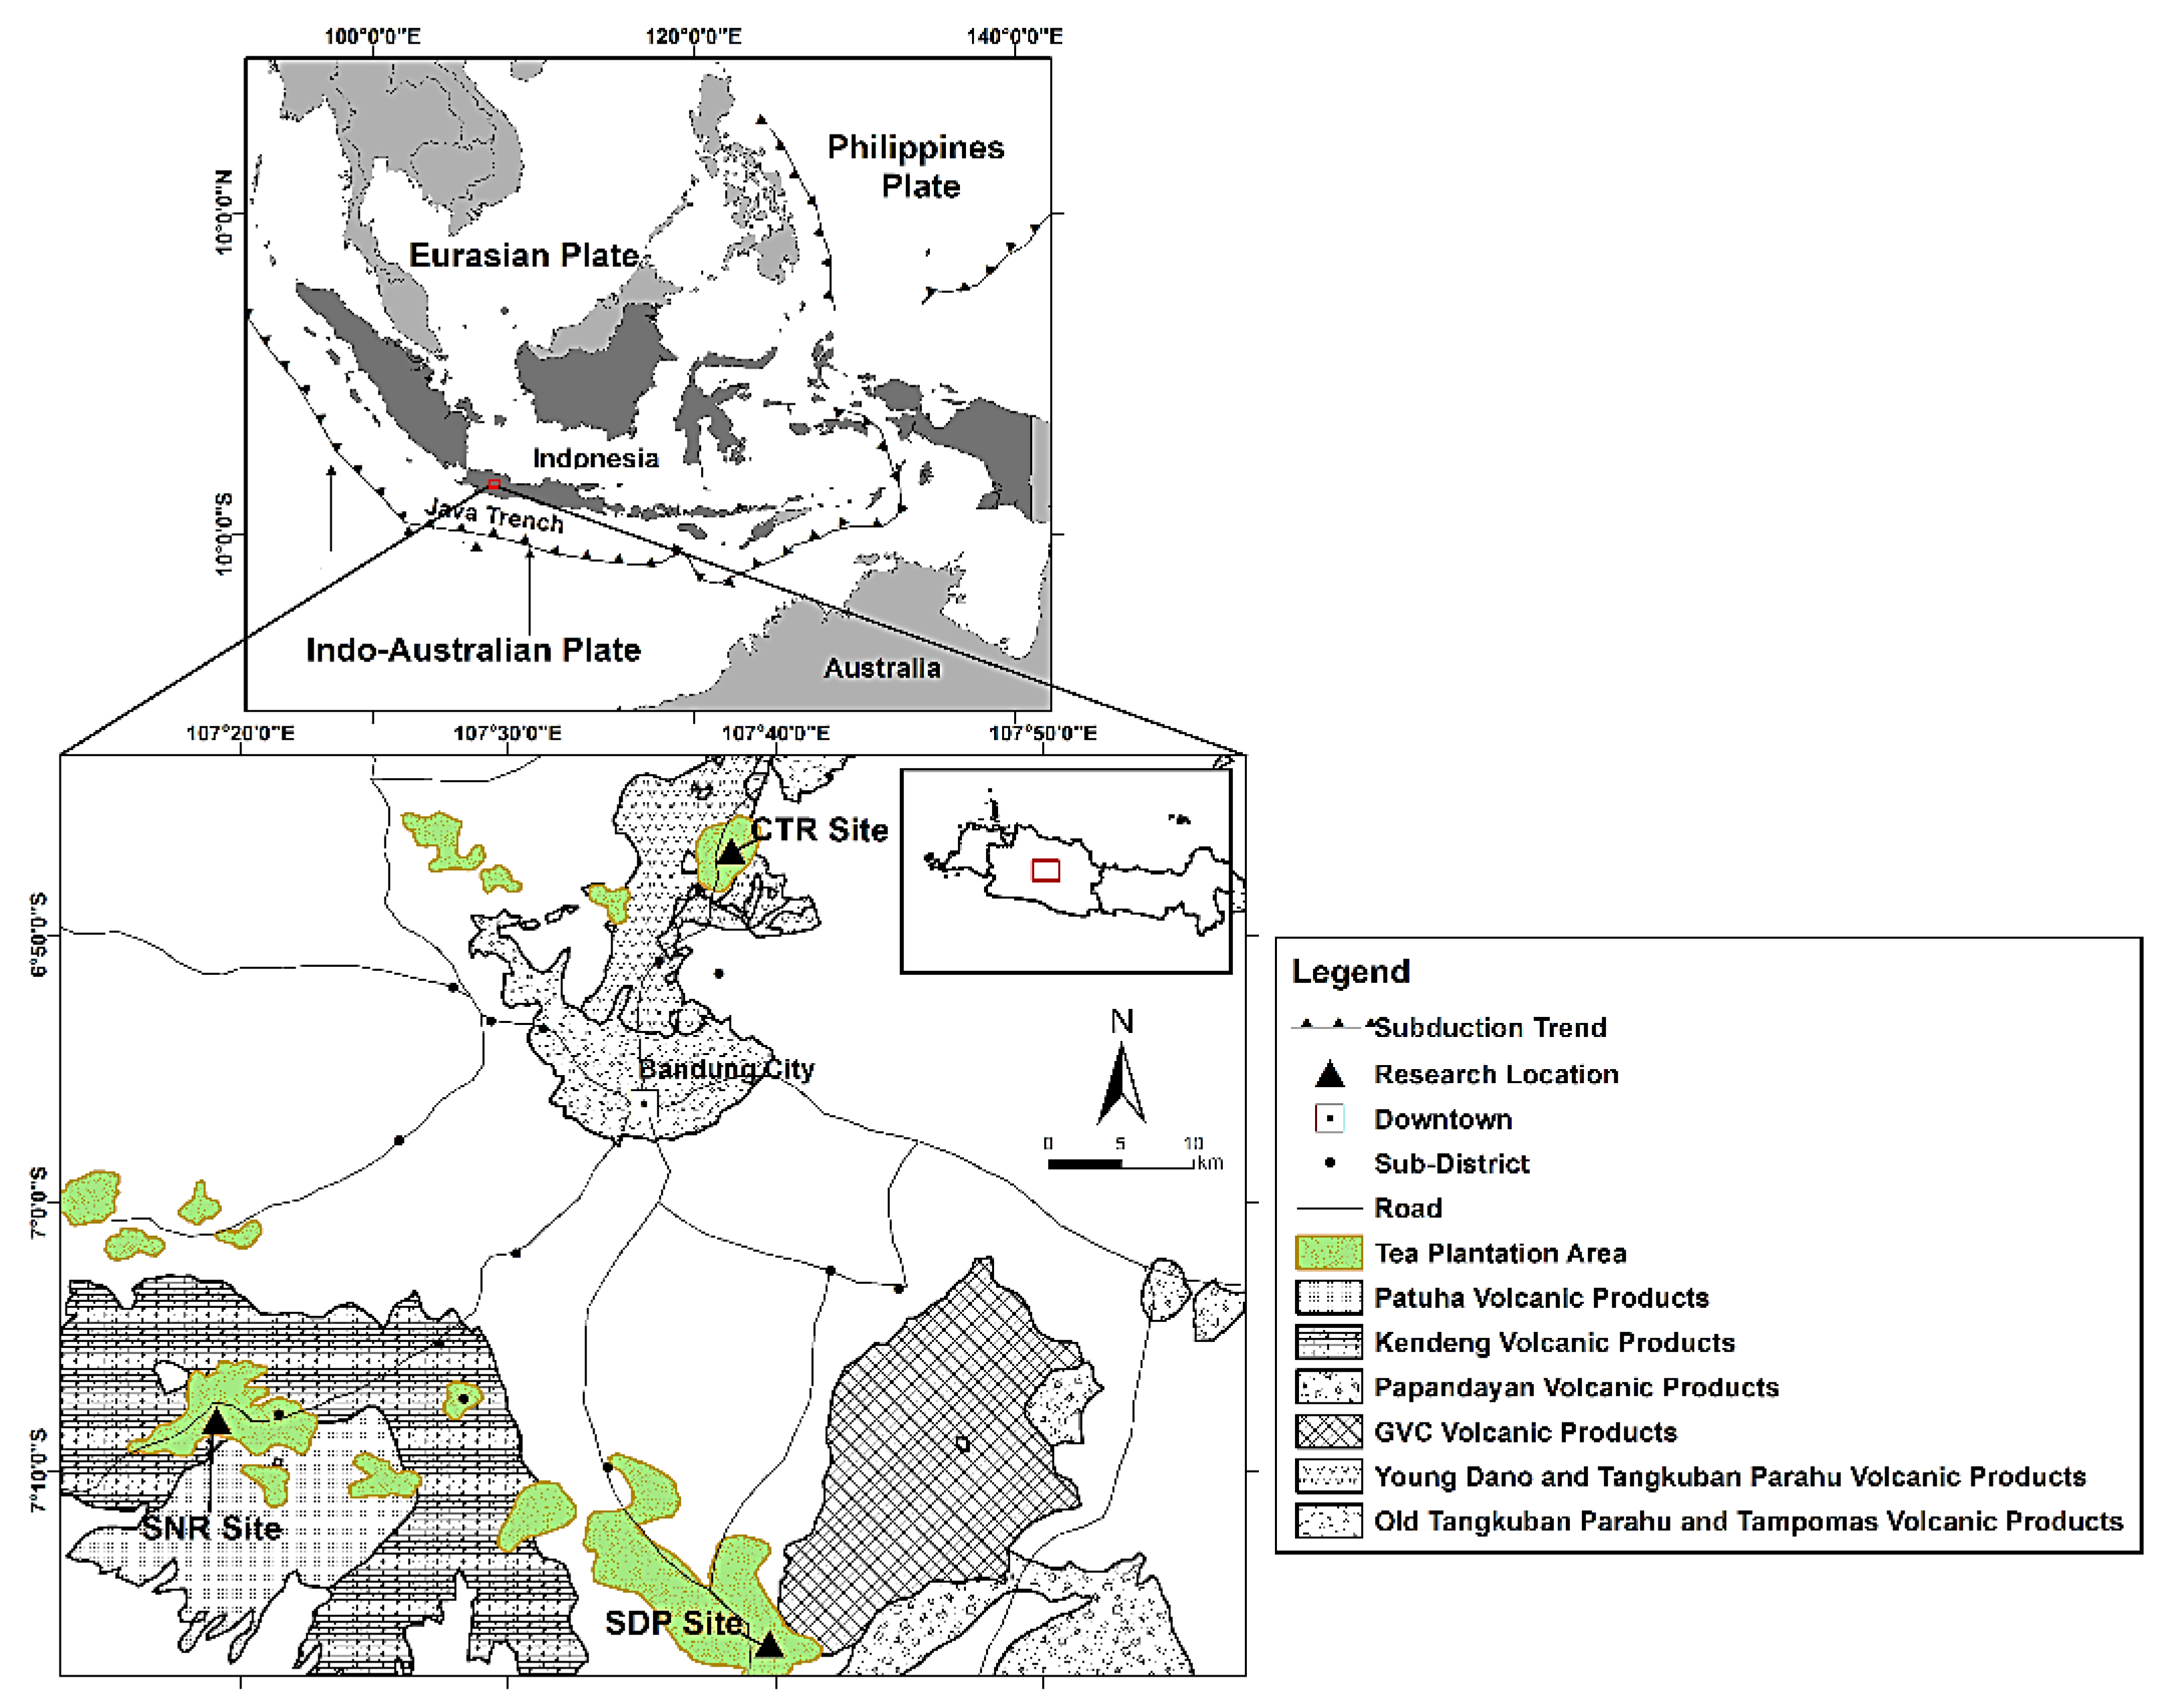
2.1. Site Description
2.2. Soil Sampling Technique
2.3. Soil Physico-Chemical Analyses
2.4. Mineralogical Analyses
3. Results
3.1. Soil Morphological Characteristics
3.2. Mineralogical Compositions of Soil Sand Fractions
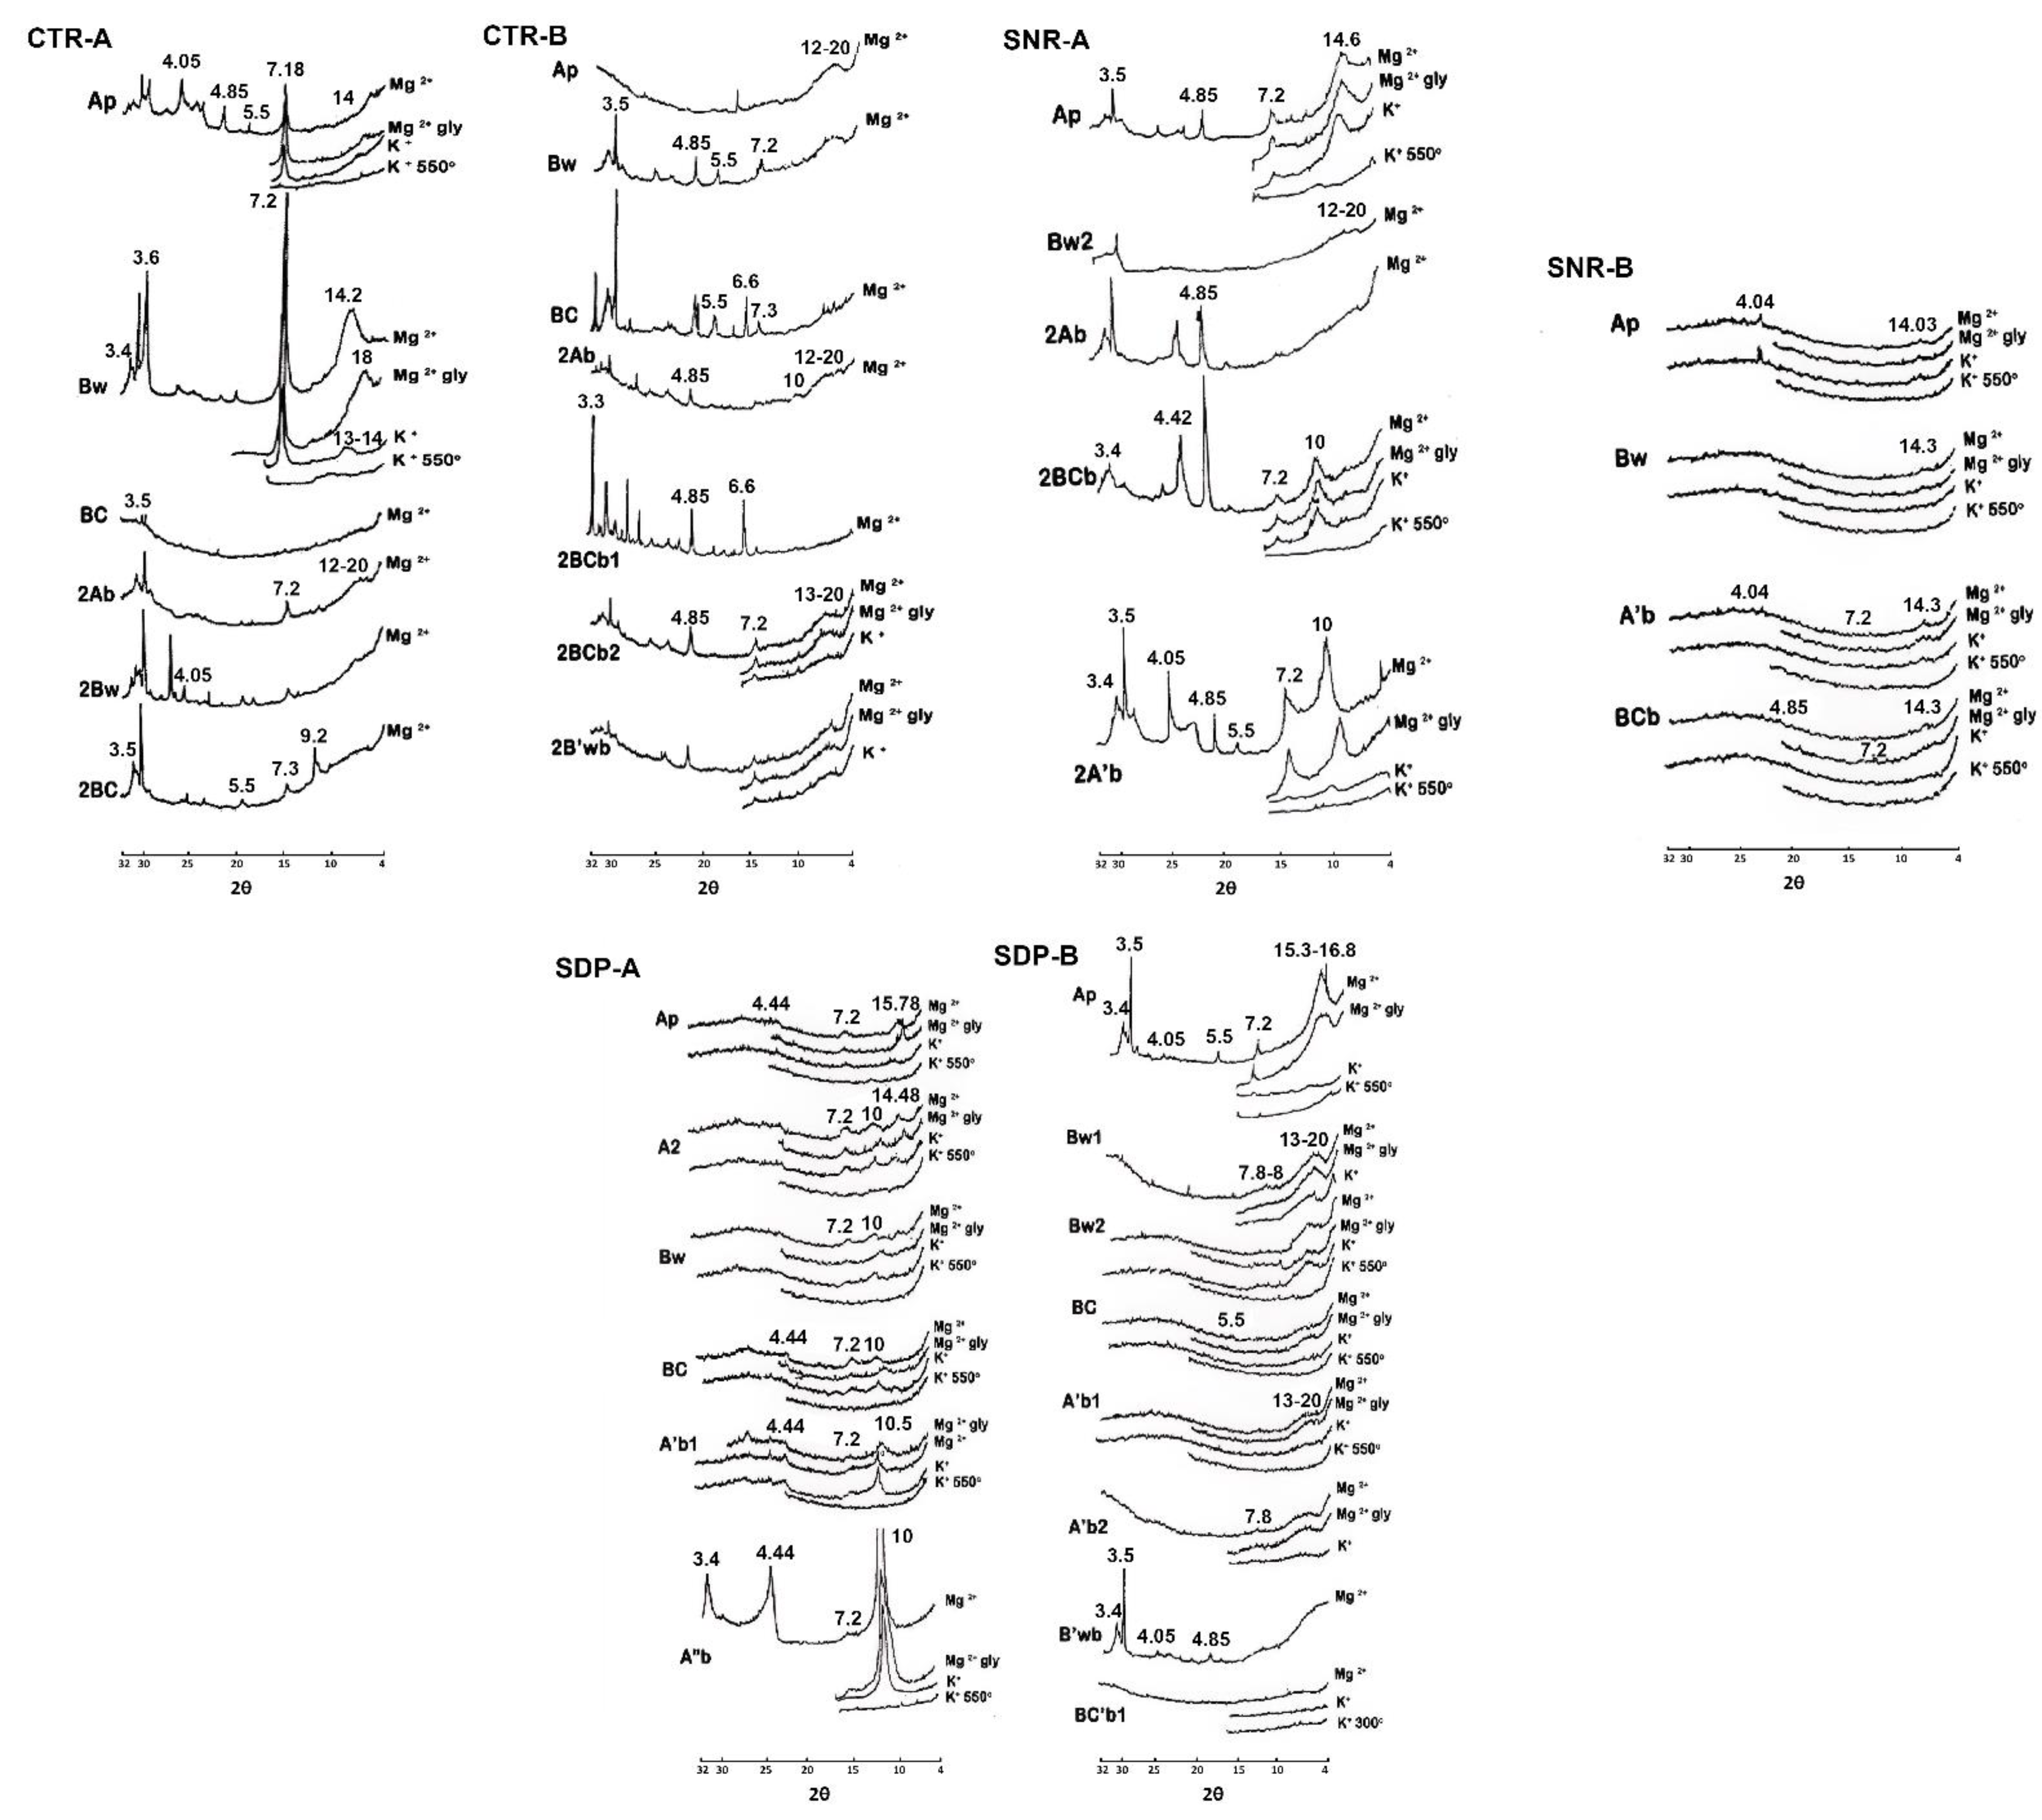
3.3. Mineralogical Compositions of the Clay Fraction of the Studied Soils
3.4. Chemical Properties of Soils Developed from Different Parent Materials and in Different Agro-Climatic Zones under Tea Plantations
3.5. The Relationship of the Pedogenic Environment with Several Chemical, Physical, and Mineralogical Characteristics of Andisols
4. Discussion
5. Conclusions
Author Contributions
Funding
Acknowledgments
Conflicts of Interest
References
- Saing, U.B.; Bani, P.; Haerani, N.; Aiuppa, A.; Primulyana, S.; Alfianti, H.; Syahbana, D.K. First characterization of Gamkonora gas emission, North Maluku, East Indonesia. Bull. Volcanol. 2020, 82, 37. [Google Scholar] [CrossRef]
- Kartawisastra, S.; Dariah, A. Tanah Andisol di Indonesia: Karakteristik, Potensi, Kendala, dan Pengelolaannya untuk Pertanian, 1st ed.; Balai Besar Penelitian dan Pengembangan Sumber Daya Lahan Pertanian: Bogor, Indonesia, 2014.
- Anda, M.; Dahlgren, R.A. Long-term response of tropical Andisol properties to conversion from rainforest to agriculture. CATENA 2020, 194, 104679. [Google Scholar] [CrossRef]
- Fiantis, D.; Hakim, N.; van Ranst, E. Properties and utilization of Andisols in Indonesia. J. Integr. Field Sci. 2005, 2, 29–37. [Google Scholar]
- Tan, K.H. The Andosol in Indonesia. Soil Sci. 1965, 99, 375–378. [Google Scholar] [CrossRef]
- Smith, G.D. A preliminary proposal for reclassification of Andepts and some andic subgroups (The Andisol proposal, 1978). N. Z. Soil Bur. Rec. 1978, 96. [Google Scholar] [CrossRef]
- Van Ranst, E.; Qafoku, N.P.; Noble, A.; Xu, R.-k. Variable charge soils: Mineralogy and chemistry. In Encyclopedia of Soil Science; Lal, R., Ed.; CRC Press: Boca Raton, FL, USA, 2017; pp. 2432–2439. [Google Scholar]
- Staff, S.S. Keys to Soil Taxonomy, 12th ed.; U.S. Department of Agriculture (USDA): Washington, DC, USA, 2014.
- Nanzyo, M.; Dahlgren, R.; Shoji, S. Chemical Characteristics of Volcanic Ash Soils. In Developments in Soil Science; Shoji, S., Nanzyo, M., Dahlgren, R., Eds.; Elsevier: Amsterdam, The Netherlands, 1993; Volume 21, pp. 145–187. [Google Scholar]
- Uehara, G.; Gillman, G.P. The Mineralogy, Chemistry, and Physics of Tropical Soils with Variable Charge Clays; Westview Press: Boulder, CO, USA, 1981. [Google Scholar]
- Xu, R.-k.; Qafoku, N.P.; van Ranst, E.; Li, J.-y.; Jiang, J. Adsorption Properties of Subtropical and Tropical Variable Charge Soils: Implications from Climate Change and Biochar Amendment. In Advances in Agronomy; Sparks, D.L., Ed.; Academic Press: Cambridge, MA, USA, 2016; Volume 135, pp. 1–58. [Google Scholar]
- Gillman, G.P.; Sumner, M.E. Surface Charge Characterization and Soil Solution Composition of Four Soils from the Southern Piedmont in Georgia. Soil Sci. Soc. Am. J. 1987, 51, 589–594. [Google Scholar] [CrossRef]
- FitzPatrick, E.A. Soils, Their Formation, Classification and Distribution; Longman: London, UK, 1980. [Google Scholar]
- Tan, K.H. Soils in the Humid Tropics and Monsoon Region of Indonesia, 1st ed.; CRC Press: Boca Raton, FL, USA, 2008; p. 584. [Google Scholar]
- Egli, M.; Alioth, L.; Mirabella, A.; Raimondi, S.; Nater, M.; Verel, R. Effect of climate and vegetation on soil organic carbon, humus fractions, allophanes, imogolite, kaolinite, and oxyhydroxides in volcanic soils of Etna (Sicily). Soil Sci. 2007, 172, 673–691. [Google Scholar] [CrossRef] [Green Version]
- Tsai, C.C.; Chen, Z.S.; Kao, C.I.; Ottner, F.; Kao, S.J.; Zehetner, F. Pedogenic development of volcanic ash soils along a climosequence in Northern Taiwan. Geoderma 2010, 156, 48–59. [Google Scholar] [CrossRef]
- Delmelle, P.; Opfergelt, S.; Cornelis, J.-T.; Ping, C.-L. Volcanic Soils. In The Encyclopedia of Volcanoes, 2nd ed.; Sigurdsson, H., Ed.; Academic Press: Amsterdam, The Netherlands, 2015; pp. 1253–1264. [Google Scholar]
- Ugolini, F.; Dahlgren, R. Soil development in volcanic ash. Global Environ. Res. Engl. Ed. 2002, 6, 69–81. [Google Scholar]
- Taylor, M.D.; Lowe, D.J.; Hardi, P.; Smidt, G.A.; Schnug, E. Comparing volcanic glass shards in unfertilised and fertilised Andisols derived from rhyolitic tephras, New Zealand: Evidence for accelerated weathering and implications for land management. Geoderma 2016, 271, 91–98. [Google Scholar] [CrossRef]
- Churchman, J.; Lowe, D. Alteration, Formation, and Occurrence of Minerals in Soils, 2nd ed.; CRC Press: Boca Raton, FL, USA, 2012; Volume 1, pp. 33.29–33.48. [Google Scholar]
- Parfitt, R.L. Allophane in new zealand—A review. Aust. J. Soil Res. 1990, 28, 343–360. [Google Scholar] [CrossRef]
- Parfitt, R.L. Allophane and imogolite: Role in soil biogeochemical processes. Clay Miner. 2009, 44, 135–155. [Google Scholar] [CrossRef]
- Parfitt, R.L.; Russell, M.; Orbell, G.E. Weathering sequence of soils from volcanic ash involving allophane and halloysite, New Zealand. Geoderma 1983, 29, 41–57. [Google Scholar] [CrossRef]
- Parfitt, R.L.; Saigusa, M.; Cowie, J.D. Allophane and halloysite formation in a volcanic ash bed under different moisture conditions. Soil Sci. 1984, 138, 360–364. [Google Scholar] [CrossRef]
- Singleton, P.L.; McLeod, M.; Percival, H.J. Allophane and halloysite content and soil solution silicon in soils fromrhyolitic volcanic material, new zealand. Aust. J. Soil Res. 1989, 27, 67–77. [Google Scholar] [CrossRef]
- Oldeman, L.R. An Agro-Climatic Map of Java; Central Research Institute for Agriculture: Bogor, Indonesia, 1975. [Google Scholar]
- Vigouroux, N.; Wallace, P.J.; Williams-Jones, G.; Kelley, K.; Kent, A.J.R.; Williams-Jones, A.E. The sources of volatile and fluid-mobile elements in the Sunda arc: A melt inclusion study from Kawah Ijen and Tambora volcanoes, Indonesia. Geochem. Geophys. Geosystems 2012, 13. [Google Scholar] [CrossRef] [Green Version]
- Deegan, F.M.; Whitehouse, M.J.; Troll, V.R.; Geiger, H.; Jeon, H.; le Roux, P.; Harris, C.; van Helden, M.; González-Maurel, O. Sunda arc mantle source δ18O value revealed by intracrystal isotope analysis. Nat. Commun. 2021, 12, 3930. [Google Scholar] [CrossRef]
- Gasparon, M.; Varne, R. Crustal assimilation versus subducted sediment input in west Sunda arc volcanics: An evaluation. Mineral. Petrol. 1998, 64, 89–117. [Google Scholar] [CrossRef]
- Silitonga, P.H. Geological Map of Bandung Quadrangle, Java; Geological Survey of Indonesia; Ministry of Mines: Bandung, Indonesia, 1973.
- Koesmono, M.; Kusnama; Suwarna, N. Geological Map of Sindangbarang Quadrangle, Java; Geological Survey of Indonesia; Ministry of Mines: Bandung, Indonesia, 1996.
- Alzwar, M.; Akbar, N.; Bachri, S. Geological Map of Garut-Pamempeuk Quadrangle, Java; Geological Survey of Indonesia; Ministry of Mines: Bandung, Indonesia, 1975.
- Baver, L.D.; Gardner, W.H. Soil Physics, 4th ed.; John Wiley & Sons: New York, NY, USA, 1972; p. 498. [Google Scholar]
- Marcano-Martinez, E.; McBride, M.B. Calcium and Sulfate Retention by Two Oxisols of the Brazilian Cerrado. Soil Sci. Soc. Am. J. 1989, 53, 63–69. [Google Scholar] [CrossRef]
- Hendershot, W.H.; Lavkulich, L.M. Effect of Sesquioxide Coatings on Surface Charge of Standard Mineral and Soil Samples. Soil Sci. Soc. Am. J. 1983, 47, 1252–1260. [Google Scholar] [CrossRef]
- Schwertmann, U.; Taylor, R.M. Iron Oxides. In Minerals in Soil Environments; Soil Science Society of America, Inc.: Madison, WI, USA, 1989; pp. 379–438. [Google Scholar]
- Sharpley, A.N.; Singh, U.; Uehara, G.; Kimble, J. Modeling Soil and Plant Phosphorus Dynamics in Calcareous and Highly Weathered Soils. Soil Sci. Soc. Am. J. 1989, 53, 153–158. [Google Scholar] [CrossRef]
- Van Raij, B.; Peech, M. Electrochemical Properties of Some Oxisols and Alfisols of the Tropics. Soil Sci. Soc. Am. J. 1972, 36, 587–593. [Google Scholar] [CrossRef]
- Nagatsuka, S. Methods of type-analysis of iron. In A Handbook of Quartenary Research; Japan Association for Quartenary Research, Ed.; University of Tokyo Press: Tokyo, Japan, 1993; pp. 22–32. [Google Scholar]
- Mange, M.A.; Maurer, H.F.W. Heavy Minerals in Colour; Springer: Berlin/Heidelberg, Germany, 1992; p. 147. [Google Scholar]
- Ali, A.; Chiang, Y.W.; Santos, R.M. X-ray Diffraction Techniques for Mineral Characterization: A Review for Engineers of the Fundamentals, Applications, and Research Directions. Minerals 2022, 12, 205. [Google Scholar] [CrossRef]
- Xing, B.; Dudas, M.J. Characterization of Clay Minerals in White Clay Soils, People’s Republic of China. Soil Sci. Soc. Am. J. 1994, 58, 1253–1259. [Google Scholar] [CrossRef]
- Kitagawa, Y.; Imoto, H.; Kurihara, H. Clay mineralogy of a podzol developed under a Sciadopitys verticillata forest on Mt. Irazu, Shikoku mountains, Southwest Japan. Soil Sci. Plant Nutr. 2004, 50, 331–338. [Google Scholar] [CrossRef] [Green Version]
- Uzarowicz, Ł.; Skiba, S.; Skiba, M.; Šegvić, B. Clay-Mineral Formation in Soils Developed in the Weathering Zone of Pyrite-Bearing Schists: A Case Study from The Abandoned Pyrite Mine in Wieściszowice, Lower Silesia, SW Poland. Clays Clay Miner. 2011, 59, 581–594. [Google Scholar] [CrossRef]
- Volzone, C.; Ortiga, J. SO2 gas adsorption by modified kaolin clays: Influence of previous heating and time acid treatments. J. Environ. Manag. 2011, 92, 2590–2595. [Google Scholar] [CrossRef]
- Bullock, P. Handbook for Soil Thin Section Description; Waine Research: Wolverhampton, UK, 1985. [Google Scholar]
- Nanzyo, M.; Shoji, S.; Dahlgren, R. Physical Characteristics of Volcanic Ash Soils. In Developments in Soil Science; Shoji, S., Nanzyo, M., Dahlgren, R., Eds.; Elsevier: Amsterdam, The Netherlands, 1993; Volume 21, pp. 189–207. [Google Scholar]
- Yoshinaga, N. Mineralogical characteristics, II. In Ando Soils in Japan, Wada, K., Ed.; Kyushu University Press: Fukuoka, Japan, 1986; pp. 41–56. [Google Scholar]
- Hardjowigeno, S. Klasifikasi Tanah dan Pedogenesis; Akademika Pressindo: Jakarta, Indonesia, 1993; Volume 320, p. 274. [Google Scholar]
- Blatt, H.; Tracy, R. Petrology, Second Edition: Igneous, Sedimentary, and Metamorphic; W. H. Freeman: Basingstoke, UK, 1996; p. 529. [Google Scholar]
- Hsu, P.H. Aluminum Hydroxides and Oxyhydroxides. In Minerals in Soil Environments; Soil Science Society of America, Inc.: Madison, WI, USA, 1989; pp. 331–378. [Google Scholar]
- Tan, K.H. Principles of Soil Chemistry, 4th ed.; CRC Press: Boca Raton, FL, USA, 2010; p. 390. [Google Scholar]
- Brown, G.; Brindley, G.W. X-ray Diffraction Procedures for Clay Mineral Identification. In Crystal Structures of Clay Minerals and Their X-ray Identification; Brindley, G.W., Brown, G., Eds.; Mineralogical Society of Great Britain and Ireland: Twickenham, UK, 1980; Volume 5. [Google Scholar]
- Otsuka, H. Characteristics and Genesis of Volcanic Ash Soil in the Philippines. II. Some Physical and Chemical Properties; Tropical Agriculture Research Center: Rome, Italy, 1985. [Google Scholar]
- Allen, B.L.; Hajek, B.F. Mineral Occurrence in Soil Environments. In Minerals in Soil Environments; Soil Science Society of America, Inc.: Madison, WI, USA, 1989; pp. 199–278. [Google Scholar]
- Taylor, R.M. Amorphous Iron Oxides in Soils. J. Soil Sci. 1959, 10, 309–315. [Google Scholar] [CrossRef]
- Inoue, K.; Higashi, T. Al-and Fe-humus Complexes in Andisols. In Proceedings of the Ninth International Soil Classfication Workshop, Tokyo, Japan, 20 July–1 August 1987; pp. 81–96. [Google Scholar]
- Qafoku, N.P.; Ranst, E.V.; Noble, A.; Baert, G. Variable Charge Soils: Their Mineralogy, Chemistry and Management. In Advances in Agronomy; Academic Press: Cambridge, MA, USA, 2004; Volume 84, pp. 159–215. [Google Scholar]
- Qafoku, N.P.; Sumner, M.E.; West, L.T. Mineralogy and chemistry of some variable charge subsoils. Commun. Soil Sci. Plant Anal. 2000, 31, 1051–1070. [Google Scholar] [CrossRef]
- Dixon, J.B. Kaolin and Serpentine Group Minerals. In Minerals in Soil Environments; Soil Science Society of America, Inc.: Madison, WI, USA, 1989; pp. 467–525. [Google Scholar]
- Eswaran, H. Morphology of allophane, imogolite and halloysite. Clay Miner. 1972, 9, 281–285. [Google Scholar] [CrossRef]
- Wada, K. Allophane and imogolite. In Developments in Sedimentology; Sudo, T., Shimoda, S., Eds.; Elsevier: Amsterdam, The Netherlands, 1978; Volume 26, pp. 147–187. [Google Scholar]
- Goenadi, D.H.; Tan, K.H. Mineralogy and Micromorphology of Soils from Volcanic Tuffs in the Humid Tropics. Soil Sci. Soc. Am. J. 1989, 53, 1907–1911. [Google Scholar] [CrossRef]
- Dahlgren, R.; Shoji, S.; Nanzyo, M. Mineralogical Characteristics of Volcanic Ash Soils. In Developments in Soil Science; Shoji, S., Nanzyo, M., Dahlgren, R., Eds.; Elsevier: Amsterdam, The Netherlands, 1993; Volume 21, pp. 101–143. [Google Scholar]
- Papoulis, D.; Tsolis-Katagas, P.; Katagas, C. Progressive Stages in the Formation of Kaolin Minerals of Different Morphologies in the Weathering of Plagioclase. Clays Clay Miner. 2004, 52, 275–286. [Google Scholar] [CrossRef]
- Sakurai, K.; Teshima, A.; Kyuma, K. Changes in Zero Point of Charge (ZPC), Specific Surface Area (SSA), and Cation Exchange Capacity (CEC) of kaolinite and montmorillonite, and strongly weathered soils caused by Fe and Al coatings. Soil Sci. Plant Nutr. 1990, 36, 73–81. [Google Scholar] [CrossRef]
- Wada, K. The Distinctive Properties of Andosols. In Advances in Soil Science; Springer: New York, NY, USA, 1985; pp. 173–229. [Google Scholar]
- Aomine, S.; Wada, K. Differential weathering of volcanic ash and pumice, resulting in formation of hydrated halloysite1. Am. Mineral. 1962, 47, 1024–1048. [Google Scholar]
- Parfitt, R.L.; Theng, B.K.G.; Whitton, J.S.; Shepherd, T.G. Effects of clay minerals and land use on organic matter pools. Geoderma 1997, 75, 1–12. [Google Scholar] [CrossRef]
- Soil Survey Staff. Soil Taxonomy. In A Basic System of Soil Classification for Making and Interpreting Soil Surveys; US Department of Agriculture: Washington, DC, USA, 1999. [Google Scholar]


| Site | Pedon | Oldeman’s Agro-Climatic Zone | Parent Material | Age of Parent Material |
|---|---|---|---|---|
| Ciater (CTR) | CTR-A | A (4215 mm/year) | Andesitic | Holocene |
| CTR-B | Andesitic | Pleistocene | ||
| Sinumbra (SNR) | SNR-A | B1 (3087 mm/year) | Andesitic | Pleistocene |
| SNR-B | Basaltic | Holocene | ||
| Sedep (SDP) | SDP-A | B2 (2668 mm/year) | Basaltic | Pleistocene |
| SDP-B | Basaltic | Holocene |
| Horizons | Depth (cm) | Color (Moist) | Texture ¶ | Structure † | Consistency ‡ | Horizon Boundary ¥ | Pores § | Coarse Fraction € |
|---|---|---|---|---|---|---|---|---|
| Profile CTR A | ||||||||
| Ap | 0–17 | 10YR 3/3–3/4 | l | sg, 2, f-m | vfr | g,s | f-m, ma | - |
| Bw | 17–31 | 7.5YR 3/4–10YR 3/4 | cl | ab, 2, f-m | fr | c,s | f-m, ma | - |
| BC | 31–43 | 10YR 4/6–3/6 | cl | ab, 1- 2, f-m | fr | c,s | f-m, mo | - |
| 2Ab | 43–60 | 5YR 3/3 | cl | ab, 2, f-m | fr | c,s | f-m, mo | - |
| 2Bwb | 60–70 | 10YR 4/6–7.5YR 5/8 | sil | ab, 2, m | fr | d,s | f-m, mo | - |
| 2BCb | 70–94 | 7.5YR 5/8 | cl | mv | vfi | g,s | f-m, mo | b,ma, vh |
| 3Ab | 94–110 | 10YR 3/4 | sicl | ab, 2, m | fr | g,s | f-m, mo | - |
| 3Bwb | 110–128 | 10YR 3/6 | c | ab, 2–3, m | fi | g,s | f-m-fe | s,fe,mo |
| 3BCb | 128–148 | 10YR 3/6 | sil | ab, 2, f-m | fi | - | f-m, mo | b, fe, mo |
| Profile CTR B | ||||||||
| Ap | 0–15 | 7.5YR 3/2–3/4 | sil | sb, 1, f | l | a,s | f-m,c, ma | - |
| Bw | 15–30 | 10YR 4/6–3/6 | sil | ab, 2–3, m | vfr | c,s | f-m, ma | - |
| BC | 30–38 | 10YR 4/6 | sil | ab, 2, f-m | fi | c,s | m-f, mo | - |
| 2Ab | 38–52 | 10YR 3/4 | sicl | ab, 2, f-m | fi | c,s | m-f, mo | - |
| 2BCb1 | 52–65 | 10YR 3/6 | cl | sb, 2–3, f-m | fr | c,s | m-f, mo | - |
| 2BCb2 | 65–90 | 10YR 4/6–3/6 | sil | sb, 2, m-f | fr | c,w | m-f, mo | m, ma, mo-h |
| 2A’b1 | 90–105 | 5YR 3/2–2.5/2 | sil | sb 2, f-m | fr | d,s | m-f, mo | s,fe, mo |
| 2A’b2 | 105–120 | 5YR 3/2–3/3 | c | sb, 2, f-m | fr | c,u | m-f, mo | - |
| 2B’wb | 120–130 | 10YR 4/6 | cl | ab, 2, f-m | fr | d,s | f-m, ma | m,fe,h |
| 2BC’b | 130–150 | 10YR 3/4 | cl | ab, 1–2, f-m | fr | - | f-m, ma | - |
| Profile SNR A | ||||||||
| Ap | 0–10 | 5 YR 3/3–3/2 | sil | cr, 2, f-vf | vfr-fr | a,s | f, ma; m-c, mo | - |
| Bw1 | 10–23 | 10YR 3/6–4/6 | sicl | cr, 2, f | l | c,s | f, ma; c-mo | - |
| Bw2 | 23–40 | 10YR 3/4–3/6 | sicl | ab, 2–3, f-m | fr | g,s | f, ma; m-fe | - |
| Bw3 | 40–54 | 10YR 3/4 | sic | ab, 3, f-vf | fr-sfi | g,s | f, me; c, fe | - |
| BC | 54–73 | 10YR 3/4–3/6 | sic | ab, 3, v-vf | fi-fr | c,s | f, me; c, fe | - |
| 2Ab | 73–84 | 10YR 4/6 | sil | ab, 3, f-vf | fr-fi | c,s | f, me; c, fe | - |
| 2BCb | 84–98 | 7.5YR 3/4–10YR 4/6 | cl | ab, 3, f-vf | fi | c,s | f, mo | b, fe,mo-f |
| 2A’b | 98–120/130 | 7.5YR 4/6–5/6 | sic | pr, 2, vf; ab,2, f | fi | c,w | f, mo; m, mo | m, fe, h |
| 2BC’b | 120/130–142 | 10YR 3/6 | sil | pr, 2, vf; ab,2, f | fr-fi | - | f, mo | m, he, h |
| Profile SNR B | ||||||||
| Ap | 0–10 | 10YR 2/2–3/3 | sil | ab, 3, f-m | cr-fi | c,s | me, ma | - |
| Bw | 10–19 | 10YR 3/4 | cl | ab-sb, 2–1, f-vf | vfr-fr | c,s | f-me, ma | - |
| A’b | 19–40 | 10YR 4/6–3/6 | c | sg, 3, m; ab, 3, f | fr-fi | c,w | f, ma; me, mo | b, mo, h |
| B’wb | 40–70 | 10YR 4/6 | c | ab,2–3, f-m | fi | - | f, me | b, fe, mo |
| Profile SDP A | ||||||||
| Ap | 0–14 | 7.5YR 3/2 | sl | cr, 3, m | fr | g,s | f-m, ma | - |
| A2 | 14–24 | 7.5YR 3/2 | l | cr-ab, 1, vf | vfr | c,s | f-m, ma | - |
| Bw | 24–35 | 7.5YR 3/2–3/4 | cl | ab-cr, 1, f-vf | fr | c,s | m, ma | - |
| BC | 35–46 | 7.5YR 3/4–3/2 | sil | ab, 2, f-fn | fr-fi | c,s | f, ma | - |
| A’b1 | 46–65 | 10YR 3/6 | c | ab, 2–3, f-vf | fr-fi | c,sw | f, ma | m, fe, mo, |
| A’b2 | 65–81 | 10YR 3/4–3/3 | sicl | ab-sb, 2, f-vf | fr | c,s | f, ma | m, fe, mo |
| B’wb | 81–95 | 10YR 3/4–3/6 | sic | ab-sb, 2–3, f-vf | fr | c,s | f, mo | m, fe, mo |
| A”b | 95–105 | 10YR 3/4 | sic | ab, 3, m | fi | c,s | f, fe | m, fe, mo |
| B”wb | 105–130 | 10YR 3/6 | c | ab, 2–3, m-f | fi | g,s | f, fe | b, me, mo |
| BC’b | 130–153 | 7.5YR 4/4–3/4 | c | ab, 2–3, f-vf | fr | - | f, fe | b, me, mo-h |
| Profile SDP B | ||||||||
| Ap | 0–11 | 10YR 3/2 | l | cr, 1–3, m | l-sg | a,s | m,mo; f, ma | - |
| Bw | 11–30 | 10YR 3/6 | sicl | ab-sb, 2, f-vf | fr | g,s | m, vf; f, m | - |
| A’b | 30–45 | 10YR 4/6 | sil | sb, 2, v-vf | fr | g,s | c,m; m-f, m | s, fe, mo |
| B’wb | 45–54 | 10YR 4/6 | sic | ab, 2, f-vf | fr | c,s | c,f; f, m | - |
| A”b1 | 54–72 | 10YR 3/3–3/4 | sil | ab, 2–3, f-m | fr | d,s | m-f,mo; | - |
| A”b2 | 72–94 | 10YR 3/3–3/4 | sicl | ab, 2–3, f-m | fr | c,s | f-m, mo | - |
| B”wb | 94–115 | 10YR 3/6 | sicl | ab, 2–3, f-m | fr | g,s | m-f, mo | - |
| BC’b | 115–135 | 10YR 3/4–3/3 | sil | ab, 2–3, f-m | fr | g,s | f-m; fe | - |
| A”’b | 135–152 | 10YR 3/3–3/4 | cl | ab, 2–3, f-m | fr-fi | - | m-f, mo | - |
| Profile/ Horizons | Light Fractions | WM/ EWM | ||||||||||||||
|---|---|---|---|---|---|---|---|---|---|---|---|---|---|---|---|---|
| op | cq | ic | sio | ze | Cm | rf | gv | an | lb | bt | ga | Au | hp | ov | ||
| CTR-A | ||||||||||||||||
| Ap | - | - | 2 | 1 | 1 | 1 | 44 | 22 | - | 9 | vr | 1 | 18 | 1 | - | 0.04 |
| Bw | vr | - | - | vr | vr | 4 | 31 | 28 | - | 7 | - | 8 | 14 | 8 | - | 0.04 |
| BC | 1 | - | 1 | vr | vr | - | 33 | 8 | - | 19 | - | 5 | 20 | 13 | - | 0.01 |
| 2Ab | 3 | - | - | - | vr | - | 48 | 10 | - | 4 | - | 5 | 24 | 6 | - | 0.00 |
| 2Bwb | 10 | - | 2 | vr | vr | 2 | 34 | 2 | - | 24 | - | 2 | 22 | 2 | - | 0.05 |
| 2BCb | 6 | - | 8 | vr | vr | 2 | 40 | - | - | 32 | - | - | 12 | - | - | 0.12 |
| 3Ab | 2 | - | 1 | - | vr | 3 | 26 | - | - | 27 | - | 32 | 7 | 2 | - | 0.04 |
| 3Bwb | 1 | - | 1 | vr | vr | 2 | 14 | - | - | 35 | - | 33 | 11 | 3 | - | 0.03 |
| 3BCb | 7 | - | 1 | - | - | 1 | 11 | - | - | 19 | - | 44 | 14 | 3 | - | 0.02 |
| CTR-B | ||||||||||||||||
| Ap | 1 | - | 68 | - | - | 1 | 4 | 4 | 2 | - | - | 6 | 12 | 2 | - | 2.30 |
| Bw | 3 | - | 45 | - | - | - | 5 | 1 | 19 | - | - | 11 | 13 | 3 | - | 0.87 |
| BC | 4 | - | 8 | - | - | 15 | 10 | - | 30 | - | - | 10 | 21 | 2 | - | 0.32 |
| 2Ab | 2 | - | 1 | - | - | 10 | 10 | - | 15 | - | - | 40 | 19 | 3 | - | 0.13 |
| 2BCb1 | 3 | - | 1 | - | - | 29 | 1 | 1 | 24 | - | - | 38 | 2 | 1 | - | 0.45 |
| 2BCb2 | 1 | - | 1 | - | vr | 10 | 10 | - | 9 | - | - | 59 | 5 | 5 | - | 0.13 |
| 2A’b1 | 3 | - | 4 | - | vr | 11 | 10 | - | 2 | - | - | 62 | 6 | 2 | - | 0.18 |
| 2A’b2 | 5 | - | 2 | - | - | 5 | 10 | - | 5 | - | - | 67 | 4 | 2 | - | 0.08 |
| 2Bwb | 8 | - | 2 | - | 1 | 30 | 17 | - | 9 | - | - | 30 | 1 | 2 | - | 0.13 |
| 2BC’b | 4 | - | 6 | vr | - | 49 | 20 | - | 5 | - | - | 16 | - | - | - | 1.34 |
| SNR-A | ||||||||||||||||
| Ap | 4 | - | 41 | - | - | 4 | 6 | - | 8 | - | - | 13 | 11 | 12 | 1 | 0.88 |
| Bw1 | 5 | 1 | - | - | - | 19 | 3 | - | - | - | - | 35 | 7 | 30 | vr | 0.25 |
| Bw2 | 2 | 1 | 1 | - | 1 | 48 | 6 | - | - | - | - | 20 | 3 | 18 | - | 1.02 |
| Bw3 | 2 | - | - | - | - | 38 | 3 | - | - | - | - | 44 | 2 | 11 | - | 0.63 |
| BC | 7 | - | - | - | - | 51 | 9 | - | 1 | - | - | 14 | - | 18 | - | 1.21 |
| 2Ab | 7 | 1 | 4 | - | - | 50 | 9 | 1 | - | - | - | 25 | - | 2 | - | 1.38 |
| 2BCb | 17 | 1 | 8 | - | vr | 50 | 2 | 1 | - | - | - | 20 | - | 1 | - | 2.32 |
| 2A’b | 27 | 6 | 10 | - | - | 54 | 3 | - | - | - | - | sd | - | - | - | 7.11 |
| 2BC’b | 12 | 2 | 11 | - | 1 | 70 | 5 | - | - | - | - | - | - | - | - | 11.57 |
| SNR-B | ||||||||||||||||
| Ap | 2 | - | 1 | - | - | 1 | 54 | 1 | - | 5 | 18 | 4 | 9 | 5 | vr | 0.02 |
| Bw | 2 | - | 1 | - | - | 3 | 29 | 5 | - | 4 | 2 | 14 | 19 | 21 | - | 0.04 |
| A’b | 3 | - | - | - | - | 5 | 10 | 4 | - | 17 | 1 | 6 | 15 | 39 | - | 0.05 |
| BCb | 2 | - | 1 | - | - | 4 | 47 | 9 | - | 10 | - | 1 | 7 | 19 | - | 0.05 |
| SDP-A | ||||||||||||||||
| Ap | 2 | - | 3 | - | - | - | 48 | - | - | - | 27 | 1 | 7 | 1 | 11 | 0.03 |
| A2 | 2 | - | 7 | - | - | - | 46 | - | - | - | 24 | 2 | 8 | 5 | 6 | 0.08 |
| Bw | 4 | vr | 1 | - | - | - | 33 | - | - | - | 13 | 9 | 24 | 7 | 9 | 0.01 |
| BC | 8 | - | 1 | - | - | 3 | 10 | - | - | - | 2 | 19 | 27 | 21 | 3 | 0.05 |
| A’b1 | 4 | - | 4 | - | - | 85 | 4 | - | - | 16 | 1 | 1 | Vr | 1 | vr | 12.71 |
| A’b1 | 22 | vr | 9 | - | - | 53 | 14 | - | - | - | - | 1 | Vr | 1 | - | 3.88 |
| B’wb | 44 | - | 4 | - | vr | 48 | 3 | - | - | - | - | vr | - | >1 | - | 13.00 |
| A”b | 30 | - | 2 | - | vr | 59 | 9 | - | - | - | - | vr | - | - | - | 6.78 |
| B”wb | 32 | - | 1 | - | 2 | 54 | 11 | - | - | - | - | - | - | - | - | 2.39 |
| BC’b | 23 | - | - | - | vr | 70 | 6 | - | - | - | - | - | - | - | - | 10.00 |
| SDP-B | ||||||||||||||||
| Ap | 1 | - | 2 | - | - | 1 | 63 | 1 | - | 3 | 10 | 3 | 9 | 3 | 4 | 0.03 |
| Bw | 2 | - | 1 | - | - | - | 43 | - | - | 4 | 16 | 5 | 15 | 9 | 5 | 0.01 |
| A’b | 3 | - | - | - | - | - | 18 | - | - | 4 | 19 | 8 | 24 | 21 | 3 | 0.00 |
| B’wb | 3 | - | 1 | - | - | 1 | 28 | - | - | 4 | 1 | 12 | 28 | 19 | 3 | 0.02 |
| A”b1 | 6 | - | 3 | - | - | - | 18 | - | - | 2 | - | 25 | 21 | 16 | 9 | 0.03 |
| A”b2 | 7 | - | 2 | - | - | - | 31 | - | - | 1 | - | 9 | 27 | 20 | 3 | 0.02 |
| B”wb | 13 | - | 2 | - | - | 1 | 13 | - | - | 1 | - | 10 | 30 | 22 | 8 | 0.04 |
| BC’b | 4 | - | - | - | - | 2 | 25 | vr | - | 9 | - | 6 | 31 | 18 | 5 | 0.02 |
| A”’b | 4 | - | - | - | vr | 7 | 40 | vr | - | 1 | - | 7 | 24 | 9 | 8 | 0.08 |
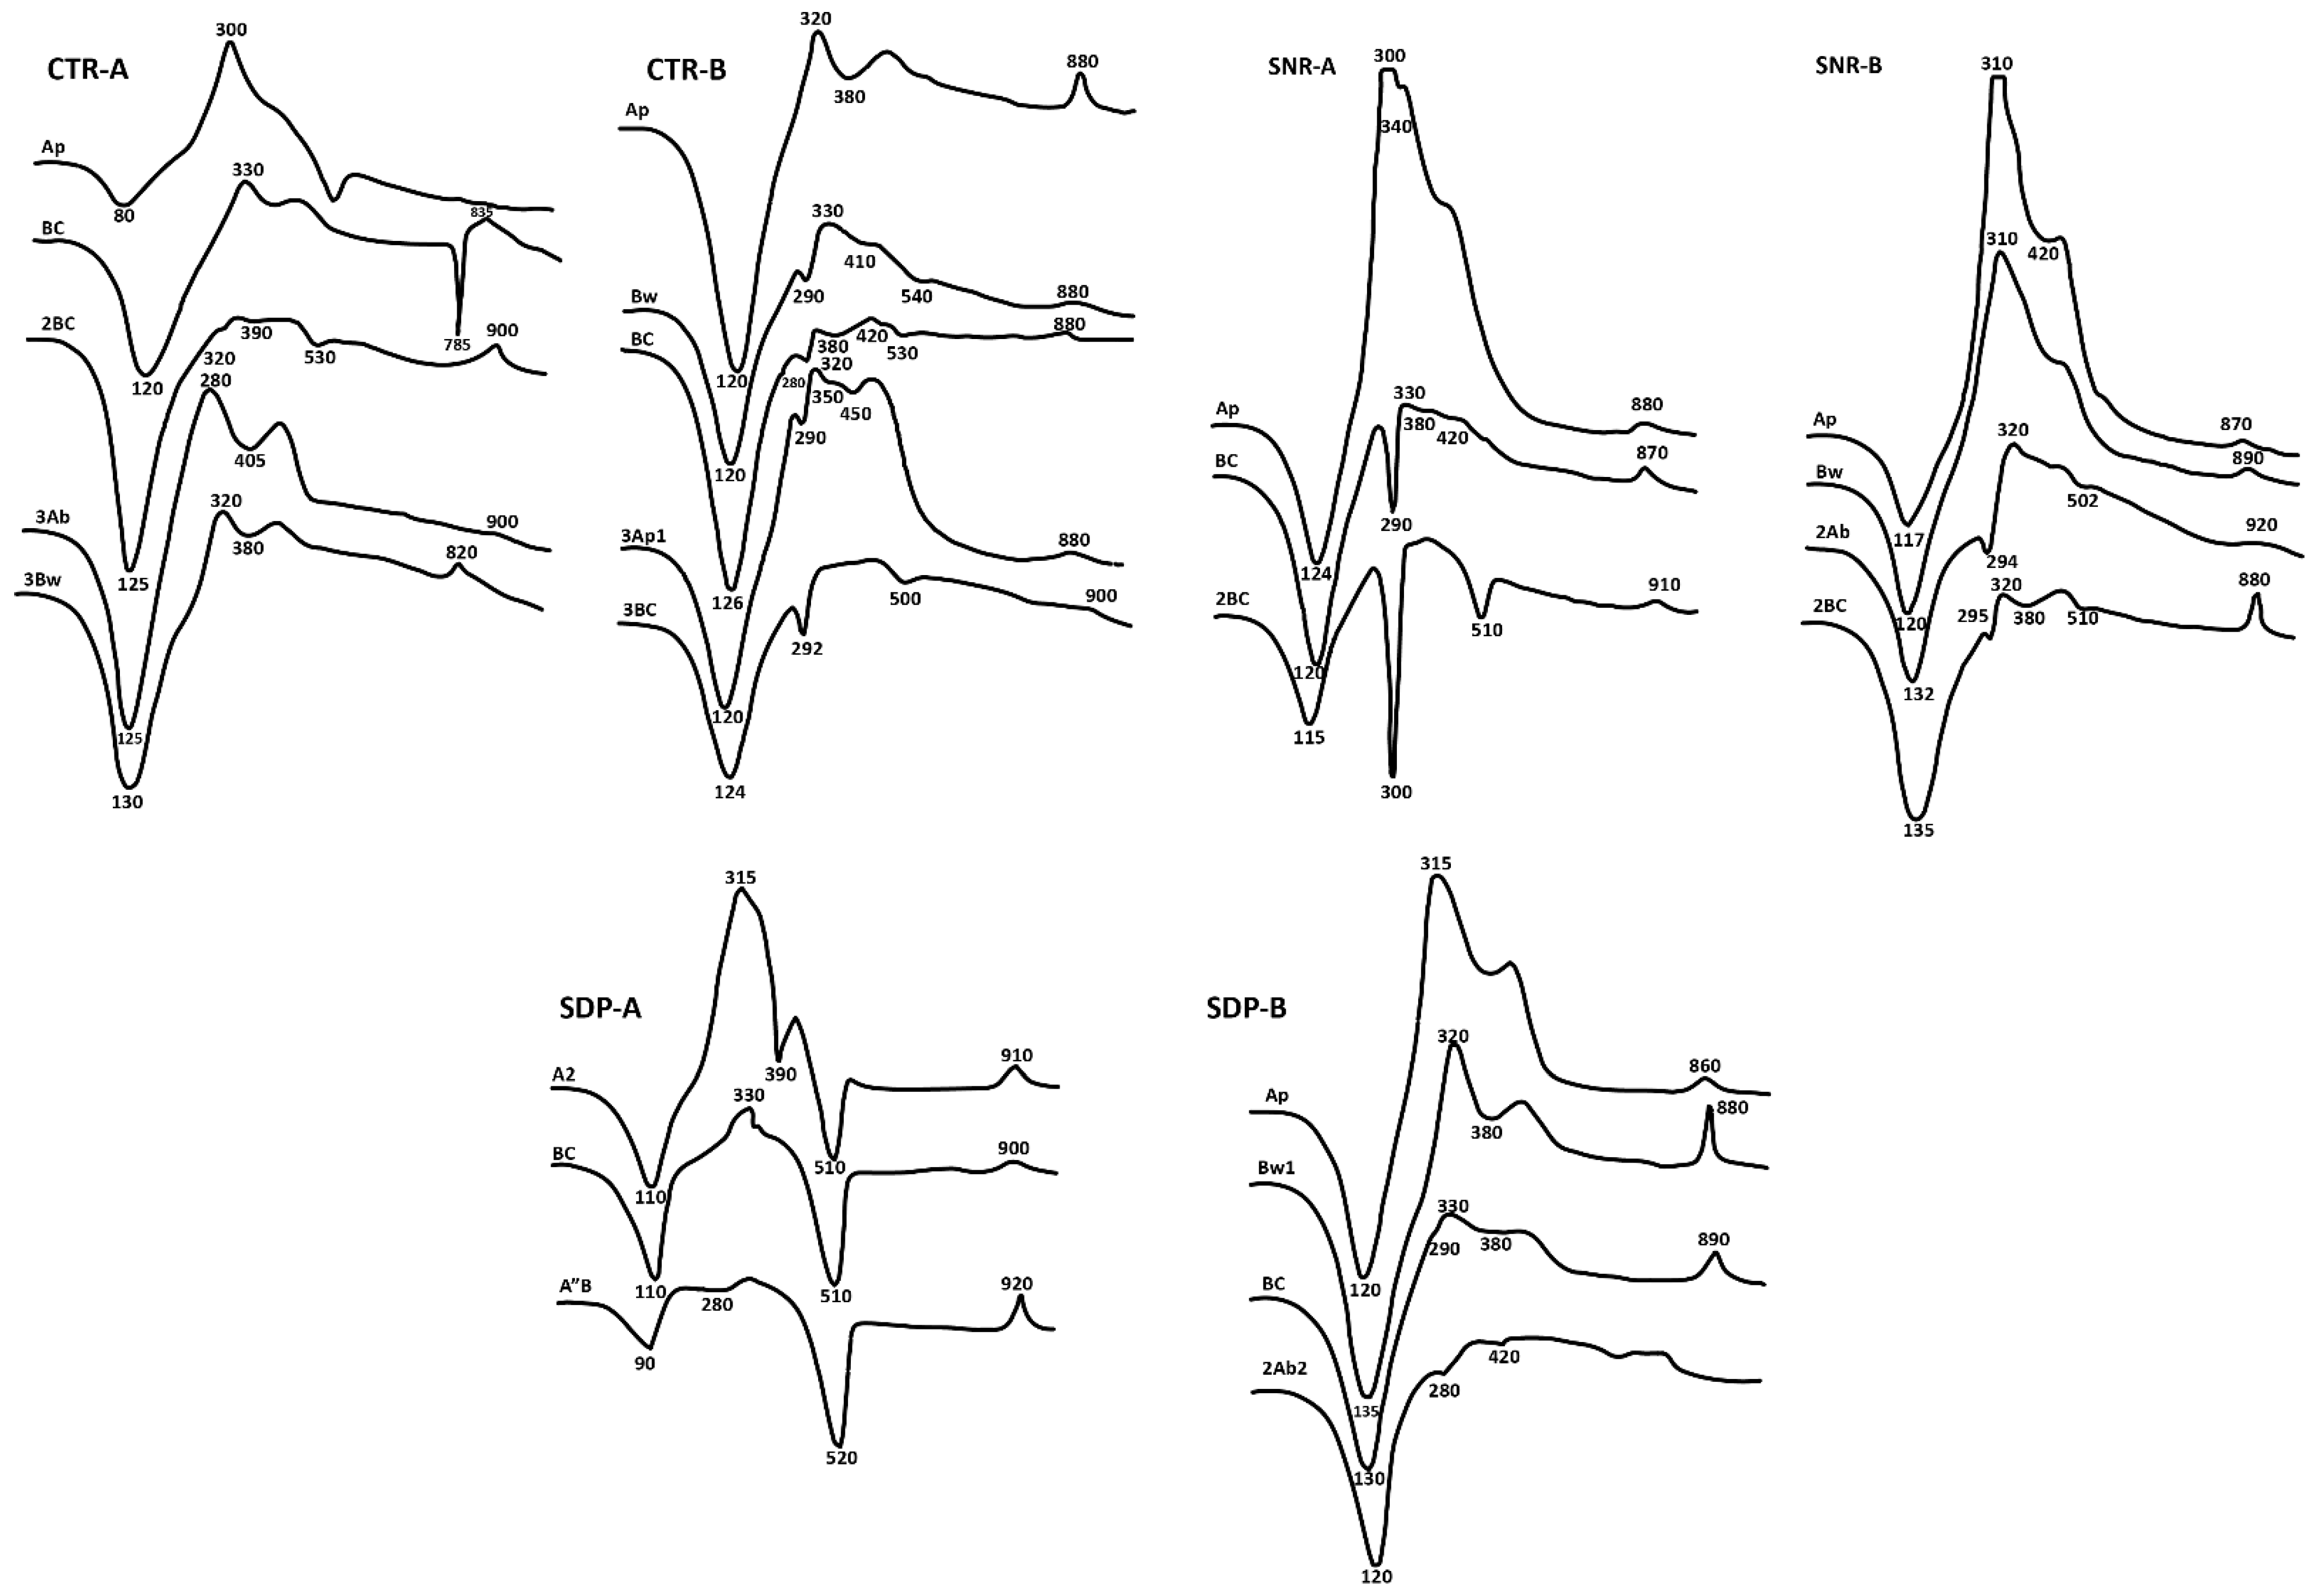
| Profiles | Horizons | DTA | XRD-Peaks | ||
|---|---|---|---|---|---|
| Diffraction Peaks | (Å) | ||||
| Endothermal (°C) | Exothermal (°C) | ||||
| CTR-A | Ap | 80; 520 | 300 | 4.05; 4.85; 7.18 | |
| BC | 120: 410; 785 | 330; 835 | 3.50; 4.36; 7.20; 12.00–17.00 | ||
| 2BCb | 125; 320; 390; 530 | 900 | 3.50; 5.50; 7.30; 9.20 | ||
| 3Ab | 125; 405 | 280; 900 | ---- | ||
| 3Bwb | 130; 380 | 320; 820 | ---- | ||
| CTR-B | Ap | 120; 380 | 320; 880 | ---- | |
| Bw | 120; 290; 350; 405 | 320; 880 | 3.50; 4.85; 5.50; 7.20 | ||
| BC | 126; 280; 380; 420; 530 | 880 | 3.50; 4.85; 5.50; 7.30 | ||
| 2A’b1 | 120; 290; 410; 540 | 330; 880 | 3.30; 4.85; 6.60 | ||
| 2BC’b | 124; 292; 500 | 900 | ---- | ||
| SNR-A | Ap | 124; 340; 420 | 300; 880 | 3.50; 4.85; 7.20; 14.60 | |
| BC | 120; 280; 380; 420 | 330; 870 | ---- | ||
| 2BC’b | 115; 300; 510 | 910 | 3.40; 4.42; 4.85; 7.20; 10.00 | ||
| SNR-B | Ap | 117; 420 | 310; 870 | 4.05; 7.20; 14.03 | |
| Bw | 120; 340 | 310; 890 | ---- | ||
| A’b | 132; 294; 502 | 320; 920 | 4.04; 4.85; 7.20; 14.30 | ||
| BC’b | 135; 295; 380; 510 | 325; 880 | 4.85; 7.20 | ||
| SDP-A | A2 | 110; 390; 510 | 315; 910 | 7.20; 10.00; 14.48 | |
| BC | 110; 380; 510 | 330; 900 | 4.42; 7.20; 10.00 | ||
| A”b | 90; 280; 520 | 920 | 3.40; 4.42; 7.20; 10.00 | ||
| SDP-B | Ap | 120; 410 | 315; 860 | 5.50; 7.20; 15.30–16.80 | |
| B’wb | 135; 380 | 320; 860 | 7.80–8.00; 13.00–20.00 | ||
| BC’b | 130; 290; 380 | 330; 890 | ---- | ||
| A”b1 | 120; 280; 420 | ---- | 4.85; 7.00–8.00; 13.00–20.00 | ||
| Profile/Horizons | Depth | pH | ΔpH ‡ | pH NaF | pH0 | C | Exchangeable Cations | Sum Cat ¶ | CEC † | Al 3+ | H+ | BS § | ||||||
|---|---|---|---|---|---|---|---|---|---|---|---|---|---|---|---|---|---|---|
| H2O | KCl | 2’ | 4’ | 60’ | Ca | Mg | K | Na | ||||||||||
| cm | % | cmol kg−1 | % | |||||||||||||||
| CTR-A | ||||||||||||||||||
| Ap | 0–17 | 3.61 | 3.81 | 0.20 | 8.99 | 9.05 | 9.33 | 3.87 | 9.11 | 0.52 | 0.38 | 0.14 | 0.48 | 1.52 | 14.84 | 3.92 | 0.10 | 10.24 |
| Bw | 17–31 | 4.08 | 4.11 | 0.03 | 9.31 | 9.36 | 9.76 | 4.10 | 7.18 | 0.00 | 0.04 | 0.09 | 0.46 | 0.59 | 8.71 | 1.76 | 0.02 | 3.97 |
| BC | 31–43 | 4.14 | 4.45 | 0.31 | 10.45 | 10.51 | 11.20 | 4.56 | 7.52 | 0.25 | 0.04 | 0.22 | 0.53 | 1.04 | 8.45 | 0.38 | 0.48 | 7.00 |
| 2Ab | 43–60 | 4.13 | 4.43 | 0.30 | 10.34 | 10.44 | 11.18 | 4.48 | 5.92 | 0.74 | 0.05 | 0.01 | 0.57 | 1.37 | 12.51 | 0.26 | 0.46 | 9.21 |
| 2Bwb | 60–70 | 4.36 | 4.67 | 0.31 | 10.49 | 10.57 | 11.45 | 4.73 | 5.35 | 0.45 | 0.06 | 0.08 | 0.50 | 1.09 | 11.03 | 0.18 | 0.34 | 7.33 |
| 2BCb | 70–94 | 4.86 | 5.12 | 0.26 | 10.17 | 10.42 | 11.29 | 5.13 | 3.90 | 0.86 | 0.03 | 0.19 | 0.87 | 1.95 | 4.51 | 0.00 | 0.14 | 13.10 |
| 3Ab | 94–110 | 4.81 | 4.87 | 0.06 | 10.27 | 10.53 | 11.28 | 4.89 | 4.44 | 0.85 | 0.46 | 0.38 | 1.38 | 3.07 | 11.20 | 0.00 | 0.42 | 20.60 |
| 3Bwb | 110–128 | 4.73 | 4.87 | 0.14 | 10.34 | 10.50 | 11.28 | 4.91 | 5.55 | 0.31 | 0.11 | 0.26 | 1.07 | 1.75 | 8.50 | 0.00 | 0.38 | 11.74 |
| 3BCb | 128–148 | 4.51 | 4.98 | 0.47 | 9.80 | 9.99 | 11.05 | 5.09 | 4.04 | 0.39 | 0.22 | 0.17 | 0.45 | 1.03 | 6.16 | 0.00 | 0.24 | 6.90 |
| CTR-B | ||||||||||||||||||
| Ap | 0–15 | 3.96 | 4.25 | 0.29 | 10.60 | 10.71 | 11.68 | 4.23 | 10.01 | 0.41 | 0.06 | 0.12 | 0.56 | 1.15 | 11.62 | 1.44 | 0.32 | 7.70 |
| Bw | 15–30 | 4.49 | 4.76 | 0.27 | 10.89 | 10.94 | 11.81 | 4.82 | 8.04 | 0.49 | 0.04 | 0.29 | 0.67 | 1.49 | 6.25 | 0.60 | 0.00 | 9.97 |
| BC | 30–38 | 4.53 | 4.87 | 0.34 | 10.46 | 10.53 | 11.70 | 4.93 | 4.47 | 0.26 | 0.04 | 0.16 | 0.57 | 1.03 | 4.95 | 0.00 | 0.26 | 6.89 |
| 2Ab | 38–52 | 4.67 | 4.80 | 0.13 | 10.54 | 10.62 | 11.79 | 4.90 | 5.52 | 0.46 | 0.06 | 0.13 | 0.60 | 1.25 | 6.65 | 0.00 | 0.36 | 8.35 |
| 2BCb1 | 52–65 | 4.54 | 4.91 | 0.37 | 10.27 | 10.32 | 11.66 | 4.96 | 4.01 | 0.34 | 0.04 | 0.13 | 0.56 | 1.07 | 3.35 | 0.00 | 0.34 | 7.14 |
| 2BCb2 | 65–90 | 4.87 | 4.85 | 0.02 | 9.39 | 9.47 | 11.53 | 4.97 | 4.53 | 0.00 | 0.03 | 0.19 | 0.60 | 0.82 | 3.45 | 0.00 | 0.42 | 5.47 |
| 2A’b1 | 90–105 | 5.00 | 4.83 | 0.17 | 10.29 | 10.30 | 11.60 | 4.87 | 7.95 | 0.59 | 0.03 | 0.10 | 0.43 | 1.15 | 11.27 | 0.20 | 0.18 | 8.16 |
| 2A’b2 | 105–120 | 5.17 | 4.86 | 0.31 | 10.67 | 10.76 | 11.67 | 4.84 | 7.81 | 0.48 | 0.02 | 0.25 | 0.64 | 1.39 | 10.02 | 0.00 | 0.38 | 9.86 |
| 2B’wb | 120–130 | 5.00 | 5.02 | 0.02 | 9.54 | 9.58 | 11.37 | 5.05 | 3.92 | 0.37 | 0.05 | 0.10 | 0.49 | 1.01 | 7.76 | 0.00 | 0.18 | 7.16 |
| 2BC’b | 130–150 | 5.07 | 5.06 | 0.01 | 9.44 | 9.48 | 10.89 | 5.00 | 5.04 | 0.25 | 0.04 | 0.15 | 0.55 | 0.99 | 8.62 | 0.04 | 0.46 | 7.02 |
| SNR-A | ||||||||||||||||||
| Ap | 0–10 | 4.35 | 4.27 | 0.08 | 11.11 | 11.38 | 11.47 | 4.17 | 10.08 | 1.57 | 0.30 | 0.09 | 0.51 | 2.47 | 10.53 | 1.40 | 0.02 | 17.51 |
| Bw1 | 10–23 | 4.60 | 4.48 | 0.12 | 11.37 | 11.63 | 11.63 | 4.60 | 8.37 | 0.35 | 0.21 | 0.07 | 0.63 | 1.26 | 12.03 | 1.22 | 0.28 | 8.93 |
| Bw2 | 23–40 | 4.74 | 4.65 | 0.09 | 11.11 | 11.42 | 11.55 | 4.67 | 5.20 | 0.00 | 0.21 | 0.04 | 0.47 | 0.72 | 10.29 | 0.24 | 0.26 | 5.10 |
| Bw3 | 40–54 | 4.81 | 4.81 | 0.0 | 11.02 | 11.37 | 11.75 | 4.70 | 5.38 | 0.42 | 0.11 | 0.04 | 0.51 | 1.08 | 15.01 | 0.00 | 0.72 | 7.66 |
| BC | 54–73 | 5.37 | 5.45 | 0.08 | 11.18 | 11.49 | 11.64 | 5.41 | 4.19 | 0.33 | 0.38 | 0.13 | 0.63 | 1.47 | 9.61 | 0.00 | 0.48 | 10.42 |
| 2Ab | 73–84 | 5.29 | 5.45 | 0.16 | 10.92 | 11.28 | 11.52 | 5.55 | 3.57 | 0.21 | 0.22 | 0.06 | 0.41 | 0.90 | 7.54 | 0.00 | 0.28 | 6.38 |
| 2BCb | 84–98 | 4.98 | 4.68 | 0.30 | 10.59 | 10.94 | 11.34 | 4.48 | 2.91 | 2.14 | 2.16 | 0.02 | 0.38 | 4.70 | 8.24 | 0.18 | 0.08 | 33.31 |
| 2A’b | 98–120/130 | 4.48 | 3.52 | 0.96 | 9.65 | 9.78 | 10.19 | 3.47 | 2.27 | 0.31 | 0.18 | 0.01 | 0.34 | 0.84 | 6.52 | 7.24 | 0.00 | 5.95 |
| 2BC’b | 120/130–142 | 4.85 | 3.93 | 0.92 | 9.55 | 9.67 | 10.61 | 4.10 | 2.19 | 0.28 | 0.47 | 0.01 | 0.27 | 1.03 | 6.28 | 1.54 | 0.26 | 7.30 |
| SNR-B | ||||||||||||||||||
| Ap | 0–10 | 4.03 | 4.19 | 0.16 | 11.13 | 11.36 | 11.59 | 4.15 | 19.99 | 0.49 | 0.06 | 0.04 | 0.43 | 1.02 | 14.02 | 1.46 | 0.08 | 7.23 |
| Bw | 10–19 | 4.83 | 4.78 | 0.05 | 11.31 | 11.51 | 11.69 | 4.72 | 9.92 | 0.34 | 0.06 | 0.02 | 0.27 | 0.69 | 9.98 | 0.12 | 0.20 | 4.89 |
| A’b | 19–44 | 5.93 | 5.45 | 0.48 | 11.21 | 11.48 | 11.70 | 5.31 | 7.04 | 0.41 | 0.10 | 0.02 | 0.36 | 0.89 | 10.51 | 0.12 | 0.04 | 6.30 |
| B’wb | 44–60+ | 6.16 | 5.65 | 0.51 | 11.07 | 11.37 | 11.59 | 5.57 | 4.80 | 0.51 | 0.56 | 0.16 | 1.03 | 2.26 | 6.89 | 0.00 | 0.14 | 16.01 |
| SDP-A | ||||||||||||||||||
| Ap | 0–14 | 4.86 | 4.34 | 0.52 | 10.36 | 10.48 | 11.03 | 3.53 | 8.42 | 3.39 | 1.84 | 0.26 | 1.53 | 7.02 | 17.71 | 0.48 | 0.08 | 49.72 |
| A2 | 14–24 | 4.97 | 4.38 | 0.59 | 10.31 | 10.60 | 11.20 | 3.34 | 6.98 | 3.29 | 1.15 | 0.22 | 1.13 | 5.79 | 11.37 | 0.32 | 0.44 | 41.00 |
| Bw | 24–35 | 5.73 | 4.77 | 0.96 | 10.00 | 10.66 | 11.21 | 3.70 | 7.29 | 1.44 | 1.60 | 0.04 | 2.45 | 5.53 | 15.65 | 0.00 | 0.24 | 39.16 |
| BC | 35–46 | 6.15 | 4.67 | 1.48 | 9.35 | 9.52 | 10.03 | 3.15 | 4.88 | 3.53 | 2.26 | 0.20 | 2.01 | 8.00 | 15.08 | 0.00 | 0.18 | 56.65 |
| A’b1 | 46–65 | 5.89 | 4.33 | 1.56 | 9.29 | 9.09 | 9.23 | 2.97 | 3.71 | 2.82 | 1.68 | 0.04 | 1.65 | 6.19 | 13.76 | 0.00 | 0.24 | 43.83 |
| A’b2 | 65–81 | 5.69 | 4.15 | 1.54 | 9.15 | 9.12 | 9.39 | 2.85 | 2.73 | 4.38 | 2.95 | 0.02 | 1.83 | 9.18 | 16.27 | 0.00 | 0.46 | 64.99 |
| B’wb | 81–95 | 5.82 | 4.28 | 1.54 | 9.21 | 9.04 | 9.48 | 2.92 | 3.34 | 3.42 | 1.38 | 0.02 | 2.29 | 7.11 | 17.25 | 0.00 | 0.24 | 50.33 |
| A”b | 95–105 | 5.84 | 4.41 | 1.43 | 9.10 | 9.16 | 9.62 | 3.05 | 2.75 | 2.55 | 1.21 | 0.02 | 1.91 | 5.69 | 9.56 | 0.00 | 0.24 | 40.28 |
| B”wb | 105–130 | 5.35 | 3.89 | 1.46 | 9.11 | 9.13 | 9.36 | 3.12 | 2.25 | 2.24 | 1.44 | 0.02 | 1.31 | 5.01 | 13.10 | 0.26 | 0.34 | 35.46 |
| BC’b | 130–153 | 5.48 | 3.71 | 1.77 | 9.28 | 9.18 | 9.36 | 2.96 | 2.33 | 1.77 | 1.30 | 0.02 | 1.65 | 4.74 | 13.94 | 0.26 | 0.48 | 33.55 |
| SDP-B | ||||||||||||||||||
| Ap | 0–11 | 4.39 | 4.22 | 0.17 | 11.03 | 11.26 | 11.55 | 4.15 | 8.06 | 0.35 | 0.18 | 0.07 | 0.53 | 1.13 | 13.11 | 0.84 | 0.32 | 8.00 |
| Bw | 11–30 | 4.75 | 4.55 | 0.2 | 11.30 | 11.55 | 11.75 | 4.50 | 5.56 | 0.45 | 0.14 | 0.04 | 0.46 | 1.09 | 16.12 | 0.10 | 0.72 | 7.71 |
| A’b | 30–45 | 4.56 | 4.36 | 0.2 | 11.15 | 11.35 | 11.65 | 4.33 | 7.07 | 0.50 | 0.24 | 0.06 | 0.48 | 1.28 | 18.83 | 0.94 | 0.36 | 9.06 |
| B’wb | 45–54 | 5.11 | 4.59 | 0.52 | 11.27 | 11.48 | 11.73 | 4.41 | 6.91 | 0.60 | 0.51 | 0.08 | 0.60 | 1.79 | 22.06 | 0.22 | 0.54 | 12.66 |
| A”b1 | 54–72 | 5.38 | 4.90 | 0.48 | 11.00 | 11.17 | 11.50 | 4.64 | 7.48 | 2.10 | 0.61 | 0.05 | 0.51 | 3.27 | 22.81 | 0.00 | 0.30 | 23.13 |
| A”b2 | 72–94 | 5.32 | 5.05 | 0.27 | 10.88 | 11.17 | 11.51 | 4.63 | 5.81 | 3.62 | 1.47 | 0.05 | 0.51 | 5.65 | 24.83 | 0.00 | 0.22 | 39.97 |
| B”wb | 94–115 | 5.86 | 5.48 | 0.38 | 10.95 | 11.19 | 11.53 | 5.49 | 3.36 | 4.29 | 2.31 | 0.04 | 0.57 | 7.21 | 26.80 | 0.00 | 0.14 | 51.00 |
| BC’b | 115–135 | 5.62 | 5.53 | 0.09 | 10.97 | 11.21 | 11.57 | 5.74 | 4.85 | 5.43 | 1.82 | 0.03 | 0.49 | 7.87 | 31.24 | 0.00 | 0.14 | 55.67 |
| A”’b | 135–152 | 5.85 | 5.52 | 0.33 | 11.02 | 11.28 | 11.66 | 5.61 | 5.06 | 1.88 | 2.08 | 0.07 | 0.58 | 4.61 | 35.72 | 0.00 | 0.14 | 32.60 |
| Profiles/Horizons | Depth | P-Ret † | Oxalate | Pyrophosphate | Sio/Alo | Sio/Feo | Alo/Feo | FH ‡ | AL ¶ | ||||
|---|---|---|---|---|---|---|---|---|---|---|---|---|---|
| Sio | Alo | Feo | Alo + ½Feo | Alp | Fep | ||||||||
| (cm) | % | % | |||||||||||
| CTR-A | |||||||||||||
| Ap | 0–17 | 89.3 | 0.18 | 1.48 | 3.14 | 3.05 | 0.79 | 1.91 | 0.12 | 0.06 | 0.47 | 5.3 | 4.7 |
| Bw | 17–31 | 94.3 | 0.55 | 1.60 | 4.27 | 3.74 | 0.98 | 2.48 | 0.34 | 0.13 | 0.37 | 7.3 | 3.1 |
| BC | 31–43 | 96.4 | 1.63 | 4.88 | 3.27 | 6.52 | 0.80 | 0.56 | 0.33 | 0.50 | 1.49 | 5.6 | 15.3 |
| 2Ab | 43–60 | 97.3 | 1.71 | 4.02 | 6.29 | 7.17 | 1.33 | 1.64 | 0.43 | 0.27 | 0.64 | 10.7 | 11.1 |
| 2Bwb | 60–70 | 97.2 | 2.23 | 6.36 | 6.83 | 9.78 | 0.86 | 0.62 | 0.35 | 0.33 | 0.93 | 11.6 | 20.6 |
| 2BCb | 70–94 | 97.2 | 1.80 | 6.24 | 5.02 | 8.75 | 0.63 | 0.07 | 0.29 | 0.36 | 1.24 | 8.5 | 24.0 |
| 3Ab | 94–110 | 97.6 | 1.67 | 7.10 | 5.43 | 9.82 | 1.12 | 0.79 | 0.24 | 0.31 | 1.31 | 9.2 | 32.5 |
| 3Bwb | 110–128 | 98.6 | 1.78 | 8.84 | 5.30 | 11.49 | 0.64 | 0.16 | 0.20 | 0.34 | 1.67 | 9.0 | 64.2 |
| 3BCb | 128–148 | 99.1 | 1.79 | 7.46 | 5.10 | 10.01 | 0.60 | 0.02 | 0.24 | 0.35 | 1.46 | 8.7 | 46.4 |
| CTR-B | |||||||||||||
| Ap | 0–15 | 97.2 | 0.99 | 4.77 | 3.30 | 6.42 | 0.95 | 0.91 | 0.21 | 0.30 | 1.45 | 5.6 | 26.6 |
| Bw | 15–30 | 99.2 | 2.06 | 6.66 | 5.52 | 9.42 | 0.93 | 0.14 | 0.31 | 0.37 | 1.21 | 9.4 | 22.4 |
| BC | 30–38 | 98.8 | 1.68 | 6.34 | 5.13 | 8.91 | 0.65 | 0.09 | 0.26 | 0.33 | 1.24 | 8.7 | 27.4 |
| 2Ab | 38–52 | 98.9 | 1.43 | 6.82 | 5.29 | 9.47 | 0.69 | 4.65 | 0.21 | 0.27 | 1.29 | 9.0 | 51.6 |
| 2BCb1 | 52–65 | 98.8 | 1.71 | 5.42 | 6.02 | 8.43 | 0.41 | 0.03 | 0.32 | 0.28 | 0.90 | 10.2 | 20.2 |
| 2BCb2 | 65–90 | 98.9 | 1.69 | 6.80 | 2.58 | 8.09 | 0.56 | 0.10 | 0.25 | 0.66 | 2.64 | 4.4 | 37.0 |
| 2A’b1 | 90–105 | 98.8 | 1.94 | 7.64 | 5.08 | 10.18 | 0.61 | 0.13 | 0.25 | 0.38 | 1.50 | 8.6 | 39.4 |
| 2A’b2 | 105–120 | 98.7 | 2.71 | 7.52 | 6.48 | 10.76 | 1.00 | 0.12 | 0.36 | 0.42 | 1.16 | 11.0 | 24.3 |
| 2B’wb | 120–130 | 98.8 | 1.15 | 5.57 | 5.99 | 8.57 | 0.64 | 0.11 | 0.21 | 0.19 | 0.93 | 10.2 | 74.2 |
| 2BC’b | 130–150 | 99.3 | 1.54 | 6.29 | 5.36 | 8.97 | 0.54 | 0.03 | 0.24 | 0.29 | 1.17 | 9.1 | 35.3 |
| SNR-A | |||||||||||||
| Ap | 0–10 | 98.2 | 2.04 | 6.18 | 3.45 | 7.91 | 1.02 | 0.58 | 0.33 | 0.59 | 1.79 | 5.9 | 19.4 |
| Bw1 | 10–23 | 98.7 | 5.19 | 7.75 | 2.83 | 9.17 | 1.40 | 0.10 | 0.67 | 1.83 | 2.74 | 4.8 | 30.2 |
| Bw2 | 23–40 | 99.3 | 5.55 | 10.91 | 5.50 | 13.66 | 0.46 | 0.05 | 0.51 | 1.01 | 1.98 | 9.4 | 40.2 |
| Bw3 | 40–54 | 98.9 | 4.64 | 7.99 | 2.08 | 9.03 | 0.27 | 0.01 | 0.58 | 2.23 | 3.84 | 3.5 | 31.1 |
| BC | 54–73 | 98.4 | 2.88 | 7.09 | 5.37 | 9.78 | 0.26 | 0.06 | 0.41 | 0.54 | 1.32 | 9.1 | 25.5 |
| 2Ab | 73–84 | 91.4 | 2.18 | 4.71 | 2.89 | 6.16 | 0.22 | 0.13 | 0.46 | 0.75 | 1.63 | 4.9 | 16.9 |
| 2BCb | 84–98 | 98.1 | 1.33 | 2.14 | 4.24 | 4.26 | 0.18 | 0.32 | 0.62 | 0.31 | 0.50 | 7.2 | 8.4 |
| 2A’b | 98–120/130 | 88.4 | 0.43 | 0.27 | 1.95 | 1.25 | 0.21 | 0.53 | 1.59 | 0.22 | 0.14 | 3.3 | 1.9 |
| 2BC’b | 120/130–142 | 92.8 | 0.51 | 0.84 | 1.84 | 1.76 | 0.45 | 0.95 | 0.61 | 0.28 | 0.46 | 3.1 | 2.6 |
| SNR-B | |||||||||||||
| Ap | 0–10 | 97.7 | 1.59 | 4.32 | 1.98 | 5.31 | 1.29 | 1.35 | 0.37 | 0.80 | 2.18 | 3.4 | 12.0 |
| Bw | 10–19 | 97.4 | 2.08 | 5.71 | 2.58 | 7.00 | 0.69 | 0.99 | 0.36 | 0.81 | 2.21 | 4.4 | 18.5 |
| A’b | 19–44 | 98.5 | 2.79 | 6.56 | 3.14 | 8.13 | 0.65 | 0.11 | 0.43 | 0.89 | 2.09 | 5.3 | 23.6 |
| B’wb | 44–60+ | 98.9 | 3.15 | 8.33 | 2.62 | 9.64 | 0.27 | 0.02 | 0.38 | 1.20 | 3.18 | 4.5 | 28.8 |
| SDP-A | |||||||||||||
| Ap | 0–14 | 88.9 | 0.42 | 0.71 | 2.66 | 2.04 | 0.57 | 0.49 | 0.59 | 0.16 | 0.27 | 4.5 | 1.9 |
| A2 | 14–24 | 92.7 | 0.72 | 1.22 | 3.07 | 2.76 | 0.38 | 0.58 | 0.59 | 0.23 | 0.40 | 5.2 | 4.1 |
| Bw | 24–35 | 96.0 | 1.13 | 1.60 | 1.95 | 2.58 | 0.37 | 0.49 | 0.71 | 0.58 | 0.82 | 3.3 | 6.3 |
| BC | 35–46 | 89.1 | 0.28 | 0.46 | 1.90 | 1.41 | 0.27 | 0.81 | 0.61 | 0.15 | 0.24 | 3.2 | 1.4 |
| A’b1 | 46–65 | 88.9 | 0.16 | 0.36 | 1.76 | 1.24 | 0.31 | 0.88 | 0.44 | 0.09 | 0.20 | 3.0 | 0.7 |
| A’b2 | 65–81 | 88.3 | 0.34 | 0.42 | 1.06 | 0.95 | 0.37 | 0.73 | 0.81 | 0.32 | 0.40 | 1.8 | 1.5 |
| B’wb | 81–95 | 87.8 | 0.78 | 0.17 | 1.50 | 0.92 | 0.12 | 1.19 | 4.59 | 0.52 | 0.11 | 2.6 | 3.4 |
| A”b | 95–105 | 88.8 | 0.62 | 0.27 | 1.28 | 0.91 | 0.22 | 0.71 | 2.30 | 0.48 | 0.21 | 2.2 | 2.7 |
| B”wb | 105–130 | 88.9 | 0.27 | 0.11 | 1.43 | 0.83 | 0.06 | 0.11 | 2.45 | 0.19 | 0.08 | 2.4 | 1.2 |
| BC’b | 130–153 | 88.8 | 0.28 | 0.31 | 1.52 | 1.07 | 0.26 | 0.48 | 0.90 | 0.18 | 0.20 | 2.6 | 1.2 |
| SDP-B | |||||||||||||
| Ap | 0–11 | 96.6 | 1.68 | 3.34 | 2.07 | 4.38 | 0.74 | 0.92 | 0.50 | 0.81 | 1.61 | 3.5 | 10.8 |
| Bw | 11–30 | 98.8 | 2.29 | 7.45 | 3.14 | 9.02 | 0.66 | 0.12 | 0.31 | 0.73 | 2.37 | 5.3 | 27.7 |
| A’b | 30–45 | 97.2 | 3.87 | 9.32 | 3.58 | 11.11 | 0.58 | 0.10 | 0.42 | 1.08 | 2.60 | 6.1 | 32.6 |
| B’wb | 45–54 | 98.8 | 2.53 | 10.89 | 4.02 | 12.90 | 0.53 | 0.04 | 0.23 | 0.63 | 2.71 | 6.8 | 67.5 |
| A”b1 | 54–72 | 98.9 | 3.93 | 10.87 | 4.46 | 13.10 | 0.48 | 0.01 | 0.36 | 0.88 | 2.44 | 7.6 | 39.6 |
| A”b2 | 72–94 | 99.2 | 2.82 | 11.00 | 4.42 | 13.21 | 0.55 | 0.03 | 0.26 | 0.64 | 2.49 | 7.5 | 62.7 |
| B”wb | 94–115 | 99.1 | 2.07 | 11.76 | 4.43 | 13.98 | 0.46 | 0.01 | 0.18 | 0.47 | 2.65 | 7.5 | 71.3 |
| BC’b | 115–135 | 98.9 | 2.21 | 12.22 | 5.47 | 14.96 | 0.40 | 0.01 | 0.18 | 0.40 | 2.23 | 9.3 | 69.5 |
| A”’b | 135–152 | 99.3 | 4.44 | 10.16 | 5.21 | 12.77 | 0.28 | 0.01 | 0.44 | 0.85 | 1.95 | 8.9 | 36.8 |
| No | Soil Properties | Soil Factors Formation | ||||
|---|---|---|---|---|---|---|
| Climates *) | Age of Parent Materials | Parent Materials | ||||
| 1 | pH H2O | Xx | X | Xx | ||
| 2 | ΔpH | Xx | O | X | ||
| 3 | pH0 | O | Xx | X | ||
| 4 | Bases | Xx | X | X | ||
| 5 | Al-exchangeable | O | X | O | ||
| 6 | Organic C | Xx | Xx | O | ||
| 7 | CEC (pH7) | X | O | X | ||
| 8 | BS (%) | Xx | O | Xx | ||
| 9 | P-Retention | O | X | O | ||
| 10 | (Al + ½ Fe)-oxalate | X | X | O | ||
| 11 | (Al +Fe)-pyrophosphate | Xx | X | O | ||
| 12 | Sand, Silt, Clay | O | Xx | O | ||
| 13 | Bulk Density ⅓ bar | X | X | X | ||
| 14 | Water Retention 15 Bar | Xx | X | O | ||
| 15 | Clay Minerals | Xx | Xx | X | ||
| 16 | Sand Minerals | X | Xx | Xx | ||
Publisher’s Note: MDPI stays neutral with regard to jurisdictional claims in published maps and institutional affiliations. |
© 2022 by the authors. Licensee MDPI, Basel, Switzerland. This article is an open access article distributed under the terms and conditions of the Creative Commons Attribution (CC BY) license (https://creativecommons.org/licenses/by/4.0/).
Share and Cite
Arifin, M.; Devnita, R.; Anda, M.; Goenadi, D.H.; Nugraha, A. Characteristics of Andisols Developed from Andesitic and Basaltic Volcanic Ash in Different Agro-Climatic Zones. Soil Syst. 2022, 6, 78. https://doi.org/10.3390/soilsystems6040078
Arifin M, Devnita R, Anda M, Goenadi DH, Nugraha A. Characteristics of Andisols Developed from Andesitic and Basaltic Volcanic Ash in Different Agro-Climatic Zones. Soil Systems. 2022; 6(4):78. https://doi.org/10.3390/soilsystems6040078
Chicago/Turabian StyleArifin, Mahfud, Rina Devnita, Markus Anda, Didiek H. Goenadi, and Adi Nugraha. 2022. "Characteristics of Andisols Developed from Andesitic and Basaltic Volcanic Ash in Different Agro-Climatic Zones" Soil Systems 6, no. 4: 78. https://doi.org/10.3390/soilsystems6040078
APA StyleArifin, M., Devnita, R., Anda, M., Goenadi, D. H., & Nugraha, A. (2022). Characteristics of Andisols Developed from Andesitic and Basaltic Volcanic Ash in Different Agro-Climatic Zones. Soil Systems, 6(4), 78. https://doi.org/10.3390/soilsystems6040078