Article

Analysis of Molecular Structure Changes in Humic Acids from Manure-Amended Soils over 17 Years Using Elemental Analysis and Solid-State 13C Nuclear Magnetic Resonance Spectroscopy

1
School of Environmental Sciences, University of Guelph, Guelph, ON N1G 2W1, Canada
2
Harrow Research and Development Centre, Agriculture and Agrifood Canada, Harrow, ON N0R 1G0, Canada
3
Chitose Laboratory Corp., Kawasaki 213-0012, Kanagawa, Japan
*
Author to whom correspondence should be addressed.
Soil Syst. 2023, 7(3), 76; https://doi.org/10.3390/soilsystems7030076
Submission received: 11 July 2023 / Revised: 17 August 2023 / Accepted: 18 August 2023 / Published: 21 August 2023

Abstract

:
Soil organic matter (SOM) plays an important role in regulating plant nutrient availability. Here, the effects of the long-term application of different forms of processed swine manure on the SOM structure are explored through the analysis of humic acid (HA) using elemental analysis and 13C solid-state nuclear magnetic resonance (NMR) spectroscopy. The HAs from soils amended with liquid swine manure (LSM) and swine manure compost (SMC) are found to be more humified compared to the soils treated with solid swine manure (SSM) and the control (CK). The H/C and O/C molar ratios suggest that carboxyl-rich aliphatic structures are the most important class of biomolecules contributing to the LSM- and SMC-HA structures, while lignin-like structures are the most important biomolecules contributing to the CK- and SSM-HAs. SSM promoted the formation of aliphatic polar structures, which are more susceptible to aerobic biodegradation, whereas the CK facilitated the inclusion of condensed aromatic structures into the HA. Apart from the LSM-HA, the proportion of carboxylic acid functional groups reduced with manure application, while the proportion of phenolic acid functional groups increased. LSM-HA has the highest potential to enhance plant nutrient availability.

1. Introduction

Soil organic matter (SOM) is essential for sustainable agricultural production and to increase the resilience of agroecosystems to climate change [1,2]. It is generally accepted that crop nutrition can be improved when the organic structures in the SOM make nutrients more soluble [3]. These structures are traditionally called humic substances (HSs) and are operationally categorized into humic acid, fulvic acid, and humin [4]. The humic acid (HA) fraction is believed to be essentially involved in soil reactions that regulate plant nutrients due to its abundance of carboxylic acid groups [3].
Many studies have shown that the application of organic amendments can enhance soil fertility and increase the SOM content [2,5]. However, these organic amendments, over time, also alter the composition, molecular structure, and reactivity of the SOM, including the HSs [6].
The structural configurations of the SOM and the HSs are integrally linked to how they are formed from organic amendments [7]. Thus, HSs formed under different organic amendment management systems tend to differ in their mechanism and efficacy of plant nutrient supply [3]. Similarly, processes governing the persistence of the SOM are important in determining the potential of the HSs to enhance plant nutrient availability [8]. For example, more humified HSs have greater resistance to microbial attack [9]. In addition, the interaction of the HS with cations can increase its structural stability by linking negatively charged functional groups together, which can then adsorb on soil colloids, thereby physically protecting it from microbial attack [10,11].
Soils in southwestern Ontario are predominantly calcareous [12]. Accordingly, phosphorus availability is a major constraint to sustainable grain production [13,14]. The application of organic amendments to calcareous soils is one of the strategies for improving plant nutrient availability. Research has shown that, in calcareous soils, even small additions of organic amendments that promote the formation of HSs may strongly improve plant nutrient uptake [15].
In southwestern Ontario, the use of processed swine manures as an organic amendment has become very popular and economical for supplying plant nutrients and replenishing the SOM stock in grain production fields [16].
Studies of SOM structure and functionality are often limited by the heterogenous nature of soils, which comprise a complex mixture of mineral and organic components. To overcome these challenges, studies of SOM chemical structure often rely on operational extracts that reduce the complexity such that key differences in chemical functionality can be compared between treatments. Key approaches used to reduce the chemical complexity include the physical fractionation of the SOM [17], which has been shown to be useful for providing information on carbon sequestration in different size fractions of the soil [18,19], and the more traditional approach based on the operational separation based on differences in solubility at different pH values to produce fulvic acid (FA), humic acid (HA), and humin fractions and extracts [20]. While concerns related to the possibility of structural alterations to the SOM through these operational extractions have been raised [21], there is a growing body of literature that shows that structural information at the molecular level obtained from alkaline-extracted fractions can provide valuable insights into soil processes and their environmental controls [22,23,24,25]. Work by our group has also validated the use of alkaline-extracted HA fractions for studying the functionality of the SOM [26].
In this study, we explore structural changes in the HA extract of soils amended with different forms of swine manure as a proxy for changes in SOM structure and functional group distribution over a 17-year study period. Our objectives are to identify changes in the molecular structures in the SOM in soils amended with different forms of swine manure over the long term, to understand the formation pathway and how these structures change with the different swine manure amendments, and to understand how these changes influence soil fertility and nutrient use efficiency under a continuous system of crop production.

2. Materials and Methods

2.1. Experimental Site and Treatments

The soils used for this study were collected at The Eugene Whelan Research Farm of the Harrow Research and Development Center which is located at the Agriculture and Agri-Food Canada research farm in Woodslee, ON, Canada (42°13′ N, 82°44′ W). These soils are part of an ongoing long-term integrated nutrient management study started in 2004 and designed to observe the effect of organic amendments and inorganic fertilizer on corn and soybean grown in alternate-year rotations. The soil is classified as Brookston clay loam, formed from silty material and the underlying loamy till in depressions on till plains and moraines. Its taxonomic class is fine-loamy, mixed, mesic, Typic Argiaquoll [16].
The experimental plots were laid out as a randomized complete block design, with three replicates. The selected treatments consisted of three forms of swine manure: solid swine manure (SSM), liquid swine manure (LSM), and swine manure compost (SMC). The control (CK) received no manure application, but the crop residues were incorporated into the soil after harvest. The manures were collected from two local swine farms in southwestern Ontario. The SSM amendment included the wheat straw used as bedding, while the SMC was prepared by spraying LSM on shredded wheat straw. Details of the preparation, handling, and application of the amendments have been published [16].
Prior to the collection of soil samples in the spring of 2021, corn was grown in the spring of 2020, and the fields had been fallowed since the end of the growing season in autumn 2020. The plots discussed in this study received organic amendment application during every corn phase of the rotation at a P rate of 100 kg P ha−1; the control plot received no manure application, but the crop residues were incorporated into the soil.

2.2. Soil Sampling and Analysis

The surface soil (0–20 cm) was sampled with an auger based on a composite diagonal points sampling scheme in the spring of 2021. This involved collecting soil samples at auger points along diagonals at a depth of 0–20 cm, followed by bulking of the disturbed samples and sub-sampling of the composite samples. A total of 12 auger points of approximately 750 g were collected per plot. The soil samples were collected in three replicates. The samples collected were air-dried to a constant weight and sieved through a 2 mm screen prior to analysis. The chemical properties of the soils used for this study are shown in Table 1.

2.3. Extraction and Purification of Humic Acid

The humic acid (HA) extracts were prepared from the soils based on the standard method of the International Humic Substance Society (IHSS) [26].
The soil samples were treated with 1 M HCl in centrifuge bottles at a soil to solution ratio of 1:10 (pH 1–2) to remove carbonates. The mixtures were centrifuged at 3000 rpm for 10 min, and the supernatant was decanted. The soil residues were neutralized using 1 M NaOH and then extracted using 0.1 M NaOH at a soil to solution ratio of 1:10 in a glovebox under an argon atmosphere. The suspension was extracted for 4 h under an argon atmosphere, with intermittent shaking. The suspension was allowed to settle for 16 h, and the supernatant was collected after centrifuging. The supernatant was acidified to pH 1–2 with 6 M HCl, with constant stirring, and allowed to stand for 16 h and then centrifuged at 4000 rpm to separate the HA precipitate from the fulvic acid supernatant. The HA was redissolved using a minimum volume of 0.1 M KOH in a glovebox under an argon atmosphere, and solid KCl was added to attain a solution K+ concentration of 0.3 M. The solution was then centrifuged at 8000 rpm to remove suspended solids. HA was reprecipitated from the suspension by acidifying the suspension to pH 1 by adding 6 M HCl, with constant stirring, and allowing the suspension to stand for 16 h. The suspension was centrifuged, and the supernatant was discarded. The HA precipitate was suspended in 0.1 M HCl and shaken at room temperature on a reciprocal shaker at 200 rpm for 24 h. The mixture was centrifuged; the supernatant was discarded, and the procedure was repeated. The HA was slurried into a dialysis tubing with an MW cutoff of 4000 kD and dialyzed extensively against 18.2 MΩ water. The purified extracts were freeze-dried, weighed, and subjected to further analysis.

2.4. Elemental Analysis

The concentrations of solid-phase carbon, hydrogen, nitrogen, and sulfur were measured on a CHNS analyzer (PerkinElmer 2400 CHNS analyzer, Waltham, MA, USA). The ash contents were measured by igniting the HA extracts at 700 °C for 3 h using a muffle furnace (Thermo Fisher Scientific, Lindberg BF51442C, Waltham, MA, USA). All measurements were carried out in triplicate. The content of oxygen in the samples was calculated by subtracting the C, H, N, S, and ash contents from total organic matter measured by loss on ignition.

2.5. NMR Experiments

Solid-state 13C nuclear magnetic resonance (NMR) spectra were obtained on a Bruker Avance III 500 MHz spectrometer (Bruker Biospin, Billerica, MA, USA). Powdered samples were packed in a 4 mm ZrO rotor. Preliminary work was carried out to establish the optimal conditions corresponding to maximum intensity for all experiments. Quantitative solid-state 13C direct polarization magic-angle spinning (DPMAS) spectra were acquired at a spinning speed of 12.5 kHz and by employing high-power decoupling with recycle delays of 40 s. A total of 1024 scans were acquired for each DPMAS spectrum. The cross-polarization magic-angle spinning (CPMAS) experiment was combined with total sideband suppression to remove overlap of the spinning sidebands and isotropic resonances. The CPMAS spectra were acquired at a spinning speed of 8 kHz. A total of 4000 scans were obtained using a contact time of 1 ms and a recycle delay of 4 s.

2.6. Data Processing and Analysis

Insights into the basic molecular structure and changes in the structure of the HA with different organic amendments were obtained from H/C and O/C molar ratios by plotting them on a van Krevelen diagram [27], categorized into three regions of interest [7], based on where the H/C and O/C ratios fell on the van Krevelen plot: (1) lignin-like (0.2 ≤ O/C ≤ 0.67, 0.7 ≤ H/C ≤ 1.2), (2) condensed aromatics (0 ≤ O/C ≤ 0.67, 0.2 ≤ H/C ≤ 0.85), (3) carboxyl-containing aliphatic molecules (CCAM) (O/C ≤ 0.4, 0.85 ≤ H/C ≤ 2).
Both CPMAS and DPMAS 13C NMR spectra were used in the analysis of the samples in this study. The CPMAS spectra were used primarily for the identification of molecular structures while the DPMAS spectra were primarily used for quantification. Integrations of the spectra were performed using the Bruker Topspin 4.0 software to determine the relative intensities of the carbon types. Resonances were assigned to various molecular groups: aliphatic C (0–50 ppm), methoxy (50–60 ppm), O-alkyl (60–120 ppm), aromatic C (120–145 ppm), phenolic C (145–162), carboxyl C (162–190 ppm), and ketones C (190–200 ppm). All other peak assignments were based on the literature-reported values. The distribution of aromatic C in the NMR signal was calculated as the ratio of signals from 108 to 162 ppm to signals from 0 to 162 ppm. The total concentration of carboxylic acid functionality as a fraction of the total C in the HA was calculated by multiplying the DPMAS integral area from 162 to 190 ppm by the mass fraction of C in the HA [28]. Differences in the chemical environment of the aromatic structure of the samples were further explored by comparing NMR spectra acquired using CPMAS to the DPMAS spectra. Here, the integrals of each region in the CPMAS and DPMAS spectra were normalized to the aliphatic region from 25 to 50 ppm. CPMAS produces a 13C signal by transferring magnetization from 1H to 13C, whereas DPMAS produces signals by directly polarizing 13C nuclei without the aid of polarization transfer from 1H. As such, signal enhancements observed in the CPMAS spectra of a sample when compared with its DPMAS spectra can be qualitatively related to the density and efficiency of cross-polarization between 1H and 13C through dipolar interactions. When the aromatic region of the 13C DPMAS and CPMAS spectra are compared, the differences in signal enhancement can be used to qualitatively explore the degree of protonation of the aromatic regions of the samples.
Statistical analyses were performed using SAS/STAT® software, ODS version (2021) [29]. The least square means, standard errors, and coefficients were computed using the Proc GLIMMIX procedure. The Shapiro–Wilk residual test was performed to review the assumption of error normality. Tukey’s studentized range test was used for comparisons among the treatments. The Type I error rate of p = 0.05 was used for all statistical tests.

3. Results

3.1. Elemental Composition of HA

Table 2 lists the proportion of HA extracted as a mass % of the total SOM content; the elemental composition (on an ash-free basis); and the O/C, H/C, and C/N molar ratios of the HA extracts from the soils in this study. The amount of HA extracted from the soils varied with the type of organic amendment applied (Table 2). The HA extract from the SSM treated soil (SSM-HA) and control soil (CK-HA) was relatively low and accounted for about 1% of the total SOM. The HA extract from the SMC (SMC-HA) and LSM (LSM-HA) treated soils was higher and accounted for about 10% and 32% of the total SOM, respectively. These values are semi-quantitative but accurately reflect the relative differences in HA contents of the soils in this study.
The C content of the HA extracts ranged from 44% to 50%. Manure application significantly increased the C content of the HAs. The LSM-HA had a higher composition of C (p < 0.05) than the other samples. The relative amount of C in the samples varied in the following order: LSM > SMC > SSM > CK. Manure application also altered the elemental H and N composition, and it varied between 3.8% and 4.5% and between 3.5% and 4.6%, respectively. The LSM-HA had a higher composition of H and N (p < 0.05) while the CK-HA had the lowest. The N content in the SMC-HA and SSM-HA was not significantly different. Nevertheless, the N content was higher in all the HA extracts from soils treated with manure compared to the HA from the control soil in which only the crop residue was incorporated. Regardless of the elevated N content in the manure-treated soils, the average value of C/N for the samples was narrow and within the C/N range of 10–18 generally reported for humic substances [30]. The organic amendments influenced the elemental O content of the HAs, varying between 19% and 36%. The SSM-HA had the highest O content and was significantly different (p < 0.05) from the concentration measured in the other HAs. Except for the SSM-HA, manure treatment decreased the O content in the HA compared to the control.
The H/C molar ratio ranged from 1.04 to 1.18. Manure application increased the H/C molar ratios of the HAs compared to the control. The O/C molar ratio ranged from 0.31 to 0.59. Except for the SSM-HA, manure application decreased the O/C molar ratios of the HAs. In general, manure application increased the content of C, H, and N and the H/C molar ratio but decreased the content of O and the O/C and C/N molar ratios, except for the SSM-HA where the values of O and O/C increased.

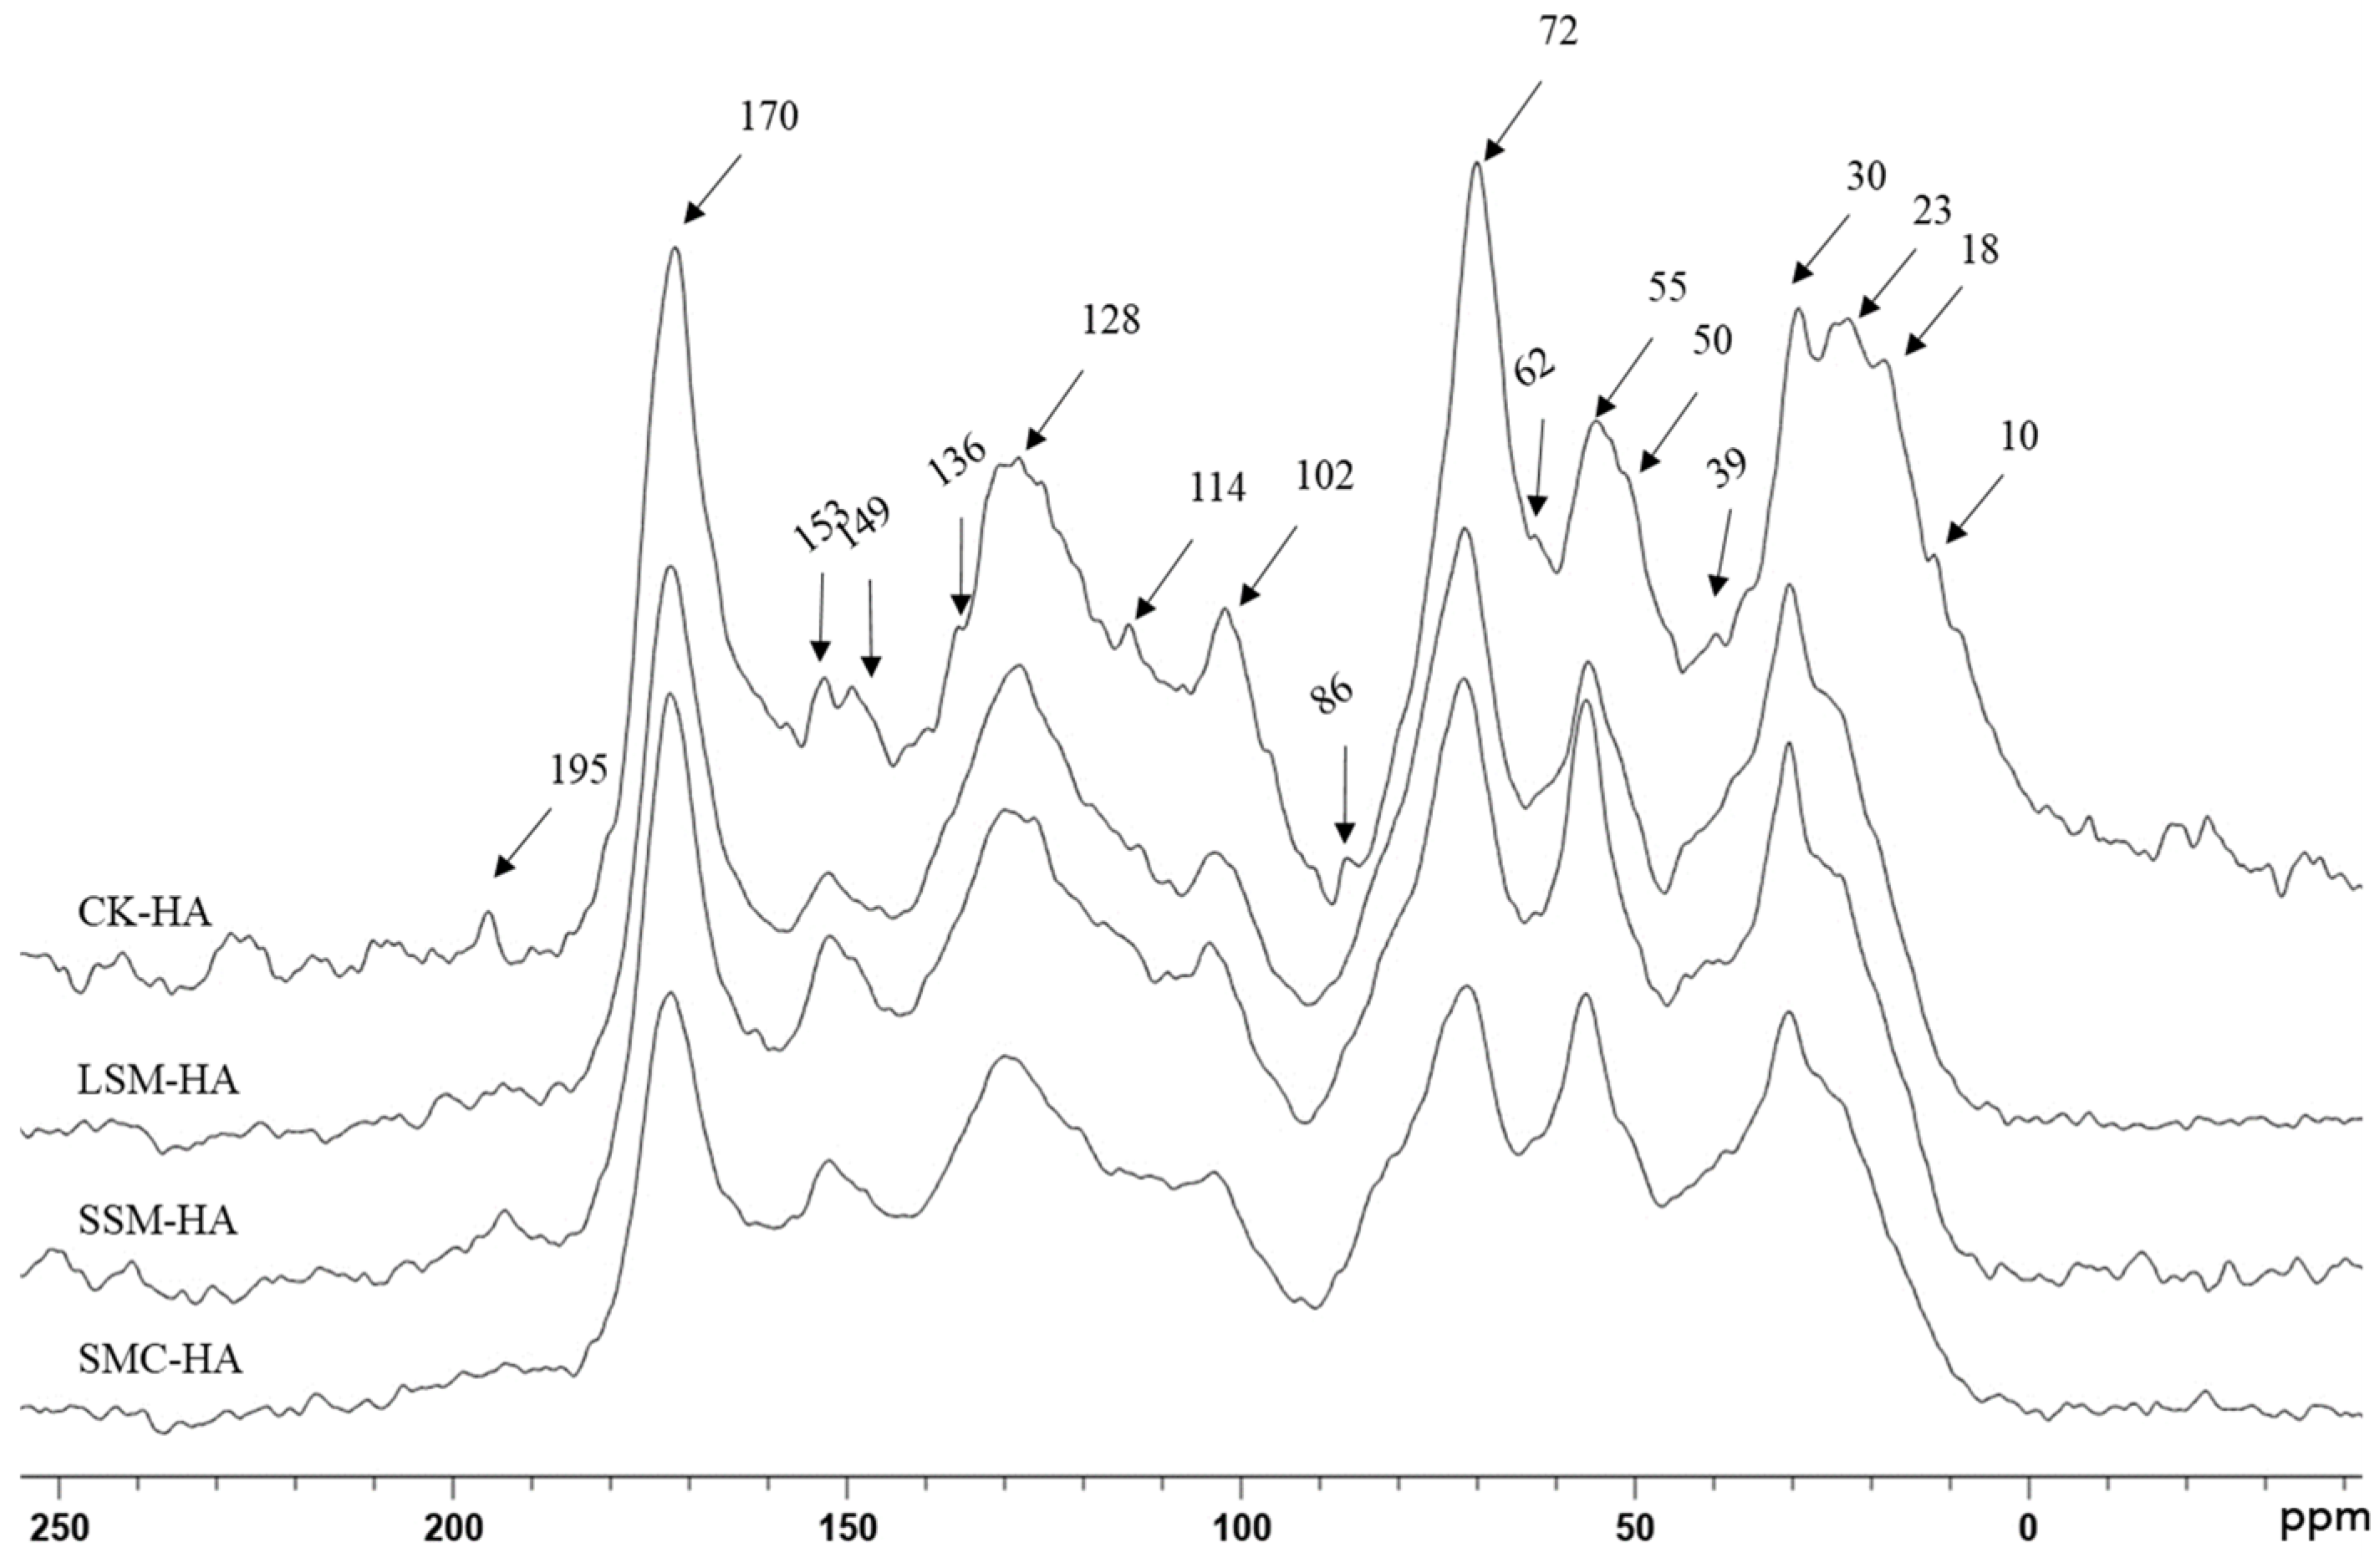
3.2. Solid-State 13C NMR of HA

Figure 1 shows the CPMAS spectra of the HAs. Major peaks were observed at 30 and 55 ppm (methoxy C), 72 ppm (saccharide, aldehydes, ethers), 102 and 128 ppm (C substituted aromatic C), 153 ppm (O-substituted aromatic C or phenolic), and 170 ppm (carboxyl C). Major differences were also observed between the spectra. The peak at 39 ppm has been assigned to quaternary C and cyclic CH2-C components [31,32] and was more evident in the CK-HA and SSM-HA spectra. The peak at 149 ppm was only present in the CK-, SSM-, and SMC-HAs and varied in prominence. This peak has been assigned to the guaiacyl structural unit of lignin [7,31]. The peaks at 10, 18, 25, 50, 86, and 114 ppm were only present in the CK-HA. The peaks at 10 and 25 ppm have been assigned to CH3 components [33,34], while the peak at 18 ppm represents terminal methyl groups [34]. The remaining peaks at 50, 86, and 114 ppm correspond to peak assignments for guaiacyl (G) units in lignin [35]. The set of peaks between 145 and 156 ppm were more pronounced in the CK-HA sample. The peak at 149 ppm (guaiacyl structural unit of lignin) reduced in intensity in the SSM- and SMC-HA relative to the peak at 153 ppm (syringyl structural unit) and was absent in the LSM-HA.
The DPMAS integral areas and the proportion of different carbon moieties in the HA extracts are presented in Table 3. The DPMAS spectra are included as Supplementary Material (Figure S1). There was a slight decrease in the proportion of aromatic C (108–120 ppm) in the HAs from soils treated with manure (LSM-HA, SSM-HA, and SMC-HA) compared to the control (CK-HA). The aromaticity ranged from 0.45 to 0.47 and is within the range typically reported for terrestrial HAs [36]. The variation in aromaticity was consistent with the variation in H/C for the samples. The aliphatic C content (0-50 ppm) varied between 20% and 21%, slightly increasing in the HAs from manure-treated plots compared to the control. The ratio of alkyl C (0–50 ppm) to O-alkyl C (AOR), commonly used to indicate the extent of humification, varied between 1.14 and 1.21. The AOR was highest for the LSM-HA (Table 3), followed by the SMC-HA. The AOR was lowest for the CK- and SSM-HAs.
The proportion of the carboxylic functional group varied between 15.7% and 17.5% (Table 3) and was higher in the LSM- and SMC-HAs than in the CK- and SSM-HAs. The proportion of the phenolic functional group varied between 8.3% and 9.9%. The SMC-HA was high in both carboxylic and phenolic functional groups. The LSM-HA was high in carboxylic but low in phenolic functional groups. The CK-HA was low in both carboxylic and phenolic functional groups, while the SSM-HA was high in phenolic and low in carboxylic functional groups. The concentration of carboxylic groups in the HA varies between 608.7 and 724.8 (cmol/kg) and in the following order: LSM-HA > SMC-HA > SSM-HA|CK-HA. The carboxylic functionality was higher in the LSM-HA and SMC-HA (p < 0.05), but there was no significant difference in the concentration of carboxylic acid between the CK-HA and SSM-HA.
There was a difference in the relative amount of non-protonated aromatic carbon in the HAs when the normalized spectra acquired by CPMAS was compared to the DPMAS (Table 4). The normalized CPMAS integral showed about 7% enhancement in the integrated area of the aromatic region (120–140 ppm) for the LSM- and SMC-HAs with direct polarization through the carbon nuclei (Table 4). The aromatic region enhancement was lower for the CK-HA (5.5%) and SSM-HA (5.25%).

4. Discussion

4.1. Formation and Composition of HA

This study used elemental analysis and solid-state 13C NMR to identify molecular structures in HA extracts from soils treated with different forms of swine manure in contrast to soils incorporated only with crop residues over a long term. The different forms of manures altered the molecular structure of the SOM, as measured by differences in the HA extracts, in ways that can influence the role of SOM in the regulation of plant nutrient use efficiency.
Although the LSM treatment had the lowest organic carbon and dry matter content, there was a higher conversion of LSM into HA and more C was incorporated into the LSM-HA structure (Table 2). The low quantity of HA extracted from the CK and the SSM- and SMC-treated plots relative to the LSM might be due to the slow rate of decomposition of plant litter and compost compared to the liquid form of the LSM. Plant residue, the only carbon input in the control plot and a substantial component of the SSM amendment, is rich in lignin and its decomposition is slow in the absence of an external supply of N [37]. This slow decomposition leads to a low degree of humification (transformation of organic residue into humic substances). Slow decomposition has been observed in environments with high deposition of plant litter, like forest floors [28] and in soils incorporated with composts [38].
The high amount of HA extracted from the LSM-treated plots might further indicate a higher substrate use efficiency (SUE) in the microbial transformation of the LSM amendment into HA. Crop residues and solid or composted forms of manure require microbes to synthesize enzymes to depolymerize the component biomolecules of the amendments before assimilating the substrate [39], whereas the liquid form of LSM allows for direct assimilation of the substrates by microbes. As a result, a higher proportion of the nutrients contained in the liquid form is assimilated and used for growth [39]. This is consistent with the observation of Kallenbach et al. (2016), who reported high accumulation of SOM in soils amended with only soluble substrates comprising glucose, cellobiose, syringol (a lignin monomer), or plant-derived DOC [40]. Some researchers have also reported an SUE as high as 75% for simple metabolic compounds such as glucose [41] compared to a low SUE of ~20% reported for complex structural compounds such as lignin [42].
It is generally accepted that the transformation of precursor materials into SOM, a process often referred to as humification, results in the formation of key functional groups, including carboxylic acids (COOHs) and phenols (OHs), that play an important role in the interaction between plant nutrients and SOM and in the stabilization of SOM through organo-mineral complexes. The high O/C values of both CK- and SSM-HAs reflect a lower degree of humification [7], implying that these two HAs were less transformed from their precursor materials compared to the LSM- and SMC-HAs. The high O/C values of both samples further reflect a type of HA that contains highly polar chemical structures and a substantial number of C-O moieties [30].
The combination of high H/C and high O/C ratios in the SSM-HA can be interpreted as a high susceptibility of the SSM-HA toward aerobic biodegradation in the absence of physical protection by adsorption onto mineral surfaces of the soil [30]. This is because aliphatic polar structures contain substantial β-O-4 linkages that are easier to degrade than carbon–carbon bonds [43] and are, thus, usually the main target during the microbial decomposition of biomolecules [44,45]. Although the CK-HA also had a high O/C value, its low H/C implies that its chemical structures, though polar, are relatively more aromatic and likely more condensed, thus being relatively less susceptible to aerobic biodegradation compared to the structures present in the SSM-HA.
The low O/C values of LSM-HA and SMC-HA reflect a more humified type of HA than the CK-HA and SSM-HA and suggest that both HA extracts possess chemical structures that are less susceptible to aerobic biodegradation. This is likely because both are largely the product of the microbial transformation of the LSM and SMC amendments. The O/C and H/C molar ratios of both samples, which lie within the CCAM domain of the van Krevelen plot, are thought to be derived from microbial biomolecules altered by environmental processes [46,47]. This might also provide insight into the origin and dominant formation pathway of LSM-HA and SMC-HA.
The trend in AOR distribution (Table 3) corresponds with the trend of the O/C molar ratio, corroborating the initial suggestion that the CK-HA and SSM-HA were less humified compared to the LSM-HA and SMC-HA. In addition, the lower enhancement of the aromatic region of CK-HA and SSM-HA (Table 4) also strongly indicates that both samples were less humified and contained higher amount of non-protonated aromatic carbon. This is consistent with the AOR, O/C, and elemental O content of both samples, and agrees with the interpretation that both CK-HA and SSM-HA were less humified compared to the LSM-HA and CK-HA.

4.2. Solid-State 13C NMR of HA

The signals present only in the CPMAS spectra of the CK-HA (10, 18, 25, 50, 86, and 114 ppm), along with the additional signals (149 ppm) observed in the CK- and SSM-Has, reflect the incorporation of a substantial number of lignin fragments into the CK-HA and SSM-HA structures. This further supports the suggestion from the H/C and O/C molar ratios that lignin-like structures are the most important biomolecules contributing to the CK-HA and SSM-HA structures.
The relative intensity of the O-substituted carbon peaks characteristic of the lignin structural units, syringyl (153 ppm) and guaiacyl (147 ppm) (Figure 2), highlights the relative contribution of both lignin structural units to the HA structures.
For the CK-HA, the relative peak intensities might reflect equal contribution from both guaiacyl (G) and syringyl (S) structural units to the HA structure. For the SSM- and SMC-HA, the enhancement of the synringyl peak relative to the guaicyl might suggest a higher contribution of syringyl structural units to the HA structures. However, considering that, in lignin, the G and S structural units are variably linked and because the peaks at 153 ppm and 149 ppm are also assigned to non-etherified G and S units [7], the relative intensities of both peaks could also reflect an abundance of depolymerized lignin structural units in the SSM-HA and SMC-HA compared to the CK-HA. This is because depolymerized S units will increase magnetization transfer from the proton nuclei to the carbon nuclei and enhance the intensity of the S peak (153 ppm) relative to the G peak (147 ppm). This suggestion agrees with the set of peaks at 10, 18, 25, 50, 86, and 114 ppm, which are all assigned to guaiacyl units and were only observed in CK-HA, and because the guaiacyl structural units can form a more condensed structure than syringyl units [48,49], a HA sample with a higher concentration of G units will tend to have a more condensed structure. This also corresponds with the van Krevelen interpretation of the H/C molar ratio of the CK-HA, which suggests that the CK-HA structure might contain, relatively, more condensed aromatic units. It is interesting that the enhancement of the S peak was also observed in the SMC-HA.
The origin of the S unit in SMC-HA was likely the lignin units from the precursor plant material from which the compost was made. And, those lignin units were conserved during humification and incorporated in the SMC-HA. However, it seems unlikely that it was the same S unit peak that was present in the LSM-HA spectra. This is because the LSM amendment does not explicitly contain lignin, although the contribution of lignin can never be ruled out in a terrestrial environment. Also, for the LSM-HA, the peak at 146 ppm assigned to the G units of lignin did not appear in the NMR spectra. Moreover, the peak at 153 ppm assigned to S unit of lignin has also been observed in microbial biomolecules [50]. Since this peak is the only prominent peak in the 140–156 ppm aromatic carbon range of the LSM-HA spectra, and since the LSM amendment does not contain lignin, this peak likely represents aromatic carbon structures of microbial origin and might imply that the aromatic carbon structures in the LSM were primarily derived from microbial sources.
It is well known that the addition of manure increases microbial activities in the soil. Hence, the slightly higher aliphatic C in the hAs from the manure-treated plots can be partly attributed to the expected higher activities of microbes in these plots due to the nutrients supplied by manure. Alkyl C structures are the major constituents of the cellular lipids that make up the framework of cell membranes, and the alkyl content of SOM will increase with increased microbial synthesis of biomass. Because the control plot received no nutrient enrichment from manure, the supply of substrate for microbial assimilation and biomass production is expected to decrease compared to that in the manure-treated plots. However, this decrease was only slight, and the SSM-HA had relatively higher aliphatic C structures compared to the other HA samples. This might provide insight into other possible sources of aliphatic structures in the HA extracts. Higuchi (2004) showed that new aliphatic molecules can be generated through ring hydroxylation and opening by enzymatic hydroxyl radicals, leading to the production of unsaturated aliphatic carboxylic acids [51]. This implies that the aliphatic structures in the hAs were also derived from the lignin precursor materials, and it corroborates the findings from the H/C and O/C molar ratios, which placed the CK-HA and SSM-HA within the domain of lignin-like structures, as well as the unique set of peaks present in the CK-HA and SSM-HA assigned to lignin structural units.

4.3. Concentration of Carboxylic Functional Group in hAs

The ionization of the carboxylic acid groups in HA contributes the bulk of the SOM-derived cation exchange capacity. By increasing the HA fraction of the SOM and, thus, the proportion of the carboxylic acid groups, the functionality of HA related to the nutrient retention capacity of the soil can be increased and the soil’s productivity enhanced. The DPMAS integral areas show that the proportion of carboxylic acidity increased with humification. The extent of this increase and its impact on the exchange capacity contributed by different organic amendment practices is clearer when the DPMAS integral area for COOH is considered in terms of the total C incorporated in the HA (Table 5). Based on this analysis, the LSM amendment has a higher potential to regulate nutrient availability and enhance plant utilization of nutrients compared to the other amendments, and, in the long run, is likely more sustainable for enhancing soil productivity.
Overall, this study shows how different forms of swine manure applied to soil over a long term influence the formation of SOM through an analysis of differences in the molecular structure and functionality of HA extracts. In general, the incorporation of crop residues facilitates the incorporation of condensed aromatic lignin fragments into the HA structure, while the application of SSM amendments promotes the formation of aliphatic polar structures that are highly susceptible to aerobic biodegradation in the absence of protection by strong bonding of the HA to soil minerals. The application of LSM and SMC promotes the formation of carboxyl-rich aliphatic molecules that are relatively more stable. Considering the role of HA in regulating plant nutrient availability, the LSM-HA has a higher potential to enhance plant utilization of nutrients compared to the other organic amendments.

Supplementary Materials

The following supporting information can be downloaded at https://www.mdpi.com/article/10.3390/soilsystems7030076/s1, Figure S1: Solid-state 13C DPMAS NMR spectra of HAs from soils amended with LSM, SSM, SMC, and control (CK).

Author Contributions

Conceptualization, Y.A., T.Z., I.M. and J.L.; methodology, I.M. and J.L.; validation, Y.A. and J.L.; formal analysis, I.M.; investigation, I.M.; resources, T.Z. and Y.W.; data curation, I.M. and J.L.; writing—original draft preparation, I.M.; writing—review and editing, J.L., Y.A. and B.K.; supervision, J.L.; project administration, J.L.; funding acquisition, Y.A. All authors have read and agreed to the published version of the manuscript.

Funding

This research was funded by the Grain Farmers of Ontario; the Ontario Ministry of Agriculture, Food, and Rural Affairs (OMAFRA); and the Natural Sciences and Engineering Council of Canada (NSERC).

Institutional Review Board Statement

Not applicable.

Informed Consent Statement

Not applicable.

Data Availability Statement

Data are available upon request to the corresponding author.

Conflicts of Interest

The authors declare no conflict of interest. The funders had no role in the design of this study; in the collection, analyses, or interpretation of data; in the writing of the manuscript; or in the decision to publish the results.

References

  1. Soman, C.; Li, D.; Wander, M.M.; Kent, A.D. Long-term fertilizer and crop-rotation treatments differentially affect soil bacterial community structure. Plant Soil 2017, 413, 145–159. [Google Scholar] [CrossRef]
  2. Audette, Y.; Congreves, K.A.; Schneider, K.; Zaro, G.C.; Nunes, A.L.P.; Zhang, H.; Voroney, R.P. The effect of agroecosystem management on the distribution of C functional groups in soil organic matter: A review. Biol. Fertil. Soils 2022, 57, 881–894. [Google Scholar] [CrossRef] [PubMed]
  3. Gerke, J. Carbon Accumulation in Arable Soils: Mechanisms and the Effect of Cultivation Practices and Organic Fertilizers. Agronomy 2021, 11, 1079. [Google Scholar] [CrossRef]
  4. Essington, M.E. Soil and Water Chemistry: An Integrative Approach, 2nd ed.; CRC Press: Boca Raton, FL, USA, 2015. [Google Scholar]
  5. Scotti, R.; Bonanomi, G.; Scelza, R.; Zoina, A.; Rao, M. Organic amendments as sustainable tool to recovery fertility in intensive agricultural systems. J. Soil Sci. Plant Nutr. 2015, 15, 333–352. [Google Scholar] [CrossRef]
  6. Mitchell, P.J.; Simpson, A.J.; Soong, R.; Schurman, J.S.; Thomas, S.C.; Simpson, M.J. Biochar amendment and phosphorus fertilization altered forest soil microbial community and native soil organic matter molecular composition. Biogeochemistry 2016, 130, 227–245. [Google Scholar] [CrossRef]
  7. DiDonato, N.; Chen, H.; Waggoner, D.; Hatcher, P.G. Potential origin and formation for molecular components of humic acids in soils. Geochim. Cosmochim. Acta 2016, 178, 210–222. [Google Scholar] [CrossRef]
  8. Guppy, C.N.; Menzies, N.W.; Moody, P.W.; Blamey, F.P.C. Competitive sorption reactions between phosphorus and organic matter in soil: A review. Soil Res. 2004, 43, 189–202. [Google Scholar] [CrossRef]
  9. Kalbitz, K.; Schmerwitz, J.; Schwesig, D.; Matzner, E. Biodegradation of soil-derived dissolved organic matter as related to its properties. Geoderma 2003, 113, 273–291. [Google Scholar] [CrossRef]
  10. Swift, R.S. Macromolecular properties of soil humic substances: Fact, fiction, and opinion. Soil Sci. 1999, 164, 790–802. [Google Scholar] [CrossRef]
  11. Piccolo, A. The Supramolecular Structure of Humic Substances. Soil Sci. 2001, 166, 810–832. [Google Scholar] [CrossRef]
  12. Saurette, D.; Warren, J.; Heck, R. Soils of Ontario. In Digging into Canadian Soils: An Introduction to Soil Science; Krzic, M., Walley, F.L., Diochon, A., Paré, M.C., Farrell, R.E., Eds.; CSSS: Pinawa, MB, Canada, 2021. [Google Scholar]
  13. Leytem, A.B.; Mikkelsen, R.L. The nature of phosphorus in calcareous soils. Better Crop. 2005, 89, 11–13. [Google Scholar]
  14. von Wandruszka, R. Phosphorus retention in calcareous soils and the effect of organic matter on its mobility. Geochem. Trans. 2006, 7, 6. [Google Scholar] [CrossRef] [PubMed]
  15. Zanin, L.; Tomasi, N.; Cesco, S.; Varanini, Z.; Pinton, R. Humic Substances Contribute to Plant Iron Nutrition Acting as Chelators and Biostimulants. Front. Plant Sci. 2019, 10, 675. [Google Scholar] [CrossRef] [PubMed]
  16. Hao, X.J.; Zhang, T.Q.; Tan, C.S.; Welacky, T.; Wang, Y.T.; Lawrence, D.; Hong, J.P. Crop yield and phosphorus uptake as affected by phosphorus-based swine manure application under long-term corn-soybean rotation. Nutr. Cycl. Agroecosystems 2015, 103, 217–228. [Google Scholar] [CrossRef]
  17. Lavallee, J.M.; Soong, J.L.; Cotrufo, M.F. Conceptualizing soil organic matter into particulate and mineral-associated forms to address global change in the 21st century. Glob. Chang. Biol. 2020, 26, 261–273. [Google Scholar] [CrossRef]
  18. Rodrigues, L.A.T.; Dieckow, J.; Giacomini, S.; Ottonelli, A.S.; Zorzo, G.P.P.; Bayer, C. Carbon sequestration capacity in no-till soil decreases in the long-term due to saturation of fine silt plus clay-size fraction. Geoderma 2022, 412, 115711. [Google Scholar] [CrossRef]
  19. Maillard, É.; Angers, D.A.; Chantigny, M.; Bittman, S.; Rochette, P.; Lévesque, G.; Hunt, D.; Parent, L.-É. Carbon accumulates in organo-mineral complexes after long-term liquid dairy manure application. Agric. Ecosyst. Environ. 2015, 202, 108–119. [Google Scholar] [CrossRef]
  20. Olk, D.C.; Bloom, P.R.; De Nobili, M.; Chen, Y.; McKnight, D.M.; Wells, M.J.M.; Weber, J. Using Humic Fractions to Understand Natural Organic Matter Processes in Soil and Water: Selected Studies and Applications. J. Environ. Qual. 2019, 48, 1633–1643. [Google Scholar] [CrossRef]
  21. Kleber, M.; Lehmann, J. Humic Substances Extracted by Alkali Are Invalid Proxies for the Dynamics and Functions of Organic Matter in Terrestrial and Aquatic Ecosystems. J. Environ. Qual. 2019, 48, 207–216. [Google Scholar] [CrossRef]
  22. Savarese, C.; Drosos, M.; Spaccini, R.; Cozzolino, V.; Piccolo, A. Molecular characterization of soil organic matter and its extractable humic fraction from long-term field experiments under different cropping systems. Geoderma 2021, 383, 114700. [Google Scholar] [CrossRef]
  23. Zou, J.; Zhang, H.; Yue, D.; Huang, J. Is the traditional alkali extraction method valid in isolating chemically distinct humic acid? Chem. Eng. J. Adv. 2021, 6, 100077. [Google Scholar] [CrossRef]
  24. Jiménez-González, M.A.; Almendros, G.; Waggoner, D.C.; Álvarez, A.M.; Hatcher, P.G. Assessment of the molecular composition of humic acid as an indicator of soil carbon levels by ultra-high-resolution mass spectrometric analysis. Org. Geochem. 2020, 143, 104012. [Google Scholar] [CrossRef]
  25. Jakab, G.; Vancsik, A.; Filep, T.; Madarász, B.; Zacháry, D.; Ringer, M.; Ujházy, N.; Szalai, Z. Soil organic matter characterisation using alkali and water extraction, and its relation to soil properties. Geoderma Reg. 2022, 28, e00469. [Google Scholar] [CrossRef]
  26. Audette, Y.; Longstaffe, J.G.; Gillespie, A.W.; Smith, D.S.; Voroney, R.P. Validation and comparisons of NaOH and Na 4 P 2 O 7 extraction methods for the characterization of organic amendments. Soil Sci. Soc. Am. J. 2021, 85, 273–285. [Google Scholar] [CrossRef]
  27. Kim, S.; Kramer, R.W.; Hatcher, P.G. Graphical Method for Analysis of Ultrahigh-Resolution Broadband Mass Spectra of Natural Organic Matter, the Van Krevelen Diagram. Anal. Chem. 2003, 75, 5336–5344. [Google Scholar] [CrossRef]
  28. Ussiri, D.A.; Johnson, C.E. Characterization of organic matter in a northern hardwood forest soil by 13C NMR spectroscopy and chemical methods. Geoderma 2003, 111, 123–149. [Google Scholar] [CrossRef]
  29. SAS Institute Inc. SAS/STAT® User’s Guide; SAS Institute Inc.: Cary, NC, USA, 2021. [Google Scholar]
  30. Sposito, G. The Chemistry of Soils, 2nd ed.; Oxford University Press: New York, NY, USA, 2016. [Google Scholar]
  31. Dodla, S.K.; Wang, J.J.; Cook, R.L. Molecular Composition of Humic Acids from Coastal Wetland Soils along a Salinity Gradient. Soil Sci. Soc. Am. J. 2012, 76, 1592–1605. [Google Scholar] [CrossRef]
  32. Wong, S.; Hanna, J.V.; King, S.; Carroll, T.J.; Eldridge, R.J.; Dixon, D.R.; Bolto, B.A.; Hesse, S.; Abbt-Braun, G.; Frimmel, F.H. Fractionation of Natural Organic Matter in Drinking Water and Characterization by 13C Cross-Polarization Magic-Angle Spinning NMR Spectroscopy and Size Exclusion Chromatography. Environ. Sci. Technol. 2002, 36, 3497–3503. [Google Scholar] [CrossRef]
  33. Mao, J.-D.; Tremblay, L.; Gagné, J.-P.; Kohl, S.; Rice, J.; Schmidt-Rohr, K. Humic acids from particulate organic matter in the Saguenay Fjord and the St. Lawrence Estuary investigated by advanced solid-state NMR. Geochim. Cosmochim. Acta 2007, 71, 5483–5499. [Google Scholar] [CrossRef]
  34. SWIFT, R.S. Organic matter characterization. In Methods of Soil Analysis. Part 3. Chemical Methods; SSSA: Madison, WI, USA, 1996; Volume 5, pp. 1001–1069. [Google Scholar]
  35. Pu, Y.; Hallac, B.; Ragauskas, A.J. Plant Biomass Characterization: Application of Solution- and Solid-State NMR Spectroscopy. In Aqueous Pretreatment of Plant Biomass for Biological and Chemical Conversion to Fuels and Chemicals; John Wiley & Sons: Hoboken, NJ, USA, 2013; pp. 369–390. [Google Scholar] [CrossRef]
  36. Hatcher, P.G.; Rowan, R.; Mattingly, M.A. 1H and 13C NMR of marine humic acids. Org. Geochem. 1980, 2, 77–85. [Google Scholar] [CrossRef]
  37. Vitousek, P.M.; Hattenschwiler, S.; Olander, L.; Allison, S. Nitrogen and nature. AMBIO A J. Hum. Environ. 2002, 31, 97–101. [Google Scholar] [CrossRef] [PubMed]
  38. Bernal, M.; Sánchez-Monedero, M.; Paredes, C.; Roig, A. Carbon mineralization from organic wastes at different composting stages during their incubation with soil. Agric. Ecosyst. Environ. 1998, 69, 175–189. [Google Scholar] [CrossRef]
  39. Cotrufo, M.F.; Wallenstein, M.D.; Boot, C.M.; Denef, K.; Paul, E. The Microbial Efficiency-Matrix Stabilization (MEMS) framework integrates plant litter decomposition with soil organic matter stabilization: Do labile plant inputs form stable soil organic matter? Glob. Chang. Biol. 2013, 19, 988–995. [Google Scholar] [CrossRef] [PubMed]
  40. Kallenbach, C.M.; Frey, S.D.; Grandy, A.S. Direct evidence for microbial-derived soil organic matter formation and its ecophysiological controls. Nat. Commun. 2016, 7, 13630. [Google Scholar] [CrossRef]
  41. Dijkstra, P.; Thomas, S.C.; Heinrich, P.L.; Koch, G.W.; Schwartz, E.; Hungate, B.A. Effect of temperature on metabolic activity of intact microbial communities: Evidence for altered metabolic pathway activity but not for increased maintenance respiration and reduced carbon use efficiency. Soil Biol. Biochem. 2011, 43, 2023–2031. [Google Scholar] [CrossRef]
  42. Bahri, H.; Rasse, D.P.; Rumpel, C.; Dignac, M.-F.; Bardoux, G.; Mariotti, A. Lignin degradation during a laboratory incubation followed by 13C isotope analysis. Soil Biol. Biochem. 2008, 40, 1916–1922. [Google Scholar] [CrossRef]
  43. Lisý, A.; Ház, A.; Nadányi, R.; Jablonský, M.; Šurina, I. About Hydrophobicity of Lignin: A Review of Selected Chemical Methods for Lignin Valorisation in Biopolymer Production. Energies 2022, 15, 6213. [Google Scholar] [CrossRef]
  44. Xu, Z.; Peng, B.; Kitata, R.B.; Nicora, C.D.; Weitz, K.K.; Pu, Y.; Shi, T.; Cort, J.R.; Ragauskas, A.J.; Yang, B. Understanding of bacterial lignin extracellular degradation mechanisms by Pseudomonas putida KT2440 via secretomic analysis. Biotechnol. Biofuels Bioprod. 2022, 15, 117. [Google Scholar] [CrossRef]
  45. Zhao, C.; Xie, S.; Pu, Y.; Zhang, R.; Huang, F.; Ragauskas, A.J.; Yuan, J.S. Synergistic enzymatic and microbial lignin conversion. Green Chem. 2016, 18, 1306–1312. [Google Scholar] [CrossRef]
  46. Lam, B.; Baer, A.; Alaee, M.; Lefebvre, B.; Moser, A.; Williams, A.; Simpson, A.J. Major Structural Components in Freshwater Dissolved Organic Matter. Environ. Sci. Technol. 2007, 41, 8240–8247. [Google Scholar] [CrossRef]
  47. Woods, G.C.; Simpson, M.J.; Simpson, A.J. Oxidized sterols as a significant component of dissolved organic matter: Evidence from 2D HPLC in combination with 2D and 3D NMR spectroscopy. Water Res. 2012, 46, 3398–3408. [Google Scholar] [CrossRef] [PubMed]
  48. Christiernin, M. Lignin composition in cambial tissues of poplar. Plant Physiol. Biochem. 2006, 44, 700–706. [Google Scholar] [CrossRef] [PubMed]
  49. Wikberg, H.; Liisamaunu, S. Characterisation of thermally modified hard- and softwoods by 13C CPMAS NMR. Carbohydr. Polym. 2004, 58, 461–466. [Google Scholar] [CrossRef]
  50. Wang, Y.; Griffin, P.; Jin, K.; Fogel, M.L.; Steele, A.; Cody, G.D. Tracing H isotope effects in the dynamic metabolic network using multi-nuclear (1H, 2H and 13C) solid state NMR and GC–MS. Org. Geochem. 2013, 57, 84–94. [Google Scholar] [CrossRef]
  51. Higuchi, T. Microbial degradation of lignin: Role of lignin peroxidase, manganese peroxidase, and laccase. Proc. Jpn. Acad. B Phys. Biol. Sci. 2004, 80, 204–214. [Google Scholar] [CrossRef]
Figure 1. Solid-state 13C CPMAS NMR spectra of HAs extracted from the experimental soils. CK-HA = humic acid extract from control plot; LSM-HA = humic acid extract from plots amended with liquid swine manure; SSM-HA = humic acid extract from plots amended with solid swine manure; SMC = humic acid extract from plots amended with swine manure compost.
Soilsystems 07 00076 g001
Figure 2. Chemical structure of guaiacyl and syringyl lignin monomers.
Soilsystems 07 00076 g002
Table 1. Average chemical properties of the soils in this study.
Treatment PlotspHP (mg kg−1)K (mg kg−1)Mg (mg kg−1)Ca (mg kg−1)Base Saturation (K%)Base Saturation (Mg%)Base Saturation (Ca%)SOM (%)Amendment
CK6.36.3129.3405.72646.71.918.672.92.6No Manure (control)
LSM6.540.0236.3309.72056.74.217.470.03.2Liquid Swine Manure
SSM7.365.3306.0389.72803.34.116.872.74.4Solid Swine Manure
SMC7.151.3257.0433.33226.73.116.774.74.4Swine Manure Compost
CK = control; LSM = liquid swine manure; SSM = solid swine manure; SMC = swine manure compost.
Table 2. Mean elemental content; O/C, H/C and C/N molar ratios; and amount of humic acid extracted from soils in this study.
SampleCarbon
(%)
Hydrogen
(%)
Nitrogen
(%)
Sulfur
(%)
Oxygen
(%)
O/CH/CC/NHA Extracted (% SOM)
CK-HA44.01 c3.82 d3.50 c0.52 c32.82 b0.561.0414.701.10c
LSM-HA49.73 a4.65 a4.61 a0.73 b31.21 c0.471.1212.6132.02a
SSM-HA45.55 b4.49 b4.41 b0.81 a36.00 a0.591.1812.060.91c
SMC-HA46.59 b4.34 c4.39 b0.80 a19.16 d0.311.1212.3910.04b
Notes: Percentages are expressed on an ash-free basis. Means with same letter are not significantly different according to t-test (ά = 0.05). CK-HA = humic acid extract from control plot; LSM-HA = humic acid extract from plots amended with liquid swine manure; SSM-HA = humic acid extract from plots amended with solid swine manure; SMC = humic acid extract from plots amended with swine manure compost.
Table 3. DPMAS integral areas (% distribution of carbon signal) and aromaticity of humic acids from soils in this study.
Integral Areas
SampleAliphaticMethoxyO-AlkylAromaticPhenolicCarboxylKetonicAromaticityAOR
0–50 ppm50–60ppm60–108 ppm108–145 ppm145–162 ppm162–190 ppm190–200 ppm
CK-HA20.45.117.830.69.216.60.20.481.15
LSM-HA21.45.217.829.78.317.50.10.461.20
SSM-HA21.16.518.528.89.415.7<0.10.451.14
SMC-HA20.65.817.029.19.917.20.40.471.21
CK-HA = humic acid extract from control plot; LSM-HA = humic acid extract from plots amended with liquid swine manure; SSM-HA = humic acid extract from plots amended with solid swine manure; SMC = humic acid extract from plots amended with swine manure compost.
Table 4. CPMAS integral areas (% distribution of carbon signal) and percent of non-protonated carbon in CK, LSM, SSM, and SMC humic acids.
Integral Areas
SampleAliphatic (25–50 ppm)Aromatic (120–140 ppm)Aliphatic Region Normalization Factor *Normalized Area of CPMAS Aromatic RegionIncrease in Area of Aromatic Region from CPMAS
CK-HA11.7116.881.3322.415.53
LSM-HA12.8316.971.4123.956.98
SSM-HA12.517.041.3122.295.25
SMC-HA12.3316.771.423.446.67
* Ratio of aliphatic region peak areas integrated in CPMAS to those integrated in DPMAS (Table 3). CK-HA = humic acid extract from control plot; LSM-HA = humic acid extract from plots amended with liquid swine manure; SSM-HA = humic acid extract from plots amended with solid swine manure; SMC = humic acid extract from plots amended with swine manure compost.
Table 5. Concentration of carboxylic acid (cmol/kg) in the humic acids.
TreatmentsCarboxylic Acidity (cmol/kg)
CK-HA608.7 c
LSM-HA724.8 a
SSM-HA609.7 c
SMC-HA653.6 b
Note: Means with same letter are not significantly different according to t-test (ά = 0.05). CK-HA = humic acid extract from control plot; LSM-HA = humic acid extract from plots amended with liquid swine manure; SSM-HA = humic acid extract from plots amended with solid swine manure; SMC = humic acid extract from plots amended with swine manure compost.
Disclaimer/Publisher’s Note: The statements, opinions and data contained in all publications are solely those of the individual author(s) and contributor(s) and not of MDPI and/or the editor(s). MDPI and/or the editor(s) disclaim responsibility for any injury to people or property resulting from any ideas, methods, instructions or products referred to in the content.

