Abstract
This work describes the microbial community structure of the continuously revegetated chronosequence of a former sand quarry, which demonstrates a unique example of nearly complete soil restoration in less than 100 years. Samples were collected at five time points (0, 3, 30, 70 years and mature soil) from the entire set of soil horizons, revealing the history of pedogenesis. Real-time PCR was applied to quantitatively describe the bacterial and archaeal communities. High-throughput sequencing of the bacterial and archaeal V4 variable region of the 16S rRNA gene was used to identify abundant microbial taxa. A beta-diversity analysis revealed that the prokaryotic community structure responded strongly to the processes of organic matter accumulation and the corresponding evolution of the soil into discrete horizons. Changes in soil microbiota in the course of soil profile evolution revealed three groups of prokaryotes, which tended to accumulate in the specific soil horizons and might be associated with the certain soil-forming processes, including plant roots growth. This research showed the heuristic potential of soil horizon profiling in microbiological studies as opposed to the formal depth-dependent separation of the soil layers. The results allowed us to trace the relationship between the structure of the soil prokaryotic community and the peculiarities of the evolution of the podzolic soil profile as well as to identify the microbial indicators and drivers of primary pedogenesis.
Keywords:
chronosequence; high-throughput sequencing; microbiome; soil; soil horizons; 16S rRNA gene 1. Introduction
Soil evolution is defined as the process of soil development from the initial stage—known as the “zero stage” of soil formation [1]—through the separation of well-defined horizons of zonal soil types (the so-called “embryonic” soil profile) to the formation of the mature soil—the final stage in the ecological succession [2,3]. Thus, the soil profile—the unique packet of recognizable soil horizons—is the result of complex interactions between four soil-forming factors (biota, climate, parent material and relief) over time. The combination of five soil-forming factors (time, climate, topography, parent material, living organisms) is unique to the particular ecosystem, so the rate and specific characteristics of soil development will depend on the vegetation, parent material, and climate [4,5,6,7]. Although the soil microbiome is an essential link between all these factors, its relevance in soil development is still poorly understood. There are many examples of research where the biodiversity (mainly fungi, bacteria and protozoa and to a lesser extent archaea) was studied in different soil types as well as in various soil horizons [8,9,10,11]. Many of them lack the complete description of the soil profile, dividing the soil layers according to the depth [12] and saying nothing of the dynamic changes of microbial diversity on the successive stages of soil development.
It is essential to study soil as a continuously evolving natural body that demonstrates vertical stratification features. Studies of the former soil iterations help us to match certain microorganisms with particular soil-forming processes and predict their potential impacts on soil fertility and function. However, it is often difficult to conduct such studies due to the paucity of suitable natural sites where different stages of soil succession over time can be observed.
Currently, we can only obtain glimpses of soil evolution from two types of studies. The first is devoted to the description of the microbial diversity in the soil horizons of mature soils [13,14,15,16,17,18,19,20,21]. These studies have demonstrated a measurable decrease in the number of bacteria from the upper to lower soil layers [13,14] and have recorded maintenance of the microbial counts with depth [20]. The archaea vs. bacteria ratio has been found to increase with depth, whereas fungal vs. bacterial abundance has the reverse tendency. Will et al. [14] provided an exhaustive description of the taxonomic diversity of bacteria inhabiting different soil horizons, finding Actinobacteria, Bacteroidetes, Cyanobacteria, Fibrobacteres, Firmicutes, Spirochaetes, Verrucomicrobia, Alphaproteobacteria, Betaproteobacteria, and Gammaproteobacteria among the dominant population in the A horizon, whereas Acidobacteria, Chloroflexi, Gemmatimonadetes, Nitrospira, TM7, and WS3 were dominant in the B horizon. The diversification in prokaryotic communities with depth has also been demonstrated with the use of RNA analysis [22].
The second type of soil evolution study describes microbial succession in disturbed soil environments, including former mining sites [23,24,25,26], areas of deglaciation [27,28,29], post-fire ecosystems [30,31], and volcanogenic soils [32]. The basic methodology of these studies has been to convert time into a spatial gradient, resulting in the ability to visualize continuous stages of soil evolution, which are known as chronosequences [27,33]. Soil chronosequences represent successive stages of soil formation, starting from the same parent material and evolving in a specific climatic zone [21].
Mining activity has an enormous impact on natural ecosystems [34,35]. An analysis of the studies on microbial successions from former mining sites revealed that many were devoted to complex and biologically unavailable substrates, such as uranium or oil deposits [36,37,38] and coal mining sites [23,39]. The majority of these studies used conventional microbiological approaches rather than metagenomics methods. Anthropogenic disturbance in this case leads to complete disturbance of the land cover, and soil formation starts from the so-called “zero stage” [1]. In the case of natural disturbances, for example, windthrow successions, the soil layer is not completely destroyed, and this model of chronoseries is much less informative than the first one.
Generally, in the initial stages of biological succession, soil is inhabited by pioneer prokaryotic communities that are involved in erosion of the rock parent material and the accumulation of organic substances [27,40]. Consequently, they form substrates suitable for plant growth [40]. Plants, in turn, promote the second stage of soil microbiome formation and the increase in the diversity of heterotrophic microorganisms [41,42]. Simultaneously, the functional diversity of the soil microorganisms increases in this stage, providing stability to the entire ecosystem [43].
Studies on primary soil successions have been described in numerous publications [40,41,44,45], whereas the long-term development of soil was less investigated and usually restricted to the upper soil layers [21,46]. Among the physicochemical properties of soil that influence microbial diversity, increased concentrations of iron and aluminum oxides have been noted with increasing age of the soil [47,48]. Prokaryotic communities undergo substantial changes in their structure during the initial stages of succession with the rate of change decreasing thereafter [21,46,47,49]. Some authors have reported a decrease in the number of bacteria as soil ages due to transformation of the organic matter from biologically available to inert forms [39]. This decrease in bacteria counts was accompanied by the active growth of fungal communities in the final stages of succession [21,26]. The number of archaea increased in mature soils, which can also be associated with the accumulation of specific substances and the partitioning of ecological niches [21]. The maintenance of such specific ecological niches seems to be particular to lower soil horizons where organic matter forms complexes with the mineral matrix of the soil [47,50,51].
During the initial stages of soil development, the microbial community is enriched with the bacterial taxa Acidobacteria, Bacteroidetes, Verrucomicrobia, Comamonadaceae, and Betaproteobacteria [27]. Terrimonas, Nocardioides, Solirubrobacter, and Microvirga dominate in mature soils [20]. The rate of succession decreases in the final stages of soil development [52]. The decrease in microbial biomass and increase in the number of oligotrophic groups of bacteria can largely be explained by modification of the organic matter and its transformation into inert forms [52,53,54].
The changes observed in microbial community compositions over time [27,28,45,54] are entirely dependent on changes occurring in the soil physicochemical properties, particularly pH, and the amount of organic carbon (C), phosphorus, and nitrogen (N) [45,46,55]. The diversity of archaea is affected by N and plant community composition [45]. After 30–40 years of succession, the values of the physicochemical parameters stabilize and are maintained until the final stage [39].
The main disadvantage of all the aforementioned studies is the lack of a comprehensive description of the soil evolutionary process, including separation of the early stages of soil genesis from the intermediate stages, and stages of soil maturation. The main obstacle to such studies is identifying sites with relatively high rates of soil evolution. In this respect, noteworthy sites are where pine forests have formed in the sand quarries located in the Leningrad region of Russia, which preserve soil chronosequences of 100 to 200 years. This paper aims to characterize the soil prokaryotic communities in the entire soil profile using metagenomics data from different stages of Podzol soil chronosequences that formed on the former spoil heaps of a sandy quarry. The objectives of this study were to (1) evaluate the main indices of soil development in the chronosequence, including the soil morphology and basic chemical and physical properties; (2) characterize the soil microbial community composition of differently aged sites using 16S rRNA high-throughput sequencing; (3) analyze the levels of microbial diversity in the different ages of soil and multiple soil horizons; and (4) identify the horizon- and stage-specific microorganisms that mark the steps of soil profile development.
2. Materials and Methods
2.1. Study Sites
The chronosequence of sandy soils in the Maluksa sand quarry (Kirovsky District, Leningrad Region, Russia) is one of the foremost examples of Podzol chronosequences in northwestern Russia (Figure 1). According to previous studies, this chronosequence includes soils ranging from the initial sod–sandy soils with no features of the podzolization process [3] to embryonic Podzols with evident features of Spodic profile differentiation [56]. Soil organic matter dynamics, as well as the composition of humic substances, have previously been analyzed for differently aged soils in the same area [3,56].
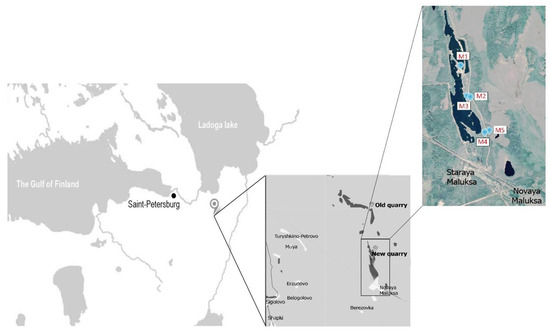
Figure 1.
Geographical location of the sample collection sites. Northwest of Russia, Leningrad region, Kirovskiy district. M1–M5—indicating the points of sampling.
The quarry is situated in the southern taiga zone, with an annual precipitation of ~600–700 mm and a mean annual temperature of ~3.5 °C. The quarry, ~10 km long and up to 2 km wide, is a former esker composed of glaciofluvial sands. Mining began in the quarry in 1930. Intensive mining activity was aimed at exploring the ridge (fluvioglacial esker) with an average height ranging from 7 to 10 m. The mining activity resulted in the formation of lakes and ponds, which now occupy up to 70% of the area. The soil parent material comprises homogeneous (in both chemical composition and particle size distribution) glaciofluvial sands. This parent material has promoted rapid pedogenesis, resulting in the formation of a well-developed and complete chronosequence. The vegetation of zonal mature plots are presented by Scotch pine (Pinus sylvestris) forest stands with shrub (Vaccinium myrtilus, Vaccinium vitis-iadae) and mosses soil cover. Plants of zero stage of succession are presented by sporadic reedgrass plants (Calamagrostis epigejos). At the three-year stage, sandy soils begin to be colonized by pine, alder (Alnus incana) and willow (Salix caprea), while the projective cover of vegetation is 20–30%. Then, the projective coverage increases, alder and willow are replaced by pine, sporadic birch trees (Betula pendula) appear, and a shrub layer is formed.
Sampling was performed in May 2018, at five morphologically dissimilar sites, representing sequential stages in the soil development: M1—the initial (zero) stage, lacking any evidence of vegetation; M2—sandy 3-year-old primary sod gray humus soil with developed humus layer and first features of initial parent material alteration; M3 and M4—30- and 70-year-old Embryopodzols, respectively; and, finally, M5—mature (benchmark) Podzol beneath mature pine forest. The Embryopodzols were deposited on the flat surfaces of the former spoil heaps that had been naturally revegetated by Scots pine (Pinus sylvestris L.) after the quarrying was ended. Samples were collected from the middle of each morphologically defined genetic horizon. Oi—forest litter with initial features of organic material transformation, Oe—forest litter with medium stage of organic matter transformation, Ay—horizon of humus accumulation, E—eluvial podzol horizon, BF—horizon of iron oxide eluviation, C—initial parent material.
The soil profile morphology (Figure 2) showed that podzolization started at the 15-year-old site with the formation of an illuviated iron horizon. In the Russian classification system, this soil can be characterized as an Entic Podzol due to the absence of well-separated eluvial horizons in the vertical profile. The 30-year-old site included a poorly developed E horizon (brackets and a lowercase letter usually mark this horizon). The more mature soils were characterized by a thickening of the profile, particularly in the E and B horizons, and differentiation of the upper soil horizon (O) into accumulation (Oi) and fermentation (Oe) portions. Podzol formation is one of the fastest processes of soil formation, especially on mineralogically poor sands of fluviglacial origin. The differentiation of soil profile by Al-Fe-humus type occurs rapidly, and preclimax soil can be formed in the first hundred years after the beginning of soil formation [3,4].
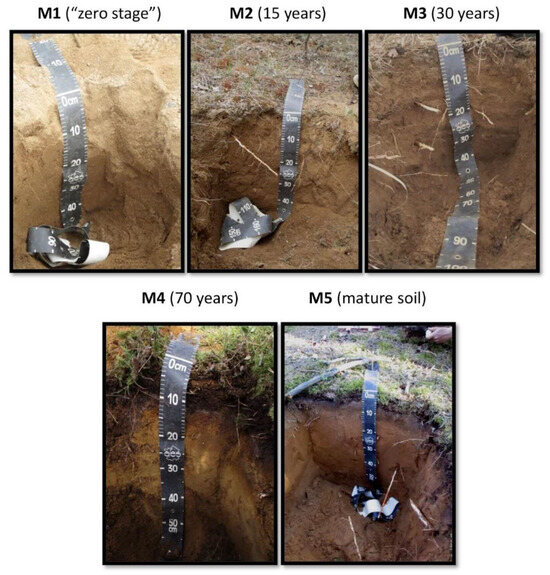
Figure 2.
Soils in various chronosequence stages: M1—zero stage; M2—15 years old; M3—30 years old; M4—70 years old; and M5—mature soil.
For the further analysis (physicochemical analysis and DNA extraction), the soil was sampled at each horizon of the five sites, according to the following scheme: M1—the initial (zero) stage, lacking any evidence of vegetation (samples of C1-C2-C3-C4); M2—sandy 3-year-old primitive sod gray humus soil (samples of Oi-Ay-BF-C); M3 (samples of Oi-E-BF-BC-C) and M4 (Oi-Oe-E-BHF-BF-C)—30- and 70-year-old Embryopodzols, respectively; and, finally, M5—mature (benchmark) (Oi-E-BF-C).
Each sample was taken in three randomly chosen locations. Subsamples were pooled to create composite samples. Composite samples were taken both for agro-chemical analyses (3 replicates, each containing 200 g of soil, which were immediately transported and analyzed in the laboratory) and soil description and DNA analysis (5 replicates per sample, which were transported to the laboratory in 10 mL sterile tubes and stored at −70 °C). The soils were classified as Podzol Spodosol, which was based on the 30-year-old stage (World Reference Base 2015).
2.2. Soil Analyses
Organic and mineral soil materials were ground and sieved through 2 mm meshes, and large root debris was removed manually. A CHN analyzer (model Euro EA3028-HT) was used to determine the C and N contents with the data being converted to the air-dried form. The pH values were determined using a routine method in water and calcium chloride suspensions. The particle size distribution and texture class were determined using a sedimentometric method with pyrophosphate peptization of the microaggregates [57]. The C from the microbial biomass (Cmic) was quantitatively determined according to the formula Cmic (g C/g soil) = (emitted CO2/g soil per hour) × 40.04 + 0.37. The microbial metabolic rate (the specific respiration of the microbial biomass, qCO2) was determined as the ratio of the basal respiration (BR) to the microbial biomass carbon index: qCO2 (mg CO2/Cmic mg/h) = BR/Cmic [58]. ANOVA analysis was performed to evaluate the significant differences among samples in the main physicochemical and microbiological parameters.
2.3. Soil DNA Extraction
Soils for DNA extraction were not ground before analysis. The samples were frozen in the field and then transported to the laboratory. DNA was extracted from 0.2 g of soil using a PowerSoil DNA Isolation Kit (Mobio Laboratories, Solana Beach, CA, USA), which included a bead-beating step, based on the manufacturer’s specifications. Homogenization of the samples was performed using a Precellys 24 (Bertin Corp, Rockville, MD, USA) at 6.5 m/s twice for 30 s. The purity and quantity of the DNA were tested by electrophoresis in 0.5× TAE buffer on 1% agarose. The quality of DNA extraction was assessed on the electrophoregram by the presence of a clear bright band (the length of the DNA fragments was approximately 20,000 bp compared to the lambda-HindIII marker DNA). The DNA concentrations were measured at 260 nm using a SPECTROStar Nano (BMG LABTECH, Ortenberg, Germany). The average DNA concentrations ranged between 30 and 50 ng/μL.
The relative abundances of bacterial and archaeal small subunit rRNA gene copies were analyzed by quantitative PCR (qPCR). The pairs of primers Eub338/Eub518 [59] and 915f/1059r [60] was used for bacteria and archaea correspondingly [61]. ANOVA analysis was performed to evaluate the significance of differences between qPCR samples.
2.4. Next-Generation Sequencing (NGS) of Amplicon Libraries of the 16S rRNA Gene
The purified DNA templates were amplified with the universal multiplex primers F515 5′-GTGCCAGCMGCCGCGGTAA-3′ and R806 5′-GGACTACVSGGGTATCTAAT-3′ [62], which targeted the variable region V4 of the bacterial and archaeal 16S rRNA genes. Each multiplex primer contained the adapter, 4 bp key (The Centre for Applied Genomics, TCAG), 10 bp barcode, and primer sequences. The expected length of the amplification product was 300 bp. The sequencing of the amplicon libraries was conducted using an Illumina MiSeq sequencer in the Genomic Technologies, Proteomics, and Cell Biology Department (All-Russia Research Institute for Agricultural Microbiology, ARRIAM).
2.5. Bioinformatics and Statistical Analysis
The raw sequences were processed using the QIIME_1.9.1 environment [63].The raw reads were preliminarily processed using TRIMMOMATIC software [64]. The multiplexed reads were first filtered for quality and then grouped according to barcode sequences to reduce sequencing errors. Sequences were omitted from the analysis if they were less than 200 bp, had a quality score of less than 25, contained uncorrectable barcodes, primers, ambiguous characters, or had a homopolymer length equal to or greater than 8 bp. All non-bacterial ribosomal sequences and chimeras were also removed from the libraries. The chimeras were removed using the chimera_slayer.py script, which was incorporated in QIIME. For analysis of the operational taxonomic unit (OTU) abundance fluctuations between samples, the decontam package [65] in the R environment (https://www.R-project.org/, the version R 4.1.2, accessed on 1 November 2021) was used.
In total, 1,023,728 sequences were obtained with an average of 33,023 sequences per library. The dataset was subjected to a rarefaction procedure, reducing the sample outcome to the minimal quantity of sequences in the dataset (16,365 sequences per sample) (Figure S1). OTU picking was performed using a close-reference picking algorithm based on 97% sequence similarity with the SILVA database, version 132, 2018 (https://www.arb-silva.de/download/archive/qiime, accessed on 28 November 2019). Aligned sequences were used to build a distance matrix with a distance threshold of 0.1 and the phylogenetic tree necessary for downstream analysis.
Alpha- and beta-diversity analyses were performed to compare prokaryotic communities. The alpha diversity was determined by calculating the indices for richness (observed species, ChaoI) and evenness (Faith’s index, Shannon evenness). Rarefaction analysis was applied to estimate the efficiency of the conducted sequencing effort. An ANOVA was performed to verify the observed differences. For the beta diversity, the weighted UniFrac metric [66] was used to calculate the amount of dissimilarity (distance) between the prokaryotic communities being compared. PERMANOVA was applied to calculate the significant differences between samples in beta-diversity analysis. The results were presented in a principal components analysis (PCoA) using the Emperor program implemented in QIIME. All estimates were measured for the normalized data (normalization was carried out to the smallest number of sequences present in the sample).
The core microbial community (generally defined as the specific taxonomic set presenting in each sample of the current dataset) of the entire profiles (obtained by combining all of the horizons together) in each stage of the soil chronosequence was calculated in the QIIME environment. The OTU abundances were compared among samples by calculating the median relative change values for all groups of replicates. A positive median indicated an increase in abundance, whereas a negative median could be considered evidence for a decrease in abundance. A basic permutation test was used to infer significance, while a jackknife-like resampling approach was applied to test the stability of the median estimates. An assessment of the reliability of differences in the representation of individual taxa in the analyzed samples was conducted using a custom script that performed several pairwise comparisons of the OTU frequency contingency tables in different sample sets, including the replications. The algorithm dynamically selected either the G-test or Fisher’s exact test and applied the Bonferroni correction to the p-value. The dynamic behavior of the algorithm allowed it to be applied to all types of datasets, including both the normally and non-normally distributed data types—that is, the soil microbial community NGS data [67]. The 50 most abundant OTUs were chosen to illustrate the transitions in abundance of specific OTUs over time. Each OTU was heat-mapped within the graphically painted soil profiles using the phyloseq [68] and tidyverse (https://CRAN.R-project.org/package=tidyverse version 2.0.0., the version R 4.1.2, accessed on 1 November 2021) packages in RStudio (http://www.rstudio.com/, the version 2021.09.0, accessed on 29 September 2021).
The same set of dominant OTUs was used to investigate the main physicochemical drivers behind the microbial compositions of the evolving Podzol profiles using canonical correspondence analysis (CCA). The analysis was carried out using the vegan package (https://CRAN.R-project.org/package=vegan, version 2.6-4, accessed on 11 October 2022) in RStudio (http://www.rstudio.com/, the version 2021.09.0, accessed on 29 September 2021). The correlation between the factors was evaluated using the VIFs function. An analysis of variance (ANOVA), including 999 permutations, was used to estimate the significance of certain factors (comprising the model) in shaping the microbial diversity. Visualization was performed using Past3 software (version 1.0.0.0).
All sequences were deposited in the Sequence Read Archive of the National Center for Biotechnology Information in the dataset SUB4606526.
3. Results
3.1. General Soil Characteristics
The initial substrate was slightly acidic (Table S1). As the soil profile developed (from the initial M1 to the mature M5 stages), the acidity of the soil (generally, topsoil—O and E horizons) increased (Tables S1 and S2). This tendency is directly associated with organic matter accumulation and redistribution, and particularly in the observed peak in organic-matter content in the 30-year-old site, leading to a substantial decrease in the corresponding pH values. The accumulation of TOC (as well as soil N) in the O horizons of podzolic soils (stages M3–5) is supported by ANOVA with Fisher’s LSD test (Table S2, Figure S2,). The increase in accumulation of soil organic matter in the mineral solum was fixed in the 70-year-old soil (Tables S1 and S2, Figure 3 and Figure S2), indicating the intensification of soil organo-mineral interaction. The development of the corresponding physical and chemical transformations led to a more pronounced differentiation of the vertical soil profile and its division into two spodic sub-horizons—BHF and BF—which had disappeared from the soil profile by the climax stage. Here and afterwards, the climax stage of soil development or corresponding microbial succession will be defined as a stable biome (in terms of energy, diversity estimates, etc.) demonstrating typical characteristics of the certain climatic zone [69]. The soils were classified as sandy textured due to the very low clay content. The basal respiration as well as metabolic coefficient demonstrated the tendency of decrease in the mature soil (stage M5) (Table S2). This indicates the stabilization of the soil formation process.
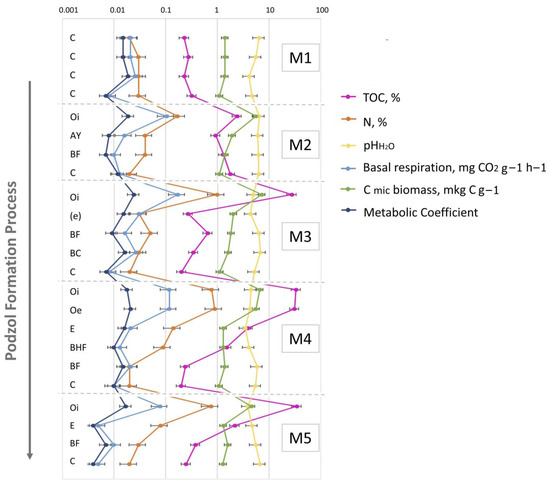
Figure 3.
The values of the soil’s main physicochemical characteristics and microbiological parameters of the soil horizons in M1–M5 samples representing their change the course of the soil ecogenesis. Abbreviations: (TOC—total organic carbon, N—total nitrogen, pHH2O—water PH measurement, basal respiration, C mic biomass—microbial carbon biomass, metabolic coefficient) of the soil horizons in M1–M5 samples. C—initial parent material, not altered by pedogeneis, Oi—initial litter, not altered by organic matter transformation process, Oe—liters, slightly transformed by enzymatic processes, AY—humus accumulative superficial soil horizon, BF—illuvial iron-oxide horizon, (e)—entic podzol horizon, BHF—illuvial iron–oxide–humic complexes horizon.
3.2. Real-Time PCR
An increase in the number of bacteria and archaea was detected in the mature soil (Figure 4). The bacteria were associated with the upper horizons, whereas the number of archaea increased in the BC mineral horizon. This distribution of prokaryotic communities depended on the organic matter accumulation. The ANOVA analysis results can be seen in Tables S3 and S4. All the differences observed are statistically significant.
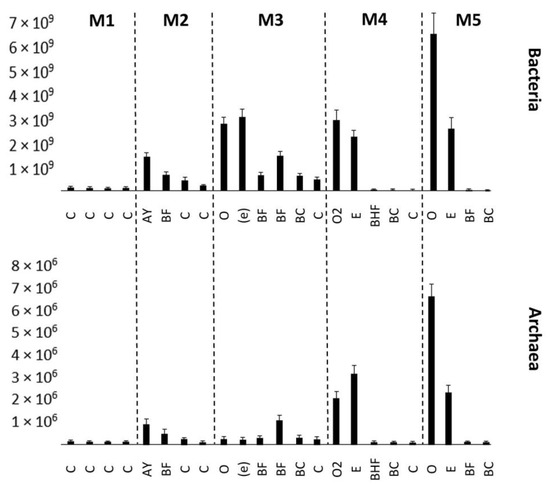
Figure 4.
Number of bacteria and archaea expressed in amounts of 16S rRNA or internal transcribed tracer sequences per gram of soil (y-axis), estimated by quantitative PCR. Error bars represent the SDs of the values. M1–M5 represent stages in the soil succession. C—initial parent material, not altered by pedogeneis, Oi—initial litter, not altered by organic matter transformation process, Oe—litter, slightly transformed by enzymatic processes, AY—humus accumulative superficial soil horizon, BF—illuvial iron-oxide horizon, (e)—entic podzol horizon, BHF—illuvial iron–oxide–humic complexes horizon. BC—transitional horizon between illuvial horizon and parent material.
3.3. Alpha Diversity of Soil Microbiomes
All the measured diversity indices tended to decrease from the initial to the mature stage of soil succession. In Stages M1 and M2, the alpha diversity was not significantly different in all soil horizons. In M3, a clear separation of the more diverse upper horizon (O) was observed. In M4 and M5, the vertical pattern of microbial diversity was flattened or even biased toward the lower soil horizons (Table 1, Figure S3).

Table 1.
Alpha-diversity indices. The letters denote the significance difference according to ANOVA (p-value < 0.05). Different letters (a–e) mark significant differences in the values of alpha-diversity indices of the correspondence samples within each column.
3.4. Beta Diversity of Soil Prokaryotic Communities
The beta diversity demonstrates the correlation of the microbial community structure with soil genesis (Figure 5).
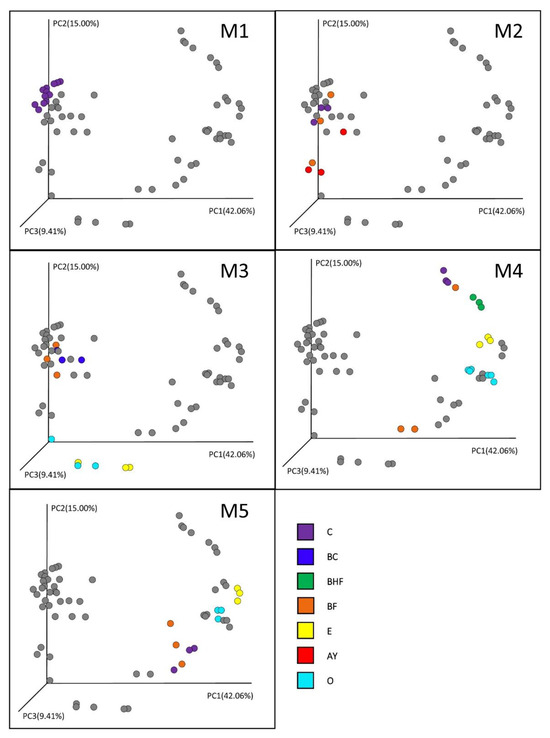
Figure 5.
Beta diversity in the soil horizons of different genesis. Distances between the samples were calculated using the weighted UniFrac method. PCoA1, 2, and 3 represent the axes of the PCoA plot with the percentage of explained variance. O, E, AY, BHF, BF, BC, and C are the soil horizons. M1–M5 represent sequential stages in the soil succession. Gray dots are marking all the samples to show the range of microbial dynamic shifts in each stage.
In the initial stages of succession, the prokaryotic communities of the soil layers (the nascent horizons) had a similar structure (Stage M1). With the accumulation of organic matter, the process of vertical diversification and the formation of the predecessors of the soil horizons of the mature soil began (Stage M2). Although the diversification of the prokaryotic communities of the soil horizons was still not significant, according to the PERMANOVA test (p = 0.097, indicating a difference at the trend level), particularly in the second stage, AY and BF horizons formed and took the intermediate position between the mineral and organic soil horizons, which completely separated in the M3 stage of soil formation. In the M3 stage, a clear diversification of the organogenic part of the profile—O and E horizons—was observed, which showed the highest levels of dissimilarity compared to the mineral horizons (p < 0.05), which tended to have quite similar microbial composition.
Stage M4 was characterized by the further diversification of the mineral horizons as well as a sharp differentiation in the O horizon, resulting in the complete separation of the organic and eluvial (E) horizons in the preclimax and climax soil profiles. Except for some profile points (e.g., replicates of the experiment in the case of the humus-accumulative horizons BF and BHF) that occupied the intermediate position between the mineral and organic soil horizons (Figure 5), the illuvial humus-accumulative BF horizons were also well defined in the mature stage of soil genesis (Figure 6).
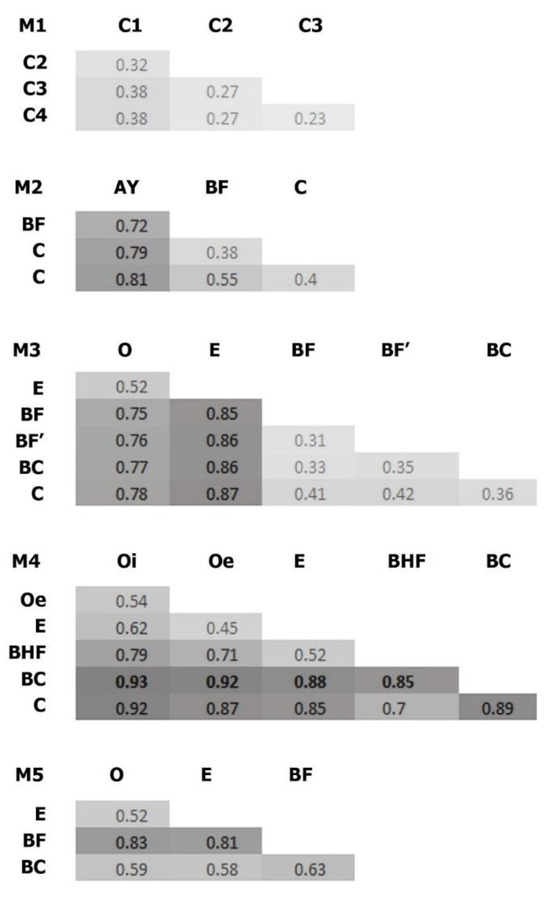
Figure 6.
Bray–Curtis dissimilarities of the soil samples. O, E, AY, BHF, BF, BC, and C are soil horizons. BF’ refers to the lower part of BF horizon in M3 (these parts differed in density, however this difference was within density values of the same horizon). M1–M5 represent stages in the soil succession.
3.5. Taxonomic Characteristics of the Entire Dataset
We identified more than 900 phylotypes. Some of them were common soil bacteria, such as rhizobia or actinobacteria, and others were previously found on more or less similar disturbed sites. A total of 47 bacterial and two archaeal phyla were identified with the unassigned nucleotide sequences comprising 6.6% of the entire dataset. Among the dominant phyla were Proteobacteria (30.6%), Acidobacteria (18.30%), Bacteroidetes (10.20%), Actinobacteria (9.60%), Verrucomicrobia (4.80%), Chloroflexi (3.90%), Planctomycetes (3.60%), Crenarchaeota (3.20%), Nitrospirae (1.30%), Gemmatimonadetes (1.10%), and Firmicutes (1.00%).
3.6. Taxonomic Composition of the Core Prokaryotic Communities in the Different Stages of Soil Succession
To assess changes in the soil prokaryotic communities’ structure during evolution of the soil profile, the core phylotypes were identified for each succession stage (M1–M5) (Figure 7). The composition of the cores was determined from pooled replicates of the samples of each horizon of the site. This procedure was applied to identify all possible trends in the compositions of each site. The core prokaryotic communities contained the following number of identified phylotypes: M1—41; M2—71; M3—59; M4—97; and M5—94. No phylotypes were present in all five stages simultaneously. Most of the identified phylotypes demonstrated continuous transitions through two or even three successive stages of soil development, such as from M1 to M2 (11 OTUs), M1 to M2 and M3 (11 OTUs), M3 to M4 (3 OTUs), M3 to M4 and M5 (3 OTUs), and M4 to M5 (the largest group with 55 OTUs). However, a small number of phylotypes had random patterns of distribution, such as one shared OTU between M2 and M4 (ACB, Sg1, Acidobacteria), one between M2 and M5 (Cyanobacteria), and two between M1 and M3. Thus, the overall core diversity could be divided into two large groups—those phylotypes that dominated the initial stages of soil formation (from M1 to M3), and those that dominated in more or less developed soil profiles in Stages M4 and M5. Stages M1 and M2 were dominated by archaea from the family Nitrososphaeraceae (1 OTU) and bacteria from the families Microscillaceae (1 OTU), Xanthomonadaceae (1 OTU), and Nitrosomonadaceae (1 OTU). This transition was also characterized by the presence of various acidobacterial subdivisions, particularly the Pyrinomonadales and Holophaga groups. The transition to Stage M3 contained archaea from the family Nitrososphaeraceae (1 OTU) and bacteria belonging to the Microscillaceae (Bacteroidetes, 1 OTU), Chitinophagaceae (Bacteroidetes, 3 OTUs), Micrococcales (Bacteroidetes, 2 OTUs), Burkholderiaceae (Gammaproteobacteria, 3 OTUs), Gaiellales (Actinobacteria, 1 OTU), Rhizobiales (Alphaproteobacteria, 1 OTU), Nitrosomonadaceae (Gammaproteobacteria, 3 OTUs), and Pyrinomonadales, particularly genus RB41 (Acidobacteria, 3 OTUs) taxonomic subdivisions. Very often, the bacteria that dominated Stages M2 and M3 had been eliminated from the microbial community of Stages M4 and M5. In particular, only Stages M2 and M3 contained bacteria from the phyla Nitrospira and unidentified representatives of the Chloroflexi. The least number of transitions were observed between Stages M3 and M4–M5, including unidentified representatives of the Gemmatimonadetes and bacteria from the family Corynebacteriales, which were absent from M1 and M2. Other bacteria, such as the Rhizobiaceae family and acidobacteria from the genus RB41, remained in the core prokaryotic communities of the mature soils, but it changed in their species and genus compositions.
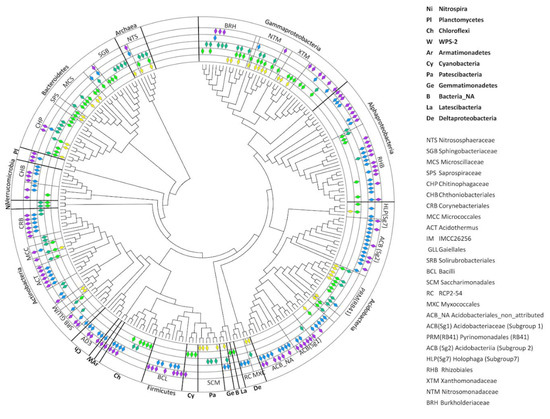
Figure 7.
Core community of soil microbiomes. Diamonds represent the presence of taxa in the core community at certain stages in the soil succession: Stage M1—yellow; M2—light green; M3—dark green; M4—blue; and M5—violet.
Some bacterial families, or even bacterial phyla, appeared only in the final stages of soil profile development, among them being entire phyla: WPS-2, Armatimonadetes, Planctomycetes, and almost all (except one OTU in Stage M2) representatives of the Verrucomicrobia; the orders and classes Corynebacteriales, Solirubrobacterales (Actinobacteria), AD3 (Chloroflexi), Bacilli (Firmicutes), Acidobacteriales, Acidobacteria from Subgroups 1 and 2; and the genus Acidothermus (Actinobacteria). Along with the appearance of the new groups of bacteria in the later successional stages, the taxonomic compositions of the previous prokaryotic communities changed dramatically, transforming the components of the Rhizobiales and Chitinophagaceae subgroups (Figure 7).
3.7. Dynamic Changes in the Compositions of the Prokaryotic Communities Inhabiting Different Soil Horizons through Time
To study the dynamic changes in the prokaryotic communities during soil development, a set of dominant taxa was selected for each stage (M1–M5), including 47 phylotypes, the abundances of which exceeded 1% in at least one soil sample (Table S5).
Several groups of taxa were found in specific soil horizons. The first group was found exclusively in the BC–C mineral horizons of the mature soil, the second accumulated in the upper and (regularly) in the lower part of the soil profile (in zones of active root growth), and the third occurred in the BF horizon of the mature soil (Figure 8A–C). The first group (Figure 8A) included Myxococcales, MND1, Xanthobacteriaceae (Proteobacteria), and KD 4-26 (Chloroflexi). The second group (Figure 8B) included representatives of Xanthobacteriaceae, Bradyrhizobium, WD260, Burkholderia multivorans (Proteobacteria), Solirubrobacteraceae, Subtercola sp. (Actinobacteria), Chitinophagaceae (Bacteroidetes), and Acidobacteriales (Acidobacteria). The third group (Figure 8C) comprised Subgroup 2, RB41 (Acidobacteria), Massilia sp., Beijerinckiaceae, IS44 (Proteobacteria), Candidatus Udaeobacter (Verrucomicrobia), TK10, AD3 (Chloroflexi), Gemmatimonadaceae (Gemmatimonadetes), and unidentified archaea from the phylum Thaumarchaeota.
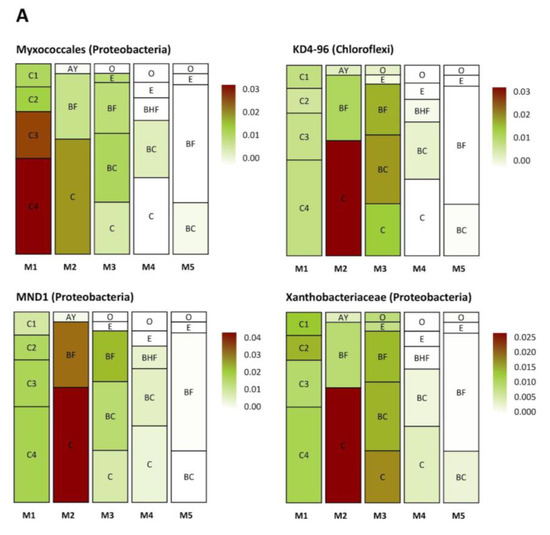
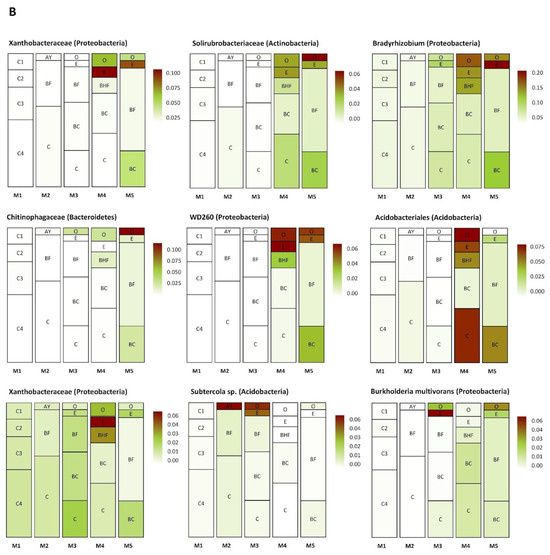
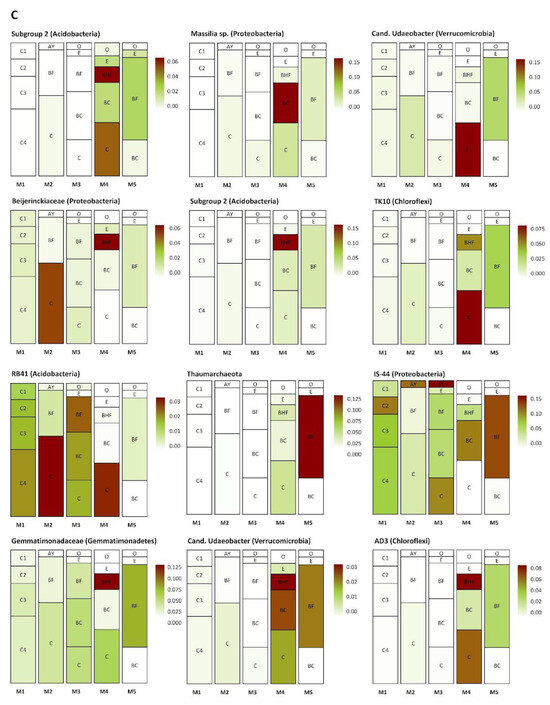
Figure 8.
Distribution (heat map) of specific taxa in the soil profiles (the pictures were drawn to show the exemplary spatial architecture of the soil profile, using the depth measurement of the soil horizons). Only taxa with significant differences in their abundances (expressed as the percent of the total microbial number of the amplicon library, marked with color range from red—the most abundant to white—the less abundant) are shown. A–C are the phylotype groups, separated according to their tendency to concentrate in particular parts of the soil profile. O, E, AY, BHF, BF, BC, and C are soil horizons.
3.8. Influence of Physicochemical Factors in Shaping Prokaryotic Communities’ Structure in the Course of Podzol Profile Evolution
The analysis included two stages that highlighted the development of the primary Podzol that are known to be the main soil-forming processes under coniferous forests. The first was development of an Embryopodzol (Stage M3), with only a nascent podzolic (e) horizon, and the second was the preclimax stage (M4), where the podzolic process manifested as a clearly pronounced illuvial–eluvial differentiation of the soil profile, along with a thick organogenic horizon, including forest litter (O) (Figure 9).
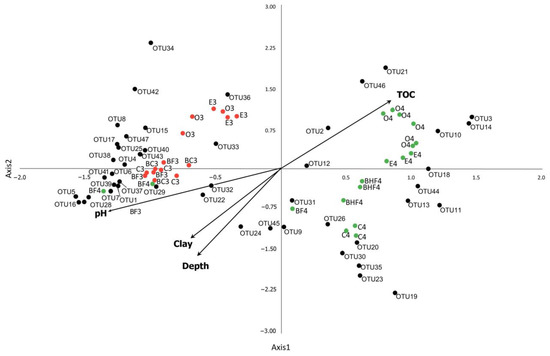
Figure 9.
CCA plot of the dominant phylotypes (>1% in the dataset) in Stages M3 and M4 (OTU 1–47). OTU1—Nitrososphaeraceae_NA (Archaea); OTU2—Bradyrhizobium_NA (Proteobacteria); OTU3—WD260_NA (Proteobacteria); OTU4—RB41_NA (Acidobacteria); OTU5—Rhizobium etli (Proteobacteria); OTU6—Arthrobacter sp. (Actinobacteria); OTU7—RB41_NA (Acidobacteria); OTU8—Comamonas sp. (Proteobacteria); OTU9—Gemmatimonadaceae_NA (Gemmatimonadetes); OTU10––Mycobacterium sp. (Actinobacteria); OTU11—Acidobacteriales_NA; OTU12—Xanthobacteraceae_NA (Proteobacteria); OTU13—Subgroup 2 (Acidobacteria); OTU14—Xanthobacteraceae (Proteobacteria); OTU15—Ideonella (Proteobacteria); OTU16—Massilia sp. (Proteobacteria); OTU17—Pseudomonas sp. (Proteobacteria); OTU18—Solirubrobacteraceae_NA (Actinobacteria); OTU19—Candidatus Udaeobacter (Verrucomicrobia); OTU20—Subgroup 2_NA (Acidobacteria); OTU21—Chitinophagaceae_NA (Bacteroidetes); OTU22—Subgroup 6_NA (Acidobacteria); OTU23—TK10_NA (Chloroflexi); OTU24—RB41_NA (Acidobacteria); OTU25—Variovorax sp. (Proteobacteria); OTU26—Subgroup 2_NA (Acidobacteria); OTU27—MND1_NA (Proteobacteria); OTU28—Bacillales_NA (Firmicutes); OTU29—Corynebacterium sp. (Actinobacteria); OTU30—Thaumarchaeota group 1,1c_NA (Archaea); OTU31—Beijerinckiaceae_NA; OTU32—Subgroup 6_NA (Acidobacteria); OTU33—Mycobacterium sp. (Actinobacteria); OTU34—Subtercola sp. (Actinobacteria); OTU35—AD3_NA (Chloroflexi); OTU36—Burkholderia multivorans (Proteobacteria); OTU37—Myxococcales_NA (Proteobacteria); OTU38—KD4-96_NA (Chloroflexi); OTU39—Gaiellales_NA (Actinobacteria); OTU40—Ellin6067_NA (Proteobacteria); OTU41—Stenotrophobacter terrae (Acidobacteria); OTU42—Variovorax sp. (Proteobacteria); OTU43—Xanthobacteraceae_NA (Proteobacteria); OTU44—RCP2-54_NA (Proteobacteria); OTU45—Candidatus Udaeobacter sp. (Verrucomicrobia); OTU46—Chthoniobacter sp. (Verrucomicrobia); and OTU47—IS-44_NA (Proteobacteria). NA—non-attributed sequence. M3 stage (red dots) is represented by O, E, BF, BC and C horizons (each point is shown in several replications), M4 stage (green dots) is represented by O, E, BF, BHF and C horizons, marked by 3 and 4, correspondingly. The CCA axes show the magnitude of the variation in the abundance of the microbial phylotypes (OTUs) as well as soil horizons attributed to the values of the main physicochemical soil properties (pH value, clay particles content, the percent of total organic carbon (C) and depths of sampling).
The model included the factors total Corg, depth, clay content, and pH, and these totally explained 41.9% of the entire variation in the values of the current dataset. The CCA plot allowed us to distinguish several zones. The first zone was characterized by positive values of both the CCA1 and CCA2 axes, explaining 19% of the total variance, which was correlated with the accumulation of Corg in the soil and corresponded with diversification in the topsoil of Stage M4. This is the most probable reason for the increase in proteobacteria from the Gammaproteobacteria, Xanthobacteraceae (Rhizobiales), and Bradyrhizobium (Rhizobiales) groups as well as bacteria from the family Chitinophagaceae (Bacteroidetes) and genera Chthoniobacter (Verrucomicrobia) and Mycobacterium (Actinobacteria) in Stage M4.
The negative values of both the CCA1 and CCA2 axes corresponded to the mineral (BF3, BC3, and C3) and illuvial (BF4) soil horizons. The microbial shifts here were likely associated with the more neutral pH values of the soil in solution as well as with the illuviation process and the corresponding increase in the proportion of clay particles (clay factor). Phylotypes of Acidobacteria of Subgroups 6 and 4 (Blastocatellia, Pyrinomonadaceae), Proteobacteria of the family Nitrosomonadaceae (Gammaproteobacteria), Verrucomicrobia phylotypes (Candidatus Udaeobacter), and the Archaea (Thaumarchaeota) were associated with these samples. Negative values of the CCA2 axis determined the overall abundance of taxa associated with the mineral horizons. Of these, Acidobacteria of Subgroup 2, the order Acidobacteriales, and Actinobacteria of the family Solirubrobacteraceae were associated with the podzolic horizon of the preclimax stage (E4, positive values of the CCA1 and negative values of the CCA2 axes). In the mineral horizons of the preclimax stage (BF4 and, to a greater extent, C4), there was an increase in the abundances of Acidobacteria of Subgroup 2, phylotypes of Gemmatimonadetes and Chloroflexi (AD3), and Archaea (Thaumarchaeota) (Figure 9).
4. Discussion
The investigated soils represented classic Podzol soil evolution through ecogenetic succession. In general, the soil profile development rate was comparable with those studied previously [3,4,5,7]. The main reason for this is the origin of the parent materials of the mentioned studies, which are extremely acidic. Due to the specificity of the soil-forming process—the sandy texture of the parent material [70], the acidic reaction of coniferous fallout [71], and the flushing water regime with high precipitation—the soil development in the chronosequence was rapid, and the soil profile became well developed in 70 years, expressing all the genetic horizons that are typical of Podzols of the southern taiga [72].
As the plant cover developed, the biomass of the associated soil microbial community also increased due to fresh organic matter deposition in the organogenic horizons (topsoils) in the form of plant litter and sloughing of root cells during growth, which in turn may explain the increase in bacterial biomass (estimated as amounts of ribosomal operons) in the upper horizons of the mature zonal soils of the preclimax and climax (M4 and M5) stages (Figure 4). When analyzing soil prokaryotic community in the context of soil ecogenesis, the main trend of soil microbiological succession is observed at the level of the quantitative indicators of the microbial diversity, primarily related to the redistribution of organic matter and, in particular, to the shifts in its composition. So, we might suppose the occurrence of bacteria that utilize relatively simple components of the organic matter at the early stages, whereas later stages are characterized by a more diverse community.
Moreover, under intensive leaching of the soil biomass, rates of mineralization of plant residues and humification are suppressed, and the majority of the products of organic-material transformation are washed out of the soil profile, accumulating in the illuvial horizon [73]. This organic matter concentration can contribute to the maintenance of an oligotrophic microbiota in the lower mineral soil layers, explaining the relative increase in archaeal ribosomal operons in the mineral horizons of the mature soils. Furthermore, the lower portion of the BF horizon is usually poor in organic matter and nutrients, contributing to a relative increase in the abundance of the Archaea, which are more resistant to various environmental stresses [74]. For example, an increase in the archaeal-to-bacterial ratio has been reported from the late stages of pedogenesis (more than 120,000 years) in the lower mineral horizons, indicating the adaptation of the Archaea to the nutrient and energy-poor environment typical of the subsoil [42].
The alpha diversity data clearly demonstrated a strong dependence of soil differentiation processes on the organic matter supply and podzolization with the overall level of prokaryotic diversity, sharply decreasing in the latest stages. In general, this trend is common in succession processes with the early stages of biome development characterized by dynamic changes in the architecture and organization of ecological niches that are occupied at the beginning by various copiotrophic microorganisms, which are then replaced by well-specialized oligotrophs, marking the climax stage of soil development [69]. During successive differentiation of the vertical soil profile, the diversity indices gradually decreased, marking two hot-spots of relatively high microbial diversity in the organogenic (O) and humus-accumulative (BF), or even mineral BC, horizons (e.g., the M4 stage). Starting from the M3 stage, the tendency toward separation of the podzolic horizon (E) became obvious due to intensification of the leaching processes (i.e., podzolization). Among the named tendencies, the accumulation of microbial diversity in the lower soil layers merits special discussion. Well-established soil mineral horizons are enriched with organic matter from the upper soil layers. In addition, they contain large amounts of clay. A high clay content, in turn, can cause the accumulation of extracellular DNA, which is known to form stable complexes with clay minerals [75]. Both factors can stimulate the growth of microbial diversity in these horizons.
The beta-diversity analysis revealed regularities between vertical soil differentiation and the changes that occurred in the microbial community structure. The initial stage demonstrated an absence of differences in the microbial diversity values between samples. Beginning from Stage M2, the process of differentiation gained strength, resulting in the formation of a full set of the predecessors of the mineral and organogenic horizons in the M3 stage. Thus, slightly more than 30 years was enough time for the soil to completely restore its zonal characteristics. The subsequent processes simply reinforced this differentiation without adding anything fundamentally new to the soil structure. Detailed analysis of the transition from the M3 stage of embryopodzol to the mature podzol profile at the M4 stage demonstrated the continuation of the process of acidification of the upper part of the soil profile (Figure 9), which is associated with the accumulation of organic matter in the O horizon of the M4 stage. Also, in relation to mineral horizons, their preferential enrichment with clay particles was observed compared to the upper part of the profile, which was also more characteristic of the more mature preclimax soil (M4).
The continuous development of the soil profile was fully reflected in the taxonomic changes in the microbial community, ending with the formation of the prokaryotic communities, which are typical of podzolic soils in the temperate zone in Russia [76,77]. The distribution of specific taxa in the soil profiles showed the dominance of Proteobacteria in the zero stage of soil formation, Chloroflexi in the intermediate stage of soil development, affected by illuviation processes, and Acidobacteria in the preclimax and climax stages. These shifts were quite expected and can be explained by ecological changes. At the beginning of ecosystem development, the dominant positions were occupied by fast-growing copiotrophs (concentrated primarily within the Proteobacteria), which were succeeded by a well-specialized oligotrophic microbiota (e.g., Acidobacteria, Verrucomicrobia, Gemmatimonadetes, AD3, WSP-2, Planctomycetes, and Armatimonadetes) [78,79,80,81].
In addition to these ecological explanations, prokaryotic communities’ changes can occur via, for example, intensive acidification of the soil profile, which promotes the growth of Acidobacteria in the latest stages of soil formation; these are known to dominate in soil with pH values of 3 to 5 [82]. A change in the plant community, accompanied by a greater amount of fresh organic matter and increased thickness of the organogenic horizon (forest litter), may explain an increase in the abundance of Verrucomicrobia in the microbial community of mature soils. Bacteria belonging to this phylum are known to gravitate to the forest floor [83].
To understand the reasons for, and specific traits of, the adaptive patterns of prokaryotic communities in the course of soil genesis, it is important to consider the changes occurring in the taxonomic structure at lower taxonomic levels. In this respect, the circular representation of changes in the basic (core) community, presented in Figure 7, as well as the gradual change in abundance of the taxa in the soil profiles (Figure 8) is relevant. The adaptation strategies of the microorganisms evolve during the evolution of the soil ecosystem alongside diversification and changes in the dominant components of the microbial community, which are, in turn, responsible for certain soil biological processes. The intensity of these processes also changes during the development of genetic soil horizons.
The first of these processes is root growth and the corresponding migration of the rhizosphere microorganisms to the lower soil layers. For example, Figure 8B presents various bacterial groups that were evenly distributed in the soil profile in the initial stages of succession, while in the latter stages, these bacteria were concentrated in the upper soil layers and mineral BC horizon. The presence of bacteria belonging to the Bradyrhizobium genus or Solirubrobacteraceae and Xanthobacteraceae families points to a rhizospheric origin for this part of the soil prokaryotic community [84,85].
Unfortunately, this study is lacking comprehensive information on the distance between the trees and the points of soil sampling as well as the complete list of the plant species inhabiting this biome. Obviously, it might be the main predictor of the microbial distribution among the soil profile.
The second of these processes involves the N cycle. Analysis of the investigated prokaryotic communities revealed a succession of prokaryotes associated with the transformation of N compounds during soil genesis. In the initial stages, this group was represented by the Archaea (family Nitrososphaeraceae) and a few Nitrosomonadales, the abundance of which increased in subsequent stages, particularly that of the Embryopodzol (M3). These stages were also enriched with cyanobacteria (particularly M2), which were presumably involved in the primary structuring of the soil and its enrichment with N and organic matter [86]. The presence of cyanobacteria in the first stages of the regeneration of dump soils has been noted previously [87]. Probably, the detection of cyanobacteria in the mineral horizons of the preclimax soils occurred due to the entry of DNA from these microorganisms from the upper horizons during pedogenesis. In the latest stages of succession (M4, M5), Nitrospirae lineages and N-fixators from the Rhizobiales order were included in the N transformation [88].
The final process is bacterial degradation of the main soil biopolymers. Along with the accumulation of fresh organic matter, the proportion and diversity of cellulose, hemicellulose, pectin, and lignin degraders [89,90] belonging to the Bacteroidetes (families Chitinophagaceae, Sphingobacteriaceae), as well as gamma-proteobacteria (family Burkholderiaceae), gradually increased. This group can also include Actinobacteria in the final stages of soil development.
Because the earlier stages (especially M2 and M3) were dominated by the coccoid copiotrophic representatives of this phylum, such as Micrococcales, the latter stages included bacteria with pseudo- (Corynebacteriales) and true (Actinomycetales) mycelium, generally referred to the autochthonous soil microbiota, which utilize humus substances and soil biopolymers, and these are known to integrate the soil community chemically by synthesizing various antibiotics and signal molecules and mechanically aggregating microbial cells and soil particles [90].
In this study, their co-occurrence can be seen in Figure 8A–C, especially Figure 8B, where the bacteria forming the rhizosphere community are represented. The plant-associated nature of this part of the microbial community is marked by indicator phylotypes, such as Bradyrhizobium and bacteria belonging to the families Xanthomonadaceae and Solirubrobacteraceae [84,91,92]. So, we might expect the same ecological features or some beneficial function for plant nutrition/development, etc., from the other members of this group, such as from the WD260 phylotype (Proteobacteria). The existing information on the distribution and functional opportunities of these bacteria is quite poor. However, they are likely to have the widest ecological capabilities in both aquatic and terrestrial environments, including disturbed soils [93,94].
5. Conclusions
The studied model of Podzol soil genesis showed the continuous evolution of the prokaryotic communities’ structure, which entirely corresponded with the process of soil organic matter redistribution and formation of the vertical soil profile (podsolization, illuviation of iron oxides).
The results allowed us to trace the relationship between the structure of the soil prokaryotic community and the peculiarities of the evolution of the podzolic soil profile as well as to identify the microbial indicators and drivers of primary pedogenesis. Thus, the direct task was solved—the influence of soil age and the degree of differentiation of its profile on the microbiome was studied. In the future, it is necessary to solve a more complex–inverse problem—how to control soil formation process with the help of functional composition of the microbiome. The solution of this problem will be an important step for soil cover restoration and land reclamation.
Beta-diversity data analysis, as well as analysis of the core prokaryotic communities in each stage, revealed a comparatively large distance and sharp transition, in terms of microbial diversity, between the Embryopodzol (Stage M3) and the later stages of soil development. Thus, in further research, it will be reasonable to complete the chronosequence with at least one intermediate stage of soil formation, ranging from 40 to 45 years old.
The methods applied to studying this multiplex system are generalized and sometimes difficult. In particular, the representation of changes between subsequent stages of soil genesis, in terms of the core prokaryotic communities combined from the horizons and replicates, was adequate but too generalized. Unfortunately, we currently lack an elaborate mathematical model that could highlight the hidden abundance patterns of certain taxa. It would have also been useful to have included different pools of nucleic acids in this study, such as DNA, RNA, and extracellular DNA, and to have been able to divide the soil into its natural microenvironments––that is, soil aggregates. Currently, studying the microbial succession in a developing soil can contribute to various biological and ecological questions, including the discovery of new symbiotic relationships and the matching of specific functional profiles to yet-uncultured prokaryotes.
Supplementary Materials
The following supporting information can be downloaded at: https://www.mdpi.com/article/10.3390/soilsystems8010009/s1, Figure S1: Rarefaction curves for alpha-diversity analysis. title; Figure S2: Box-plots for the physic-chemical parameters; Figure S3: Box-plots for the alpha-diversity measurements. Table S1: Summary of ANOVA results of the abundance of bacteria and archaea estimated by quantitative PCR; Table S2: Tukey multiple comparisons of means (95% family-wise confidence level) based on ANOVA results of the abundance of bacteria and archaea estimated by quantitative PCR; Table S3: The list of dominant taxa (abundances exceeds 1% of the soil sample community), which are present in at least one of the soil horizons and the corresponding soil samples (the core community).
Author Contributions
E.E.—writing and editing, E.I.—statistic and writing, G.G.—laboratory experiment, A.Z.—bioinformatics treatment, A.K. (Anastasiya Kimeklis)—laboratory experiment, E.S.—writing, A.P.—visualization, A.K. (Arina Kichko)—writing, T.A.—field and laboratory research, E.A. (Evgeny Andronovand)—conceptualization, E.A. (Evgeny Andronov)—project administration, funding acquisition. All authors have read and agreed to the published version of the manuscript.
Funding
This work was supported by the Russian Science Foundation, project No 23-16-20003, date 20 April 2023 and Saint-Petersburg Scientific Foundation, agreement No 23-16-20003, date 5 May 2023.
Institutional Review Board Statement
Not applicable for studies not involving humans or animals.
Informed Consent Statement
Not applicable.
Data Availability Statement
All raw data (sequences) are avialable in the Sequence Read Archive of the National Center for Biotechnology Information (https://www.ncbi.nlm.nih.gov/bioproject/999634, accessed on 5 August 2023).
Acknowledgments
This work is dedicated to 300-year anniversary of Saint-Petersburg State University.
Conflicts of Interest
The authors declare no conflict of interest.
References
- Targulian, V.O.; Krasilnikov, P.V. Soil System and Pedogenic Processes: Self-Organization, Time Scales, and Environmental Significance. Catena 2007, 71, 373–381. [Google Scholar] [CrossRef]
- Abakumov, E.; Parnikoza, I.Y.; Vlasov, D.Y.; Lupachev, A. Biogenic–Abiogenic Interaction in Antarctic Ornithogenic Soils. In Biogenic—Abiogenic Interactions in Natural and Anthropogenic Systems; Mergelov, N.S., Shorkunov, I.G., Targulian, V.O., Dolgikh, A.V., Abrosimov, K.N., Zazovskaya, E.P., Goryachkin, S.V., Eds.; Springer International Publishing: Cham, Switzerland, 2016; pp. 205–222. ISBN 978-3-319-24985-8. [Google Scholar]
- Abakumov, E.V. Accumulation and Transformation of Organic Matter in Different-Aged Dumps from Sand Quarries. Eurasian Soil Sci. 2008, 41, 844–851. [Google Scholar] [CrossRef]
- Mokma, D.L.; Yli-halla, M.; Lindqvist, K. Podzol Formation in Sandy Soils of Finland. Geoderma 2004, 120, 259–272. [Google Scholar] [CrossRef]
- Bowman, G.M. Podzol Development in a Holocene Moruya Heads, New South Wales. Aust. J. Soil Res. 1989, 27, 607–628. [Google Scholar] [CrossRef]
- Abakumov, E.V.; Frouz, J. Evolution of the Soil Humus Status on the Calcareous Neogene Clay Dumps of the Sokolov Quarry Complex in the Czech Republic. Eurasian Soil Sci. 2009, 42, 718–724. [Google Scholar] [CrossRef]
- Huggett, R.J. Soil Chronosequences, Soil Development, and Soil Evolution: A Critical Review. Catena 1998, 32, 155–172. [Google Scholar] [CrossRef]
- Rosling, A.; Landeweert, R.; Lindah, B.D.; Larsson, K.H.; Kuyper, T.W.; Taylor, A.F.S.; Finlay, R.D. Vertical distribution of ectomycorrhizal fungal taxa in a podzol soil profile. New Phytol. 2003, 159, 775–783. [Google Scholar] [CrossRef]
- Naylor, D.; McClure, R.; Jansson, J. Trends in Microbial Community Composition and Function by Soil Depth. Microorganisms 2022, 10, 540. [Google Scholar] [CrossRef]
- Gagelidze, N.A.; Amiranashvili, L.L.; Sadunishvili, T.A.; Kvesitadze, G.I.; Urushadze, T.F.; Kvrivishvili, T.O. Bacterial Composition of Different Types of Soils of Georgia. Ann. Agrar. Sci. 2018, 16, 17–21. [Google Scholar] [CrossRef]
- Geisen, S. The Future of Soil Microbiome Studies: Current Limitations, Integration, and Perspectives. mSystems 2021, 6, e00613-21. [Google Scholar] [CrossRef]
- Fierer, N.; Schimel, J.P.; Holden, P.A. Variations in microbial community composition through two soil depth profiles. Soil Biol. Biochem. 2003, 35, 167–176. [Google Scholar] [CrossRef]
- Hansel, C.M.; Fendorf, S.; Jardine, P.M.; Francis, C.A. Changes in Bacterial and Archaeal Community Structure and Functional Diversity along a Geochemically Variable Soil Profile. Appl. Environ. Microbiol. 2008, 74, 1620–1633. [Google Scholar] [CrossRef] [PubMed]
- Will, C.; Thürmer, A.; Wollherr, A.; Nacke, H.; Herold, N.; Schrumpf, M.; Gutknecht, J.; Wubet, T.; Buscot, F.; Daniell, R. Horizon-Specific Bacterial Community Composition of German Grassland Soils, as Revealed by Pyrosequencing-Based Analysis of 16S RRNA Genes. Appl. Environ. Microbiol. 2010, 76, 6751–6759. [Google Scholar] [CrossRef] [PubMed]
- Richter, D.D.; Markewitz, D. How Deep Is Soil? BioScience 1995, 45, 600–609. [Google Scholar] [CrossRef]
- Eilers, K.G.; Debenport, S.; Anderson, S.; Fierer, N. Digging Deeper to Find Unique Microbial Communities: The Strong Effect of Depth on the Structure of Bacterial and Archaeal Communities in Soil. Soil Biol. Biochem. 2012, 50, 58–65. [Google Scholar] [CrossRef]
- Hartmann, A.; Schmid, M.; van Tuinen, D.; Berg, G. Plant-Driven Selection of Microbes. Plant Soil 2009, 321, 235–257. [Google Scholar] [CrossRef]
- Hartmann, M.; Howes, C.G.; Vaninsberghe, D.; Yu, H.; Bachar, D.; Christen, R.; Henrik Nilsson, R.; Hallam, S.J.; Mohn, W.W. Significant and Persistent Impact of Timber Harvesting on Soil Microbial Communities in Northern Coniferous Forests. ISME J. 2012, 6, 2199–2218. [Google Scholar] [CrossRef] [PubMed]
- Agnelli, A.; Ascher, J.; Corti, G.; Ceccherini, M.T.; Nannipieri, P.; Pietramellara, G. Distribution of Microbial Communities in a Forest Soil Profile Investigated by Microbial Biomass, Soil Respiration and DGGE of Total and Extracellular DNA. Soil Biol. Biochem. 2004, 36, 859–868. [Google Scholar] [CrossRef]
- Sánchez-Marañón, M.; Miralles, I.; Aguirre-Garrido, J.F.; Anguita-Maeso, M.; Millán, V.; Ortega, R.; García-Salcedo, J.A.; Martínez-Abarca, F.; Soriano, M. Changes in the Soil Bacterial Community along a Pedogenic Gradient. Sci. Rep. 2017, 7, 14593. [Google Scholar] [CrossRef]
- Turner, S.; Meyer-Stüve, S.; Schippers, A.; Guggenberger, G.; Schaarschmidt, F.; Wild, B.; Richter, A.; Dohrmann, R.; Mikutta, R. Microbial Utilization of Mineral-Associated Nitrogen in Soils. Soil Biol. Biochem. 2017, 104, 185–196. [Google Scholar] [CrossRef]
- Baldrian, P.; Kolaiřík, M.; Štursová, M.; Kopecký, J.; Valášková, V.; Větrovský, T.; Žifčáková, L.; Šnajdr, J.; Rídl, J.; Vlček, Č.; et al. Active and Total Microbial Communities in Forest Soil Are Largely Different and Highly Stratified during Decomposition. ISME J. 2012, 6, 248–258. [Google Scholar] [CrossRef] [PubMed]
- Dangi, S.R.; Stahl, P.D.; Wick, A.F.; Ingram, L.J.; Buyer, J.S. Soil Microbial Community Recovery in Reclaimed Soils on a Surface Coal Mine Site. Soil Sci. Soc. Am. J. 2012, 76, 915–924. [Google Scholar] [CrossRef]
- Li, Y.; Wen, H.; Chen, L.; Yin, T. Succession of Bacterial Community Structure and Diversity in Soil along a Chronosequence of Reclamation and Re-Vegetation on Coal Mine Spoils in China. PLoS ONE 2014, 9, e115024. [Google Scholar] [CrossRef] [PubMed]
- Sprocati, A.R.; Alisi, C.; Tasso, F.; Fiore, A.; Marconi, P.; Langella, F.; Haferburg, G.; Nicoara, A.; Neagoe, A.; Kothe, E. Bioprospecting at Former Mining Sites across Europe: Microbial and Functional Diversity in Soils. Environ. Sci. Pollut. Res. 2014, 21, 6824–6835. [Google Scholar] [CrossRef] [PubMed]
- Escobar, I.E.C.; Santos, V.M.; da Silva, D.K.A.; Fernandes, M.F.; Cavalcante, U.M.T.; Maia, L.C. Changes in Microbial Community Structure and Soil Biological Properties in Mined Dune Areas During Re-Vegetation. Environ. Manag. 2015, 55, 1433–1445. [Google Scholar] [CrossRef] [PubMed]
- Nemergut, D.R.; Anderson, S.P.; Cleveland, C.C.; Martin, A.P.; Miller, A.E.; Seimon, A.; Schmidt, S.K. Microbial Community Succession in an Unvegetated, Recently Deglaciated Soil. Microb. Ecol. 2007, 53, 110–122. [Google Scholar] [CrossRef]
- Schütte, U.M.E.; Abdo, Z.; Foster, J.; Ravel, J.; Bunge, J.; Solheim, B.; Forney, L.J. Bacterial Diversity in a Glacier Foreland of the High Arctic. Mol. Ecol. 2010, 19, 54–66. [Google Scholar] [CrossRef]
- Bradley, J.A.; Singarayer, J.S.; Anesio, A.M. Microbial Community Dynamics in the Forefield of Glaciers. Proc. Biol. Sci./R. Soc. 2014, 281, 20140882. [Google Scholar] [CrossRef]
- Goberna, M.; García, C.; Insam, H.; Hernández, M.T.; Verdú, M. Burning Fire-Prone Mediterranean Shrublands: Immediate Changes in Soil Microbial Community Structure and Ecosystem Functions. Microb. Ecol. 2012, 64, 242–255. [Google Scholar] [CrossRef]
- Sun, H.; Santalahti, M.; Pumpanen, J.; Köster, K.; Berninger, F.; Raffaello, T.; Asiegbu, F.O.; Heinonsalo, J. Bacterial Community Structure and Function Shift across a Northern Boreal Forest Fire Chronosequence. Sci. Rep. 2016, 6, 32411. [Google Scholar] [CrossRef]
- Gomez-Alvarez, V.; King, G.M.; Nüsslein, K. Comparative Bacterial Diversity in Recent Hawaiian Volcanic Deposits of Different Ages. FEMS Microbiol. Ecol. 2007, 60, 60–73. [Google Scholar] [CrossRef] [PubMed]
- Stevens, P.R.; Walker, T.W. The Chronosequence Concept and Soil Formation. Q. Rev. Biol. 1970, 45, 333–350. [Google Scholar] [CrossRef]
- Lewis, D.E.; White, J.R.; Wafula, D.; Athar, R.; Dickerson, T.; Williams, H.N.; Chauhan, A. Soil Functional Diversity Analysis of a Bauxite-Mined Restoration Chronosequence. Microb. Ecol. 2010, 59, 710–723. [Google Scholar] [CrossRef] [PubMed]
- Urbanová, M.; Kopecký, J.; Valášková, V.; Ságová-Marečková, M.; Elhottová, D.; Kyselková, M.; Moёnne-Loccoz, Y.; Baldrian, P. Development of Bacterial Community during Spontaneous Succession on Spoil Heaps after Brown Coal Mining. FEMS Microbiol. Ecol. 2011, 78, 59–69. [Google Scholar] [CrossRef] [PubMed]
- Selenska-Pobell, S.; Kampf, G.; Flemming, K.; Radeva, G.; Satchanska, G. Bacterial Diversity in Soil Samples from Two Uranium Waste Piles as Determined by Rep-APD, RISA and 16S RDNA Retrieval. Antonie Van Leeuwenhoek Int. J. Gen. Mol. Microbiol. 2001, 79, 149–161. [Google Scholar] [CrossRef] [PubMed]
- Kaplan, C.W.; Kitts, C.L. Bacterial Succession in a Petroleum Land Treatment Unit. Appl. Environ. Microbiol. 2004, 70, 1777–1786. [Google Scholar] [CrossRef] [PubMed][Green Version]
- Lewis, D.E.; Chauhan, A.; White, J.R.; Overholt, W.; Green, S.J.; Jasrotia, P.; Wafula, D.; Jagoe, C. Microbial and Geochemical Assessment of Bauxitic Un-Mined and Post-Mined Chronosequence Soils from Mocho Mountains, Jamaica. Microb. Ecol. 2012, 64, 738–749. [Google Scholar] [CrossRef] [PubMed]
- Frouz, J.; Nováková, A. Development of Soil Microbial Properties in Topsoil Layer during Spontaneous Succession in Heaps after Brown Coal Mining in Relation to Humus Microstructure Development. Geoderma 2005, 129, 54–64. [Google Scholar] [CrossRef]
- Schulz, S.; Brankatschk, R.; Dümig, A.; Kögel-Knabner, I.; Schloter, M.; Zeyer, J. The Role of Microorganisms at Different Stages of Ecosystem Development for Soil Formation. Biogeosciences 2013, 10, 3983–3996. [Google Scholar] [CrossRef]
- Brankatschk, R.; Töwe, S.; Kleineidam, K.; Schloter, M.; Zeyer, J. Abundances and Potential Activities of Nitrogen Cycling Microbial Communities along a Chronosequence of a Glacier Forefield. ISME J. 2011, 5, 1025–1037. [Google Scholar] [CrossRef]
- Turner, B.L.; Wells, A.; Condron, L.M. Soil Organic Phosphorus Transformations along a Coastal Dune Chronosequence under New Zealand Temperate Rain Forest. Biogeochemistry 2014, 121, 595–611. [Google Scholar] [CrossRef]
- Lynch, J.M.; Benedetti, A.; Insam, H.; Nuti, M.P.; Smalla, K.; Torsvik, V.; Nannipieri, P. Microbial Diversity in Soil: Ecological Theories, the Contribution of Molecular Techniques and the Impact of Transgenic Plants and Transgenic Microorganisms. Biol. Fertil. Soils 2004, 40, 363–385. [Google Scholar] [CrossRef]
- Tscherko, D.; Rustemeier, J.; Richter, A.; Wanek, W.; Kandeler, E. Functional Diversity of the Soil Microflora in Primary Succession across Two Glacier Forelands in the Central Alps. Eur. J. Soil Sci. 2003, 54, 685–696. [Google Scholar] [CrossRef]
- Zumsteg, A.; Luster, J.; Göransson, H.; Smittenberg, R.H.; Brunner, I.; Bernasconi, S.M.; Zeyer, J.; Frey, B. Bacterial, Archaeal and Fungal Succession in the Forefield of a Receding Glacier. Microb. Ecol. 2012, 63, 552–564. [Google Scholar] [CrossRef] [PubMed]
- Uroz, S.; Tech, J.J.; Sawaya, N.A.; Frey-Klett, P.; Leveau, J.H.J. Structure and Function of Bacterial Communities in Ageing Soils: Insights from the Mendocino Ecological Staircase. Soil Biol. Biochem. 2014, 69, 265–274. [Google Scholar] [CrossRef]
- Tarlera, S.; Jangid, K.; Ivester, A.H.; Whitman, W.B.; Williams, M.A. Microbial Community Succession and Bacterial Diversity in Soils during 77 000 Years of Ecosystem Development. FEMS Microbiol. Ecol. 2008, 64, 129–140. [Google Scholar] [CrossRef]
- Fraterrigo, J.M.; Balser, T.C.; Turner, M.G. Microbial Community Variation and Its Relationship with Nitrogen Mineralization in Historically Altered Forests. Ecology 2014, 87, 570–579. [Google Scholar] [CrossRef]
- Turner, S.; Mikutta, R.; Meyer-Stüve, S.; Guggenberger, G.; Schaarschmidt, F.; Lazar, C.S.; Dohrmann, R.; Schippers, A. Microbial Community Dynamics in Soil Depth Profiles over 120,000 Years of Ecosystem Development. Front. Microbiol. 2017, 8, 874. [Google Scholar] [CrossRef]
- Mikutta, R.; Turner, S.; Schippers, A.; Gentsch, N.; Meyer-Stüve, S.; Condron, L.M.; Peltzer, D.A.; Richardson, S.J.; Eger, A.; Hempel, G.; et al. Microbial and Abiotic Controls on Mineral-Associated Organic Matter in Soil Profiles along an Ecosystem Gradient. Sci. Rep. 2019, 9, 10294. [Google Scholar] [CrossRef]
- Kleber, M.; Eusterhues, K.; Keiluweit, M.; Mikutta, C.; Mikutta, R.; Nico, P.S. Mineral-Organic Associations: Formation, Properties, and Relevance in Soil Environments; Elsevier Ltd.: Amsterdam, The Netherlands, 2015; Volume 130. [Google Scholar]
- Ortiz-Álvarez, R.; Fierer, N.; De Los Ríos, A.; Casamayor, E.O.; Barberán, A. Consistent Changes in the Taxonomic Structure and Functional Attributes of Bacterial Communities during Primary Succession. ISME J. 2018, 12, 1658–1667. [Google Scholar] [CrossRef]
- Pennanen, T. Microbial Communities in Boreal Coniferous Forest Humus Exposed to Heavy Metals and Changes in Soil PH—A Summary of the Use of Phospholipid Fatty Acids, Biolog® and 3H-Thymidine Incorporation Methods in Field Studies. Geoderma 2001, 100, 91–126. [Google Scholar] [CrossRef]
- Chodak, M.; Gołębiewski, M.; Morawska-Płoskonka, J.; Kuduk, K.; Niklińska, M. Soil Chemical Properties Affect the Reaction of Forest Soil Bacteria to Drought and Rewetting Stress. Ann. Microbiol. 2015, 65, 1627–1637. [Google Scholar] [CrossRef] [PubMed]
- Jangid, K.; Whitman, W.B.; Condron, L.M.; Turner, B.L.; Williams, M.A. Soil Bacterial Community Succession during Long-Term Ecosystem Development. Mol. Ecol. 2013, 22, 3415–3424. [Google Scholar] [CrossRef] [PubMed]
- Abakumov, E.; Trubetskoj, O.; Demin, D.; Celi, L.; Cerli, C.; Trubetskaya, O. Humic Acid Characteristics in Podzol Soil Chronosequence. Chem. Ecol. 2010, 26, 59–66. [Google Scholar] [CrossRef]
- Rastvorova, O.T.; Andreev, D.P. Preparation of soil samples for the analysis and methods of expressing the results of analysis. Theory Pract. Chem. Anal. Soils 2006, 1, 103–111. (In Russian) [Google Scholar]
- Vance, E.D.; Brookes, P.C.; Jenkinson, D.S. An extraction method for measuring soil microbial biomass C. Soil Biol. Biochem. 1987, 19, 703–707. [Google Scholar] [CrossRef]
- Lane, D.J. 16S/23S rRNA sequencing. In Nucleic acid Techniques in Bacterial Systematics; Stackebrandt, E., Goodfellow, M., Eds.; Wiley: New York, NY, USA, 1991; pp. 115–175. [Google Scholar]
- Yu, Y.; Lee, C.; Hwang, S. Analysis of community structures in anaerobic processes using a quantitative real-time PCR method. Water Sci. Technol. 2005, 52, 85–91. [Google Scholar] [CrossRef]
- Andronov, E.E.; Petrova, S.N.; Pinaev, A.G.; Pershina, E.V.; Rakhimgalieva, S.Z. Analysis of the structure of microbial community in soils with different degrees of salinization using T-RFLP and real-time PCR techniques. Eur. Soil Sci. 2012, 45, 147–156. [Google Scholar] [CrossRef]
- Bates, S.T.; Berg-Lyons, D.; Caporaso, J.G.; Walters, W.A.; Knight, R.; Fierer, N. Examining the Global Distribution of Dominant Archaeal Populations in Soil. ISME J. 2011, 5, 908–917. [Google Scholar] [CrossRef]
- Caporaso, J.G.; Kuczynski, J.; Stombaugh, J.; Bittinger, K.; Bushman, F.D.; Costello, E.K.; Fierer, N.; Peña, A.G.; Goodrich, J.K.; Gordon, J.I.; et al. QIIME allows analysis of high-throughput community sequencing data. Nat. Methods. 2010, 7, 335–336. [Google Scholar] [CrossRef]
- Bolger, A.M.; Lohse, M.; Usadel, B. Trimmomatic: A Flexible Trimmer for Illumina Sequence Data. Bioinformatics 2014, 30, 2114–2120. [Google Scholar] [CrossRef]
- Davis, N.M.; Proctor, D.M.; Holmes, S.P.; Relman, D.A.; Callahan, B.J. Simple Statistical Identification and Removal of Contaminant Sequences in Marker-Gene and Metagenomics Data. Microbiome 2018, 6, 226. [Google Scholar] [CrossRef] [PubMed]
- Lozupone, C.; Hamady, M.; Knight, R. UniFrac—An Online Tool for Comparing Microbial Community Diversity in a Phylogenetic Context. BMC Bioinform. 2006, 7, 371. [Google Scholar] [CrossRef]
- Pershina, E.V.; Ivanova, E.A.; Korvigo, I.O.; Chirak, E.L.; Sergaliev, N.H.; Abakumov, E.V.; Provorov, N.A.; Andronov, E.E. Investigation of the Core Microbiome in Main Soil Types from the East European Plain. Sci. Total Environ. 2018, 631–632, 1421–1430. [Google Scholar] [CrossRef]
- McMurdie, P.J.; Holmes, S. Phyloseq: An R Package for Reproducible Interactive Analysis and Graphics of Microbiome Census Data. PLoS ONE 2013, 8, e61217. [Google Scholar] [CrossRef] [PubMed]
- Clements, F.E. Nature and Structure of the Climax. J. Ecol. 1936, 24, 252. [Google Scholar] [CrossRef]
- Aristovskaya, T.V. The Microbiology of Podzolic Soils; Nauka: Moscow, Russia, 1965; 188p. [Google Scholar]
- Ponomareva, V.V. Theory of Podzolization; Israel Progr. Sci. Transr. Jerusalem; Nauka: Leningrad, Russia, 1969; 309p. [Google Scholar]
- Abakumov, E.; Polyakov, V.; Orlova, K. Podzol development on different aged coastal bars of Lake Ladoga. Tomsk State Univ. J. Biol. 2019, 48, 6–31. [Google Scholar] [CrossRef]
- Hillel, D.; Hatfield, J.H.; Powlson, D.S.; Rosenzweig, C.; Scow, K.M.; Singer, M.J.; Sparks, D.L. (Eds.) Encyclopedia of Soils in the Environment; Elsevier: Amsterdam, The Netherlands; Academic Press: Cambridge, MA, USA, 2005. [Google Scholar]
- Zhao, S.; Banerjee, S.; White, J.F.; Liu, J.J.; Zhou, N.; Tian, C.Y. High salt stress increases archaeal abundance and network connectivity in saline agricultural soils. Catena 2022, 217, 106520. [Google Scholar] [CrossRef]
- Cai, P.; Huang, Q.Y.; Zhang, X.W. Interactions of DNA with Clay Minerals and Soil Colloidal Particles and Protection against Degradation by DNase. Environ. Sci. Technol. 2006, 40, 2971–2976. [Google Scholar] [CrossRef]
- Ivanova, E.A.; Pershina, E.V.; Kutovaya, O.V.; Sergalieva, N.K.; Nagieva, A.G.; Zhiengaliev, A.T.; Provorov, N.A.; Andronov, E.E. Comparative analysis of microbial communities of contrasting soil types in different plant communities. Russ. J. Ecol. 2018, 49, 30–39. [Google Scholar] [CrossRef]
- Ivanova, E.A.; Kutovaya, O.V.; Tkhakakhova, A.K.; Chernov, T.I.; Pershina, E.V.; Markina, L.G.; Andronov, E.E.; Kogut, B.M. The Structure of Microbial Community in Aggregates of a Typical Chernozem Aggregates under Contrasting Variants of Its Agricultural Use. Eur. Soil Sci. 2015, 48, 1242–1256. [Google Scholar] [CrossRef]
- Zhou, J.; Xia, B.; Huang, H.; Treves, D.S.; Hauser, L.J.; Mural, R.J.; Palumbo, A.V.; Tiedje, J.M. Bacterial Phylogenetic Diversity and a Novel Candidate Division of Two Humid Region, Sandy Surface Soils. Soil Biol. Biochem. 2003, 35, 915–924. [Google Scholar] [CrossRef]
- Moreno-Espíndola, I.P.; Ferrara-Guerrero, M.J.; Luna-Guido, M.L.; Ramírez-Villanueva, D.A.; De León-Lorenzana, A.S.; Gómez-Acata, S.; González-Terreros, E.; Ramírez-Barajas, B.; Navarro-Noya, Y.E.; Sánchez-Rodríguez, L.M.; et al. The Bacterial Community Structure and Microbial Activity in a Traditional Organic Milpa Farming System under Different Soil Moisture Conditions. Front. Microbiol. 2018, 9, 2737. [Google Scholar] [CrossRef] [PubMed]
- Silveira Sartori Silva, M.R.; Pereira de Castro, A.; Krüger, R.H.; Bustamante, M. Soil Bacterial Communities in the Brazilian Cerrado: Response to Vegetation Type and Management. Acta Oecologica 2019, 100, 103463. [Google Scholar] [CrossRef]
- Lauber, C.L.; Hamady, M.; Knight, R.; Fierer, N. Pyrosequencing-Based Assessment of Soil PH as a Predictor of Soil Bacterial Community Structure at the Continental Scale. Appl. Environ. Microbiol. 2009, 75, 5111–5120. [Google Scholar] [CrossRef]
- Chan, O.C.; Yang, X.; Fu, Y.; Feng, Z.; Sha, L.; Casper, P.; Zou, X. 16S RRNA Gene Analyses of Bacterial Community Structures in the Soils of Evergreen Broad-Leaved Forests in South-West China. FEMS Microbiol. Ecol. 2006, 58, 247–259. [Google Scholar] [CrossRef] [PubMed]
- Yeoh, Y.K.; Dennis, P.G.; Paungfoo-Lonhienne, C.; Weber, L.; Brackin, R.; Ragan, M.A.; Schmidt, S.; Hugenholtz, P. Evolutionary Conservation of a Core Root Microbiome across Plant Phyla along a Tropical Soil Chronosequence. Nat. Commun. 2017, 8, 215. [Google Scholar] [CrossRef] [PubMed]
- Naz, I.; Mirza, M.; Bano, A. Molecular Characterization of Rhizosphere Bacterial Communities Associated With Wheat (Triticum aestivum L.) Cultivars at flowering stage. JAPS J. Anim. Plant 2014, 24, 1123–1134. [Google Scholar]
- Chen, J.; Xu, D.; Chao, L.; Liu, H.; Bao, Y. Microbial Assemblages Associated with the Rhizosphere and Endosphere of an Herbage, Leymus Chinensis. Microb. Biotechnol. 2020, 13, 1390–1402. [Google Scholar] [CrossRef]
- Pankratova, E.M. Functioning of cyanobacteria in soil ecosystems. Eur. Soil Sci. 2006, 39 (Suppl. 1), S118–S127. [Google Scholar] [CrossRef]
- Harantová, L.; Mudrák, O.; Kohout, P.; Elhottová, D.; Frouz, J.; Baldrian, P. Development of Microbial Community during Primary Succession in Areas Degraded by Mining Activities. Land Degrad. Dev. 2017, 28, 2574–2584. [Google Scholar] [CrossRef]
- Mehmood, M.A.; Fu, Y.; Zhao, H.; Cheng, J.; Xie, J.; Jiang, D. Enrichment of bacteria involved in the nitrogen cycle and plant growth promotion in soil by sclerotia of rice sheath blight fungus. Stress Biol. 2022, 2, 32. [Google Scholar] [CrossRef] [PubMed]
- Stursová, M.; Zifčáková, L.; Leigh, M.B.; Burgess, R.; Baldrian, P. Cellulose utilization in forest litter and soil: Identification of bacterial and fungal decomposers. FEMS Microbiol. Ecol. 2012, 80, 735–746. [Google Scholar] [CrossRef]
- Waksman, S.A. Decomposition of the various chemical constituents etc of complex plant materials by pure cultures of fungi and bacteria. Arch. Mikrobiol. 1931, 2, 136–154. [Google Scholar] [CrossRef]
- Yin, C.; Mueth, N.; Hulbert, S.; Schlatter, D.; Paulitz, T.C.; Schroeder, K.; Prescott, A.; Dhingra, A. Bacterial Communities on Wheat Grown under Long-Term Conventional Tillage and No-till in the Pacific Northwest of the United States. Phytobiomes J. 2017, 1, 83–90. [Google Scholar] [CrossRef]
- Bárta, J.; Tahovská, K.; Šantrůčková, H.; Oulehle, F. Microbial Communities with Distinct Denitrification Potential in Spruce and Beech Soils Differing in Nitrate Leaching. Sci. Rep. 2017, 7, 9738. [Google Scholar] [CrossRef] [PubMed]
- Bedogni, G.L.; Massello, F.L.; Giaveno, A.; Donati, E.R.; Urbieta, M.S. A Deeper Look into the Biodiversity of the Extremely Acidic Copahue Volcano-Río Agrio System in Neuquén, Argentina. Microorganisms 2020, 8, 58. [Google Scholar] [CrossRef]
- Opelt, K.; Berg, G. Biodiversity and Antagonistic Potential of Bacteria Associated with Bryophytes from Nutrient-Poor Habitats of the Baltic Sea Coast. Appl. Environ. Microbiol. 2004, 70, 6569–6579. [Google Scholar] [CrossRef]


Disclaimer/Publisher’s Note: The statements, opinions and data contained in all publications are solely those of the individual author(s) and contributor(s) and not of MDPI and/or the editor(s). MDPI and/or the editor(s) disclaim responsibility for any injury to people or property resulting from any ideas, methods, instructions or products referred to in the content. |
© 2024 by the authors. Licensee MDPI, Basel, Switzerland. This article is an open access article distributed under the terms and conditions of the Creative Commons Attribution (CC BY) license (https://creativecommons.org/licenses/by/4.0/).