Abstract
Interest in improving the long-term sustainability of agricultural production systems has focused on identifying management practices that promote soil health. No tillage, cover cropping, and amending soils with broiler (Gallus gallus domesticus L.) litter are commonly adopted conservation practices that have been shown to improve soil fertility and crop yield. However, the overall influence of these conservation practices on soil health in the southeastern US are not well understood. Thus, a study was conducted to evaluate the influence of tillage, broiler litter (BL) applications, and cropping systems on soil biochemical properties. Soils were collected from field research plots under long-term management (>than 25 years of tillage, 15 years of broiler litter application, and 15 years of cropping system). Soil microbial biomass, C, N, and P, amidohydrolases, and dissolved organic matter (DOM) were evaluated as indicators of soil health. Adopting tillage and BL into the agricultural management system modified the biochemical parameters of the soils evaluated. Most of these modifications occurred in the 0–5 cm depth. Higher microbial biomass carbon (MBC; 85%) and nitrogen (MBN; 10%) and enzyme activities of asparaginase (65%) and glutaminase (70%) were observed in the 0–5 cm depth under no tillage (NT) compared to conventional tillage (CT), indicating greater biological activities were established in these soil ecosystems. Broiler litter applications increased microbial biomass N and activities of asparaginase and glutaminase in both soil depths. In addition, microbial biomass phosphorus (MBP) was increased following BL application in the 0–5 cm depth. The results suggest that long-term management of NT and BL additions can improve the health of eroded southeastern US soils by altering the soil biochemical parameters.
1. Introduction
Sustainability of intensive crop production will depend on the implementation of agricultural systems that promote soil health and environmental quality [1]. These agricultural systems will most likely consist of employing conservation practices (systems that conserve soil nutrients) with both inorganic and organic fertilizer inputs to ensure high crop productivity. However, the vitality of these agricultural systems will depend on the functions of belowground biological processes in soil [2,3]. For example, soil microbes control the turnover of carbon, nitrogen, and phosphorus through the decomposition of plant and animal residues and mobilization of organic carbonates, nitrates, and phosphates via extracellular enzymes. Thus, to understand the influence that different conservation practices have on the overall health of sustainable production systems, there is a need to evaluate belowground biochemical processes in soil.
Soil microbes are the living components of soil organic matter (SOM). They play key roles in maintaining a healthy soil by regulating the rate of plant and animal residue decomposition and nutrient availability. To help do this, soil microbes secrete extracellular enzymes that catalyze the decomposition of organic material (plant and animal residue) into nutrients which are accessible in soil. Once nutrients are made mobile, a portion of these decomposed organic substrates are immobilized in microbial cells (microbial biomass) for energy and resources, whereas the remaining portion is turned over, thereby affecting nutrient accessibility in soil [4,5]. Hydrolases in soil are also of importance because these enzymes are the main drivers mediating the processes involved in organic matter decomposition, mineralization, and nutrient cycling for the microbial biomass [6]. Thus, evaluating biochemical parameters reflective to a soil’s microbial biomass and its enzymatic activity are often used as sensitive indicators of how changes to crop management practices can influence the overall health of a production system [7,8,9,10].
Soil organic matter is one of the most widely accepted indicators for determining the overall quality and health of a soil [11]. A small portion of organic matter can be found in a soil solution’s liquid phase, called the dissolved organic matter (DOM). The DOM portion of a SOM fraction serves as a nutrient and energy source for microbes and their functions in the biogeochemical carbon cycle [12,13,14]. Understanding the interaction between soil microorganisms and DOM, which enables nutrient availability, is fundamental to the sustainability of a healthy soil system. Thus, DOM can be used as an indicator of changes in soil processes.
Historically, soils in the southeastern US have been conventionally tilled and supplemented with inorganic fertilizers. These agrarian practices have left the soil relatively infertile, highly eroded, and low in OM [15]. During the last decade of the twentieth century, conservation agricultural practices such as no tillage were widely adopted to combat soil [16] and nutrient loss [17]. Cover crop planting was encouraged as opposed to leaving agricultural fields fallow during winter months to protect the soil surface from erosion [16], promote moisture retention [18], and improve SOM and nutrient retention [18]. Broiler litter additions were promoted in regions of broiler production as a low-cost alternative nutrient source for crop production and to increase SOM reserves in degraded soils [19,20,21]. A number of studies have shown the benefits of conservation tillage and manure additions on soil physical and chemical properties, water conservation, crop yields, and economics [21,22]. However, little research has examined the benefits of these conservation practices on belowground biochemical properties, which can be used as an index of soil health, from soils in the southeast.
Corn and soybean production dominates the US agricultural landscape [23,24,25]; however, there is limited research on the influence of these crops on soil health in the southeastern US, where cotton production has been dominant until recently. In addition, increasing demand for corn and soybean production for food and biofuel production has intensified crop production in recent years. In order to develop new prescriptions for land practitioners wanting to achieve sustainable crop production through improved soil health, more region-specific information is needed on the influence that different conservation practices may have on the soil health of intensive crop production systems. Understanding the overall benefits that these conservation practices may have on soil health can only be achieved from a comprehensive understanding of the long-term function of these agricultural systems. Therefore, our objective was to investigate the soil biochemical effects of conventional tillage (CT) vs. no tillage (NT), as well as BL applications and corn vs. soybean cropping systems with and without winter cover. The present investigation is from a broader study evaluating the influence of a long-term cropping system, tillage, and BL applications on soil properties of an Alabama Ultisol [26].
2. Materials and Methods
2.1. Site Description and Experimental Design
A description of the research site and experimental design was reported in an earlier publication [26]. Briefly, this long-term field study was established in northwest Alabama during the fall of 1979 at the Alabama Agricultural Experiment Station’s Sand Mountain Research and Extension Center (34°18′ N, 86°01′ W), where there is an elevation of 345 m near Crossville. The soil type is classified as a Hartsells fine sandy loam (a fine, loamy, siliceous, sub-active, thermic Typic Hapludult [27]. These soils have a dark grayish brown color. More specifically, this soil has an average particle size distribution of 600 g kg−1 sand, 300 g kg−1 silt, and 100 g kg−1 clay. This region has a humid subtropical climate with an annual precipitation of 1377 mm and temperature of 15 °C. Broiler production is the largest agricultural enterprise in this region with BL often being used as a low-cost nutrient source to fertilize nearby pastures and some row crops such as corn and cotton.
This experiment followed a split–split plot treatment structure with a randomized complete block design of two tillage treatments, four cropping systems, and two fertilization treatments, replicated four times. The main plots were tillage treatments (CT vs. NT), the split plots were cropping systems, and the split–split plots (5.49 m by 7.62 m) were fertilization treatments (with and without broiler litter). The cropping systems were continuous corn (Zea mays L.) (C), continuous soybean (Glycine max L.) (S), continuous corn with wheat (Triticum aestivum L.), cover crop (C/W), and continuous soybean with wheat cover crop (S/W). Both the corn and soybean plots had six rows planted at 0.76 m spacings. Initially, the CT plots received moldboard plowing and disking, followed by rototilling in spring. In 2003, mold board plowing was discontinued, but disking and rototilling continued. The NT plots consisted of planting into existing crop residues. Broiler litter was applied from 1991 to 2016. A list of treatments can be found in Table 1. The fertilization information is provided in Table 2.

Table 1.
Description of treatments used in this study.
Table 2.
Annual nutrients supplied by broiler litter fertilization for each cropping system during an application year for given time periods.
Soil samples were collected in January of 2016 by compositing 8 cores (25 mm inner diameter) from two depths (0–5 and 5–10 cm) of each plot. Afterwards, these soils were placed in polyethylene bags and immediately put in a cooler for transportation to the laboratory. Once at the laboratory, the samples were stored at 4 °C until needed for analysis.
2.2. Microbial Biomass Carbon, Nitrogen, and Phosphorus
Soil microbial biomass carbon (MBC), a quantifiable soil labile carbon fraction used to measure the biological activity in soil, was estimated using the chloroform fumigation–incubation method as described by Franzluebbers et al. [28]. Field moist soil was fumigated with ethanol-free chloroform for 24 h and placed in a 1 L jar containing beakers with 2 mL of 0.5 mol L−1 NaOH and 20 mL water. After incubating the soil for 10 d, the CO2 absorbed in NaOH was back-titrated using BaCl2 and HCl. Microbial biomass concentration was calculated by dividing the amount of CO2–C absorbed in NaOH by a factor of 0.41 [29] after subtracting the values from the nonfumigated control [30].
To determine microbial biomass nitrogen (MBN), which is a crucial participant in soil N cycling [31], 10 g of fumigated incubated soil after 10 d was extracted with 50 mL of 0.5 M K2SO4 for 1 h (1:5 Wt/V ratio). The extracted organic N and NH4–N was oxidized to NO3–N by persulfate [32]. Afterwards, the N concentration was determined using an ammonium nitrate analyzer (Timberline instrument, model no. TL-2800: Timberline Instrument, Boulder, CO, USA). Microbial biomass N was calculated as the difference between NO3–N concentrations in the sample before and after fumigation–incubation and divided by a factor of 0.41 [33].
To determine microbial biomass P (MBP), which is one of the most active forms of phosphorus (P) in soils [34], 10 g of fumigated incubated soil after 10 d was extracted with 50 mL of 0.5 M NaHCO3 (1:5 Wt/V ratio). Microbial biomass P was calculated as the difference in the amount of inorganic P extracted (0.5 M NaHCO3) from fumigated soils and the amount extracted from unfumigated soils [35,36].
2.3. Amidohydrolases Determination
Various enzymes involved in N mineralization were assayed according to the protocols described in the Methods of Soil Analysis, Part 2: Microbiological and Biochemical Properties, Soil Science Society of America Book Series [37]. The amidohydrolase activity of each sample was assayed by incubating 5 g of soil, 0.2 mL toluene, and 9 mL of 0.1 mol/L THAM buffer (pH 10 for asparaginase and glutaminase; pH 9 for urease; and pH 8.5 for amidase and aspartase), and 1 mL 0.5 mol/L substrate (i.e., L-asparagine, L-glutamine, urea, acetamide, or L-aspartate) at 37 °C for 2 h. After incubation, 35 mL of KCl (2.5 mol/L)–Ag2SO4 (100 ppm) solution was added to stop the activity. The resultant mixture was then filtered and analyzed for ammonium release using an ammonium nitrate analyzer (Timberline instrument, model no. TL-2800: Timberline Instrument, Inc., Boulder, CO, USA). This amidohydrolase activity was expressed as the g NH4+ released per g of dry soil.
2.4. Dissolved Organic Matter (DOM) Components
Four key DOM constituents (i.e., phenols, hexoses, free amino acids, and proteins) were analyzed using the method described by Chantigny et al. [38]. Dissolved organic matter is considered as one of the labile fractions of natural organic matter and plays an important role in the ecological dynamics and cycling of nutrients [14]. The extractions were conducted by preparing a homogeneous slurry mixture using 5 g of moist soil and 10 mL of 5 mM CaCl2 solution in a 50 mL centrifuge tube. The solution was centrifuged at 12,000× g for 10 min. The supernatant was vacuum filtered through a 0.4 µm polycarbonate filter, and then the filtrate was transferred into a glass vial and stored at 4 °C until analysis. A more in-depth description of how the reagents and solutions were determined for the determination of phenol, hexoses, free amino acids, and proteins can be found in the Supplemental Materials.
2.5. Statistical Analysis
The statistical language R was used for data analysis and plotting. Tukey’s honestly significant difference (HSD) test from the R library “agricolae” was used for contrast analyses of crop management treatments [39]. Contrast comparisons were conducted to determine the effects of tillage treatments (CT vs. NT), cropping systems (C vs. CW, C vs. S, C vs. SW, CW vs. S, CW vs. SW, S vs. SW), and fertilization practices (−L vs. +L) on soil properties. The treatments within a tillage plot (C − L vs. C + L vs. C/WL vs. C/W + L vs. S − L vs. S + L vs. S/W − L vs. S/W + L) for each soil attribute were also compared for significance. Pairwise correlation coefficients were calculated to determine the relationships between soil properties. The significance of these correlation coefficients was checked at p levels of 0.1, 0.05, 0.01, and 0.001 [40]. Data in the figures are presented as the average of field tetraplicates, and error bars represent standard deviations. Significant differences were observed between the 0–5 and 5–10 cm depths for the biochemical parameters evaluated; thus, data are presented by depth.
3. Results
3.1. Microbial Biomass Parameters
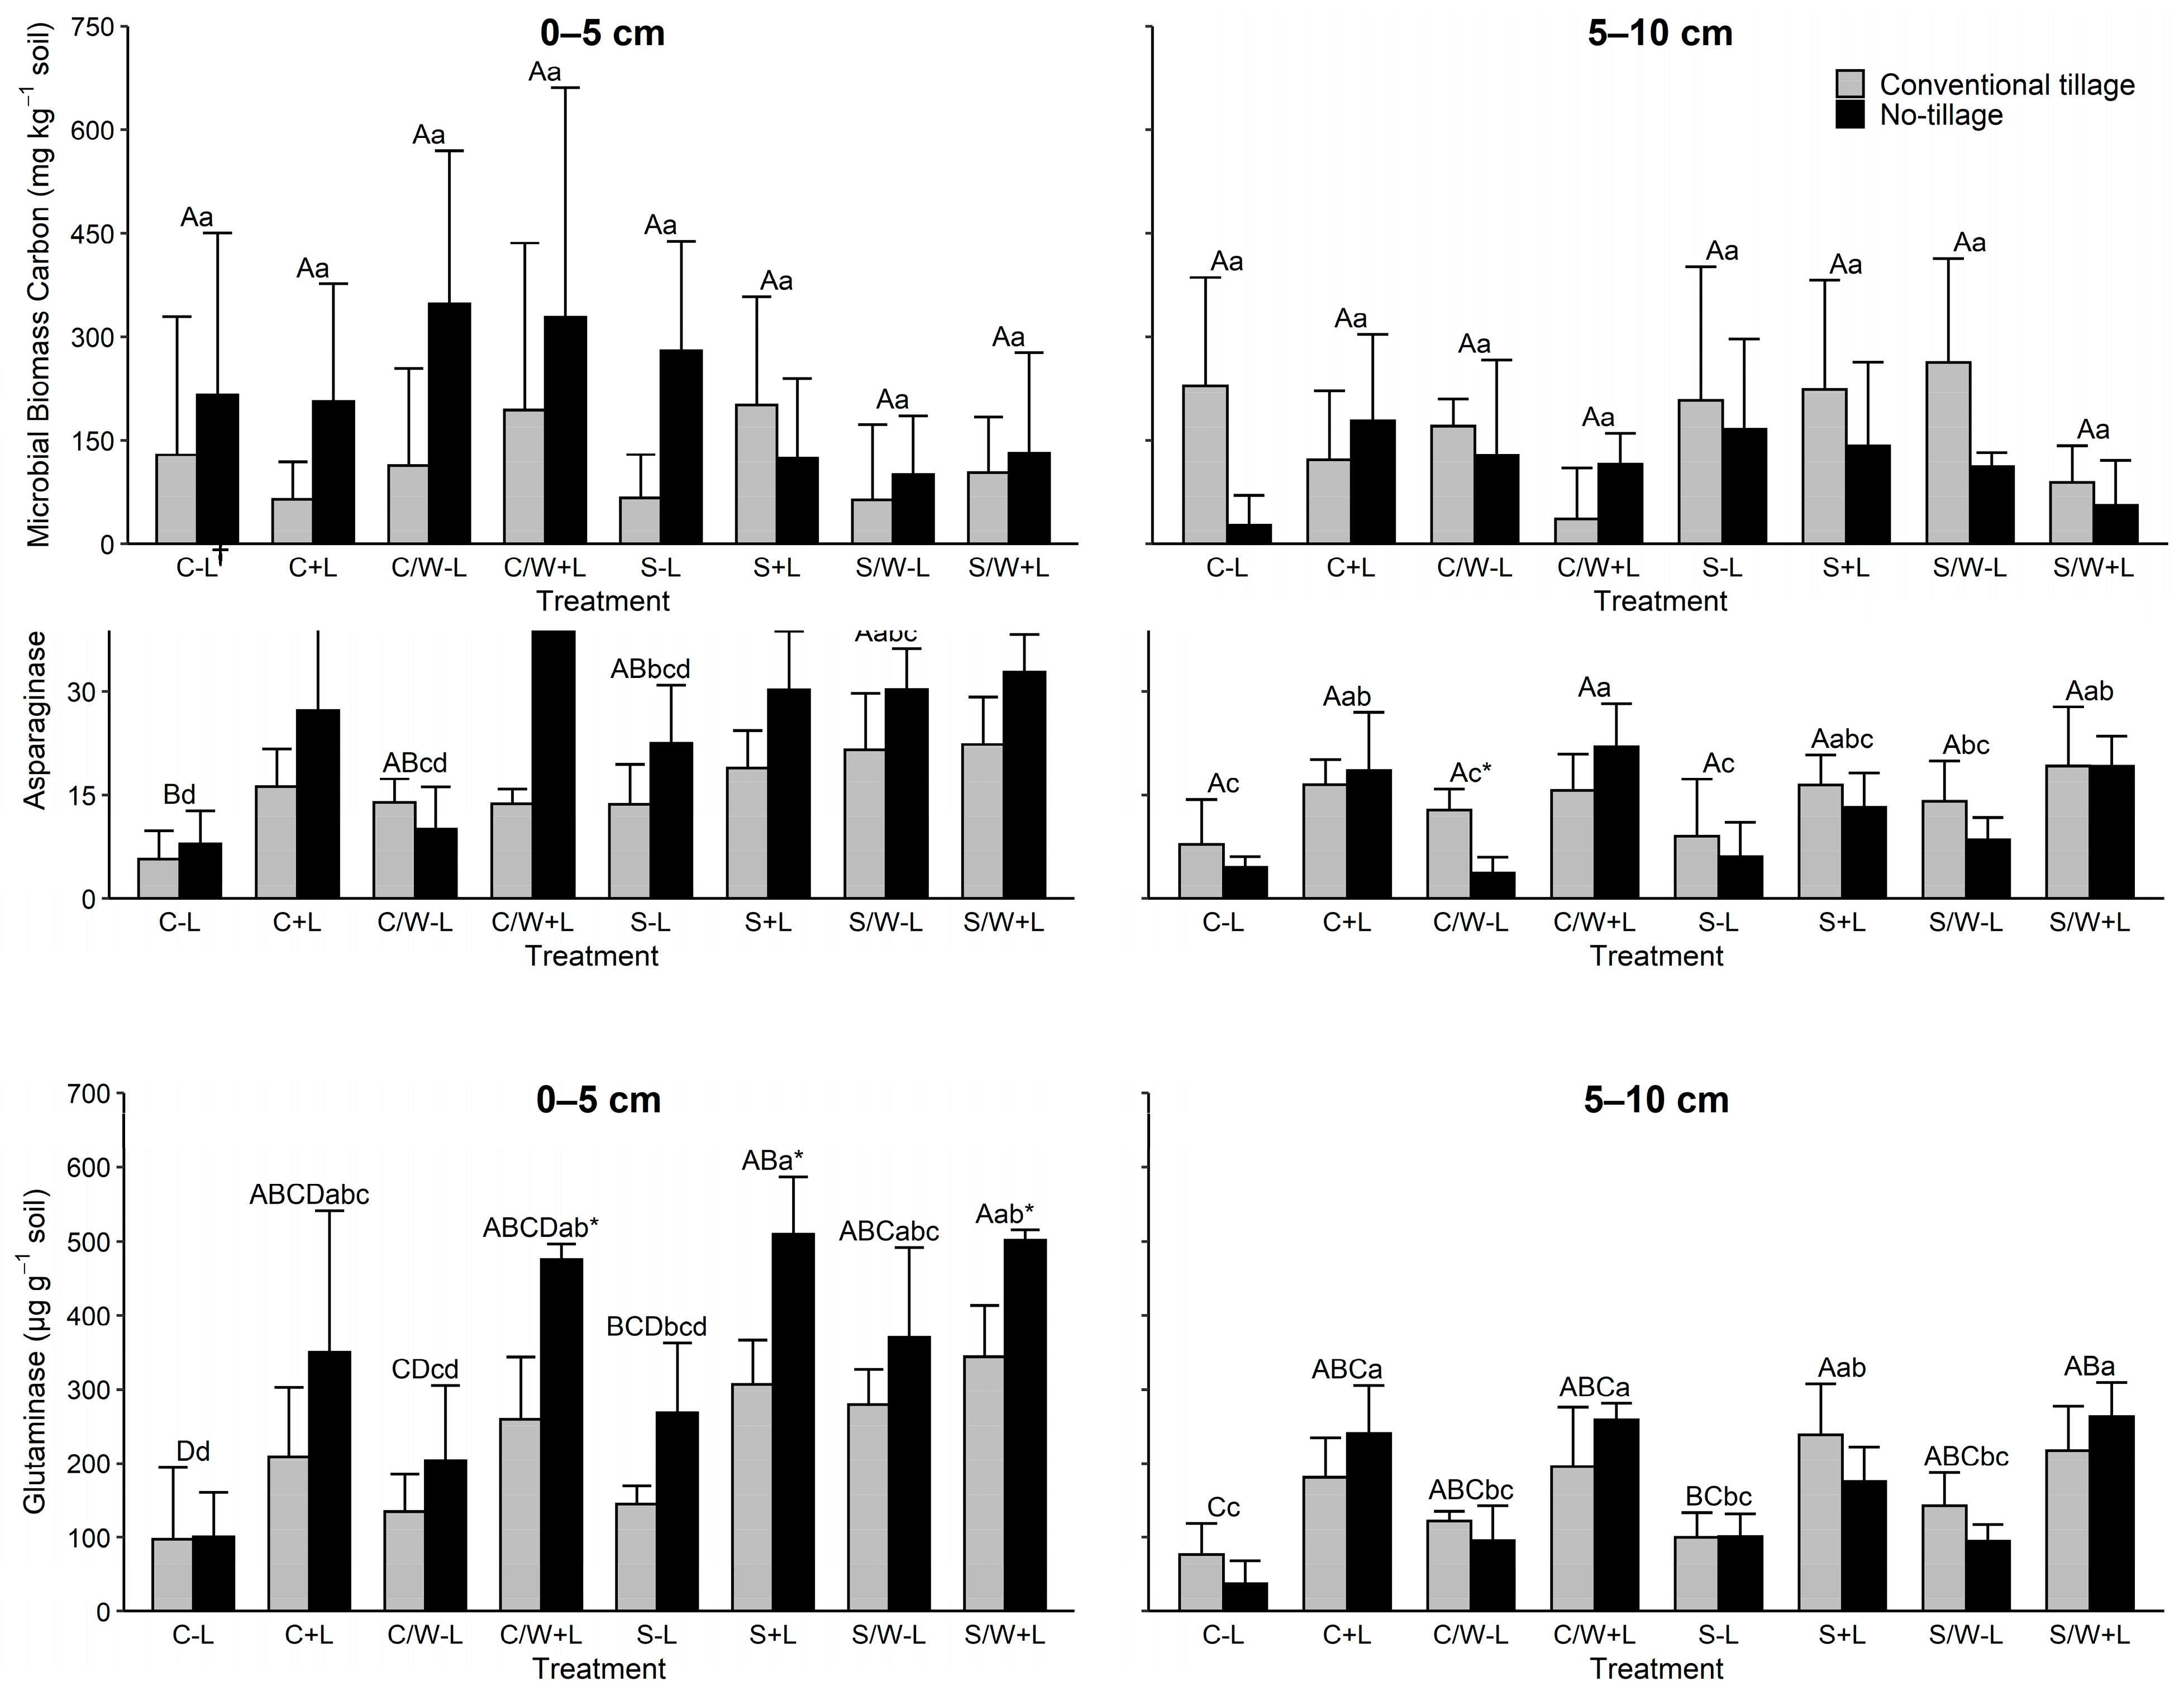
Soil microbial biomass carbon (MBC) varied greatly across the 0–5 cm and 5–10 cm soil depths (Figure 1). Microbial biomass C concentrations were significantly influenced (p ≤ 0.10) only at the 0–5 cm depth by tillage, with no tillage having 85.2% more MBC than that of conventional tillage. The MBC was not influenced by BL additions in either the 0–5 or 5–10 cm depths. Only the CW vs. SW cropping system was significant for MBC.
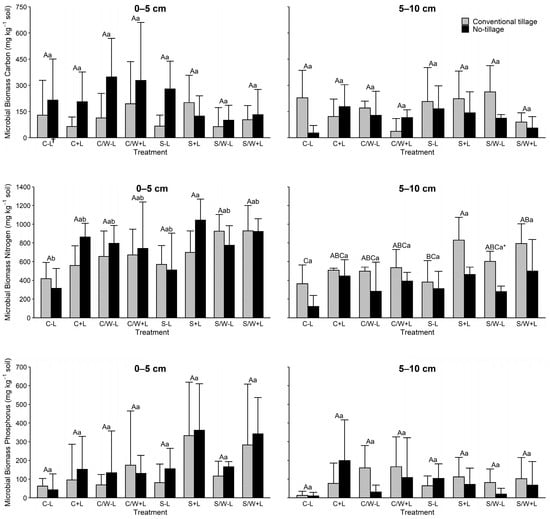
Figure 1.
Soil microbial biomass carbon (MBC), microbial biomass nitrogen (MBN), and microbial biomass phosphorus (MBP) levels in the 0–5 and 5–10 cm soil layers as affected by management practice. The data presented are means with standard deviation (n = 4). Different capital letters indicate significant (p < 0.05) differences between conventional tillage treatments, different lowercase letters indicate significant (p < 0.05) differences between no tillage treatments, and * indicates a significant (p < 0.05) difference between conventional tillage and no tillage under the same cropping and fertilization system. See Table 1 for the treatment abbreviations. † C − L, corn with synthetic fertilizer; C + L, corn with broiler litter (BL) application; C/W − L corn–wheat cover crop with synthetic fertilizer; C/W + L, corn–wheat cover crop with BL application; S − L, soybean with synthetic fertilizer; S + L, soybean with BL application; S/W − L, soybean–wheat cover crop with synthetic fertilizer, S/W + L, soybean–wheat cover crop with BL application.
Soil microbial biomass nitrogen (MBN) was affected in both soil depths by some of the agricultural management practices evaluated (Figure 1). Tillage influenced soil MBN (p ≤ 0.10) in both soil depths (Table 3). Averaged across treatments, no tillage had the greatest MBN in the 0–5 cm depth, while conventional tillage was greater in the 5–10 cm depth. The MBN was 10% higher in NT at the 0–5 cm and 61% higher in CT at the 5–10 cm depth. In both soil layers, MBN was significantly increased with BL applications (in most but not all BL-applied soils) compared to treatments without BL (Table 3). On average, BL increased soil MBN by 11.3% and 44.4% with CT in the 0–5 cm and 5–10 cm layers, respectively, and by 49.2% and 81.0% with NT in the corresponding soil depths, respectively. When evaluating the influence of tillage by fertilization, NT decreased soil MBN by 46.1% and 32.5% in no-BL and BL-amended soils, respectively. Cropping systems, for the most part, did not have a great effect on MBN in the lower depth except for C vs. SW, while a number of differences were observed among cropping systems in the 0–5 cm.
Table 3.
Contrast comparison p values of the main effects of tillage, cropping systems, and fertilization practices on the microbial biomass carbon (MBC), microbial biomass nitrogen (MBN), microbial biomass phosphorus (MBP), protein, amino acid, amidohydrolase activities (amidase, asparaginase, and glutaminase), phenol, and hexose obtained from an Alabama soil.
Soil microbial biomass phosphorus (MBP) was most noticeably impacted by fertilization regardless of the soil depth being evaluated (Figure 1). On average, MBP increased by 126% and 87% in the 0–5 cm and 5–10 cm depths, respectively. From evaluating fertilization by tillage, the application of BL increased MBP from 82.13 to 221.36 mg kg−1 for CT and from 124.61 to 246.83 mg kg−1 for NT in the 0–5 cm depth and from 79.84 to 114.4 mg kg−1 for CT and from 41.15 to 111.94 for NT at the 5–10 cm depth. Neither tillage nor cropping system significantly influenced MBP in either soil depth (Table 3).
3.2. Proteins and Amino Acids
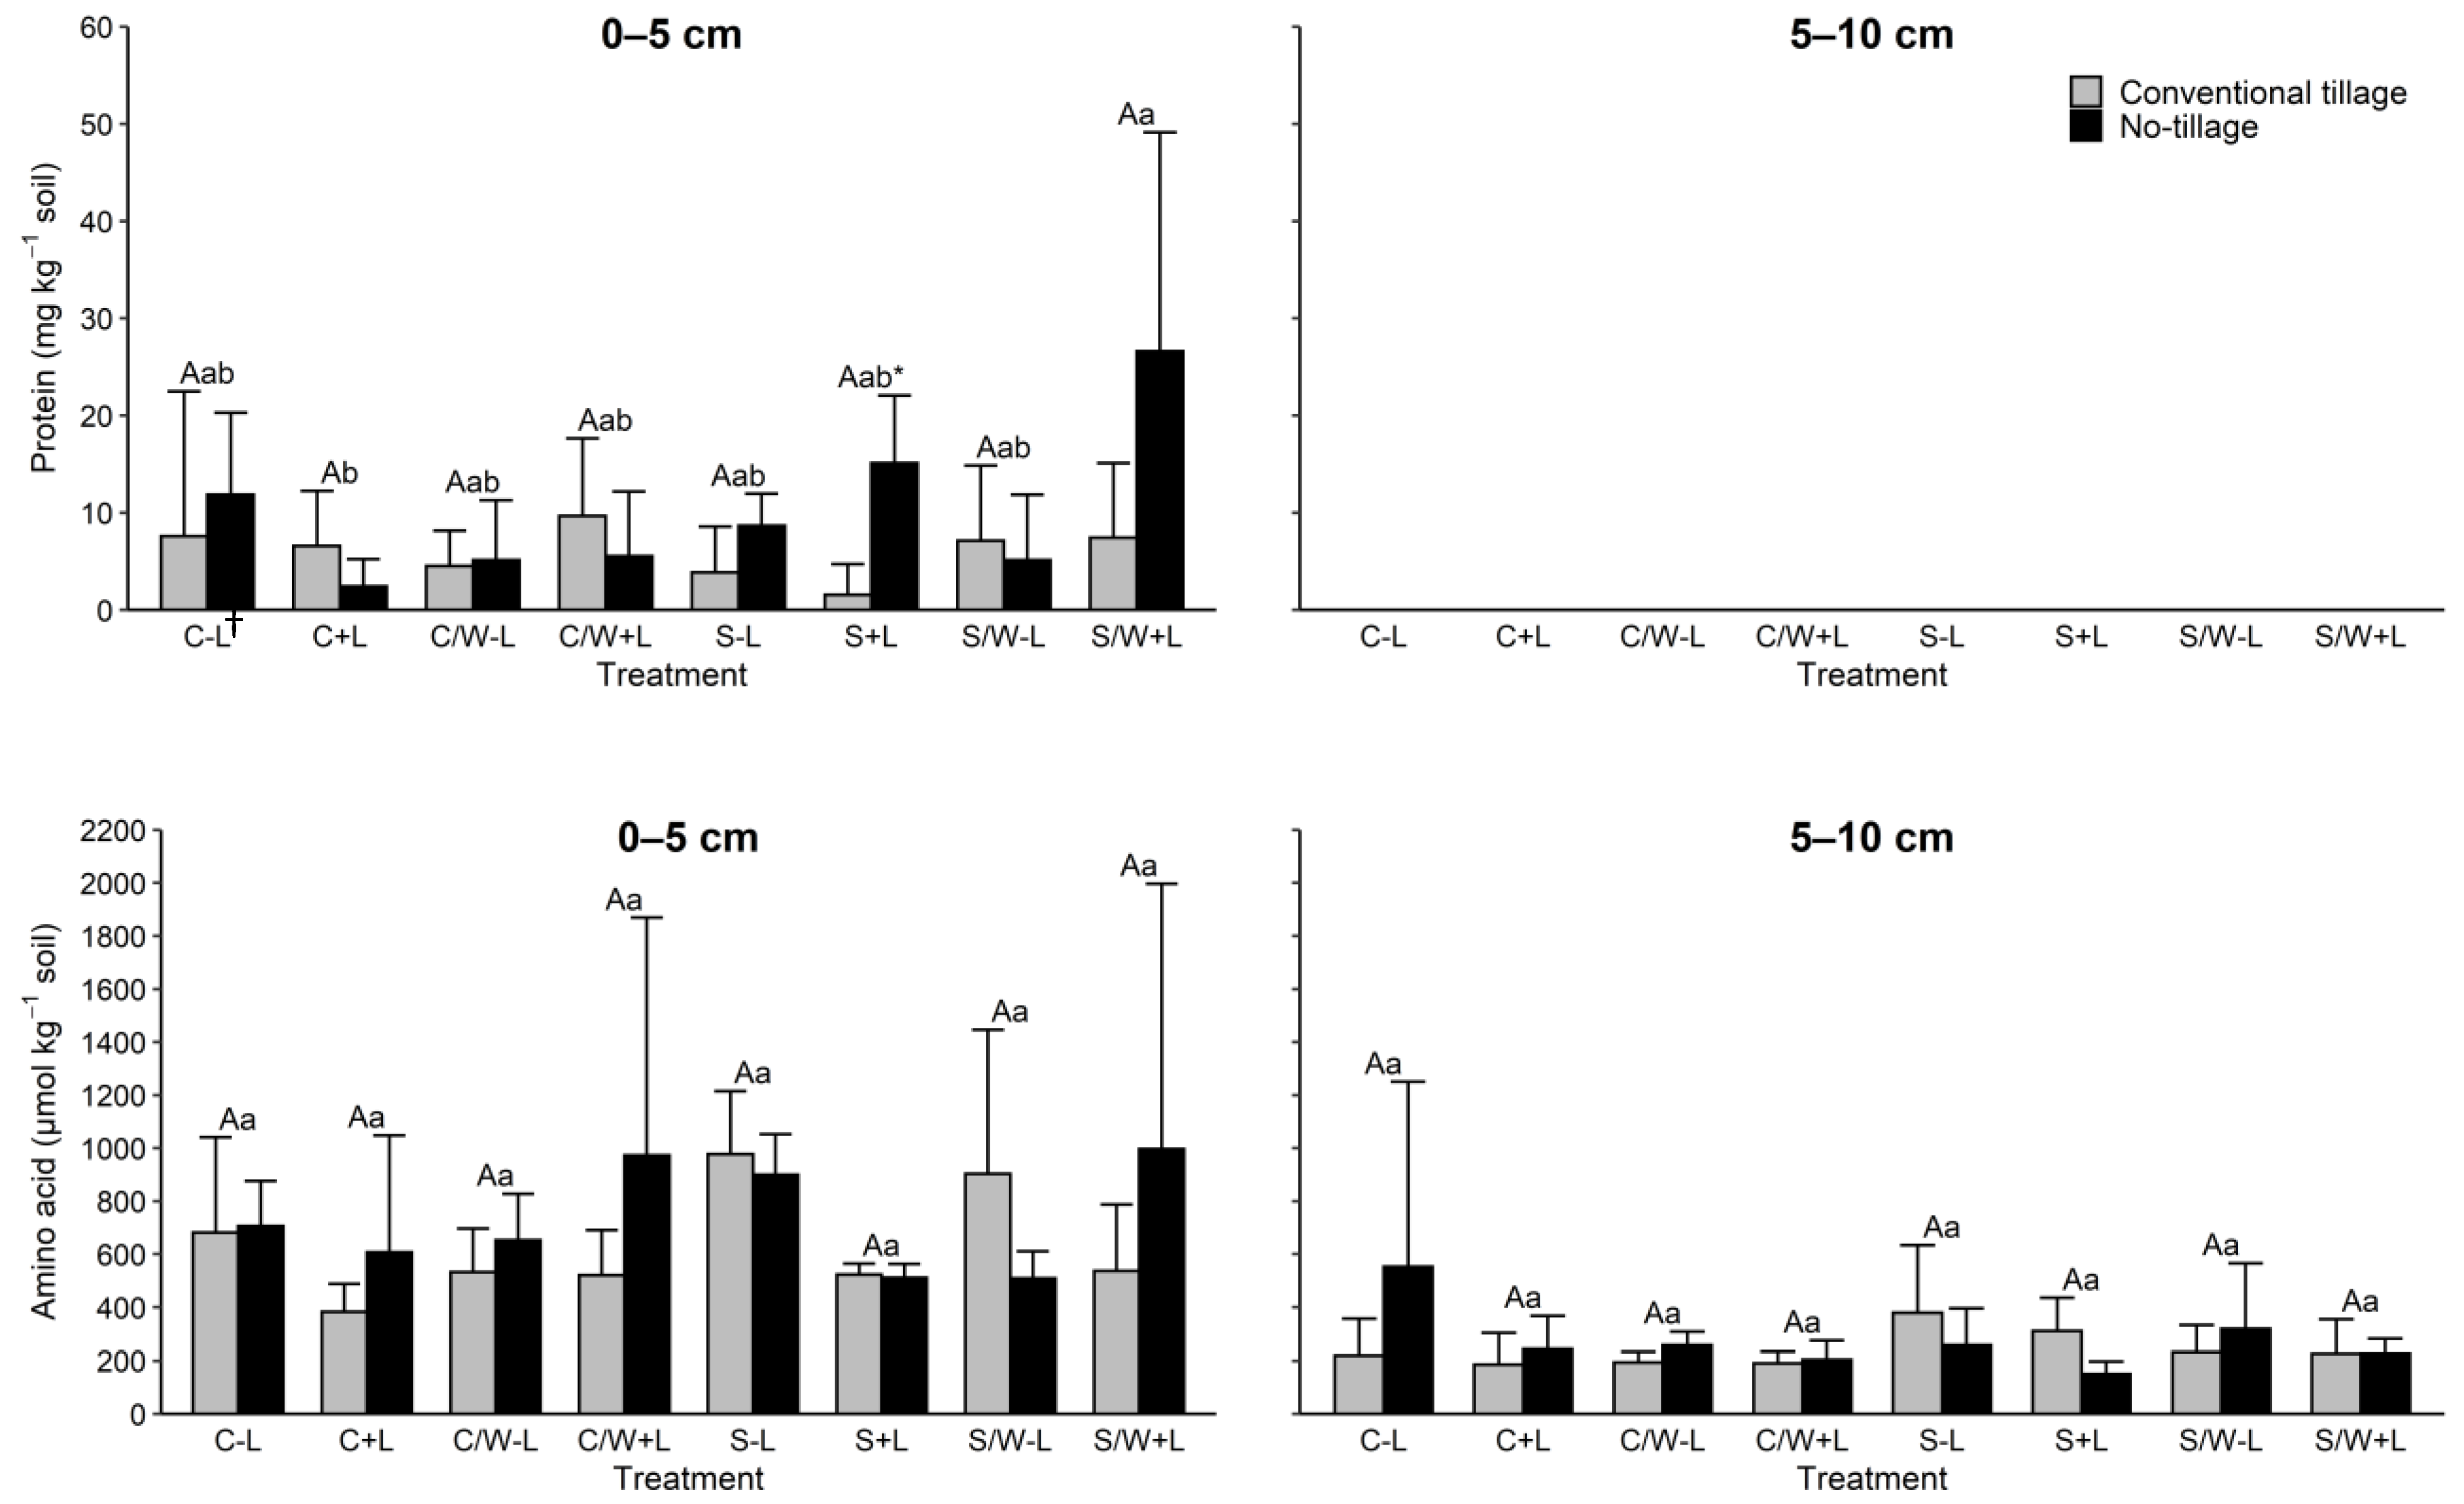
Soil protein concentrations were not clearly affected by management practice (Figure 2). The effects of tillage and fertilization on protein amounts were not significant (Table 3). Protein level was also largely unaffected by cropping systems except for tillage S + L vs. no-tillage S + L. Notably, no protein was observed in the 5–10 cm soil layer.
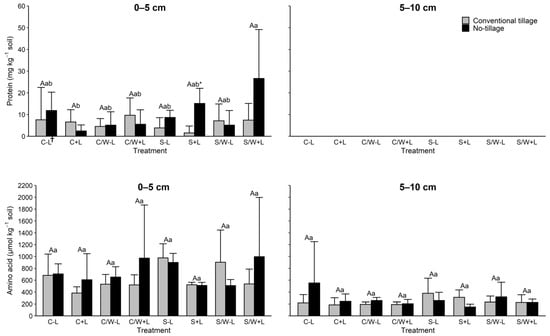
Figure 2.
Concentrations of protein and amino acid in the 0–5 and 5–10 cm soil layers as affected by management practice. The data presented are means with standard deviation (n = 4). Different capital letters indicate significant (p < 0.05) differences between conventional tillage treatments, different lowercase letters indicate significant (p < 0.05) differences between no tillage treatments, and * indicates a significant (p < 0.05) difference between conventional tillage and no tillage under the same cropping and fertilization system. Concentrations of protein in the 5–10 cm soil layer were below the detection limit for all treatments. † C − L, corn with synthetic fertilizer; C + L, corn with broiler litter (BL) application; C/W − L corn–wheat cover crop with synthetic fertilizer; C/W + L, corn–wheat cover crop with BL application; S − L, soybean with synthetic fertilizer; S + L, soybean with BL application; S/W − L, soybean–wheat cover crop with synthetic fertilizer, S/W + L, soybean–wheat cover crop with BL application.
Soil amino acid concentrations within each soil depth for tillage and fertilization were statistically equivalent (Figure 2). Contrast analyses also revealed no significant effect by any of the tillage, cropping system, or fertilization application treatments, indicating no meaningful difference between these practices with respect to the effect of amino acid (Table 3).
3.3. Amidohydrolases
Amidase activity in soil was largely unaffected by tillage and fertilization in both soil depths evaluated (Figure 3). In the uppermost soil depth, amidase activity was influenced by C vs. S and CW vs. S (Table 3). In the lower soil depth, it was only affected by S vs. SW (Table 3).

Figure 3.
Amidase, asparaginase, and glutaminase activities in the 0–5 and 5–10 cm soil layers as affected by management practice. The data presented are the means with standard deviation (n = 4). Different capital letters indicate significant (p < 0.05) differences between conventional tillage treatments, different lowercase letters indicate significant (p < 0.05) differences between no tillage treatments, and * indicates a significant (p < 0.05) difference between conventional tillage and no tillage under the same cropping and fertilization system. † C − L, corn with synthetic fertilizer; C + L, corn with broiler litter (BL) application; C/W − L corn–wheat cover crop with synthetic fertilizer; C/W + L, corn–wheat cover crop with BL application; S − L, soybean with synthetic fertilizer; S + L, soybean with BL application; S/W − L, soybean–wheat cover crop with synthetic fertilizer, S/W + L, soybean–wheat cover crop with BL application.
Asparaginase activity in the 0–5 cm depth showed a clear trend of a response to management treatments (Figure 3). Asparaginase activity in this soil depth was significantly influenced by tillage. Average asparaginase activity increased from 15.7 μg g−1 in the CT to 25.9 μg g−1 in the NT. Litter also influenced asparaginase, increasing activity from 15.5 μg g−1 in soil receiving inorganic fertilizer to 26.0 μg g−1 for soil receiving BL. When evaluating the fertilization by tillage, concentrations increased by 29.6% and 92.9% with BL application in CT and NT fields, respectively. Asparaginase activity was significantly influenced by all cropping systems evaluated in the 0–5 cm depth, except for CS vs. S. Crop systems with wheat cover tended to have higher asparaginase compared to those without cover. In addition, crop rotations with corn responded more (had higher asparaginase activity) to the BL additions than those with soybean. When evaluating asparaginase activity at the 5–10 cm depth, only fertilization had an influence. No differences were observed for tillage or the crop rotation systems evaluated. Litter addition increased asparaginase activity from 8.3 μg g−1 for soil receiving inorganic N to 17.6 μg g−1 for soil receiving BL. At the 5–10 cm depth, BL application increased values by 54.4% and 219.8% in CT and NT fields, respectively.
Glutaminase activity in the upper soil depth showed a similar pattern to those observed for asparaginase activity (Figure 3). Tillage significantly affected the activity in this layer with NT having greater glutaminase activity than CT. No tillage increased values from 163.87 and 279.94 μg g−1 to 235.85 and 459.36 μg g−1 in no-BL and BL-amended soils, respectively. Litter addition resulted in greater glutaminase activity than that of inorganic fertilizer, regardless of the soil depth. In the 0–5 cm depth, BL application increased the activity by 70.8% and 94.8% in the CT field and NT field, respectively. In the subsurface layer, BL application increased the activity by 88.8% and 185.2% in the CT field and NT field, respectively. The soybean cropping systems tended to have higher glutaminase activity than the corn cropping systems. Similarly, wheat addition resulted in greater glutamine activity compared to that without. Most crop rotations in the 0–5 cm depth were significant except for CW vs. S and the S vs. SW. No differences were observed among the crop rotations in the 5–10 cm depth.
3.4. Dissolved Organic Matter (DOM) Components
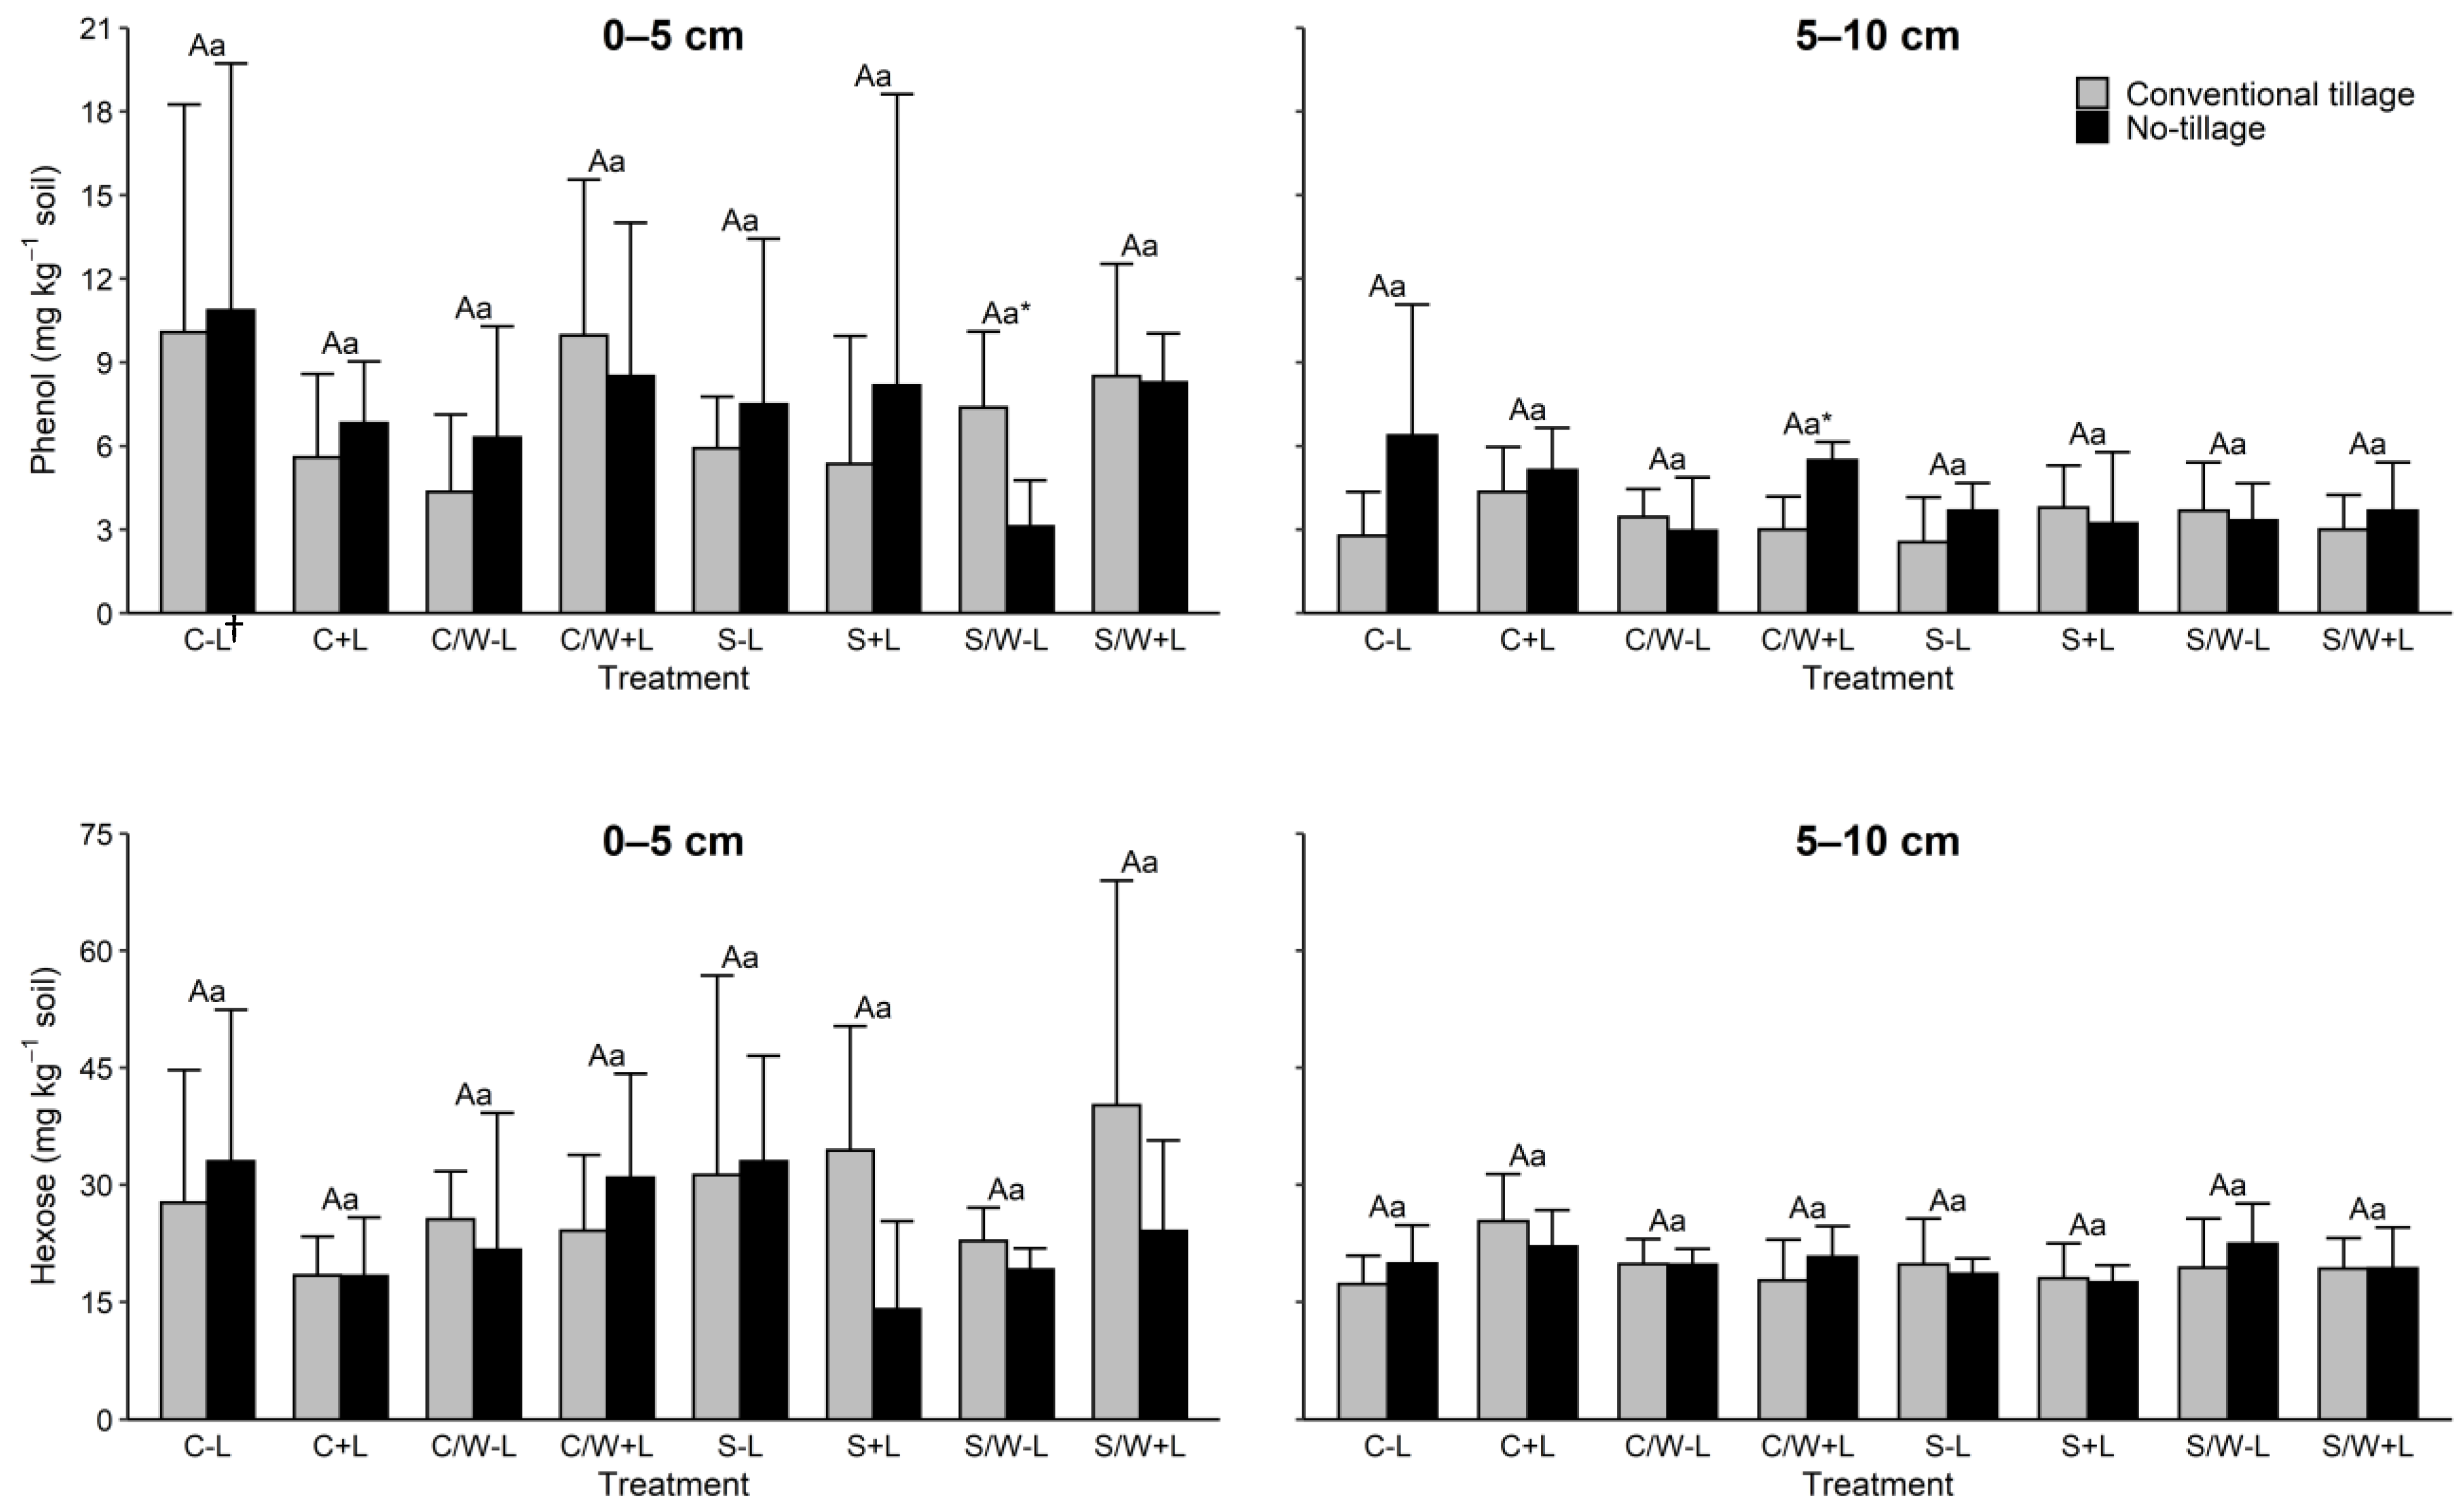
Both dissolved organic matter (DOM) components phenol and hexose showed little change from the management practices evaluated in either soil depth. Phenol levels within both soil depths and tillage treatments were statistically equivalent to each other regardless of the cropping system or fertilization treatment (Figure 4). Tillage treatment was also ineffective with the exceptions of tillage vs. no tillage S/W − L in the topmost layer and tillage vs. no tillage C/W + L in the subsurface layer. Similarly, hexose had no significant responses to the management practices (Table 3).
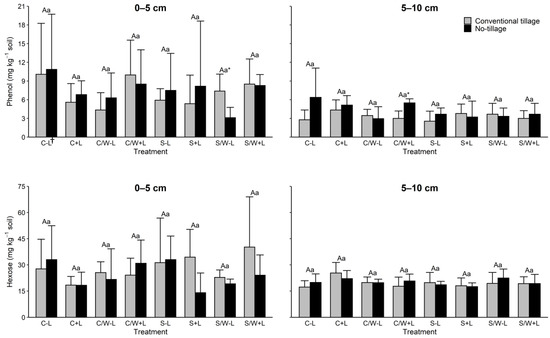
Figure 4.
Concentrations of phenol and hexose in the 0–5 and 5–10 cm soil layers as affected by management practice. The data are presented are means with standard deviation (n = 4). Different capital letters indicate significant (p < 0.05) differences between conventional tillage treatments, different lowercase letters indicate significant (p < 0.05) differences between no tillage treatments, and * indicates a significant (p < 0.05) difference between conventional tillage and no tillage under the same cropping and fertilization system. † C − L, corn with synthetic fertilizer; C + L, corn with broiler litter (BL) application; C/W − L corn–wheat cover crop with synthetic fertilizer; C/W + L, corn–wheat cover crop with BL application; S − L, soybean with synthetic fertilizer; S + L, soybean with BL application; S/W − L, soybean–wheat cover crop with synthetic fertilizer, S/W + L, soybean–wheat cover crop with BL application.
3.5. Correlations between the Soil Attributes Tested
The relationships between soil attributes were analyzed by calculating correlation coefficients between the 10 sets of soil biochemical property data in the topmost and subsurface soils (Table 4). No significant correlations were found between MBC and any other soil property. The DOM components, phenol and hexose, had no statistically significant correlations with each other or any other parameters. Protein was not correlated to any property either, but amino acid showed a significant positive correlation with amidase in the uppermost soil depth and significant negative correlations with asparaginase and glutaminase in the lower soil depth. Microbial biomass N, asparaginase, and glutaminase had significant positive correlations with each other in both soil depths, suggesting a strong interaction between these attributes. Microbial biomass P showed strong positive correlations with microbial biomass N and glutaminase in the 0–5 cm depth and with asparaginase and glutaminase in the 5–10 cm depth.
Table 4.
Correlation coefficients between the 10 soil properties of the surface (0–5 cm) and subsurface (5–10 cm) layers of an Alabama soil calculated per the data of 16 treatments with different cropping systems, tillage, and fertilization.
4. Discussion
The influence of inorganic fertilizer and tillage on soil fertility and nutrient cycling have been extensively studied with a wide range of crops across the US and worldwide [41,42,43,44,45]. However, the long-term influence of BL vs. inorganic fertilizer on microbial biomass and soil enzyme activities have been rarely studied [46]. This study attempted to evaluate the influence of common conservation management strategies being employed in progressive agricultural systems under climatic conditions within the southeastern US to determine their lasting effect on soil health. Previous work has suggested that sustainable practices such as conservation tillage, cropping systems (with and without cover crops), and manure additions have the potential to improve the soil health of cultivated agricultural systems [47,48]. Documenting the influence of these sustainable management practices from various climatic regions is necessary for drawing conclusions about how to improve the soil health of an agricultural system. To effectively evaluate the sustainability or health of a management system, it is useful to have a comparative assessment [49] among the long-term agricultural system practices being employed.
4.1. Microbial Biomass
Wide-spread adoption of conservation tillage practices started during the last two decades of the 19th century to improve the sustainability of agricultural production systems and reduce input costs. These changes in agricultural management have led to SOM increases under reduced tillage practices, which have generally contributed to higher soil microbial biomass [50,51,52,53,54,55,56]. Similar to findings from previous studies, we observed increases in MBC and MBN in southeastern US soils with the implementation of no tillage. However, no differences were observed for MBP with tillage. Differences for MBC were only observed in the 0–5 cm depth, while the impact on MBN was significant at both the 0–5 and 5–10 cm depths even though, at the 5–10 cm depth, microbial biomass N was higher under CT than NT. This phenomenon was most likely a result of the crop residue being mixed under CT vs. the residue being left on the soil surface of NT.
The tillage-induced improvements in microbial biomass can be attributed to conservation tillage retaining more crop residue, which is a substrate used for sustaining microbial biomass. Also, a lack of soil disturbance under NT likely provided a steadier source of OM for supporting the microbial community as opposed to CT, which led to a flush of microbial activity after tillage that resulted in large C loss as CO2, bringing about a decrease in biomass. In addition, agricultural production systems promoting minimal disturbance improve soil structure, thereby favoring the formation and stabilization of macroaggregates that improve and protect microbiota [57,58,59,60]. The depth effect we observed between tillage in our study can also be attributed to management practices. For example, conservation practices such as no tillage create a more stratified soil environment for microbes and nutrients, resulting in increases to microbial biomass and enzymatic activity at the surface soil depth. Conventional tillage causes soil disruption to the upper layers, creating a more homogeneous soil zone of nutrients in the plow zone relative to that of conservation practices [61].
Broiler litter is often used as a fertility source for forage and row crops in the southeastern US. The application of BL supplies the soil with appreciable amounts of OM, N, P, K, and other macro- and micronutrients. Generally speaking, BL has the highest nutritive value among manure sources [62]. Previous work has reported improvements in soil biochemical parameters with the application of municipal solid waste [63] and cattle manures [64,65,66,67] observed increases in MBN from pasture soils with manure application relative to its untreated and inorganic fertilizer-treated counterparts. Forge et al. [68] stated that manure applications increased microbial turnover and nutrient cycling in the same soils as those studied by Bittman et al. [67]. In our study, we observed increases in MBN and MBP, suggesting that BL additions can potentially improve N and P availability. These BLs induced improvements in microbial biomass can be attributed to the additions of more OM and other nutrients, which stimulate microbial growth in soil. In addition, BL application can also stimulate rhizosphere processes which increases soil enzyme activities. For example, Waldrip et al. [66] reported that poultry manure application increased acid phosphomonoesterase, alkaline phosphomonoesterase, and phosphodiesterase activity in rhizosphere soil compared to an unamended rhizosphere soil in a greenhouse trial with ryegrass.
4.2. Amidohydrolases
Soil enzymes are largely a function of microbial biomass and activity [37]; thus, management practices that enhance microbial numbers in soil are likely to enhance measurable enzyme values [69]. In this study, not all of the enzymes evaluated responded to changes in tillage, BL addition, or crop rotation. Enzymes L-glutaminase, L-asparaginase, and amidase have been reported to perform vital roles in the cycling of soil C and N [70]. Improvements in L-glutaminase and L-asparaginase were observed in this study, while no differences were noticed for amidase. This response was primarily observed in the top 0–5 cm soil layer. L-glutaminase and L-asparaginase are important N cycling enzymes and most of the NH4 released for crop uptake is derived from the hydrolysis of amide (asparagine, aspartate, and glutamine) residues in the SOM [71]. Previous studies have shown that enzymes L-asparaginase, L-glutaminase, and amidase are significantly greater under no tillage than under conventional systems [72,73]. Amidase activity was not affected by tillage in this study perhaps because this enzyme has a wide range of substrate specificities [74].
Increasing concentrations of these N cycling enzymes also occurred, resulting from BL additions in the current study. These results demonstrate that BL promotes catalytic activity in soils because of improved enzyme activity and content. In addition, these increases indicated that BL additions improved the nutrient status of inherent N compounds in soil compared to soil receiving inorganic N fertilizer. It is also important to note that previous researchers have reported that increases in N cycling enzymes corresponds to the growth of microbial biomass because exocellular enzymes are produced by soil microorganisms [75,76]. Kanazawa and Kiyota [77] reported increases in L-glutaminase and L-asparaginase activities in soils with farmyard manure when compared to chemical fertilizer or a no fertilizer control. Other researchers have also observed similar findings with animal manure [78,79]. Similar to our findings, Acosta-Martinez and Harmel [80] reported that the addition of poultry litter to a Houston Blackland Prairie Clay under pasture management in Texas increased N cycling enzymes when compared to that of the control. However, our study showed that BL additions can increase N cycling enzymes when compared to inorganic fertilizer application.
4.3. Dissolved Organic Matter (DOM)
Organic N sources in soil are found in the form of amino compounds (including protein and amino acids), which arise from crop residue return to soil or the necromass of soil macro- or microorganisms [81,82] and manure input [83,84]. Soil proteins are broken down into amino acids through biochemical reactions (enzyme reactions as analyzed above). The amino acids are subsequently consumed by soil microbes as a source of N, C, and energy. This enables the release of N into soil [85]. Thus, amino compounds are of particular importance to N cycling in soils because they may account for as much as 35–80% of the total soil N [86,87]. Cropping systems and their management practices are thought to influence the amino acid composition of the OM due to differences in rooting systems and crop residue retention and additions [88]. While some research has shown that soil receiving long-term animal manure applications has higher amino compounds compared to those receiving only inorganic fertilizer [89,90], other research seems to not support these observations [83]. More than that, this study also observed minimal differences among tillage and BL additions on soil proteins and amino acids (i.e., −L vs. +L in Table 3). This observation supports the fact that the impact of BL application is more complex than simple build-up of BL amino acids in soils [91]. Similarly, in a 16-week pot study with ryegrass, soil amino acid concentration was increased by poultry manure at a high application rate, but decreased at a low application rate [84]. Thus, both fertilizer types and application strategies and application rates can be the factors influencing the observations of soil amino acid change patterns due to organic amendments [92,93].
In our previous work from a companion study on these same soils [26], we reported increases in total C and N, macro-, and micronutrients for no-till vs. conventional till and BL vs. inorganic fertilizer applications. The crop residue retained in these soils under no-till and from BL additions most likely provided an energy source for microbes, thus enhancing the microbial biomass. Generally, microbial biomass depends on the quantity and quality of the labile organic matter in soil. In the current study, we found differences in the MBC, MBN, and MBP and some enzyme activity. Therefore, the quantity and quality of OM retained in soil under no-till vs. conventional tillage and BL additions vs. inorganic N was of great enough importance in influencing the microbial communities [94]. However, we did not see any differences in DOM components. The minimal DOM differences observed in this study could be attributed to the fact that soil samples were collected during the winter month when additional DOM fractions may have been present from the decomposing plant residue left in the field after harvest.
4.4. Correlations between the Soil Attributes Tested
The general effect trend for improvements in biochemical parameters was BL application > no tillage > cropping type and crop cover practice. No correlations existed for microbial biomass C, protein, phenol, and hexose with any other soil property at either soil layer. Strong correlations existed among the microbial biomass N, asparaginase, and glutaminase at both soil layers, indicating strong interactions among these properties. Microbial biomass P also had a significant correlation with glutaminase at both soil layers, suggesting a strong interaction. The different observations may have reflected the fact that microbial biomass C, N, and P were all main but independent components, associated with their respective enzyme activities [40,95]. In addition, not all soil enzymes are exclusively derived from microorganisms. Enzymes that originated from animal and plant cells could have made these types of enzymatic activity weakly or non-significantly correlated to the microbial biomass parameters [70].
4.5. Overall Summary
Several studies have demonstrated the benefits of implementing conservation tillage, cropping systems (with and without cover crops), and manure additions to improve the soil health of cultivated agricultural systems [96,97]. As stated previously, the benefits of implementing these agricultural systems have been evaluated in the Midwestern US related to high clay and organic C content soils. Overall, the biochemical parameters evaluated in this study showed supporting evidence of the benefits of adopting these agricultural practices to sandy soils from the humid southeastern US. The greatest benefits were observed from the adoption of no tillage and BL additions with minimal differences being observed for cropping type and crop cover practice.
5. Conclusions
Our results show that the biochemical parameters evaluated in this study were altered as a result of long-term tillage and BL applications. The alterations primarily occurred in the 0–5 cm depth. Higher MB (C and N) and enzyme activity exhibited in NT compared to CT indicates greater biological activity was established in no-till soils. Higher microbial activity is desirable given that they are responsible for decomposing plant residues and recycling nutrients. As a result, these soils will tend to have higher residual nutrient concentrations. Broiler litter application also greatly increased microbial biomass N and P, asparaginase, and glutaminase in both soil layers. Among the cropping systems, soybean, especially with wheat cover, contributed more to the increased microbial biomass N, asparaginase, and glutaminase in the surface soil than corn. This was less pronounced in the 5–10 cm depth, but soybean with wheat cover still resulted in higher microbial biomass N and glutaminase than corn. Minimal differences were observed for proteins, amino acids, and DOM among management practices. Contrast analyses conducted on the biochemical parameters evaluated showed that the general effect trend was BL application > no tillage > cropping type and crop cover practice. These findings suggest that conservation practices such as no tillage and BL applications implemented in the southeastern US can favorably alter soil biochemical properties, thereby improving soil health. This is promising evidence for the adaption of conservation practices into agricultural systems which include no tillage and organic amendments. Future research should also evaluate the long-term influence of these practices with different crops on other highly eroded soils across the southeastern U.S.
5.1. Determination of Phenol
Reagents and solutions were prepared according to the following. A saturated Na2CO3 solution was prepared by dissolving 216 g in a liter of deionized (DI) water. Standard stock solution was prepared by dissolving 100 mg of 2-hydrobenzoic acid in 1 L of DI water. Working standards of 2.5, 5, 10, 20, 30, and 40 mg L−1 of diluted 2-hydrobenzoic acid were prepared from stock solution. A 0.7 mL aliquot of the water-extractable DOM was mixed with 50 µL of Folin–Ciocalteu’s reagent in a 1.5 mL Eppendorf tube and allowed to sit for 3 min at room temperature. A 100 µL of saturated Na2CO3 solution and 150 µL of DI water were added to the solution and thoroughly mixed. If a precipitate formed, the solution was centrifuged for 2–3 min at 2000× g and the absorbance was read immediately. Absorbance was determined at 725 nm against a blank. Samples developed a blue color when phenols were present. The blank was colorless. Calibration curves were prepared and phenol concentration calculated in a mg L−1 2-hydroxybenzoic acid equivalent. The standard solution was prepared using the same procedure as described for the sample solution. A blank was also prepared following the same procedure as the sample, but deionized water was used in place of the extracted DOM.
5.2. Determination of Hexoses
Reagents and solutions used were prepared according to the following. Anthrone–sulfuric acid reagent was prepared by dissolving 0.2 g of anthrone (analytical grade) in 100 mL of concentrated sulfuric acid. Afterwards, the solution was left to sit for 1 h at room temperature before use. This solution was prepared fresh daily. The standard stock solution was prepared by dissolving 100 mg of glucose in 1 L of DI water. Working standards of 2.5, 5, 10, 20, 30, and 50 mg L−1 of diluted glucose were prepared from the stock solution. A 1 mL extracted DOM sample solution was mixed with 2 mL of anthrone–sulfuric acid reagent. The solution was vortexed and left to sit for 15 min at room temperature. Then, the standard or anthrone-treated sample was transferred to a glass cuvette and its absorbance read at 625 nm against the blank. A calibration curve was prepared and phenol concentration calculated in a mg L−1 glucose equivalent. The standard solution was prepared using the same procedure as that described for the sample solution. A blank of the same volume as the sample was used.
5.3. Determination of Free Amino Acids
Reagents and solutions were prepared according to the following. Acetate buffer (pH 5.5) was prepared by dissolving 54 g of Na acetate trihydrate in 40 mL of DI water and then adding 10 mL of glacial acetic acid. Afterwards, the solution pH was adjusted to 5.5 with NaOH. Ninhydrin reagent was prepared by dissolving 2 g of ninhydrin and 0.3 g of hydrindantin in 75 mL of 2-hydroxy ethanol. The solution was purged with N2 for 30 min, after which 25 mL of acetate buffer (pH 5.5) was added. This solution was prepared fresh daily with limited air exposure. The dilutant was prepared by mixing equal amounts of 95% ethanol with DI water. Standard stock solution was prepared by mixing 1000 µmol leucine solution in 1 L of DI water. Working standards of 20, 40, 60, 80, and 100 µmol L−1 of diluted 2-hydrobenzoic acid were prepared by diluting the stock solution. Two milliliters of DOM sample solution was mixed with 1.25 mL of the ninhydrin reagent in 10 mL glass tubes. The tubes were capped with Teflon-lined screw caps and kept in a 95 °C water bath for 25 min. The tubes were cooled to room temperature in another water bath, and then, 4.5 mL of dilutant was mixed with the cooled solution. The standard or treated sample was transferred to a glass cuvette and its absorbance read at 570 nm against a blank. A calibration curve was prepared and amino acid concentration was calculated in a µmol L−1 leucine equivalent. The standard solution was prepared with the same procedure described for the sample solution. Deionized water of the same volume as the sample was used as a blank.
5.4. Protein Determination
Three reagents and solutions used in the analysis were prepared according to the following. Standard stock solution was prepared daily by dissolving 100 mg of bovine serum albumin (BSA) in 1 L of DI water. Working standards of 2.5, 5, 10, 15, 20, and 25 mg L−1 of diluted BSA were prepared by diluting the stock solution. Bradford protein reagent was purchased and stored under refrigeration until use. Subsequently, protein was quantified according to the following. Bradford protein reagent in the amount 0.5 mL was added into a spectrophotometer cuvette and mixed with 0.5 mL of DOM sample solution, standard solution, or blank solution. The mixture was left to sit for 5 min at room temperature and then absorbance was read at 620 nm against the blank. A calibration curve was prepared and protein concentration was calculated in a mg L−1 BSA equivalent.
Supplementary Materials
The following supporting information can be downloaded at: https://www.mdpi.com/article/10.3390/soilsystems8020041/s1, Text S1. Determination of Phenol. Text S2. Determination of hexoses. Text S3. Determi-nation of Free Amino Acids. Text S4. Protein Determination.
Author Contributions
Conceptualization, D.B.W., H.A.T. and Z.H.; methodology, Z.H. and Z.N.S.; formal analysis, D.B.W. and Z.H.; investigation, D.B.W., Z.H. and H.T.; resources, D.B.W., H.A.T., Z.H. and Z.N.S.; data curation, Z.H. and X.Y.; writing—original draft preparation, D.B.W. and Z.H.; writing—review and editing, D.B.W., Z.H., X.Y., H.A.T., Z.N.S. and H.T.; visualization, Z.H., D.B.W. and Z.N.S.; supervision, D.B.W. and Z.H.; project administration, Z.H. and D.B.W. All authors have read and agreed to the published version of the manuscript.
Funding
This research was funded by United Stated Department of Agriculture Agricultural Research Service (USDA ARS) appropriated funds.
Institutional Review Board Statement
Not applicable.
Informed Consent Statement
Not applicable.
Data Availability Statement
The data presented in this study are available on request from the corresponding authors.
Acknowledgments
The authors thank David Zhang, Morris G. Welch, J. Ashley Robinson, and Irenus A. Tazisong for their technical assistance. This work was supported by the U.S. Department of Agriculture (USDA), Agricultural Research Service. Mention of trade names or commercial products is solely for the purpose of providing specific information and does not imply recommendation or endorsement by the USDA. The USDA is an equal opportunity provider and employer.
Conflicts of Interest
The authors declare no conflicts of interest.
References
- He, Z.; Zhang, H. Applied Manure and Nutrient Chemistry for Sustainable Agriculture and Environment; Springer: Amsterdam, The Netherlands, 2014; 372p. [Google Scholar]
- Kouno, K.; Wu, J.; Brookes, P.C. Turnover of biomass C and P in soil following incorporation of glucose or ryegrass. Soil Biol. Biochem. 2002, 34, 617–622. [Google Scholar] [CrossRef]
- McLaughlin, M.J.; McBeath, T.M.; Smernik, R.; Stacey, S.P.; Ajiboye, B.; Guppy, C. The chemical nature of P accumulation in agricultural soils-implications for fertiliser management and design: An Australian perspective. Plant Soil 2011, 349, 69–87. [Google Scholar] [CrossRef]
- Spohn, M.; Widdig, M. Turnover of carbon and phosphorus in the microbial biomass depending on phosphorus availability. Soil Biol. Biochem. 2017, 113, 53–59. [Google Scholar] [CrossRef]
- Richardson, A.E.; Barea, J.M.; Mcneill, A.M.; Prigent-Combaret, C. Acquisition of phosphorus and nitrogen in the rhizosphere and plant growth promotion by microorganisms. Plant Soil 2009, 321, 305–339. [Google Scholar] [CrossRef]
- Marx, M.C.; Wood, M.; Jarvis, S.C. A microplate fluorimetric assay for the study of enzymes diversity in soils. Soil Biol. Biochem. 2001, 33, 1633–1640. [Google Scholar] [CrossRef]
- Powlson, D.S.; Brooks, P.C.; Christensen, B.T. Measurement of soil microbial biomass provides an early indication of changes in total soil organic matter due to straw incorporation. Soil Biol. Biochem. 1987, 19, 159–164. [Google Scholar] [CrossRef]
- Islam, K.R.; Weil, R.R. Soil quality indicator properties in mid-Atlantic soils as influenced by conservation management. J. Soil Water Conserv. 2000, 55, 69–78. [Google Scholar]
- Rietz, D.N.; Haynes, R.J. Effects of irrigation-induced salinity and sodicity on soil microbial activity. Soil Biol. Biochem. 2003, 35, 845–854. [Google Scholar] [CrossRef]
- Wang, V.N.L.; Dalal, R.C.; Greene, R.S.B. Salinity and sodicity effects on respiration and microbial biomass of soil. Biol. Fert. Soils 2008, 44, 943–953. [Google Scholar] [CrossRef]
- Bastida, F.; Moreno, J.L.; Hernández, T.; García, C. Microbiological activity in a soil 15 years after its devegetation. Soil Biol. Biochem. 2006, 38, 2503–2507. [Google Scholar] [CrossRef]
- Bowen, S.R.; Gregorich, E.G.; Hopkins, D.W. Biochemical properties and biodegradation of dissolves organic matter from soils. Biol. Fert. Soils 2009, 45, 733–742. [Google Scholar] [CrossRef]
- Kaiser, K.; Kalbitz, K. Cycling downwards—Dissolved organic matter in soils. Soil Biol. Biochem. 2012, 52, 29–32. [Google Scholar] [CrossRef]
- He, Z.; Wu, F. Labile Organic Matter: Chemical Compositions, Function, and Significance in Soil and the Environment; SSSA Special Publication 62; Soil Science Society of America: Madison, WI, USA, 2015; 382p. [Google Scholar]
- Tazisong, I.A.; Senwo, Z.N.; He, Z. Elemental composition and functional groups in soil labile organic matter fractions. In Labile Organic Matter-Chemical Compositions, Function, and Significance in Soil and the Environment; He, Z., Wu, F., Eds.; Soil Science Society of America (SSSA): Madison, WI, USA, 2015; Volume 62, pp. 137–156. [Google Scholar]
- Prasuhn, V. On-farm effects of tillage and crops on soil erosion measured over 10 years in Switzerland. Soil Till. Res. 2012, 120, 137–146. [Google Scholar] [CrossRef]
- Locke, M.A.; Krutz, J.L.; Steinriede, W., Jr.; Testa, S., III. Conservation management imporoves runoff water quality: Implications for environmental sustainability in glyphosate-resistant cotton production systems. Soil Sci. Soc. Am. J. 2015, 79, 660–671. [Google Scholar] [CrossRef]
- Zablotowicz, R.M.; Reddy, K.N.; Weaver, M.A.; Mengistu, A.; Krutz, L.J.; Gordon, R.E.; Bellaloui, N. Cover crops, tillage, and glyphosate effects on chemical and biological properties of a lower Mississippi Delta soil and soybean yield. Environ. Res. J. 2010, 4, 227–251. [Google Scholar]
- Watts, D.B.; Torbert, H.A., III.; Prior, S.A.; Huluka, G. Long-term tillage and poultry litter impacts soil carbon and nitrogen mineralization and fertility. Soil Sci. Soc. Am. J. 2010, 74, 1239–1247. [Google Scholar] [CrossRef]
- Watts, D.B.; Torbert, H.A., III. Long-Term tillage and poultry litter impacts on soybean and corn grain yield. Agron. J. 2011, 103, 1479–1486. [Google Scholar] [CrossRef]
- Lin, Y.; Watts, D.B.; Van Santen, E.; Cao, G. Influence of poultry litter on crop productivity under different field conditions: A meta-analysis. Agron. J. 2018, 110, 807–818. [Google Scholar] [CrossRef]
- Lin, Y.; Watts, D.B.; Runion, G.B. Influence of poultry litter on nutrient availability and fate in plant-soil systems: A meta-analysis. J. Soil Water Conserv. 2022, 77, 230–239. [Google Scholar] [CrossRef]
- USDA—National Agricultural Statistics Service. Crop Production 2022 Summary. United States Department of Agriculture–National Agricultural Statistics Service. Available online: https://downloads.usda.library.cornell.edu/usda-esmis/files/k3569432s/9306v916d/wm119139b/cropan23.pdf (accessed on 4 April 2024).
- Vaiknoras, K.; Hubbs, T. Characteristics and Trends of U.S. Soybean Production Practices, Costs, and Returns Since 2002; Economic Research Report Number 316; U.S. Department of Agriculture, Economic Research Service: Washington, DC, USA, 2023. [Google Scholar]
- Claassen, R.; Bowman, M.; McFadden, J.; Smith, D.; Wallander, S. Tillage Intensity and Conservation Cropping in the United States; Economic Information Bulletin Number 197; U.S. Department of Agriculture, Economic Research Service: Washington, DC, USA, 2018. [Google Scholar]
- He, Z.; Tazisong, I.A.; Yin, X.; Watts, D.B.; Senwo, Z.N.; Torbert, H.A. Long-term cropping system, tillage, and poultry litter application affect the chemical properties of an Alabama Ultisol. Pedosphere 2019, 29, 180–194. [Google Scholar] [CrossRef]
- Soil Survey Staff. Keys to Soil Taxonomy, 12th ed.; USDA-Natural Resources Conservation Service: Washington, DC, USA, 2014. [Google Scholar]
- Franzluebbers, A.J.; Hons, F.M.; Zuberer, D.A. Soil organic carbon, microbial biomass, and mineralizable carbon and nitrogen in sorghum. Soil Sci. Soc. Am. J. 1995, 59, 460–466. [Google Scholar] [CrossRef]
- Varoney, P.R.; Paul, E.A. Determination of kc and kN in situ for calibration of the chloroform fumigation-incubation method. Soil Biol. Biochem. 1984, 16, 9–14. [Google Scholar] [CrossRef]
- Franzluebbers, A.J.; Hons, F.M.; Zuberer, D.A. Determination of microbial biomass and nitrogen mineralization following rewetting of dried soil. Soil Sci. Soc. Am. J. 1996, 60, 1133–1139. [Google Scholar] [CrossRef]
- Xing, T.T.; Cai, A.D.; Lu, C.A.; Ye, H.L.; Wu, H.L.; Huai, S.C.; Wang, J.Y.; Xu, M.G.; Lin, Q.M. Increasing soil microbial biomass nitrogen in crop rotation systems by improving nitrogen resources under nitrogen application. J. Integr. Agric. 2022, 21, 1488–1500. [Google Scholar] [CrossRef]
- Cabrera, M.L.; Beare, M.H. Alkaline persulfate oxidation for determining total nitrogen in microbial biomass extract. Soil Sci. Soc. Am. J. 1993, 57, 1007–1012. [Google Scholar] [CrossRef]
- Carter, M.R.; Rennie, D.A. Changes in soil quality under zero tillage farming systems: Distribution of microbial biomass and mineralizable C and N potentials. Can. J. Soil Sci. 1982, 62, 587–597. [Google Scholar] [CrossRef]
- He, Z.; Honeycutt, C.W.; Olanya, M.; Larkin, R.P.; Halloran, J.M. Soil test phosphorus and microbial biomass phosphorus in potato fields. J. Food Agri. Environ. 2011, 9, 540–545. [Google Scholar]
- Brookes, P.C.; Powlson, D.S.; Jenkinson, D.S. Measurement of microbial biomass phosphorus in soil. Soil Biol. Biochem. 1982, 14, 319–329. [Google Scholar] [CrossRef]
- Hedley, M.J.; Stewart, J.W.B. Method to measure microbial phosphate in soils. Soil Biol. Biochem. 1982, 14, 377–385. [Google Scholar] [CrossRef]
- Tabatabai, M.A. Soil Enzymes. In Methods of Soil Analysis: Microbiological and Biochemical Properties; Weaver, R.W., Angle, J.S., Bottomley, P.S., Eds.; Soil Science Society of America: Madison, WI, USA, 1994; pp. 775–833. [Google Scholar]
- Chantigny, M.H.; Angers, D.A.; Bélanger, G.; Rochette, P.; Eriksen-Hamel, N.; Bittman, S.; Buckley, K.; Massé, D.; Gasser, M.-O. Yield and nutrient export of grain corn fertilized with raw and treated liquid swine manure. Agron. J. 2008, 100, 1303–1309. [Google Scholar] [CrossRef]
- De Mendiburu, F. Agricolae: Statistical Procedures for Agricultural Research, R package version 2019, 1.3-1; R Foundation for Statistical Computing: Vienna, Austria, 2019. [Google Scholar]
- He, Z.; Honeycutt, C.W.; Griffin, T.S.; Larkin, R.P.; Olanya, M.; Halloran, J.M. Increases of soil phosphatase and urease activities in potato fields by cropping rotation practices. J. Food Agri. Environ. 2010, 8, 1112–1117. [Google Scholar]
- Amorim, H.C.; Ashworth, A.J.; Wienhold, B.J.; Savin, M.C.; Allen, F.L.; Saxton, A.M.; Owens, P.R.; Curi, N. Soil quality indices based on long-term conservation cropping systems management. Agrosystems Geosci. Environ. 2020, 3, e20036. [Google Scholar] [CrossRef]
- Tewolde, H.; Shankle, M.W.; Way, T.R.; Pote, D.H.; Sistani, K.R.; He, Z. Poultry litter band placement affects accessibility and conservation of nutrients and cotton yield. Agron. J. 2018, 110, 675–684. [Google Scholar] [CrossRef]
- Xia, Q.; Liu, X.; Gao, Z.; Wang, J.; Yang, Z. Responses of rhizosphere soil bacteria to 2-year tillage rotation treatments during fallow period in semiarid southeastern Loess Plateau. PeerJ 2020, 8, e8853. [Google Scholar] [CrossRef] [PubMed]
- Xiao, J.; Yin, X.; Sykes, V.R.; He, Z. Differential accumulation of heavy metals in soil profile and corn and soybean grains after 15-year poultry litter application under no-tillage. J. Soils Sed. 2022, 22, 844–858. [Google Scholar] [CrossRef]
- Zhong, S.; Zeng, H.; Jin, Z. Soil microbiological and biochemical properties as affected by different long-term banana-based rotations in the tropics. Pedosphere 2015, 25, 868–877. [Google Scholar] [CrossRef]
- He, Z.; Pagliari, P.H.; Waldrip, H.M. Applied and environmental chemistry of animal manure: A review. Pedosphere 2016, 26, 779–816. [Google Scholar] [CrossRef]
- Karlen, D.L.; Eash, N.S.; Unger, P.W. Soil and crop management effects on soil quality indicators. Am. J. Altern. Agric. 1992, 7, 48–55. [Google Scholar] [CrossRef]
- Ozlu, E.; Sandhu, S.S.; Kumar, S.; Arriaga, F.J. Soil health indicators impacted by long-term cattle manure and inorganic fertilizer application in a corn-soybean rotation of South Dakota. Sci. Rep. 2019, 9, 11776. [Google Scholar] [CrossRef]
- Larson, W.E.; Pierce, F.J. The dynamics of soil quality as a measure of sustainable management. In Defining Soil Quality for a Sustainable Environment; Soil Science Society of America (SSSA): Madison, WI, USA, 1994; Volume 35, pp. 37–51. [Google Scholar]
- Alvear, M.A.; Rosas, J.L.; Rouanet, F.B. Effects of three soil tillage systems on some biological activities in an Ultisol from southern Chile. Soil Till. Res. 2005, 82, 195–202. [Google Scholar] [CrossRef]
- Bausenwein, U.; Gattinger, A.; Langer, U.; Embcher, A.; Hartmann, H.P.; Sommer, M.; Munch, J.C.; Schloter, M. Exploring soil microbial communities and soil organic matter: Variability and interactions in arable soils under minimum tillage practice. Appl. Soil Ecol. 2008, 40, 67–77. [Google Scholar] [CrossRef]
- Feng, Y.; Motta, A.C.; Reeves, D.W.; Burmester, C.H.; van Santen, E.; Osborne, J.A. Soil microbial communities under conventional-till and no-till continuous cotton systems. Soil Biol. Biochem. 2003, 35, 1693–1703. [Google Scholar] [CrossRef]
- Jiang, X.; Hu, Y.; Bedell, J.H.; Xie, D.; Wright, A.L. Soil organic carbon and nutrient content in aggregate-size fractions of a subtropical rice soil under variable tillage. Soil Manag. 2011, 27, 28–35. [Google Scholar] [CrossRef]
- Kandeler, E.; Tscherko, D.; Spiegel, H. Long-term monitoring of microbial biomass, N mineralisation and enzyme activities of a Chernozem under different tillage management. Biol. Fert. Soils 1999, 28, 343–351. [Google Scholar] [CrossRef]
- Spedding, T.A.; Hamel, C.; Mehuys, G.R.; Madramootoo, C.A. Soil microbial dynamics in maize-growing soil under different tillage and residue management systems. Soil Biol. Biochem. 2004, 36, 499–512. [Google Scholar] [CrossRef]
- von Lutzow, M.; Leifeld, J.; Kainz, M.; Kogel-Knabner, I.; Munch, J.C. Indications for soil organic matter quality in soils under different management. Geoderma 2002, 105, 243–258. [Google Scholar] [CrossRef]
- Powlson, D.S.; Jenkinson, D.S. A comparison of the organic matter, biomass, adenosine triphosphate and mineralizable nitrogen contents of ploughed and direct-drilled soils. J. Agric. Sci. 1981, 97, 713–721. [Google Scholar] [CrossRef]
- Sorensen, P.; Ladd, J.N.; Amato, M. Microbial assimilation of 14C of ground and unground plant materials decomposing in a loamy sand and a clay soil. Soil Biol. Biochem. 1996, 28, 1425–1434. [Google Scholar] [CrossRef]
- Hungria, M.; Andrade, D.S.; Colozzi-Filho, A.; Balota, E.L. Interação entre microrganismos do solo, feijoeiro e milho em monocultura ou consórcio. Pesqui. Agropecu. Bras. 1997, 32, 807–818. [Google Scholar]
- Balota, E.L.; Colozzi-Filho, A.; Andrade, D.S.; Dick, R.P. Microbial biomass in soils under different tillage and crop rotation systems. Biol. Fert. Soils 2003, 38, 15–20. [Google Scholar] [CrossRef]
- Kraut-Cohen, J.; Zolti, A.; Shaltiel-Harpaz, L.; Argaman, E.; Rabinovich, R.; Green, S.J. Effects of tillage practices on soil micro-biome and agricultural parameters. Sci Total Environ. 2020, 705, 135791. [Google Scholar] [CrossRef] [PubMed]
- Eghball, B.; Wienhold, B.J.; Gilley, J.E.; Eigenberg, R.A. Mineralization of manure nutrients. J. Soil Water Conserv. 2002, 57, 470–473. [Google Scholar]
- Pascual, J.A.; García, C.; Hernandez, T. Lasting microbiological and biochemical effects of the addition of municipal solid waste to an arid soil. Biol. Fert. Soils 1999, 30, 1–6. [Google Scholar] [CrossRef]
- Ritz, K.; Wheatley, R.E.; Griffiths, B.S. Effects of animal manure application and crop plants upon size and activity of soil microbial biomass under organically grown spring barley. Biol. Fert. Soils 1997, 24, 372–377. [Google Scholar] [CrossRef]
- Parham, J.; Deng, S.; Raun, W.; Johnson, G. Long-term cattle manure application in soil. Biol. Fert. Soils 2002, 35, 328–337. [Google Scholar]
- Waldrip, H.M.; He, Z.; Erich, M.S. Effects of poultry manure amendment on phosphorus uptake by ryegrass, soil phosphorus fractions and phosphatase activity. Biol. Fert. Soils 2011, 47, 407–418. [Google Scholar] [CrossRef]
- Bittman, S.; Laurens, J.P.; van Vliet, C.; Kowalenko, G.; McGinn, S.; Hunt, D.E.; Bounaix, F. Surface-banding liquid manure over aeration slots: A new low-disturbance method for reducing ammonia emissions and improving yield of perennial grasses. Agron. J. 2005, 97, 1304–1313. [Google Scholar] [CrossRef]
- Forge, T.A.; Bittman, S.; Kowalenko, C.G. Responses of grassland soil nematodes and protozoa to multi-year and single-year applications of dairy manure slurry and fertilizer. Soil Biol. Biochem. 2005, 37, 1751–1762. [Google Scholar] [CrossRef]
- Mullen, M.D.; Melhorn, C.G.; Duck, B.N. Biological and biochemical soil properties in no-till corn with different cover crops. J. Soil Water Conserv. 1998, 53, 219–224. [Google Scholar]
- Acosta-Martínez, V.; Waldrip, H.M. Soil enzyme activities as affected by manure types, application rates, and management practices. In Applied Manure and Nutrient Chemistry for Sustainable Agriculture and Environment; He, Z., Zhang, H., Eds.; Springer: Amsterdam, The Netherlands, 2014; pp. 99–122. [Google Scholar]
- Acosta-Martinez, V.; Tabatabai, M.A. Enzyme activity in a limes agricultural soil. Biol. Fert. Soils 2000, 31, 85–91. [Google Scholar] [CrossRef]
- Deng, S.P.; Tabatabai, M.A. Effect of tillage and residue management on enzyme activities in soil: III. Phosphatases and arylsulfatase. Biol. Fert. Soils. 1997, 24, 141–146. [Google Scholar] [CrossRef]
- Deng, S.P.; Tabatabai, M.A. Effect of Tillage and Residue Management on Enzyme Activities in Soils: II. Glycosidases. Biol. Fert. Soils 1996, 22, 208–213. [Google Scholar] [CrossRef]
- Kobayashi, M.; Komeda, H.; Nagasawa, T.; Nishiyama, M.; Horinouchi, S.; Beppu, T.; Yamada, H.; Shimizu, S. Amidase coupled with low molecular-mass nitrile hydratase from Rh. rhodochrous J1. Euro J. Biochem. 1993, 217, 327–336. [Google Scholar] [CrossRef]
- Hasebe, A.; Kanazawa, S.; Takai, Y. Microbial biomass in paddy soil 1. Microbial biomass calculated from direct count using fluorescence microscope. Soil Sci. Plant Nutr. 1984, 30, 175–187. [Google Scholar] [CrossRef]
- Kanazawa, S.; Asakawa, S.; Takai, Y. Effect of fertilizer and manure application on microbial numbers, biomass, and enzyme activities in volcanic ash soils. Soil Sci. Plant Nutr. 1988, 34, 429–439. [Google Scholar] [CrossRef]
- Kanazawa, S.; Kiyota, H. Effect of fertilizer and manure application on L-Glutaminase and L-Asparaginase activities in soils. Soil Sci. Plant Nutr. 2000, 46, 741–744. [Google Scholar] [CrossRef]
- Khorsandi, N.; Nourbakhsh, F. Effect of amendment of manure and corn residues on soil N mineralization and enzyme activity. Agron. Sustain. Dev. 2007, 27, 139–143. [Google Scholar] [CrossRef]
- Bhattacharyya, P.; Chakrabarti, K.; Chakraborty, A. Microbial biomass and enzyme activities in submerged rice soil amended with municipal solid waste compost and decomposed cow manure. Chemosphere 2005, 60, 310–318. [Google Scholar] [CrossRef]
- Acosta-Martinez, V.; Harmel, D.R. Soil microbial communities and enzyme activities under various poultry litter application rates. J. Environ. Qual. 2006, 33, 1309–1318. [Google Scholar] [CrossRef]
- Vieira, R.F. Ciclo do Nitrogênio em Sistemas Agrícolas; Embrapa Brasília: Brasília, DF, Brazil, 2017; p. 21. [Google Scholar]
- Sobucki, L.; Ramos, R.F.; Meireles, L.A.; Antoniolli, Z.I.; Jacques, R.J.S. Contribution of enzymes to soil quality and the evolution of research in Brazil. Rev. Bras. Cienc Solo 2021, 45, e0210109. [Google Scholar] [CrossRef]
- Gonzalez Perez, P.; Zhang, R.; Wang, X.; Ye, J.; Huang, D. Characterization of the amino acid composition of soils under organic and conventional management after addition of different fertilizers. J. Soils Sed. 2015, 15, 890–901. [Google Scholar] [CrossRef]
- He, Z.; Senwo, Z.N.; Zou, H.; Tazisong, I.A.; Martens, D.A. Amino compounds in poultry litter, litter-amended pasture soils and grass shoots. Pedosphere 2014, 24, 178–185. [Google Scholar] [CrossRef]
- Ma, H.; Pei, G.; Gao, R.; Yin, Y. Mineralization of amino acids and its signs in nitrogen cycling of forest soil. Acta Ecol. Sin. 2017, 37, 60–63. [Google Scholar] [CrossRef]
- Martens, D.A.; Loeffelmann, K.L. Soil amino acid composition quantified by acid hydrolysis and anion chromatography-pulsed amperometry. J. Agric. Food Chem. 2003, 51, 6521–6529. [Google Scholar] [CrossRef] [PubMed]
- Creamer, C.A.; Filley, T.R.; Olk, D.C.; Stott, D.E.; Dooling, V.; Boutton, T.W. Changes to soil organic N dynamics with leguminous woody plant encroachment into grasslands. Biogeochem 2013, 113, 307–321. [Google Scholar] [CrossRef]
- Senwo, Z.N. Amino Acid Composition of Soil Organic Matter and Nitrogen Transforamtions in Soils under Different Management Systems. Ph.D. Thesis, Iowa State University, Ames, IA, USA, 1995. [Google Scholar]
- Bol, R.; Ostle, N.J.; Petzke, K.J.; Chenu, C.; Balesdent, J. Amino acid N-15 in long-term bare fallow soils: Influence of annual N fertilizer and manure applications. Euro. J. Soil Sci. 2008, 59, 617–629. [Google Scholar] [CrossRef]
- Scheller, E.; Raupp, J. Amino acid and soil organic matter content of topsoil in a long term trial with farmyard manure and mineral fertilizers. Biol. Agric. Hort. 2005, 22, 379–397. [Google Scholar] [CrossRef]
- He, Z.; Olk, D.C.; Waldrip, H.M. Soil amino compound and carbohydrate contents influenced by organic amendments. In Applied Manure and Nutrient Chemistry for Sustainable Agriculture and Environment; He, Z., Zhang, H., Eds.; Springer: Amsterdam, The Netherland, 2014; pp. 69–82. [Google Scholar]
- Peltre, C.; Gregorich, E.G.; Bruun, S.; Jensen, L.S.; Magid, J. Repeated application of organic waste affects soil organic matter composition: Evidence from thermal analysis, FTIR-PAS, amino sugars and lignin biomarkers. Soil Biol. Biochem. 2017, 104, 117–127. [Google Scholar] [CrossRef]
- Wyngaard, N.; Cabrera, M.L.; Shober, A.; Kanwar, R. Fertilization strategy can affect the estimation of soil nitrogen mineralization potential with chemical methods. Plant Soil 2018, 432, 75–89. [Google Scholar] [CrossRef]
- Regelink, I.C.; Stoof, C.R.; Rousseva, S.; Weng, L.; Lair, G.J.; Kram, P.; Nikolaidis, N.P.; Kercheva, M.; Banwart, S.; Comans, R.N. Linkages between aggregate formation, porosity and soil chemical properties. Geoderma 2015, 247, 24–37. [Google Scholar] [CrossRef]
- Borges, C.D.; Corá, J.E.; Barbosa, J.C.; Nahas, E. Soil microbiological attributes under summer/winter crops rotation in a no-tillage system. Arch. Agron. Soil Sci. 2013, 59, 1471–1485. [Google Scholar]
- Madejón, E.; Murillo, J.; Moreno, F.; López, M.; Arrúe, J.L.; Álvaro-Fuentes, J.; Cantero, C. Effect of long-term conservation tillage on soil biochemical properties in Mediterranean Spanish areas. Soil Till. Res. 2009, 105, 55–62. [Google Scholar] [CrossRef]
- Ohno, T.; He, Z.; Tazisong, I.A.; Senwo, Z.N. Influence of tillage, cropping, and nitrogen source on the chemical characteristics of humic acid, fulvic acid, and water-soluble soil organic matter fractions of a long-term cropping system study. Soil Sci. 2009, 174, 652–660. [Google Scholar] [CrossRef]

Disclaimer/Publisher’s Note: The statements, opinions and data contained in all publications are solely those of the individual author(s) and contributor(s) and not of MDPI and/or the editor(s). MDPI and/or the editor(s) disclaim responsibility for any injury to people or property resulting from any ideas, methods, instructions or products referred to in the content. |
© 2024 by the authors. Licensee MDPI, Basel, Switzerland. This article is an open access article distributed under the terms and conditions of the Creative Commons Attribution (CC BY) license (https://creativecommons.org/licenses/by/4.0/).