Article

Enzymatic Diagnostics of Soil Health of the European Part of Russia with Lead Contamination

1
Academy of Biology and Biotechnology by D.I. Ivanovsky, Southern Federal University, Rostov-on-Don 344090, Russia
2
Azov-Black Sea Branch, The Federal State Budgetary Scientific Branch, All-Russian Research Institute of Fishing and Oceanography, Rostov-on-Don 344002, Russia
*
Author to whom correspondence should be addressed.
Soil Syst. 2024, 8(3), 76; https://doi.org/10.3390/soilsystems8030076
Submission received: 23 April 2024 / Revised: 2 July 2024 / Accepted: 3 July 2024 / Published: 5 July 2024
(This article belongs to the Special Issue Research on Heavy Metals in Soils and Sediments)

Abstract

:
Lead (Pb) is one of the most common environmental pollutants. Lead has an acute toxic effect on soil biotas and the enzymatic system of soils. The objective of this study is to carry out enzymatic diagnostics of soil health in the European part of Russia after Pb contamination. As a part of the simulation experiment, Pb (at maximum permissible concentrations (MPCs) of 1, 10, and 100) was used to contaminate 12 types of soils in the south and center of the European part of Russia, which differed in their physical and chemical properties. To assess soil health, the activity of oxidoreductases (catalase, dehydrogenases, and cysteine reductase) and hydrolases (invertase, urease, and phosphatase) was studied. Most enzymes were inhibited with increased Pb dosage. The most sensitive soils to Pb contamination, assessed by enzyme activity, are soils of semi-deserts and dry steppes. Cysteine reductase is considered the most sensitive enzyme to Pb contamination. The most informative indicators for Pb contamination were phosphatase, cysteine reductase, and invertase. The P (phosphatase) cycle and the redox enzyme (catalase) also have instability in Pb-contaminated soils. The C (invertase and dehydrogenases) and N (urease) cycles do not change significantly when contaminated with lead. The results of this study can be used for the diagnostics of the condition of soils in different natural areas after Pb contamination.

1. Introduction

Lead (Pb) is a priority pollutant found in soils due to the use of leaded fuel, the burning of coal in furnaces of thermal power plants, and the operation of plants for processing metal ore containing Pb [1]. Soil pollution leads to the accumulation of Pb in plant organs, which entails the migration of heavy metal into the body of animals and ultimately humans [2,3,4,5]. Lead contamination of soils is mainly due to atmospheric emissions rather than discharges [6,7]. Soil contamination with Pb also occurs in landfills with local soil contamination with equipment and consumables containing Pb: batteries, cells, lead-sheathed cables, etc. [8,9]. The main sources of soil contamination with Pb are transport (which uses leaded gasoline) and mining enterprises [10,11]. Lands with an alkaline pH as well as a high content of organic matter, Fe hydroxides, carbonates, and clay deposits contribute to the fixation of Pb in the soil and the toxic effect on living organisms of the environment [12].
To assess the ecological state of soils in case of soil contamination with heavy metals and oil, the activity of soil enzymes is often used as one of the sensitive and informative indicators of soil health [13,14,15,16,17]. This is since enzymes are involved in the biogeochemical cycles of carbon (C), nitrogen (N), phosphorus (P), oxygen (O), sulfur (S), and other elements in the soil. The enzymatic activity serves as an indicator of many anthropogenic processes occurring in the soil, including those associated with biogeochemical cycles of C, N, P, S, and other cycles [18,19,20,21,22]. When soils are polluted with heavy metals and petroleum hydrocarbons, as well as when soil cultivation technology changes, the activity of soil enzymes changes [14,17,23,24,25]. The enzymatic activity of soils, especially the activity of dehydrogenases and arylsulfatase, was significantly inhibited in the case of contamination with Cd, Pb, Cu, Ni, V, and Cr [26]. The least sensitive enzymatic activities to heavy metal contamination are the activity of β-glucosidase and protease. It is interesting and relevant to develop soil health scales for indicators of enzymatic activity in the case of heavy metal contamination, using the example of lead. Lead, as one of the most common and toxic heavy metals, causes oxidative stress, disrupts disulfide bonds in the proteins of soil microorganisms, reduces the vital activity of nitrifying and ammonifying bacteria, reduces the availability of phosphorus to plants, and has other negative effects [2,27].
Soil contamination with Pb affects the enzymatic activity of soils and plants [28,29,30]. According to Zhou (2014), low concentrations of Pb (less than 500 mg/kg) can stimulate the activity of soil enzymes, whereas concentrations of Pb greater than 500 mg/kg inhibit the activity of soil enzymes (urease and invertase) [31]. The effect of Cd(II), Cu(II), and Pb(II) at different doses and with different incubation periods has been studied for arylsulfatase, the β-activity of glucosidase, acid phosphatase, protease, and urease in uncontaminated brown forest soil (Argentina) [32]. It was found that the studied metals inhibited the activity of arylsulfatase, acid phosphatase, protease, and urease. The effect on the activity of β-glucosidase was insignificant or absent altogether. The toxicity of various metals, estimated by the percentage of inhibition of enzymatic activity, was in the following sequence: Cd ≅ Cu > Pb. It was concluded that protease turned out to be the enzyme most sensitive to soil contamination with Cd, Cu, and Pb. The activity of peroxidase and polyphenol oxidase in chernozem, alluvial, and urban soils contaminated with Pb and Cd was evaluated 3, 90, 180, and 360 days after the start of the experiment [33]. It was found that Pb and Cd increased the activity of peroxidase in soils, while polyphenol oxidase did not change. Considering the problem of soil contamination with lead, attempts have been made to reduce the metal content and restore the ecological state of the soil after contamination. Therefore, it is of real interest to study the enzymatic activity characterizing the biogeochemical cycles of C, N, P, O, and S in 12 types of soils in different climatic zones of the European part of Russia.
This study’s aim is to carry out enzymatic diagnostics on the soil health of the European part of Russia in the case of lead contamination.

2. Materials and Methods
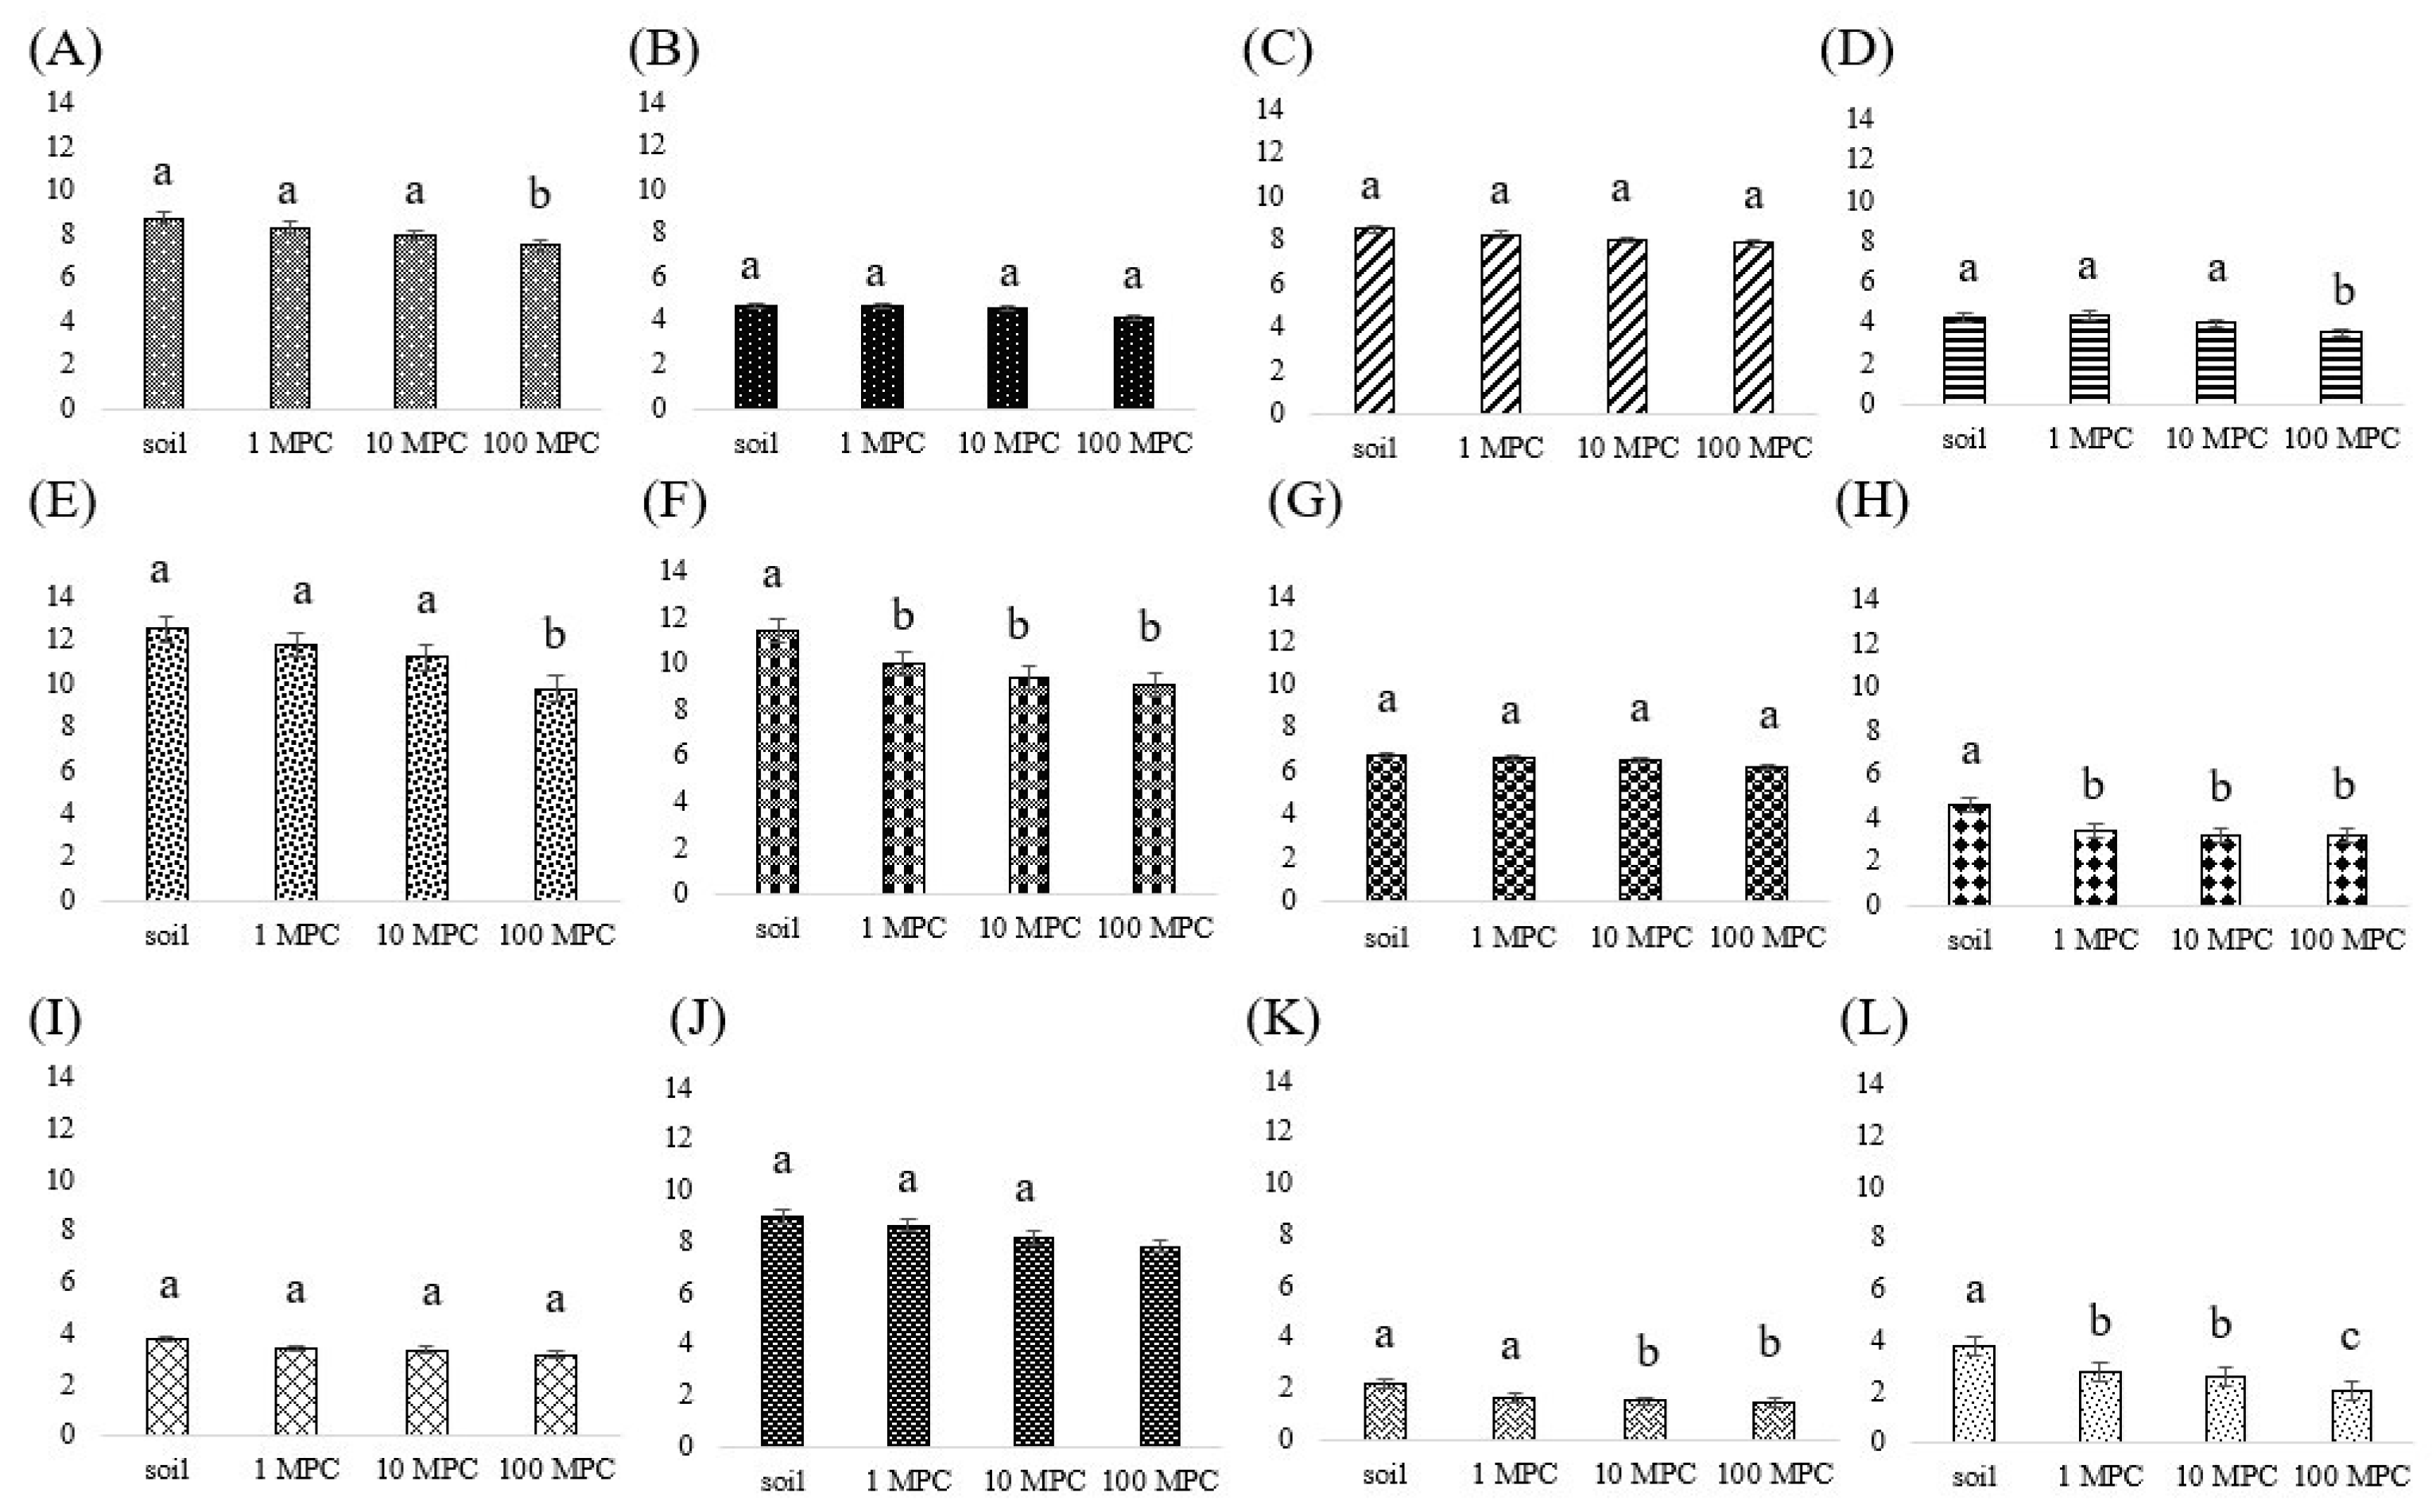
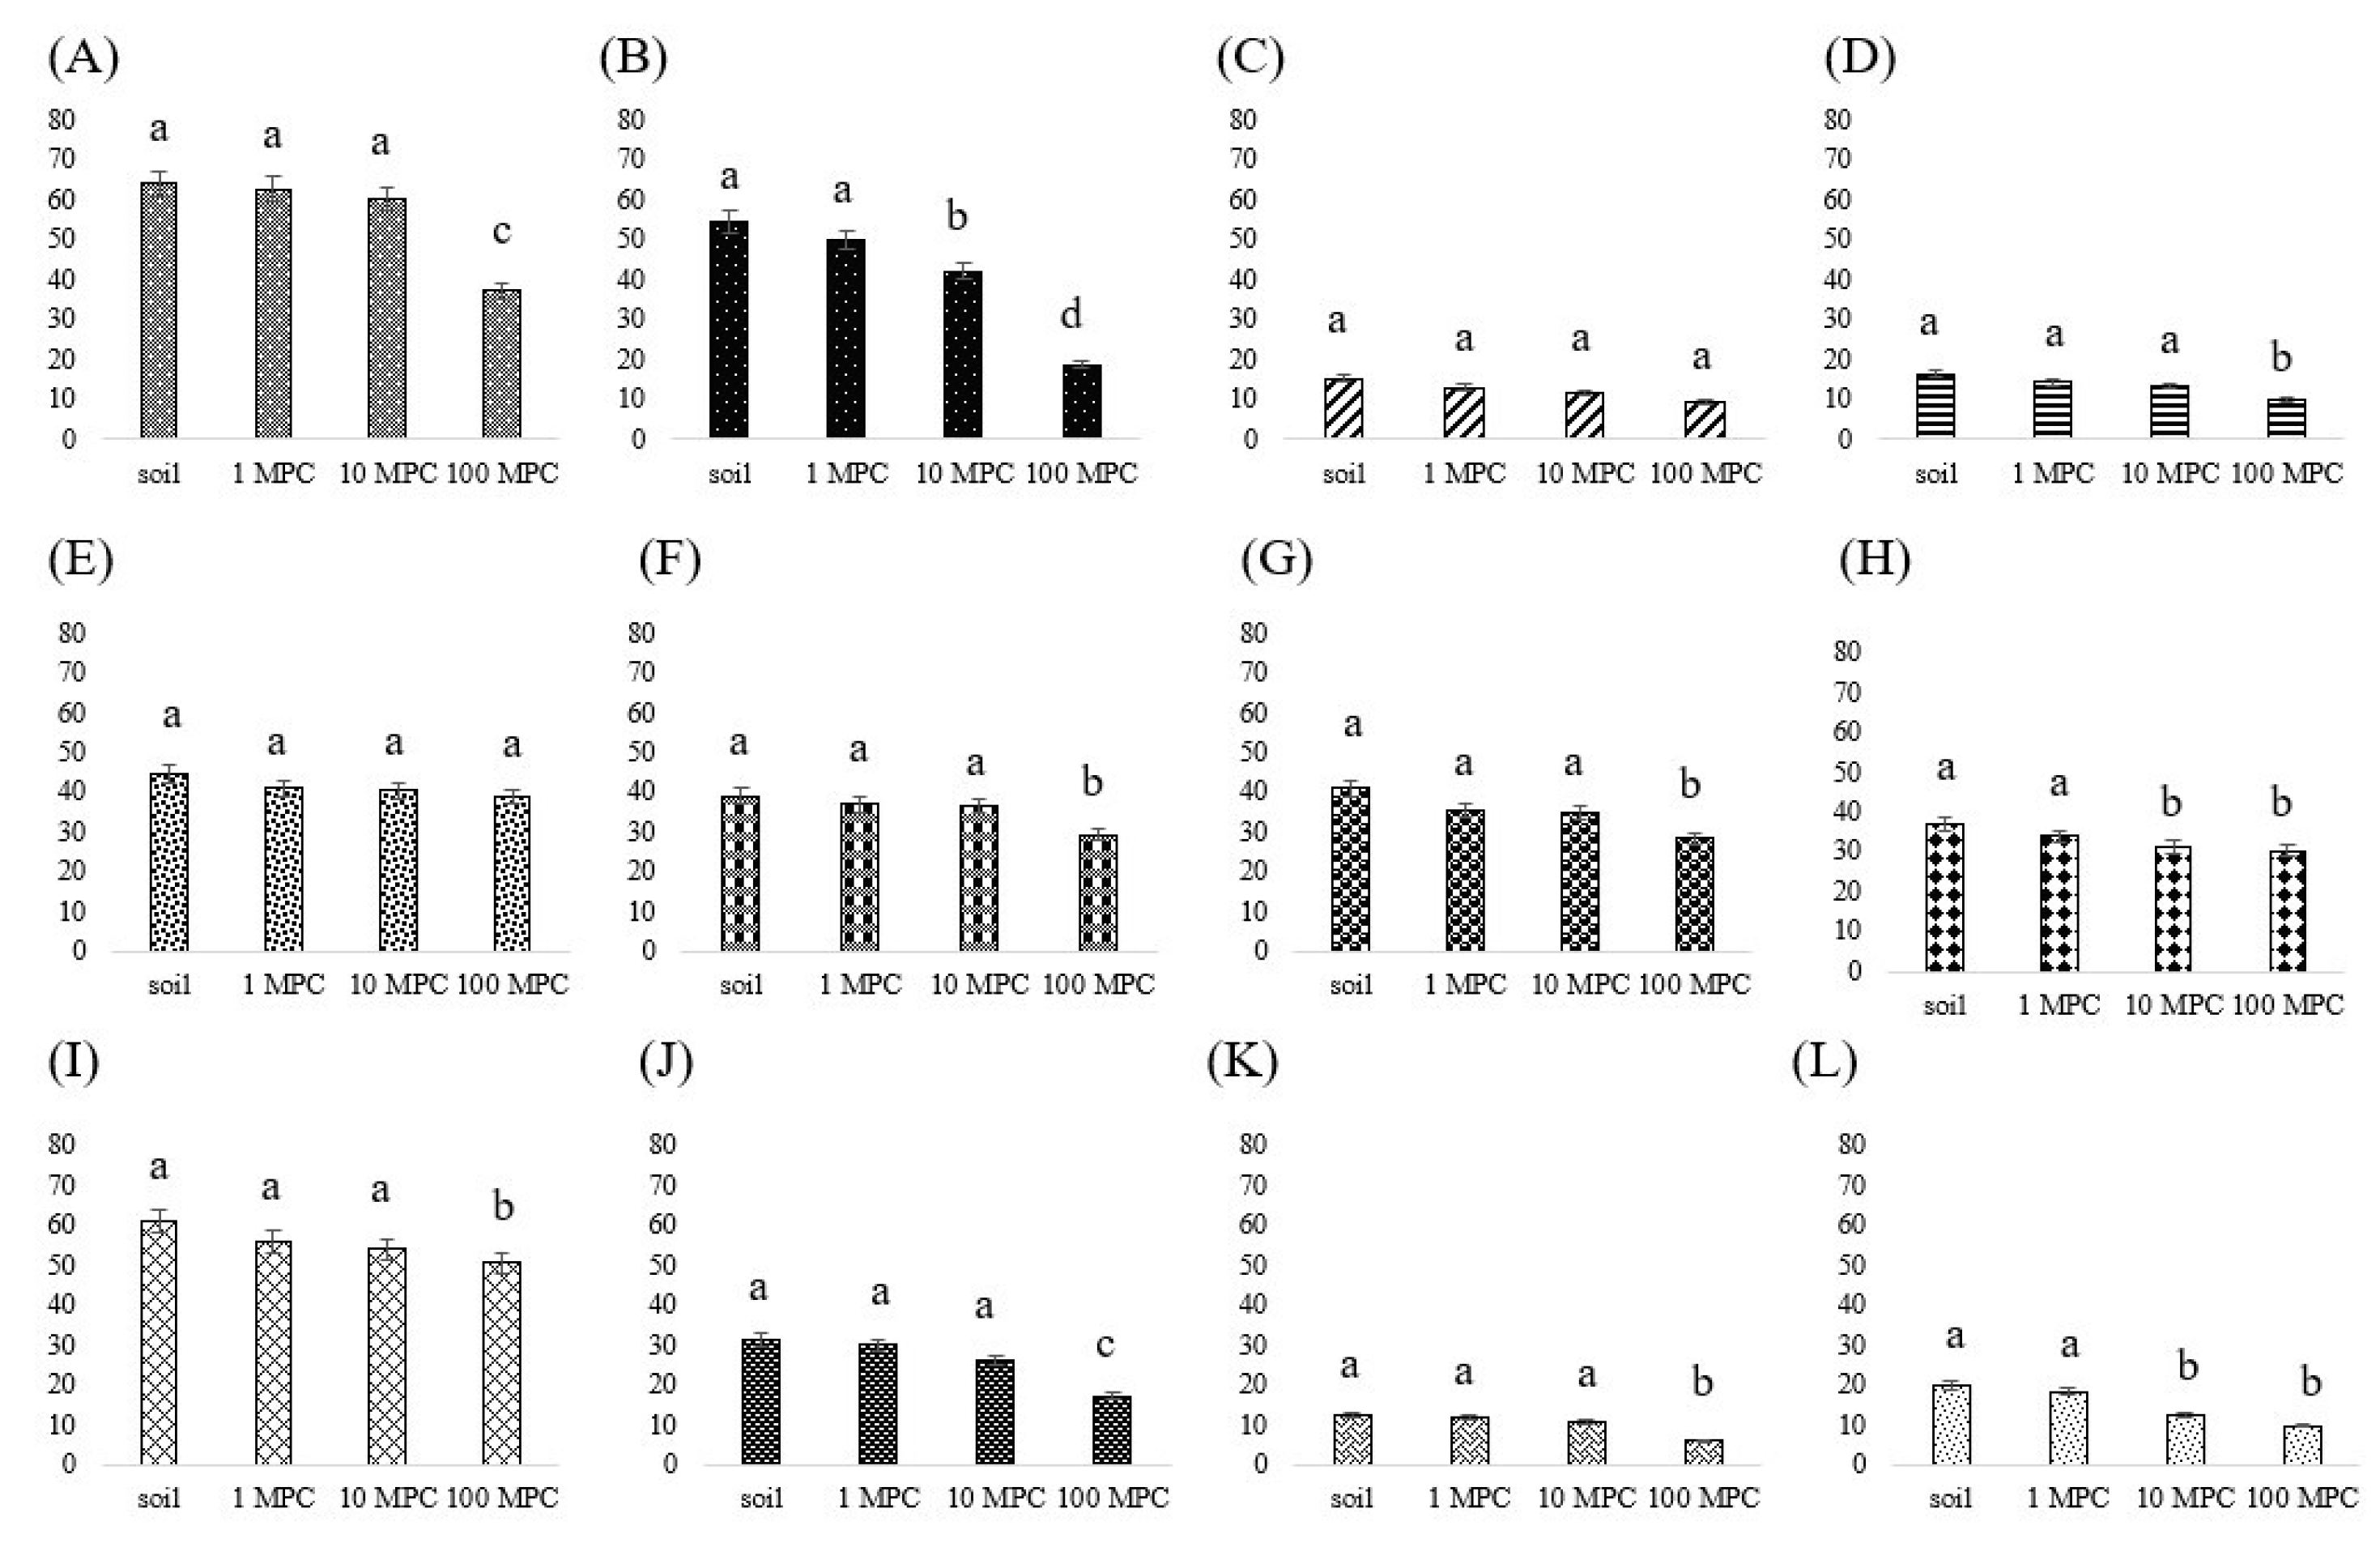
Object of study. Twelve types of soils in southern and central part of Russia were analyzed (Table 1). These soils represent 5 types of ecosystems: meadow soils, saline and brackish soils, soils of dry steppes and semi-deserts, soils of steppes, and soils of broad-leaved forests and forest steppes. These soils differ in the following physical, chemical, and biological properties: pH, organic matter content, cation exchange capacity, and granulometric composition (clay, sand, and silt content).
The pollutant. Lead was investigated as a pollutant, as one of the priority environmental toxicants. The main sources of Pb in the soils of the European part of Russia are road transport, coal burning, processing of ores containing heavy metals, etc. The background Pb content in soils was analyzed using a Spectroscan MAX-GVM analyzer. The absence of Pb in soils or its trace content was found. Lead oxide (PbO2) was added to the soil in terms of Pb atoms in concentrations of 1, 10, and 100 MPC (1 MPC = 100 mg/kg).
Experimental design. Contamination of 12 different types of Pb soils was carried out according to a single scheme (Figure 1). Lead was added to the purified and sifted soil in concentrations of 1, 10, and 100 MPC. For the experimental model, soils were selected at a distance from roads and processing plants. Therefore, controls for each soil were considered to be free from contamination with heavy metals, including Pb. The soil was thoroughly mixed to simulate Pb soil contamination and moistened (40% of the soil mass). The incubation period for soil contaminated with Pb lasted 30 days.
During experiment, soil samples were kept at a constant of temperature, humidity, and illumination in the climate growth chamber (Binder KBW240-230V (BINDER GmbH, Tuttlingen, Germany)).
Physical and chemical properties of soils. To assess the physical and chemical state of soils, the following soil properties were determined according to standard methods [34,35]: granulometric composition in terms of silt, sand, and clay (%), organic matter content (%), pH, and cation exchange capacity (mg × eq/100 g of soil). The granulometric composition of the soil was determined by the method of Kaczynski. The content of clay (<0.002 mm), silt (0.05–0.002 mm), and sand (>0.05 mm) was estimated using the soil texture triangle (in %). The content of total organic matter was determined by acid oxidation of potassium dichromate with a spectrophotometric termination (in %). The reaction of the soil medium (pH) was measured using an electrode potentiometer in distilled water in a ratio of 1 part soil to 2.5 parts water (w/v). The capacity of cation exchange in soils was determined by acid–base titration (in mg × eq/100 g of soil).
Methods for determining enzymatic activity. To diagnose the ecological state and health of soils, changes in enzymes of the oxidoreductase (catalase, dehydrogenases, and cysteine reductase) and hydrolase (invertase, urease, and phosphatase) classes were analyzed according to F.Kh. Khaziev (2005) [36]. Each enzyme characterizes a part of the cycle of a certain element necessary for the optimal functioning of the ecosystem. Methods for the determination of enzymes are presented in Table 2. Analyses to determine enzymatic activity were performed 3–4 times in duplicate.
According to the average values of the activity of all soil enzymes (catalase, dehydrogenase, cysteine reductase, invertase, phosphatase, and urease), the integrated index of enzymatic activity (IIEA) was calculated according to Equation (1) [37]:
IIEA = A 1 A 1   contr × 100 %
where A1, A2…, and An are the relative scores for each of the indicators of enzymatic activity in %; and A1 contr—control value.
The geometric mean of enzymatic activity (GMea) was calculated using Equations (2) and (3) [38] as follows:
A 1 = A op A   contr × 100 %
where A1, A2…, and An are the relative scores for each of the indicators of enzymatic activity in %; and Aop—absolute value of enzyme activity.
The final GMea calculation is presented in Equation (3) as follows:
GMea = A 1   + A 2   + + A n n
where A1, A2…, and An are the relative scores for each of the indicators of enzymatic activity in %.
The complex nature of the GMea indicator makes it possible to evaluate the response of enzymes of different classes (oxidoreductases and hydrolases), which reflects the totality of the processes of restoration or degradation occurring in the soil. This indicator, along with IIEA, can be used to diagnose soil health under various types of anthropogenic stress, including pollution with heavy metals, petroleum hydrocarbons, etc. [24,25,39,40].
Statistical analysis of the obtained data was carried out using the Statistica 12.0 software package. The mean values and variance were determined, and the reliability of various samples was established using variance analysis (Student’s t-test). An analysis of variance (ANOVA) was calculated on the activity of soil enzymes for different soil types.

3. Results

Catalase activity. The change in the activity of catalase, as an enzyme involved in the decomposition of hydrogen peroxide, which is toxic to microorganisms, to oxygen and hydrogen after soil contamination with Pb, is shown in Figure 2. Lead contamination of VCP, HSA, ECY, GPA, and HCP reduced the enzymatic activity only at an MPC of 100 by 15, 10, 17, 16, and 13% compared to the control.
In the VCP (typ.) soils, a decrease in catalase activity was observed at MPCs of 10 and 100 of Pb of 11 and 23% compared to the control. The inhibition of enzymatic activity at the minimum dose (1 MPC) with a proportional decrease in activity and an increase in the Pb dose was observed in the VCP (ord.) (13–21%), LPA (26–31%), LSD (ill.-ferr.) (25–33%), and LSD soils (28–47%). In the HKC and VCP (leach) soils, there was no significant difference in catalase activity with an increase in the Pb dose.
Among the studied soils, the VCP (typ.) (9.8–12.6 mL O2/1 g/1 min) and VCP (ord.) (9.1–11.4 mL O2/1 g/1 min) soils had the highest enzymatic activity, even after the Pb contamination. The least catalase activity was observed in the HSA (4.2–4.7 mL O2/1 g/1 min), ECY (3.6–4.3 mL O2/1 g/1 min), GPA (3.2–3.8 mL O2/1 g/1 min), LSD (ill.-ferr.) (1.4–2.2 mL O2/1 g/1min), and LSD (2.0–3.8 mL O2/1 g/1 min) soils.
All soils with the lowest catalase activity have a light and medium loamy granulometric composition, a low cation exchange capacity, and an lower content of organic matter. This leads to a decrease in the rate of decomposition of hydrogen peroxide, which is toxic to the microbiota, and as a result, underestimated values of enzyme activity. Nitrogen in the soil stimulates catalase, and phosphorus can inhibit enzyme activity. According to Galstyan, in the presence of a high concentration of phosphorus in soil (for example, in soils with a high phosphorus content or the introduction of phosphorus fertilizers), a decrease in catalase activity is due to the blocking of the prosthetic group of the catalase enzyme by phosphoric acid anions [41].
Dehydrogenases activity. The carbon cycle in soils is one of the most important in the life of microorganisms, plants, animals, and humans. In the soil, the activity of dehydrogenases (Figure 3) and invertase (Figure 4) is directly involved in the biogeochemical carbon cycle.
The most resistant soil to Pb pollution in terms of dehydrogenase activity is LSD (ill-ferr.) soil, the activity of which is reduced only at an MPC of 100 of Pb by 10% compared to the control group. The activity of dehydrogenases in the case of contamination with MPCs of 10 and 100 of Pb decreased in the VCP (33–43%), HKC (29–37%), LPA (42–44%), and HCP (10–40%) soils. In other types of soils, even with the minimum dose of Pb (1 MPC), a decrease in dehydrogenase activity was found, which increased by the following percentages with increasing concentrations: HSA (11–52%), ECY (17–31%), VCP (typ.) (18–31%), VCP (ord.) (26–42%), VCP (leach) (10–47%), GPA (13–27%), and LSD (22–46%).
The highest activity of dehydrogenases, despite the Pb contamination, was found in the HSA (16.6–34.0 mg TPF/1 g/24 h), VCP (typ.) (23.3–33.8 mg TPF/1 g/24 h), LPA (19.6–34.7 mg TPF/1 g/24 h), and GPA (32.9–44.6 mg TPF/1 g/24 h) soils. The lowest enzymatic activity was found in the LSD (ill.-ferr.) (9.1–10.0 mg TPF/1 g/24 h) and LSD (8.6–15.8 mg TPF/1 g/24 h) soils.
The activity of dehydrogenases in soil is closely related to the catalysis of redox reactions by the dehydrogenation of organic substances in soil [23,42]. When Pb contaminates the soil, the oxidation of organic compounds in the soil is disrupted, and as a result, the activity of dehydrogenases decreases [2]. Therefore, there is no sharp decrease in the activity of dehydrogenases. A significant decrease in the activity of this enzyme is observed in soils contaminated with petroleum hydrocarbons [43].
Invertase activity. The invertase activity after the Pb contamination at an MPC of 100 decreased only in the VCP and HCP soils by 42 and 25% (Figure 4).
When the doses were increased to MPCs of 10 and 100, the toxic effect of Pb was exerted on the HSA (23–66%), VCP (typ.) (10–13%), LPA (16–18%), GPA (12–18%), LSD (ill.-ferr.) (15–51%), and LSD (47–51%) soils. Starting with the minimum dose (1 MPC) and increasing to an MPC of 100, a decrease in the enzymatic activity compared to that of the control was found in the HKC (15–40%), ECY (13–39%), and VCP (leach) (14–39%) soils. The highest invertase activity in the case of Pb contamination was found in the VCP (37.3–64.1 mg glucose/1 g/24 h), HSA (18.8–54.6 mg glucose/1 g/24 h), and GPA soils (50.8–61.4 mg glucose/1 g/24 h). The lowest enzymatic activity was found in the HKC (9.3–15.3 mg glucose/1 g/24 h), ECY (10.2–16.5 mg glucose/1 g/24 h), and LSD (ill.-ferr.) (6.2–12.6 mg glucose/1 g/24 h) soils.
The activity of invertase in the soil is characterized by the quantitative accounting of reducing sugars according to Bertrand and by changes in the optical properties of a sucrose solution. The activity of this enzyme is closely related to the humus content in the soil [41,43,44,45]. All soils with the lowest invertase activity have a low humus content, ranging from 0.5% (HKC) to 2.41 (LSD ill.-ferr.).
Cysteine reductase activity. An indicator of the biogeochemical cycle of sulfur in soil with Pb contamination is the activity of soil cysteine reductase (Figure 5). The inhibition of enzymatic activity relative to that of the control at Pb MPCs 10 and 100 was found in the VCP (typ.) (83–98%), GPA (28–87%), and LSD (ill.-ferr.) (18–94%) soils.
After applying Pb at a minimum dose (1 MPC) and with its increase to 100 MPC, a decrease in cysteine reductase activity was found compared to that of the control group in the VCP (16–84%), HSA (22–83%), HKC (11–98%), ECY (24–97%), VCP (ord.) (20–95%), VCP (leach) (19–98%), LPA (26–99%), HCP (12–100%), and LSD (19–99%) soils.
The highest activity of cysteine reductase, despite the Pb soil contamination, was found in the HSA (162.2–946.0 mg of formazan/10 g/2 h), HKC (17.5–738.1 mg of formazan/10 g/2 h), LPA (10.7–654.6 mg of formazan/10 g/2 h), and LSD (ill.-ferr.) soils (37.5–569.6 mg of formazan/10 g/2 h). The lowest activity of cysteine reductase was found in the VCP (ord.) (6.8–131.0 mg formazan/10 g/2 h) and LSD soils (0.4–21.2 mg formazan/10 g/2 h).
Cysteine reductase, as an enzyme that oxidizes sulfur from the sulfhydryl group of cysteine to the disulfide group of cystine, is very sensitive to Pb contamination, as it is to any heavy metal. However, the activity of this enzyme is also related to the chemical composition of each soil type. The highest activity of this enzyme corresponds to slightly acidic (HSA, HKC, and LPA) or very acidic soils (LSD ill.-ferr.). In addition, the organic matter content in these soils is low. It is likely that the high activity of cysteine reductase is due to sulfur-containing compounds released into the soil solution. The availability of sulfur to plants allows for access to nitrogen, phosphorus, and other elements [46,47]. Sulfur is mainly contained in the soil in the form of organic compounds (70–90%) and is closely related to the availability of humus in soils [48]. In light and medium loamy soils, the humus content is reduced, sulfur is easily washed out, and the activity of cysteine reductase is high.
Phosphatase activity. The phosphorus cycle in the soil is involved in the formation of humic substances and the provision of nutrients to microorganisms, plants, and animals. In the soil, the phosphorus cycle is also influenced by the activity of phosphatase. According to Figure 6, the activity of this enzyme is more resistant to Pb contamination. The introduction of Pb at any dosage into the VCP (leach), VCP (typ.), and LSD soils did not have a significant effect on the enzymatic activity.
At the maximum concentration of Pb (100 MPC), the inhibition of enzymatic activity was found in the VCP (15%), HSA (17%), HKC (30%), VCP (ord.) (17%), LPA (12%), GPA (15%), and LSD (ill.-ferr.) soils (28%).
The highest phosphatase activity, despite the Pb contamination, was found in the VCP (ord.) (240–260 µg of p-nitrophenol in 1 g of soil per 1 h) and VCP (leach) (238–259 µg of p-nitrophenol in 1 g of soil per 1 h) soils. The lowest phosphatase activity was found in the HKC (47.1–67.1 µg of p-nitrophenol in 1 g of soil per 1 h) and ECY soils (33.8–47.2 µg of p-nitrophenol in 1 g of soil per 1 h).
Soil phosphatases hydrolyze organic phosphorus compounds in the soil and release free phosphate ions for plant nutrition [36].
Urease activity. The nitrogen cycle and the phosphorus cycle in the soil are of crucial importance for the formation of humic substances in the soil. Urease is directly involved in the formation of alkaline hydrolyzable nitrogen in the soil (Figure 7).
Among the studied soils, the VCP (typ.), HCP, and LSD soils had the greatest resistance to Pb contamination: at the maximum dose of Pb (100 MPC), the inhibition of enzymatic activity was 15, 14, and 18% compared to the control. The urease activity in the VCP (ord.) soil decreased at MPCs of 10 and 100 by 20 and 28% compared to the control. Regardless of the Pb concentration in the soil, a decrease in the urease activity was found in the VCP (10–30%), HSA (15–28%), HKC (20–52%), ECY (10–46%), VCP (leach) (10–20%), LPA (17–25%), GPA (19–42%), and LSD (ill.-ferr.) soils (24–35%).
The highest urease activity, despite the Pb contamination, was found in the GPA (30.5–51.7 mg of NH3 per g of soil in 24 h) and LSD (24.1–29.2 mg NH3 per g of soil in 24 h) soils. These soils (GPA and LSD) are forest soils in broad-leaved and mixed forests. These types of soils contain a lot of organic matter, including ammonifying and nitrifying bacteria, which cause high urease activity [49,50]. The lowest urease activity was found in the HKC (4.5–9.3 mg NH3 per g of soil in 24 h) and ECY soils (5.8–10.6 mg NH3 per g of soil in 24 h).
Urease activity is closely related to the processes of ammonification, the nitrification of nitrogen in soil, and the content of organic matter [51]. Carbon functions are closely involved in the regulation of the mineralization and immobilization cycle of nitrogen [52,53]. In soils with a high content of organic matter (GPA and LSD soils), the maximum value of urease was established, and with a low content of organic matter (HKC and ECY soils), the lowest enzymatic activity was observed (Table 1). Earlier, Vasbieva (2019) confirmed that prolonged cultivation of soil leads to a decrease in the content of organic matter, as well as the content of total nitrogen and its non-hydrolyzable, difficult-to-hydrolyze, and easily hydrolyzable fractions, which can be replenished only after the application of organic fertilizers [54].
The change in the integral index of soil enzymatic activity (IIEA). The data obtained in determining the activity of each enzyme were used to calculate the integral index of soil enzymatic activity (IIEA) by enzyme classes (Figure 8). The maximum value of the IIEA generalized by the activity of all enzymes was found in the VCP, VCP (typ.), VCP (leach), and HCP soils, and the lowest value was found in the HKC and LSD soils.
The integral indicator of the soil enzymatic activity of oxidoreductases was less than the IIEA of hydrolases in all soils. The greatest difference between the classes of enzymatic activity was found in the VCP (typ.) (26%), VCP (ord.) (23%), LPA (25%), and LSD soils (27%). In arid soils (HSA, ECY, HKC, and HCP) under the conditions of a lack of precipitation and a light granulometric composition, as well as in the LSD (ill.-ferr.) soil from the Moscow region (a zone of broad-leaved forests), differences between the IISEAs of oxidoreductases and hydrolases could not be established.
The geometric mean of enzymatic activity. Figure 9 shows the values of the geometric mean (GME) enzymes of the oxidoreductase and hydrolase classes of the soils contaminated with Pb. It was found that Pb soil pollution most simulated GME oxidoreductases in comparison with GME hydrolases in soils of dry steppes and semi-deserts (HSA, HKC, and ECY soils), as well as in soils of meadows (VCP), steppes (LPA, HCP, GPA), and broad-leaved forests (LSD ill.-ferr.).
The GME value calculated from the activity of all enzymes for all soils varied in the range of 2.1–3.3. At the same time, the maximum GME value calculated from the activity of all enzymes was found in the HSA (2.7–3.3) and LPA (2.5–3.1) soils. The lowest GME value was found in the ECY (2.1–2.9), VCP (ord.) (2.5–2.7), HCP (2.3–2.8), and LSD soils (2.5–2.6). The GME value calculated from the activity of all enzymes and the GME value of hydrolases were the same in the LSD soil. The predominance of the GME of oxidoreductases is mainly characteristic of soils of the arid zone with a light or medium loamy granulometric composition (except for the VCP (leach) and HCP soils). The amount of precipitation in the region also influences the enzymatic activity of each class [55]. In the soils of the central part of Russia with a large amount of precipitation in the region, a heavy granulometric composition and, as a result, a greater amount of soil moisture, the GME of hydrolases are greater than the GME of oxidoreductases for the VCP (typ.), VCP (ord.), and LSD soils.
It was found that the enzymatic activity of soils was closely related not only to the type of anthropogenic impact but also to the amount of productive moisture in the soil [24]. The index of the GME of oxidoreductases in the VCP (ord.) soil with sunflowers decreased by 16% in the summer compared to the spring, and that of the GME of hydrolases decreased by 60%. The values of the mean geometric enzymatic activity (GMea) of oxidoreductases and hydrolases of oil-contaminated chernozem were stimulated relative to a control with a minimum dose of biochar, sodium humate, nitroammophos, and Baikal EM-1 [14].
Sensitivity and informativeness of biological indicators. The sensitivity of biological indicators for each type of soil was assessed for Pb contamination in Table 3. The enzymes are ranked from “1” to “6”, where “1” is the most sensitive and “6” is the least sensitive enzyme for a given soil type.
The most sensitive enzyme to Pb contamination for all types of soils, without exception, was cysteine reductase. The least sensitive enzymes were phosphatase (in eight out of the twelve soil types) and catalase (in two out of the twelve soil types).
The informativeness of each indicator for each type of soil was assessed by the close relationship between the Pb content and the change in the biological indicator. The series of informative biological indicators for each type of soil are presented below in Table 4. Enzymes are ranked from “1” to “6”, where “1” is the most informative and “6” is the least informative enzyme for a given soil type.
The most informative indicators for Pb contamination were phosphatase (in three out of the twelve soils), cysteine reductase (in three out of the twelve soils), and invertase (in two out of the twelve soils). The least informative indicators were dehydrogenases (in seven out of the twelve soils) and catalase (in three out of the twelve soils).
As can be seen from the above series, the most sensitive and informative enzyme was cysteine reductase only for four out of the twelve soils (HCP, LPA, LSD (ill.-ferr.), and LSD soils). For the other soils, other enzymes were the most informative. The sensitivity of enzymes to contamination with various heavy metals depends on the concentration and chemical form of the metal (oxide, nitrate, or sulfide) [56,57].
When the VCP (ord.) soil was contaminated with oxides and nitrates of Ag, Bi, Te, and Tl, it was found that oxidoreductases showed a greater sensitivity to Ag, Bi, Te, and Tl than hydrolases [25]. Among the oxidoreductases, the greatest sensitivity was found in ferrireductase, and the greatest informativeness was found for peroxidase. Among the enzymes of the hydrolase class, invertase was the most sensitive and informative enzyme.
Thus, the S (cysteine reductase) cycle in soils contaminated with Pb is the most vulnerable. The P (phosphatase) cycle and the redox enzyme (catalase) also have instability in Pb-contaminated soils. The C (invertase and dehydrogenase) and N (urease) cycles do not change significantly when contaminated with heavy metals.
According to the data obtained above, Table 5 was compiled, which shows the state of the enzymatic soil system (from very high to very low activity) of the following different climatic zones with Pb contamination: meadow soils, brackish soils, dry steppes, true steppes, and forest soils.
The activity of dehydrogenases had similar values (30–35 mg of TPF in 10 g in 24 h) in all climatic zones except dry steppes. The catalase activity was also the lowest in the brackish and forest soils. For arid soils, the low activity of oxidoreductases is associated with their physical and chemical properties and the amount of precipitation, while for forest soils, the most important effect on the activity of soil enzymes is exerted by a light and sandy loam granulometric composition. The lowest values of another oxidoreductase, cysteine reductase, were found in the meadow soils (280 mg of formazan per 10 g in 2 h) and dry steppes (250 mg of formazan per 10 g in 2 h), which is associated with the sulfur cycle in these soils [48,58]. The urease activity was the lowest in the meadow soils (12 mg of NH3 per g of soil in 24 h), saline soils (15 mg of NH3 per g of soil in 24 h), and dry steppes (10 mg of NH3 per g of soil in 24 h). The activity of this enzyme is closely related to the carbon content in the soil, expressed in terms of the humus content. In these soils, the humus content, according to Table 1, varies from 0.3 to 3.6%. In contrast, the activity of another hydrolase, invertase, was the highest in the meadow soils (50 mg of glucose in 1 g/24 h) and the lowest in the soils of the dry steppes and semi-deserts (15 mg of glucose in 1 g/24 h). The phosphatase activity was the highest in the soils of the true steppes (250 µg of p-nitrophenol in 1 g of soil per 1 h) and the lowest in the soils of the dry steppes and semi-deserts (65 µg of p-nitrophenol in 1 g of soil per 1 h).
Earlier, scales for assessing the activity of soil enzymes were proposed by Zvyagintsev (1978), Gaponyuk, and Malakhov (1985) [59,60]. However, there is no information on which types of soils and which climatic zones these scales of activity of soil enzymes were developed for. Such scales are actively used for comparative assessments of the ecological state of soil under various types and factors of anthropogenic impacts [61,62,63,64].
Thus, for the first time, the values of the enzymatic activity of soils of different climatic zones were ranked on a scale of assessment from very strong to very poor. Subarid and arid soils, including saline brackish soils and dry steppes, are characterized by high values of enzymes of the S cycle and low values of enzymes of the C, N, P, and O cycles. In subhumid and humid soils, including those of meadows, forests, and true steppes, high values of enzymes of the C, N, P, and O cycles and low values of enzymes of the S cycle are characteristic. Such differences in enzyme values characterizing the C, N, P, O, and S cycles are associated with soil formation factors and the fertilizers applied to the soil [65,66,67,68,69,70,71]. In humid areas, soils accumulate organic matter, compounds of silicon, iron, manganese, and phosphorus, and in arid areas, they accumulate lime, gypsum, and water-soluble salts.

4. Discussion

The reduction and solubility of PbO2 in different types of soils vary depending on their physicochemical properties and the biological and enzyme activity of soil [72]. Lead from fertilizers (e.g., composts and organic amendments) has a toxic effect on the morphological, physiological, and biochemical functions of plants: it changes the permeability of cell membranes, reacts with the active groups of various enzymes involved in plant metabolism, and reacts with phosphate groups of ADP or ATP, as well as replaces essential Ca ions [73,74]. Non-controlled organic amendments may be a source of Pb, whereas mineral phosphate is usually clean. Lead from atmospheric deposition has a less-pronounced toxic effect on soil biotas because its path in the soil begins from above and not from the inside, as in the case of fertilizers. Among all the studied enzymes of different biogeochemical cycles of soils in different natural zones, it was the activity of cysteine reductase that was the most sensitive to Pb contamination. Soil contamination with Pb has been found to inhibit cysteine reductase activity by 40–78%. When Pb contaminates the soil, hydrophobins containing eight cysteine residues form disulfide bridges [75]. Disulfide bonds in proteins (−S−S−) are formed between thiol groups of cysteine residues during the oxidation process. Soil contamination with Pb causes soil oxidation [76,77,78]. Among the 12 soils, the greatest inhibition of cysteine reductase was found for the VCP (leach) soil. Previously, the resistance of the VCP (leach) soil to Pb and oil pollution was studied in the direction of soil bioremediation [79]. At the end of the bioremediation experiment, the enzymatic activity of the oily soil decreased, and the presence of Pb slightly increased the catalase and invertase activity in the first half of the experiment. With joint contamination, the activity of catalase and urease is noticeably suppressed. When Pb acetate contaminates VCP (leach) soil, it has been established that invertase and cellulase are inhibited [80]. The least sensitive enzymes to Pb contamination are catalase (HSA, HKC, ECY, and HCP soils), phosphatase (VCP, VCP (typ.), VCP (ord.), VCP (leach), LPA, GPA, and LSD soils), and dehydrogenases (LSD ill.-ferr.). These enzymes are also indicators of the ecological state and health of the soil in the case of Cd and Hg pollution, soil erosion, different types of land use, etc. [21,81,82,83]. A direct relationship has been established between the concentration of copper and the degree of a decrease in enzyme activity in VCP (leach) soil in the following order of descending sensitivity: catalase > urease > invertase > protease [84]. When VCP (leach) soil is contaminated with Cd, Pb, and Cu, the activity of catalase and urease increases, and the activity of protease and invertase decreases [85]. Simulation experiments on soil contamination with Zn, Pb, Cd, Cr, and Ni show enzymatic activity to be an indicator of the level of degradation and the course of ecosystem restoration [86].
According to the change in enzymatic activity, a number of soils (from the least sensitive to the most sensitive) were compiled for their resistance to Pb pollution in the following order: VCP (typ.) > GPA = HCP > ECY = VCP > HSA > VCP (leach) > VCP (ord.) = LSD ill.-ferr. > LPA > HKC > LSD soils. It was found that the most resistant to Pb pollution were the VCP (typ.), GPA, and HCP soils, and the least stable were the LSD, HKC, and LPA soils. The least resistant soils to Pb contamination are the soils of the arid zone with a light granulometric composition and the forest soils with medium loamy and heavy loamy granulometric compositions.
In the alkaline reaction of the soil environment, the level of metal retention is significantly higher than that in acidic soils [87]. Accordingly, LSD soils (pH = 5.2–5.4) are more unstable and subject to significant contamination with Pb and other heavy metals [88,89]. According to Ivanov et al., in addition to pH, the processes of Pb fixation in sedentary compounds were more strongly influenced by an increased humus content and light granulometric composition of cultivated LSD soils [90]. One of the most recent sources of Pb in soils worldwide is shooting ranges [91]. It was found that the coexistence of Pb and Ca in combination with different ratios with P suggested mechanisms for the exchange of Pb2+ for Ca2+, which led to the stabilization of Pb in orthophosphates. There is a decrease in the mobility and leachability of Pb in the studied soil, which means that the toxicity is reduced. With an increase in the levels of contamination of VCP (leach), GPA, and HKC soils with Cd, Zn, and Pb, a gradual decrease in the intensity of soil respiration was noted, especially when the soils were contaminated with Cd compounds and in the case of polyelement contamination [92]. It was found that due to inoculation by bacteria of the Pseudomonas genus, the content and ratio of forms of heavy metal compounds in the soils of the experiment changed: the content of mobile and organic-related Cd compounds increased, and the content of Cu, Ni, Pb, and Zn associated with organic matter and iron compounds increased [93].

5. Conclusions

Soil pollution with Pb in different climatic zones has a significant impact on the enzymatic system of soils. It was found that the most resistant to Pb pollution were the VCP (typ.), GPA, and HCP soils, and the least stable were the LSD, HKC, and LPA soils. Cysteine reductase is considered the most sensitive enzyme to Pb contamination. Cysteine reductase is the most informative and sensitive enzyme for the HCP, LSD (ill.-ferr.), and LSD soils. For the other soils, the most informative enzymes were phosphatase and catalase. In arid soils, such as the HSA, ECY, HKC, and HCP soils, when there is a lack of precipitation or the soils have a light granulometric composition, as well as in LSD (ill.-ferr.) (zone of broad-leaved forests) soils, differences between the IISEAs of oxidoreductases and hydrolases have not been established. In soils with a large amount of precipitation in the region, a heavy granulometric composition, and, as a result, a greater amount of soil moisture, GME hydrolases are greater than GME oxidoreductases, such as in VCP (typ.), VCP (ord.), and LSD soils. The S (cysteine reductase) cycle in soils contaminated with Pb is the most vulnerable. The P (phosphatase) cycle and the redox enzyme (catalase) also have instability in Pb-contaminated soils. The C (invertase, dehydrogenase) and N (urease) cycles do not change significantly when contaminated with Pb. The results of this study can be used to assess the ecological state and health of soils with Pb pollution.

Author Contributions

Conceptualization, T.M., S.K. and A.K.; methodology, S.K.; software, T.M.; formal analysis, A.K.; investigation, A.K., T.M. and S.K.; resources, T.M.; data curation, T.M.; writing—original draft preparation, D.T., E.K., T.M. and A.T.; writing—review and editing, A.K., E.K., A.T. and T.M.; visualization, T.M.; supervision, T.M.; project administration, S.K. and T.M.; funding acquisition, T.M. and S.K. All authors have read and agreed to the published version of the manuscript.

Funding

This research was funded by financial support from the project of the Strategic Academic Leadership Program of the Southern Federal University (“Priority 2030”) (No. SP-12-23-01), the Ministry of Science and Higher Education of the Russian Federation, the Soil Health Laboratory of the Southern Federal University (agreement No. 075- 15-2022-1122), of the Ministry of Science and Higher Education of Russia on the Young Scientist Laboratory within the framework of the Interregional Scientific and Educational Center of the South of Russia (FENW-2024-0001).

Institutional Review Board Statement

Not applicable.

Informed Consent Statement

Not applicable.

Data Availability Statement

Data are contained within the article.

Conflicts of Interest

The authors declare no conflicts of interest.

References

  1. Ladonin, D.V. Lead Isotopic Composition in Soils of the Impact Zone of the Cherepovets Steel Mill. Moscow Univ. Soil Sci. Bull. 2022, 77, 253–257. [Google Scholar] [CrossRef]
  2. Titov, A.F.; Kaznina, N.M.; Karapetyan, T.A.; Dorshakova, N.V. Effect of lead on living organisms. J. Gen. Biol. 2020, 81, 147–160. [Google Scholar] [CrossRef]
  3. Zubarev, V.A.; Mishchuk, S.N. Changes in the concentrations of heavy metals in soils in the south of the Middle Amur Lowland during long-term agricultural use. News Tomsk. Polytech. Univ. Georesources Eng. 2019, 330, 18–26. [Google Scholar]
  4. Voloshin, E.I.; Polosina, V.A.; Burina, M.V. The influence of chemicalization agents on the content of heavy metals, fluorine in soils and the quality of plant products in JSC Iskra and the agricultural firm Uchumskaya in the Uzhur region of Central Siberia. Bull. Krasn. State Agrar. Univ. 2020, 8, 18–26. [Google Scholar]
  5. Pobilat, A.E.; Kirichuk, A.A.; Baranova, O.V. Monitoring the content of heavy metals in agricultural crops in the South of Central Siberia. Probl. Reg. Ecol. 2023, 6, 56–62. [Google Scholar] [CrossRef]
  6. He, Z.L.; Yang, X.E.; Stoffella, P.J. Trace elements in agroecosystems and impacts on the environment. J. Trace Elem. Med. Biol. 2005, 19, 125–140. [Google Scholar] [CrossRef]
  7. Gómez, V.; Molina-Roco, M.; Chichipe, E.; Morales Rojas, E. Trace Elements in Fertilizers Used in Peru. OnLine J. Biol. Sci. 2023, 23, 225. [Google Scholar] [CrossRef]
  8. Ivanova, Y.S.; Gorbachev, V.N. Soil contamination with heavy metals under the influence of unauthorized landfills (medical and environmental aspect). Ulyanovsk. J. Med. Biol. 2012, 1, 119–124. [Google Scholar]
  9. Makarov, O.A.; Strokov, A.S.; Tsvetnov, E.V.; Abdulkhanova, D.R.; Krasilnikova, V.S.; Shcherbakova, L.S. Assessment of damage from soil degradation and lands of the constituent entities of the Russian Federation. Agriculture 2020, 6, 3–6. [Google Scholar] [CrossRef]
  10. Kushwaha, A.; Hans, N.; Kumar, S.; Rani, R. A critical review on speciation, mobilization andtoxicity of lead in soil-microbe-plant system and bioremediation strategies. Ecotoxicol. Environ. Saf. 2018, 147, 1035–1045. [Google Scholar] [CrossRef]
  11. Ouabo, R.E.; Ogundiran, M.B.; Sangodoyin, A.Y.; Babalola, B.A. Ecological risk and human health implications of heavy metals contamination of surface soil in Ewaste recycling sites in Douala, Cameroun. J. Health Pollut. 2019, 9, 190310. [Google Scholar] [CrossRef] [PubMed]
  12. Baenguev, B.A.; Belogolova, G.A.; Chuparina, E.V.; Prosekin, S.N.; Dolgikh, P.G.; Pastukhov, M.V. Distribution of lead content and forms of its compounds in technogenic soil of Svirsk (Southern Baikal region). News Tomsk. Polytech. Univ. Georesource Eng. 2022, 333, 205–214. [Google Scholar] [CrossRef]
  13. Minnikova, T.; Kolesnikov, S.; Evstegneeva, N.; Timoshenko, A.; Tsepina, N. Estimation of the Enzymatic Activity of Haplic Chernozem under Contamination with Oxides and Nitrates of Ag, Bi, Te and Tl. Agronomy 2022, 12, 2183. [Google Scholar] [CrossRef]
  14. Minnikova, T.V.; Ruseva, A.S.; Kolesnikov, S.I. Assessment of enzymatic activity of oil-contaminated chernozem after bioremediation. News Timiryazev Agric. Acad. 2022, 5, 5–20. [Google Scholar] [CrossRef]
  15. Goswami, O.; Rouff, A.A. Soil Lead Concentration and Speciation in Community Farms of Newark, New Jersey, USA. Soil Syst. 2021, 5, 2. [Google Scholar] [CrossRef]
  16. Obrycki, J.F.; Perez-Guzman, L. The Utility and Futility of Soil Health Assessment. In Soil Health Series; American Society of Agronomy: Madison, WI, USA, 2021. [Google Scholar] [CrossRef]
  17. Minnikova, T.; Kolesnikov, S.; Revina, S.; Ruseva, A.; Gaivoronsky, V. Enzymatic Assessment of the State of Oil-Contaminated Soils in the South of Russia after Bioremediation. Toxics 2023, 11, 355. [Google Scholar] [CrossRef] [PubMed]
  18. Utobo, E.B.; Tewari, L. Soil enzymes as bioindicators of soil ecosystem status. Appl. Ecol. Environ. Res. 2014, 13, 147–169. [Google Scholar] [CrossRef]
  19. Acosta-Martínez, V.; Perez-Guzman, L.; Johnson, J.M.F. Simultaneous determination of β-glucosidase, β-glucosaminidase, acid phosphomonoesterase, and arylsulfatase activities in a soil sample for a biogeochemical cycling index. Appl. Soil Ecol. 2019, 142, 72–80. [Google Scholar] [CrossRef]
  20. Acosta-Martinez, V.; Cotton, J.; Slaughter, L.C.; Ghimire, R.; Roper, W. Soil Health Assessment to Evaluate Conservation Practices in SemiArid Cotton Systems at Producer Site Scale. Soil Syst. 2023, 7, 72. [Google Scholar] [CrossRef]
  21. Revina, S.; Minnikova, T.; Ruseva, A.; Kolesnikov, S.; Kutasova, A. Catalase activity as a diagnostic indicator of the health of oil-contaminated soils after remediation. Environ. Monit. Assess. 2024, 196, 449. [Google Scholar] [CrossRef]
  22. Reinersmann, T.; Herre, M.; Marschner, B.; Heinze, S. Soil Enzyme Activity Response to Substrate and Nutrient Additions on Undisturbed Forest Subsoil Samples. Soil Syst. 2023, 7, 57. [Google Scholar] [CrossRef]
  23. Polyak, Y.M.; Sukharevich, V.I. Soil enzymes and soil pollution: Biodegradation, bioremediation, bioindication. Agrochemistry 2020, 3, 83–93. [Google Scholar] [CrossRef]
  24. Mokrikov, G.; Minnikova, T.; Kazeev, K.; Kolesnikov, S. Use of soil enzyme activity in assessing the effect of No-Till in the South of Russia. Agron. Res. 2021, 19, 171–184. [Google Scholar] [CrossRef]
  25. Minnikova, T.V.; Kolesnikov, S.I.; Evstegneeva, N.A.; Timoshenko, A.N.; Tsepina, N.I.; Kazeev, K.S. Assessment of enzymatic activity of haplic chernozem soils contaminated with Ag, Bi, Te, and Tl. Eurasian Soil Sci. 2024, 57, 395–408. [Google Scholar] [CrossRef]
  26. Papa, S.; Alvarez-Romero, M. Biological Activities in Artificially Heavy-Metal-Contaminated Growing Substrates. Soil Syst. 2023, 7, 111. [Google Scholar] [CrossRef]
  27. Sevak, P.I.; Pushkar, B.K.; Kapadne, P.N. Lead pollution and bacterial bioremediation: A review. Environ. Chem. Lett. 2021, 19, 4463–4488. [Google Scholar] [CrossRef]
  28. Chen, F.; Zhang, S.; Chen, Z.; Zhang, Y.; Cao, B. Phytoremediation of Toxic Lead from Contaminated Soil Using Neyraudia reynaudiana: Soil of Xuzhou as a Case Study. Agronomy 2024, 14, 118. [Google Scholar] [CrossRef]
  29. Marzadori, C.; Ciavatta, C.; Montecchio, D.; Gessa, C. Effects of lead pollution on different soil enzyme activities. Biol. Fertil. Soils 1996, 22, 53–58. [Google Scholar] [CrossRef]
  30. Zeng, L.S.; Liao, M.; Chen, C.L.; Huang, C.Y. Effects of lead contamination on soil enzymatic activities, microbial biomass, and rice physiological indices in soil-lead-rice (Oryza sativa L.) system. Ecotoxicol. Environ. Saf. 2007, 67, 67–74. [Google Scholar] [CrossRef]
  31. Zhou, F.; Wang, J.; Yang, N.; Zhang, Q.; Zou, P. Effects of Lead and Water Stress on Soil Enzyme Activities from Two Plant Species. Nat. Environ. Pollut. Technol. 2014, 13, 31–36. [Google Scholar]
  32. Effron, D.; de la Horra, A.M.; Defrieri, R.L.; Fontanive, V.; Palma, R.M. Effect of Cadmium, Copper, and Lead on Different Enzyme Activities in a Native Forest Soil. Commun. Soil Sci. Plant Anal. 2004, 35, 1309–1321. [Google Scholar] [CrossRef]
  33. Novoselova, E.I.; Volkova, O.O.; Turyanova, R.R. Enzymatic transformation of organic residues in soils contaminated with heavy metals. Ecol. Urban Areas 2019, 1, 75–81. [Google Scholar] [CrossRef]
  34. Prokopchuk, V.F.; Chernositova, T.N.; Naumenko, A.V.; Khairulina, T.P. Methods for studying the composition, properties and regimes of soils: Workshop. In Blagoveshchensk: Far Eastern State Publishing House; Agrarian University: Yerevan, Armenia, 2018; 31p. [Google Scholar]
  35. Semendyaeva, N.V.; Marmulev, A.N.; Dobrotvorskaya, N.I. Methods for studying soils and soil cover: Textbook. In Novosibirsk State Agrarian University, SibNIIZIKh—Novosibirsk; Publishing House of NGAU: Novosibirsk, Novosibirsk Region, Russia, 2011; p. 202. [Google Scholar]
  36. Khaziev, F.K. Methods of Soil Enzymology; Nauka, M., Ed.; Wiley: Moscow, Russia, 2005; 252p. [Google Scholar]
  37. Kolesnikov, S.I.; Kazeev, K.S.; Akimenko, Y.V. Development of regional standards for pollutants in the soil using biological parameters. Environ. Monit. Assess. 2019, 191, 544–550. [Google Scholar] [CrossRef]
  38. Garcia-Ruiz, R.; Ochoa, V.; Hinojosa, M.B.; Carreira, J.A. Suitability of enzyme activities for the monitoring of soil quality improvement in organic agricultural systems. Soil Biol. Biochem. 2008, 40, 2137–2145. [Google Scholar] [CrossRef]
  39. Gao, Y.; Wang, J.; Xu, J.; Kong, X.; Zhao, L.; Zeng, D.H. Assessing the quality of oil contaminated saline soil using two composite indices. Ecol. Indic. 2013, 24, 105–112. [Google Scholar] [CrossRef]
  40. Galstyan, A.S. Enzymatic Activity of Soils in Armenia; Hayastan: Yerevan, Armenia, 1974; 275p. [Google Scholar]
  41. Khaziev, F.K. Functional role of enzymes in soil processes. Bull. Acad. Sci. Repub. Bashkortostan 2015, 20, 14–24. [Google Scholar]
  42. Wyszkowska, J.; Wyszkowski, M. Activity of soil dehydrogenases, urease, and acid and alkaline phosphatases in soil polluted with petroleum. J. Toxicol. Environ. Health 2010, 73, 1202–1210. [Google Scholar] [CrossRef]
  43. Belousova, E.N.; Belousov, A.A. The influence of soil protection technologies on the content of mobile organic matter and the enzymatic activity of the soil. Agrochemistry 2022, 5, 30–37. [Google Scholar] [CrossRef]
  44. Lapa, V.V.; Mikhailovskaya, N.A.; Barashenko, T.B.; Pogirnitskaya, T.V.; Dyusova, S.V. Biochemical and microbiological indicators for assessing the influence of anthropogenic load on soil fertility. Soil Sci. Agrochem. 2014, 2, 28–42. [Google Scholar]
  45. Marcinkeviciene, A.; Boguzas, V.; Balnyte, S.; Pupaliene, R.; Velicka, R. Influence of crop rotation, intermediate crops, and organic fertilizers on the soil enzymatic activity and humus content in organic farming systems. Eurasian Soil Sci. 2013, 46, 198–203. [Google Scholar] [CrossRef]
  46. Merkusheva, M.G.; Ubugunov, L.L.; Boloneva, L.N.; Lavrentieva, I.N. Sulfur in rain-fed and irrigated chestnut soils and assessment of the use of increasing doses of sulfur fertilizers (against the background of NPK) for potatoes. Agrochemistry 2023, 3, 20–28. [Google Scholar] [CrossRef]
  47. Chevychelov, A.V.; Levshakov, L.V.; Lazarev, V.I. The influence of fertilizers containing sulfur on the yield and grain quality of spring wheat in the conditions of the Kursk region. Int. J. Agric. 2019, 4, 54–57. [Google Scholar] [CrossRef]
  48. Aristarkhov, A.N. Sulfur in Russian agroecosystems: Monitoring the content in soils and the effectiveness of its use. Int. Agric. J. 2016, 5, 39–47. [Google Scholar]
  49. Błońska, E.; Lasota, J.; Gruba, P. Effect of temperate forest tree species on soil dehydrogenase and urease activities in relation to other properties of soil derived from loess and glaciofluvial sand. Ecol. Res. 2016, 31, 655–664. [Google Scholar] [CrossRef]
  50. Pajares, S.; Bohannan, B.J.M. Ecology of Nitrogen Fixing, Nitrifying, and Denitrifying Microorganisms in Tropical Forest Soils. Front. Microbiol. 2016, 7, 1045–1052. [Google Scholar] [CrossRef] [PubMed]
  51. Naimi, O.I. Patterns of profile distribution of urease in ordinary chernozem in agrocenosis. Int. J. Humanit. Nat. Sci. 2019, 8, 12–14. [Google Scholar] [CrossRef]
  52. Nieder, R.; Benbi, D.K. Carbon and Nitrogen in the Terrestrial Environment; Springer: Dordrecht, The Netherlands, 2008; 430p. [Google Scholar]
  53. Semenov, V.M. Functions of carbon in the mineralization-immobilization turnover of nitrogen in soil. Agrochemistry 2020, 6, 78–96. [Google Scholar] [CrossRef]
  54. Vasbieva, M.T. Effect of long-term application of organic and mineral fertilizers on the organic carbon content and nitrogen regime of soddy-podzolic soil. Eurasian Soil Sci. 2019, 52, 1422–1428. [Google Scholar] [CrossRef]
  55. Mokrikov, G.V.; Minnikova, T.V.; Kazeev, K.S.; Kolesnikov, S.I. The influence of productive moisture reserves and the amount of precipitation on yields under the condition of direct sowing of agricultural crops in the Rostov region. Samara Sci. Bull. 2019, 8, 69–75. [Google Scholar] [CrossRef]
  56. Karaca, A.; Cetin, S.C.; Turgay, O.C.; Kizilkaya, R. Effects of Heavy Metals on Soil Enzyme Activities. In Soil Heavy Metals. Soil Biology; Springer: Berlin/Heidelberg, Germany, 2010; Volume 19. [Google Scholar] [CrossRef]
  57. Hong, Y.K.; Kim, J.W.; Lee, S.P.; Yang, J.E.; Kim, S.C. Heavy metal remediation in soil with chemical amendments and its impact on activity of antioxidant enzymes in Lettuce (Lactuca sativa) and soil enzymes. Appl. Biol. Chem. 2020, 63, 42. [Google Scholar] [CrossRef]
  58. Cherkasov, E.A.; Lobachev, D.A.; Zakharova, D.A. Content of mobile sulfur in soils of agricultural lands in the Ulyanovsk region. Bull. Ulyanovsk. State Agric. Acad. 2018, 1, 54–59. [Google Scholar] [CrossRef]
  59. Zvyagintsev, D.G. Biological activity of soils and scales for assessing some of its indicators. Eurasian Soil Sci. 1978, 6, 48–54. [Google Scholar]
  60. Gaponyuk, E.I.; Malakhov, S.V. Complex system of indicators of soils environmental monitoring. In Proceedings of the 4th All-Union Conference Gidrometeoizdat, Moscow, Russia, 14–16 May 1985; pp. 3–10. [Google Scholar]
  61. Tovstik, E.V.; Olkova, A.S. Assessment of the influence of factors of abiotic nature on the enzymatic activity of soil. Ecobiotech 2021, 4, 128–134. [Google Scholar] [CrossRef]
  62. Piletskaya, O.A.; Yachnaya, D.A. The influence of storage times and methods on changes in the activity of enzymes in the chernozem-like soil of the Zeya-Bureya Plain. Bull. Soil Inst. 2022, 112, 48–72. [Google Scholar] [CrossRef]
  63. Tsandekova, O.L.; Ufimtsev, V.I. Activity of soil hydrolytic enzymes in the phytogenic field of Acer negundo L. in conditions of disturbed floodplain communities. News Samara Sci. Cent. Russ. Acad. Sci. 2018, 20, 92–96. [Google Scholar] [CrossRef]
  64. Tsandekova, O.L.; Ufimtsev, V.I. Enzymatic activity of soil under ash-leaved maple plantations in floodplain forest biogeocenoses. Lesovedenie 2021, 4, 437–445. [Google Scholar] [CrossRef]
  65. Litvinovich, A. Degradation of well-cultivated soils in humid and arid regions. In Lap Lambert; Academic Publishing: Cambridge, MA, USA, 2011; 279p, ISBN 978-3-8454-2837-6. [Google Scholar]
  66. Semenkov, I.N.; Sharapova, A.V.; Lednev, S.A.; Koroleva, T.V. Fractional composition of metal and sulfur compounds in the upper layer of soil in zones affected by a coal mine waste heap (Central Russian forest-steppe). Arid. Ecosyst. 2023, 29, 118–127. [Google Scholar]
  67. Kulikova, A.K.; Dozorov, A.V.; Cherkasov, E.A.; Zakharova, D.A.; Smyvalov, V.S. Sulfur content in soils of the Ulyanovsk region, the yield of spring wheat and the balance of nutrients in leached chernozem when using sulfur-containing fertilizers. Int. J. Agric. 2019, 3, 50–54. [Google Scholar] [CrossRef]
  68. Prudnikova, E.Y.; Savin, I.Y.; Lebedeva, M.P.; Volkov, D.S.; Rogova, O.B.; Varlamov, E.B.; Abrosimov, K.N. Transformation of the surface layer in the arable soil horizon under the impact of atmospheric precipitation. Eurasian Soil Sci. 2021, 54, 1770–1781. [Google Scholar] [CrossRef]
  69. Sorokin, A.S.; Kust, G.S.; Abrosimov, K.N.; Lebedeva, M.P. Composition and structure of aggregates from compacted soil horizons in the southern steppe zone of European Russia. Eurasian Soil Sci. 2016, 49, 326–337. [Google Scholar] [CrossRef]
  70. Mikkelsen, R.; Norton, R. Sulfur in soils and sulfur-containing fertilizers. Int. Inst. Plant Nutr. 2014, 3, 6–9. [Google Scholar]
  71. Yudin, S.A.; Plotnikova, O.O.; Belobrov, V.P.; Lebedeva, M.P.; Abrosimov, K.N.; Ermolaev, N.R. Quantitative charactristics of the microstructure of typical chernozems using different agricultural technologies. Eurasian Soil Science. Eurasian Soil Sci. 2023, 6, 774–786. [Google Scholar] [CrossRef]
  72. Lin, Y.-P.; Valentine, R.L. Reduction of Lead Oxide (PbO2) and Release of Pb(II) in Mixtures of Natural Organic Matter, Free Chlorine and Monochloramine. Environ. Sci. Technol. 2009, 43, 3872–3877. [Google Scholar] [CrossRef] [PubMed]
  73. Pourrut, B.; Shahid, M.; Dumat, C.; Winterton, P.; Pinelli, E. Lead uptake, toxicity, and detoxification in plants. Rev. Environ. Contam. Toxicol. 2011, 213, 113–136. [Google Scholar] [CrossRef] [PubMed]
  74. Hassan, S.H.; Chafik, Y.; Lebrun, M.; Sferra, G.; Bourgerie, S.; Scippa, G.; Morabito, D.; Trupiano, D. Lead Toxicity and Tolerance in Plants: Insights from Omics Studies. In Heavy Metal Toxicity and Tolerance in Plants: A Biological, Omics, and Genetic Engineering Approach; Wiley: Hoboken, NJ, USA, 2023. [Google Scholar] [CrossRef]
  75. Popov, A.I.; Konoplina, L.Y.; Komolkina, N.A.; Prilepa, S.V.; Sazanova, E.V.; Kholostov, G.D. Component composition of soil organic matter. Sci. Herit. 2021, 65, 11–19. [Google Scholar] [CrossRef]
  76. Wuana, R.A.; Okieimen, F.E. Heavy Metals in Contaminated Soils: A Review of Sources, Chemistry, Risks and Best Available Strategies for Remediation. Int. Sch. Res. Not. 2011, 402647. [Google Scholar] [CrossRef]
  77. Darma, A.; Ibrahim, S.; Sani, A.; Zandi, P.; Yang, J. Appraisal of lead (Pb) contamination and potential exposure risk associated with agricultural soils and some cultivated plants in gold mines. Environ. Syst. Res. 2022, 11, 14. [Google Scholar] [CrossRef]
  78. Mosina, L.V.; Dovletyarova, E.A.; Efremova, S.Y.; Norvosuren, Z. Ecological danger of soil pollution with heavy metals (using the example of lead). News Penza State Pedagog. Univ. 2012, 29, 383–386. [Google Scholar]
  79. Rafikova, G.F.; Kuzina, E.V.; Korshunova, T.Y. The influence of bioremediation on the biological activity of leached chernozem contaminated with oil and lead. Eurasian Soil Sci. 2022, 3, 354–369. [Google Scholar] [CrossRef]
  80. Ananyeva, Y.S.; Shpis, T.E. The influence of lead contamination on the biological properties of leached chernozem. Bull. Altai State Agrar. Univ. 2010, 72, 29–32. [Google Scholar]
  81. Yeboah, J.O.; Shi, G.; Shi, W. Effect of Heavy Metal Contamination on Soil Enzymes Activities. J. Geosci. Environ. Prot. 2021, 9, 135–154. [Google Scholar] [CrossRef]
  82. Zheng, L.; Li, Y.; Shang, W.; Dong, X.; Tang, Q.; Cheng, H. The inhibitory effect of cadmium and/or mercury on soil enzyme activity, basal respiration, and microbial community structure in coal mine-affected agricultural soil. Ann. Microbiol. 2019, 69, 849–859. [Google Scholar] [CrossRef]
  83. Donkova, R.; Deribeeva, D.; Nedyalkova, K. Enzyme activity of Chromic Luvisols under different degree of erosion and land use. Eurasian J. Soil Sci. 2017, 6, 37–43. [Google Scholar] [CrossRef]
  84. Korotchenko, I.S.; Kirienko, N.N. Enzymatic activity of leached chernozem contaminated with copper. Bull. Krasn. State Agrar. Univ. 2014, 3, 103–109. [Google Scholar]
  85. Korotchenko, I.S. Phytotoxicity and Enzymatic activity of leached chernozem due to contamination with heavy metals. Bull. Krasn. State Agrar. Univ. 2011, 5, 109–115. [Google Scholar]
  86. Ciarkowska, K. Enzyme Activities in Soils Contaminated with Heavy Metals in Varying Degrees. In Heavy Metal Contamination of Soils. Soil Biology; Sherameti, I., Varma, A., Eds.; Springer: Cham, Switzerland, 2015; Volume 44. [Google Scholar] [CrossRef]
  87. Golia, E.E.; Kantzou, O.D.; Chartodiplomenou, M.A.; Papadimou, S.G.; Tsiropoulos, N.G. Study of Potentially Toxic Metal Adsorption in a Polluted Acid and Alkaline Soil: Influence of Soil Properties and Levels of Metal Concentration. Soil Syst. 2023, 7, 16. [Google Scholar] [CrossRef]
  88. Vitkovskaya, S.E.; Yakovlev, O.N.; Shavrina, K.F. The influence of increasing doses of dolomite flour on the acid-base properties of sod-podzolic soil. Agrochemistry 2016, 7, 3–11. [Google Scholar]
  89. Vitkovskaya, S.E.; Shavrina, K.F. Dynamics of acidity of sod-podzolic soil depending on the dose of lime ameliorant. Agrophysics 2021, 1, 1–6. [Google Scholar] [CrossRef]
  90. Ivanov, A.I.; Sukhanov, P.A.; Ivanova, Z.A.; Yakovleva, T.I. Agroecological significance of the cultivation of sandy soddy-podzolic soils with Pb and Cd contamination. Agrochemistry 2019, 4, 70–78. [Google Scholar] [CrossRef]
  91. Porfido, C.; Gattullo, C.E.; Allegretta, I.; Fiorentino, N.; Terzano, R.; Fagnano, M.; Spagnuolo, M. Investigating Lead Bioavailability in a Former Shooting Range by Soil Microanalyses and Earthworms Tests. Soil Syst. 2022, 6, 25. [Google Scholar] [CrossRef]
  92. Plekhanova, I.O.; Zolotareva, O.A. Assessment and regulation of the ecological state of soils contaminated with heavy metals. Agrochemistry 2021, 7, 83–94. [Google Scholar]
  93. Plekhanova, I.O.; Kulikov, V.O.; Shabaev, V.P. Influence of rhizosphere bacteria on the fractional composition of heavy metal compounds in the soil-plant system. Eurasian Soil Sci. 2022, 9, 1179–1186. [Google Scholar]
Figure 1. Scheme of the model experiment.
Soilsystems 08 00076 g001
Figure 2. Change in catalase activity in soils contaminated with lead, ml O2/1 g/1 min: (A) Voronic Chernozems Pachic; (B) Haplic Solonchaks Aridic; (C) Haplic Kastanozems Chromic; (D) Endosalic Calcisols Yermic; (E) Voronic Chernozems Pachic (typical); (F) Voronic Chernozems Pachic (ordinary); (G) Voronic Chernozems Pachic (leached); (H) Luvic Phaeozems Albic; (I) Greyic Phaeozems Albic; (J) Haplic Chernozems Pachic; (K) Luvic Stagnosols Dystric (illuvial ferrugenous); (L) Luvic Stagnosols Dystric. Note: The different lowercase letters per column indicate significant differences (p < 0.05) among different ages that based on one-way ANOVA: (a)—does not differ significantly from the control; (b)—significant difference from control (p < 0.05); (c)—significant difference from control (p < 0.01).
Soilsystems 08 00076 g002
Figure 3. Change in the activity of dehydrogenases in soils contaminated with lead, mg TPF/1 g/24 h: (A) Voronic Chernozems Pachic; (B) Haplic Solonchaks Aridic; (C) Haplic Kastanozems Chromic; (D) Endosalic Calcisols Yermic; (E) Voronic Chernozems Pachic (typical); (F) Voronic Chernozems Pachic (ordinary); (G) Voronic Chernozems Pachic (leached); (H) Luvic Phaeozems Albic; (I) Greyic Phaeozems Albic; (J) Haplic Chernozems Pachic; (K) Luvic Stagnosols Dystric (illuvial ferrugenous); (L) Luvic Stagnosols Dystric. Note: The different lowercase letters per column indicate significant differences (p < 0.05) among different ages that based on one-way ANOVA: (a)—does not differ significantly from the control; (b)—significant difference from control (p < 0.05); (c)—significant difference from control (p < 0.01): (d)—significant difference from control (p < 0.0075).
Soilsystems 08 00076 g003
Figure 4. Change in invertase activity in soils contaminated with lead, mg glucose/1 g/24 h: (A) Voronic Chernozems Pachic; (B) Haplic Solonchaks Aridic; (C) Haplic Kastanozems Chromic; (D) Endosalic Calcisols Yermic; (E) Voronic Chernozems Pachic (typical); (F) Voronic Chernozems Pachic (ordinary); (G) Voronic Chernozems Pachic (leached); (H) Luvic Phaeozems Albic; (I) Greyic Phaeozems Albic; (J) Haplic Chernozems Pachic; (K) Luvic Stagnosols Dystric (illuvial ferrugenous); (L) Luvic Stagnosols Dystric. Note: The different lowercase letters per column indicate significant differences (p < 0.05) among different ages that based on one-way ANOVA: (a)—does not differ significantly from the control; (b)—significant difference from control (p < 0.05); (c)—significant difference from control (p < 0.01): (d)—significant difference from control (p < 0.0075).
Soilsystems 08 00076 g004
Figure 5. Change in the activity of cysteine reductase in soils contaminated with lead, mg formazan/10 g/2 h: (A) Voronic Chernozems Pachic; (B) Haplic Solonchaks Aridic; (C) Haplic Kastanozems Chromic; (D) Endosalic Calcisols Yermic; (E) Voronic Chernozems Pachic (typical); (F) Voronic Chernozems Pachic (ordinary); (G) Voronic Chernozems Pachic (leached); (H) Luvic Phaeozems Albic; (I) Greyic Phaeozems Albic; (J) Haplic Chernozems Pachic; (K) Luvic Stagnosols Dystric (illuvial ferrugenous); (L) Luvic Stagnosols Dystric. Note: The different lowercase letters per column indicate significant differences (p < 0.05) among different ages that based on one-way ANOVA: (a)—does not differ significantly from the control; (b)—significant difference from control (p < 0.05); (c)—significant difference from control (p < 0.01); (d)—significant difference from control (p < 0.0075); (e)—significant difference from control (p < 0.005); (f)—significant difference from control (p < 0.0025).
Soilsystems 08 00076 g005
Figure 6. Change in phosphatase activity in soils contaminated with lead, μg of p-nitrophenol in 1 g of soil per 1 h: (A) Voronic Chernozems Pachic; (B) Haplic Solonchaks Aridic; (C) Haplic Kastanozems Chromic; (D) Endosalic Calcisols Yermic; (E) Voronic Chernozems Pachic (typical); (F) Voronic Chernozems Pachic (ordinary); (G) Voronic Chernozems Pachic (leached); (H) Luvic Phaeozems Albic; (I) Greyic Phaeozems Albic; (J) Haplic Chernozems Pachic; (K) Luvic Stagnosols Dystric (illuvial ferrugenous); (L) Luvic Stagnosols Dystric. Note: The different lowercase letters per column indicate significant differences (p < 0.05) among different ages that based on one-way ANOVA: (a)—does not differ significantly from the control; (b)—significant difference from control (p < 0.05).
Soilsystems 08 00076 g006
Figure 7. Change in urease activity in soils contaminated with lead, mg NH3 per g of soil over 24 h: (A) Voronic Chernozems Pachic; (B) Haplic Solonchaks Aridic; (C) Haplic Kastanozems Chromic; (D) Endosalic Calcisols Yermic; (E) Voronic Chernozems Pachic (typical); (F) Voronic Chernozems Pachic (ordinary); (G) Voronic Chernozems Pachic (leached); (H) Luvic Phaeozems Albic; (I) Greyic Phaeozems Albic; (J) Haplic Chernozems Pachic; (K) Luvic Stagnosols Dystric (illuvial ferrugenous); (L) Luvic Stagnosols Dystric. Note: The different lowercase letters per column indicate significant differences (p < 0.05) among different ages that based on one-way ANOVA: (a)—does not differ significantly from the control; (b)—significant difference from control (p < 0.05); (c)—significant difference from control (p < 0.01).
Soilsystems 08 00076 g007
Figure 8. Change in the integral indicator of enzymatic activity of soils contaminated with lead: (A) Voronic Chernozems Pachic; (B) Haplic Solonchaks Aridic; (C) Haplic Kastanozems Chromic; (D) Endosalic Calcisols Yermic; (E) Voronic Chernozems Pachic (typical); (F) Voronic Chernozems Pachic (ordinary); (G) Voronic Chernozems Pachic (leached); (H) Luvic Phaeozems Albic; (I) Greyic Phaeozems Albic; (J) Haplic Chernozems Pachic; (K) Luvic Stagnosols Dystric (illuvial ferrugenous); (L) Luvic Stagnosols Dystric.
Soilsystems 08 00076 g008
Figure 9. Change in geometric mean of enzymes (GME) of the oxidoreductase and hydrolase classes in lead-contaminated soils: (A) Voronic Chernozems Pachic; (B) Haplic Solonchaks Aridic; (C) Haplic Kastanozems Chromic; (D) Endosalic Calcisols Yermic; (E) Voronic Chernozems Pachic (typical); (F) Voronic Chernozems Pachic (ordinary); (G) Voronic Chernozems Pachic (leached); (H) Luvic Phaeozems Albic; (I) Greyic Phaeozems Albic; (J) Haplic Chernozems Pachic; (K) Luvic Stagnosols Dystric (illuvial ferrugenous); (L) Luvic Stagnosols Dystric.
Soilsystems 08 00076 g009
Table 1. Characteristics of sampling sites and soil properties.
NoType of Soil (WRB, 2022) Place of SelectionCoordinatesSoil Granulometric Composition, %Corg, %pHCEC, mg × eq/100 g Soil
ClaySandSilt
Soils of meadow
1.Voronic Chernozems Pachic (VCP)Stavropol Territory, Kochubeevsky district, st. Barsukovskaya44°47′43.93″ N
41°51′3.70″ E
2238403.598.223.0
2.Haplic Solonchaks Aridic (HSA)Saline and alkaline soils, Republic of Kalmykia, Yashkul district, Utta village46°18′33.96″ N
45°51′34.98″ E
1479141.757.421.7
Soils of dry steppes and semi-deserts
3.Haplic Kastanozems Chromic (HKC)Rostov region, Remontnensky district, Privolny village46°42′41.92″ N
43°17′49.24″ E
115840.518.128.5
4.Endosalic Calcisols Yermic (ECY)Republic of Kalmykia, Yashkul district, Khulkhuta village46°12′4.89″ N
45°25′32.07″ E
1472140.308.021.7
Soils of steppe
5.Voronic Chernozems Pachic (typical) (VCP(typ.))Voronezh region, Kashira district, Mosalskoe village51°22′15.40″ N
39°32′50.20″ E
4328298.877.654.5
6.Voronic Chernozems Pachic (ordinary) (VCP(ord.))Voronezh region, Bogucharsky district, Filonovo village50° 3′5.41″ N
40°25′59.22″ E
3029416.267.851.2
7.Voronic Chernozems Pachic (leached) (VCP(leach))Tula region, Volovsky district, Zapovednoe village53°25′57.89″ N
38°10′11.54″ E
3039317.797.449.5
8.Luvic Phaeozems Albic (LPA)Tula region, Venevsky district, Ulyanovka village54°23′54.78″ N
54°23′54.78″ E
3138316.007.331.7
9.Haplic Chernozems Pachic (HCP)Rostov region, Millerovsky district, st. Malchevskaya49°1′59.58″ N
40°27′27.81″ E
4237213.477.247.7
10.Greyic Phaeozems Albic (GPA)Moscow region, Kashira urban district, Zlobino village54°44′1.19″ N
38°5′41.17″ E
1860225.357.417.4
Soils of broad-leaved forests and forest-steppes
11.Luvic Stagnosols Dystric (illuvial-ferrugenous) (LSD(ill.-ferr.))Moscow region, Stupinsky district, Tutykhino village54°52′38.14″ N
37°59′47.60″ E
19542.415.49.1
12.Luvic Stagnosols Dystric (LSD)Moscow region, Domodedovo urban district, village of the Podmoskovye sanatorium55°21′42.48″ N
37°46′32.05″ E
1664206.705.213.4
Table 2. Methods for determining the activity of soil enzymes.
NoEnzymeMethod
Class of oxidoreductases
1.Catalase activity (H2O2:H2O2-oxidoreductase, EC 1.11.1.6.)By the volume of oxygen released during the decomposition of hydrogen peroxide (according to A.Sh. Galstyan), ml O2 in 1 g of soil per 1 min
2.Activity of dehydrogenases (substrate: NAD (P)-oxidoreductase, EC 1.1.1)For the reduction of tetrazolium salts into formazan (according to A.Sh. Galstyan, modified by F.Kh. Khaziev), mg triphenylformazan in 1 g of soil in 24 h
3.Cysteine reductase activity (cysteine NAD(P)-oxidoreductase EC 1.8.1)The method is based on the oxidation of sulfur of the sulfhydryl group of cysteine into the sulfide group of cystine with a colorimetric end (according to A.Sh. Galstyan, A.D. Antonyan (1981), mg of formazan per 10 g in 2 h
Class of hydrolases
4.Activity of β-fructofuranosidase (invertase, sucrase, EC 3.2.1.26)According to the amount of glucose during the hydrolysis of sucrose, colorimetrically using Felling’s reagent (according to F.Kh. Khaziev (2005)), mg of glucose in 1 g of soil in 24 h
5.Urease activity (urea-amidohydrolase, EC 3.5.1.5.)According to the amount of ammonia formed with Nessler’s reagent during the hydrolysis of urea (according to F.Kh. Khaziev (2005)), mg NH3 per g of soil per 24 h
6.Phosphatase activity (phosphohydrolase of orthophosphoric acid monoesters. EC 3.1.3.1-2)According to the change in the content of nitrophenols with the formation of organic phosphorus and mineral substrates (according to Tabatabai and Dick (2002)), μg of p-nitrophenol in 1 g of soil per 1 h
Table 3. Ranking of enzymes by sensitivity to soil contamination with Pb.
Type of SoilDEHINVURECATCYSTPHOS
VCP243516
HSA234615
HKC352614
ECY442516
VCP(typ.)245316
VCP(ord.)253416
VCP(leach)234516
LPA354316
HCP426513
GPA342516
LSD(ill.-ferr.)643315
LSD345316
Note: DEH—dehydrogenases activity (mg TPF per 10 g per 24 h), INV—invertase activity (mg glucose per 1 g per 24 h), URE—urease activity (mg NH3 per g soil per 24 h), CAT—catalase activity (mL O2 in 1 g of soil in 1 min), CYST—cysteine reductase activity (mg formazan per 10 g in 2 h), PHOS—phosphatase activity (μg p-nitrophenol in 1 g of soil in 1 h).
Table 4. Ranking of enzymes according to informativeness in case of soil contamination with Pb.
Type of SoilDEHINVURECATCYSTPHOS
VCP613452
HSA534231
HKC426531
ECY524131
VCP(typ.)652143
VCP(ord.)614532
VCP(leach)345261
LPA434512
HCP634512
GPA123542
LSD(ill.-ferr.)425513
LSD531524
Note: DEH—dehydrogenases activity (mg TPF per 10 g per 24 h), INV—invertase activity (mg glucose per 1 g per 24 h), URE—urease activity (mg NH3 per g soil per 24 h), CAT—catalase activity (mL O2 in 1 g of soil in 1 min), CYST—cysteine reductase activity (mg formazan per 10 g in 2 h), PHOS—phosphatase activity (μg p-nitrophenol in 1 g of soil in 1 h).
Table 5. A scale for assessing the ecological state of the fermentative system of soils in different climatic zones when contaminated with lead.
Enzyme ActivityElement/Enzyme Cycle
Carbone (C)Nitrogen (N)Oxygen (O)Sulfur (S)Phosphorus (P)
DEHINVURECATCYSTPHOS
Meadow soils
very strong>30>50>12>8>280>110
strong19–3035–508–125–8180–25080–110
weak15–1920–356–82–540–18060–80
very weak<15<20<6<2<40<60
Saline and alkaline soils
very strong>30>45>15>4>600>160
strong20–3025–4512–152–4350–600130–160
weak10–2015–258–121–2120–350110–130
very weak<10<15<8<1<120<110
Dry steppes and semi-deserts
very strong>18>15>10>8>500>65
strong15–1812–158–105–8200–50050–65
weak11–159–124–83–550–20030–50
very weak<11<9<4<3<50<30
Real steppes
very strong>35>40>20>12>250>250
strong25–3525–4018–2010–12120–250150–250
weak15–2518–2512–186–1020–120100–150
very weak<15<18<12<6<20<100
Soils of broad-leaved forests and forest-steppes
very strong>25>45>30>5>400>230
strong18–2525–4520–302–5150–400150–230
weak9–1815–2512–201–225–15090–150
very weak<9<15<12<1<25<90
Note: DEH—dehydrogenases activity (mg TPF per 10 g per 24 h), INV—invertase activity (mg glucose per 1g per 24 h), URE—urease activity (mg NH3 per g soil per 24 h), CAT—catalase activity (ml O2 in 1 g of soil in 1 min), CYST—cysteine reductase activity (mg formazan per 10 g in 2 h), PHOS —phosphatase activity (μg p-nitrophenol in 1 g of soil in 1 h).
Disclaimer/Publisher’s Note: The statements, opinions and data contained in all publications are solely those of the individual author(s) and contributor(s) and not of MDPI and/or the editor(s). MDPI and/or the editor(s) disclaim responsibility for any injury to people or property resulting from any ideas, methods, instructions or products referred to in the content.

