Abstract
Boron (B) in soils originates from both natural and human sources, such as agriculture and industry, which contribute boron via fertilizers and irrigation water. Using treated wastewater (TWW) for irrigation is a strategy to address water scarcity in agriculture within arid areas like Tunisia; however, it introduces a risk of B contamination. Thus, the primary objective of this study is to assess the levels of B contamination throughout the entire irrigation system of the TWW “Cebala Borj-Touil” in Northeast Tunisia. To evaluate the lasting impact of TWW irrigation on B and the dynamics of physicochemical parameters across the entire system, soil samples were collected from various depths (0–150 cm) in a control area and gathered both prior to and following irrigation (two campaigns). Water samples utilized for irrigation and water released from drainage were gathered throughout an irrigation cycle. Groundwater sampling took place over two campaigns in April and September of 2018. The findings indicated that B concentrations in irrigation water were below the Tunisian standards (NT 106.03), while in drainage and groundwater, B levels exceeded the standard slightly during some periods. Throughout a three-decade cycle, the patterns of irrigation caused a notable transfer of boron from the topsoil to the groundwater. Therefore, it is essential to regularly supervise the irrigated area system and enhance the drainage system.
1. Introduction
Boron (B) is not only an essential element for plant nutrition, but it is also known for its phytotoxicity when it exceeds a certain threshold. Its distribution in rocks is different from other trace elements, because its predominant sources are sedimentary rocks. B in soils and sediments does not only have natural origins but also anthropogenic sources such as industry and agriculture, where it is contained in fertilizers and irrigation water [1].
It is also found in high concentrations in saline soils and saline well water [2]. High levels of B are usually found in agricultural soils which are close to coastal areas due to the intrusion of B-rich seawater in fresh aquifers [3,4].
Sludge and wastewater from urban sewage treatment plants are also a major source of B and trace elements. Boron is also widely used in industry but is not eliminated during conventional wastewater treatment [5]. The variability of the treated wastewater characteristics is a challenge when considering this water as a resource for irrigated crops. It was found that irrigation with TWW for more than 7 years in the Keshopur wastewater treatment plant in India increased B concentration significantly in the top layers of two soil types [6]. Additionally, wastewater is often very salty and/or sodic compared to conventional water [7,8]. The reuse of TWW can thus become problematic as salinity inhibits plant growth [9], and a high sodium concentration can degrade the soil structure, affecting clay swelling and leading to particle dispersion [10,11]
Many factors influence the bioavailability of B, such as the pH of the soil, the cation exchange capacity in soil, the quantities and types of minerals in the soil (clay mineral types), the organic matter in the soil, iron and aluminum oxides, and other factors [12]. An increased pH contributes to B absorption by plants [13]; therefore, B mobility is related to the pH of the soil solution [13]. Increasing the soil temperature induces an increase in B adsorption in soils, and this increase can be explained by an interactive effect of soil temperature with soil moisture [14]. The organic matter level of the soil also greatly influences B accumulation or depletion in the soil [13].
Adsorption of B by iron and aluminum hydroxides is an important mechanism that largely controls B solubility in soils [13] and has impact in B absorption by plants. Moreover, B is an immobile element in most species, because it accumulates in leaves, in older plants, more than in younger ones. B deficiency affects the yield and the cellular physiology of plants.
In fact, the range between required B levels and toxicity is partially very small [15]. For instance, the recommended amount for sunflower is 0.5 ppm, whereas 1.0 ppm is considered toxic [16]. For many plants, the ratio of toxic to sufficient B concentrations is the smallest among the essential micronutrients [17,18,19].
Boron deficiency is a widespread issue in relatively humid areas, especially in sandy soils [1] where it can be easily drained. Actually, clayey soils can adsorb more B than sandy soils due to their clay mineral content (high specific surface and cation exchange capacity) [20]. On the other hand, toxic levels of B have been reported frequently in soils and irrigation waters in many arid and semi-arid regions of the world. Boron toxicity is a far more difficult issue to manage than deficiency [21]. High B amounts are often found in saline soils. These amounts are removed more slowly than Na+, Cl− and SO42− ions during leaching. Therefore, B may still be present at excessive quantities in reclaimed saline soils [22,23].
Calcareous soils are rich in B because it is plentiful in limestone during soil development, especially in regions where these materials come from marine sediments.
Opposite to trace metals where their mobility increases at an acidic pH, B is an element for which mobility increases with a basic pH, which is the case of Tunisian soils rich in limestone. In this sense, and as B amounts can be added when TWW is used in cropping systems [24], it is obviously important to assess the mobility of B, and this is the case in the Cebala Borj-Touil irrigated system.
Moreover, knowledge about B levels in Tunisian soils and waters is limited, and little work has been conducted on soils irrigated by TWW in Tunisia. Boron presence in coastal soils with a marine influence is presented in the case of the Lower Valley Mejerda soils (Tunisia), formed in the Gulf of Utique. These soils included in our study area are still connected to the sea via a shallow saline water table. An additional reason to undertake this work is the thousands of cubic meters of TWW irrigation that have been added to the Cebala Borj-Touil up until 2018 during a cycle of 30 years. Under these considerations, this study aims to (i) assess B contamination in the perimeter of the irrigated system: irrigation water, shallow groundwater, drainage water and soil (topsoil and until 150 cm depth) before and after a summer irrigation cycle under saline conditions and (ii) highlight the long-term effect of TWW irrigation on soil properties and B mobility. The expected outcomes may aid in the future planning of irrigation in this region and can serve as a model for other Mediterranean basin areas, where agriculture plays a significant role in food production and environmental sustainability.
2. Materials and Methods
2.1. Study Area
The study area is located in the Cebala Borj-Touil, about 20 km North of Tunis City (36°50 N; 9°75 E), (Figure 1a). With 3200 ha of agricultural area, it is the largest irrigated system with TWW in Tunisia. The study area covers about 40% of the total TWW-irrigated surface, which is about 8400 ha in Tunisia. The climate is semi-arid with a dry season from June to August and a wet season from September to May. The average annual precipitation in the region is around 470 mm with an average annual evapotranspiration of 1400 mm.
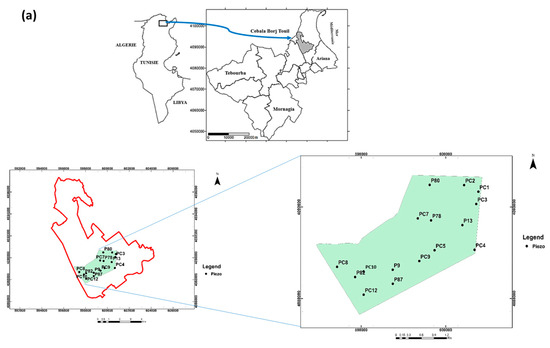
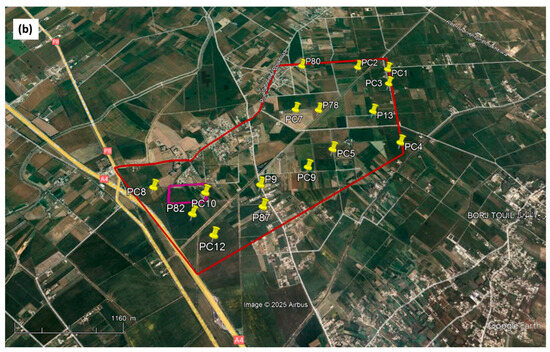
Figure 1.
Localization of the Cebala Borj-Touil irrigated perimeter (a), studied plot (in purple) with the 16 piezometers (in yellow) (aerial image from Google Earth open source, Scale: 1/1160) (b).
The prevailing soil type is alluvial with a clay loam texture with mixed clays consisting of swelling clays (smectites) and also kaolinite and illites, rich in calcareous fractions (30%) and a low content of organic matter (OM) (<1.5%) with a shallow saline water table. The CEC (Cationic Exchange Capacity) is around 20 meq/100 g. Two main streams, the El Maleh and the Khelij, are flowing through the perimeter. The drainage system consists of primary channels, secondary open ditches and tertiary PVC pipes. The drainage system was established 3 decades ago and is now slowly degrading. Since 1989, the area has been irrigated with TWW provided by the Chotrana Waste Water Treatment Plant, 10 km North of Tunis City. The agricultural practices throughout the research period varied by season: during winter, crops like wheat and alfalfa were grown, while in summer, maize and sorghum were cultivated. In both seasons, certain fields remained uncultivated and were thus categorized as fallow land. Irrigation was predominantly utilized in the summer for maize and sorghum.
2.2. Methodologies and Statistical Analyses
2.2.1. Groundwater, Drainage Water and Irrigation Water Sampling
The treated wastewater was collected from the Cebala perimeter in irrigated plots during the summer irrigation cycle. Irrigation water samples were taken from July to September 2018. The samples were kept cold (2 to 4 °C) in accordance with ISO standard 5667-3 [25] and then transported to the laboratory for chemical analysis.
Groundwater sampling was carried out in April and September 2018 before and after the irrigation cycle at 16 piezometers (Figure 1b). These samples were taken after the clogged piezometers had been cleaned and the stagnant water drained. At the same time, the depth of the water table was determined with an electric sensor that detects water level by triggering an audible signal when the sensor reaches the water surface.
In parallel with the irrigation water sampling, drainage water was collected from a secondary ditch. Drainage water samples were taken at the outlet of the secondary outfall, named D2 Ditch (Figure 2), which drains from 36 cultivated ha.
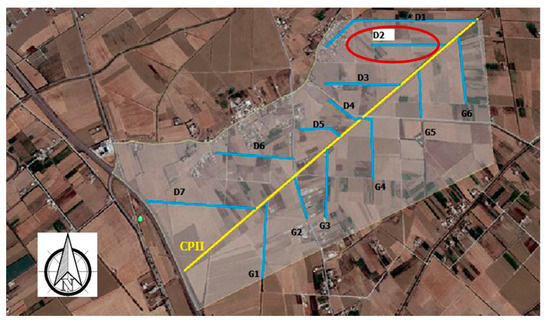
Figure 2.
Location of D2 drainage ditch and CPII main canal in the Cebala Borj-Touil area.
All water samples were analyzed to determine physicochemical parameters during the studied period (April and September 2018). The following analyses were carried out using the standard method applied at the valorization of non-conventional waters laboratory (INRGREF), Tunisia. The pH was measured by using an Inolab pH meter with a glass electrode in accordance with method ISO 10523 [26]. Electrical conductivity (EC) was determined directly using a conductivity meter (pen model type 8361), in accordance with NF T 90-031 method [27]. The ionic composition namely the chloride Cl− [28], bicarbonate HCO3− [29], calcium Ca2+ [30], magnesium Mg2+ [30], potassium K+ [31], sodium Na+ [31] and sulfate SO42− [32] ions, were measured in filtered water samples by titration or spectrophotometry using standard methods (Table 1). Ionic composition was visualized using a Piper diagram.

Table 1.
Methods used for ion determination with the respective indicator and reagents for the titrations.
The azomethine-H method was used to determine B concentration in water samples. Boron, defined as the quantity present in the sample, reacts with azomethine-H to form a yellow compound, which is measured photometrically [33].
2.2.2. Soil Sampling
All collected soil samples in the Cebala Borj-Touil irrigated area were classified as Fluvisols in the World Reference Base for Soil Resources [34]. Soil samples were collected during two campaigns in April and September 2018, respectively, before and after the irrigation cycle, in a plot cultivated with maize (at piezometer PC10). A control site was selected in a location that had never been irrigated in the Cherfech area adjoining the Cebala area (zero irrigation) without any short- or long-term irrigation. Each campaign comprised three sites that represent the three replicates. Soil samples were systematically taken at depths of 0–30 cm, 30–60 cm, 60–90 cm, 90–120 cm and 120–150 cm. These samples were transported to the laboratory, air-dried at room temperature, crushed and sieved to 2 mm. Then, soil samples were analyzed for physicochemical properties and boron content. The pH was determined using a soil/water suspension with a ratio of 1/2.5 [35]. The measurement was performed by the electrometric method using a direct-reading pH meter using a glass electrode. Electrical conductivity was measured by the conductivity meter with an extract from a saturated soil paste at the laboratory in accordance with NF T 90-031 method [27]. The soluble salts Cl− [28], HCO3− [29], SO42− [32], Ca2+ [30], Mg2+ [30], K+ [31] and Na+ [31] were measured in the filtrated water samples by titration or spectrophotometry in accordance with internationally recognized methods (Table 1). The Carmine method [36] was used to determine the B content in the soil samples. The B available in the soil was extracted using hot water. The extraction method is widely used for B determination in soil [37].
2.2.3. Statistical Analysis
Statistical analysis of experimental data was carried out with Excel (c) and included calculation of the standard descriptive characteristics: mean, median, minimum and maximum, standard deviation (SD) and coefficient of variation (CV). CV interpretation was based on the following limits: CV < 10%: low dispersion; 10% < CV < 50%: medium dispersion and CV > 100%: high dispersion. The R program (Version 3.5.1; R Core Team, Vienna, Austria, 2018) was used to create a correlation matrix between B and the physicochemical parameters studied.
3. Results
Since the mobility of B is significantly affected by pH, electrical conductivity and ionic composition, we examined the concentrations of B along with various physicochemical parameters in both water and soil.
3.1. Boron in Water
The analysis is split into irrigation water, drainage water and shallow groundwater.
3.1.1. Boron in Irrigation Water
The effect of B depends on the pH of water [38] and other chemicals parameters (Table 2). The mean pH value of irrigation water varied from neutral to slightly alkaline with low variability during the summer irrigation cycle, and values were within permissible limits according to the Tunisian standard of reuse of TWW in agriculture (NT 106.03) [39] and within the pH range of major Tunisian TWW. The normal pH of fresh water in Tunisia is slightly alkaline. The domestic and urban activities induce a slight acidification by some chemical products such as detergents [40]. The salinity (ECw) is moderate with an average of 4.54 dS/m and moderate variability (CV = 17%) during the summer irrigation cycle. Dahmouni et al. [41] observed values within the permitted range of Tunisian TWW. Compared to other countries, it seems high, but the EC of Tunisian drinking water varies with region and time. The average in Tunis City where the TWW comes from is around 2.5 dS/m in summer. The ionic composition leads to a sodium adsorption ratio (SAR) around 9.92 and chemical facies that are alkaline with a dominance of Na+ cations and Cl− anions. This means a high risk of sodicity, in particular when used in clayey soils. Fortunately, the local soil is rich in limestone and, thus, is not prone to degradation.
Table 2.
Main characteristics of TWW during summer irrigation cycle 2018.
Despite the variability of some chemical elements, the concentration of B with a mean value of 0.75 mg/L remains fairly constant over time with little variability. This corresponds to approximately the average value (0.80 mg/L) obtained by Bahri [42] for a general survey of all Tunisian TWW. This value is below the threshold of 3 mg/L of the Tunisian standard of reuse of TWW (NT 106.03) [39].
3.1.2. Boron in Drainage Water
Boron in the drainage water was controlled between May and the end of September 2018. The pH of the water was slightly alkaline (Table 3) with medium variability (CV = 21.3%). It is in the range obtained by Dahmouni et al. [41] in the same area and also by Agoro et al. [43] in their studies of the effluents.
Table 3.
Chemical composition of the drainage water during the period of control (May to September 2018; number of samples: 15).
The salinity (ECd) is high with an average of 12.4 dS/m (from 10.3 to 15.9 dS/m) but with very low variability (CV = 2.9%) during the study period. Dahmouni et al. [41] had observed lower values with an average of 9.7 dS/m. The ionic composition leads to a high sodium adsorption ratio (SAR) around 14.6 and alkaline chemical facies with a dominance of Na+ cations as well as Cl− anions.
The B concentration in DW stayed relatively stable over time with minimal fluctuations, averaging 1.62 mg/L, which is double the typical concentration found in irrigation water. In some periods, the concentration slightly exceeded the Tunisian standard NT 106.02 (2 mg/L) [44].
3.1.3. Boron in Groundwater
After irrigation and drainage water, groundwater was controlled with 16 piezometers before irrigation in April 2018 and after irrigation at the end of September 2018. We measured hydrological (level) and hydro-chemical (pH, EC, soluble salts and B) characteristics.
The average groundwater level from the surface varied between 1.21 m in April 2018 and 1.45 m in September 2018 (Table 4). The levels increased in the rainy winter period by 0.24 m compared to summer. The variability stays moderate (CV < 20%).
Table 4.
Statistical summary of the groundwater level (m).
The pH is neutral to slightly alkaline with low temporal variability (7.59 in April; 7.44 in September, CV < 5%). This low decrease in pH in September was probably induced by the pH of the irrigation water. At the same time, the EC increases from 14.61 dS/m in April to 15.54 dS/m in September (Table 5) with a high variability (CV > 50%), probably caused by the insufficient drainage in some parcels, a high infiltration of rainwater in winter and excess irrigation in summer. The ionic composition leads to a moderate sodium adsorption ratio (SAR) around 14.46 in winter and a SAR value in summer around 13.94. The cationic composition is dominated by sodium (Na+), and the anionic composition is dominated by chloride (Cl−). This results in sodium chloride chemical facies (Figure 3).
Table 5.
Main groundwater characteristics during the wet (April) and dry (September) seasons in 16 piezometers (N = 16).

Figure 3.
Ionic composition of irrigation, drainage and groundwater (April and September 2018).
In contrast to the irrigation water, the concentration of B in the shallow groundwater was not constant over time and had moderate variability with a mean value 1.26 mg/L in April and 1.43 mg/L in September (Table 5), about 1.5 times the average concentration of the irrigation water. In both seasons, some samples showed a B concentration slightly exceeding the Tunisian standard NT 106.02. High concentrations of naturally occurring B in groundwater might be a severe issue. Many studies have reported on the distribution and health risk of high concentrations of B in groundwater.
3.1.4. Correlation Between B and the Different Physicochemical Parameters
Figure 4 shows the Pearson correlation coefficients (r) existing between the different parameters during the two campaigns of April and September 2018, as well as the distribution of the scatter plots resulting from the correlation relationship between the different parameters. According to these correlation coefficients, only in April (before irrigation) was there an average positive correlation (r = 0.553 *) between B and HCO3−. This correlation coefficient is significant since the p value is less than 0.05. According to Figure 5, which summarizes the significant correlations (based on the Pearson coefficient) between the different parameters, high correlations were observed between Na+ and Cl−, Mg2+ and SO42− and EC and Na+ in the two campaigns. There were important correlations between EC and Cl−, EC and SO42−, EC and Na+, EC and Ca2+, EC and Mg2+ and Cl− and Ca2+.
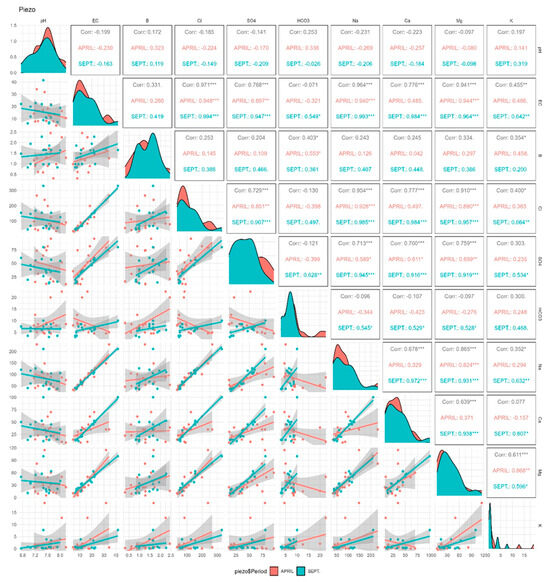
Figure 4.
The Pearson correlation coefficients between the different chemical parameters and B with scatter plots in groundwater during the two campaigns (April and September 2018). *, ** and ***: significance level at p = 0.05, 0.01 and 0.001.
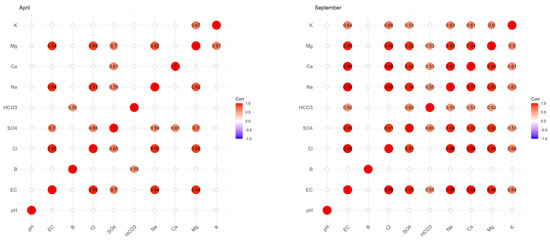
Figure 5.
Correlation matrix (only significant) between B and the different physicochemical parameters for groundwater in the two campaigns (April and September 2018).
3.2. Boron in Soil
The most important parameter controlling the mobility of B in soil is the pH. In our study, the initial pH is slightly basic at about 7.98, higher in the surface and lower near the water table (Table 6). This pH remained nearly constant with a low CV after several years of irrigation with only a small decrease (7.73) and also after the summer irrigation cycle (7.88).
Table 6.
Main characteristics in control soil (Cherfech) and in Cebala soil during the two campaigns (April and September) between the soil surface and a depth of 150 cm.
Irrigation with TWW resulted in an increase in soil salinity in the 0–1 m layer during a summer irrigation cycle (Table 6). This increase is more evident in the 60–90 cm layer. The electrical conductivity of the saturated soil extract ECe is around 1.42 dS/m in the surface layer and 7.12 dS/m in the bottom layer. For the control, the values were 2.55 dS/m in the surface layer and 7.46 dS/m in the bottom layer in April 2018 and 3.27 dS/m in the surface layer and 7.57 dS/m in the bottom layer in September 2018.
Ionic composition in the soil was dominated by Cl− anions and Na+ cations in all soils: the control soil and the soils irrigated in April and September (Table 6). The highest chloride and sodium contents were found in the soil irrigated (since 1989) with Cebala TWW prior to the 2018 irrigation cycle. After irrigation, these levels decreased but remained higher than those in the control soil at Cherfech.
SAR values in the soils show an increase in depth. Comparing the irrigated and control soils, we note that the soil irrigated in April shows the highest mean SAR value of 11.17 (<12), indicating average alkalinization. In this soil, the SAR increases significantly from the surface layer to the deepest layer. In September, the average SAR increased from the surface soil to the deepest layer, reaching a value of 15.06. In the control soil, the 90–120 cm layer shows the highest SAR values of around 12. However, its average along the depth shows the lowest value (7.92 < 8) compared to irrigated soil in both campaigns [45].
The average boron content for the depth of 0–150 cm was about 1.36 mg/kg in April 2018 and increased to around 1.45 mg/kg in September 2018 under the summer cycle of irrigation (Table 6). The control indicates a value of 0.94 mg/kg, which showed an increase after several irrigation cycles. This increase is accompanied by the decrease in the CV, which was medium in the control site (20.82%) and in April 2018 (11.34%) to low in September 2018 (7.37%) indicating more homogeneity and uniformity of the B content variation for all the layers of the profiles. Thus, the significant variation in the B content occurred in the layers from 30 cm to 150 cm depth. Shorrocks [46] classified the level of water-soluble B in soils into five categories depending on the B content in the soils: very low (<0.25 μg/g), low (0.25–0.5 μg/g), medium (0.51–1.0 μg/g), high (1.1–2.0 μg/g) and very high concentration (>2.0 μg/g). Later, Choi et al. revisited this classification, concluding that water-soluble B, in soils containing >0.5 μg/g, is sufficient for many crops’ development [47]. In our case, B in the soil is classified between the medium and high concentrations. According to Choi et al. [47], the hot-water-soluble B in our soils is sufficient for crops.
Correlation Between B and Different Physicochemical Parameters in Soil
Figure 6 below shows all correlations in the different campaigns. In the control soil, the B/SO42− correlation represents a strong negative correlation. B/Na+ represents also a strong and negative correlation. In September, B showed strong negative correlations with EC, Na+ and Cl−, while in April there was no correlation between B and all the physicochemical parameters. The correlations between EC/Na+ (0.99), EC/Cl−, EC/Ca2+ and EC/Mg2+ are positive and very strong in the control soil. In the soil irrigated in September, the Na+/Cl− (0.97) and Ca2+/Mg2+ (0.82) correlations are the most abundant, while in April, before irrigation, the Na+/Cl− (0.89), Ca2+/Mg2+ (0.83), Ca2+/Cl− (0.92) and Mg/Cl− (0.87) correlations are the most abundant.
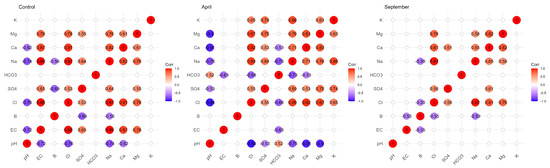
Figure 6.
Correlation matrix between B and the different physicochemical parameters in the control soil and in the two campaigns (April and September).
4. Discussion
To evaluate the status of B, we measured B, pH, the chemical composition of soluble salts and the depth of the groundwater for a summer irrigation cycle. We compared the soil irrigated by TWW with a control soil without irrigation. In this discussion, we will link these components to the water cycle and soil properties.
The pH is the main parameter controlling the fluxes of matter in the soil. Despite a lower pH of irrigation water than that of the soil, the latter retains its condition in the surface layer, which is directly subjected to water inputs. The pH of the groundwater and of the water collected in the drainage ditch is slightly higher than the irrigation water (Figure 7). This can be explained by excess irrigation water in summer, rainwater in other seasons and the local contact with groundwater. On the other hand, the limestone of the soil buffers the soil pH, but this effect decreases with time after several irrigation cycles. However, this depends also on the method of determining soil pH. Some authors think that the pH of water measured in a solution of 20 g of soil with 50 mL of distilled water (1:2.5 soil-to-water ratio) [30] does not take into account the very fast change during irrigation and the effects of the acid exudates (humic and fulvic acids) of the roots of the plants at the soil–root interface. Recently, Patko et al. [48] studied and discussed a novel approach to understanding pH dynamics within the rhizosphere using “smart soils”—artificial substrates equipped with integrated chemical sensors. Their research aimed to provide deeper insights into the interactions between plant roots and soil, focusing on how pH gradients form and evolve due to root activity. Methods and instruments for in situ measurement of soil pH have been developed, but their use remains very limited. It is, therefore, both a problem of the method and of scale that must be the subject of further research.
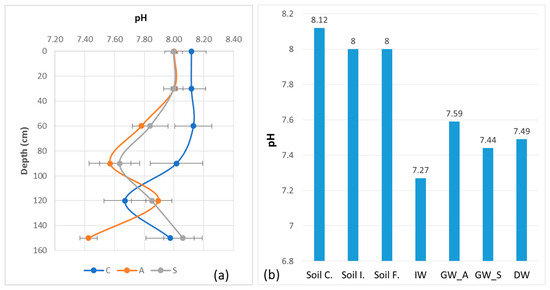
Figure 7.
pH values with standard deviation error bars between soil surface and 150 cm depth in control soil (C), before irrigation in April 2018 (A) and at the end of irrigation in September 2018 (S): (a) pH variation trends in soil, IW, GW and DW; (b) soil control: Soil C., soil initial: Soil I., soil final: Soil F., irrigation water: IW, groundwater—April 2018: GW_A, groundwater—September 2018: GW_S and drainage water: DW.
In the short term, the soil EC is increased by irrigation. Thus, the soil ECe at the end of the irrigation cycle is higher than at the beginning (Figure 8). The ECe of the control soil is lower than the ECe of the initial soil before irrigation because of the residual salinity from earlier irrigation with saline water since 1989 and an insufficient leaching by winter rainfall. The EC of the groundwater is high, with seasonal and spatial variations. The EC of the drainage water is slightly less than in groundwater. Two main factors act in this direction. The groundwater covers a very large area over several square kilometers, reacts to irrigation and rainfall and interacts with the entire Lower Mejerda plain. It is even connected to the sea, which is less than 10 km away. The drainage water taken from the open ditch is also connected to the groundwater, but it can also receive surface runoff during major rainfall events. As discussed in the previous paragraph, the results can only be interpreted in the context of time and space. Therefore, we need more frequent monitoring and a narrower sampling grid.
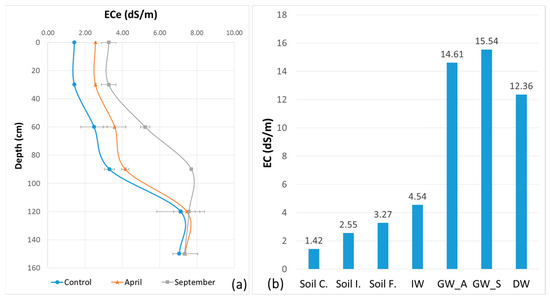
Figure 8.
ECe variation with standard deviation error bars between soil surface and 150 cm depth from control, before irrigation in April 2018 and at the end of irrigation in September 2018: (a) EC variation trends of soil, IW, GW and D; (b) soil control: Soil C., soil initial: Soil I., soil sinal: Soil F., irrigation water: IW, groundwater—April 2018: GW_A, groundwater—September 2018: GW_S and drainage water: DW.
Groundwater and drainage water SAR values in the Cebala perimeter are frequently monitored, as well as the soils before and after irrigation [41]. The SAR average value of the surface soil (0–30 cm) before irrigation (Soil I.) is high (about 8) compared to its value (about 5.3) after irrigation (Soil F.) and considering that the irrigation water SAR value is about 10. As the SAR reflects the ratio of major cations, its increase can only come from an increase in Na+ or a decrease in Ca2+ and/or Mg2+. A decrease in the divalent cations is possible with the desaturation of the exchange complex; although, this is usually a slow process. Again, more frequent soil and water sampling would be useful to answer these questions.
Despite the high variability of some chemical elements, the concentration of B in irrigation water remained constant over time with a mean value 0.75 mg/L, which is similar to the average value (0.80 mg/L) obtained by Bahri [42] in a general survey of all Tunisian TWW. This value is below the threshold of 3 mg/L of the Tunisian standard of reuse of TWW (NT 106.03) [39]. According to FAO [49], only minor restrictions are needed to use this water for irrigation. The USA, Saudi Arabia and Japan have quite strict guidelines for extreme B concentrations in irrigation water ranging from 0.4 to 1.0 mg/L [50]. Canada has limits for sensitive crops for B between 0.5 and 6 mg/L [51]. Levels higher than 0.3–0.5 mg/L in irrigation water are toxic for citrus plants [52]. The toxicity risk is related to the water regime, time scale and frequency of TWW application. Grattan et al. [53] observed a high accumulation of B in the leaves of citrus cultivated in clay soil reaching 267 mg B/kg DM, which exceeds the toxicity threshold of 250–260 mg B/kg dry matter. Abu-Daba’an and Al-Najar [16] found leaf B concentrations above a dangerous level (200 mg B/kg) after irrigation with water containing 0.31 mg B/L for 30 years. For sensitive crops, B toxicity is difficult to avoid without altering the crop or the water source; in addition, the B toxicity is increased with increasing temperatures, which are likely to occur under global change conditions [54]. In most reuse studies, salinity and B concentration are the key restrictions for a long-term use of TWW. The recommended limits for B in TWW used for irrigation are divided into two groups: for long-term use, it should be below 0.75 mg/L, and for short-term use below 2 mg/L [55]. According to Pedrero et al. [56], who investigated TWW use in the Region of Murcia in Spain, the sources of B are household detergents and discharge from industrial plants.
We observed B in shallow groundwater and drainage water with concentration values exceeding the limit set by the Tunisian standard NT 106.02 (2 mg/L) [44]. In shallow groundwater, we observed that in some samples, B concentrations slightly exceeding this standard (NT 106.02) [44] in both seasons. Besides some other elements, high concentrations of naturally occurring B in groundwater might be a severe issue. Many studies around the world have reported on the distribution and health risk of high concentrations of B in groundwater [57]. For drinking water, the acceptable concentration of B according to the WHO [58] is 2.4 mg/L. However, the recommended national standard level in Bangladesh of B in groundwater is much lower (1 mg/L) [57]. The concentration of B in drainage water with a mean value of 1.62 mg/L was double the average B concentration in irrigation water. In some periods, the B concentration slightly exceeded the Tunisian standard NT 106.02 [44].
Concerning B in the soil, we can suggest that the irrigation cycles for several years produced the observed form of variation and indicate a deep transfer of B from the surface layer to the deep layer near the perched groundwater. Figure 9 highlights a moderate increase in B in the soil from its unirrigated state, the irrigated soil before irrigation and finally during a summer irrigation cycle. This increase is also reflected in the groundwater with an increase under summer irrigation and in the drainage water. However, not all the B in the soil, groundwater and drainage water can be attributed to B inputs from irrigation water. Two other sources also contribute: the marine alluvium deposited in an ancient gulf about 3000 years ago [59] and the present relation between the water table and the sea. These factors, undoubtedly, could be responsible for maintaining a B level in soils that might be harmful to sensitive crops. This is another comparable problem that can arise in different regions of the Mediterranean basin impacted by seawater intrusion or salts persisting in alluvial soils, such as in the southeast of Spain.
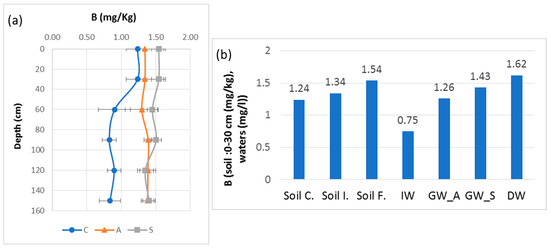
Figure 9.
B variation with standard deviation error bars between soil surface and 150 cm depth from control (C), before irrigation in April 2018 (A) and at the end of irrigation in September 2018 (S): (a) B variation trends of soil, IW, GW and DW; (b) soil control: Soil C., soil initial: Soil I., soil final: Soil F., irrigation water: IW, groundwater—April 2018: GW_A, groundwater—September 2018: GW_S and drainage water: DW.
5. Conclusions
In countries like Tunisia, which are semi-arid and arid, the practice of reusing wastewater for irrigation has become widespread. The Cebala Borj-Touil perimeter, located in northern Tunisia, is one of the largest and most susceptible regions to pollution. This boundary is already influenced by the utilization of treated saline wastewater. Consequently, this research concentrated on the B status in soil that has been irrigated for an extended period with TWW. The soil’s environment is salty. We discovered an alkaline pH and an increase in salts with a dominance of Na+, Cl− and SO42−, along with elevated levels of B in the soil. The B quantities are beneath the limits for irrigation water. In drainage water and groundwater, the levels slightly surpass the Tunisian standard NT 106.02 during certain periods. These waters exhibited elevated salinity.
The groundwater plays a role in soil salinization by elevating during wet seasons and through heavy irrigation. The presence of B in the soil relies on inputs from rainwater and irrigation water.
The boron concentration was increased in the soil after several irrigation cycles as compared to the control site and accumulates with time. The hot-water-soluble B amount extracted in our soils, as an indicator for crop suitability, is sufficient for the development of several crops and is critical for the most sensitive crops. The irrigation cycles for several years lead to an accumulation and deep transfer of B from the surface layer to the deep layer close to the groundwater. However, the irrigation by TWW is not the only source of the B increase in the soil, GW and DW, two other sources must be considered: the marine alluvium deposited in an ancient gulf about 3000 years ago and the present relation between the water table and the sea. This saline context may cause long-term higher B content in the soil and lead to further exceeding B thresholds in waters; thus, the contamination would be from natural sources. For that situation, continuous monitoring of B in the various components of this system is essential.
Improving irrigation efficiency is necessary to reduce salinity problems and yield losses on farmers’ plots. Furthermore, limiting groundwater characteristics’ deterioration by amplifying the maintenance operations of the actual drainage system and by deepening of the principal canal (CPII canal) of the drainage system is primordial, as the studied area is poorly drained. In conclusion, the agricultural reuse of treated wastewater requires, even if standards are respected, a continuous, and long-term monitoring of the entire system from the parcel to the sea.
Author Contributions
Conceptualization, S.F. and M.H.; methodology, S.F., J.N.-P. and M.H.; software, G.H.; validation, G.H., N.F. and M.H.; formal analysis, S.F.; investigation, S.F.; resources, M.H.; data curation, S.F., M.H. and G.H.; writing—original draft preparation, S.F., G.H., N.F. and M.H.; writing—review and editing, S.F., J.N.-P. and M.H.; visualization, J.N.-P. and M.H; supervision, M.H.; project administration, M.H.; funding acquisition, M.H. All authors have read and agreed to the published version of the manuscript.
Funding
This research received no external funding.
Institutional Review Board Statement
Not applicable.
Informed Consent Statement
Not applicable.
Data Availability Statement
The original contributions presented in this study can be facilitated by authors after demand. Further inquiries can be directed to the corresponding authors.
Acknowledgments
We would like to thank Nele Gloy for her valuable contribution in this research.
Conflicts of Interest
The authors declare no conflicts of interest.
References
- Santos, P.D.; Goldberg, S.; Costa, A.C.S.D. Modeling Boron Adsorption on Five Soils before and after Removal of Organic Matter. Sci. Agric. 2019, 77, e20180023. [Google Scholar] [CrossRef]
- Song, Y.; Paerhati, P.; Xu, S.; Gao, B.; Jiang, S.; Li, S.; Wang, Y.; Lv, H. Boron Enrichment in Salinized Lacustrine Organic-Rich Shale of the Paleogene Biyang Depression, East China: Occurrence and Geological Controlling Factors. Minerals 2024, 14, 904. [Google Scholar] [CrossRef]
- Schwager-Guilloux, J. Les Toitures Végétalisées, Puits et Sources d’éléments En Traces Métalliques. Ph.D. Thesis, Lorraine University, Nancy, France, 2014. Available online: https://theses.fr/2014LORR0073 (accessed on 14 October 2024).
- Fatnassi, S.; Almendro Candel, M.B.; Navarro Pedreño, J.; Gómez Lucas, I.; Hachicha, M. Boron Adsorption in Semiarid Mediterranean Soils under the Influence of Background Electrolytes. Glob. J. Environ. Sci. Manag. 2022, 8, 519–532. [Google Scholar] [CrossRef]
- Dorta-Santos, M. Using marginal quality water for an energy crop in arid regions: Effect of salinity and boron distribution patterns. Agric. Water Manag. 2016, 171, 142–152. [Google Scholar] [CrossRef]
- Edelstein, M.; Ben-Hur, M. Heavy metals and metalloids: Sources, risks and strategies to reduce their accumulation in horticultural crops. Sci. Hortic. 2018, 234, 431–444. [Google Scholar] [CrossRef]
- Neubert, S.; Benabdallah, S. The Re-Utilization of Treated Wastewater in Tunisia; Reports and Working Papers no. 11/2003; German Development Institute: Bonn, Germany, 2003; p. 57. [Google Scholar]
- Xu, J.; Wu, L.; Chang, A.C.; Zhang, Y. Impact of long-term reclaimed wastewater irrigation on agricultural soils: A preliminary assessment. J. Hazard. Mater. 2010, 183, 780–786. [Google Scholar] [CrossRef]
- Jahantigh, M. Impact of recycled wastewater irrigation on soil chemical properties in an arid region. Pak. J. Biol. Sci. 2008, 11, 2264–2268. [Google Scholar] [CrossRef] [PubMed]
- Grattan, S.R.; Ostser, J.D. Use and Reuse of Saline-Sodic Waters for Irrigation of Crops. J. Crop Prod. 2003, 7, 131–162. [Google Scholar] [CrossRef]
- Rengasamy, P.; Olsson, K.A. Sodicity and soil structure. Soil Res. 1991, 29, 935–952. [Google Scholar] [CrossRef]
- Padbhushan, R.; Kumar, D. Fractions of soil boron: A review. J. Agric. Sci. 2017, 155, 1023–1032. [Google Scholar] [CrossRef]
- Varol, M.; Deliboran, A.; Aytop, H.; Ateş, Ö. Boron contamination and related health risk assessment in the soils collected from olive groves in İzmir province, Türkiye. Chemosphere 2023, 343, 140210. [Google Scholar] [CrossRef] [PubMed]
- Goli, E.; Hiemstra, T.; Rahnemaie, R. Interaction of boron with humic acid and natural organic matter: Experiments and modeling. Chem. Geol. 2019, 515, 1–8. [Google Scholar] [CrossRef]
- Goldberg, S.; Glaubig, R.A. Boron adsorption on aluminum and iron oxide minerals. Soil Sci. Soc. Am. J. 1985, 49, 1374–1379. [Google Scholar] [CrossRef]
- Abu-Dabaan, R.; Al-Najar, H. The effect of long term Irrigation by treated effluent on boron accumulation in soil and citrus plants. Asian Rev. Environ. Earth Sci. 2018, 5, 22–26. [Google Scholar] [CrossRef][Green Version]
- Chen, X.; Smith, S.M.; Shabala, S.; Yu, M. Phytohormones in plant responses to boron deficiency and toxicity. J. Exp. Botany 2023, 74, 743–754. [Google Scholar] [CrossRef] [PubMed]
- Su, C.; Suarez, D.L. Boron release from weathering of illites, serpentine, shales, and illitic/palygorskitic soils. Soil Sci. Soc. Am. J. 2004, 68, 96–105. [Google Scholar] [CrossRef]
- Hilal, N.; Kim, G.J.; Somerfield, C. Boron removal from saline water: A comprehensive review. Desalination 2011, 273, 23–35. [Google Scholar] [CrossRef]
- Al-Ameri, B.H. Boron desorption kinetic in calcareous soils. J. Agric. Sci. 2019, 11, 525. [Google Scholar] [CrossRef]
- Reid, R.J.; Hayes, J.E.; Post, A.; Stangoulis, J.C.R.; Graham, R.D. A critical analysis of the causes of boron toxicity in plants. Plant Cell Environ. 2004, 27, 1405–1414. [Google Scholar] [CrossRef]
- Nable, R.O.; Bañuelos, G.S.; Paull, J.G. Boron toxicity. Plant Soil 1997, 193, 181–198. [Google Scholar] [CrossRef]
- Eraslan, F.; Inal, A.; Savasturk, O.; Gunes, A. Changes in antioxidative system and membrane damage of lettuce in response to salinity and boron toxicity. Sci. Hortic. 2007, 114, 5–10. [Google Scholar] [CrossRef]
- Qureshi, A.S.; Hussain, M.I.; Ismail, S.; Khan, Q.M. Evaluating heavy metal accumulation and potential health risks in vegetables irrigated with treated wastewater. Chemosphere 2016, 163, 54–61. [Google Scholar] [CrossRef]
- ISO 5667-3; Water quality—Sampling—Part 3: Preservation and handling of water samples. International Organization for Standardization: Geneva, Switzerland, 2018.
- NF EN ISO 10523; Water quality—Determination of pH. Association Française de Normalisation: Paris, France, 2012.
- NF T 90-031; Qualité de l’eau—Détermination de la Conductivité Electrique (CE) de l’eau. Association Française de Normalisation: Paris, France, 2001.
- NT 09.77; Qualité des Eaux—Dosage des Chlorures Titrage au Nitrate d’argent avec du Chromate Comme Indicateur (méthode de Mohr). Institut National de Normalisation et de la Propriété Industrielle: Tunis, Tunisia, 1989.
- NF T 90-008; Qualité de l’eau—Dosage de l’alcalinité (Bicarbonates, Carbonates et Hydroxydes). Association Française de Normalisation: Paris, France, 1987.
- NT 09.10; Qualité des Eaux—Dosage du Calcium Méthode Titrimétrique à l’EDTA. Institut National de Normalisation et de la Propriété Industrielle: Tunis, Tunisia, 1985.
- NF A20-603; Spectrophotométrie d’émission de Flamme—Dosage du Sodium et du Potassium. Association Française de Normalisation: Paris, France, 1989.
- NF T 90-040; Qualité de l’eau—Dosage des sulfates. Association Française de Normalisation: Paris, France, 1985.
- Wolf, B. A Method for Determining Boron in Irrigation Waters. Soil Sci. Soc. Am. Proc. 1971, 35, 594–596. [Google Scholar] [CrossRef]
- WRB. World Reference Base for Soil Resources 2014, Update 2015. International Soil Classification System for Naming Soils and Creating Legends for Soil Maps; World Soil Resources Reports No. 106; FAO: Rome, Italy, 2015. [Google Scholar]
- ISO 10390; Soil quality—Determination of pH. International Organization for Standardization: Geneva, Switzerland, 2005.
- Mohammad, M.J.; Mazahreh, N. Changes in soil fertility parameters in response to irrigation of forage crops with secondary treated wastewater. Commun. Soil Sci. Plant Anal. 2003, 34, 1281–1294. [Google Scholar] [CrossRef]
- Sah, R.N.; Brown, P.H. Boron determination—A review of analytical methods. Microchem. J. 1997, 56, 285–304. [Google Scholar] [CrossRef]
- Navarro-Pedreño, J.; Rodríguez Espinosa, T.; Almendro Candel, M.B.; Pérez Gimeno, A.; Gómez Lucas, I. Boro en la red de azarbes de la vega baja del Segura y el Baix Vinalopó (Alicante). In Agua, Energía y Medio Ambiente; Melgarejo, J., López, I., Fernández, P., Eds.; Universidad de Alicante/Universitat d’Alacant: Alicante, Spain, 2022; pp. 439–450. ISBN 978-84-1302-184-3. [Google Scholar]
- NT 106.03; Protection de l’Environnement, Utilisation des Eaux Usées Traitées à des Fins Agricoles Spécifications Physico-Chimiques et Biologiques. INNORPI: Tunis, Tunisia, 1989.
- Mousavi, S.A.; Khodadoost, F. Effects of detergents on natural ecosystems and wastewater treatment processes: A review. Environ. Sci. Pollut. Res. 2019, 26, 26439–26448. [Google Scholar] [CrossRef] [PubMed]
- Dahmouni, M.; Hoermann, G.; Jouzdan, O.; Hachicha, M. Export of salt and heavy metals in an area irrigated with treated wastewater: A case study from Cebala Borj-Touil (Tunisia). Desalination Water Treat. 2018, 102, 61–70. [Google Scholar] [CrossRef]
- Bahri, A. Agricultural reuse of wastewater and global water management. Water Sci. Technol. 1999, 40, 339–346. [Google Scholar] [CrossRef]
- Agoro, M.A.; Adeniji, A.O.; Adefisoye, M.A.; Okoh, O.O. Heavy metals in wastewater and sewage sludge from selected municipal treatment plants in Eastern Cape Province, South Africa. Water 2020, 12, 2746. [Google Scholar] [CrossRef]
- NT 106.02; Standards for Effluent Discharges into the Water Environment. Institute National Institute for Standardization and Industrial Property: Tunis, Tunisia, 1989.
- Gloy, N. Effects of Treated Wastewater Irrigation on Soil and Groundwater Characteristics in Particular with Regard to Boron Content in the Area of Cebala Borj-Touil (Tunisia). Master’s Thesis, Kiel University, Institute for Natural Resource Conservation, Kiel, Germany, 2019. [Google Scholar]
- Shorrocks, V.M. The occurrence and correction of boron deficiency. Plant Soil 1997, 193, 121–148. [Google Scholar] [CrossRef]
- Choi, E.Y.; Park, H.I.; Ju, J.H.; Yoon, Y.H. Boron availability alters its distribution in plant parts of tomato. Hort. Environ. Biotech. 2015, 56, 145–151. [Google Scholar] [CrossRef]
- Patko, D.; Yang, Q.; Liu, Y.; Zhang, L.; Xia, L.; Zhang, W. Smart soils track the formation of pH gradients across the rhizosphere. Plant Soil 2024, 500, 91–104. [Google Scholar] [CrossRef]
- FAO. The Use of Wastewater in Agriculture: Manual on Safe Use of Wastewater, Excreta, and Greywater; Food and Agriculture Organization of the United Nations: Rome, Italy, 2003. [Google Scholar]
- Park, Y.; Kim, Y.; Ki Park, S.; Jin Shin, W.; Sik Lee, K. Water quality impacts of irrigation return flow on stream and groundwater in an intensive agricultural watershed. Sci. Total Environ. 2018, 630, 859–868. [Google Scholar] [CrossRef] [PubMed]
- AESRD. Alberta Environmental Quality Guidelines for Alberta Surface Waters; Alberta Environment and Sustainable Resource Development: Edmonton, AB, Canada, 2014. [Google Scholar]
- Grieve, C.M.; Grattan, S.R.; Maas, E.V. Plant salt tolerance. ASCE Man. Rep. Eng. Pract. 2012, 71, 405–459. [Google Scholar]
- Grattan, S.R.; Díaz, F.J.; Pedrero, F.; Vivaldi, G.A. Assessing the suitability of saline wastewaters for irrigation of Citrus spp.: Emphasis on boron and specific-ion interactions. Agric. Water Manag. 2015, 157, 48–58. [Google Scholar] [CrossRef]
- Akdağ, S.; Keyikoğlu, R.; Karagunduz, A.; Keskinler, B.; Khataee, A.; Yoon, Y. Recent advances in boron species removal and recovery using layered double hydroxides. Appl. Clay Sci. 2023, 233, 106814. [Google Scholar] [CrossRef]
- Hashem, M.S.; Qi, X. Treated wastewater irrigation—A review. Water 2021, 13, 1527. [Google Scholar] [CrossRef]
- Pedrero, F.; Kalavrouziotis, I.; Alarcón, J.J.; Koukoulakis, P.; Asano, T. Use of treated municipal wastewater in irrigated agriculture—Review of some practices in Spain and Greece. Agric. Water Manag. 2010, 97, 1233–1241. [Google Scholar] [CrossRef]
- Rahman, M.; Tushar, M.A.N.; Zahid, A.; Ahmed, K.M.U.; Siddique, M.A.M.; Mustafa, M.G. Spatiotemporal distribution of boron in the groundwater and human health risk assessment from the coastal region of Bangladesh. Environ. Sci. Pollut. Res. 2021, 28, 21964–21977. [Google Scholar] [CrossRef] [PubMed]
- WHO. Guidelines for Drinking-Water Quality: Fourth Edition Incorporating the First Addendum; World Health Organization: Geneva, Switzerland, 2017. [Google Scholar]
- Delile, H.; Abichou, A.; Gadhoum, A.; Goiran, J.P.; Pleuger, E.; Monchambert, J.Y.; Wilson, A.; Fentress, E.; Quinn, J.; Ben Jerbania, I.; et al. The geoarchaeology of Utica, Tunisia: The paleogeography of the Mejerda Delta and hypotheses concerning the location of the ancient harbor. Geoarchaeology 2015, 30, 291–306. [Google Scholar] [CrossRef]


Disclaimer/Publisher’s Note: The statements, opinions and data contained in all publications are solely those of the individual author(s) and contributor(s) and not of MDPI and/or the editor(s). MDPI and/or the editor(s) disclaim responsibility for any injury to people or property resulting from any ideas, methods, instructions or products referred to in the content. |
© 2025 by the authors. Licensee MDPI, Basel, Switzerland. This article is an open access article distributed under the terms and conditions of the Creative Commons Attribution (CC BY) license (https://creativecommons.org/licenses/by/4.0/).