Abstract
Soil health and fertility are essential components of sustainable land management. In Bhutan, where agricultural practices range from organic to conventional systems, and natural vegetation areas persist across varied elevations. Understanding how these factors influence soil properties is essential for advancing sustainable agriculture and fostering environmental stewardship. Thus, the objectives of this study were to evaluate some soil chemical properties across land use practices and their relationship to soil texture. Soil organic carbon (SOC) and macro-nutrients in three land use types (organic fields—OrgF; conventional fields—ConF; and natural vegetation—NatV) were studied across high-, mid-, and low-altitude sites in the Wangdue Phodrang, Chhukha, and Dagana districts of Bhutan. The effects of land use practices on soil properties varied with altitude. While available P responded significantly at both high- and mid-altitude locations (p < 0.01), SOC content was influenced only at high altitude (p < 0.001). In contrast, soil pH (p < 0.01) and available K (p < 0.001) showed clear sensitivity to land use at low altitude but were unaffected at higher elevations. Total N content and C:N ratios remained relatively stable across management practices within each altitude category. Silt and clay content had positive relationship with SOC (R2 ≥ 0.13), whereas sand content had a significant negative relationship (R2 = 0.23, p < 0.001). These findings are pertinent to providing guidelines for sustainable land management, improving agricultural practices, and shaping policies to protect and restore soil health across varied agro-ecological zones.
Keywords:
land use; altitudinal range; soil organic carbon; macro-nutrients; soil pH; texture; relationship 1. Introduction
Bhutan is a small country located in the fragile mountainous terrain of the Eastern Himalayas bordered by China to the north and India to the south. By maintaining about 71% of the total land area under forest cover [1], Bhutan is committed to remaining carbon (C) negative, absorbing more CO2 than it emits, as part of its contribution to the global community [2,3]. This contribution is largely due to its extensive forest cover, reliance on hydropower (a clean energy source), and low industrial emissions. Agriculture is the backbone of the Bhutanese economy, employing ≈ 41% of the population and contributing about 15% to the Gross Domestic Product (National Statistics Bureau) [4]. Driven by a strong commitment to agricultural sustainability, Bhutan has expressed the aspiration to become a 100% organic nation at some stage, recognizing that organic agriculture (OA) offers greater benefits to smallholder farmers than conventional agriculture [5,6].
While OA in general offers several advantages, critics contend that its lower yields could require more land to meet food demands, potentially causing deforestation and biodiversity loss, and offsetting its environmental benefits [7]. However, one of the first studies to synthesize global data found that OA can match or exceed crop yields compared with conventional practices and could feed the world using existing farmland [8]. Although yield differences are highly context-dependent and vary with system and site characteristics, a meta-analysis reported that yields under OA were on average 34% lower than those under conventional chemical-based agriculture [9].
Soil is an active storage pool of soil organic carbon (SOC) and is a critical determinant of soil health [10]. The literature indicates that even a small increase in SOC content could provide tremendous benefits by restoring soil health [11,12] because SOC plays a vital role in nutrient availability, pollutant detoxification, and C storage [13,14]. Increasing SOC content through practices like using composted manure and diverse plant mixtures, not only improves soil health but also has significant potential to reduce atmospheric CO2 levels and mitigate greenhouse gas (GHG) emissions [10,15]. Soil health in this context broadly refers to its sustained capacity to function as a living, dynamic ecosystem that underpins plant, animal, and human well-being, while integrating agricultural and soil science with policy frameworks, stakeholder demands, and sustainable supply-chain systems [16]. Since OA involves use of manure, compost and other organic materials for maintenance of soil fertility, SOC content is often higher than that in conventional farming, which primarily depends on chemical fertilizers [17]. It is this trend that makes OA a more sustainable land use practice, with the potential to improve biodiversity, soil and water quality and farmer resilience [18,19].
In Bhutan, the principle of environmental conservation forms a fundamental component of the Gross National Happiness (GNH) framework, which shapes the nation’s development policies and strategic planning [20,21]. This policy has supported the advancement of OA, which is more environmentally sustainable and ecologically resilient than conventional methods, largely because it avoids the use of agrochemicals. In accord with this, the Royal Government of Bhutan has actively encouraged the adoption of OA practices [21,22] which have been pursued through efforts like establishing and executing the National Organic Flagship Program under the 12th Five-Year Plan (2018–2023) [23]. OA in Bhutan is supported through initiatives like model organic villages and capacity building by the National Center for Organic Agriculture (NCOA), though only a small percentage of arable land (3%) is currently certified [24]. But, studies assessing soil properties under OA in Bhutan are scanty [23,25]. Nonetheless, OA is gaining interest but faces major challenges, including lower yields (18–45% below conventional), nitrogen (N) deficiencies, limited funding, weak extension services, and insufficient research [24]. Some field studies have documented that OA produces significantly lower yields and reduces profitability in organic potato farming compared to those with conventional practices [26,27], probably due to lack of proper management of soil nutrients [28]. One promising approach is leveraging social structures like triad closure in labor exchange networks, which may help identify communities well-positioned to adopt labor-intensive OA practices [29].
While agricultural research has traditionally been conducted in controlled environments like research stations to develop standardized practices, there is an increasing need for on-farm research that reflects farmers’ real-world practices and local conditions [30,31]. Indeed, assessing the impact of management practices on soil properties through on-farm research offers a more accurate representation of real farm conditions and complexities compared to those under small-scale plot trials [32,33]. In this context and given the growing interest and adoption of OA within Bhutan’s fragile mountain ecosystems [5,6], the present study uniquely contributes by evaluating the effects of OA on soil properties under real on-farm conditions, highlighting its practical implications for sustainable soil management in mountainous regions. This study aimed to evaluate the impact of OA on key soil properties, including SOC and total N content, nutrient availability (phosphorus (P) and potassium (K)), C:N ratio, and pH, across different land uses and altitudinal gradients, addressing a research gap that remains largely unexplored. Therefore, the field study under on-farm condition was designed to test the two hypotheses (1) that soil properties differ across land use practices within altitudinal settings, and (2) that SOC content is associated with soil particle-size distribution (texture) and pH.
2. Materials and Methods
2.1. Study Area and Research Design
The study sites were aligned in a north–south orientation across west–central Bhutan to represent three distinct altitudinal zones while also encompassing diverse farming communities (Figure 1). These sites and research design were part of a previous study on earthworm inventory [23], where detailed site information is thoroughly documented. However, the current study focuses on soil properties, including SOC and soil nutrient contents among organic fields (OrgF), conventional fields (ConF), and natural vegetation (NatV) in three blocks (geogs) within three districts of Bhutan. The sites (geogs) were strategically selected to capture altitudinal variation, with Sephu in Wangdue Phodrang as the high-altitude site, Chapcha in Chhukha as the mid-altitude site, and Tsendagang in Dagana as the low-altitude site (Figure 1). The altitudinal difference between each location was at least 700 m, ensuring clear separation among the sites. Seven sites were randomly selected within each geog to represent the three land use types: OrgF, ConF, and NatV. In an effort to minimize environmental variability within the designated geographic area, the selected sites were situated either adjacent to or within the immediate vicinity of one another. An OrgF site was characterized as a field managed organically for at least four years, without the use of chemical fertilizers or pesticides. Conversely, a ConF site was maintained with the application of chemical fertilizers, pesticides, and manure over the same period. NatV sites comprising an uncultivated forest or rangeland. To establish a robust research design, the three land use types (OrgF, ConF, NatV) were considered as experimental treatments, with seven sites within each altitude/geog as replicates.
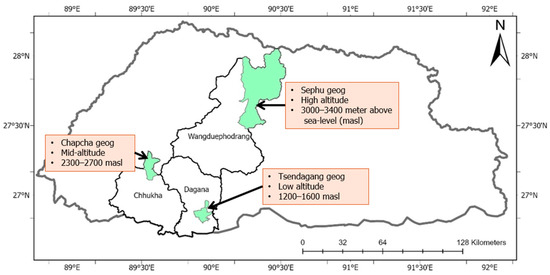
Figure 1.
Map of Bhutan indicating the study sites. Details on the distribution of soil sampling points across altitude categories by land use type are provided in Reference [23].
The sampled fields were primarily cultivated to potato (Solanum tuberosum) or maize (Zea mays), often in spatial or temporal rotation with vegetable crops. In contrast, the NatV sites remained under natural vegetation cover across all three altitudinal categories. In mid- and high-altitude locations, organically managed homestead sites were chosen as OrgF due to the absence of larger organically managed fields, while in low-altitude areas, larger mixed-cropping fields of potatoes and maize were selected. Information on land use practices, including fertilizer types and quantities, cultivation duration, and soil management methods, was obtained from the respective farmers (Table 1).

Table 1.
Crop types/vegetation, farm inputs and land preparation method in three altitude categories [23].
2.2. Land Use History and Vegetation Composition of the Study Sites
Land use history and vegetation composition have been documented elsewhere [23] and is presented herein for contextualization and clarity. A survey of farmers in the selected mid- and high-altitude locations indicated a tendency to employ relatively high levels of chemical fertilizers (Urea, Suphala (15:15:15 N:P:K) and Muriate of Potash), with the objective of optimizing potato yields, their primary cash crop (Table 1). In the high-altitude ConF, many farmers supplement chemical fertilizers with farmyard manure (FYM) and leaf litter, enhancing soil fertility. Conversely, farmers in low-altitude locations, who primarily engage in subsistence agriculture, predominantly cultivate maize and potatoes, and typically use lower amounts of chemical fertilizers or manure. For a period spanning between four and 25 years, farmers cultivating within the three altitude sites have utilized chemical fertilizers. Notably, in high-altitude sites, cattle grazing during the fallow period is common, leading to less intensive cultivation compared to mid- and low-altitude fields (Table 1). For weed and disease control in ConF, herbicides such as metribuzin (C8H14N4OS) and fungicides like mancozeb (dithiocarbamate compound) are used, whereas cattle urine serves as a biopesticide in OrgF [34]. Most vegetables grown typically in rotation with maize or potatoes, are primarily for household consumption across all sites. All study sites do not depend on supplemental irrigation and instead rely solely on rainfed agriculture (Figure 2). Regarding NatV at the high-altitude sites, the dominant species include rhododendron (Rhododendron spp.), great mullein (Verbascum thapsus), fern (Nephrolepis cordifolia), common mugwort (Artemisia vulgaris), wild strawberry (Fragaria vesca), alpine duck, shrubs, and various grasses (Table 1). The mid-altitude NatV sites are characterized by common mugwort, fern, grasses, clover (Trifolium repens), stinging nettle (Urtica dioica), and spearmint (Mentha spicata). In the low-altitude NatV sites, the vegetation primarily consists of fern, common mugwort, grasses, cottonweed (Ageratina adenophora), prickly ash (Zanthoxylum planispinum), and bamboo (Bambusa vulgaris).
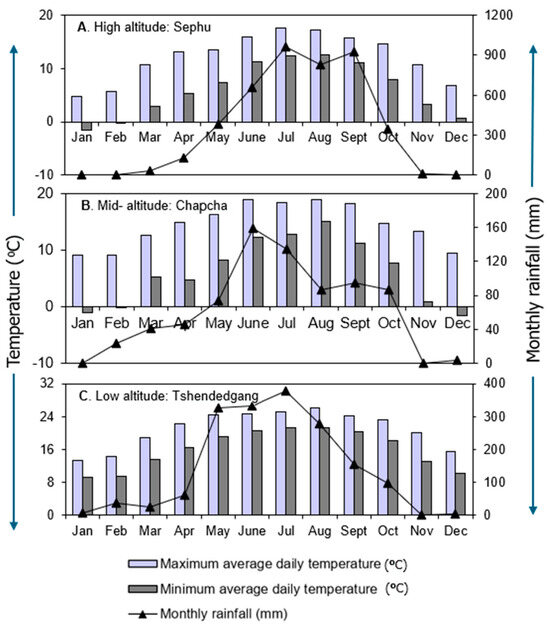
Figure 2.
Weather data, representing four-year averages (2019–2022), were obtained from the nearest meteorological stations to the study sites and sourced from the National Center for Hydrology and Meteorology (NCHM), Bhutan.
2.3. Climatic Conditions
The climatic conditions of the three altitude categories differed considerably in terms of temperature and rainfall patterns (Figure 2). Generally, the rainfall pattern across the altitudes is monomodal, characteristic of regions influenced by the South Asian monsoon, where a single wet season is followed by an extended dry period [35]. At high altitudes (Sephu), temperatures remain relatively low throughout the year, with maximum daily averages peaking ≈ 16–18 °C during summer (June–August) and dropping to sub-zero levels in winter (December–February). Rainfall at Sephu is high during the monsoon season (July–September), reaching a maximum of ≈ 900 mm per month, while the rest of the year remains relatively dry. Mid-altitude sites (Chapcha) exhibit moderate temperatures, with summer highs reaching ≈ 15–19 °C and winter temperatures occasionally falling close to freezing. The monsoon season brings increased rainfall, peaking at close to 160 mm per month, while the dry season (November–March) receives minimal precipitation. Low-altitude sites (Tshendagang) are notably warmer, with maximum temperatures often exceeding 25 °C in summer and remaining relatively mild during winter. Rainfall in this zone is most intense during the monsoon months, reaching ≥378 mm per month, whereas the dry season experiences significantly lower rainfall.
2.4. Soil Sampling and Laboratory Analysis
Seven representative soil samples from each land use type (OrgF, ConF, NatV) were collected from all three altitudinal sites in May 2022 (Table 1) [23]. Sampling sites were generally situated on gentle slopes, with hilltops and valley bottoms deliberately avoided to ensure consistency across land uses at each altitude. Briefly, at each sampling point, a composite soil sample representing the 0–0.3 m depth was prepared by combining equal proportions of soil from three depth intervals (0–0.1, 0.1–0.2 and 0.2–0.3 m) to evaluate soil chemical properties, including contents of SOC, total N, available P and K, and pH. Hence, a total of 63 soil samples (3 × 3 × 7) were collected, consisting of seven replicates for each of the three land use types across the three altitude categories. The distribution of the seven replicate sampling points within each altitude category, stratified by land use type, is presented in detail in [23]. Another set of 63 samples (0–0.3 m depth) for assessment of textural properties were collected using metal auger from sampling sites at different time (December 2024 to February 2025). The soil classification for Sephu and Chapcha sites is Dystric Cambisols, while Tsendagang sites are classified as Haplic Acrisols [36,37].
Soil samples were transported to and analyzed at the Soil and Plant Analytical Laboratory (SPAL) within the National Soil Services Center in Semtokha, Bhutan. Soil pH was measured potentiometrically in a soil-water suspension (1:2.5). The SOC and the total N content were determined using the Walkley-Black method [38] and the micro-Kjeldahl flow analyser method, respectively. Available phosphorus (P) content (mg kg−1) was measured using the Bray’s method [39], while available potassium (K) content (mg kg−1) was assessed using the CaCl2 extraction flow analyzer method [40]. Soil texture was determined on air-dried (<2 mm) soil samples using the pipette method [41].
2.5. Statistical Analysis
Collated and tabulated data on SOC, total N, available P and K content, C:N ratio, soil pH were assessed for normality and homoscedasticity of data distribution by using normal Q-Q plots and residuals vs. fitted values plots, respectively, with the statistical software STAR v.2.0.1 [42]. When the data violated the normality assumptions required for analysis of variance (ANOVA), log transformation was applied to approximate a normal distribution. Assuming a completely randomized design, ANOVA was conducted using STAR v.2.0.1 [42] to evaluate the effects of land use practices (independent variables) within each altitude category on soil properties, including SOC, total N, available P and K content, C:N ratio, and pH (response variables). Statistical significance was determined at a p-value threshold of 0.05. For variables requiring log transformation to meet ANOVA assumptions, results were presented as back-transformed means. Post hoc comparisons were conducted using Tukey’s Honest Significant Difference (HSD) test to identify statistically distinct groups. Linear regression analyses were conducted to evaluate the predictive relationships between SOC content and soil properties, including clay, silt and sand contents, and pH. Graphs were generated using STAR v.2.0.1 and Microsoft Excel to visualize the results.
3. Results
3.1. Summarized Test Statistics Using ANOVA
Across the three altitudinal zones, land use effects on soil properties varied markedly (Table 2). At high altitude (Sephu), SOC content differed significantly among land uses (F (2,18) = 10.07, p = 0.001), as did available P (F (2,18) = 5.42, p = 0.014), whereas total N, C:N ratio, soil pH, and available K had no significant land use effects (p > 0.05). At mid-altitude (Chapcha), available P again exhibited significant variation among land uses (F (2,18) = 6.67, p = 0.007), whereas SOC, total N, C:N ratio, soil pH, and available K did not (p > 0.05). At low altitude (Tshendagang), soil pH (F (2,18) = 8.79, p = 0.002) and available K (F (2,18) = 10.69, p = 0.001) differed significantly across land uses, whereas other properties had no significant variation (p > 0.05). In summary, available P showed significant land use effects at both high and mid altitudes, SOC content varied only at high altitude, and soil pH and available K were influenced exclusively at low altitude.
Table 2.
Summary of ANOVA results.
3.2. SOC Content Across Three Altitudes
At high altitudes, SOC content was consistently higher under NatV and OrgF compared to that under ConF (Figure 3). The median SOC content for NatV and OrgV were notably higher, with narrower interquartile ranges, indicating more stable C pools in these systems. In contrast, ConF exhibited the lowest median SOC content and greater variability. A similar pattern was observed at mid-altitude with lowest SOC content under ConF and relatively higher under both NatV and OrgF sites. Soils under NatV maintained a moderate spread, whereas OrgF showed a broader distribution and the central tendency for both NatV and OrgF remained higher than that of ConF sites, reinforcing the trend observed at higher altitude sites. In the low-altitude sites, SOC content under NatV remained the highest, while that under OrgF had the widest range, pointing to heterogeneous C dynamics. ConF again had the lowest SOC content, with a tight distribution around the median, suggesting uniform but reduced C contents.
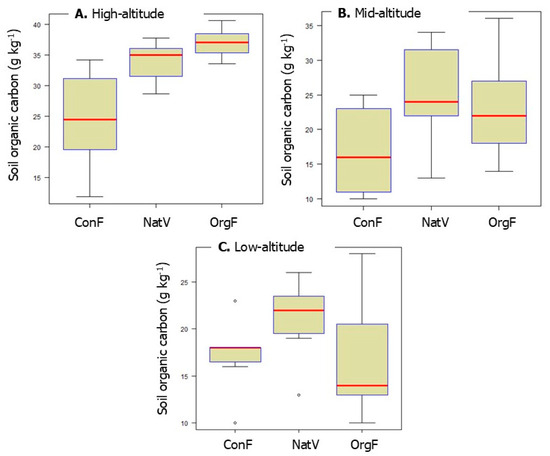
Figure 3.
Data distribution of SOC content by a median, spread and skewedness of three land uses, at high- (A), mid- (B) and low-altitude (C) sites demonstrated using box-and-whisker plots. Medians are represented by horizontal (red) lines within boxes, the 25th and 75th percentiles are represented by box boundaries, and the upper and lower whiskers extend to the largest and smallest values within 1.5 times the inter-quartile range. The points beyond the upper whiskers indicate the outliners. OrgF = organic field, ConF = convention field and NatV = natural vegetation.
At high-altitude sites, SOC content was significantly influenced by land use type (p < 0.001) (Table 2). The highest mean SOC content was recorded under OrgF (37.00 g kg−1) followed by that under NatV (33.80 g kg−1) (Figure 4). In contrast, ConF had significantly lower SOC content (24.59 g kg−1) compared with those under OrgF and NatV. The variation in SOC content among land use types at both mid (ranged 17.00 to 25.43 g kg−1) and low (ranged 17.00 to 21.00 g kg−1) altitude sites was less pronounced and not statistically significant (Figure 4). At mid-altitude, mean SOC content under both OrgF and NatV exceeded that of ConF, but high within-group variability in the OrgF and NatV data rendered these differences statistically non-significant.
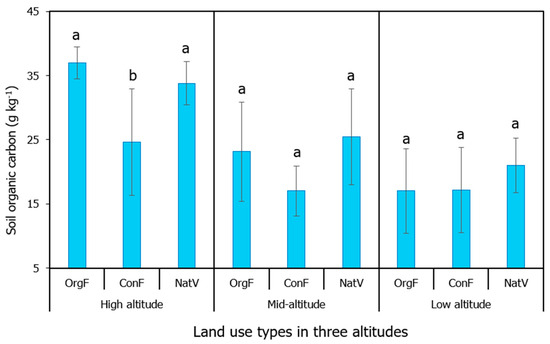
Figure 4.
Soil organic carbon content in three land uses across three altitudes. The same letter within a panel indicates no significant difference at p < 0.05. Error bars show standard deviations of means. OrgF = organic field, ConF = convention field and NatV = natural vegetation.
3.3. Soil Total N Content Across Three Altitudes
For total N, land use effects were not significant at any altitude level (Table 2), though trends suggested some variation (Table 3). At high altitude, total N showed a marginal land use effect (p = 0.08), with the highest mean under OrgF (2.91 g kg−1), followed by that under NatV (2.54 g kg−1) and ConF (2.17 g kg−1) (Table 3). At mid altitude, a similar trend was observed (p = 0.08), with NatV (1.89 g kg−1) and OrgF (1.70 g kg−1) both exhibiting marginally higher total N content than that under ConF (0.91 g kg−1). At low altitude, total N levels were uniformly low (0.80 to 0.91 g kg−1) and statistically similar across land uses.
Table 3.
Soil total N content (g kg−1) at three land uses in three altitudes.
3.4. Soil Carbon:Nitrogen Ratios
Similar to total N content, C:N ratios also did not show significant differences among land uses at any altitude (Table 2). However, there was a general trend of higher C:N ratios at lower altitudes (Table 4). In the high-altitude zone, the mean C:N ratios ranged from 11.36 (ConF) to 13.53 (NatV), indicating relatively stable N dynamics across land uses. At mid-altitude, the ratios were slightly higher, with mean values ranging from 13.69 (OrgF) to 19.29 (ConF). In contrast, the low-altitude zone exhibited considerably higher and more variable mean ratios (ranging from 20.77 to 27.69), indicating slower N turnover compared to that in other zones.
Table 4.
Soil C:N ratios at three land uses in three altitudes.
3.5. Soil pH Across Three Altitudes
Soil pH varied across altitudes and land use types (Table 2), and the general trend showed that the soil pH increased from high altitude to mid- and low altitudes (Figure 5). At high altitude, mean pH ranged from 5.11 to 5.23, showing no significant effect of land use (p = 0.85). As compared to high altitude, soils of mid-altitude had higher pH values, with ConF showing the highest mean (6.33), followed closely by OrgF (6.29) and NatV (6.18). At low altitude, OrgF exhibited a significantly higher mean pH (6.22) compared to that under ConF (5.83) and NatV (5.62).
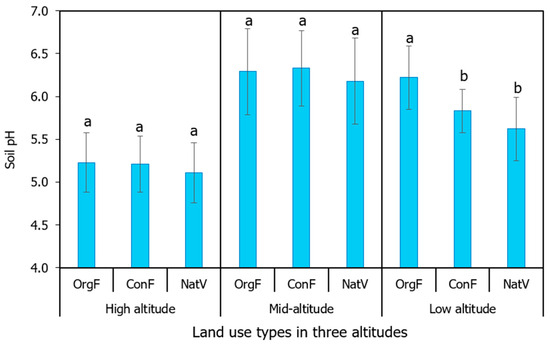
Figure 5.
Soil pH in three land uses across three altitudes. The same letter within a panel indicates no significant difference at p < 0.05. Error bars show standard deviations of means. OrgF = organic field, ConF = convention field and NatV = natural vegetation.
3.6. Soil Available P Across Three Altitudes
Soil available P content exhibited significant variations across land use types in two of three altitudes (p ≤ 0.01) (Table 2), with higher values generally observed in soil at mid- and high-altitude sites compared to those at low-altitude sites (Figure 6). At high altitude, soil under OrgF had the highest mean available P content (44.25 mg kg−1), significantly exceeding those observed under both ConF (14.76 mg kg−1) and NatV (8.60 mg kg−1) soils, despite the high variability. This trend indicates that OrgF practices enhance available P compared to soil under other land uses in high-altitude regions. At mid-altitude, available P content was highly variable but differed significantly among land uses, with OrgF (69.61 mg kg−1) and ConF (41.36 mg kg−1) both showing significantly higher values than that under NatV (2.38 mg kg−1). At low altitude, available P content ranged narrowly from 0.53 to 3.27 mg kg−1 across all land uses and showed no significant differences among them.
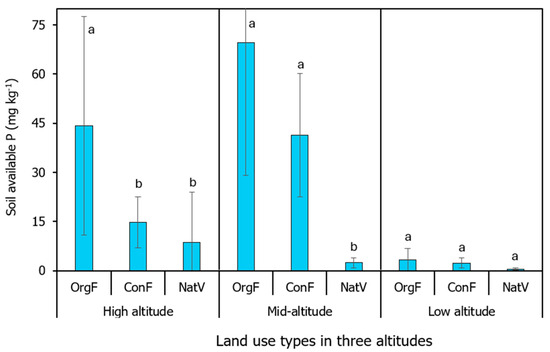
Figure 6.
Soil available P in three land uses across three altitudes. The same letter within a panel indicates no significant difference at p < 0.05. Error bars show standard deviations of means. OrgF = organic field, ConF = convention field and NatV = natural vegetation.
3.7. Soil Available K Across Three Altitudes
Across altitudes, available K content in soil peaked at mid-altitude and was the lowest under NatV at low altitude (Table 5). At high altitude, available K content in soil under OrgF and ConF had identical means (120.93 mg kg−1), while that under NatV was marginally higher (133.88 mg kg−1). Soils at mid-altitude exhibited the highest mean available K content of the three altitude groups, i.e., 258.08 mg kg−1 under OrgF, 190.97 mg kg−1 under ConF, and 135.99 mg kg−1 under NatV. At low altitude, K content in soils under OrgF (145.64 mg kg−1) slightly exceeded those for ConF (137.31 mg kg−1), whereas that under NatV remained substantially and statistically lower (50.06 mg kg−1).
Table 5.
Soil available K (mg kg−1) at three land uses in three altitudes.
3.8. Relationships of Soil C to Texture and pH
The assessment of SOC content and soil properties (clay, silt, sand, and pH) across three altitudinal zones and three land uses revealed significant associations among them (Figure 7). The regression analyses revealed a positive relationship between SOC content and both soil clay (coefficient of determination, R2 = 0.13, p < 0.01) and silt content (R2 = 0.25, p < 0.001). In contrast, SOC content demonstrated a highly significant negative relationship with soil sand content (R2 = 0.23, p < 0.001) and soil pH (R2 = 0.23, p < 0.001). These significant coefficients of determination indicate that soil texture and pH are negatively associated and represent key factors governing SOC levels across the altitudinal zones and land uses studied.
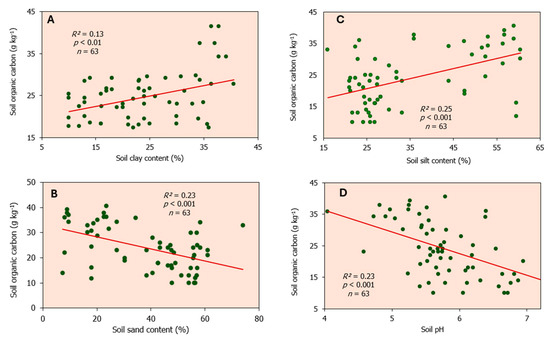
Figure 7.
The relationships between SOC and soil properties (clay, sand, silt and pH) are shown in (A), (B), (C), and (D), respectively. Each green dot represents an individual data point showing the intersection of the two variables and the red line represents the linear regression fit (trend) through these points in each plot.
4. Discussion
The observed variation in SOC content across altitudes and land uses highlights the influence of both management practices and environmental conditions on SOC dynamics. At high-altitude sites, SOC content was higher under OrgF and NatV compared with that under ConF (Figure 4), while SOC content did not differ among land uses in mid- and low- altitude sites. Overall, SOC content tended to be higher at higher altitudes regardless of land use, probably due to cooler temperatures, slower decomposition rate [43,44], and less intensive farming practices. The altitudinal trend observed in this study aligns with data from some previous studies [45,46], indicating that variations in altitude influence climatic factors that regulate the decomposition rate of soil organic matter (SOM) [45]. In addition to improving soil health, OA contributes to maintaining Bhutan’s carbon-negative status [2,3], though this effect is primarily evident in high-altitude sites. However, the largest contributor to the country’s C negativity remains in its extensive forest cover, which accounts for 71% of Bhutan’s total land area [1].
While soil pH did not vary significantly with land use at high- and mid-altitudes, it was notably higher under OrgF at low-altitude, possibly indicating enhanced buffering capacity in organically managed soils. Across all three altitudes, soils with higher SOC content consistently exhibited numerically lower pH, highlighting the dual role of organic acids in both acidifying the soil and reducing decomposition, thereby preserving SOC content in these acidic soils [47,48]. At high-altitude sites, the highest mean SOC content (37.00 g kg−1 under OrgF) was associated with a pH of 5.23 (Figure 7D). In contrast, lower SOC content under ConF (24.59 g kg−1) had a similar pH (5.21), indicating that acidification at this elevation is already pronounced regardless of its SOC content. In mid-altitude sites, soils under NatV demonstrated marginally higher mean SOC content (25.43 g kg−1) and slightly lower pH (6.18) compared to that in soils under ConF (17.00 g kg−1 SOC and pH 6.33), suggesting that land use influences SOC content and pH dynamics. At low-altitude sites, the highest mean SOC content (21.00 g kg−1 under NatV) was associated with the lowest mean pH (5.62), while OrgF soils had lower mean SOC content (17.00 g kg−1) and higher pH (6.22), indicating the combined effect of land use and altitude on SOC-pH dynamics. Overall, SOC content and soil pH were inversely related (R2 = 0.23, p < 0.001) with soils richer in SOC content tending to be more acidic (lower pH), while those with higher pH generally exhibit lower SOC content (Figure 7D). There are three primary reasons for the observed relationship between SOC content and soil pH [49,50]. First, decomposition of organic inputs, such as manures and leaf litter, releases organic acids (e.g., fulvic and humic acids) into the soil solution, leading to H+ release and a consequent decrease in soil pH [51]. This effect is particularly noticeable at high-altitude sites, where slower decomposition and cooler temperatures can enhance acid accumulation. Second, high inputs of biomass-C from crop residues, manures, or litter tend to accumulate organic acids over time at high-altitude sites, acidifying the soil environment. In contrast, inputs of biomass-C decreased progressively in mid- and low-altitude sites (Table 1), where warmer climates further influenced SOC-pH dynamics. Third, soils with relatively higher pH at mid- and low altitudes (Figure 5) generally support greater microbial activity, which enhances decomposition rates and consequently results in reducing SOC contents (Figure 4). This could be due to the combined effect of reduced organic inputs (Table 1), warmer temperatures (Figure 2), and enhanced microbial decomposition. This is because higher soil pH at mid- and low-altitude sites provides a more favorable and nutrient-rich environment for microbes, thereby enhancing microbial activity and organic matter decomposition, which ultimately accelerates SOC loss. In summary, SOC content and pH form a feedback loop: high SOC promotes acidification, and low pH slows decomposition to further enhance SOC accumulation [47,48]. Hence, understanding this interaction is critical for managing soils for fertility (nutrient content) and SOC sequestration.
The relationships between soil texture and SOC content revealed that finer particles generally promote SOC stabilization, while coarser particles accelerate organic matter turnover [52]. In a dataset of 63 soil samples, clay content had a weak positive association with SOC content (R2 = 0.13, p < 0.01) (Figure 7A), indicating that soils with higher clay fractions tend to retain slightly more SOC, likely due to clay’s ability to adsorb and protect organic molecules [53]. Silt content exhibited the strongest positive correlation with SOC content (R2 = 0.25, p < 0.001) (Figure 7C), suggesting that silt particles, like clay, provide surfaces that facilitate adsorption, enhance aggregation, and stabilize organic matter. The SOC stabilized in the silt and clay fractions slows down decomposition, thereby reducing the emission of GHG (CO2 and CH4) into the atmosphere [54,55]. Conversely, sand content had a significant negative relationship with SOC content (R2 = 0.23, p < 0.001) (Figure 7B), reflecting tendency of sandy soils to lose SOC due to larger pore spaces and lower aggregation [56]. Despite the statistical significance of these regressions, texture alone accounted for only 13 to 25% of variability in SOC content, indicating that other factors such as land use practices, climate, altitude, and management strategies also influence SOC dynamics.
Although total N content did not differ significantly across altitudinal zones or land use types, the trend suggests that OrgF may enhance N contents stocks relative to other systems at higher elevations (Table 3). Although SOC levels were influenced by both altitude and land use, total N content remained relatively stable, suggesting that C sequestration processes might be more sensitive to environmental variations compared to that for N cycling in the studied soils.
The C:N ratio of soil may be a key indicator of mechanisms which stabilize SOC content [57]. Although no significant differences were observed among land use practices across the three altitudes, the C:N ratio displayed a clear altitudinal gradient, increasing from high to low elevations across all land uses (Table 4). At high altitude, C:N ratios were relatively low and consistent (11.36 to 13.53), indicating balanced organic matter quality and efficient nutrient cycling [57,58]. This pattern reflects rapid decomposition and stable nutrient turnover under cooler conditions. At mid-altitude, the C:N ratios increased and displayed more variability (13.69 to 19.29), suggesting a mix of organic inputs and variable decomposition rates driven by warmer temperatures and diverse management practices. Soils of low-altitude sites had the highest C:N ratios (20.77 to 27.69), indicating slower decomposition [59] and the accumulation of stable organic matter [57] in warmer conditions. The upward trend of C:N ratio in soils from high to low altitude, along with variations across land uses, highlights the combined effects of climate, vegetation inputs, and management on SOM quality and nutrient cycling. Generally, lower C:N ratios favor plant growth and nutrient cycling, while higher ratios may result in temporary N limitations and slower organic matter decomposition [60,61].
Soils at mid-altitude exhibited the highest mean available K and P contents among the three altitude groups, with soil under OrgF consistently outperforming those under other land uses (Figure 6 and Table 5). Although not statistically significant due to high variability, the elevated mean K content in soil under OrgF (258.08 mg kg−1) and ConF (190.97 mg kg−1) compared to that under NatV (135.99 mg kg−1) suggest that agricultural practices enhance K availability at mid-altitude. Similarly, soil under OrgF had the highest mean available P (44.25 mg kg−1) at high altitude, significantly surpassing those of ConF (14.76 mg kg−1) and NatV (8.60 mg kg−1), indicating that organic practices improve P content in high-altitude soils. However, despite this nutrient improvement, organic potato farming in areas near high altitude sites often results in notably lower yields and reduced profitability compared to those of the conventional methods [26,27]. This trend reflects a broader trend in Bhutan, where farmers, despite strong indigenous knowledge and focus on crop yield, often apply N fertilizer at low rate that limits productivity [62]. Applying ≥50 kg N ha−1 can boost wheat yields and soil health with low emissions [63], highlighting the need to combine traditional practices with improved nutrient management and life cycle thinking in OA [28,64].
Despite high variability leading to non-significant differences at low altitudes, mean available K under OrgF (145.64 mg kg−1) and ConF (137.31 mg kg−1) exceeded those of NatV (50.06 mg kg−1) by at least 174%, highlighting the role of farming practices in sustaining K levels. Yet, mean available P content remained uniformly low across all land uses at low altitude, with OrgF showing a slight advantage (3.27 mg kg−1) over soils under ConF (2.37 mg kg−1) and NatV (0.53 mg kg−1). Soils at mid- and low-altitudes exhibited relatively higher pH compared with that at high altitude (Figure 5), which would normally be expected to enhance P availability [65]. However, available P at low altitude had no corresponding increase (Figure 6), suggesting an inherent P limitation. This limitation is likely attributable to altitude-specific constraints such as, limited microbial P turnover, or low P solubility [66], compounded by the low input of manure and fertilizer (Table 1). Limited P availability is unlikely due to fixation, as soil pH values (5.62–6.22) were above the threshold (≤5.5) where Fe and Al oxides strongly immobilize phosphate into insoluble compounds [65,67]. Overall, mid-altitude sites exhibited higher levels of available K and P, particularly under OrgF management. In contrast, low-altitude sites had consistently low P content, suggesting inherent P limitations in these soils regardless of management practice. To alleviate nutrient limitations and support a healthy food system, farmers need to comprehend sustainable nutrient dynamics and implement life cycle thinking in the OrgF [28]. The large spatial variability observed in soil nutrient data, common in on-farm studies [68,69], likely stems from inherent site heterogeneity.
5. Conclusions
Data from this on-farm study have proven the hypothesis that land use within an altitude category significantly influences soil properties, particularly contents of SOC, available P and K, and pH. High-altitude sites, especially under OrgF and NatV, had the highest SOC contents, whereas low-altitude sites had lower and more uniform SOC contents across land uses. Total N content and C:N ratios remained relatively stable across management practices within each altitude category. The C:N ratio displayed an altitudinal gradient, increasing from high to low elevations. Soil pH was generally lower at high-altitude sites, increased slightly at mid-altitude, and was the highest at low altitude, particularly under OrgF. Available nutrients (P and K) varied with both altitude and land use, with mid-altitude sites showing the highest contents of available K and P, especially under OrgF, while low-altitude soils had consistently low P content. The second hypothesis was also supported, as SOC content showed significant associations with soil texture and pH. Finer soil particles (silt and clay) were positively related to SOC content due to their role in C stabilization, while sand (coarse particles) showed a negative relationship. These results underscore the importance of both altitude and soil texture in maintaining SOC levels, with OA practices consistently enhancing soil quality, particularly in mid- and high-altitude regions.
Author Contributions
Conceptualization, Y.B., R.L. and A.A.; methodology, Y.B. and A.A.; validation, Y.B.; formal analysis, Y.B.; investigation, Y.B.; resources, A.A. and T.W.; data curation, Y.B.; writing—original draft preparation, Y.B.; writing—review and editing, Y.B., R.L., A.A. and T.W.; visualization, Y.B.; supervision, T.W. and Y.B.; funding acquisition, A.A. All authors have read and agreed to the published version of the manuscript.
Funding
A major part of the fieldwork of this study was funded by the erstwhile National Organic Flagship Program (NOFP) under the Department of Agriculture, Ministry of Agriculture and Livestock, Royal Government of Bhutan, Thimphu, Bhutan.
Institutional Review Board Statement
Not applicable.
Informed Consent Statement
Not applicable.
Data Availability Statement
The data supporting this study are available from the corresponding author upon reasonable request.
Acknowledgments
Authors extend sincere gratefulness to the National Organic Flagship Program, Department of Agriculture, Ministry of Agriculture and Livestock, Thimphu, Bhutan, for generously funding the fieldwork for this study. The authors gratefully acknowledge the administrative and logistical support provided by the National Soil Services Center (NSSC), Semtokha, in facilitating this research. We extend our sincere gratitude to all the participating farmers for granting access to their fields for the field survey. The facilitation and assistance provided by Sarda Gurung and Nima Tshering, Norbu Rinchen, Pradeep Lohar, Surja Kumar Mongar, Karma Jurmi, and Bikash Tamang during the field survey are gratefully acknowledged. We express our sincere gratitude to the Soil and Plant Analytical Laboratory, NSSC, for carrying out the laboratory analysis of the soil samples. We thank Ram C. Bajgai of the University of New Brunswick, Fredericton, Canada for his assistance in creating the map of Bhutan featuring the research sites.
Conflicts of Interest
The authors declare no conflicts of interest.
References
- FRMD. Land Use and Land Cover Assessment of Bhutan 2016: Technical Report; Forest Resources Management Division, Department of Forests and Park Services, Ministry of Agriculture and Forests, Royal Government of Bhutan: Thimphu, Bhutan, 2016. [Google Scholar]
- Yangka, D.; Vanessa, R.; Newman, P. Carbon neutral policy in action: The case of Bhutan. Clim. Policy 2019, 19, 672–687. [Google Scholar] [CrossRef]
- Yangka, D.; Rauland, V.; Newman, P. Carbon neutral Bhutan: Sustaining carbon neutral status under growth pressures. Sustain. Earth Rev. 2023, 6, 4. [Google Scholar] [CrossRef]
- NSB. National Accounts Statistics; National Statistics Bureau, Royal Government of Bhutan: Thimphu, Bhutan, 2024. Available online: www.nsb.gov.bt (accessed on 23 May 2025).
- Feuerbacher, A.; Luckmann, J.; Boysen, O.; Zikeli, S.; Grethe, H. Is Bhutan destined for 100% organic? Assessing the economy-wide effects of a large-scale conversion policy. PLoS ONE 2018, 13, e0199025. [Google Scholar] [CrossRef] [PubMed]
- Duba, S.; Ghimiray, M.; Gurung, T.R. Promoting Organic Farming in Bhutan: A Review of Policy, Implementation and Constraints; Council for RNR Research of Bhutan: Thimphu, Bhutan, 2008. [Google Scholar]
- Trewavas, A. Urban myths of organic farming. Nature 2001, 410, 409–410. [Google Scholar] [CrossRef] [PubMed]
- Badgley, C.; Moghtader, J.; Quintero, E.; Zakem, E.; Chappell, M.J.; Avilés-Vázquez, K.; Samulon, A.; Perfecto, I. Organic agriculture and the global food supply. Renew. Agric. Food Syst. 2007, 22, 86–108. [Google Scholar] [CrossRef]
- Seufert, V.; Ramankutty, N.; Foley, J.A. Comparing the yields of organic and conventional agriculture. Nature 2012, 485, 229–232. [Google Scholar] [CrossRef]
- Lal, R. Soil carbon sequestration to mitigate climate change. Geoderma 2004, 123, 1–22. [Google Scholar] [CrossRef]
- de Vries, W. Soil carbon 4 per mille: A good initiative but let’s manage not only the soil but also the expectations. Geoderma 2018, 309, 111–112. [Google Scholar] [CrossRef]
- Lal, R. Promoting “4 Per Thousand” and “Adapting African Agriculture” by south-south cooperation: Conservation agriculture and sustainable intensification. Soil Tillage Res. 2019, 188, 27–34. [Google Scholar] [CrossRef]
- Gerke, J. The central role of soil organic matter in soil fertility and carbon storage. Soil Syst. 2022, 6, 33. [Google Scholar] [CrossRef]
- Khangura, R.; Ferris, D.; Wagg, C.; Bowyer, J. Regenerative agriculture—A literature review on the practices and mechanisms used to improve soil health. Sustainability 2023, 15, 2338. [Google Scholar] [CrossRef]
- Bajgai, Y.; Kristiansen, P.; Hulugalle, N.; McHenry, M. Factors and mechanisms regulating soil organic carbon in agricultural systems. In Agroecology, Ecosystems, and Sustainability; Benkeblia, N., Ed.; CRC Press, Taylor & Francis: Boca Raton, FL, USA, 2014; pp. 41–56. [Google Scholar]
- Lehmann, J.; Bossio, D.A.; Kögel-Knabner, I.; Rillig, M.C. The concept and future prospects of soil health. Nat. Rev. Earth Environ. 2020, 1, 544–553. [Google Scholar] [CrossRef]
- Bajgai, Y.; Kristiansen, P.; Hulugalle, N.; McHenry, M.; McCorkell, B. Soil organic carbon and microbial biomass carbon under organic and conventional vegetable cropping systems in an Alfisol and a Vertisol. Nutr. Cycl. Agroecosyst. 2015, 101, 1–15. [Google Scholar] [CrossRef]
- Seufert, V.; Ramankutty, N. Many shades of gray—The context-dependent performance of organic agriculture. Sci. Adv. 2017, 3, e1602638. [Google Scholar] [CrossRef]
- Blockeel, J.; Schader, C.; Heidenreich, A.; Grovermann, C.; Kadzere, I.; Egyir, I.S.; Muriuki, A.; Bandanaa, J.; Tanga, C.M.; Clottey, J.; et al. Do organic farming initiatives in Sub-Saharan Africa improve the sustainability of smallholder farmers? Evidence from five case studies in Ghana and Kenya. J. Rural Stud. 2023, 98, 34–58. [Google Scholar] [CrossRef]
- Neuhoff, D.; Tashi, S.; Rahmann, G.; Denich, M. Organic agriculture in Bhutan: Potential and challenges. Org. Agric. 2014, 4, 209–221. [Google Scholar] [CrossRef]
- Tshomo, K.; Dorji, Y. National Framework for Organic Farming in Bhutan; Department of Agriculture, Ministry of Agriculture, Royal Government of Bhutan: Thimphu, Bhutan, 2006. [Google Scholar]
- Tashi, S.; Wangchuk, K. Prospects of organic farming in Bhutan: A SWOT analysis. Adv. Agric. 2016, 2016, 1717352. [Google Scholar] [CrossRef]
- Adhikari, A.; Bajgai, Y.; Rabgyal, J.; Lal, R.; Tshering, N.; Gurung, S.; Wangdi, T. Altitude, land use and soil depth effects on earthworm density and its relationship to soil properties in an on-farm study. J. Soil Sci. Plant Nutr. 2024, 24, 6569–6583. [Google Scholar] [CrossRef]
- Tshotsho; Lippert, C.; Zikeli, S.; Krimly, T.; Barissoul, A.; Feuerbacher, A. The role of management and farming practices, yield gaps, nutrient balance, and institutional settings in the context of large-scale organic conversion in Bhutan. Agric. Syst. 2024, 220, 104057. [Google Scholar] [CrossRef]
- Dorji, K.D.; Dema, Y.; Uden, T. Effect of different rates and combinations of farm yard manure and inorganic fertilizers on chili (Capsicum annum) yield. Bhu. J. RNR 2009, 5, 1–14. [Google Scholar]
- Rai, P.; Tulsi, G.; Sonam, T. Comparative economic analysis of potato production in Western Bhutan-conventional versus in-conversion to organic. Cogent Food Agric. 2025, 11, 2493127. [Google Scholar] [CrossRef]
- Lepcha, N.; Mankeb, P.; Suwanmaneepong, S. Productivity and profitability of organic and conventional potato (Solanum tuberosum L.) production in West-Central Bhutan. Open Agric. 2021, 6, 640–654. [Google Scholar] [CrossRef]
- David, W.; Auerbach, R.; Bügel, S.G.; Chander, M.; Saeed, M.F.; Hernandez, L.F.; Melati, M.; Tashi, S.; Sinicom, S. Organic Food System: An overview and its challenges for healthy food systems. Org. Agric. 2025, 15, 147–158. [Google Scholar] [CrossRef]
- Tshotsho; Lippert, C.; Feuerbacher, A. Organic agriculture, labour exchange, and social networks: A case study of smallholder farming in Bhutan. Org. Agric. 2023, 13, 83–98. [Google Scholar] [CrossRef]
- Lacoste, M.; Cook, S.; McNee, M.; Gale, D.; Ingram, J.; Bellon-Maurel, V.; MacMillan, T.; Sylvester-Bradley, R.; Kindred, D.; Bramley, R.; et al. On-Farm Experimentation to transform global agriculture. Nat. Food 2022, 3, 11–18. [Google Scholar] [CrossRef] [PubMed]
- Toffolini, Q.; Jeuffroy, M. On-farm experimentation practices and associated farmer-researcher relationships: A systematic literature review. Agron. Sustain. Dev. 2022, 42, 114. [Google Scholar] [CrossRef]
- Wood, S.A.; Bowman, M. Large-scale farmer-led experiment demonstrates positive impact of cover crops on multiple soil health indicators. Nat. Food 2021, 2, 97–103. [Google Scholar] [CrossRef] [PubMed]
- Crookston, B.; Yost, M.; Bowman, M.; Veum, K. Relationships of on-farm soil health scores with corn and soybean yield in the midwestern United States. Soil Sci. Soc. Am. J. 2022, 86, 91–105. [Google Scholar] [CrossRef]
- Gahukar, R.T. Cow urine: A potential biopesticide. Indian J. Entomol. 2013, 75, 212–216. [Google Scholar]
- Loo, Y.Y.; Billa, L.; Singh, A. Effect of climate change on seasonal monsoon in Asia and its impact on the variability of monsoon rainfall in Southeast Asia. Geosci. Front. 2015, 6, 817–823. [Google Scholar] [CrossRef]
- IUSS Working Group WRB. World Reference Base for Soil Resources 2014, Update 2015 International Soil Classification System for Naming Soils and Creating Legends for Soil Maps; World Soil Resources Reports No. 106; FAO: Rome, Italy, 2015. [Google Scholar]
- NSSC. Tecnical Report on the Generation of National Soil Map of Bhutan Using Digital Soil Mapping Techniques; Report No. SS 28; National Soil Services Centre (NSSC), Department of Agriculture, Ministry of Agriculture and Livestock: Thimphu, Bhutan, 2023. [Google Scholar]
- Nelson, D.W.; Sommers, L.E. Total carbon, organic carbon and organic matter. In Methods of Soil Analysis: Part 2. Chemical and Microbiological Properties—Agronomy Monograph No. 9; Page, A.L., Ed.; ASA: Madison, WI, USA, 1982; pp. 539–579. [Google Scholar]
- Dewis, J.; Freitas, F. Physical and Chemical Methods of Soil and Water Analysis; FAO soils Bulletin; FAO: Rome, Italy, 1970. [Google Scholar]
- Steele, L.D.; Ramsey, K.J.; Kane, P.F. Elimination of aliquoting in automated flame photometric determination of K2O in fertilizers. J. Assoc. Off. Anal. Chem. 1984, 67, 847–850. [Google Scholar] [CrossRef]
- Gee, G.W.; Or, D. Particle-Size Analysis. In Methods of Soil Analysis: Part 4 Physical Methods; SSSA Book Series No. 5; Dane, J.H., Topp, G.C., Eds.; SSSA: Madison, WI, USA, 2002. [Google Scholar]
- IRRI. Statistical Tool for Agricultural Research (STAR) v. 2.0.1; IRRI: Los Banos, Philippines, 2014. [Google Scholar]
- Conant, R.T.; Ryan, M.G.; Ågren, G.I.; Birge, H.E.; Davidson, E.A.; Eliasson, P.E.; Evans, S.E.; Frey, S.D.; Giardina, C.P.; Hopkins, F.M.; et al. Temperature and soil organic matter decomposition rates–synthesis of current knowledge and a way forward. Glob. Change Biol. 2011, 17, 3392–3404. [Google Scholar] [CrossRef]
- Davidson, E.A.; Janssens, I.A. Temperature sensitivity of soil carbon decomposition and feedbacks to climate change. Nature 2006, 440, 165–173. [Google Scholar] [CrossRef]
- Choudhury, B.U.; Fiyaz, A.R.; Mohapatra, K.P.; Ngachan, S. Impact of Land Uses, Agrophysical Variables and Altitudinal Gradient on Soil Organic Carbon Concentration of North-Eastern Himalayan Region of India. Land Degrad. Dev. 2016, 27, 1163–1174. [Google Scholar] [CrossRef]
- Ruiz Sinoga, J.D.; Pariente, S.; Diaz, A.R.; Martinez Murillo, J.F. Variability of relationships between soil organic carbon and some soil properties in Mediterranean rangelands under different climatic conditions (South of Spain). Catena 2012, 94, 17–25. [Google Scholar] [CrossRef]
- Bai, Z.; Caspari, T.; Gonzalez, M.R.; Batjes, N.H.; Mäder, P.; Bünemann, E.K.; de Goede, R.; Brussaard, L.; Xu, M.; Ferreira, C.S.S.; et al. Effects of agricultural management practices on soil quality: A review of long-term experiments for Europe and China. Agric. Ecosyst. Environ. 2018, 265, 1–7. [Google Scholar] [CrossRef]
- Sun, X.-L.; Minasny, B.; Wu, Y.-J.; Wang, H.-L.; Fan, X.-H.; Zhang, G.-L. Soil organic carbon content increase in the east and south of China is accompanied by soil acidification. Sci. Total Environ. 2023, 857, 159253. [Google Scholar] [CrossRef]
- Liao, K.; Wu, S.; Zhu, Q. Can soil pH be used to help explain soil organic carbon stocks? Clean Soil Air Water 2016, 44, 1685–1689. [Google Scholar] [CrossRef]
- Wang, C.; Kuzyakov, Y. Soil organic matter priming: The pH effects. Glob. Change Biol. 2024, 30, e17349. [Google Scholar] [CrossRef] [PubMed]
- Ritchie, G.S.P.; Dolling, P.J. The role of organic matter in soil acidification. Soil Res. 1985, 23, 569–576. [Google Scholar] [CrossRef]
- Thabit, F.N.; El-Shater, A.-H.; Soliman, W. Role of silt and clay fractions in organic carbon and nitrogen stabilization in soils of some old fruit orchards in the Nile floodplain, Sohag Governorate, Egypt. J. Soil Sci. Plant Nutr. 2023, 23, 2525–2544. [Google Scholar] [CrossRef]
- Baldock, J.A.; Skjemstad, J.O. Role of the soil matrix and minerals in protecting natural organic materials against biological attack. Org. Geochem. 2000, 31, 697–710. [Google Scholar] [CrossRef]
- Dhaliwal, S.S.; Naresh, R.K.; Gupta, R.K.; Panwar, A.S.; Mahajan, N.C.; Singh, R.; Mandal, A. Effect of tillage and straw return on carbon footprints, soil organic carbon fractions and soil microbial community in different textured soils under rice–wheat rotation: A review. Rev. Environ. Sci. Bio/Technol. 2020, 19, 103–115. [Google Scholar] [CrossRef]
- Kleber, M.; Mikutta, R.; Torn, M.S.; Jahn, R. Poorly crystalline mineral phases protect organic matter in acid subsoil horizons. Eur. J. Soil Sci. 2005, 56, 717–725. [Google Scholar] [CrossRef]
- Huang, J.; Hartemink, A.E. Soil and environmental issues in sandy soils. Earth-Sci. Rev. 2020, 208, 103295. [Google Scholar] [CrossRef]
- Lützow, M.V.; Kögel-Knabner, I.; Ekschmitt, K.; Matzner, E.; Guggenberger, G.; Marschner, B.; Flessa, H. Stabilization of organic matter in temperate soils: Mechanisms and their relevance under different soil conditions—A review. Eur. J. Soil Sci. 2006, 57, 426–445. [Google Scholar] [CrossRef]
- Ernfors, M.; von Arnold, K.; Stendahl, J.; Olsson, M.; Klemedtsson, L. Nitrous oxide emissions from drained organic forest soils––an up-scaling based on C:N ratios. Biogeochemistry 2007, 84, 219–231. [Google Scholar] [CrossRef]
- Springob, G.; Kirchmann, H. Bulk soil C to N ratio as a simple measure of net N mineralization from stabilized soil organic matter in sandy arable soils. Soil Biol. Biochem. 2003, 35, 629–632. [Google Scholar] [CrossRef]
- Cui, J.; Zhu, R.; Wang, X.; Xu, X.; Ai, C.; He, P.; Liang, G.; Zhou, W.; Zhu, P. Effect of high soil C/N ratio and nitrogen limitation caused by the long-term combined organic-inorganic fertilization on the soil microbial community structure and its dominated SOC decomposition. J. Environ. Manag. 2022, 303, 114155. [Google Scholar] [CrossRef] [PubMed]
- van der Sloot, M.; Kleijn, D.; De Deyn, G.B.; Limpens, J. Carbon to nitrogen ratio and quantity of organic amendment interactively affect crop growth and soil mineral N retention. Crop Environ. 2022, 1, 161–167. [Google Scholar] [CrossRef]
- Bajgai, Y.; Sangchyoswat, C. Farmers knowledge of soil fertility in West-Central Bhutan. Geoderma Reg. 2018, 14, e00188. [Google Scholar] [CrossRef]
- Bajgai, Y.; Yeshey, Y.; De Mastro, G.; Ghimiray, M.; Chhogyel, N.; Tshewang, S.; Alhajj Ali, S. Influence of nitrogen application on wheat crop performance, soil properties, greenhouse gas emissions and carbon footprint in central Bhutan. Environ. Dev. 2019, 32, 100469. [Google Scholar] [CrossRef]
- Nemecek, T.; Dubois, D.; Huguenin-Elie, O.; Gaillard, G. Life cycle assessment of Swiss farming systems: I. Integrated and organic farming. Agric. Syst. 2011, 104, 217–232. [Google Scholar] [CrossRef]
- Penn, C.J.; Camberato, J.J. A Critical Review on Soil Chemical Processes that Control How Soil pH Affects Phosphorus Availability to Plants. Agriculture 2019, 9, 120. [Google Scholar] [CrossRef]
- Menezes-Blackburn, D.; Giles, C.; Darch, T.; George, T.S.; Blackwell, M.; Stutter, M.; Shand, C.; Lumsdon, D.; Cooper, P.; Wendler, R.; et al. Opportunities for mobilizing recalcitrant phosphorus from agricultural soils: A review. Plant Soil 2018, 427, 5–16. [Google Scholar] [CrossRef]
- Wilfert, P.; Kumar, P.S.; Korving, L.; Witkamp, G.-J.; van Loosdrecht, M.C.M. The Relevance of Phosphorus and Iron Chemistry to the Recovery of Phosphorus from Wastewater: A Review. Environ. Sci. Technol. 2015, 49, 9400–9414. [Google Scholar] [CrossRef] [PubMed]
- Fu, W.; Tunney, H.; Zhang, C. Spatial variation of soil nutrients in a dairy farm and its implications for site-specific fertilizer application. Soil Tillage Res. 2010, 106, 185–193. [Google Scholar] [CrossRef]
- Tittonell, P.; Muriuki, A.; Klapwijk, C.J.; Shepherd, K.D.; Coe, R.; Vanlauwe, B. Soil heterogeneity and soil fertility gradients in smallholder farms of the East African highlands. Soil Sci. Soc. Am. J. 2013, 77, 525–538. [Google Scholar] [CrossRef]


Disclaimer/Publisher’s Note: The statements, opinions and data contained in all publications are solely those of the individual author(s) and contributor(s) and not of MDPI and/or the editor(s). MDPI and/or the editor(s) disclaim responsibility for any injury to people or property resulting from any ideas, methods, instructions or products referred to in the content. |
© 2025 by the authors. Licensee MDPI, Basel, Switzerland. This article is an open access article distributed under the terms and conditions of the Creative Commons Attribution (CC BY) license (https://creativecommons.org/licenses/by/4.0/).