
An Innovative Multi-Objective Rescheduling System for Mitigating Pandemic Spread in Aviation Networks


1
School of Air Traffic Management, Civil Aviation University of China, Tianjin 300300, China
2
School of Traffic and Transportation, Beijing Jiaotong University, Beijing 100044, China
3
Department of Electronic and Electrical Engineering, Brunel University London, London UB8 3PH, UK
4
School of Automation, Guangdong University of Technology, Guangzhou 510006, China
*
Authors to whom correspondence should be addressed.
Clean Technol. 2024, 6(1), 77-92; https://doi.org/10.3390/cleantechnol6010006
Submission received: 7 November 2023
/
Revised: 16 December 2023
/
Accepted: 21 December 2023
/
Published: 16 January 2024
Abstract
:The novel coronavirus outbreak has significantly heightened environmental costs and operational challenges for civil aviation airlines, prompting emergency airport closures in affected regions and a substantial decline in ridership. The consequential need to reassess, delay, or cancel flight itineraries has led to disruptions at airports, amplifying the risk of disease transmission. In response, this paper proposes a spatial approach to efficiently address pandemic spread in the civil aviation network. The methodology prioritizes the use of a static gravity model for calculating route-specific infection pressures, enabling strategic flight rescheduling to control infection levels at airports (nodes) and among airlines (edges). Temporally, this study considers intervals between takeoffs and landings to minimize crowd gatherings, mitigating the novel coronavirus transmission rate. By constructing a discrete space–time network for irregular flights, this research generates a viable set of routes for aircraft operating in special circumstances, minimizing both route-specific infection pressures and operational costs for airlines. Remarkably, the introduced method demonstrates substantial savings, reaching almost 53.4%, compared to traditional plans. This showcases its efficacy in optimizing responses to pandemic-induced disruptions within the civil aviation network, offering a comprehensive solution that balances operational efficiency and public health considerations in the face of unprecedented challenges.
1. Introduction
In 2020, the World Health Organization (WHO) classified COVID-19 as a Public Health Emergency of International Concern (PHEIC) due to its mode of transmission, characterized by close-contact and droplet transmission. In response to this classification, numerous countries and regions enacted stringent measures to restrict the entry of foreign visitors, particularly from areas with the highest risk of transmission. Temporary bans were imposed on all foreign passengers who had recently visited the hardest-hit regions within the previous 14 days. The infectious disease outbreaks stemming from COVID-19 have had a substantial impact, resulting in significant disease burdens, increased energy consumption, and economic challenges for affected countries [1,2]. To minimize the spread of the pandemic, countries have swiftly adapted their flight adjustment policies in response to changing pandemic dynamics, necessitating frequent modifications of flight schedules. Even more serious is the cancellation of flights. Appendix A shows the grounding rate of global airlines due to COVID-19 as of 23 May 2020. Simultaneously, the emergence of new infectious diseases with pandemic potential poses a significant threat to human life and socio-economic development [3]. An effective response to, and ideally containment of, an infectious disease outbreak can be significantly enhanced by directing healthcare responses and outbreak control measures toward flights predicted to be at the highest risk of experiencing new outbreaks.
The outbreak of COVID-19 has led to a significant decline in aviation demand, resulting in numerous flight cancellations worldwide. For instance, the outbreak in the United States triggered the cancellation of hundreds of flights at various major airports. Data from the FlightAware website reveal that, on March 19th and 20th, major airlines canceled over 700 flights at Las Vegas Airport. The confluence of the high infectivity of the novel coronavirus and the surge in travel during the Spring Festival led to a 70% cancellation rate by 41 Chinese mainland airlines on 7 February. Similarly, 81 international airlines canceled 56% of their flights. Daily passenger numbers plummeted to 471,600, marking a sharp 76.4% decline. Economic globalization is confronting formidable challenges. Boeing reduced its monthly production of the 787 aircraft from 14 to 12 due to reduced global demand for wide-body planes. On 24 March, the International Air Transport Association (IATA) estimated that the aviation industry would incur a revenue loss of USD 252 billion as compared to 2019, a 44% reduction. The IATA predicted a 48% drop in passenger demand for the year compared to 2019, and travel restrictions will exacerbate the recession’s impact on travel demand. By early April, global flight numbers had dwindled by 80% compared to 2019 [4]. Amid the COVID-19 pandemic, aviation transportation services face a multitude of challenges, extending beyond typical issues like flight delays, aircraft malfunctions, and adverse weather conditions. Unusual flight-related phenomena, such as cancellations, the addition of special flights, and passenger disputes, have emerged. Simultaneously, the novel coronavirus’s person-to-person transmission within a two-meter range has necessitated the management of crowd sizes at airports. Abnormal flights have become increasingly common and economically burdensome. Against the backdrop of this pandemic, the effective rescheduling of abnormal flights while minimizing airlines’ economic losses and curtailing the spread of the virus presents a formidable new challenge.
Throughout the pandemic, irregular flights have frequently led to flight delays and, in some cases, cancellations, resulting in substantial losses for airlines and significantly impacting the interests of passengers, airports, and airline operations [5]. Despite the continuous evolution of irregular flights, there is currently no highly effective method for their mitigation. Hence, the effective scheduling optimization of irregular flights becomes of utmost significance and importance. Many scholars have put forth models and algorithms for flight scheduling and recovery solutions under various conditions that give rise to irregular flights. Wei and colleagues introduced a flight crew management model based on multi-commodity network flow, incorporating a heuristic branch pricing search algorithm to align the flight recovery scheme as closely as possible with the actual scheduling scheme [6,7]. Kohl et al. addressed passenger recovery systems, aircraft recovery systems, crew recovery systems, and integrated recovery systems under different conditions and requirements, providing systematic insights into aviation recovery strategies [8,9,10]. To minimize flight delay costs, Li and Long designed a continuous-time flight route model aimed at deriving an approximate optimal scheme [11,12]. The emphasis of established objective functions and constraint conditions varied in line with differences in airline, airport, and service group characteristics. Qian Wang adopted a collaborative development perspective, establishing the hyper-efficiency DEA model and the Logit model for world-class airport groups to investigate flight time scheduling among airport groups [13]. In the presence of uncertain severe weather dynamics, Zhang et al. formulated a flight route selection and flight takeoff model to enhance flight route capacity utilization and reduce overall flight delay time [14]. Haibin et al. aimed to improve the service recovery quality for flight delays. They employed the SERVQUAL model to construct an evaluation index system for the service recovery quality of flight delays, performed a comprehensive assessment of service recovery quality, and utilized a service quality matrix to determine priority improvement indices [15]. Additionally, many scholars have delved into the analysis of flight delay conditions [16]. However, the outbreak of novel coronavirus pneumonia presented a dramatic challenge to the adjustment of irregular flight scheduling.
In addition to the irregular flight-related issues, the development of the pandemic posed the challenge of limited flight availability. Flight operations also needed to account for the city-specific characteristics of disease spread. Various transmission models, including the SI, SIS, and SIR models [17,18,19,20], were employed to explore the spatiotemporal evolution of communicable diseases. These models offered comprehensive control over the temporal progression of infectious diseases. The gravity model of population flow played a pivotal role in such modeling research, effectively capturing the speed and distance of disease spread [21,22]. Empirical data provided valuable insights into spatial transmission, encompassing instances such as the spatial spread of measles in the UK and Nigeria, influenza spread in the United States and Europe, and the utilization of mobile operator data to construct pandemic models for studying cholera spread in Haitian communities [23,24,25,26,27,28]. Aircraft, being enclosed environments with an inherent infection risk, coupled with their high spatial mobility, increased route-specific infection pressure. Thus, addressing crowd management to reduce the transmission rate of pneumonia emerged as a crucial concern. In light of the aforementioned context, several key questions have arisen:
- (1)
- What is the risk of disease transmission on each flight?
- (2)
- How can the risk of infection be economically and effectively managed through flight adjustments?
This paper focuses on flight and airport rescheduling during a pandemic, taking into account both spatial and temporal dimensions. Our objective is to design a model that minimizes costs and reduces the risk of infection. The second section focuses on determining and computing safe time intervals and spatial infection pressures for airports and flight routes. It introduces a new model and algorithm aimed at minimizing costs and infection risks. The third section involves the calculation and verification of the irregular flight scheduling model. The paper concludes with the fourth section.
2. Materials and Methods
This paper is primarily centered on the challenge of optimizing flight schedules to minimize a range of costs, including potential pandemic transmission expenses, flight delays, flight cancellations, carbon emissions, and the perceived value of passenger transfers, all while mitigating infectious pressure. Amidst an outbreak, all flight operations must align with actual demand and stringent health protection guidelines. Airlines are compelled to make adjustments, such as flight delays and cancellations, to devise viable flight plans that minimize losses. The fundamental objective in this study, within the context of a pandemic, is to optimize flight routing and scheduling to minimize passenger delays and economic losses for airlines.
2.1. Assumptions
To formulate the proposed model, several assumptions have been established:
- Irregular flights: Irregular flights refer to situations where aircraft experience failures or emergency changes, rendering the original flight plan temporarily infeasible.
- Flight adjustment actions: Depending on the duration of the irregularity, flights may be delayed or canceled. Short time intervals result in flight delays, while excessively long intervals lead to cancellations.
- Recovery: Flights return to their originally scheduled flight plan at the end of the recovery time interval.
- Rescheduling methods: Flight rescheduling can be achieved through aircraft exchange, flight delay, or flight cancellation. However, aircraft exchange is exceedingly rare in actual operations and is therefore excluded from the model.
- Aircraft types: Different aircraft types have varying seat capacities, affecting the execution of flight schedules.
- External factors: Changes in the original plan due to external factors, such as alterations in aircraft maintenance plans, are not considered during the recovery process.
- Crew conditions: It is assumed that the aircraft crew adheres to legal duty time regulations without fatigue or flight overruns, thereby not affecting flight operations.
- Infection dynamics: The number of infectious individuals at a study airport is proportionate to the cumulative reported cases at the airport over the preceding 14 days, and the proportion of flight movements between airports mirrors the movements of infectious persons between study areas.
- Time intervals: Determining the flight time interval in the space–time network is critical. Adequate time intervals aid in controlling airport crowding. Typically, domestic passengers are required to arrive at the airport one hour before departure, allowing for the setting of a one-hour flight time interval to disperse crowds.
In the flight adjustment process, the following constraints must be observed:
- Flight execution: Each flight may only be executed once or canceled at most.
- Departure time: The actual departure time for each adjusted flight must not precede the originally planned departure time.
- Delay limit: Flight delay should not exceed the maximum allowable delay limit (not exceeding 4 h).
- Transit time: Due to the pandemic, the transit time between aircraft should be equal to or greater than one hour.
- Airport curfew: Compliance with airport curfew regulations is mandatory.
- Last flight destination: The last flight’s destination airport should remain consistent with the original plan.
2.2. Methodology
2.2.1. Variable Definition
Within the milieu of the COVID-19 pandemic, the formulation of an optimization model for the reinstatement of flight operations mandates the systematic integration of passenger-related parameters, financial considerations, and carbon emissions metrics into the overarching objective function. This imperative underscores a methodological commitment to a comprehensive and sustainable paradigm. The primacy accorded to passenger safety in this optimization schema assumes heightened significance as it engenders a resilient response to health exigencies. Simultaneously, the strategic optimization of costs emerges as a pivotal facet, substantiating the economic viability of airline enterprises. The integration of carbon emissions considerations within this model manifests an attunement to global environmental imperatives, regulatory exigencies, and an industry-wide dedication to sustainable practices. A detailed explication of the discernible variables amenable to optimization within the purview of the elucidated objective function is expounded in Table 1:
2.2.2. Modeling
The constraint conditions of the flight scheduling model are as follows:
When we are constructing the irregular flight scheduling model, the objective function has a variety of selected criteria, such as the minimum passenger waiting time, the minimum number of flight cancellations, avoiding the airport curfew interval, and minimizing the loss that is caused by flight disruption. In this article, we consider the minimum cost to airlines and the corresponding location of the infection pressure of each flight route; the objective function mainly includes the cost minimization of potential outbreak transmission, cost minimization of delay, and cost minimization of flight cancellations.
- The potential pandemic transmission cost
In addition to mitigating delay costs, the distinctive challenges posed by a pandemic underscore the critical role played by infection pressure along each route and the population density at airports in effective pandemic control. Consequently, the precise calculation of infection pressure, as well as the establishment of optimal flight time intervals and frequencies, assumes significant importance. In scenarios characterized by extensive pandemic transmission, when undertaking the task of rescheduling irregular flights, a primary strategy involves prioritizing the cancellation of flights associated with a high infection pressure at specific airport locations. This strategic priority serves to effectively reduce the risk of disease transmission.
Using the flight data to construct a mobility matrix , with elements , comparing the next airport location at t time with their airport at t − 1 time, the infectious pressure is shown as Equation (7).
where the departure and arrival airports of flight are airport and airport . The infectious pressure of flight f is as follows:
- 2.
- The flight delay cost
Flight delays can give rise to increased expenditure in terms of resource maintenance, airport maintenance, and a reduction in the credibility of airlines. Moreover, flight delays have the potential to lead to the loss of future passengers, representing a latent cost. Within the realm of civil aviation transportation, irregular flights have the potential to diminish passenger satisfaction. Excessively prolonged flight durations are likely to result in the loss of passengers, thus incurring costs associated with flight cancellations. The method for calculating airline delay costs is outlined as follows:
- 3.
- The flight cancellation cost
Flight cancellations result in the forfeiture of anticipated revenue and the abandonment of allocated resources, thereby inflicting financial losses upon the airline. Additionally, airline reputation damage arising from flight cancellations constitutes an intangible, yet significant, loss that cannot be overlooked. The method for computing flight cancellation costs is as follows:
- 4.
- Passenger Transfer Perceived Value
Passenger perceived value pertains to the extent of time passengers are willing to wait during the transfer process. In this context, passengers have a predefined maximum acceptable waiting duration. Using this maximum acceptable duration as the benchmark, if the actual waiting time exceeds this benchmark, it will result in increased route costs. Conversely, if the actual waiting time is less than this benchmark, the route operation will not incur additional costs.
Following the value function principles of prospect theory [29], the aforementioned absolute time index is transformed into a passenger-based waiting perception. Equation (12) provides a piecewise function to represent this value function.
The perceived value function considering passengers’ waiting psychology is obtained as follows:
- 5.
- Carbon emissions costs
The carbon emission cost entails the computation of carbon emissions throughout each stage of the flight’s operational life cycle [30]. The complete operational cycle of an aircraft, commencing from the removal of wheel chocks at the departure airport to the application of wheel chocks at the destination airport, is regarded as a singular operational cycle. This cycle can be segmented into nine phases: taxi-out, takeoff, climb, ascent, cruise, descent, approach, landing, and taxi-in. According to the carbon emission computation formula introduced by the International Civil Aviation Organization (ICAO) [31,32], the carbon emissions for one takeoff and landing cycle are roughly equivalent to the summation of emissions during the landing and takeoff (LTO) phase, as well as the climb, cruise, and descent (CCD) phase. Based on the operational parameters and computation formulas for the LTO and CCD phases, the emissions for each phase are calculated independently and subsequently aggregated to derive the total carbon emissions for the entire flight segment. The computation formulas for the LTO and CCD phases are presented as Equations (14) and (15).
By summing the carbon emissions from both the and phases, Equation (16) obtains the total carbon emissions of the aircraft during a complete takeoff and landing cycle.
2.2.3. Data Collection
The data we need to input and the meanings are shown in Table 2:
3. Space–Time Network Construction
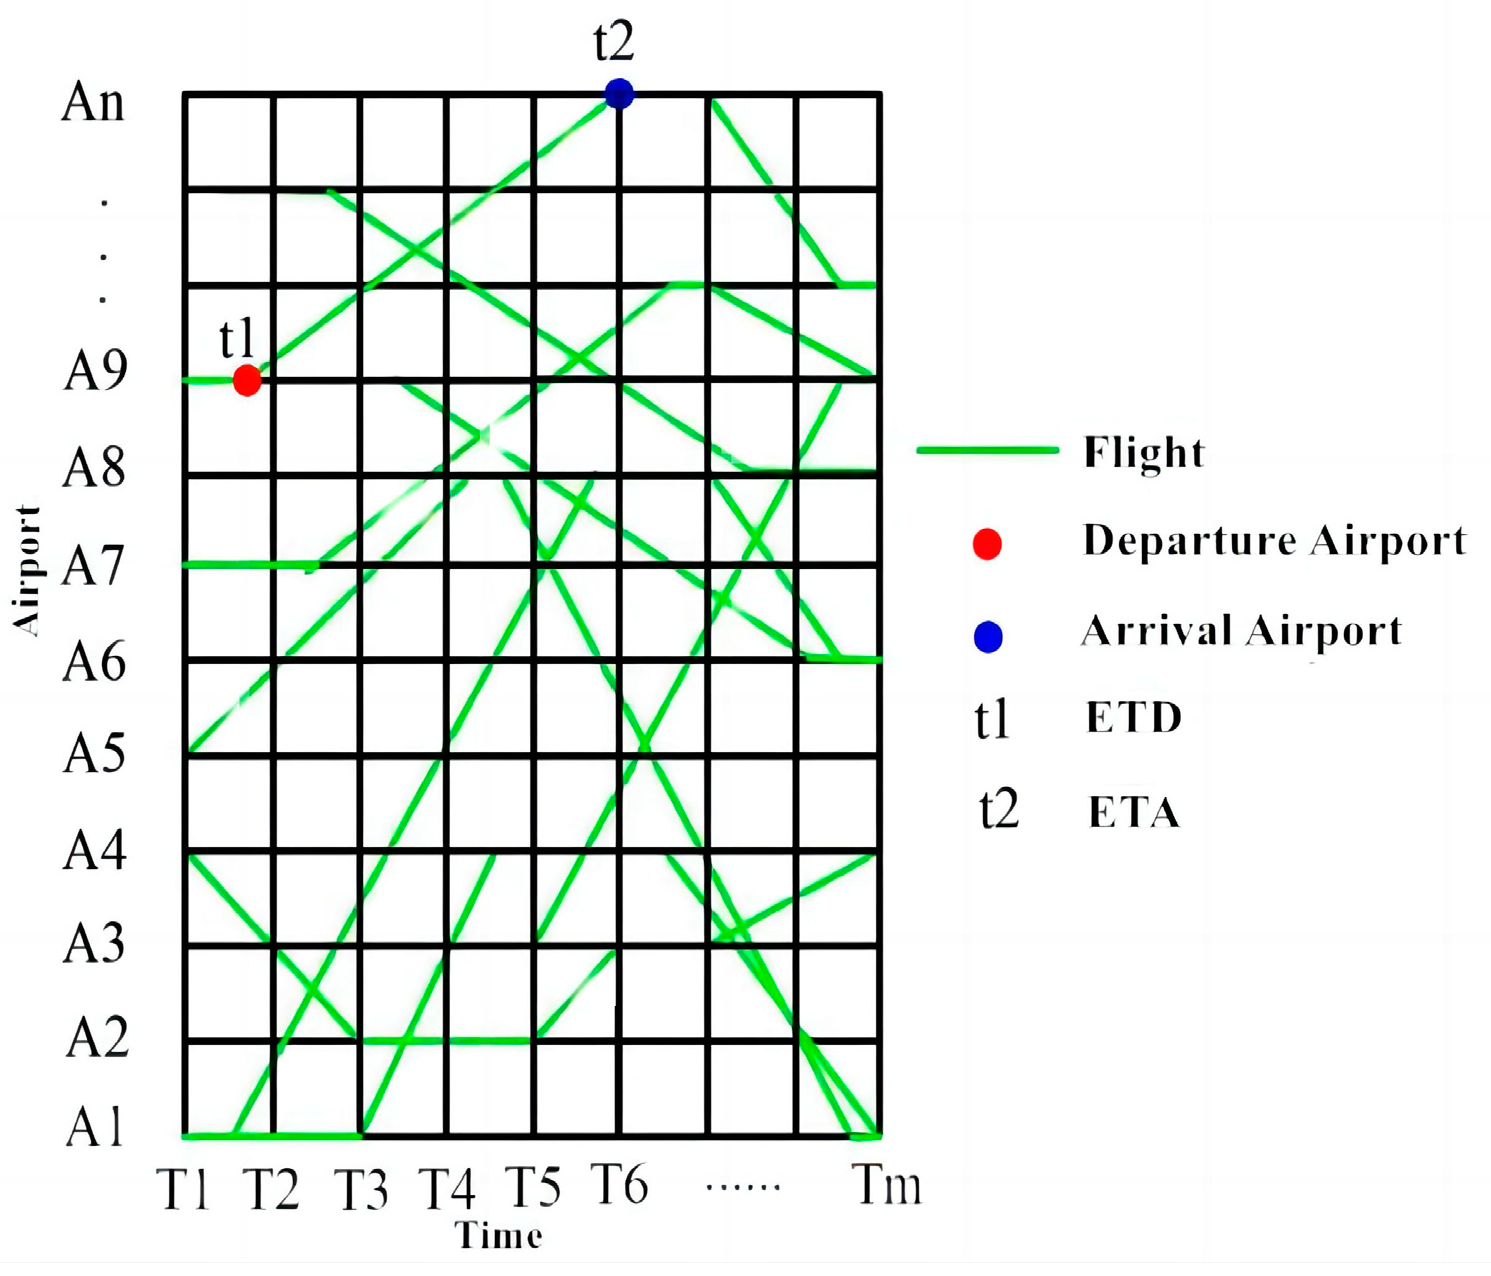
The space–time network model is an approach that involves the transformation of the problem into a network graph based on both time and space parameters, followed by the utilization of this network graph for the development of mathematical expressions. The space–time network diagram manifests as a two-dimensional plane network, comprising nodes and network edges. In Figure 1 and Table 3, you can observe a flight space–time network along with the construction algorithm. Nodes denoted as (, ) are determined by the spatial coordinates on the vertical axis and time coordinates on the horizontal axis. The spatial coordinates correspond to all airports involved in the flight plan, while the time on the horizontal axis is sequentially arranged from left to right, with an appropriate time interval determined by practical operational considerations. The arcs originating from the nodes signify individual flights. These arcs extend towards the subsequent nodes, symbolizing the arrival of the aircraft at the destination airport within the anticipated time frame. The linkage connecting the two nodes represents the network edge.
In comparison to the multi-commodity flow model and resource allocation model, the space–time network model provides comprehensive consideration of the temporal and spatial attributes of flight routes. It facilitates the direct determination of departure and arrival times for flights through the space–time network diagram. By merging the construction of the space–time network diagram with the mathematical model, the aircraft route is discretized into specific intervals. Consequently, within each of these time intervals, the node activities are interconnected. This network connectivity illustration simplifies the mathematical modeling challenge and enables the computation of delay costs associated with relevant flights.
4. Case Study
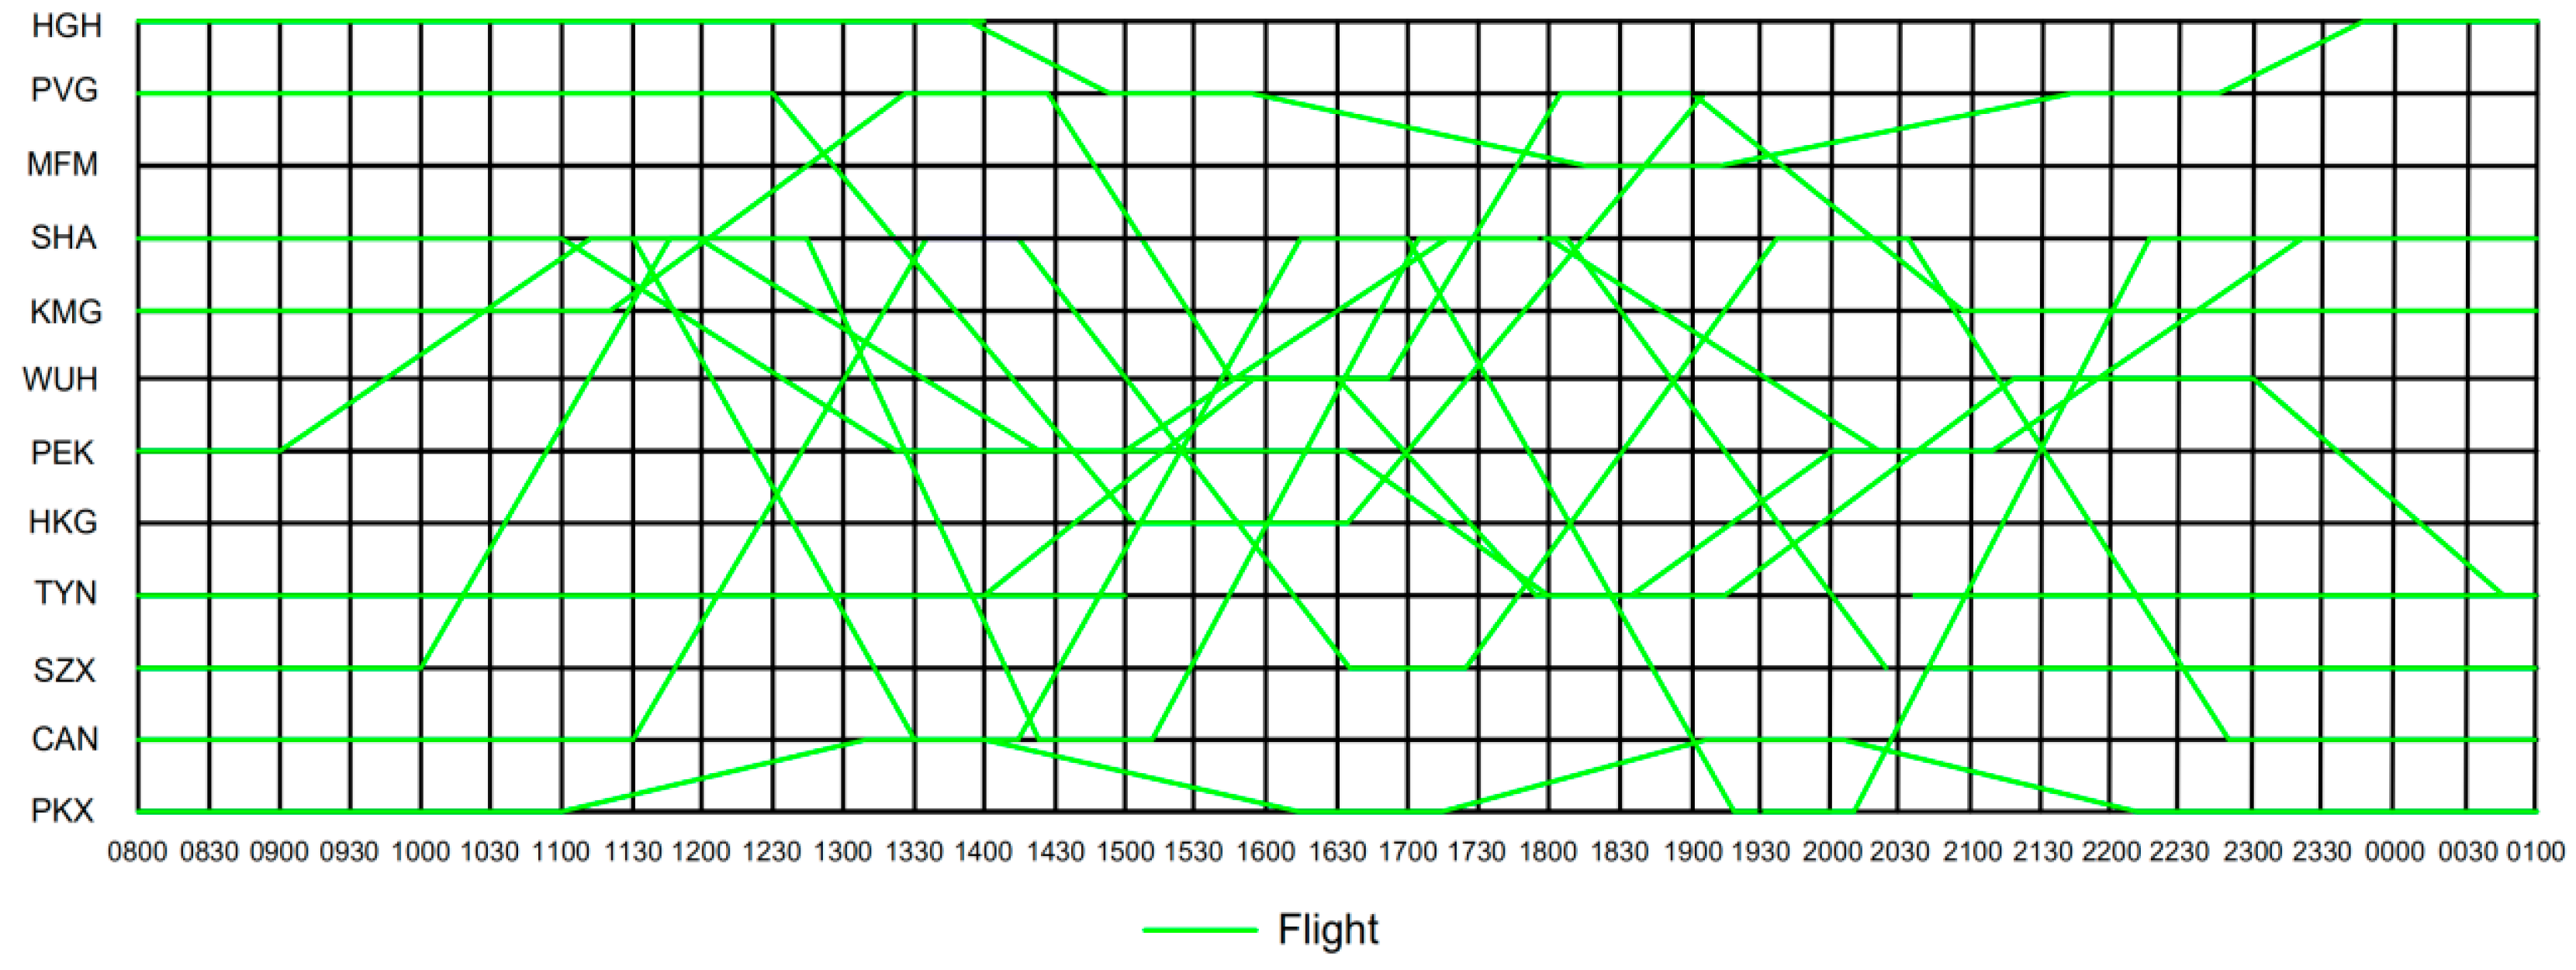
In this study, we chose to analyze flight operations involving ten aircraft in China during the COVID-19 period as a representative example for validation. Our analysis covered pandemic data from 25 January to 25 February 2020, within China. The dataset comprises 10 flight routes, encompassing a total of 38 flights. These routes connect various airports, including major hub airports and domestic trunk airports, located in cities ranging from tourist destinations to first- and second-tier urban centers.
Due to the necessity of establishing specific time intervals between flights during the pandemic, the majority of the flights are direct or air–rail combined transport, with minimal layovers. Additionally, all flights operate using B737 aircraft to ensure passengers can maintain physical distance. Therefore, in this context, the perceived price cost of passenger transfers and carbon emissions costs tends toward zero. For reference, we have included the standard flight schedule and company-designed data under normal circumstances in Appendix B.
The creation of the space–time network is depicted in Figure 2. In a typical flight schedule, the minimum connection time (MCT) between each flight is set to 40 min. The airport curfew is uniformly set at midnight (24:00 h; the flights scheduled between 24:00 and 1:00 adhere to the operational constraints defined by the curfew), and any flight delay is assumed to incur a cost of RMB 30 per minute. Delays and cancellations may lead to a tourist churn rate of 0.3. At the same time, it is defined that each infection pressure will lead to a pressure cost of RMB 1. In actual civil aviation operations, flights often feature various seat classes with different pricing. For simplicity, we assume uniform pricing for all seats. The discrete time interval for the space–time network is set at one hour.
4.1. Infection Pressure
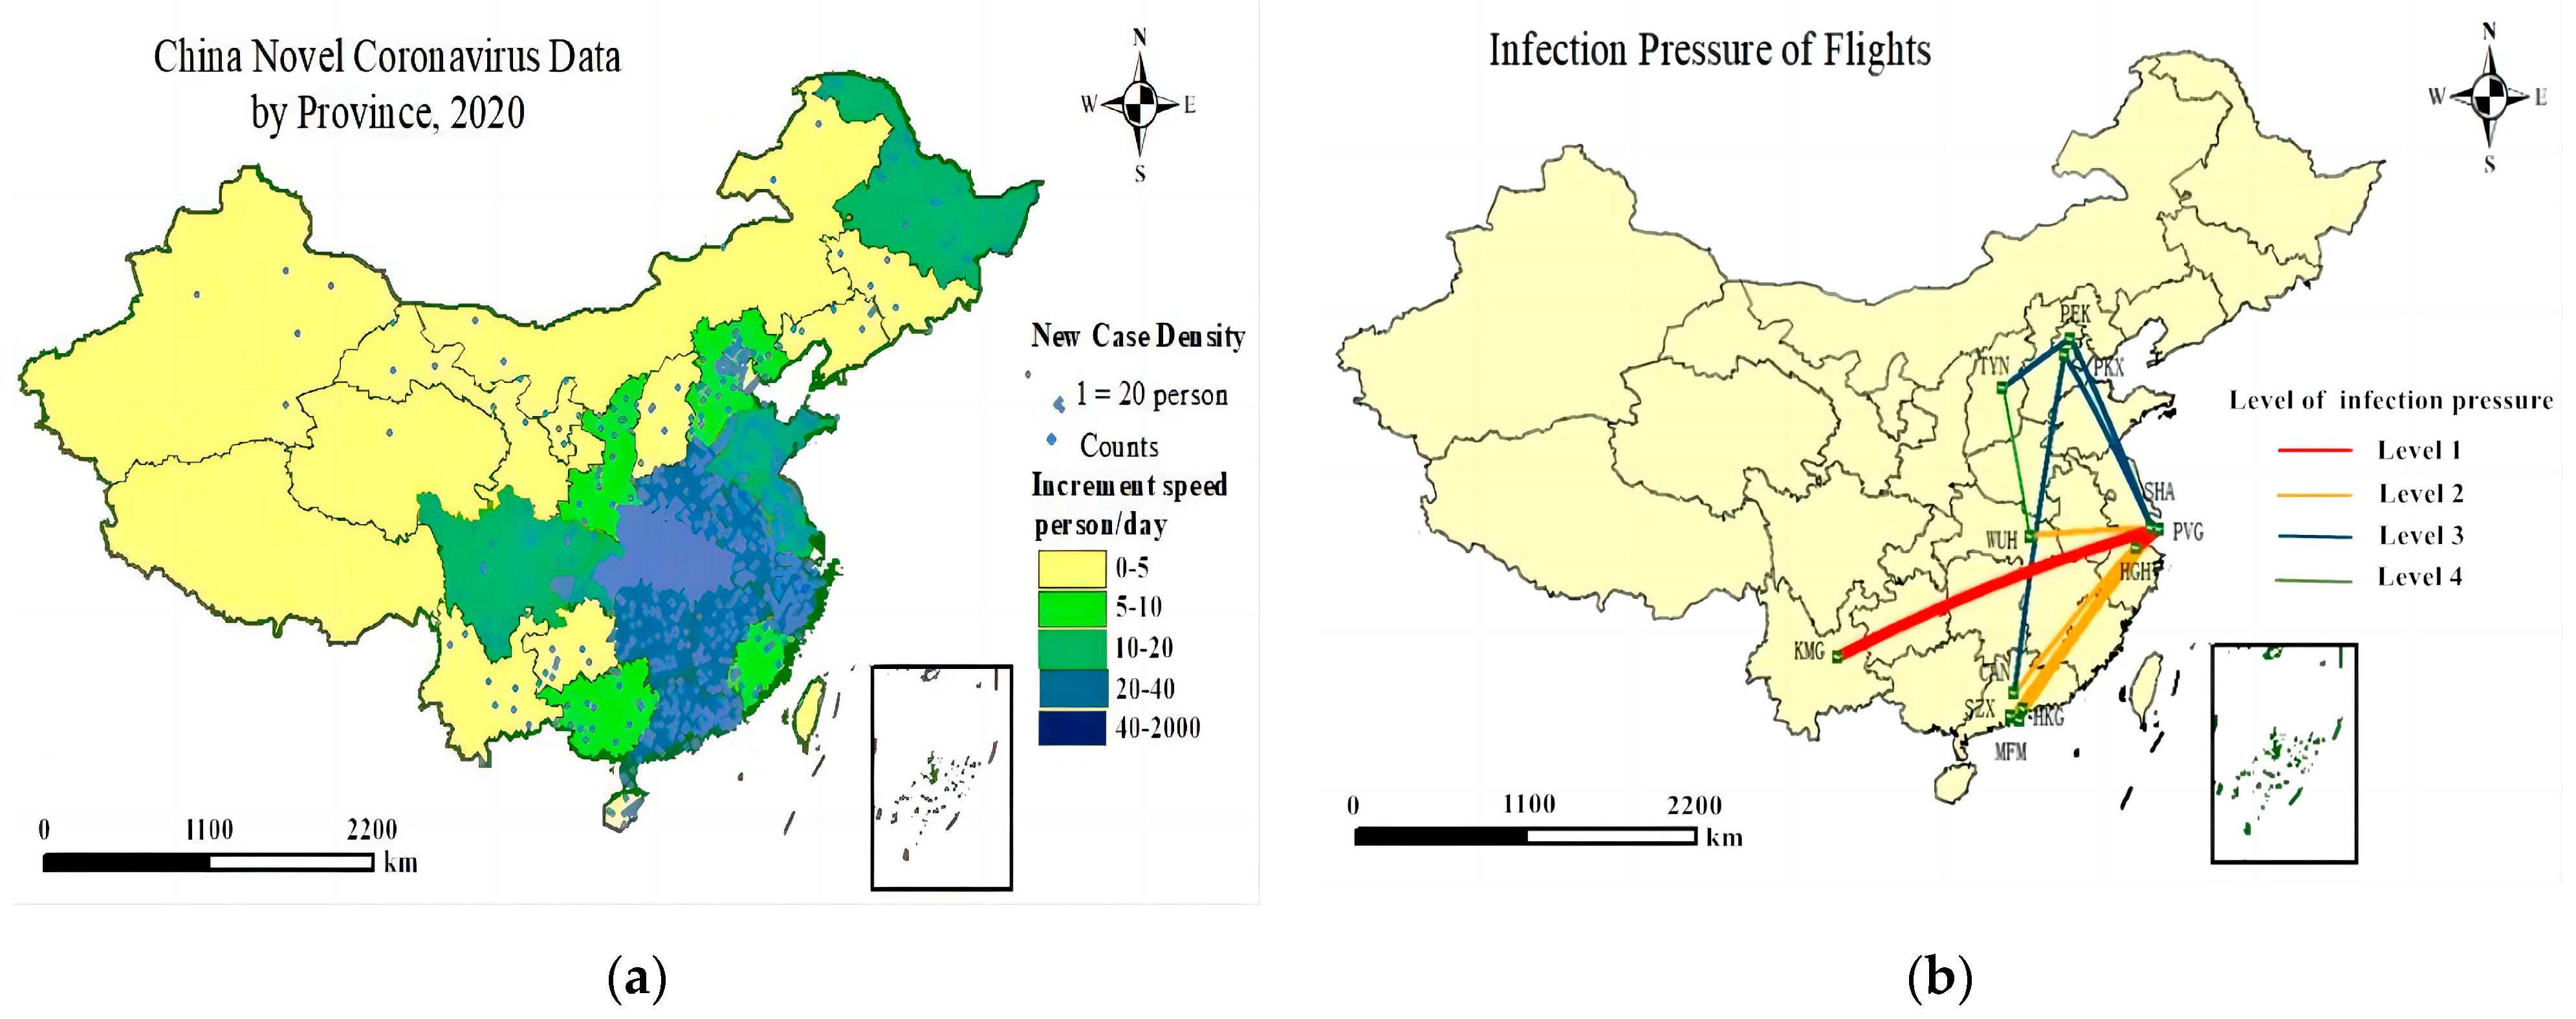
Based on statistics provided by the National Health Committee of the People’s Republic of China, spanning the period from 26 January 2020 to 26 February 2020, the daily growth of the national pandemic is illustrated in Figure 3a. The flight network established based on exhibits robust connectivity, connecting hub airports with large regions of the country as well as facilitating connections between other urban areas.
By employing Equations (7) and (8) in conjunction with the reported case growth data for each city, we have calculated the potential infection pressure of each airport, as outlined in Table 4. Subsequently, we obtained the infection pressure values for each flight route, as depicted in Figure 3b.
Figure 3a underscores a conspicuous escalation in pandemic incidences, predominantly concentrated in Wuhan, attaining its zenith with a daily surge of 2000 cases. The simultaneous scrutiny of infection pressure, delineated in Figure 3b, unveils that the trajectory affiliated with Wuhan, notwithstanding its heightened epidemic growth rate, manifests a diminished infection pressure relative to alternative pathways. Significantly, Wuhan airport manifests the most conservative pressure transmission index, quantified at 31.57 (shown as Table 4). These discernments collectively attest to an elevated cognizance and efficacious implementation of preventive measures within the realm of air passenger transport in Wuhan. Furthermore, they underscore the adept stewardship of both flight operations and the localized pandemic milieu by Wuhan.
4.2. Results
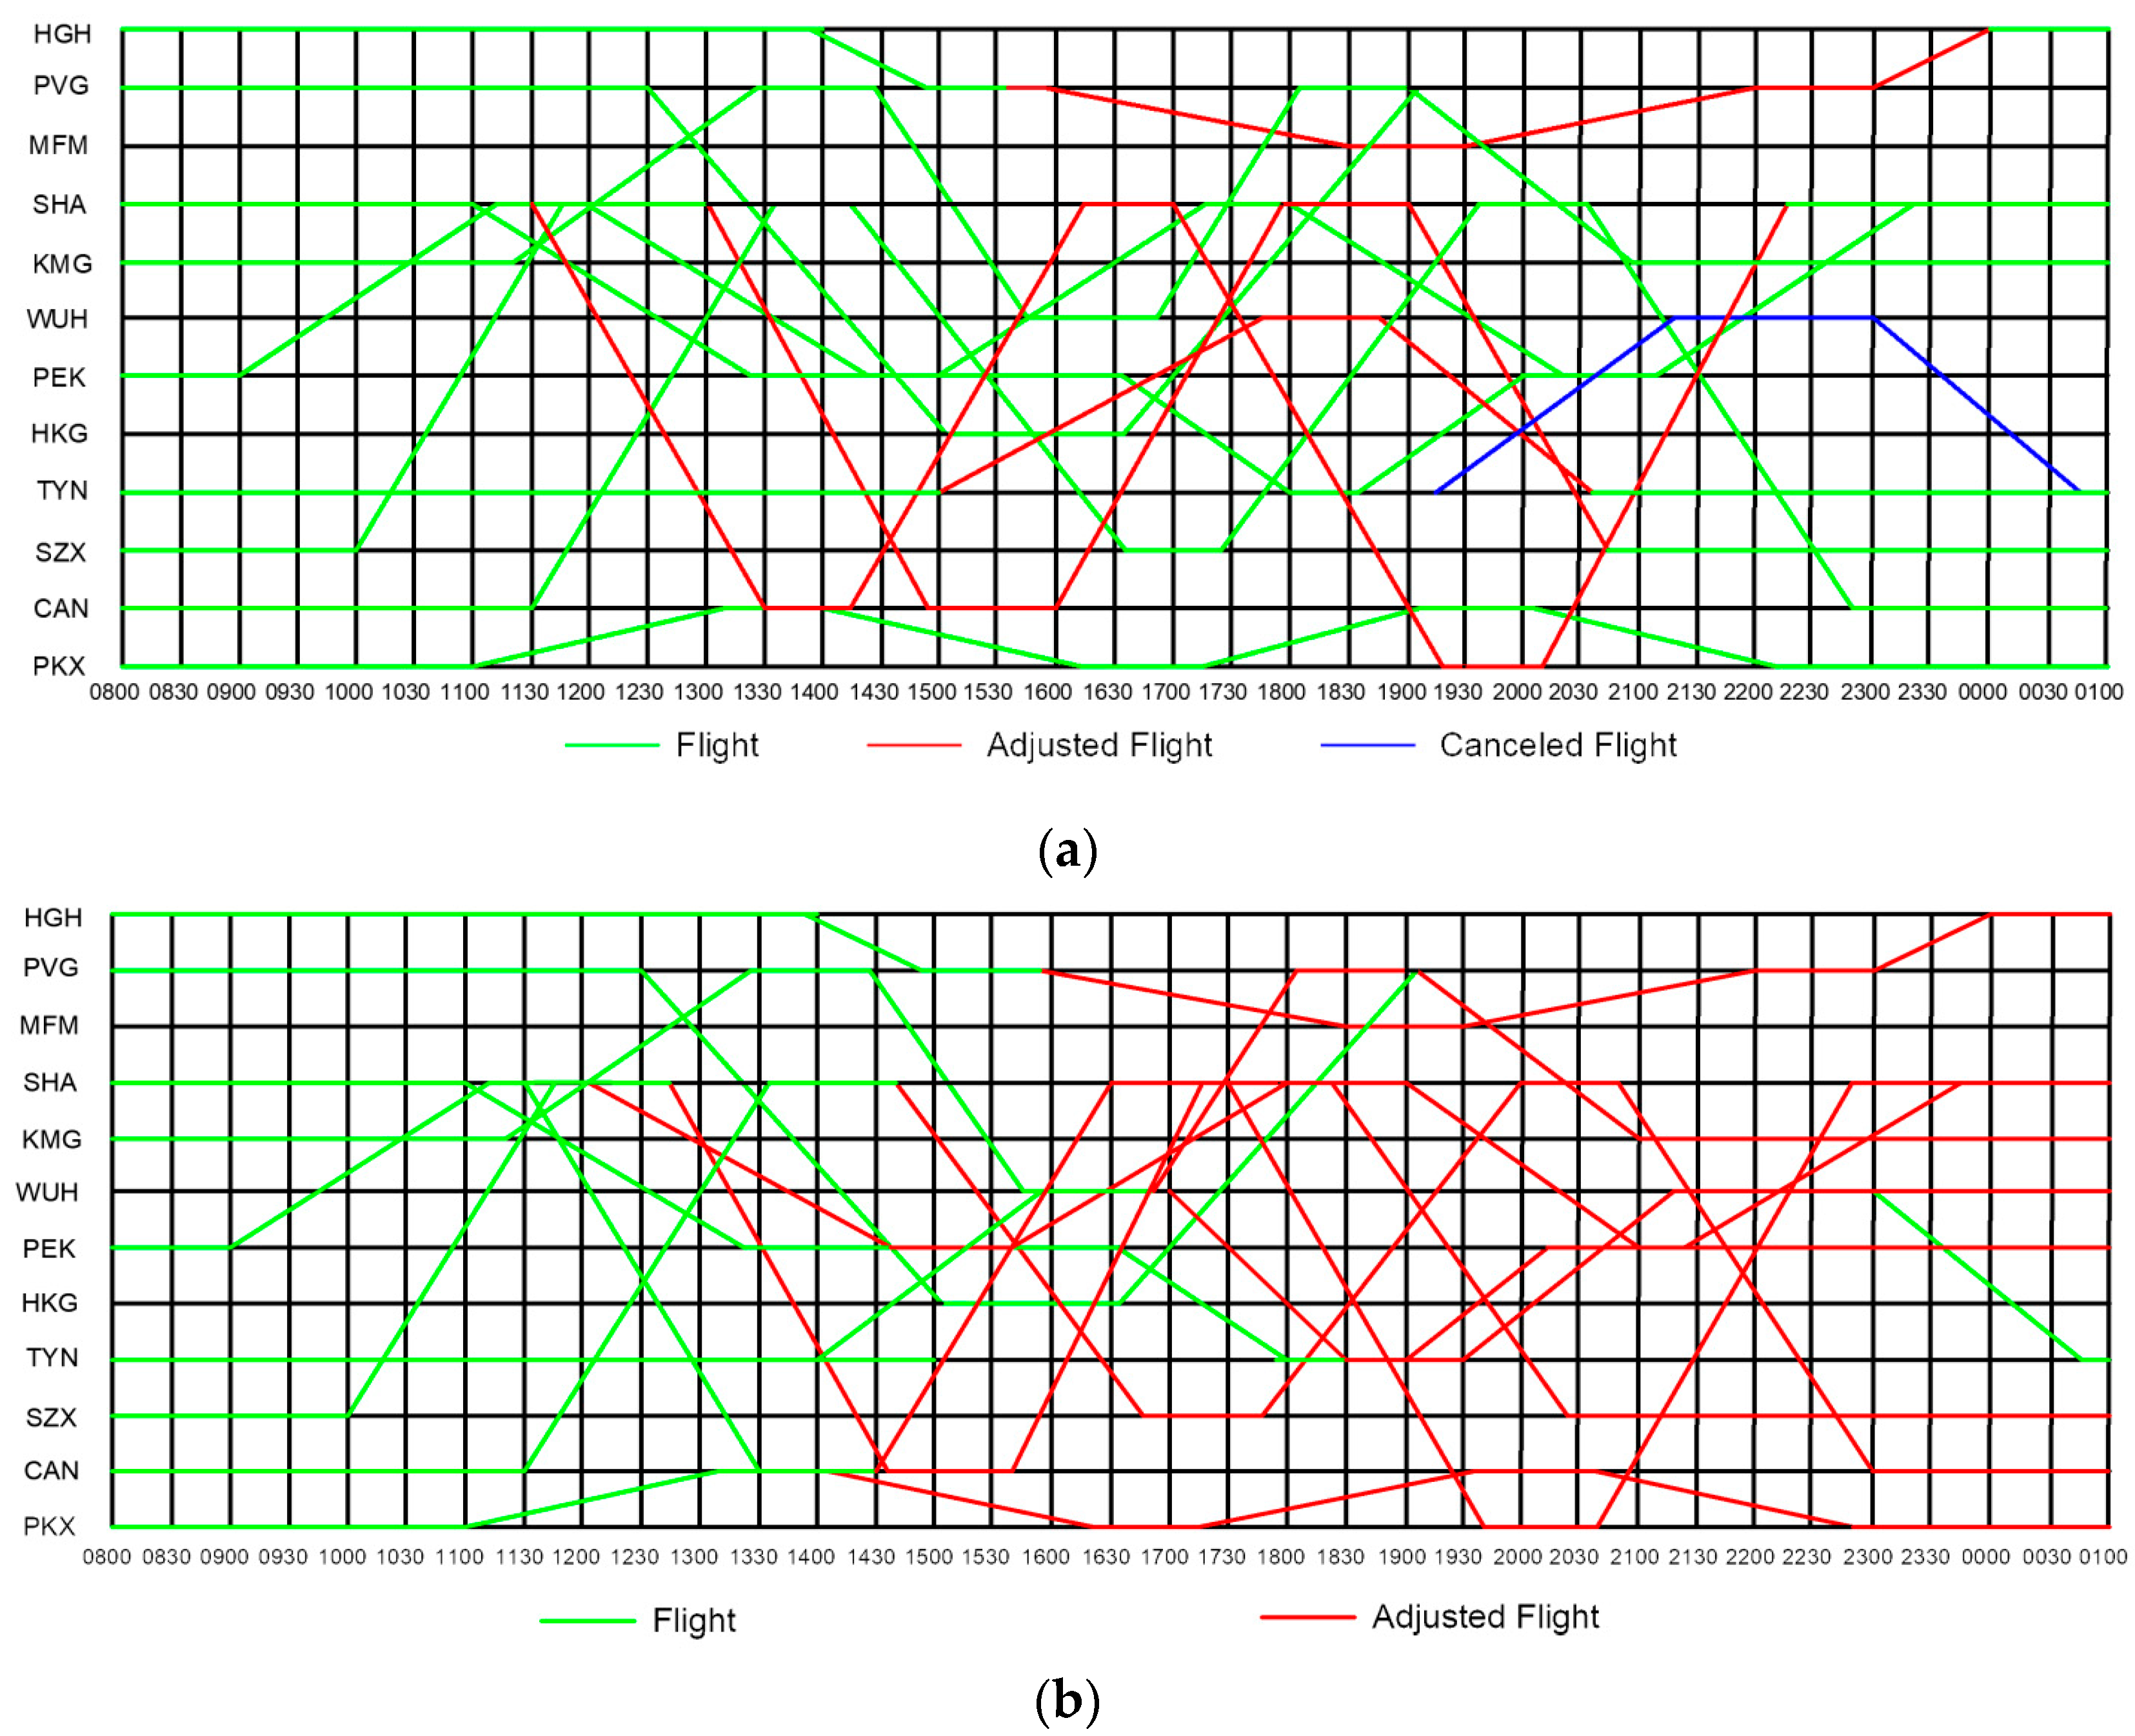
As a consequence of the pandemic, WUH airport introduced specific operational constraints, permitting flight operations only between 15:00 and 24:00, primarily serving specific travel requirements to and from Wuhan. Consequently, this study employed a flight scheduling model to compare the traditional flight operation plan with the new operational network, as depicted in Figure 4. Notably, the traditional approach to flight adjustments did not account for infection pressure and largely adhered to airport operational constraints, resulting in minimal scheduling changes and cancellations.
Utilizing the data presented in Figure 4 and Table 5, the new flight operation plan effectively reduced the infection pressure by 56,131.55. It is essential to highlight that while direct flight cancellations may mitigate the pressure on infection spread within the airport, such cancellations entail significant costs for airlines, rendering them a less favorable approach. In contrast, the traditional plan resulted in an infection pressure of 26,139.02. Additionally, examining the final results, the cost incurred by the airlines was determined to be RMB 70,981.55. In stark contrast, the new plan contributed to cost savings totaling RMB 167,082.47.
The outcomes underscore the efficacy of formulating a minimum cost model. They affirm that the implementation algorithm is instrumental in optimizing flight schedules and devising corresponding recovery programs. Notably, specific flight numbers, including 11, 21, 22, 31, 32, 41, 42, 51, 61, 71, 72, 81, 91, and 101, remained unaffected, with no cancellations. Consequently, the results validate the correctness of the model’s construction and the applicability of the discrete space–time network approach.
4.3. Discussion
This study revolves around the profound impact of the COVID-19 pandemic on the aviation sector in China, with a specific focus on flight operations and scheduling. The analysis of the daily growth of the national pandemic, depicted in Figure 3a, highlighted Wuhan as a hotspot with the most substantial increase in cases. However, our calculations of route-specific infection pressure, as shown in Figure 3b, surprisingly revealed that routes connected to Wuhan experienced lower infection pressure compared to other routes. This suggests a commendable level of awareness and effective control measures implemented at Wuhan airport, showcasing its proactive response to the health crisis.
In response to the pandemic, our study proposed a novel flight scheduling model, considering infection pressure, operational constraints, and economic factors. The results, as depicted in Figure 4, demonstrated a remarkable 53.4% reduction in infection pressure compared to traditional plans, validating the effectiveness of the new approach. Importantly, the model’s consideration of infection pressure, rather than resorting to direct flight cancellations, led to substantial cost savings for airlines—a key factor in the economic recovery of the aviation industry.
The cost analysis revealed a noteworthy 70% reduction in costs under the new plan, amounting to RMB 70,981.55, compared to the traditional method. This underscores the significance of formulating a minimum cost model that not only addresses health concerns but also proves economically advantageous for airlines. The unaffected specific flight numbers validated the robustness of our model’s construction and the applicability of the discrete space–time network approach, offering airlines a reliable framework for optimizing flight schedules during challenging periods marked by pandemic-induced disruptions.
In conclusion, our study provides valuable insights into the proactive strategies and adaptable models required for the aviation industry to navigate the complex landscape of pandemics. The findings underscore the importance of a holistic approach that balances health considerations, operational constraints, and economic factors to optimize flight schedules effectively during unprecedented challenges.
5. Conclusions
This paper addresses the challenges posed by infectious outbreaks within the context of flight scheduling. It comprehensively takes into account the spatial and temporal attributes of flights, operational environments, and the specific characteristics of pandemic transmission in airport cities. The contributions of this paper are as follows:
- This paper developed a mathematical model with the objectives of minimizing costs and reducing pandemic transmission. It leveraged real-time flight information to construct a discrete space–time network for managing irregular flights. An algorithm was devised to optimize the rescheduling of these irregular flights by utilizing the network. The algorithm effectively generated a set of viable flight recovery paths. Empirical testing confirmed the practicality and effectiveness of the model and algorithm.
- The case study shows that if stringent preventive and control measures are diligently implemented and prioritized in regions severely affected by a pandemic, the transmission pressure exerted by air travel within these areas may not exceed, and in some cases may even be lower than, that observed in less severely affected regions.
- Furthermore, when flights are scheduled with safe time intervals during a pandemic, it is more cost-effective to adjust flight delay times to prevent temporary airport closures than to cancel flights. This approach results in greater cost savings, even if it involves adjusting a larger number of flights compared to the alternative of canceling them.
The rescheduling problem is a real-time network optimization challenge, requiring rapid decision making, particularly during a pandemic. It ensures that airlines can promptly communicate with their crew and airports when dealing with irregular flights. Simultaneously, it allows for timely adjustments and responses to passengers. The next step involves the pursuit of a more efficient optimization algorithm to enhance the time model associated with this problem-solving algorithm.
Author Contributions
Conceptualization, Y.Y., Y.W., X.J. and C.S.L.; methodology, Y.Y.; software, Y.Y.; validation, Y.Y., Y.W., X.J. and C.S.L.; formal analysis, Y.Y., investigation, Y.Y.; resources, Y.Y.; data curation, Y.Y.; writing—original draft preparation, Y.Y., Y.W., X.J. and C.S.L.; writing—review and editing, Y.Y., Y.W., X.J. and C.S.L.; visualization, Y.Y.; supervision, X.J. and C.S.L.; project administration, X.J. and C.S.L.; funding acquisition, Y.W., X.J. and C.S.L. All authors have read and agreed to the published version of the manuscript.
Funding
This work was supported by the Funds of the National Natural Science Foundation of China (62206062, U2034208 and 2022YFC3002502) and China Railway P2023X012.
Institutional Review Board Statement
Not applicable.
Informed Consent Statement
Not applicable.
Data Availability Statement
The data presented in this study are available in Appendix A.
Acknowledgments
The authors would like to thank the anonymous reviewers for their insightful and constructive comments.
Conflicts of Interest
The authors declare no conflicts of interest.
Appendix A
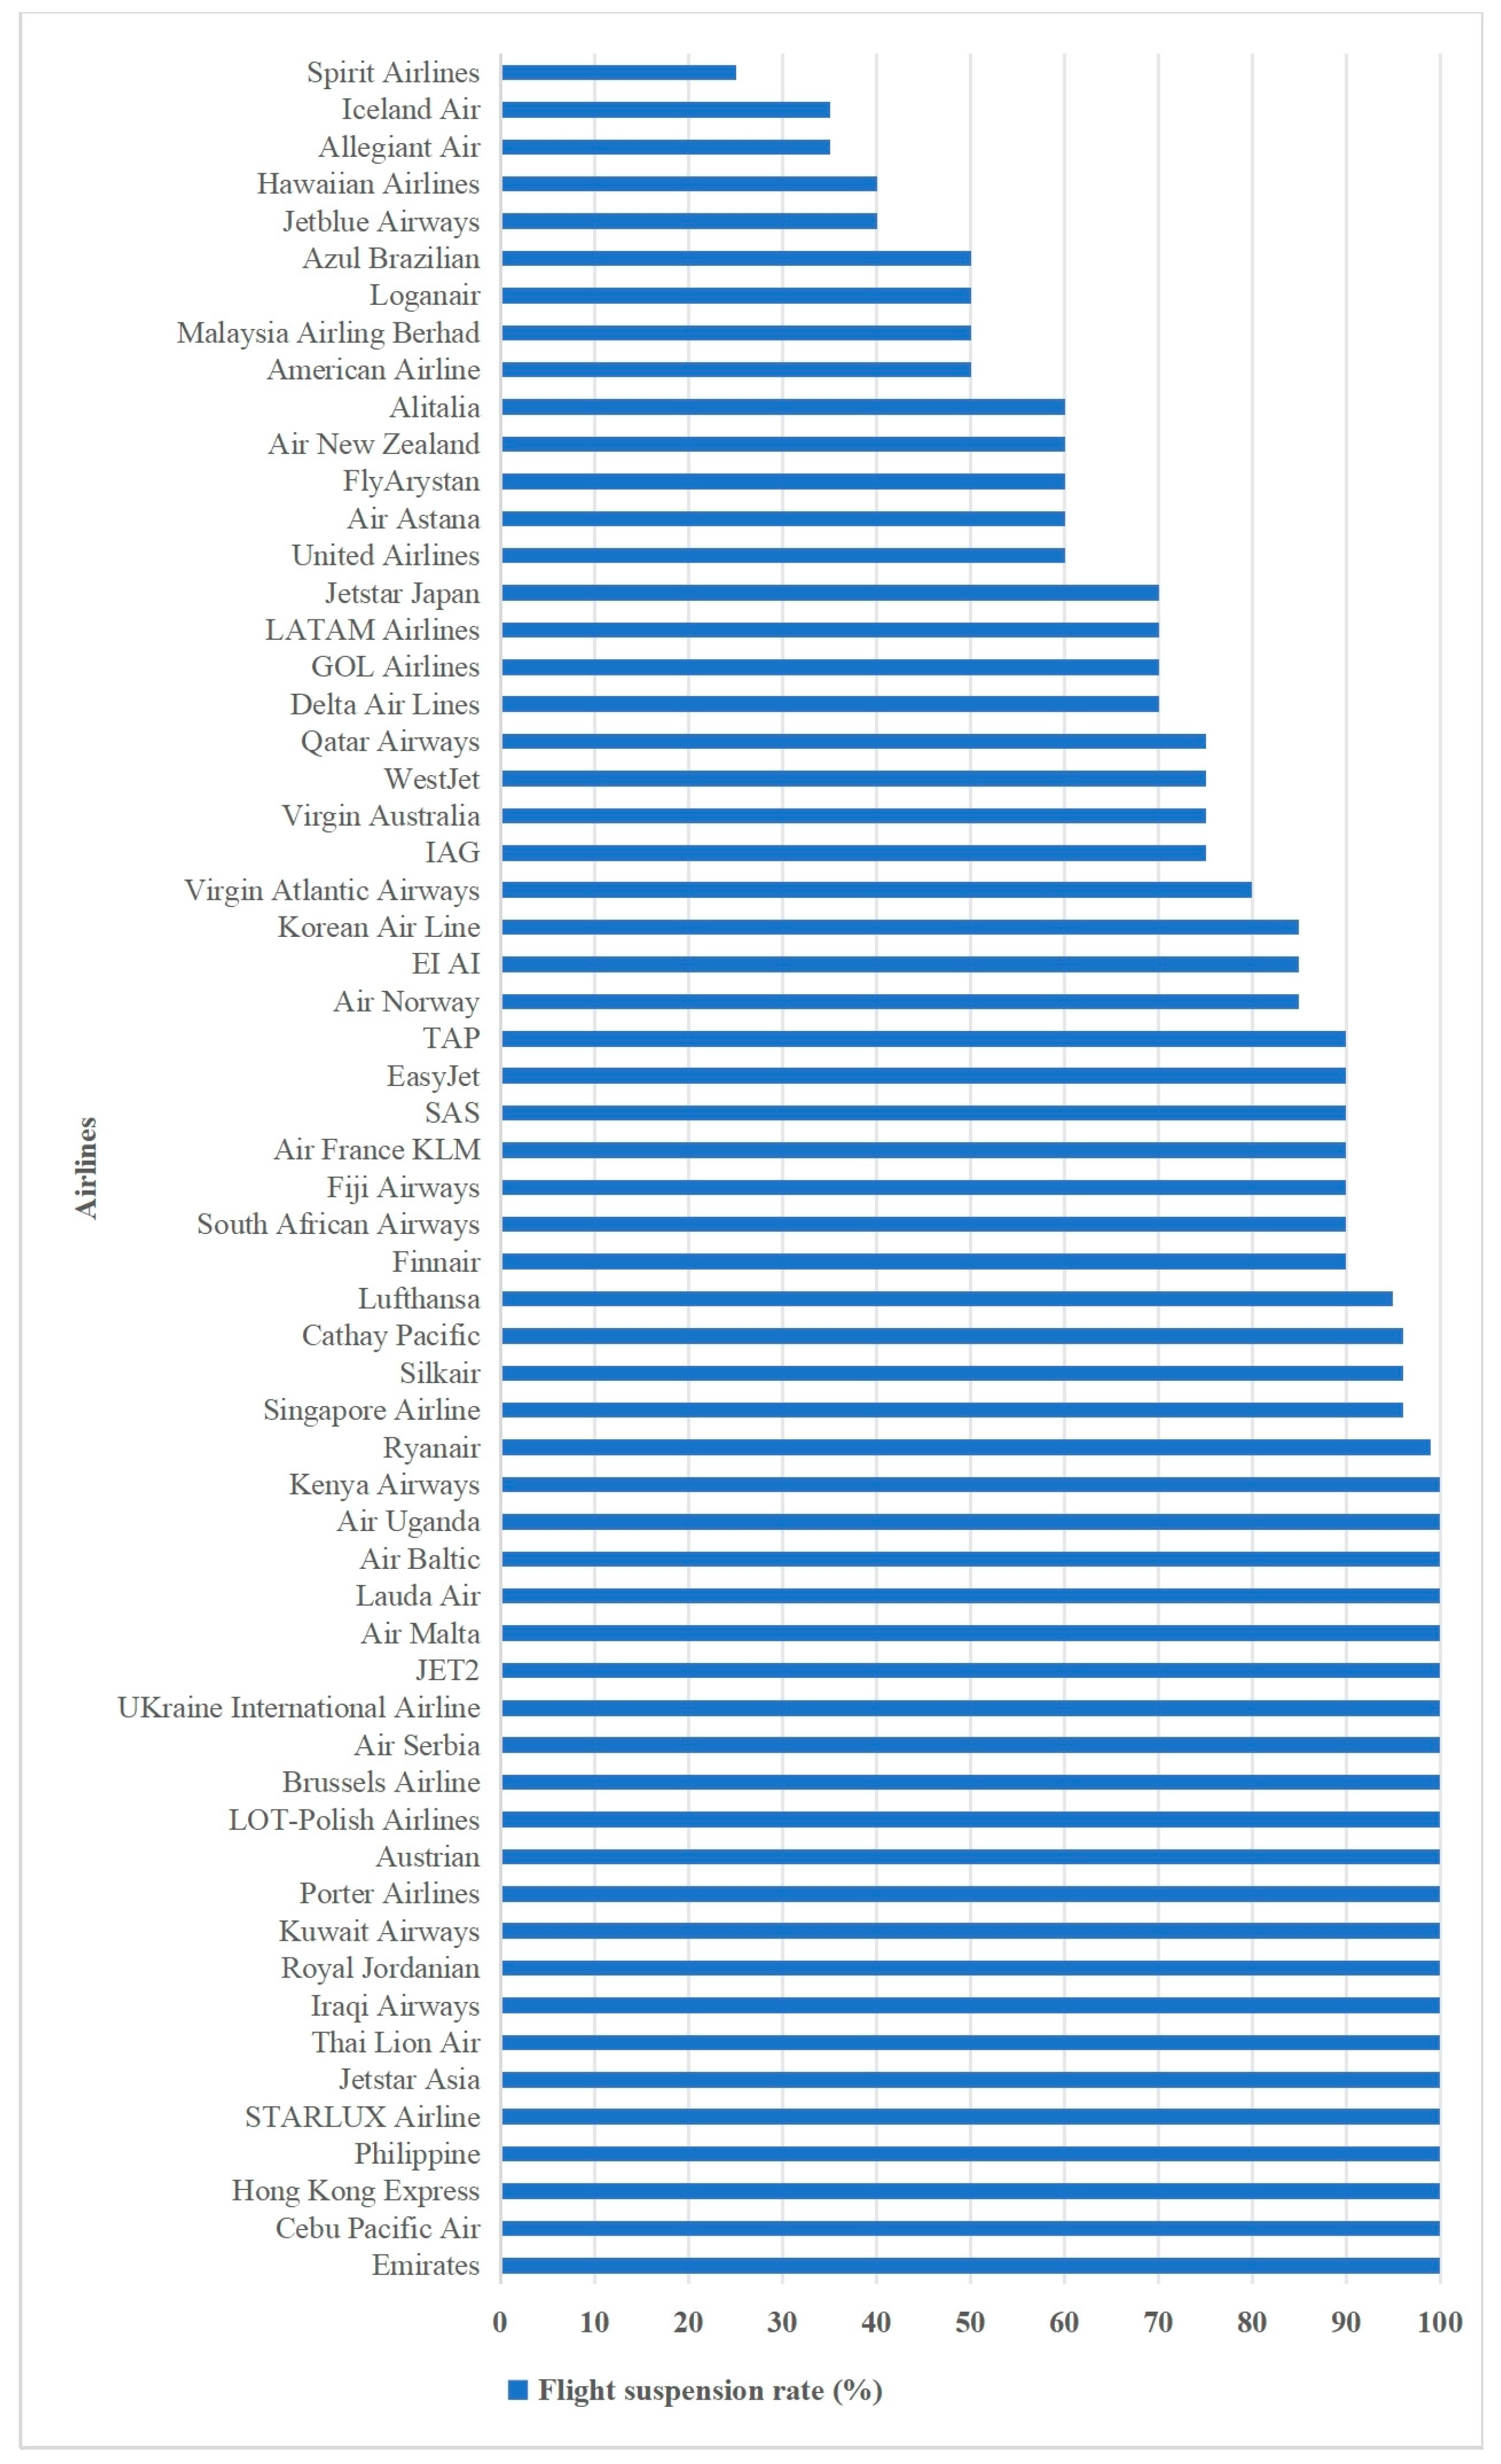
Figure A1.
The flight suspension rate of global airlines due to COVID-19 as of 23 March 2020. Data from https://www.statista.com/statistics/1111989/flights-cancelled-airlines-worldwide-covid-19/ (Access date: 28 December 2023).
Figure A1.
The flight suspension rate of global airlines due to COVID-19 as of 23 March 2020. Data from https://www.statista.com/statistics/1111989/flights-cancelled-airlines-worldwide-covid-19/ (Access date: 28 December 2023).

Appendix B

Table A1.
The flight schedule and data of airlines.
| Airport No. | Airport ID | Flight No. | Flight ID | Depart. | ETD | Arrival | ETA | Ticket/RMB | Passenger No. |
|---|---|---|---|---|---|---|---|---|---|
| 2153 | 1 | F828 | f11 | HGH | 1350 | PVG | 1450 | 709 | 241 |
| 2153 | 1 | F807 | f12 | PVG | 1540 | MFM | 1820 | 1081 | 241 |
| 2153 | 1 | F808 | f13 | MFM | 1910 | PVG | 2140 | 1013 | 241 |
| 2153 | 1 | F819 | f14 | PVG | 2240 | HGH | 2340 | 8269 | 241 |
| 2167 | 2 | F9182 | f21 | KMG | 1120 | PVG | 1325 | 683 | 127 |
| 2167 | 2 | F829 | f22 | PVG | 1425 | WUH | 1545 | 437 | 127 |
| 2167 | 2 | F830 | f23 | WUH | 1640 | PVG | 1810 | 492 | 127 |
| 2167 | 2 | F9449 | f24 | PVG | 1900 | KMG | 2050 | 711 | 127 |
| 2500 | 3 | F845 | f31 | PVG | 1230 | HKG | 1510 | 916 | 226 |
| 2500 | 3 | F846 | f32 | HKG | 1635 | PVG | 1910 | 888 | 226 |
| 2580 | 4 | F5107 | f41 | SHA | 1100 | PEK | 1320 | 1122 | 241 |
| 2580 | 4 | F5294 | f42 | PEK | 1635 | TYN | 1800 | 584 | 226 |
| 2580 | 4 | F5299 | f43 | TYN | 1835 | PEK | 2000 | 584 | 226 |
| 2580 | 4 | F5128 | f44 | PEK | 2105 | SHA | 2320 | 1100 | 241 |
| 2587 | 5 | F5166 | f51 | PEK | 900 | SHA | 1115 | 1122 | 241 |
| 2587 | 5 | F5109 | f52 | SHA | 1200 | PEK | 1425 | 1055 | 241 |
| 2587 | 5 | F5104 | f53 | PEK | 1500 | SHA | 1720 | 1493 | 241 |
| 2587 | 5 | F5128 | f54 | SHA | 1800 | PEK | 2025 | 1124 | 241 |
| 2588 | 6 | F2437 | f61 | TYN | 1400 | WUH | 1555 | 1047 | 127 |
| 2588 | 6 | F5400 | f62 | WUH | 1615 | TYN | 1750 | 656 | 127 |
| 2588 | 6 | F4112 | f63 | TYN | 1924 | WUH | 2120 | 518 | 127 |
| 2588 | 6 | F2438 | f64 | WUH | 2300 | TYN | 2440 | 1047 | 127 |
| 2145 | 7 | F2324 | f71 | SZX | 1000 | SHA | 1145 | 468 | 127 |
| 2145 | 7 | F2567 | f72 | SHA | 1235 | CAN | 1425 | 1049 | 127 |
| 2145 | 7 | F7788 | f73 | CAN | 1515 | SHA | 1705 | 794 | 127 |
| 2145 | 7 | F1324 | f74 | SHA | 1805 | SZX | 1950 | 468 | 127 |
| 2137 | 8 | F2476 | f81 | CAN | 1130 | SHA | 1335 | 434 | 241 |
| 2137 | 8 | F2019 | f82 | SHA | 1425 | SZX | 1635 | 352 | 241 |
| 2137 | 8 | F2020 | f83 | SZX | 1725 | SHA | 1935 | 352 | 241 |
| 2137 | 8 | F1284 | f84 | SHA | 2035 | CAN | 2240 | 434 | 241 |
| 2141 | 9 | F1105 | f91 | PKX | 1100 | CAN | 1310 | 359 | 226 |
| 2141 | 9 | F1385 | f92 | CAN | 1400 | PKX | 1615 | 536 | 226 |
| 2141 | 9 | F1107 | f93 | PKX | 1705 | CAN | 1915 | 492 | 226 |
| 2141 | 9 | F3231 | f94 | CAN | 2005 | PKX | 2215 | 462 | 226 |
| 2189 | 10 | F3234 | f101 | SHA | 1130 | CAN | 1330 | 476 | 241 |
| 2189 | 10 | F3432 | f102 | CAN | 1420 | SHA | 1625 | 625 | 241 |
| 2189 | 10 | F5432 | f103 | SHA | 1715 | PKX | 1920 | 497 | 241 |
| 2189 | 10 | F4321 | f104 | PKX | 2010 | SHA | 2225 | 417 | 241 |
References
- Duarte, C.C.; Cortiços, N.D. The Energy Efficiency Post-COVID-19 in China’s Office Buildings. Clean Technol. 2022, 4, 174–233. [Google Scholar] [CrossRef]
- Mack, E.A.; Agrawal, S.; Wang, S. The impacts of the COVID-19 pandemic on transportation employment: A comparative analysis. Transp. Res. Interdiscip. Perspect. 2021, 12, 100470. [Google Scholar] [CrossRef]
- Lai, C.S.; Jia, Y.; Dong, Z.; Wang, D.; Tao, Y.; Lai, Q.H.; Wong, R.T.K.; Zobaa, A.F.; Wu, R.; Lai, L.L. A Review of Technical Standards for Smart Cities. Clean Technol. 2020, 2, 290–310. [Google Scholar] [CrossRef]
- IATA. COVID-19 Updated Impact Assessment. 2020. Available online: https://www.iata.org/en/iata-repository/publications/economic-reports/third-impact-assessment/ (accessed on 28 December 2023).
- Du, W.B.; Zhang, M.Y.; Zhang, Y.; Cao, X.B.; Zhang, J. Delay causality network in air transport systems. Transp. Res. Part E Logist. Transp. Rev. 2018, 118, 466–476. [Google Scholar] [CrossRef]
- Wei, G.; Yu, G.; Song, M. Optimization model and algorithm for crew management during airline irregular operations. J. Comb. Optim. 1997, 1, 305–321. [Google Scholar] [CrossRef]
- Zellweger, A.G.; Donohue, G.L. Effects of Schedule Disruptions on the Economics of Airline Operations. In Air Transportation Systems Engineering; American Institute of Aeronautics and Astronautics, Inc.: Reston, VA, USA, 2015. [Google Scholar]
- Kohl, N.; Larsen, A.; Larsen, J.; Ross, A.; Tiourine, S. Airline disruption management—Perspectives, experiences and outlook—ScienceDirect. J. Air Transp. Manag. 2007, 13, 149–162. [Google Scholar] [CrossRef]
- Abdelghany, K.F.; Abdelghany, A.F.; Ekollu, G. An integrated decision support tool for airlines schedule recovery during irregular operations. Eur. J. Oper. Res. 2008, 185, 825–848. [Google Scholar] [CrossRef]
- Abdi, M.R.; Sharma, S. Information system for flight disruption management. Int. J. Inf. Manag. 2008, 28, 136–144. [Google Scholar] [CrossRef]
- Li, X.; Le, M. Multi objective aircraft and passenger recovery stage by stage heuristic algorithm. Comput. Appl. Res. 2014, 31, 2270–2274. [Google Scholar]
- Le, M.; Li, X. Integrated recovery model of aircraft and passenger flow. Ind. Eng. 2013, 16, 113–119. [Google Scholar]
- Wang, Q.; Yany, X.-S. DEA Model for Analysis of Domestic Three Major Airport Groups Efficiency. Aeronaut. Comput. Tech. 2017, 47, 45–49. [Google Scholar]
- Zhang, D.T.; Yang, K. Deterministic analysis of threshold value of control load. Command Inf. Syst. Technol. 2016, 7, 47–50. [Google Scholar]
- Zhou, H.; Zhang, S. Study on the Service Recovery Quality of Flight Delay by the Synthetic Fuzzy Evaluation. Sci. Technol. Manag. Res. 2010, 30, 66–70. [Google Scholar]
- Mou, D.; Zhao, W. An Irregular Flight Scheduling Model and Algorithm under the Uncertainty Theory. J. Appl. Math. 2013, 2013, 361926. [Google Scholar] [CrossRef]
- Holme, P.; Saramaki, J. Temporal networks. Phys. Rep. 2011, 519, 97–125. [Google Scholar] [CrossRef]
- Lambiotte, R.; Tabourier, L.; Delvenne, J.C. Burstiness and spreading on temporal networks. Phys. Condens. Matter 2013, 86, 320. [Google Scholar] [CrossRef]
- Perotti, J.I.; Jo, H.H.; Holme, P.; Saramäki, J. Temporal network sparsity and the slowing down of spreading. arXiv 2014, arXiv:1411.5553. [Google Scholar]
- Casteigts, A.; Flocchini, P.; Quattrociocchi, W.; Santoro, N. Time-varying graphs and dynamic networks. Int. J. Parallel Emergent Distrib. Syst. 2010, 27, 346–359. [Google Scholar]
- Anderson, R.M.; May, R.M. Infectious Diseases of Humans: Dynamics and Control; Oxford University Press: Oxford, UK, 1991. [Google Scholar]
- Grassly, N.C.; Fraser, C. Mathematical models of infectious disease transmission. Nat. Rev. Microbiol. 2008, 6, 477–487. [Google Scholar] [CrossRef]
- Viboud, C.; Bjørnstad, O.N.; Smith, D.L.; Simonsen, L.; Miller, M.A.; Grenfell, B.T. Synchrony, Waves, and Spatial Hierarchies in the Spread of Influenza. Science 2006, 312, 447–451. [Google Scholar] [CrossRef]
- Eggo, R.M.; Cauchemez, S.; Ferguson, N.M. Spatial dynamics of the 1918 influenza pandemic in England, Wales and the United States. J. R. Soc. Interface 2011, 8, 233–243. [Google Scholar] [CrossRef] [PubMed]
- Grenfell, B.T.; Bjornstad, O.N.; Kappey, J. Travelling waves and spatial hierarchies in measles pandemics. Nature 2001, 414, 716–723. [Google Scholar] [CrossRef] [PubMed]
- Bharti, N.; Tatem, A.J.; Ferrari, M.J.; Grais, R.F.; Djibo, A.; Grenfell, B.T. Explaining Seasonal Fluctuations of Measles in Niger Using Nighttime Lights Imagery. Science 2011, 334, 1424. [Google Scholar] [CrossRef]
- Crepey, P.; Barthelemy, M. Detecting robust patterns in the spread of pandemics: A case study of influenza in the United States and France. Am. J. Epidemiol. 2007, 166, 1244–1251. [Google Scholar] [CrossRef]
- Spoof-Tuomi, K.; Niemi, S. Environmental and Economic Evaluation of Fuel Choices for Short Sea Shipping. Clean Technol. 2020, 2, 34–52. [Google Scholar] [CrossRef]
- Bengtsson, L.; Gaudart, J.; Lu, X.; Moore, S.; Wetter, E.; Sallah, K.; Rebaudet, S.; Piarroux, R. Using mobile phone data to predict the spatial spread of cholera. Sci. Rep. 2014, 5, 8923. [Google Scholar] [CrossRef]
- Dou, F.; Jia, L.; Jie, X.U.; Kang, Y. Research on Train Dispatching Model Based on the Passenger Flow during Holidays. In Proceedings of the International Symposium on Innovation and Sustainability of Modern Railway, School of Traffic and Transportation, Beijing, China, 20 September 2012; Beijing Jiaotong University: Beijing, China; State Key Laboratory of Rail Traffic Control and Safety, Beijing Jiaotong University: Beijing, China, 2012. [Google Scholar]
- ICAO. ICAO Carbon Emissions Calculator Methodology Version 11; ICAO: Montreal, QC, Canada, 2018. [Google Scholar]
- ICAO. Annex 16 to the Convention on International Civil Aviation—Environmental Protection—Volume II: Aircraft Engine Emissions; ICAO: Montreal, QC, Canada, 2008. [Google Scholar]
Figure 1.
The flight space–time network.

Figure 2.
The space–time network.

Figure 3.
(a) The growth of the national pandemic of routes and (b) The growth of the infection pressure of routes.
Figure 3.
(a) The growth of the national pandemic of routes and (b) The growth of the infection pressure of routes.

Figure 4.
The space–time network of adjusted flights ((a) is the traditional method of adjusted flight network and (b) is the result of the new method).
Figure 4.
The space–time network of adjusted flights ((a) is the traditional method of adjusted flight network and (b) is the result of the new method).

Table 1.
The definitions of variables.
| Variable | Definition |
|---|---|
| A set of flights in a normal flight schedule | |
| The flight, | |
| A set of aircraft, | |
| All airports involved in the interrupt recovery decision | |
| The airport, | |
| A set of feasible paths | |
| One feasible path, | |
| The number of aircraft required to stay at the airport during normal operation period | |
| Actual time of departure | |
| Estimated time of departure | |
| , otherwise | |
| flight schedule terminated at airport S, otherwise | |
| The delaying costs of airplane at airport | |
| The churn rate of passengers caused by the flight’s delay | |
| The churn rate of passengers caused by the flight’s cancellation | |
| The ticket price of passenger on flight at time ; represents the passengers of first class, business class, and economic class separately | |
| The average daily proportion of flight volume relocating from study area to , | |
| The infectious pressure sustained by each airport during the period from 14 days () after the disease onset of the first case | |
| The number of reported cases in airport at time | |
| The operating expense of flight , including gas cost and flight-related expenses | |
| The carbon emissions during the LTO phase (kg); = 1, 2, 3, 4 corresponds to the four operational phases of takeoff, climb, approach, and taxi | |
| The flight duration of flight during phase (s) | |
| The fuel flow rate during phase i for flight (kg/s) | |
| The number of engines | |
| The carbon emission factor for aviation kerosene, generally established at 3.157 kg CO2/kg | |
| The carbon emissions of the aircraft during the CCD phase (kg) | |
| The duration of the aircraft’s operation during the CCD phase (s) | |
| The fuel flow rate of the aircraft during the CCD phase (kg/s) | |
| The extra waiting time of passengers at the airport | |
| The actual arrival time at the airport | |
| The actual check-in time when passengers transfer at airport | |
| The maximum waiting time that passengers can accept at airport | |
| The actual waiting time of passengers at airport | |
| The number of passengers transferred to the airport | |
| The risk preference. The values range between 0 and 1, which are determined by the sensitivity to the waiting time of transit passengers | |
| The aversion coefficients. The values range between 0 and 1, which are determined by the sensitivity to the waiting time of transit passengers | |
| The sensitive coefficient to the cost loss caused by passenger transit waiting | |
| flight has been canceled, otherwise | |
| flight is operating normally, otherwise | |
| delay cost, delay time , otherwise , where | |
| passenger perceived value, , otherwise | |
| the carbon emissions of the aircraft during one complete takeoff and landing cycle (kg), , otherwise | |
| infectious pressure, flight has potential infectious pressure, otherwise |
Table 2.
The definitions of data input.
| Data Type | Symbol | Definition |
|---|---|---|
| Airport data | Airport_name | Airport name |
| Curfew_time | Airport curfew time | |
| Close_starttime, Close_endtime | Airport closing time. Due to the pandemic situation, weather, or air traffic control, the time that the airport temporarily closed | |
| Pandemic_no. | The number of outbreaks in the city where the airport is located | |
| Flight data | Flight_no | Flight number |
| Depart_airport | Departure airport | |
| Depart_time | Planned departure time | |
| Arrive_airport | Arrival airport | |
| Arrive_time | Planned arrival time | |
| Passenger_no. | Number of passengers | |
| Ticket_price | Airfare | |
| Other data | Delay_cost | Flight delay cost |
| Cancel_cost | Flight cancellation cost | |
| Retention_cost | Passenger detention cost | |
| Recovery_starttime, Recovery_endtime | Recovery interval | |
| MCT | Minimum connection time |
Table 3.
The construction algorithm of space–time network.
| Algorithm: Network transformation pseudo-code |
|---|
| input: T = original flight schedule, II = reschedule discretization plan |
| output: N = space-time network, A = ordered list of space-time node |
| 1: for each airport do |
| 2: for each time segment in reschedule period do |
| Place space-time mode i at beginning of time segment |
| i = n |
| 3: end for |
| 4: end for |
| 5: let A = { } |
| 6: for each space-time mode i do |
| If mark (i) < n then place mode in A |
| 7: end for |
| 8: end for |
Table 4.
Infection pressure at airports.
| Airport Name | City | Infection Pressure |
|---|---|---|
| HGH | Hangzhou | 1316.32 |
| PVG | Shanghai | 2650.05 |
| MFM | Macau | 597.5 |
| KMG | Kunming | 910.72 |
| WUH | Wuhan | 31.57 |
| HKG | Hong Kong | 84.24 |
| SHA | Shanghai | 1459.77 |
| PEK | Beijing | 272.75 |
| TYN | Taiyuan | 1379.47 |
| SZX | Shenzhen | 1300.57 |
| CAN | Guangzhou | 1518.41 |
| PKX | Beijing | 70.96 |
Table 5.
Comparison of results of historic and proposed methods.
| Measures | Traditional Method | Proposed Method |
|---|---|---|
| No. of delayed flights | 12 | 24 |
| Total delay (min) | 439 | 495 |
| No. of canceled flights | 2 | 0 |
| Total delay cost (RMB) | 13,170 | 14,850 |
| Total flight cancellation cost (RMB) | 198,755 | 0 |
| Total reduced infection pressure (after adjusting the flight) (RMB) | 26,139.02 | 56,131.55 |
| Total cost (RMB) | 238,064.02 | 70,981.55 |
Disclaimer/Publisher’s Note: The statements, opinions and data contained in all publications are solely those of the individual author(s) and contributor(s) and not of MDPI and/or the editor(s). MDPI and/or the editor(s) disclaim responsibility for any injury to people or property resulting from any ideas, methods, instructions or products referred to in the content. |
© 2024 by the authors. Licensee MDPI, Basel, Switzerland. This article is an open access article distributed under the terms and conditions of the Creative Commons Attribution (CC BY) license (https://creativecommons.org/licenses/by/4.0/).
Share and Cite
MDPI and ACS Style
Yuan, Y.; Wang, Y.; Jiang, X.; Lai, C.S. An Innovative Multi-Objective Rescheduling System for Mitigating Pandemic Spread in Aviation Networks. Clean Technol. 2024, 6, 77-92. https://doi.org/10.3390/cleantechnol6010006
AMA Style
Yuan Y, Wang Y, Jiang X, Lai CS. An Innovative Multi-Objective Rescheduling System for Mitigating Pandemic Spread in Aviation Networks. Clean Technologies. 2024; 6(1):77-92. https://doi.org/10.3390/cleantechnol6010006
Chicago/Turabian StyleYuan, Yujie, Yantao Wang, Xiushan Jiang, and Chun Sing Lai. 2024. "An Innovative Multi-Objective Rescheduling System for Mitigating Pandemic Spread in Aviation Networks" Clean Technologies 6, no. 1: 77-92. https://doi.org/10.3390/cleantechnol6010006