Article

Wind–PV–Battery Hybrid Off-Grid System: Control Design and Real-Time Testing

by
Miloud Rezkallah
1,2,*,†,
Ambrish Chandra
2,† and
Hussein Ibrahim
3,†
1
Energy Intelligence Research and Innovation Center (Cr2ie), Sept-Iles, QC G4R 5B7, Canada
2
École de Technologie Suprieure (ETS), 1100 Notre-Dame St. W, Montreal, QC H3C 1K3, Canada
3
National Integrated Center for Smart Manufacturing (CNIMI), 575 Boul de l’Université, Drummondville, QC J2C 0R5, Canada
*
Author to whom correspondence should be addressed.
These authors contributed equally to this work.
Clean Technol. 2024, 6(2), 471-493; https://doi.org/10.3390/cleantechnol6020024
Submission received: 18 January 2024 / Revised: 25 March 2024 / Accepted: 3 April 2024 / Published: 15 April 2024
(This article belongs to the Topic Clean Energy Technologies and Assessment)

Abstract

:
The paper presents the design and implementation of decentralized control for a PV–wind–battery hybrid off-grid system with limited power electronics devices and sensors. To perform well without using any maximum power point tracking (MPPT) technique from the wind turbine (WT) based on a permanent-magnet brushless DC generator (PMBLDCG) and solar panels (PVs) and balance the power in the system, a cascade control structure strategy based on a linear active disturbance rejection controller (LADRC) is developed for the two-switch DC-DC buck-boost converter. Moreover, to ensure an uninterruptible power supply to the connected loads with a constant voltage and frequency, a cascade d-q control structure based on LADRC is developed for the interfacing single-phase inverter. Furthermore, the modeling and controller parameters design are presented. The performance under all operation conditions of the hybrid off-grid configuration and its decentralized control is validated by simulation using MATLAB/Simulink and in real-time using a small-scale hardware prototype.

1. Introduction

The most important goal of integrating sustainable sources (RESs), such as wind turbines (WTs) and solar panels (PVs) with the existing diesel generators (DGs) in remote areas, is to reduce the cost of electrical power and gas greenhouse effect and make it more readily available. However, these RESs are stochastic and do not guarantee uninterrupted power to connected isolated loads. As a result, integrating the RESs for off-grid applications requires additional equipment such as power converters and accurate control. In this context, the authors in [1] present many off-grid solutions with a variable speed generator, and in [2], many redesigned off-grid solutions with fixed speed generators are recommended. One of the key characteristics of the off-grid designs presented in [1,2] is being able to use limited power converters. In turn, this can reduce the price and complexity of this technology and enhance its performance.
Numerous off-grid solutions are offered in [3] for solving the problems of connecting and operating energy sources which can be operated from either the DC or AC side through controlled and non-controlled power converters. In [4,5,6] as well as in [1,2], off-grid configurations are described as an effective solution for soft and secure integrations of renewable and non-renewable energy sources in remote localities while requiring fewer power converters.
As it pertains to hybrid off-grid power converters, in [7], a DC-DC boost converter is used to connect the wind turbine (WT) based on PMBLDCG to the common DC link; however, the storage system is connected directly to the DC bus without using any interfacing power converter and control, and in [8], a three-phase diode bridge and DC-DC boost converter are used to connect the stator terminals of the PMBLDCG to the common DC bus. In [9], a DC-DC boost converter for WT based on PMBLDCG and batteries are connected directly to the common DC bus without any interfacing power converter and any control algorithm. In the same context, the authors in [10,11] propose two different configurations for the hybrid off-grid application, where in [10], the solar panels and the storage batteries are used as power converters, interfacing them with the DC bus; however, the stator terminals of the PMBLDCG are connected directly to the point of common coupling (PCC), which is on the load’s side, and in [10], the WT and solar panels use interfacing power converters, and the storage batteries are connected directly to the common DC bus. Connecting the batteries to the common DC bus as given in [7,9,11], can reduce their reliability and reduce their performance by reducing their lifespan. Furthermore, in all configurations [7,8,9,10,11], the WT either is connected directly to the PCC or through a DC-DC boost converter, which makes synchronization with the PCC difficult and increases the control and hardware complexity. Regarding the solar panels, all proposed hybrid off-grid configurations are interfacing with the DC bus through a DC-DC boost converter to avoid the synchronization issue and reduce the hardware and control complexity as well as increasing the battery performance and extending their lifespan.
To balance and compensate for fluctuations in power using a hybrid AC/DC configuration for an off-grid system, an energy storage element is suggested [12]. Connecting this element to the system often requires power converters to step up or down the voltage, such as Cuk, SEPIC, etc., [13,14]. This is illustrated by [15,16], which suggests a buck–boost converter with two switches. From the point of view of ESE management and control, two-switch converters show greater flexibility than Cuk or SEPIC converters. It must be noted that these power converters are prone to circulating the current ripple, which may adversely affect the performance of passive components, such as capacitors, as well as the battery lifespan [17]. An accurate design for the two-switch buck–boost converter’s passive elements is presented in [17]. To reduce this issue and enhance performance, generally, RESs in a hybrid off-grid configuration are connected to the DC bus by controlled DC-DC or AC-DC power converters and to the PCC by a controlled DC-AC inverter.In either case, the DC-DC, AC-DC, or DC-AC power converters are controlled to obtain a high level of efficiency from RESs and to supply the connected loads with a constant voltage and frequency [18,19,20,21].
The dynamic nature of solar irradiation and wind speed affects their performance as previously discussed. Thus, accurate control and maximum PowerPoint optimization techniques are necessary to obtain the maximum power from the RES as detailed in [22]. Due to their lesser complexity, the incremental conductance (InC) technique or the perturb and observe (PO) technique, etc., was typically used for the classical MPPT techniques [23]. However, these techniques are less effective and suffer during sudden weather condition variations.
As a solution to tackle these weaknesses of RESs and to obtain high performance from them under severe weather condition changes, intelligent-based MPPT techniques, such as artificial neural network-based MPPT techniques (ANN-MPPTs), are suggested in [24]. In contrast to classical MPPTs, intelligent MPPTs are more efficient, but they require big data processing, so they make the control and hardware more complex. In [25], optimization-based MPPT techniques, such as the Artificial Bee Colony technique (ABC-MPPT), are recommended to reduce the necessity of using system knowledge in the control. Despite its effectiveness, this type of MPPT is complex. In [26], special hybrid-based MPPT techniques, such as Fuzzy Particle Swarm Optimization System (FPSPO) or Adaptive Neuro-Fuzzy Interference System (ANFIS-MPPT), are recommended to combine the advantages of these two technologies of classical and intelligent or optimal MPPT techniques. Among the MPPT techniques mentioned in [22,23,24,25,26], sensing data of voltage, current, temperature, mechanical speed, etc.—are necessary to achieve maximum power tracking. For data collection and minimizing the signal errors of the output data, a precise controller with optimal parameters is required, such as the proportional–integral–derivative controller (PID) or the proportional resonant controller (PRC). Thus, the use of advanced MPPT with additional sensors and optimal controllers increases the price and complexity.
Generally, in a hybrid off-grid configuration, the DC-RESs linked to the DC bus are coupled to the PCC via DC-AC interfacing power electronic devices and are controlled to achieve the following tasks: (1) voltage and frequency regulation, (2) power quality improvement, (3) synchronization, etc. There are many control techniques to achieve these tasks, described in [11,27,28,29,30]. The adaptive sliding mode control (ASMC) in [11] is proposed to constantly regulatethe PCC voltage and frequency while improving the power quality at the PCC. The results obtained in [11] under dynamic conditions are satisfactory. Unfortunately, the chattering phenomenon is not discussed as the main ASMC drawback. In [30], control-based current regulation was implemented, and in [27] enhanced voltage control was developed. The vector control with less current ripple was recommended in [28,29]. The inner and outer control loops are closed by a simple PI controller, which ignores saturation issues and noise rejection, for all suggested methods in [27,28,29,30] and in [22,23,24,25,26]. Accordingly, Ref. [31] proposed a linear active disturbance rejection controller (LADRC), which solves these issues and enhances the control’s robustness under disturbances. The same controller was suggested for direct torque control on switched reluctance motors. It is more efficient compared to classical PI and sliding mode controllers [32]. It proves that LADRC can perform well under disturbance [31,32]. A comparison of LADRC, proportional–derivative controller (PD), and fuzzy logic proportional–integral controller (FLPI) for pitch angle control for WT applications was presented in [33,34], showing the ability of LADRC to estimate disturbances accurately and compensate for them in real-time.
According to the literature review above, optimizing energy conversion can improve efficiency and reduce electrical installation and maintenance costs of hybrid off-grid system by minimizing its power converters. Consequently, the following novelties and contributions are proposed to achieve these objectives:
(1)
A simple configuration compared to [7,8,9,10,11] with a reduced number of power converters and sensors;
(2)
Achieving the desired efficiency at high irradiances and wind speed levels without using any weather data or MPPT techniques;
(3)
Achieving high performance from the battery and extending their lifespan;
(4)
A hybrid off-grid power distribution system with a multitasking control strategy for a two-switch buck–boost converter to perform well and balance the power by only controlling the DC link voltage and ESS current;
(5)
An optimized cascade control strategy based on LADRC controllers to achieve high performance under noise and disturbance conditions;
(6)
Design of the LADRC controller and optimizing its parameters.

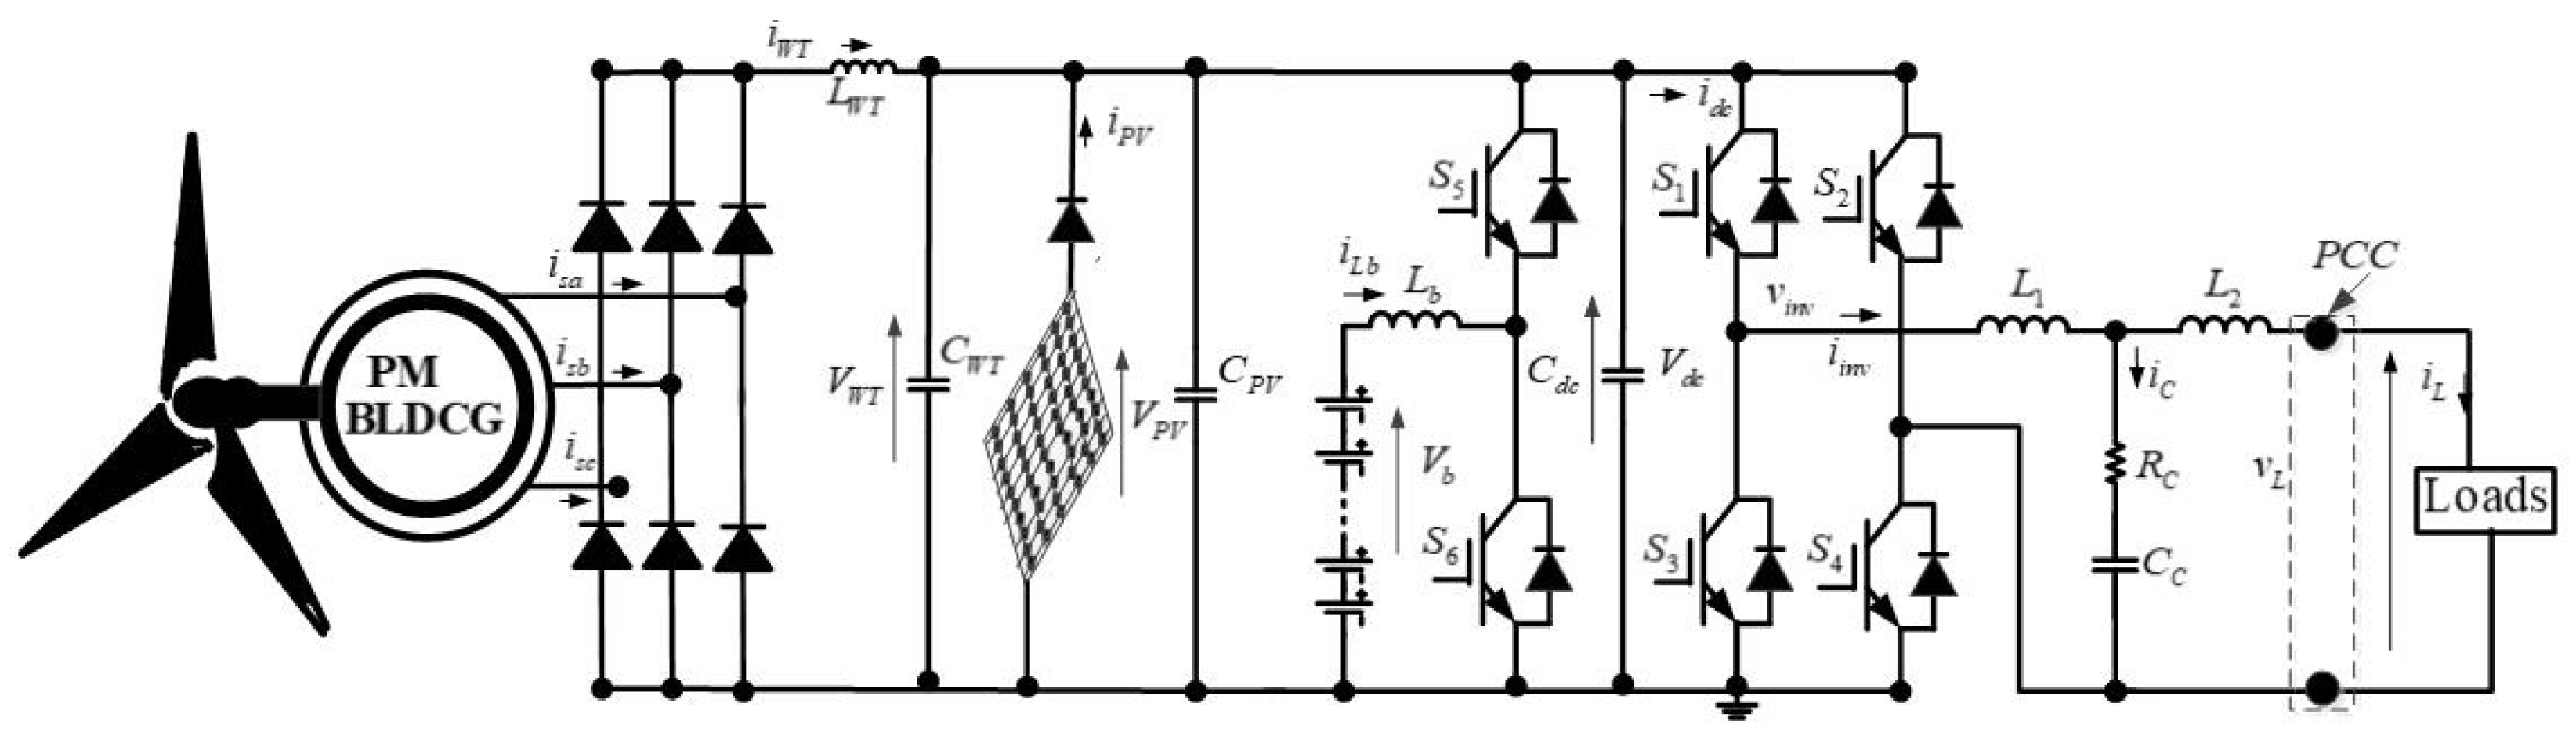
2. System Description and Operation

Figure 1 shows a small-power rating wind–PV–battery hybrid off-grid configuration. This system comprises a wind turbine-driven permanent-magnet brushless DC generator (PMBLDCG), photovoltaic panels, lead-acid batteries, and loads. To avoid the synchronization issue, achieve high performance from the WT and PVs, and increase the battery performance and lifespan, a three-phase diode bridge (TDB) connects the WT to the common DC bus. In contrast, PVs, which are connected in series and parallel, are connected directly to the DC bus. Battery backup is provided by lead-acid batteries connected to the DC bus through buck/boost converters and by DC-AC full-bridge single-phase inverter (FBSPI) to the PCC. As a result of this optimized configuration, from the point of view of many power converters as well as limited operating conditions, such as irradiation from the sun and wind as well as a high ambient temperature of 15 °C, one can easily achieve the objectives detailed above. As shown in Figure 2 and Figure 3, through regulation of the DC link voltage equal to the maximum voltage that produces maximum power from PVs and WT, the output PV and WTs voltages vary slightly with variations of solar irradiation and wind speed, and the output currents increase and decrease accordingly. As demonstrated in Figure 2 at high irradiation levels, the maximum power point at ( V P V ) equal to 240 V is the same, but at reduced values, such as 600 W/m2, there is a small difference in power, and in Figure 3, we observe that the characteristic ( T m ) = f( i W T ) is linear at different wind speeds and DC link voltage regulated at 240 V, and the output current at the output of the TDB increases with increasing mechanical torque. As a result, using the proposed configuration shown in Figure 1, one can easily obtain good efficiency at a high level of solar irradiation and for a moderate ambient temperature of 25 °C.
As demonstrated in Figure 2, for fixed DC-link voltage, the measured WT current is linear at the output of the TDB for different mechanical torques. Regarding the PVs, by connecting them in series to equalize the sum of their output voltages to the DC link voltage (i.e., 240 V) as shown in Figure 3, one can easily obtain good efficiency at a high level of solar irradiation and for moderate ambient temperature such as 25 °C.

3. Control and Parameters Design for the Hybrid Off-Grid Configuration

As presented in Figure 1, the hybrid off-grid configuration contains two intermittency energy sources, WT and PVs, which are connected to the common DC bus directly, and standalone loads connected to the PCC. The system possesses the characteristics of non-linearity and is susceptible to AC and DC voltage fluctuations as well as non-linear loads. So, the controllers used to achieve the tasks as DC and AC voltages, as well as the frequency regulation, should operate well under all conditions and should possess fewer tuning parameters. Among the controllers that meet these requirements, the LADRC based on LESO is proposed in this study. It can estimate internal and external disturbances and compensate for them in real time. Furthermore, its controller possesses only two parameters that need to be tuned and without the need for an accurate system model: observer bandwidth and controller bandwidth. The following section discusses the LADRC with LESO cascade control strategies for a buck-boost converter and an FBSPI.

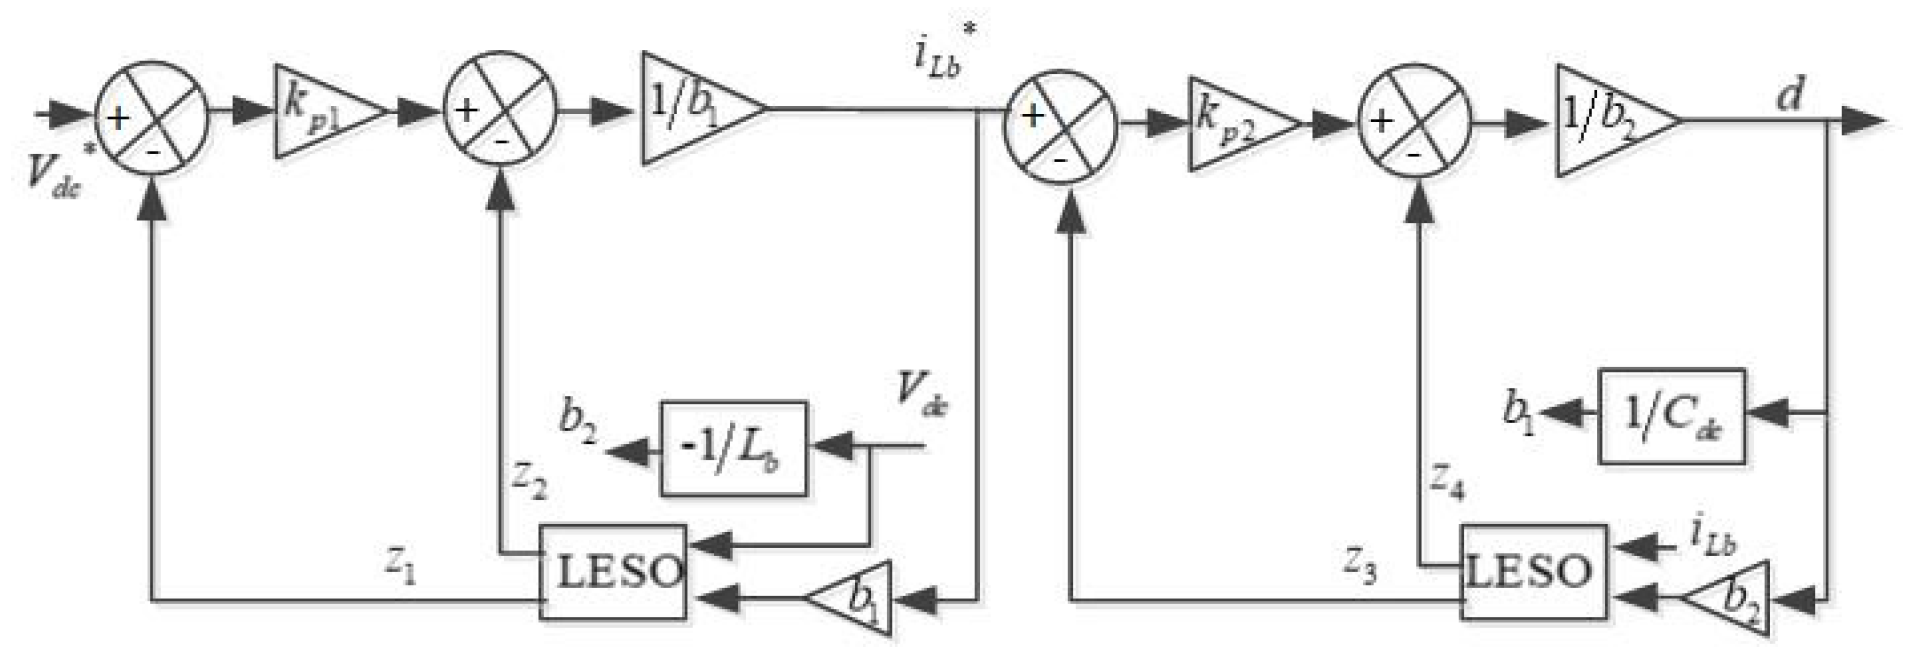
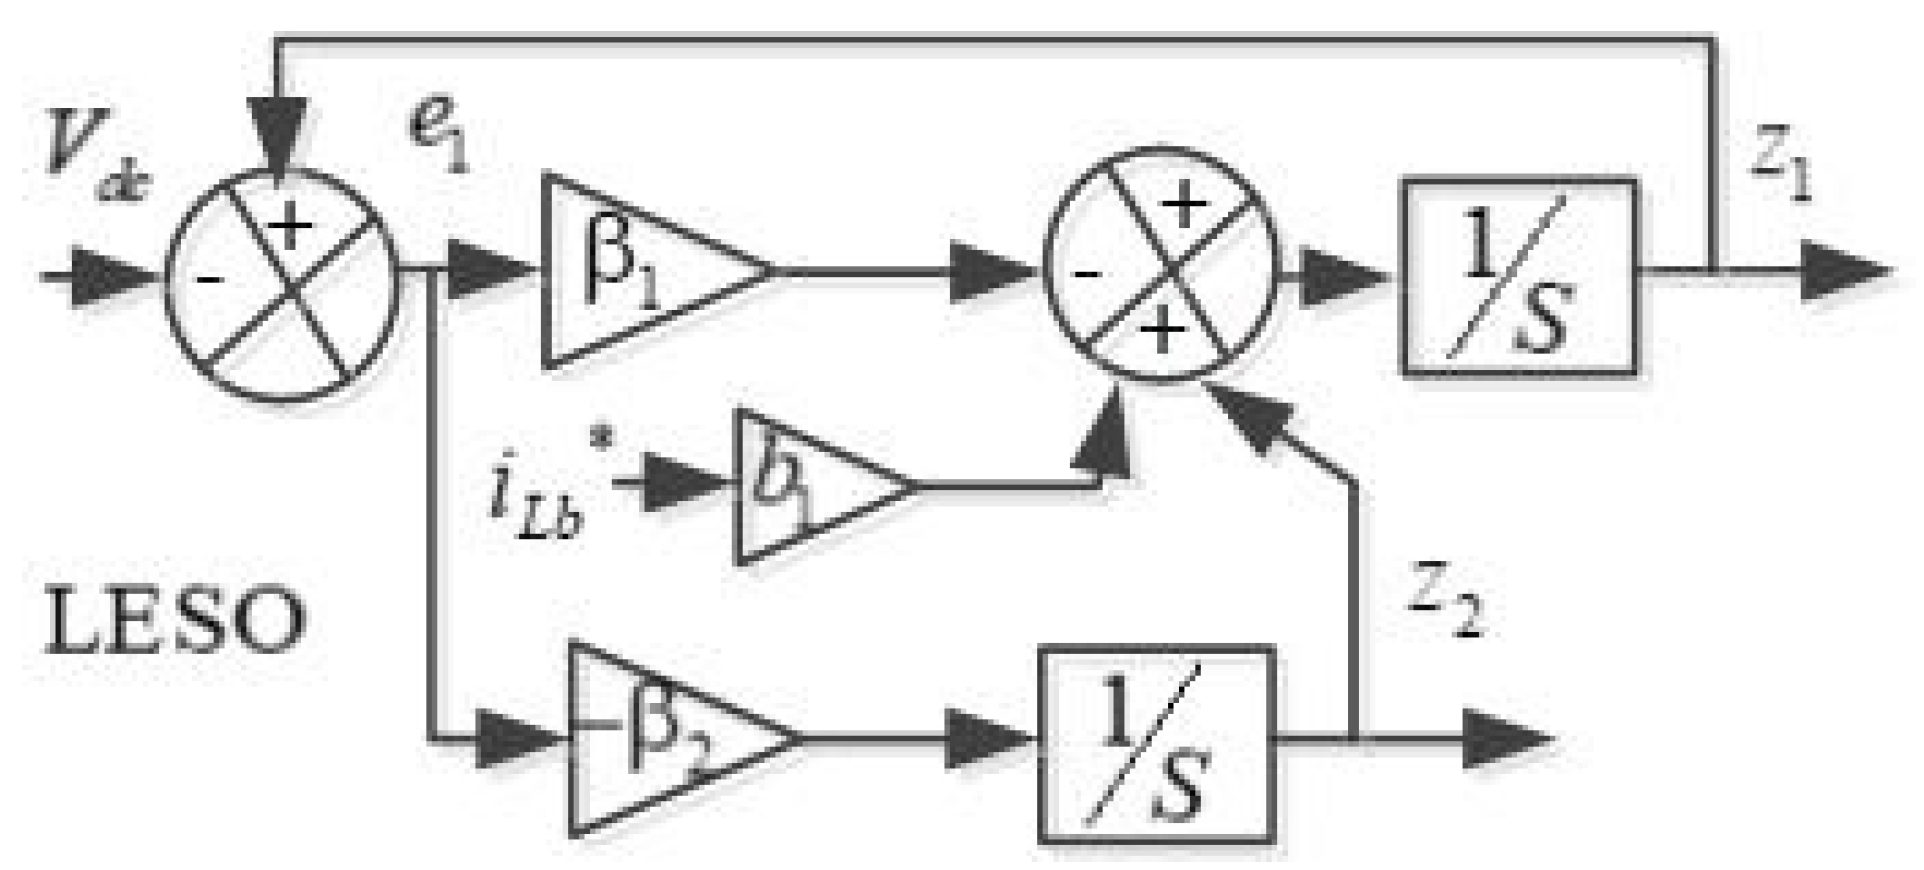
3.1. Control of Buck–Boost Converter

In Figure 1, the battery is connected to the DC bus using a buck-boost converter. The DC-link voltage is closely dependent on the active power. Thus, the adjustment of the DC link voltage means power balance in the system. Therefore, when the DC-link voltage ( V d c ) increases, the converter acts as a buck converter to charge the ESS, and when V d c it decreases, the converter acts as a boost. In terms of power flow, it is recommended that the DC-link voltage is maintained at its rated value (240 V) so that the maximum amount of power can be obtained from the WT and PVs, and the power can be balanced. As a result of the PVs and WT, the generated current is equal to
i R E S = i P V + i W T
where, i R E S , i P V and i W T denote the sum of the generated current from PVs and WT and the output currents from PVs, and WT, respectively.
Based on the switch’s behaviors (On/Off) and by applying Kirchhoff’s laws to the circuit of the two-switch buck-boost converter, one obtains the following equations:
v b = L b d i L b d t C d c d V d c d t = i d c i R E S
And
v b = L b d i L b d t + V d c C d c d V d c d t = i d c i R E S i L b
where v b , i d c , v d c , i L b , C d c , and L b denote the battery voltage, the current at the input of the FBSPI, the DC-link voltage, the battery current capacitor of the common DC bus, and the inductor of the buck–boost converter, respectively.
Introducing the duty cycle (d) applied to the switches, one obtains the following expression:
v b = L b d i L b d t + d V d c ( 4a ) C d c d V d c d t = i d c i R E S d i L b ( 4b )
Various conditions, such as load variations, WT and PV power generation, and variations in d, can affect the stability of the common DC bus voltage. However, Equation (4b) can be used as an observable system with disturbance terms such as
d V d c d t = 1 C d c i d c i R E S d i L B = ω 1 t + b 1 i L B
And
ω 1 t = 1 C d c i d c i R E S b 1 = d C d c
where b 1 and ω 1 represent the control gain and the disturbance term, respectively. The current ( i L b ) flowing through the inductor ( L b ), which is equal to battery current ( i b ), can be influenced by the variation of d. So, Equation (4a) can be written as,
d i L b d t = 1 L b v b d V d c = ω 2 t + d b 2
And
ω 2 t = 1 L b v b b 2 = V d c L b
where b 2 and ω 2 represent the control gain and the disturbance term, respectively.
In Figure 4, the developed cascade control strategy based on LADRC with LESO is demonstrated.
It consists of two closed control loops. It uses the measuring V d c and battery current ( i L b ), and the output is the d. LESO calculates tracking values ( z 1 ) and disturbances ( z 2 ) based on V d c and battery current ( i L b ). In the outer control loop, K p 1 and b 1 are gain factors and compensation coefficients, respectively. The inner control loops, i L b , and d are inputs to the second LESO for tracking and disturbance calculations ( z 3 and z 4 ). K p 2 and b 2 are proportional gain and compensation coefficients in the inner and outer control loops, respectively. Based on the LESO estimation of disturbance ( z 2 ), the compensation is as follows:
i L B = Δ V d c k p 1 b 1 i L b o = Δ V d c k p 1
where Δ V d c represents the difference in voltage between the DC voltage reference and its tracking signal ( z 1 ) generated by the LESO. The term ( Δ V d c K p 1 ) represents the reference battery current before the disturbance compensation. So, if the battery current follows its reference and z 2 estimates ω 1 accurately, Equation (4) is expressed as,
d V d c d t = ω 1 t + b 1 ( Δ V d c k p 1 ) Z 2 b 1 i L b o
Based on Equation (9), the reference battery current before disturbance compensation ( i L b 0 ) is estimated as,
i L b o = k p 1 V d c Z 1
And the reference battery current after disturbance compensation is expressed as
i L b = k p 1 V d c Z 1 Z 2 b 1
The duty cycle is estimated as,
d = k p 2 i L b Z 3 Z 4 b 2
The model of the LESO used to estimate ( z 1 , z 2 , z 3 , and z 4 ) in the outer and inner control loops shown in Figure 4 is detailed in Figure 5. The tracking value ( z 1 ) and the disturbance ( z 2 ) in the outer control loop are estimated using the following expression:
e = Z 1 V d c d Z 1 d t = Z 2 β 1 e 1 + b 1 i L b d Z 2 d t = β 2 e 1
The observer gains ( β 1 ) and ( β 2 ) influence the convergence rate of the system, and they are usually chosen so that the observer eigenvalues are placed at ω 0 as follows: β 1 = 2 ω 0 and β 2 = ω 0 2 . Here, ω 0 represents the observer bandwidth.

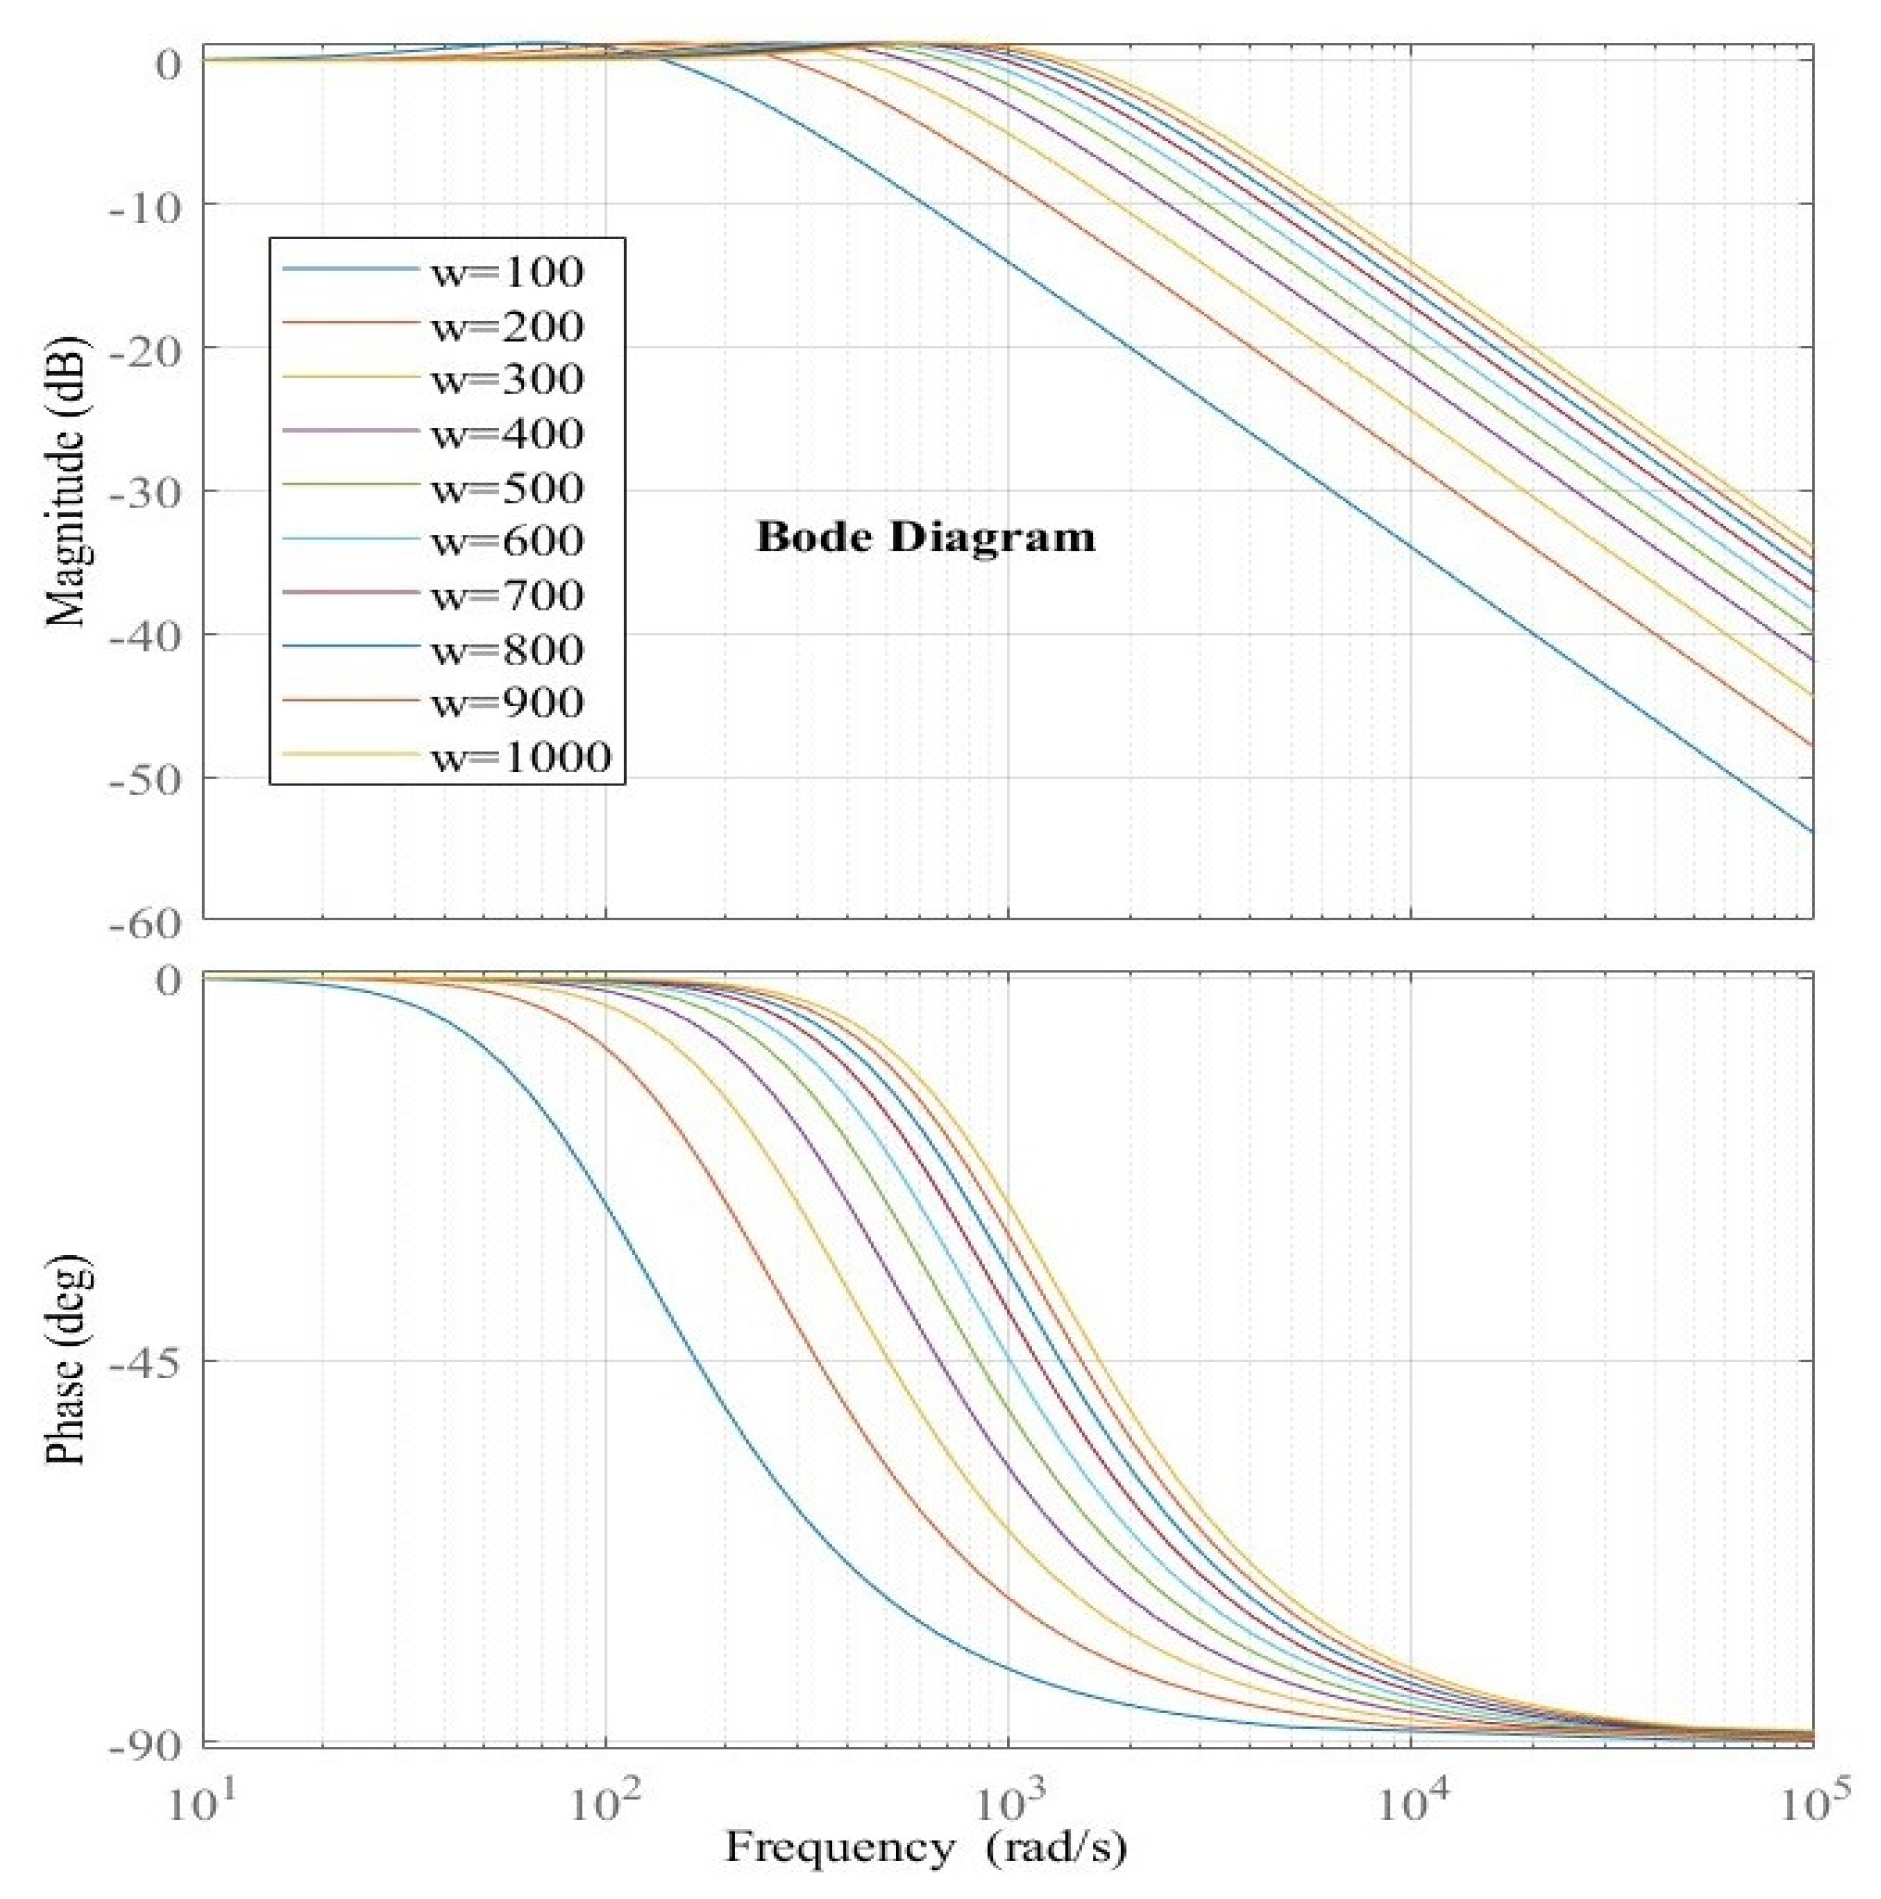
3.2. Design Parameters for LADRC and LESO

The trial-and-error method is used to design the parameters of the controllers. Details can be referred to in [35,36,37]. The ratio between the observer bandwidth ( ω 0 ) and controller bandwidth ( ω 0 ) is selected equal to ω 0 = 3 5 ω c as detailed in [36]. To evaluate the influence of the observer bandwidth, a frequency analysis is employed [36,38]. With the help of Equation (13), one obtains the following transfer function:
Z 1 s Y s = 2 ω 0 s + ω 0 2 s 2 + 2 ω 0 s + ω 0 2
where s represents the Laplace operator. The Bode diagram of Equation (14) is shown in Figure 6 for different values of ω 0 . It can be observed that the LESO acts as a low-pass filter. By increasing ω 0 , the magnitude of the middle and higher frequencies increases, indicating enhanced disturbance estimation capability. By increasing the observer bandwidth, one observes smaller phase lags. Therefore, a higher value of ω 0 results in a better disturbance estimation. However, when ω 0 is increased, the high-frequency gain is also increased, which indicates that the LESO should be more sensitive to measurement noise. Consequently, a trade-off between disturbance rejection and sensitivity to noise measurement is needed when choosing the observer bandwidth of the LESO. An illustration of the Bode diagram of Equation (16) for different values of ω c is shown in Figure 7. The controller bandwidth is similar to the coefficient k p 1 given in Equation (10). As a result, if the linear state error feedback performs well, V d c should be equal to z 1 . Using Equations (9) and (10), the disturbance is compensated, and one can define the transfer function as,
s V d c + k p 1 V d c = k p 1 V d c
And
G s = V d c V d c = k p 1 s + k p 1
The system can achieve a fast response by adjusting ω c as shown in Figure 6. Table A1 in the Appendix A shows the optimal controller parameters tuning.

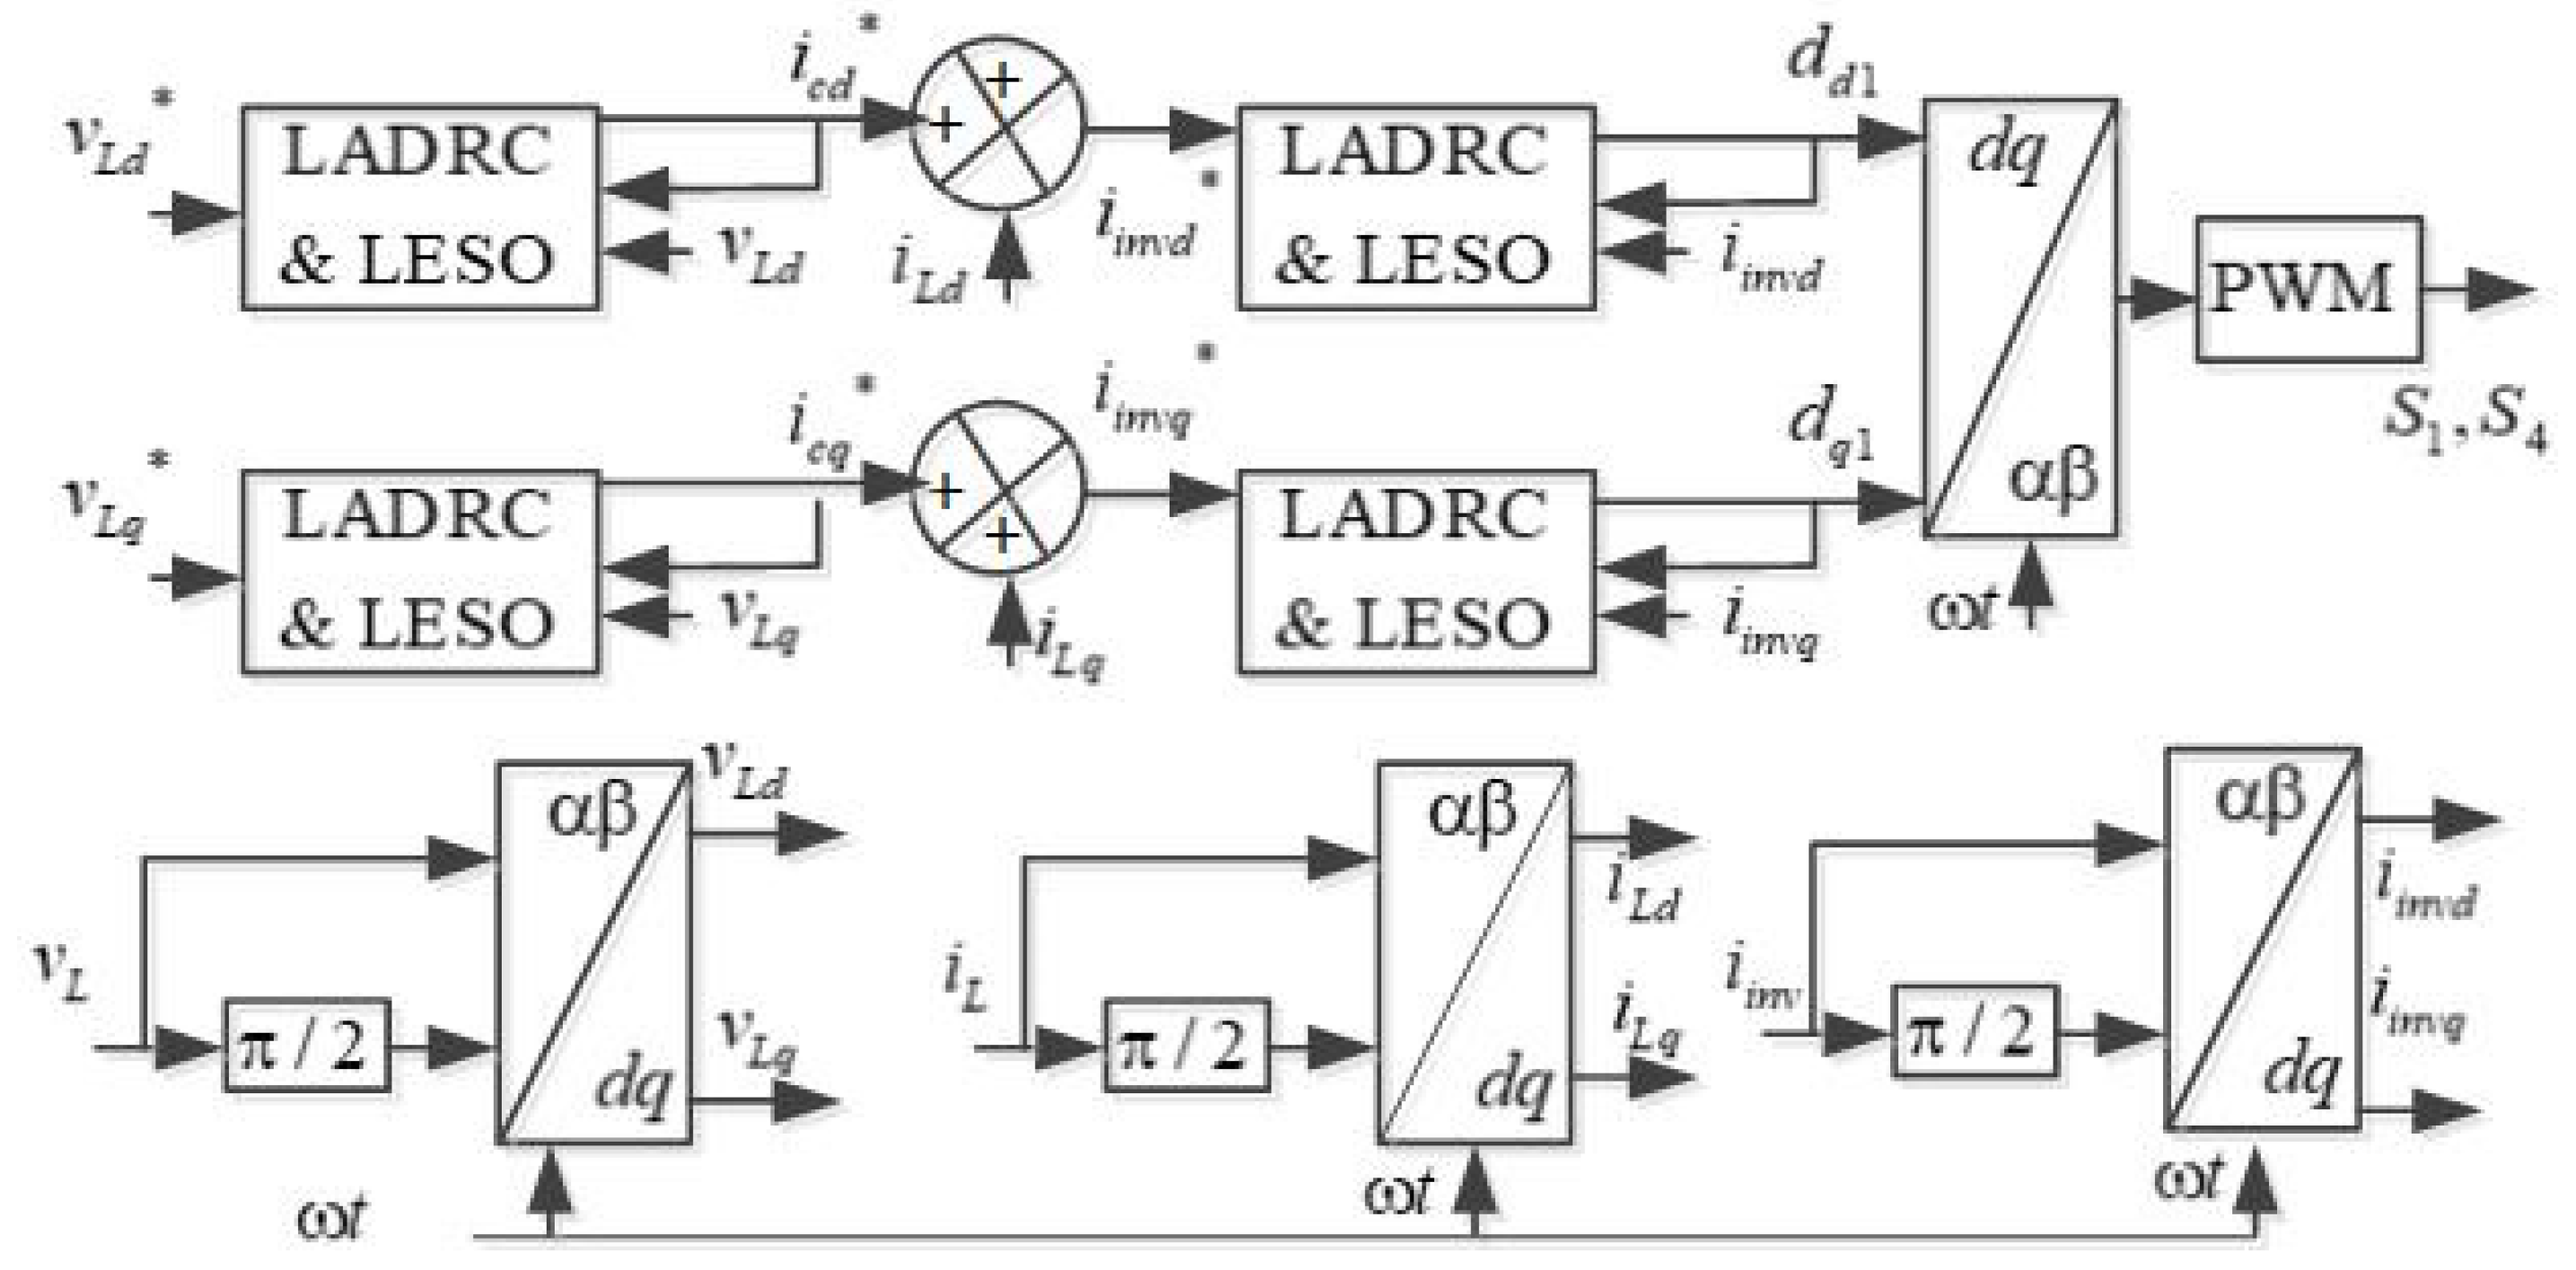
3.3. Control of the FBSPI

A control strategy based on (d-q) Park’s transformation that regulates the voltage and frequency at the PCC in the presence of disturbance caused by connected loads is illustrated in Figure 8.
The control low ( d 1 ) of the switches ( S 1 and S 4 ) of the FBSPI is determined by two control loops. In the cascade control system, two control loops are controlled using LADRC controllers with LESO. The output LCL filter’s capacitor current ( i c ) in the d-q axis is estimated as follows:
i c d = k p 3 v L d Z 5 Z 6 b 3 i c q = k p 4 v L q Z 7 Z 8 b 4
where k p 3 , k p 4 , z 5 , z 6 , z 7 , z 8 , b 3 , and b 4 represent the proportional gains, the tracking values, and the control gains coefficients, respectively.
With the help of Clark ( α β ) and Park (d-q) transformations, the load current ( i L d , i L q ), output FBSPI current ( i i n v d , i i n v q ), and load voltage ( v L d , v L q ) are obtained. The imaginary variable is obtained by shifting the original signal by ( Π 2 ) as detailed in [34,39]:
v L α v L β = v L ω t v L ω t + Π 2
And
v L d v L q = c o s ω t s i n ω t s i n ω t c o s ω t = v L α v L β
The estimated output inverter currents are described as,
i i n v d = i c d + i L d i i n v q = i c q + i L q
The estimated output FBSPI currents ( i i n v d , i i n v q ) are fed to the LADRC with LESO in the inner control loop to obtain the signals ( d d and d q ) in (d-q) rotating frame as,
d d 1 = k p 5 i i n v d Z 9 Z 10 b 5 d q 1 = k p 6 i i n v q Z 11 Z 12 b 6
where k p 5 , k p 6 , z 9 , z 11 , z 10 , z 12 , b 5 , and b 6 represent the gains factor, the tracking values, and the control gains coefficients, respectively.
Using the inverse Park transformation, the signal in ( d d d q ) is transformed and fed to PWM control to obtain the switching signals for S 1 to S 4 .

4. Results and Discussion

The performance of the hybrid off-grid configuration based on WT, PVs, and batteries, in conjunction with two cascade control strategies based on LADRC and LESO, are evaluated using MATLAB/Simulink R2022b simulation under all operation conditions, as weather and load conditions change.
Figure 9 depicts a compact prototype testing setup utilized for real-time testing of the developed concept. It includes the WT emulator, comprising a 2 kW LabVolt Four-Quadrant Dynamometer (8540-00) (7) coupled with a PMBLDC generator (8) via mechanical coupling, equipped with torque and speed sensors (10), and connected to the DC-link through a three-phase diode bridge (9). The Amatek solar array simulator 5 A, 150 V (4) serves as the PV solar and is directly connected to the common DC-link. Two IGBT Chopper/inverter modules (8837-B) (2 and 3), along with a data acquisition module and control interface (9063-00) (1) from LabVolt, are employed as a buck–boost converter and a full bridge single-phase inverter (FBSPI), as well as for sensing voltage and current data transmitted to the 1104 dSPACE. The loads (11) are connected to the FBSPI (3), while lead-acid batteries (6) are connected to the buck–boost converter (2). The performance of the system and its control algorithms is carried out by varying the load and weather conditions.

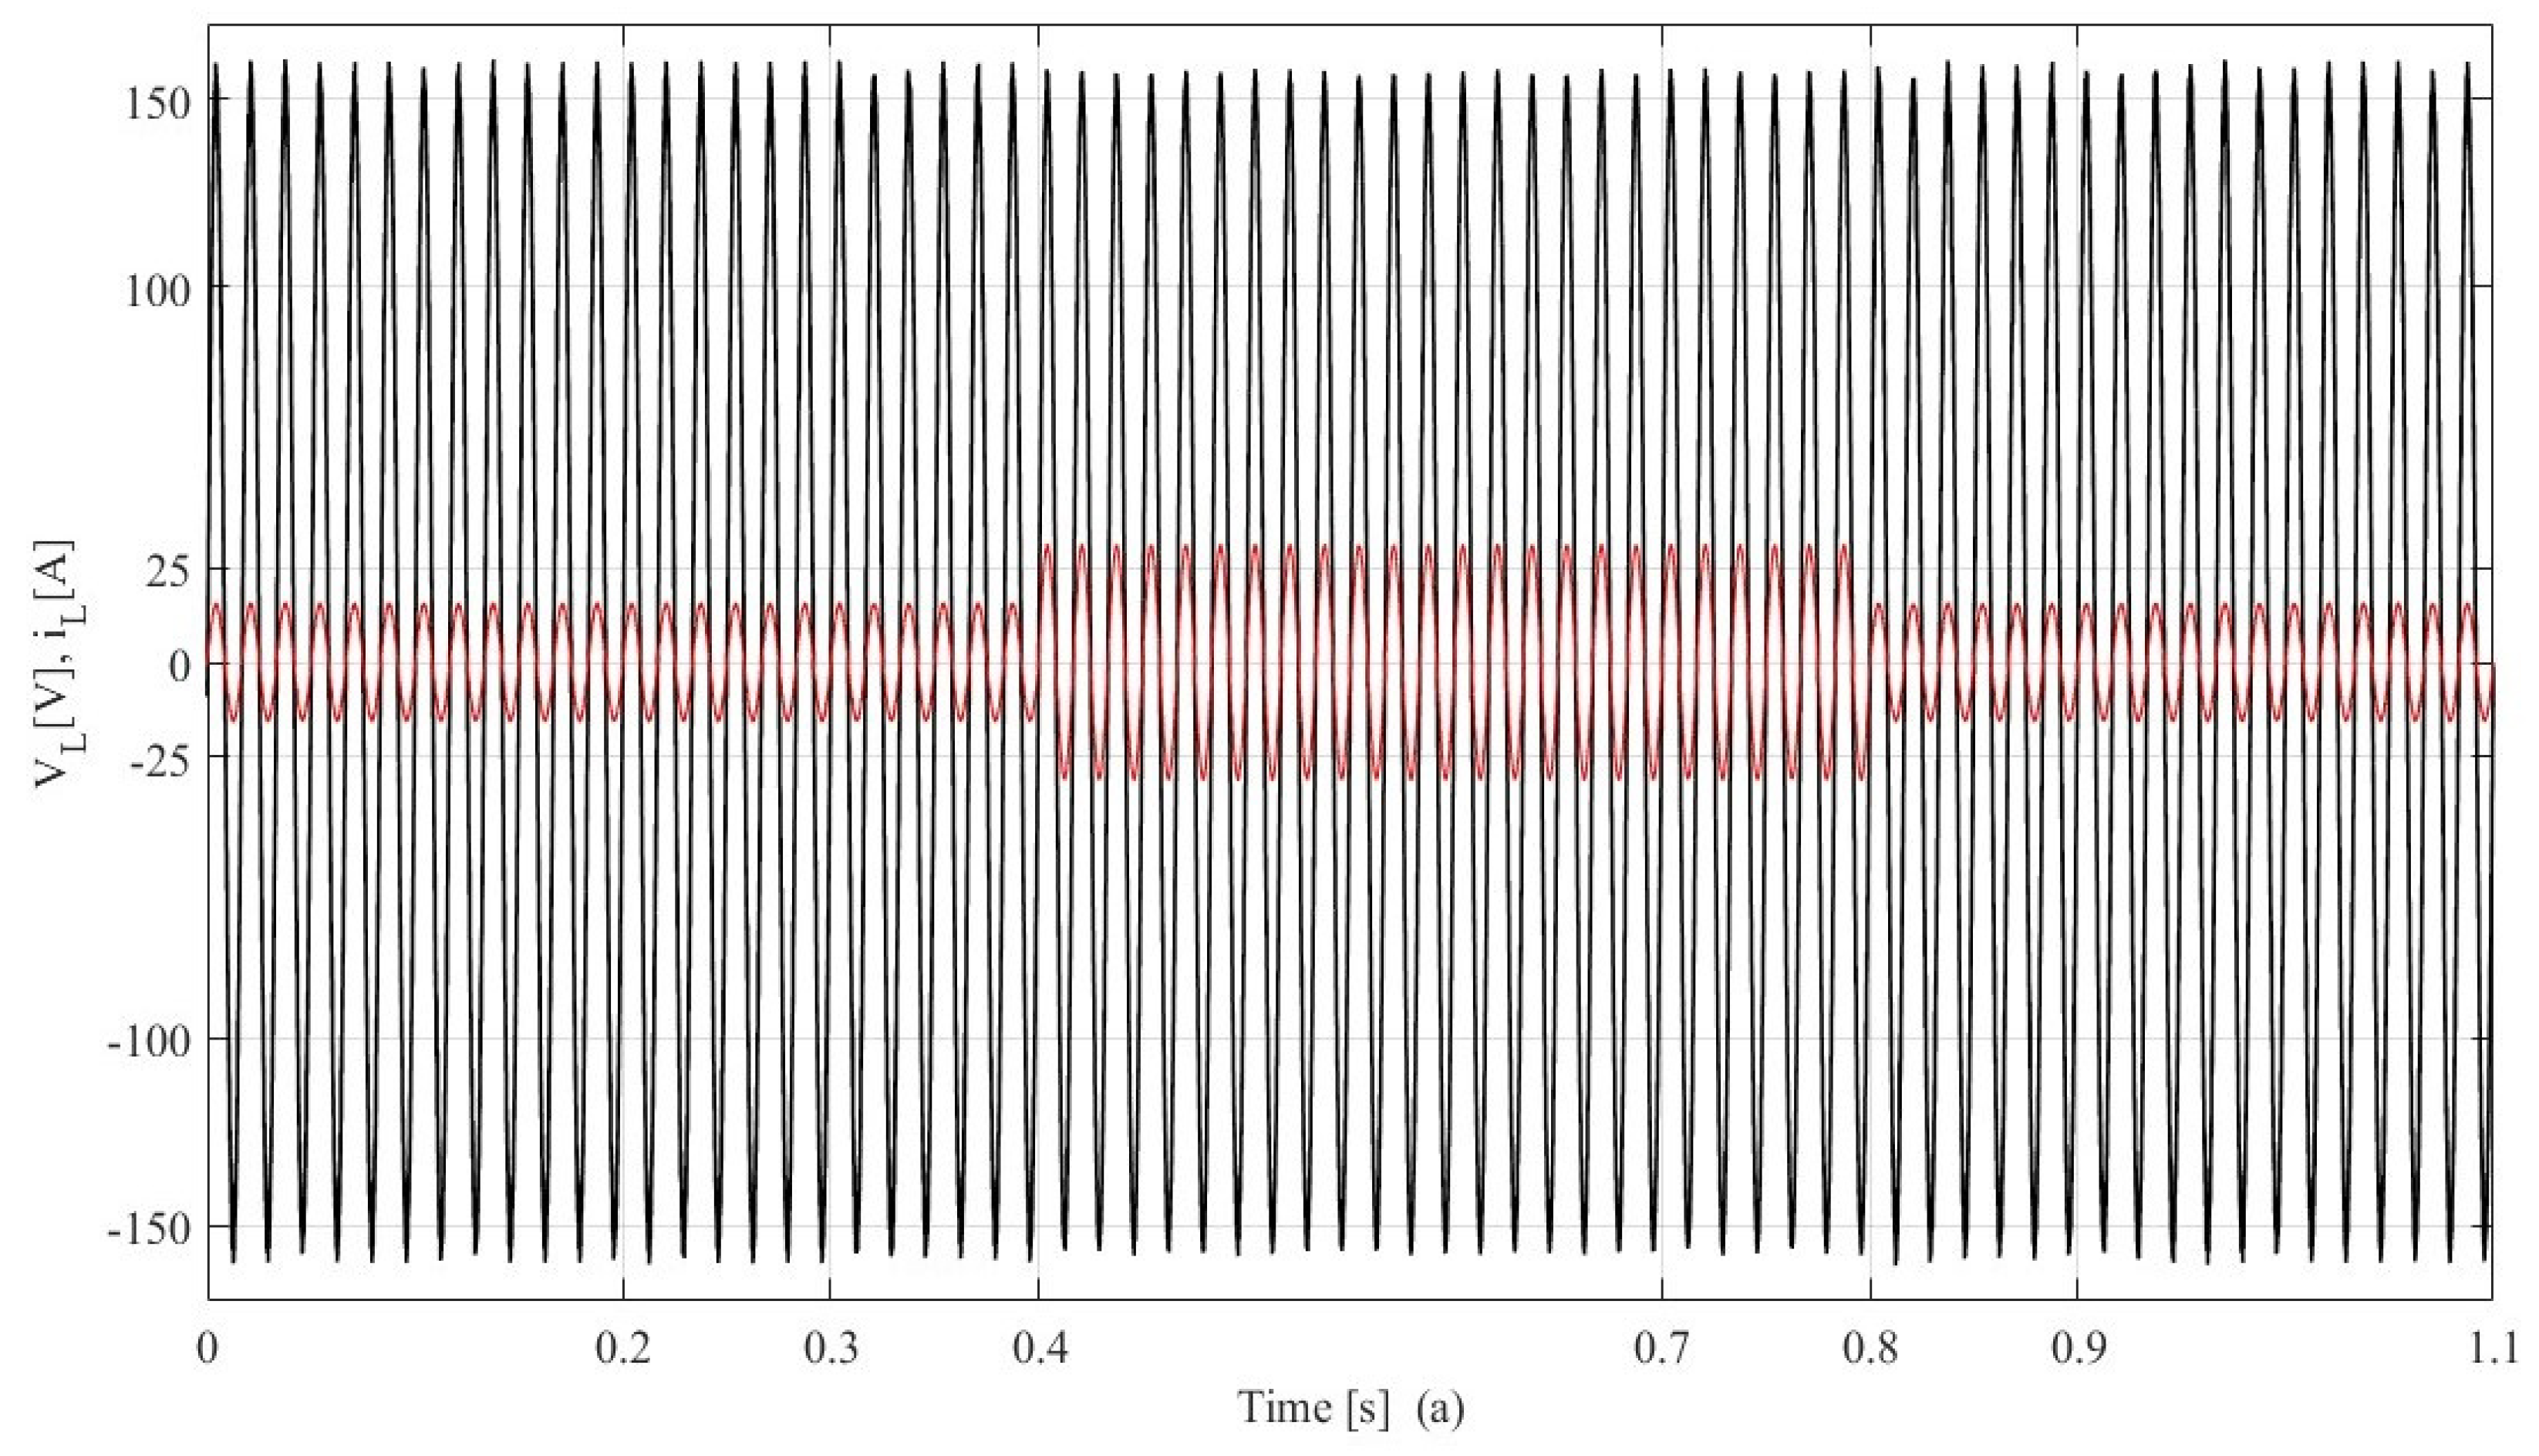
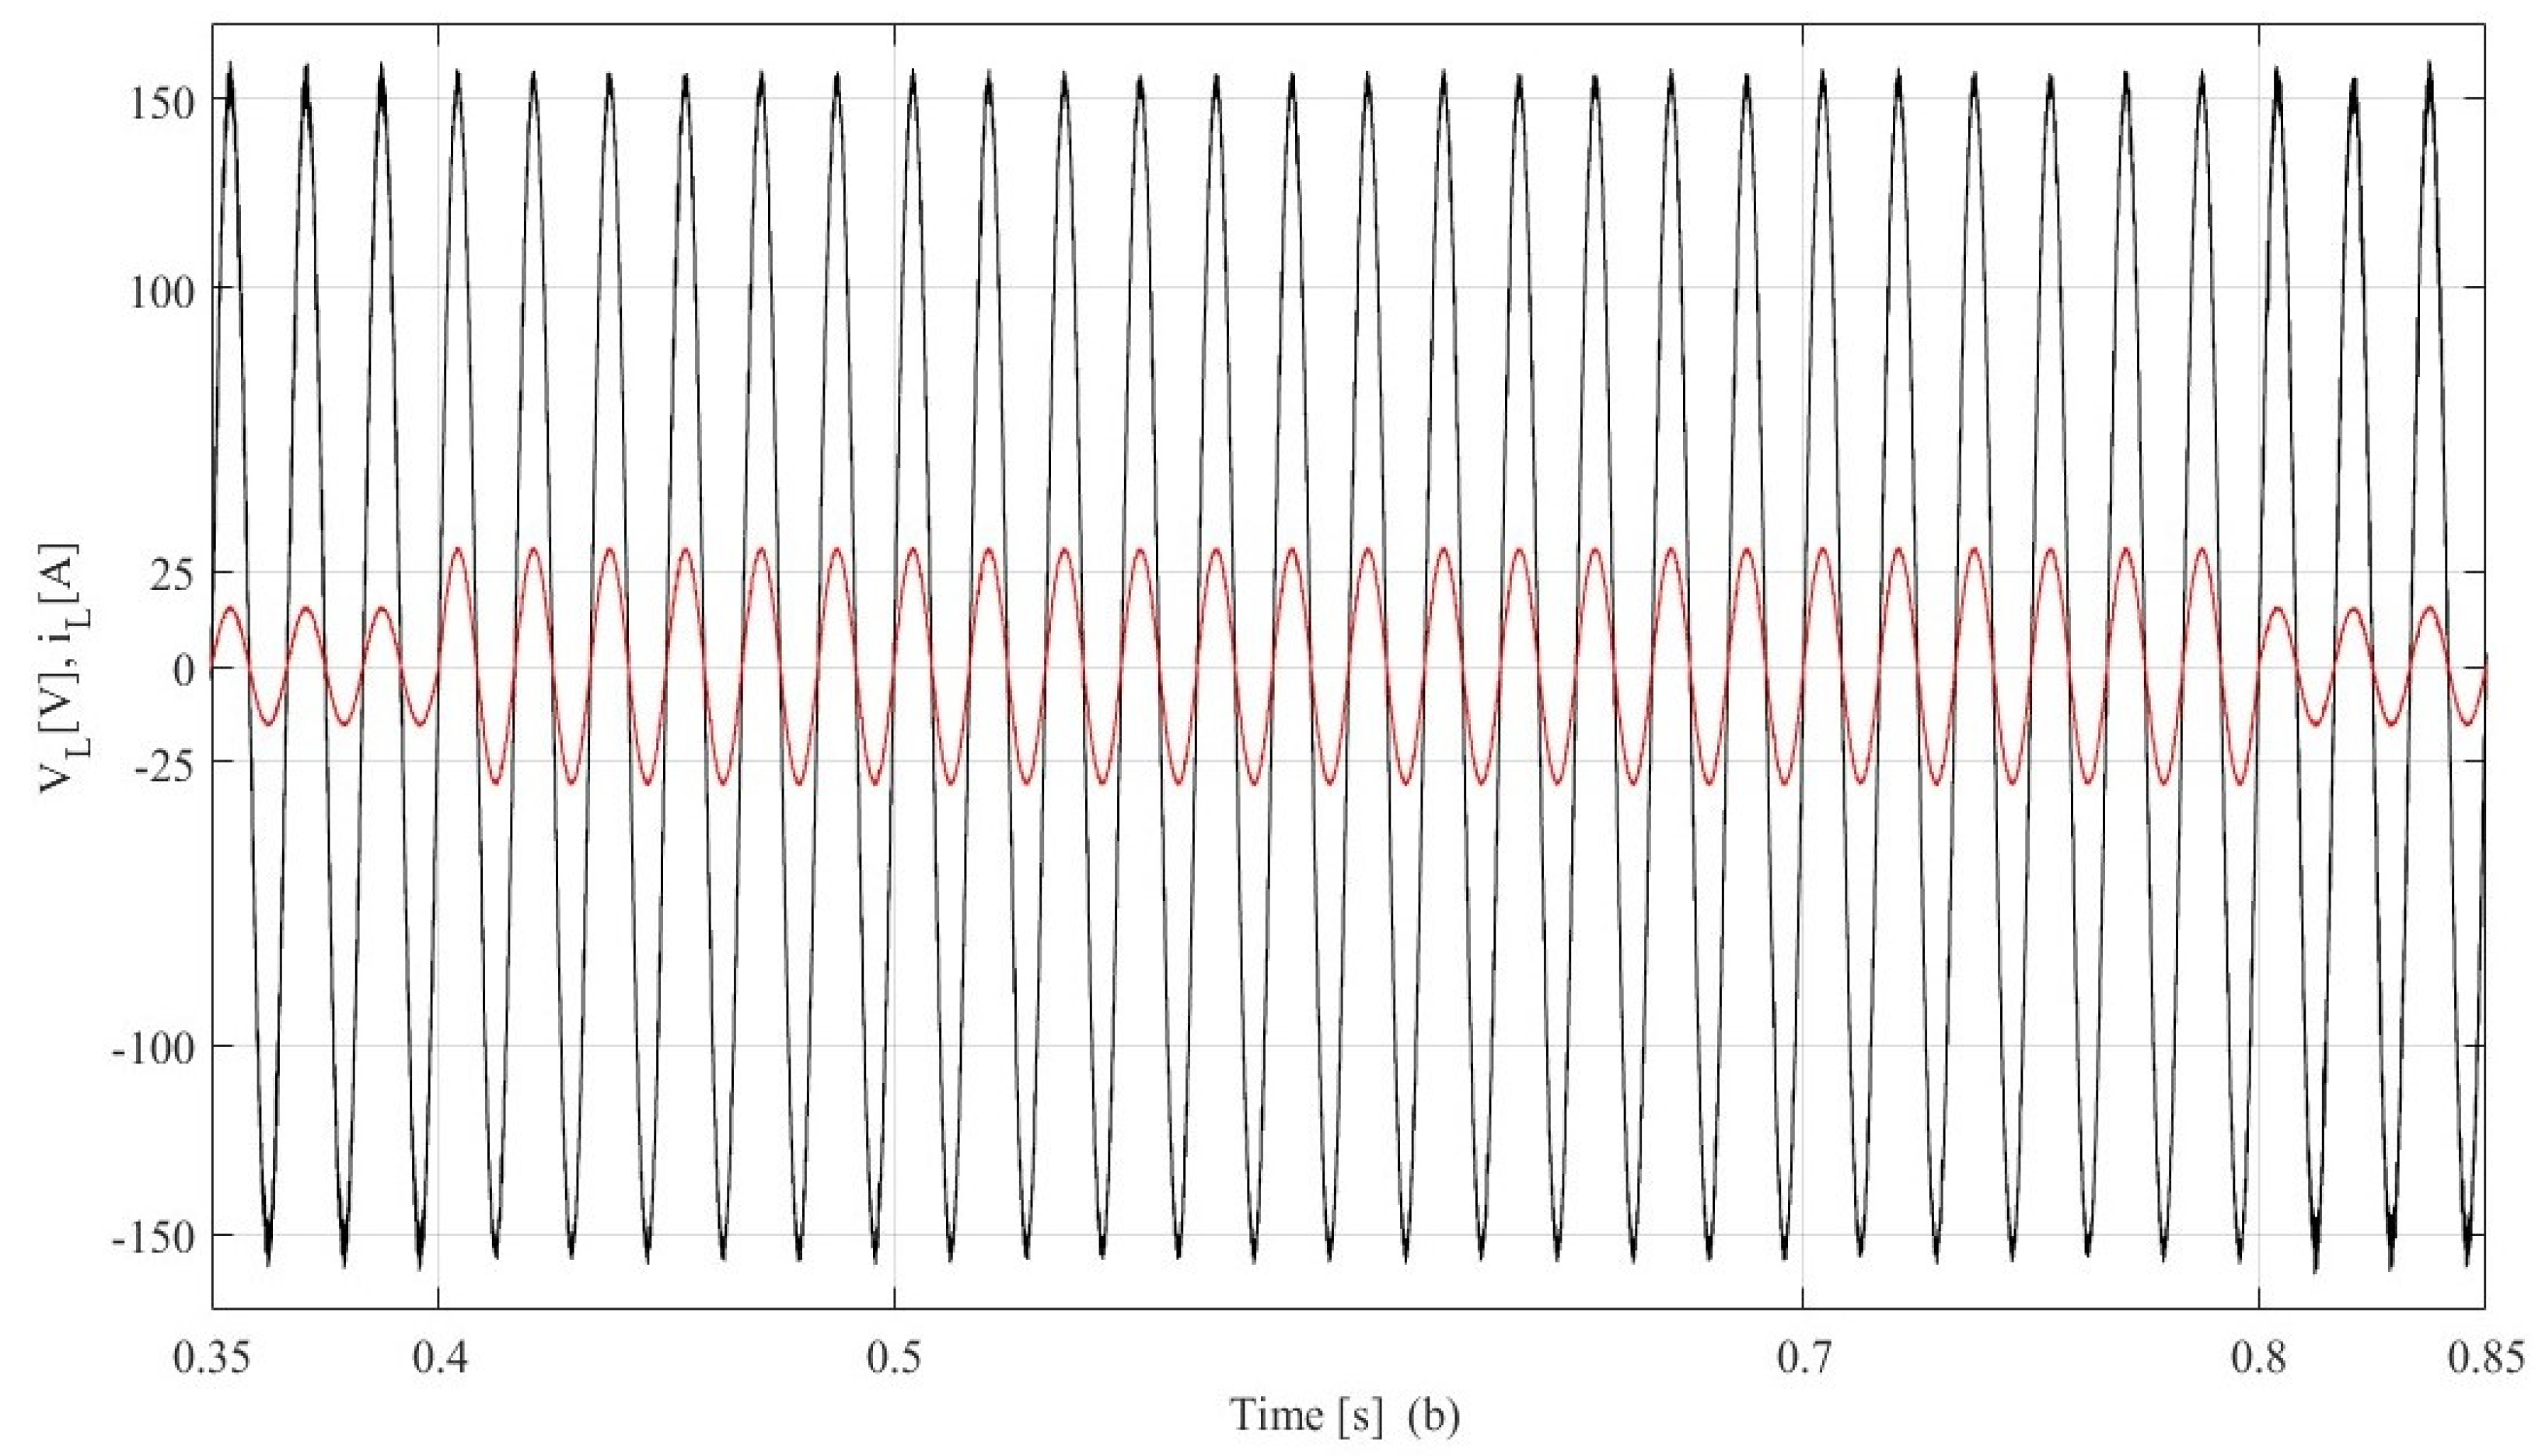
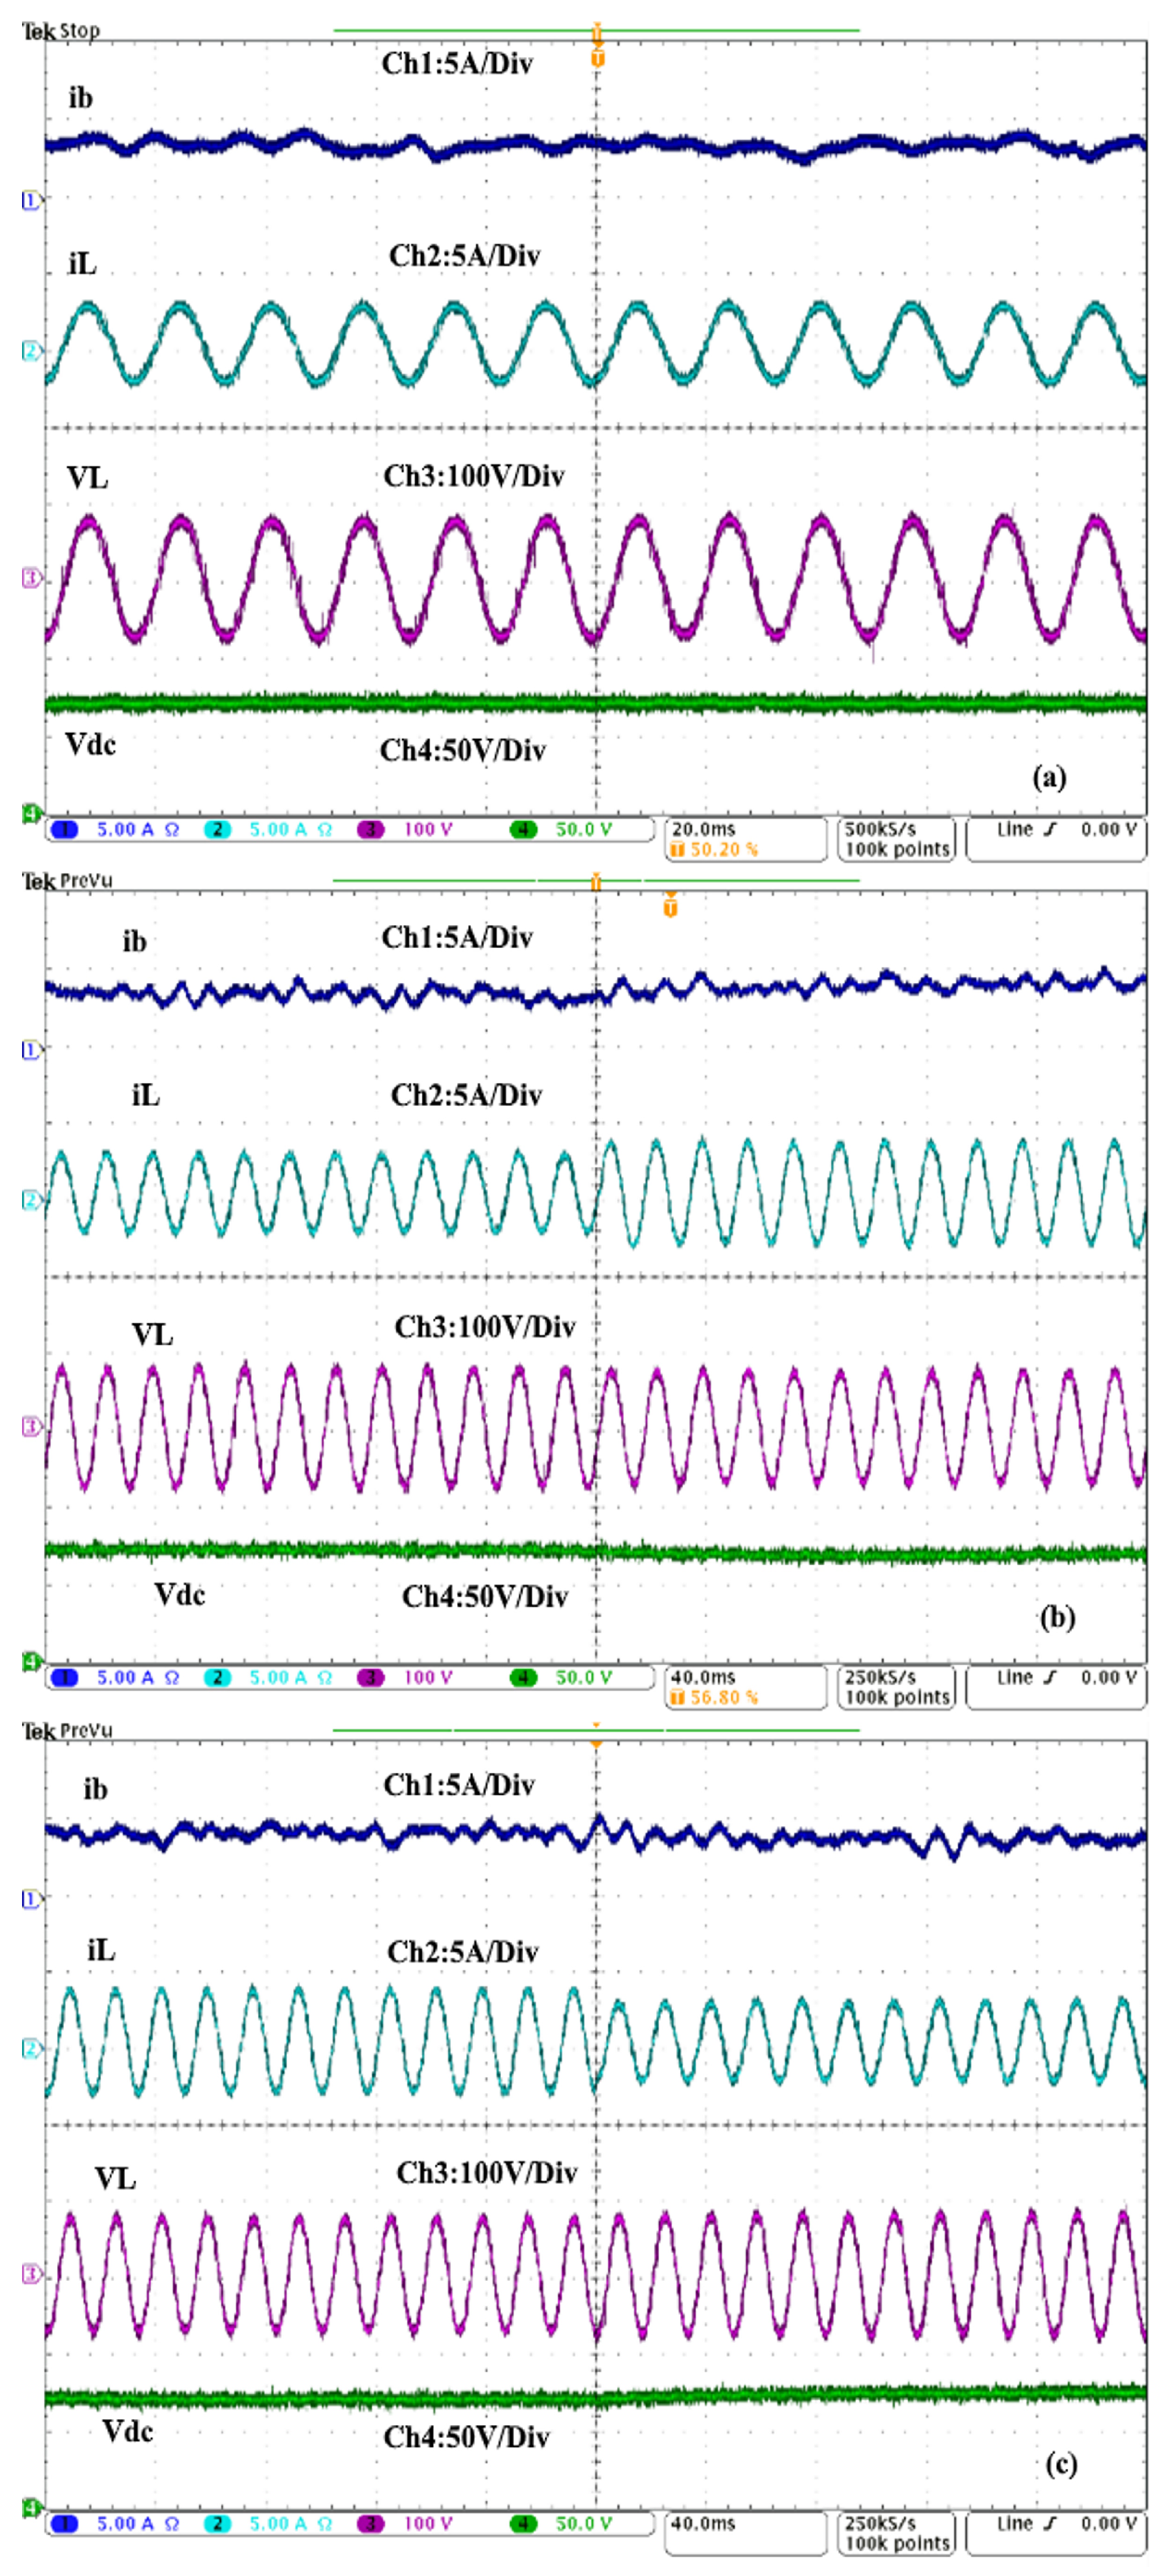
4.1. Load-Side Performance Analysis

In Figure 10a, the waveforms of the PCC voltage ( v L ), and load current ( i L ), are demonstrated. The zoom of v L and i L from t = 0.35 s and t = 0.85 s is demonstrated in Figure 10b. The developed cascade control based on LADRC with LESO for the FBSPI is tested during a sudden increase at 0.4 s and a sudden decrease at 0.8 s. It is observed in Figure 10a,b that the load is fulfilled with a constant voltage and frequency. As a result, the PCC voltage is not affected in the presence of disturbances at 0.4 s and 0.8 s. It demonstrates that the d-q axis control strategy and its optimized parameters are reliable.
Figure 11 displays the measured DC current at the output of the TDB ( i W T ) and the dynamic performance of the rotor shaft torque ( T m ), voltage ( v s a ), and current ( i s a ) of phase ‘a’ of the PMBLDCG. To test the proposed concept of achieving good efficiency from WT without using any MPPT technique, the system is subjected to wind speed variations at times of 0.1 s, 0.3 s, 0.5 s, and 0.7 s. A slight variation in the voltage is observed, but the current increases as the torque varies.
The generated currents from WT for all mechanical torques, at all wind speeds, are similar to those generated from P&O for this same condition. This provides additional confirmation of the advantages of connecting the PMBLDCG using a three-phase diode bridge to the DC bus and maintaining constant DC-link voltage.

4.2. DC Side Performance Analysis

Figure 12 illustrates the waveforms of the DC-link voltage ( V d c ) and its reference ( V d c ), the battery current ( i b ) and its reference ( i b ), and the output PV current ( i P V ). Tests are performed to evaluate the behavior of the proposed concept to achieve high performance from the PVs without using a tracking technique for the selected conditions as an ambient temperature of 25 °C at t = 0.3 s and t = 0.7 s. One see clearly that the output PVs current varies with the variation of the solar irradiation. One observes that, using the proposed concept, the efficiency decreases at a lower solar radiation (800 W/m2 and 500 W/m2), though it remains similar for high solar radiation (100 W/m2). During changes in solar irradiation at 0.33 s, 0.51 s, 0.57 s, and 0.7 s, and in changing wind speeds at 0.1 s, 0.33 s, 0.5 s, and 0.7 s, as well as in increasing and decreasing load at 0.4 s and 0.8 s, the DC-link voltage and battery current follow their references with a zero steady-state error and limited transient response during solar irradiation and wind speed change. One observes also that oscillations are less than 4%. As one can see, the battery balances the power by discharging from t = 0 to t = 0.2 s when PVs and WT generate less power, becoming zero from 0.2 to 0.3 s when the power delivered by WT and PVs equals the load demand. With increased solar radiation and wind speed, the battery begins charging in about 0.3 s to 1.1 s. While observing all these disturbances, it can be seen that the DC-link voltage is not affected and remains constant. The steady-state error confirms that the LADRC with the LESO in outer and inner control loops performs well.

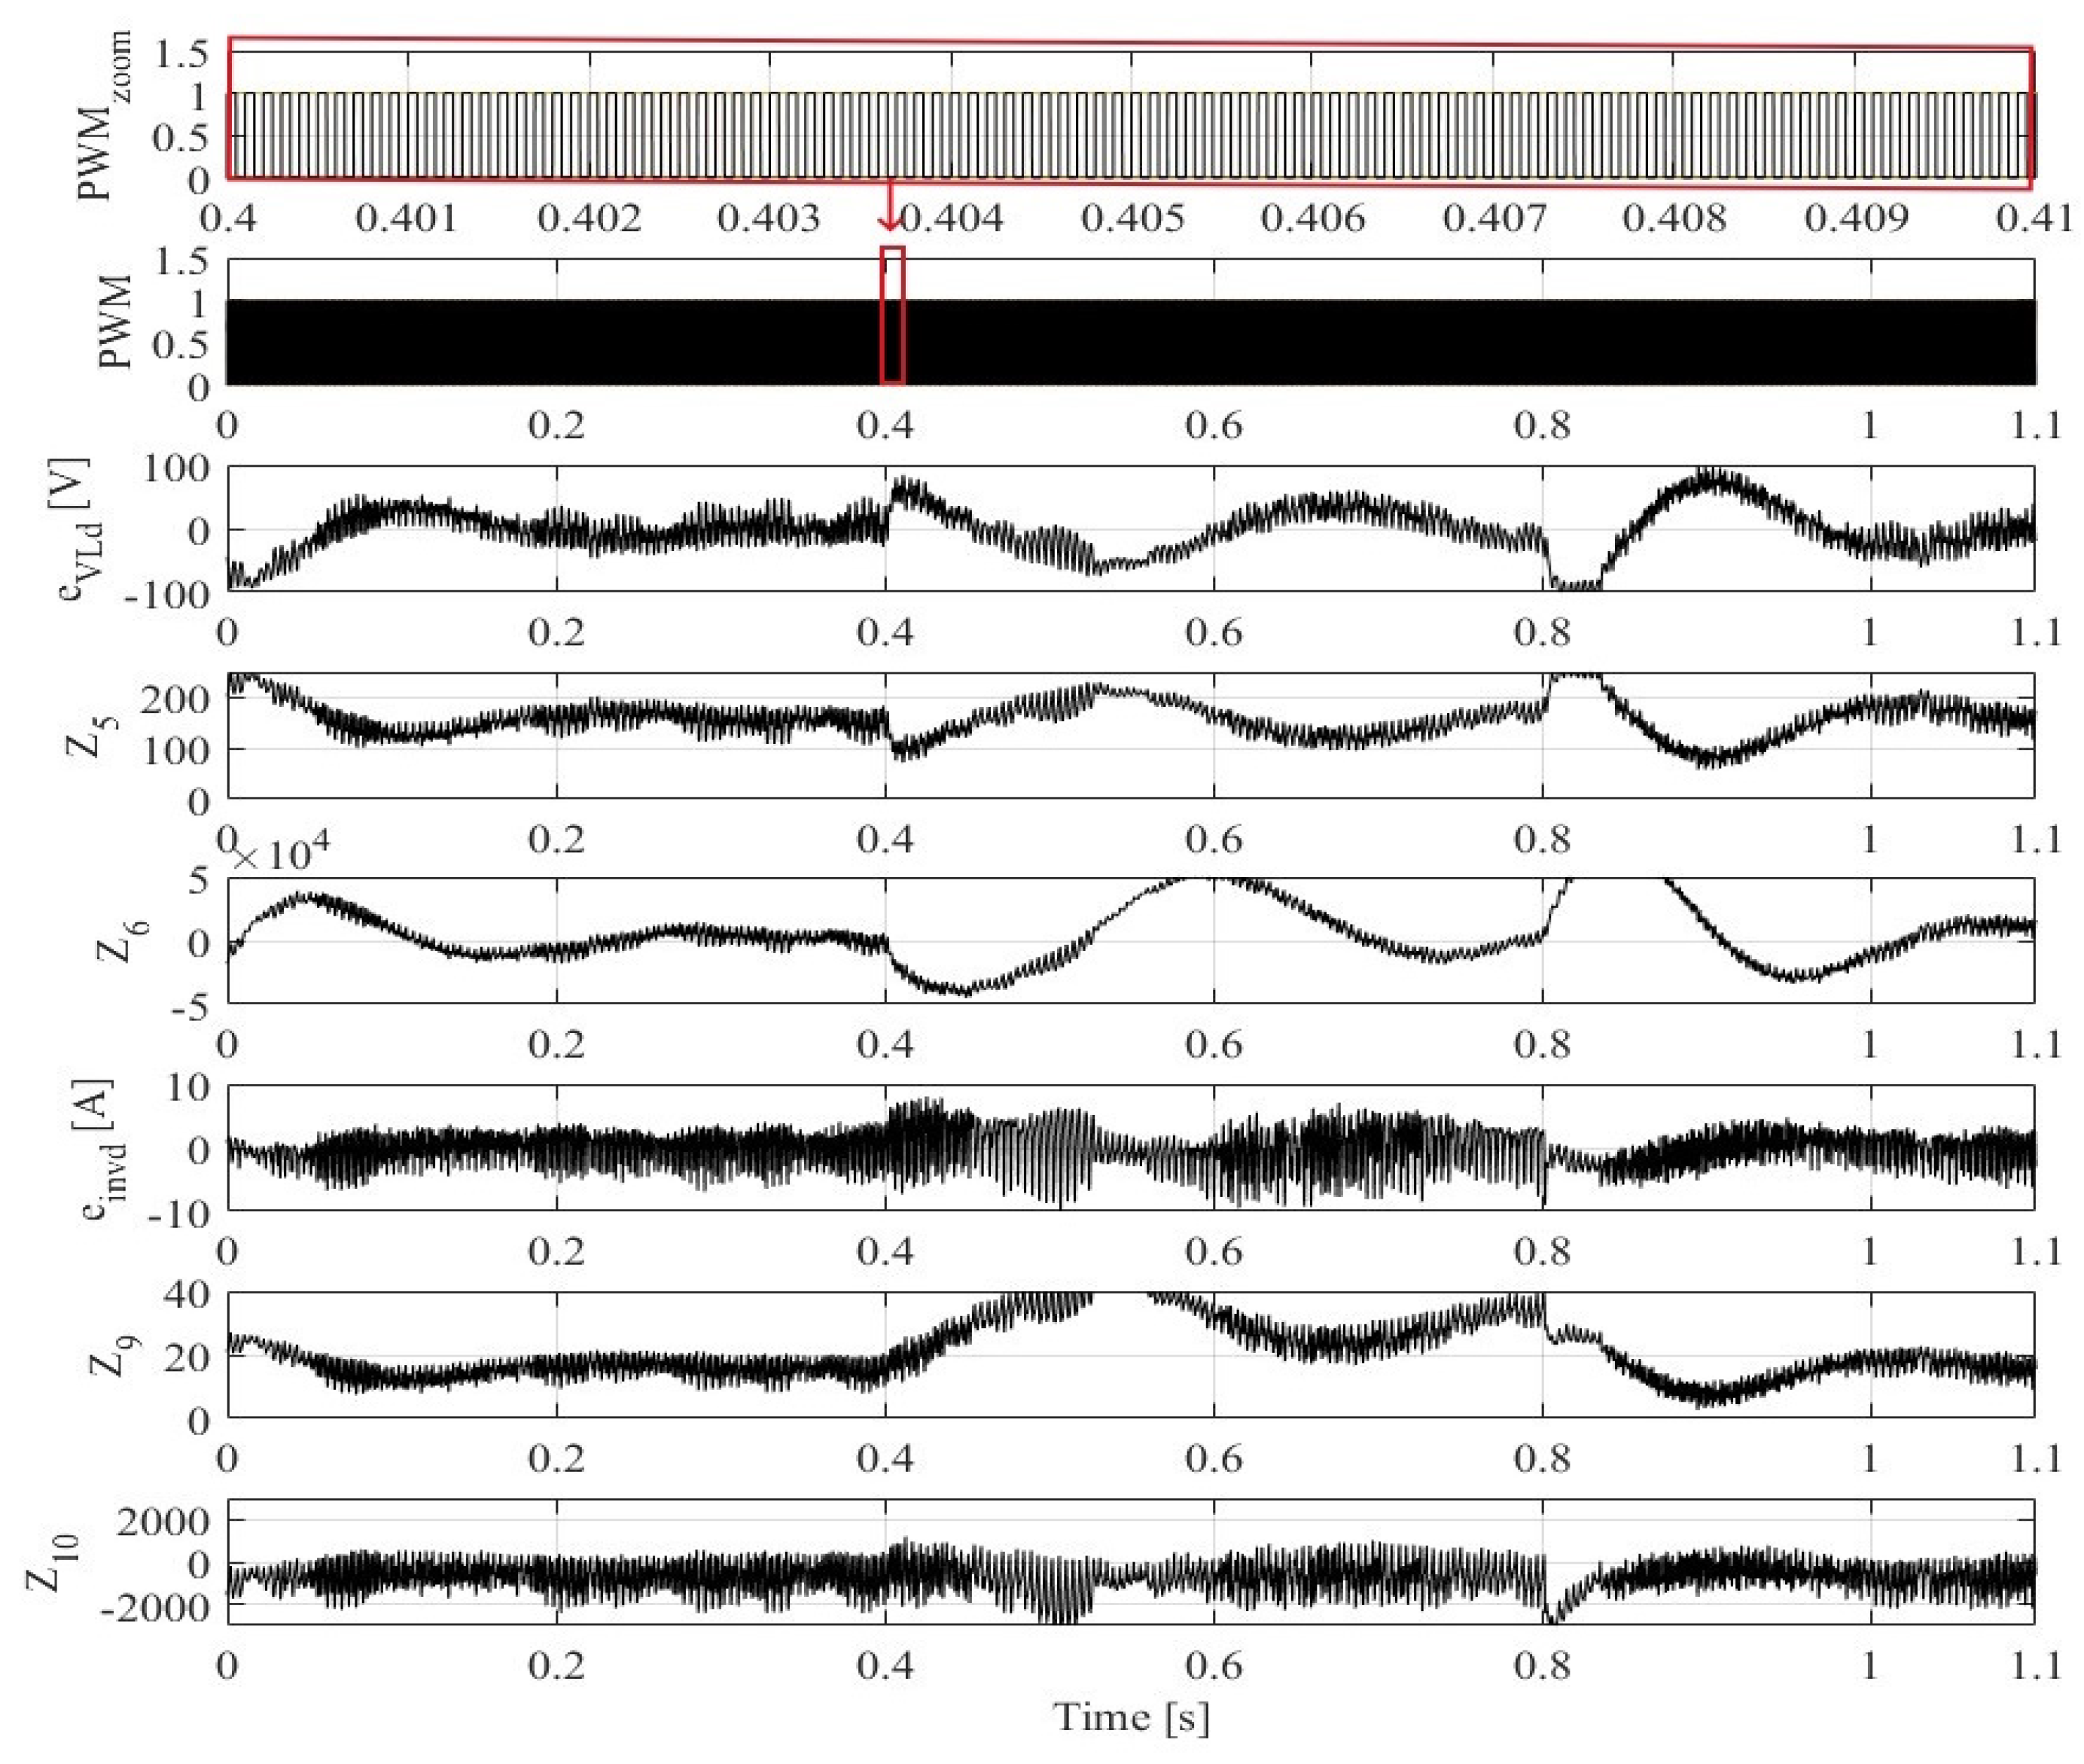
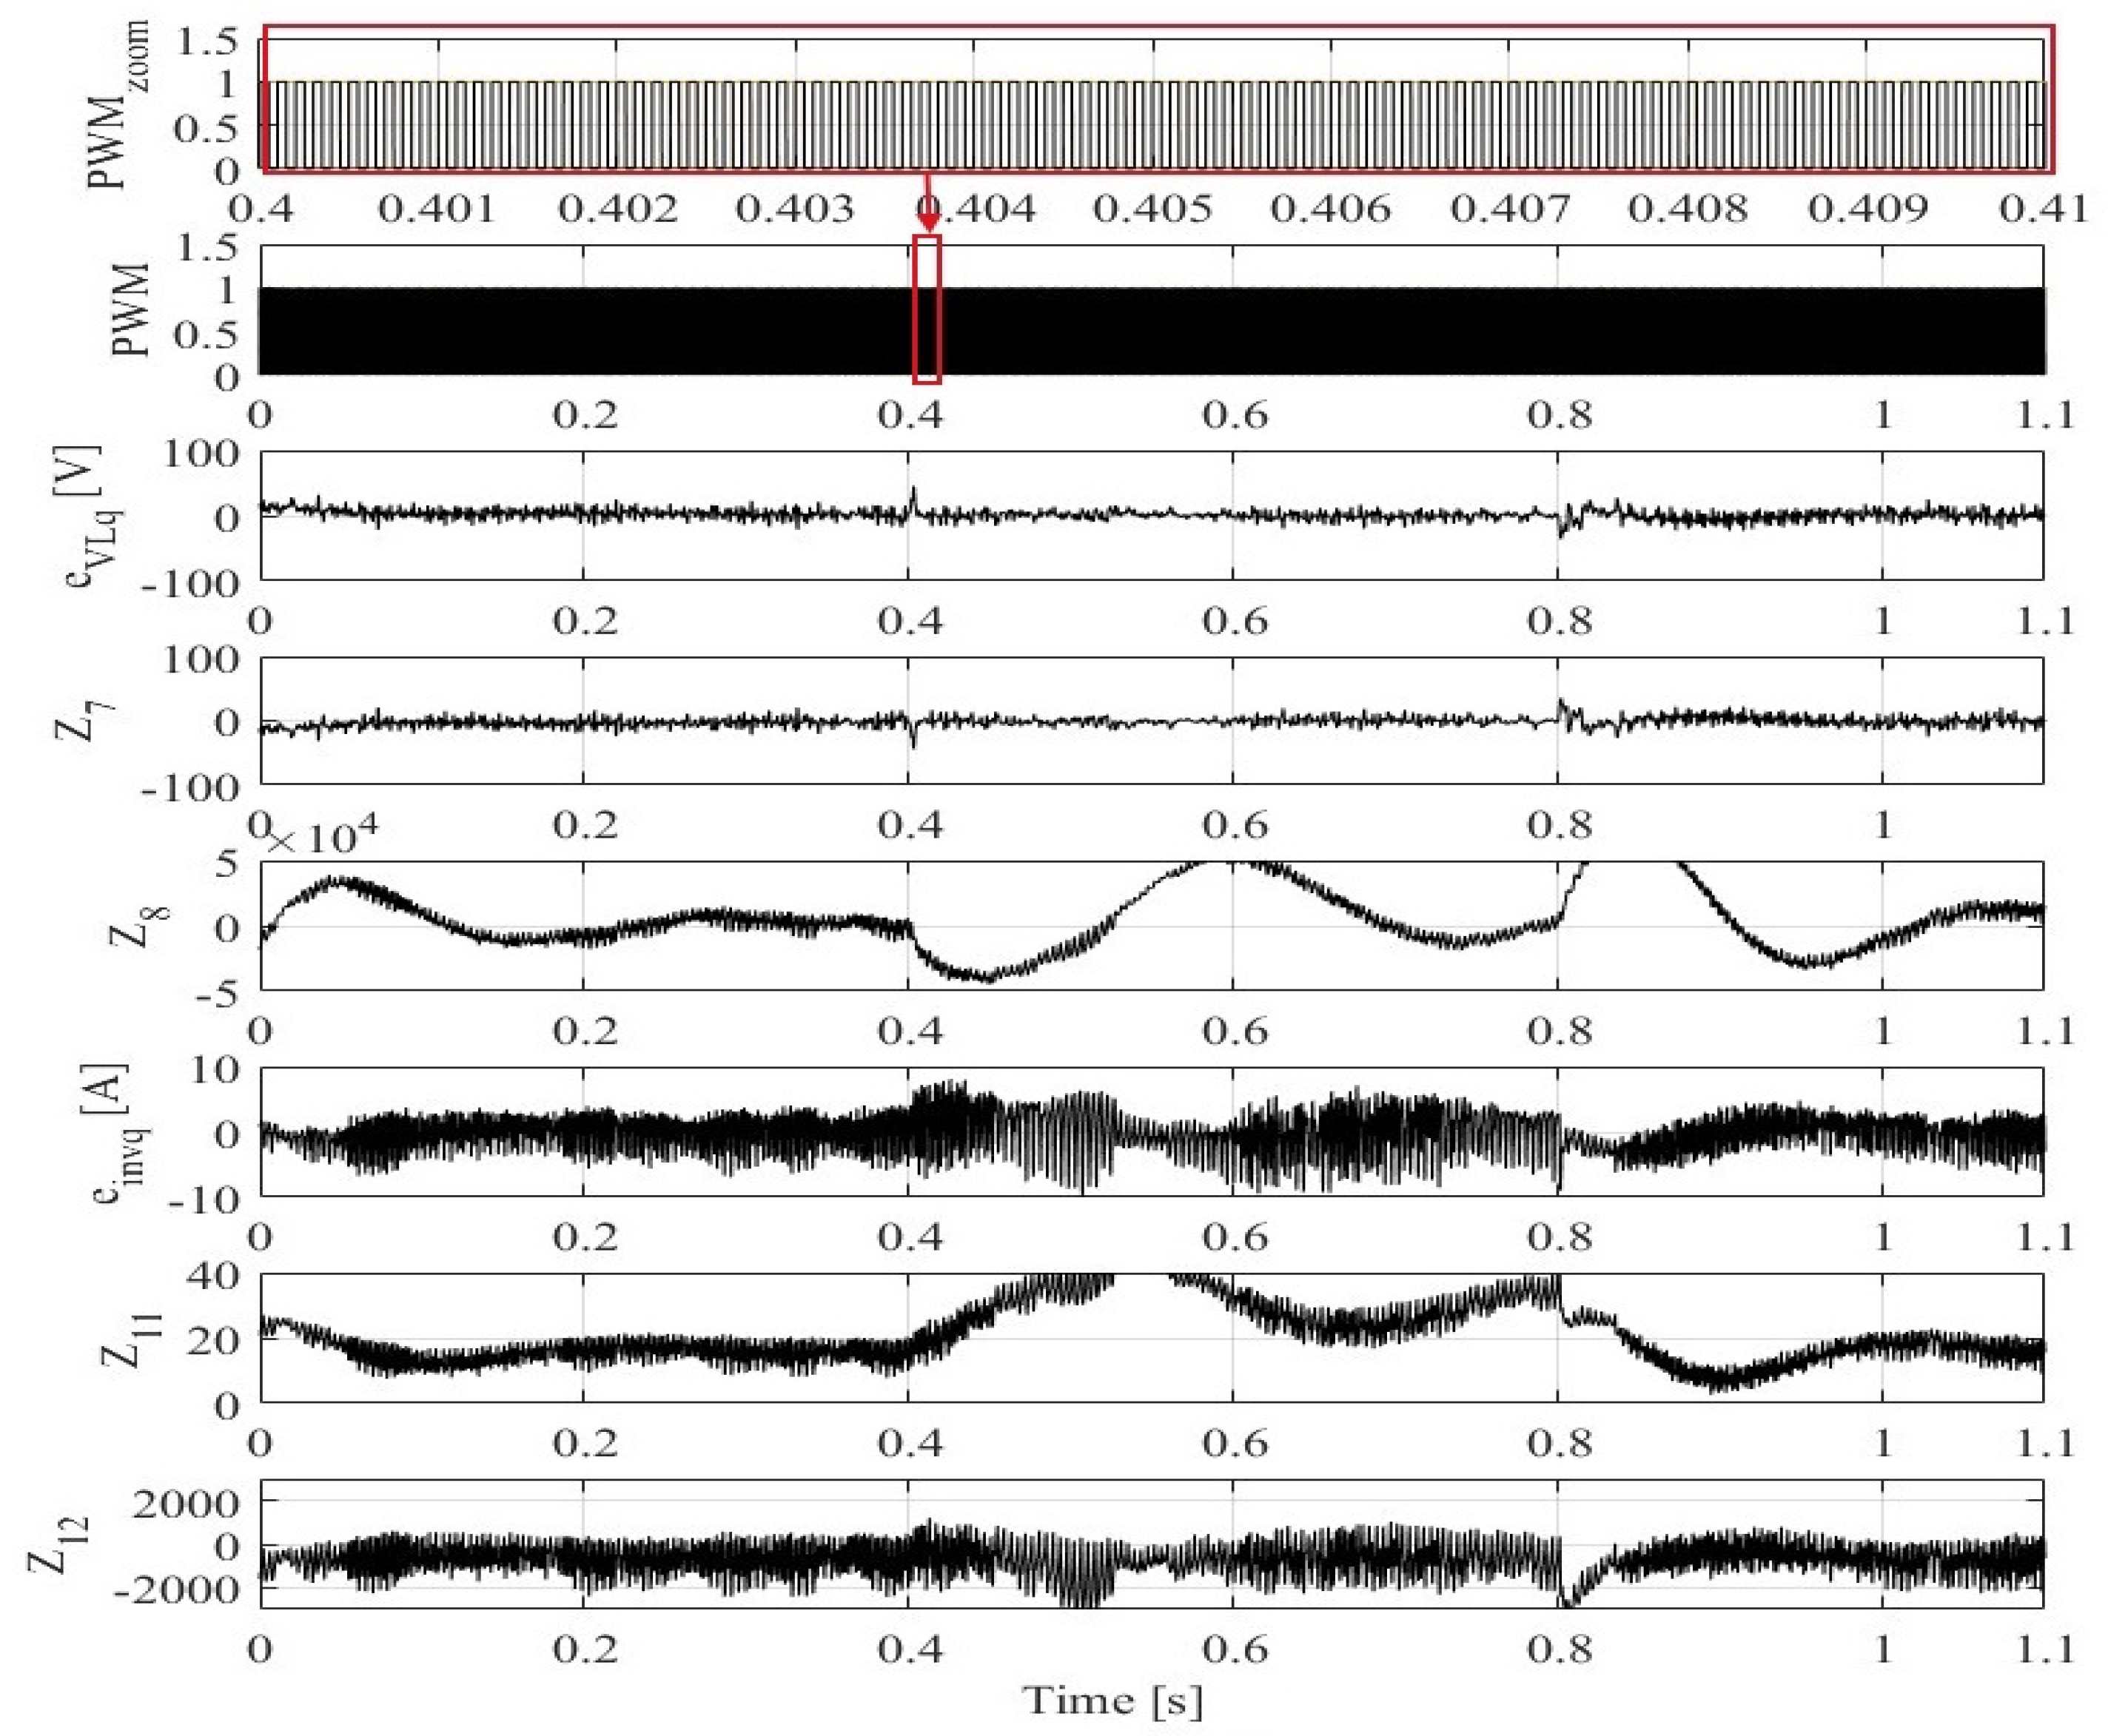
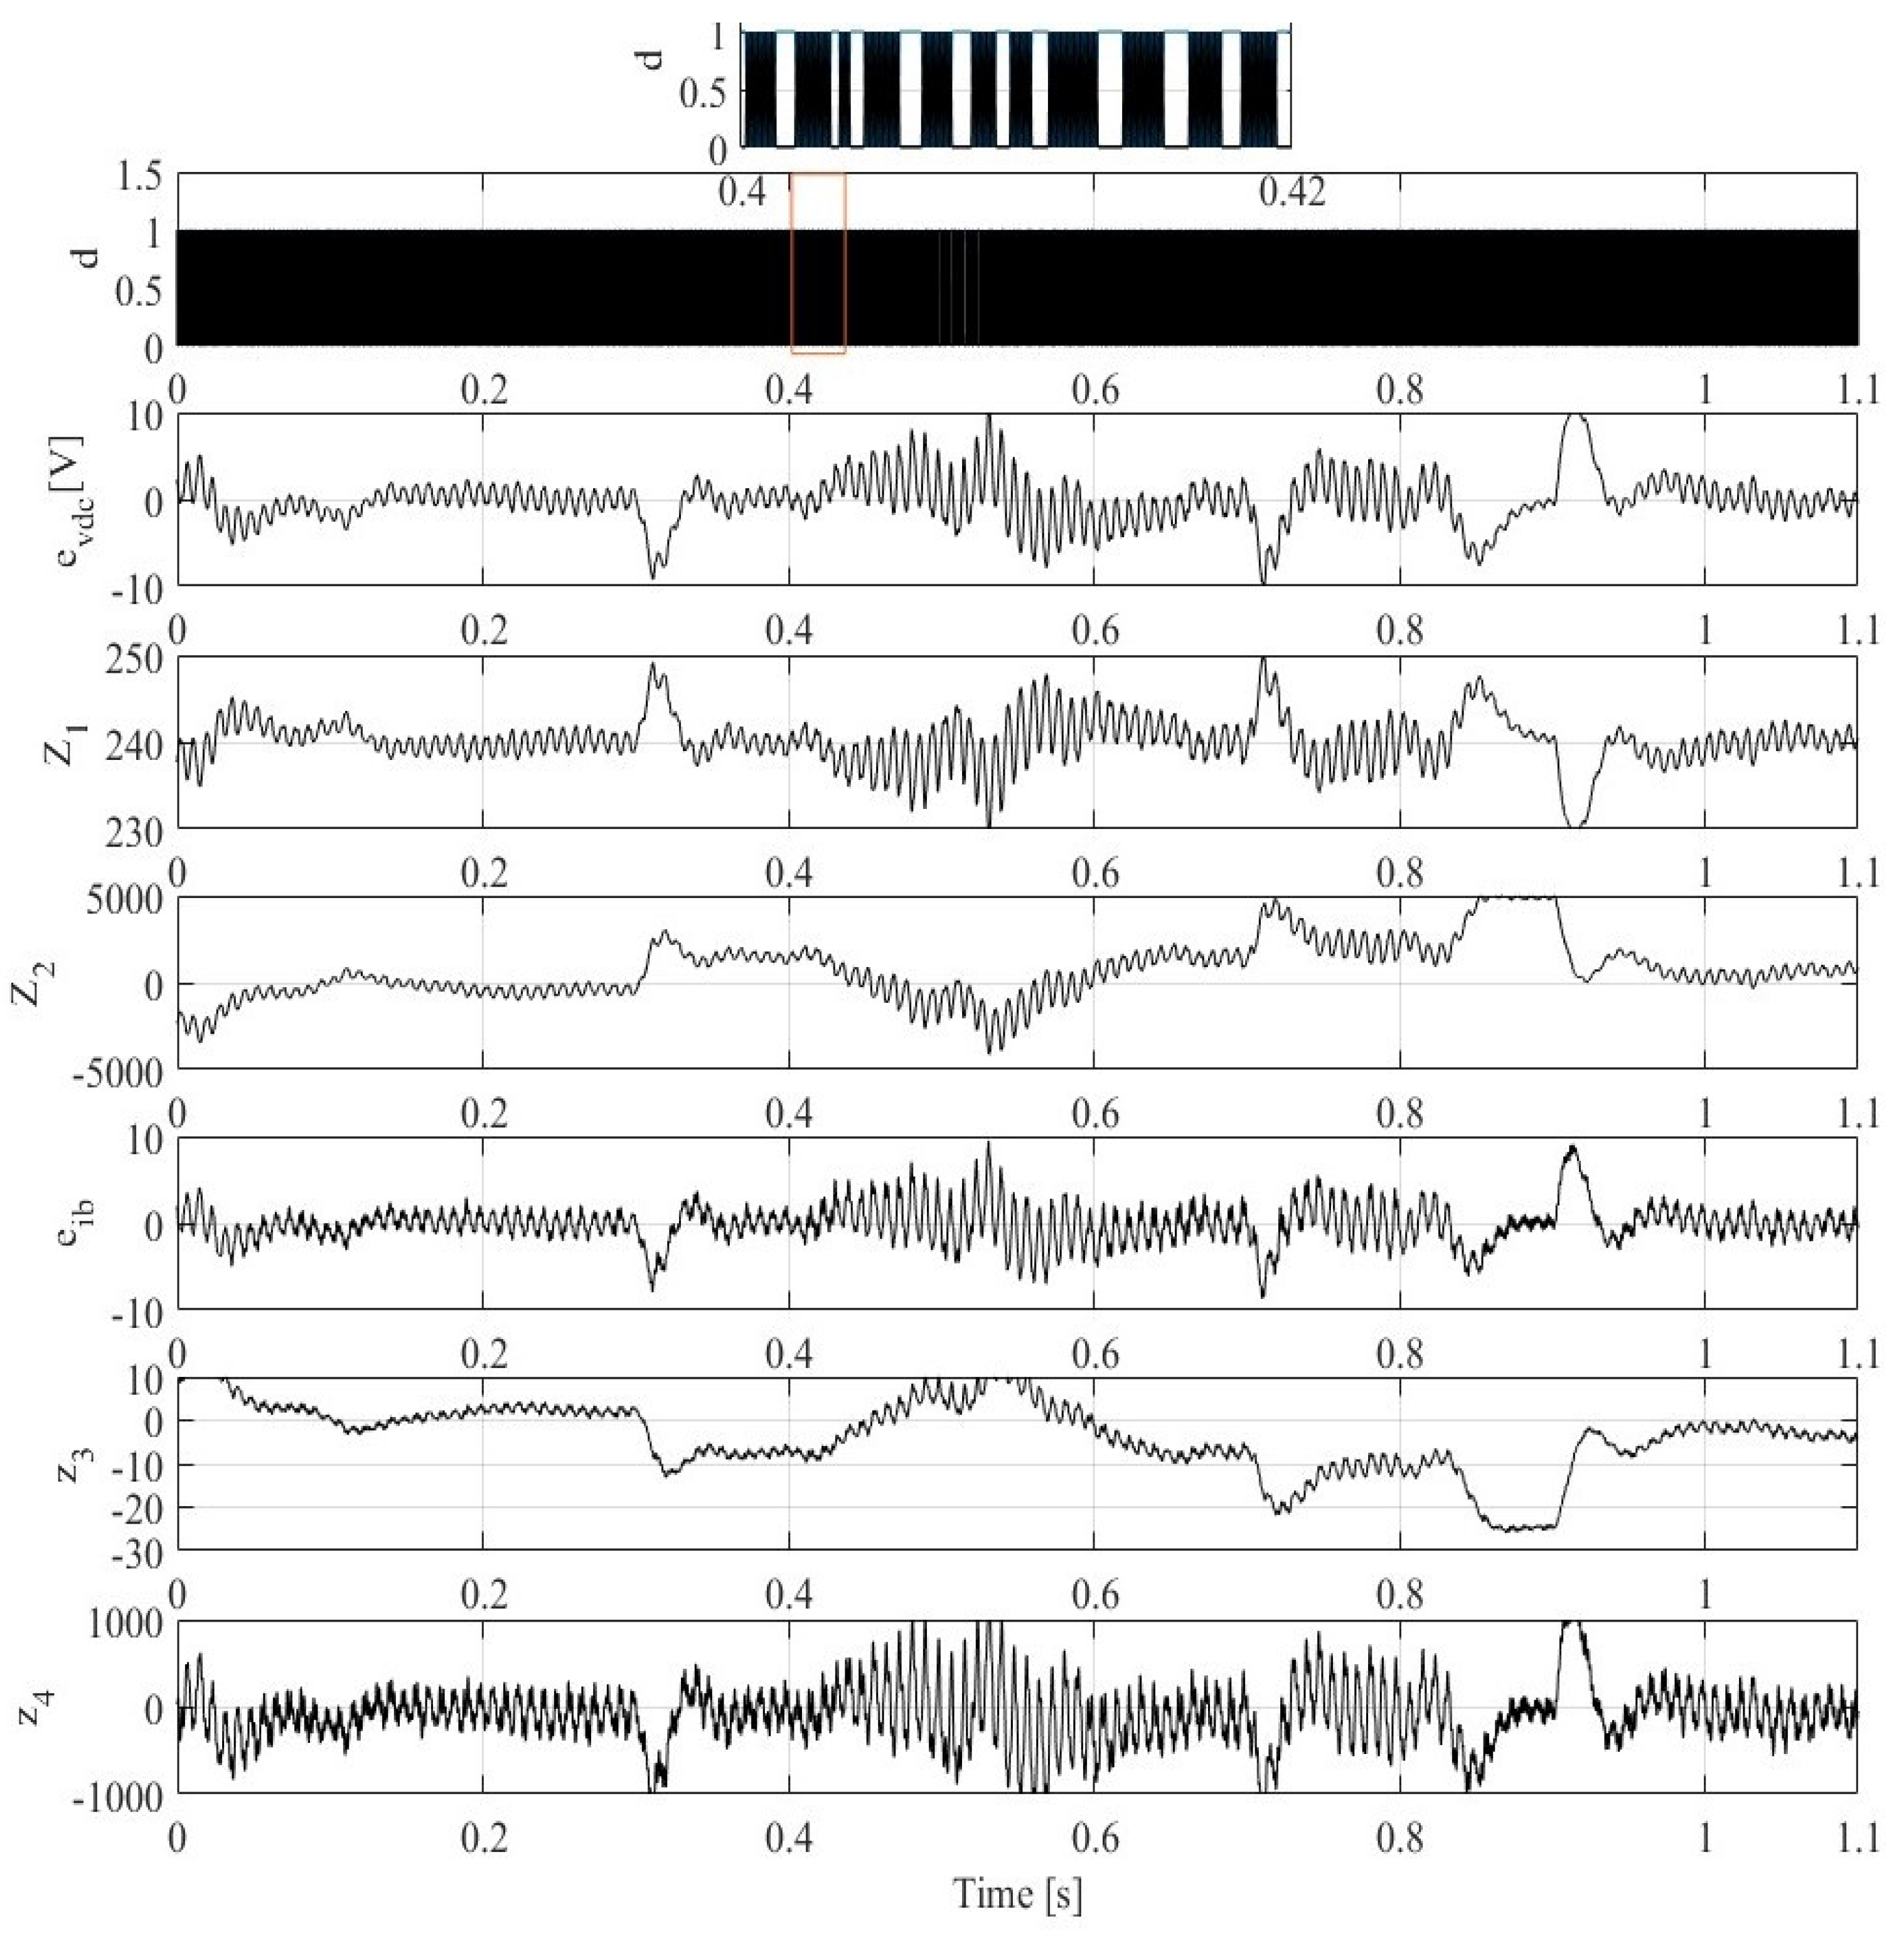
4.3. Performance of LADRC with LESO under the Presence of All Operation Conditions

Figure 13 displays the internal behavior of the LADRC controllers with LESO, showcasing various signals such as the DC-link voltage error ( e V d c ), its tracking signal ( Z 1 ), and the estimated disturbance ( Z 2 ) generated by the LESO of the outer control loop. Additionally, it presents the battery current error ( e i b ), its tracking signal ( Z 3 ), and the estimated disturbance ( Z 4 ) generated by the LESO of the inner control loop. Notably, errors in the DC-link voltage and battery current are effectively minimized, with minimal overshoot observed at 0.3 s and 0.9 s, respectively, attributed to sudden changes in operational conditions. The tracking signals in both control loops are consistently minimized across all operating conditions, without any time delay. Moreover, both LADRC controllers demonstrate rapid tracking performance with acceptable overshoot, affirming the robustness of the controllers and the efficacy of their optimal parameter design.
Figure 14 illustrates the internal behavior of the LADRC controllers with LESO in the d-axis, depicting various signals including the load voltage error ( e V L d ), its tracking signal ( Z 5 ), and the estimated disturbance ( Z 7 ) generated by the LESO of the outer control loop. Additionally, it shows the inverter current error ( e i i n v d ), its tracking signal ( Z 9 ), and the estimated disturbance ( Z 10 ) generated by the LESO of the inner control loop. The tracking signals in both control loops are effectively minimized across all operating conditions without any time delay. This underscores the optimal design of the bandwidths of both LESOs, which efficiently suppresses noise in the load voltage and inverter current in the d-axis while ensuring sufficient estimation accuracy. This demonstrates that the proposed LADRC with LESO is robust against various operating conditions and can achieve higher control accuracy.
Figure 15 provides insight into the internal behavior of the LADRC controllers with LESO in the q-axis, displaying various signals such as the load voltage error ( e V L q ), its tracking signal ( Z 5 ), and the estimated disturbance ( Z 7 ) generated by the LESO of the outer control loop. Additionally, it illustrates the inverter current error ( e i i n v d ), its tracking signal ( Z 9 ), and the estimated disturbance ( Z 10 ) generated by the LESO of the inner control loop. Across all operating conditions, it is apparent that the tracking signals in both control loops are effectively minimized without any time delay, which validates the optimal design of the controllers’ and observers parameters.

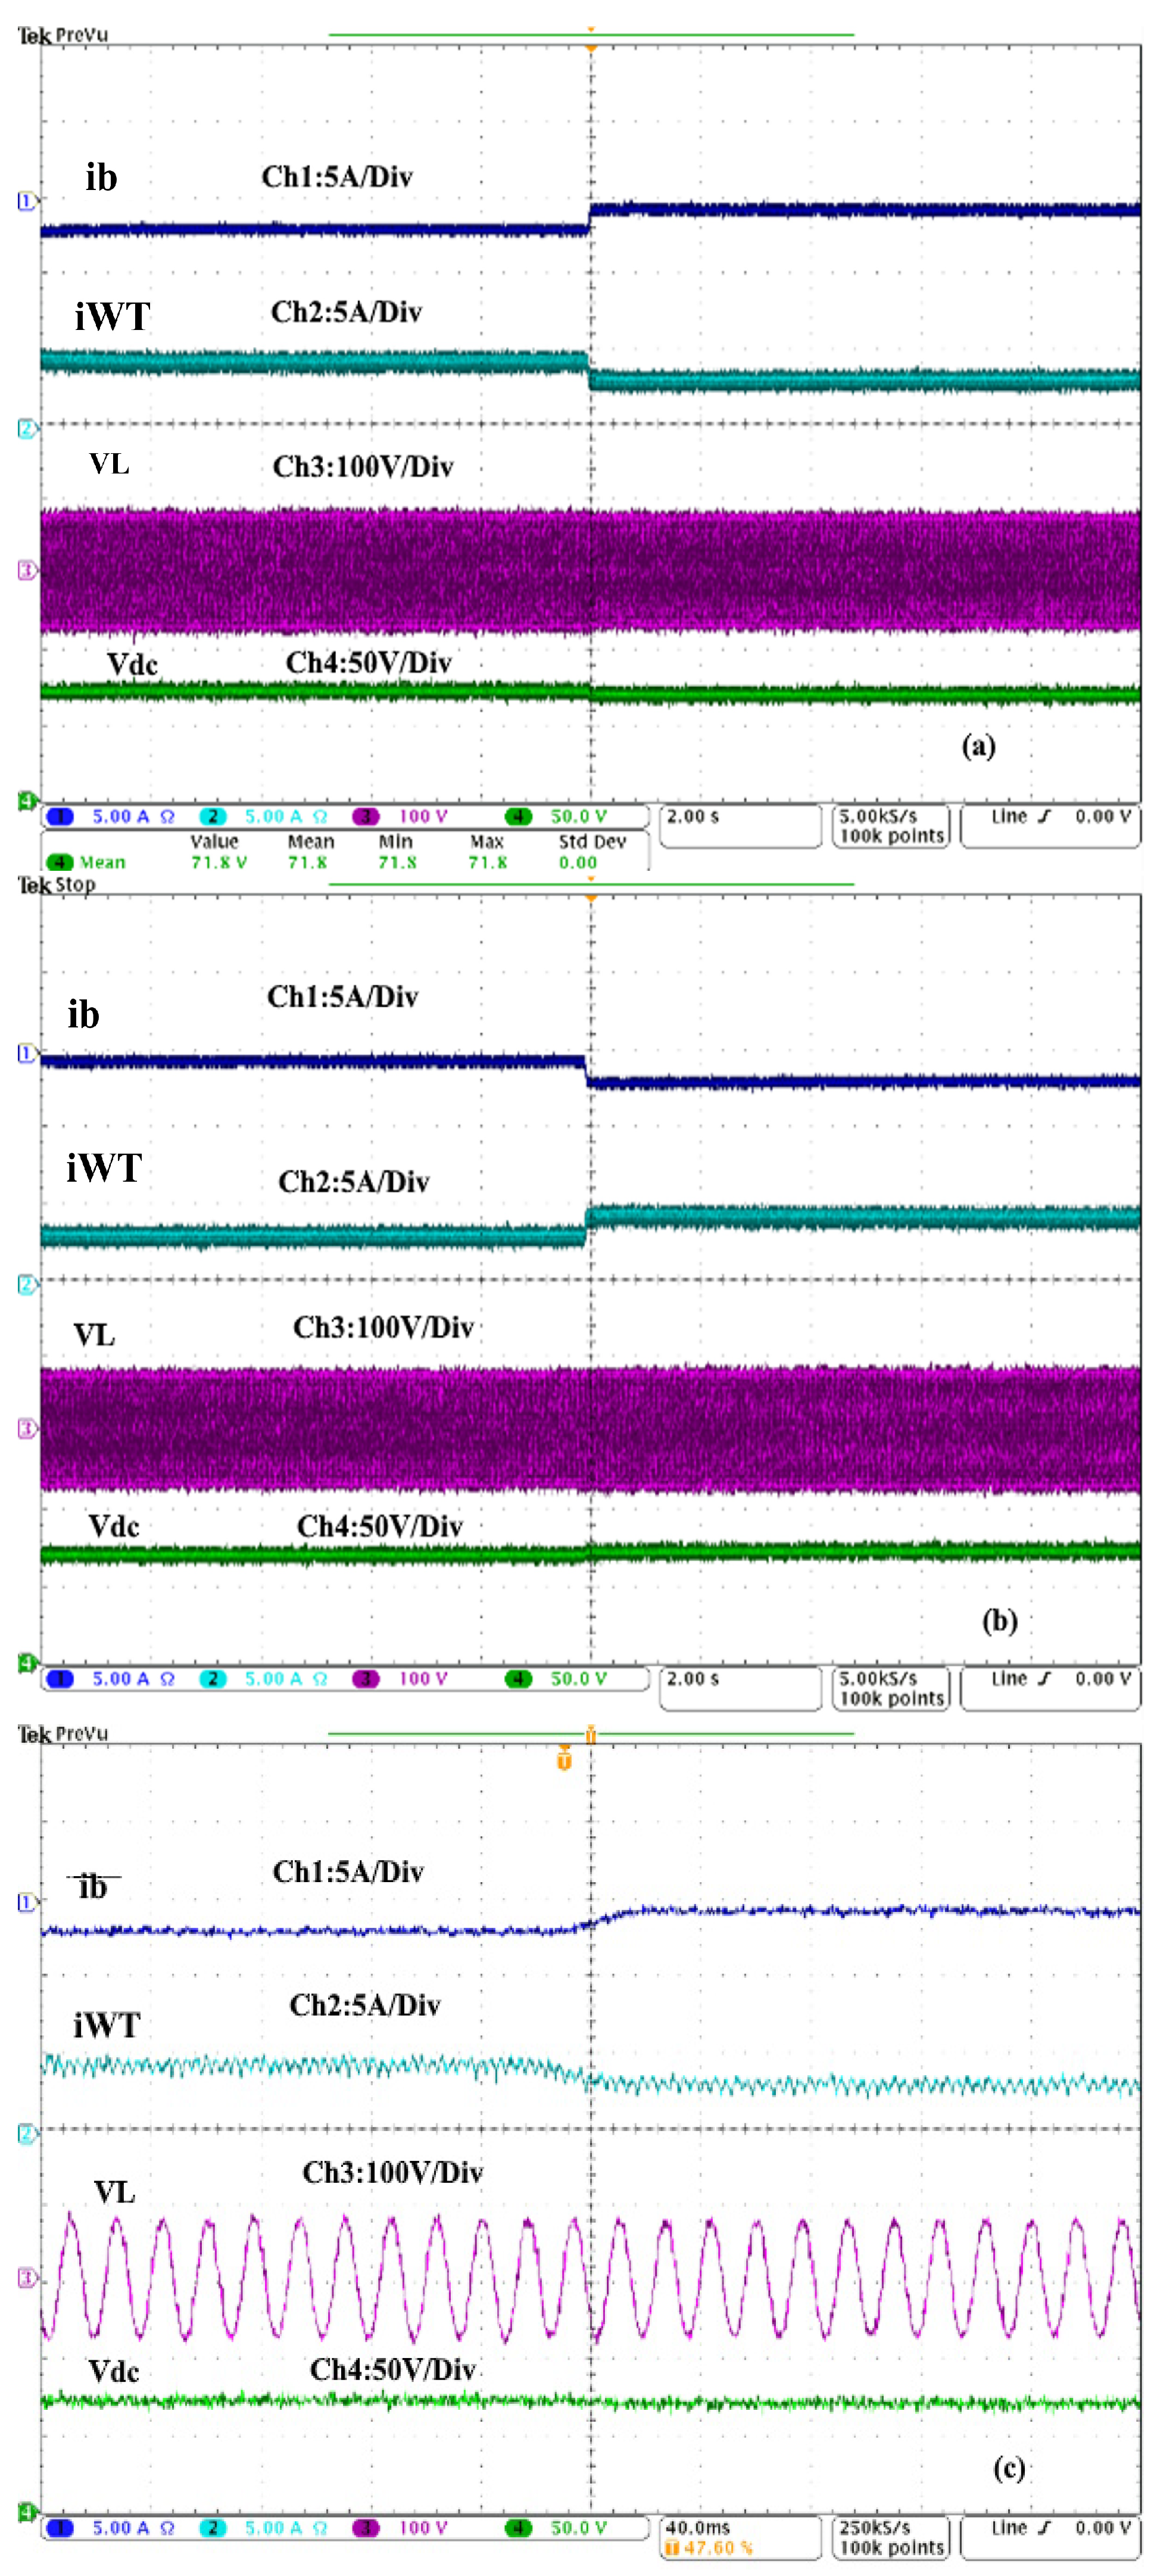
4.4. Performance Analysis under Steady-State and Load Variation in the Non-Existence of the Solar Irradiation and Wind Speed

Figure 16a–c show the performance of battery current ( i b ), load current ( i L ), PCC voltage ( v L ), and DC-link voltage ( V d c ). In this test, solar irradiation and wind speed are not available. As can be seen in Figure 16a, the load is powered with constant voltage and frequency, and the DC-link voltages are well regulated. In Figure 16b,c, the system is subjected to a sudden increase in demand and a sudden decrease in demand within 0.2 s. It is observed that the DC-link voltage and PCC voltage are kept constant without overshoots or undershoots, confirming the robustness of control strategies based on LADRC with LESO for both power converters.

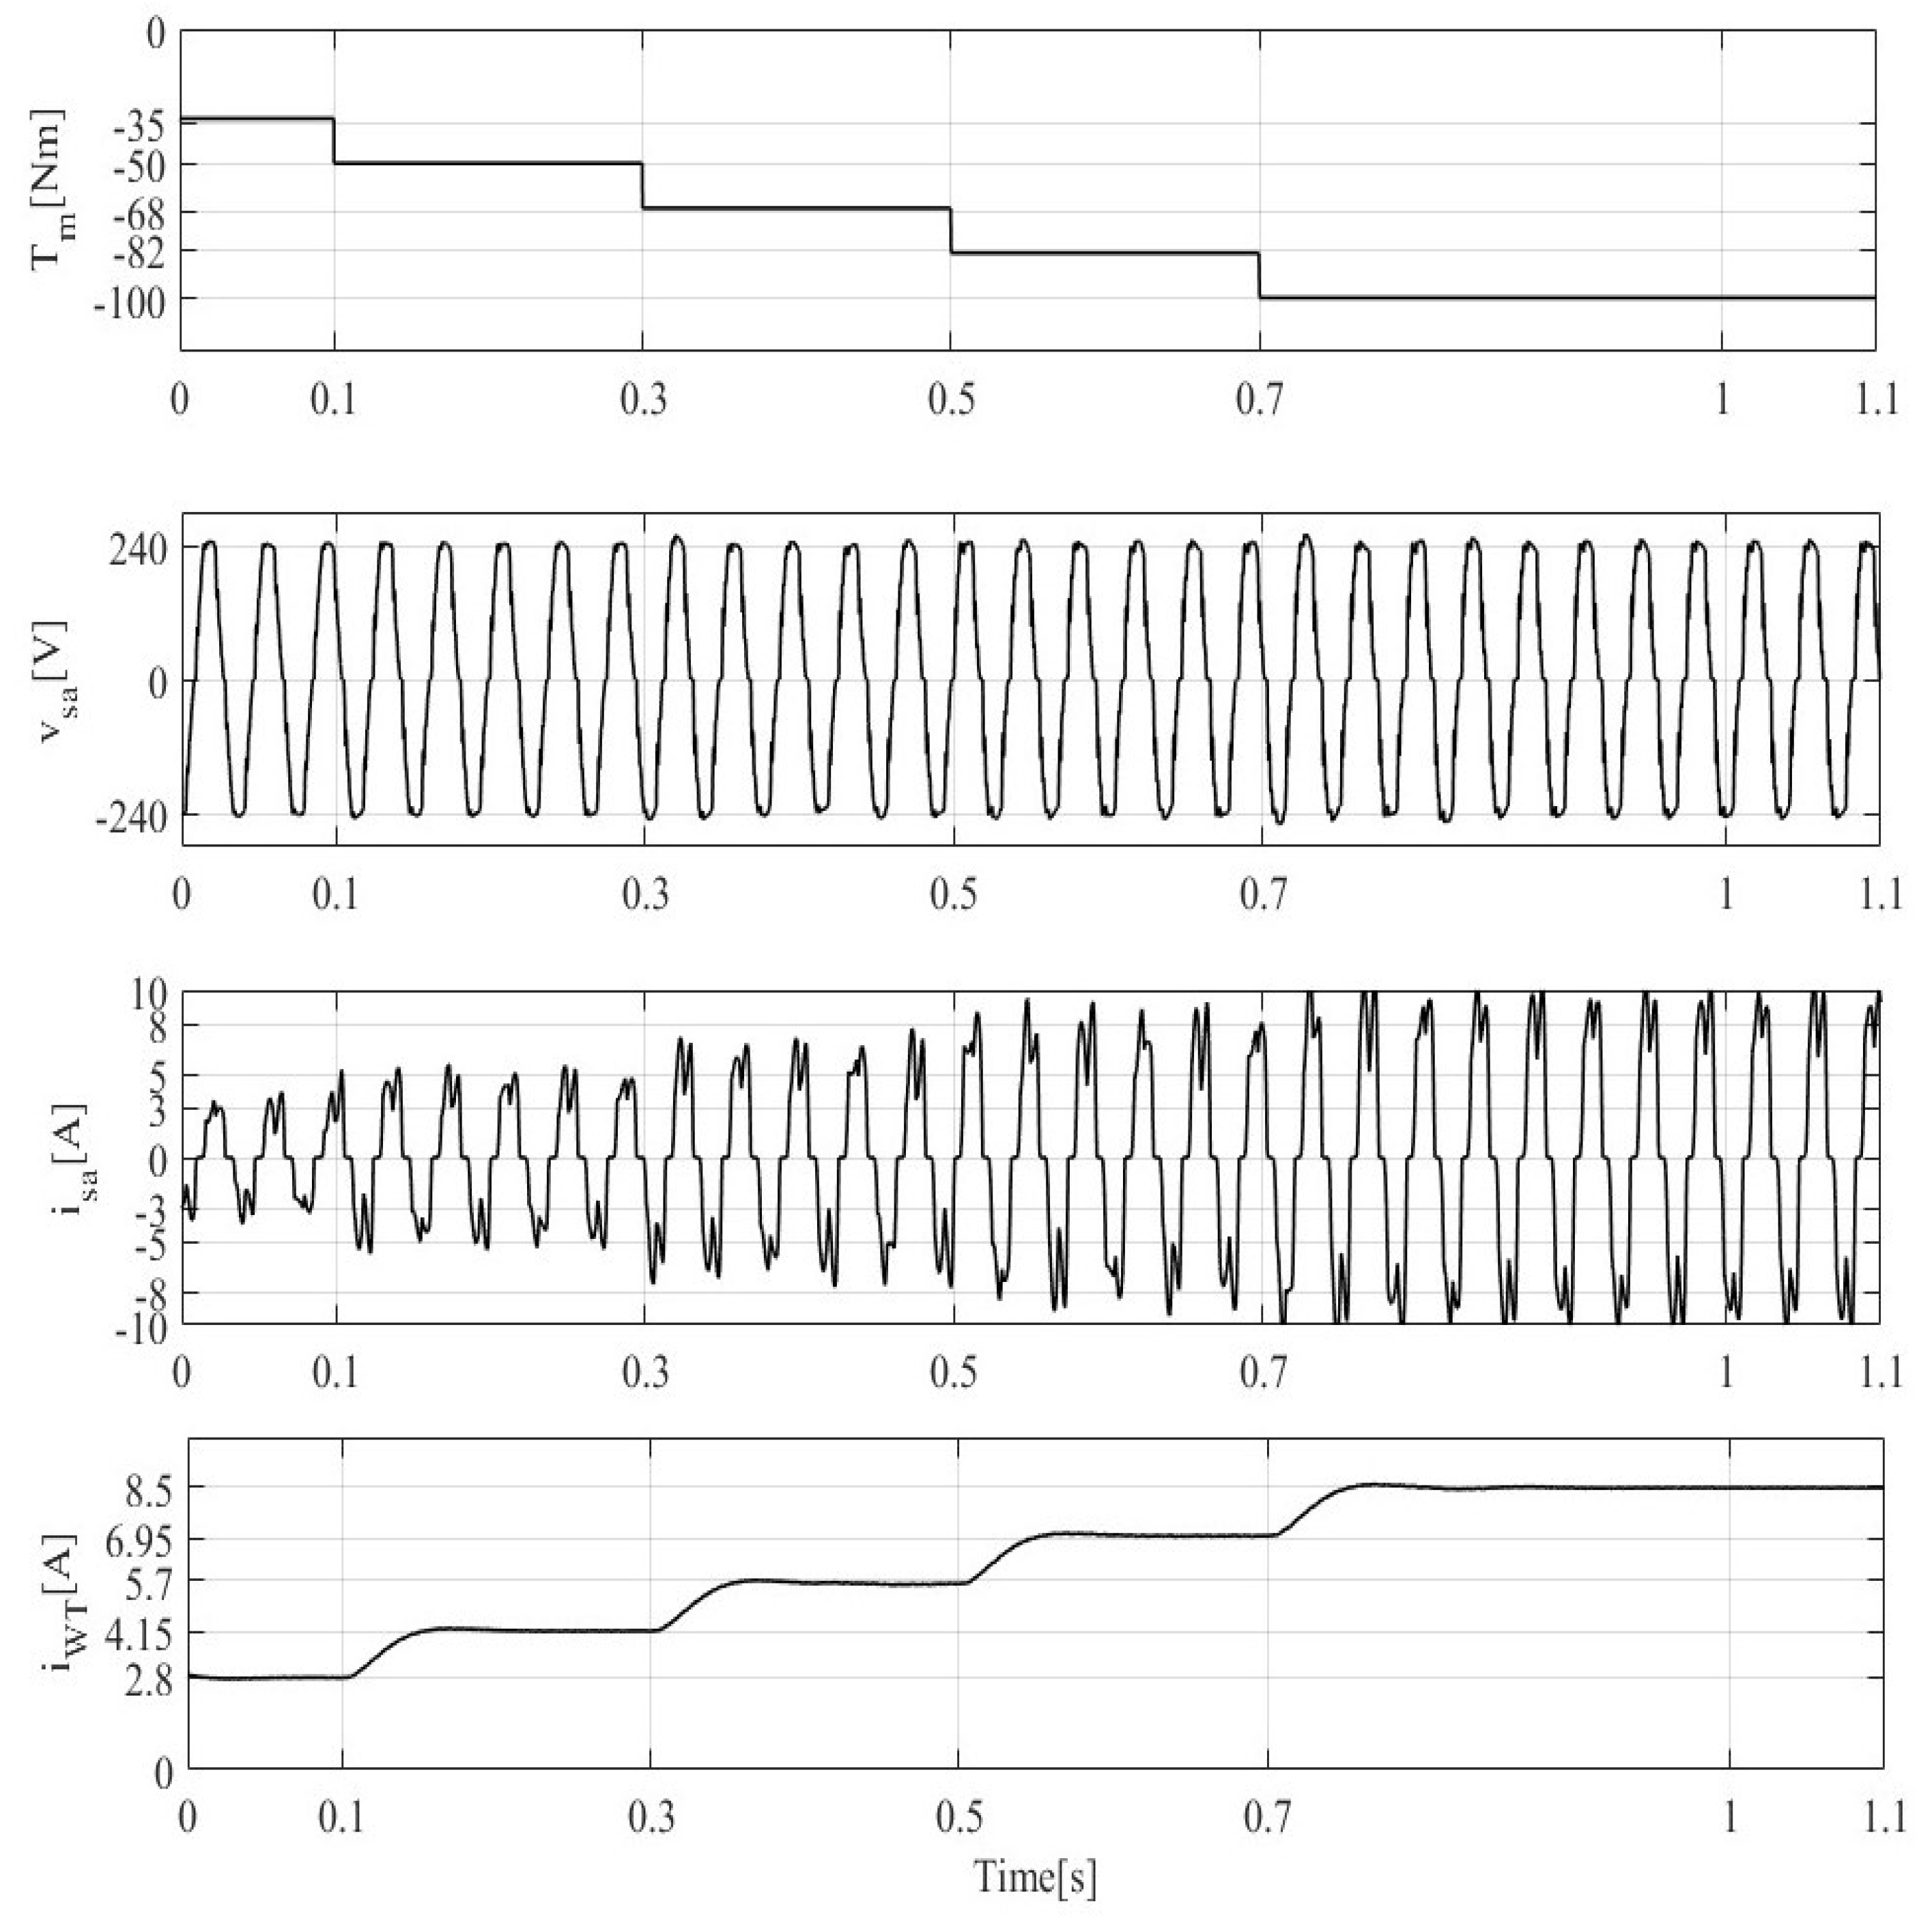
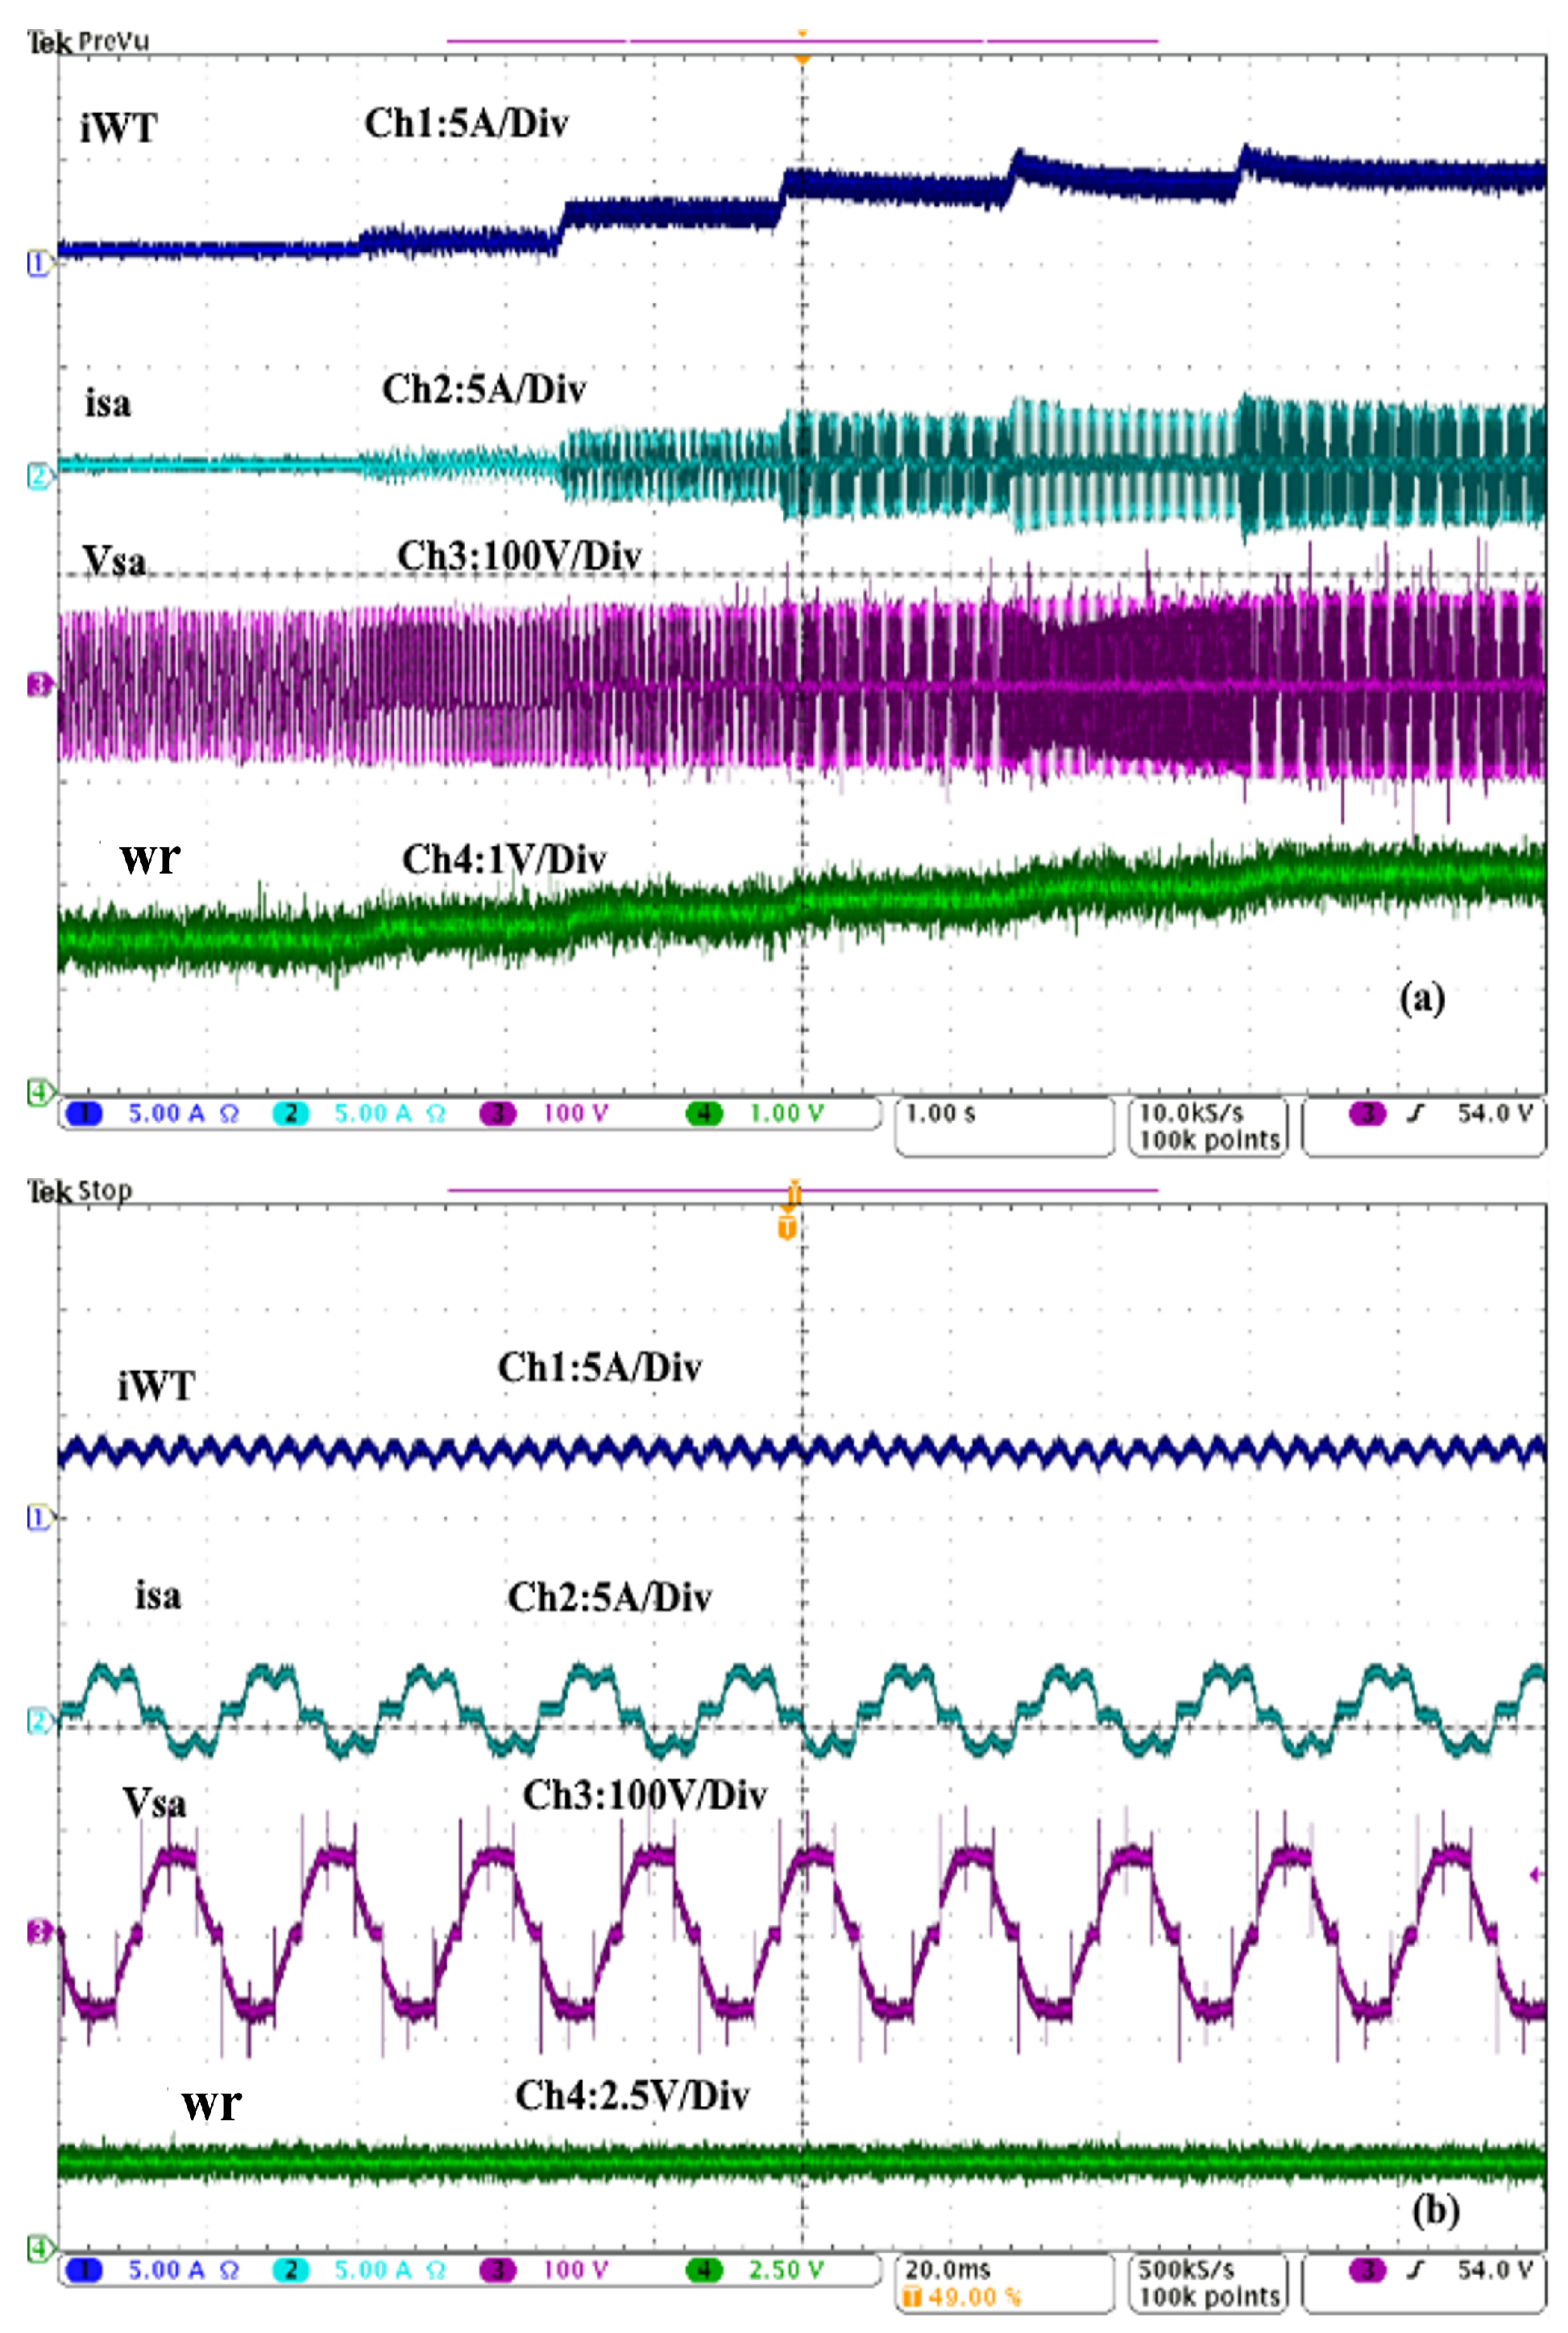
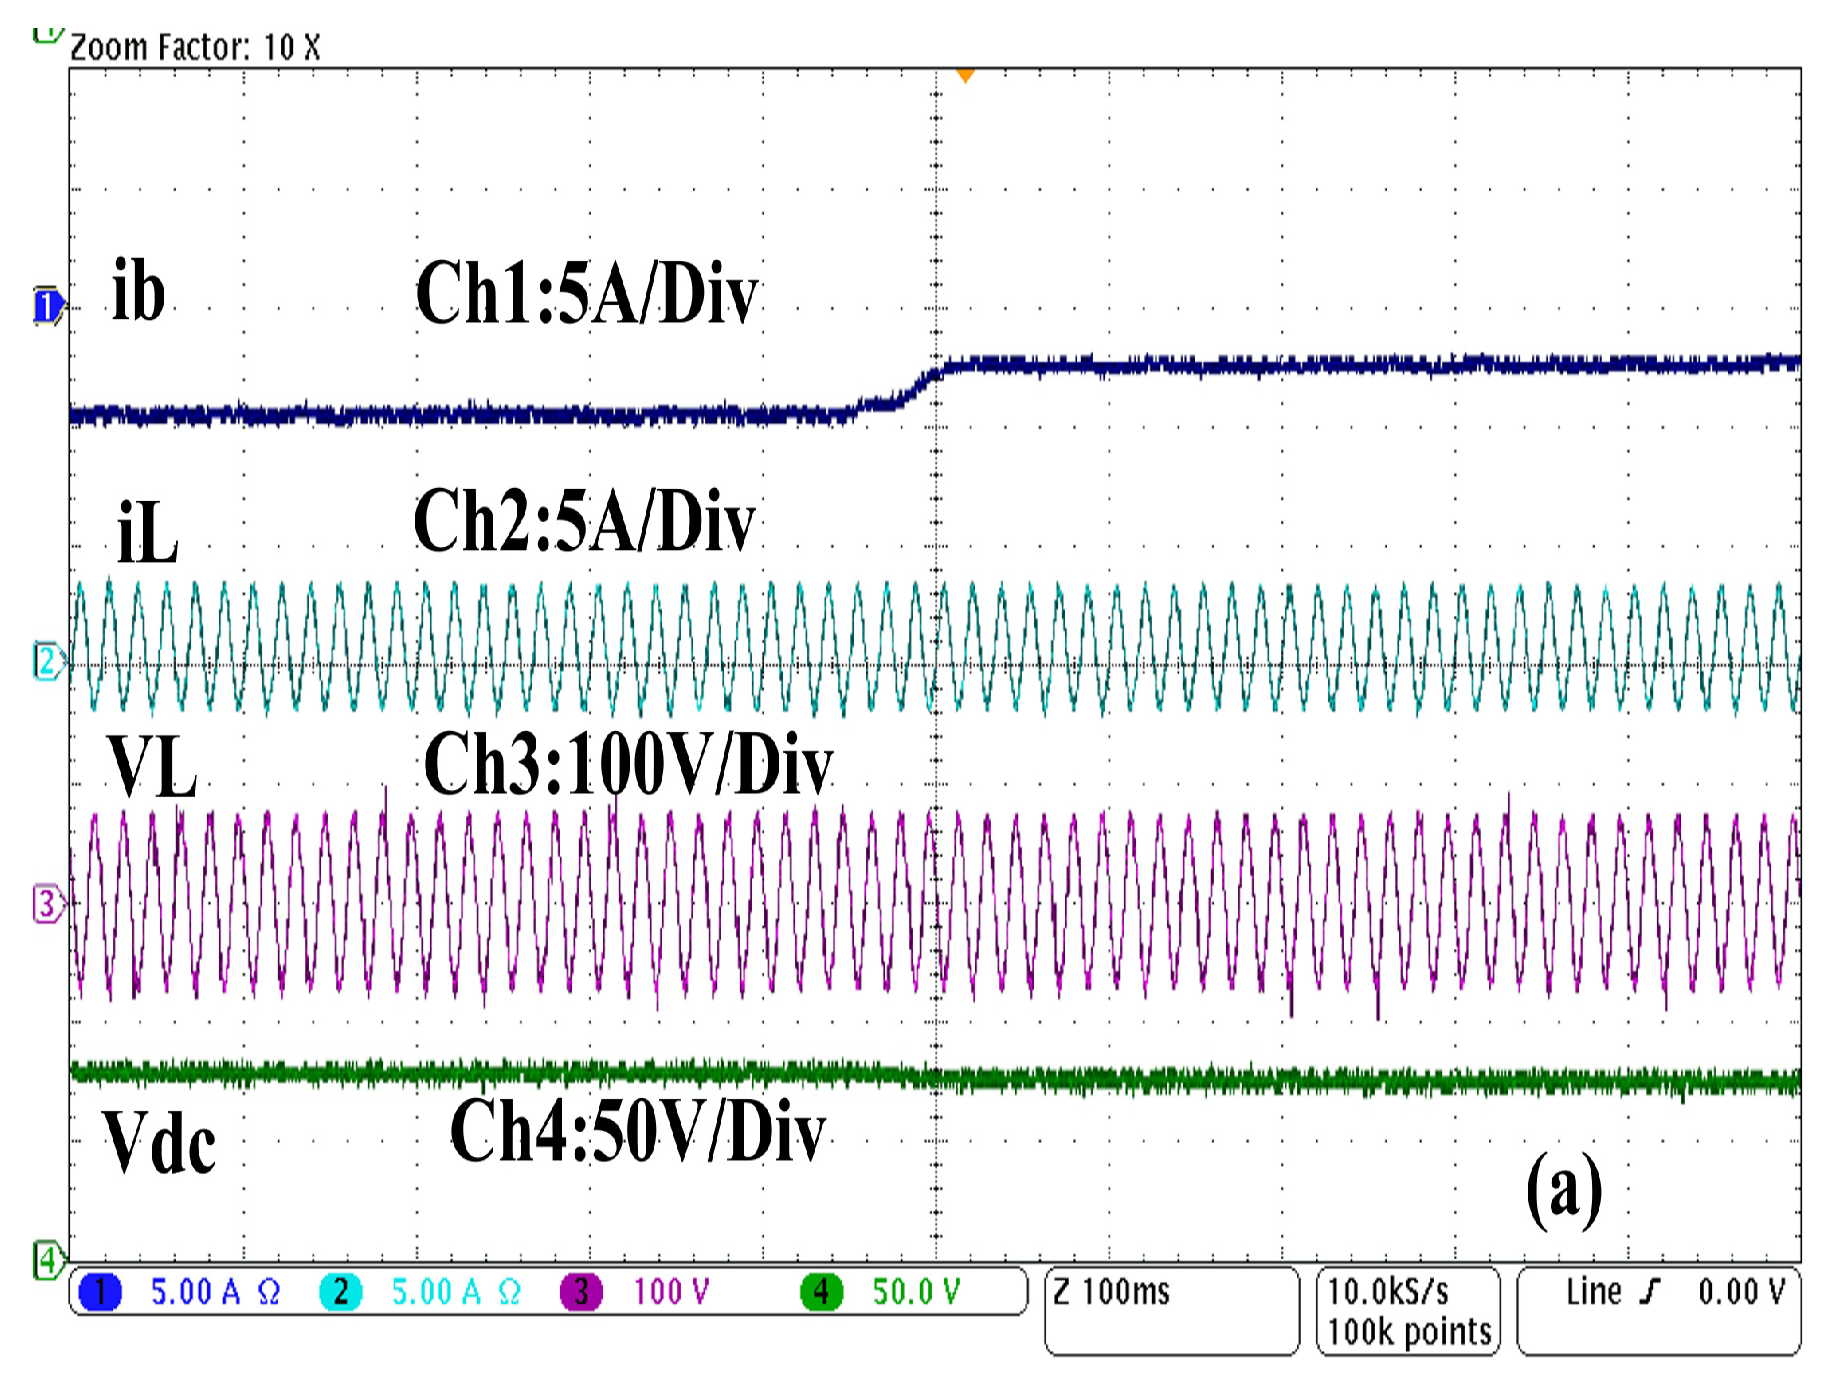
4.5. Performance Analysis under Fixed Load and during Wind Speed Variation and Non-Existence of the Solar Irradiation

In Figure 17, the dynamic performance of the DC of WT, which is measured at the output of the TDB ( i W T ), the stator current ( i s a ), and voltage ( v s a ) of phase ‘a’ as well as the rotor speed ( ω r ), is presented. Tests are being conducted to validate the proposed concept to extract high performance from WT without using MPP techniques. Depending on the rotor speed, one observes a slight variation in the stator voltage but an increase in the stator current. Therefore, this demonstrates that WT can provide more power, especially at a high level of wind speed, without the need for any MPPT technique or controlled power converter.
Figure 18a–c show the dynamic responses of battery current ( i b ), DC WT current ( i W T ), PCC voltage ( v L ), and DC-link voltage ( V d c ). In the present test, we examined how both cascade control strategies and their LADRC with LESO performed when the wind speed increased and decreased suddenly at t = 10 s as shown in Figure 18a,b. A steady voltage is observed for DC-links despite disturbances and is maintained consistently, and the battery current changes with the variation of wind speed to maintain power balance. The voltage and frequency at PCC remain constant when the wind speed varies. These results confirm the robustness of the developed control strategies and their controllers paired with their optimized parameters design.

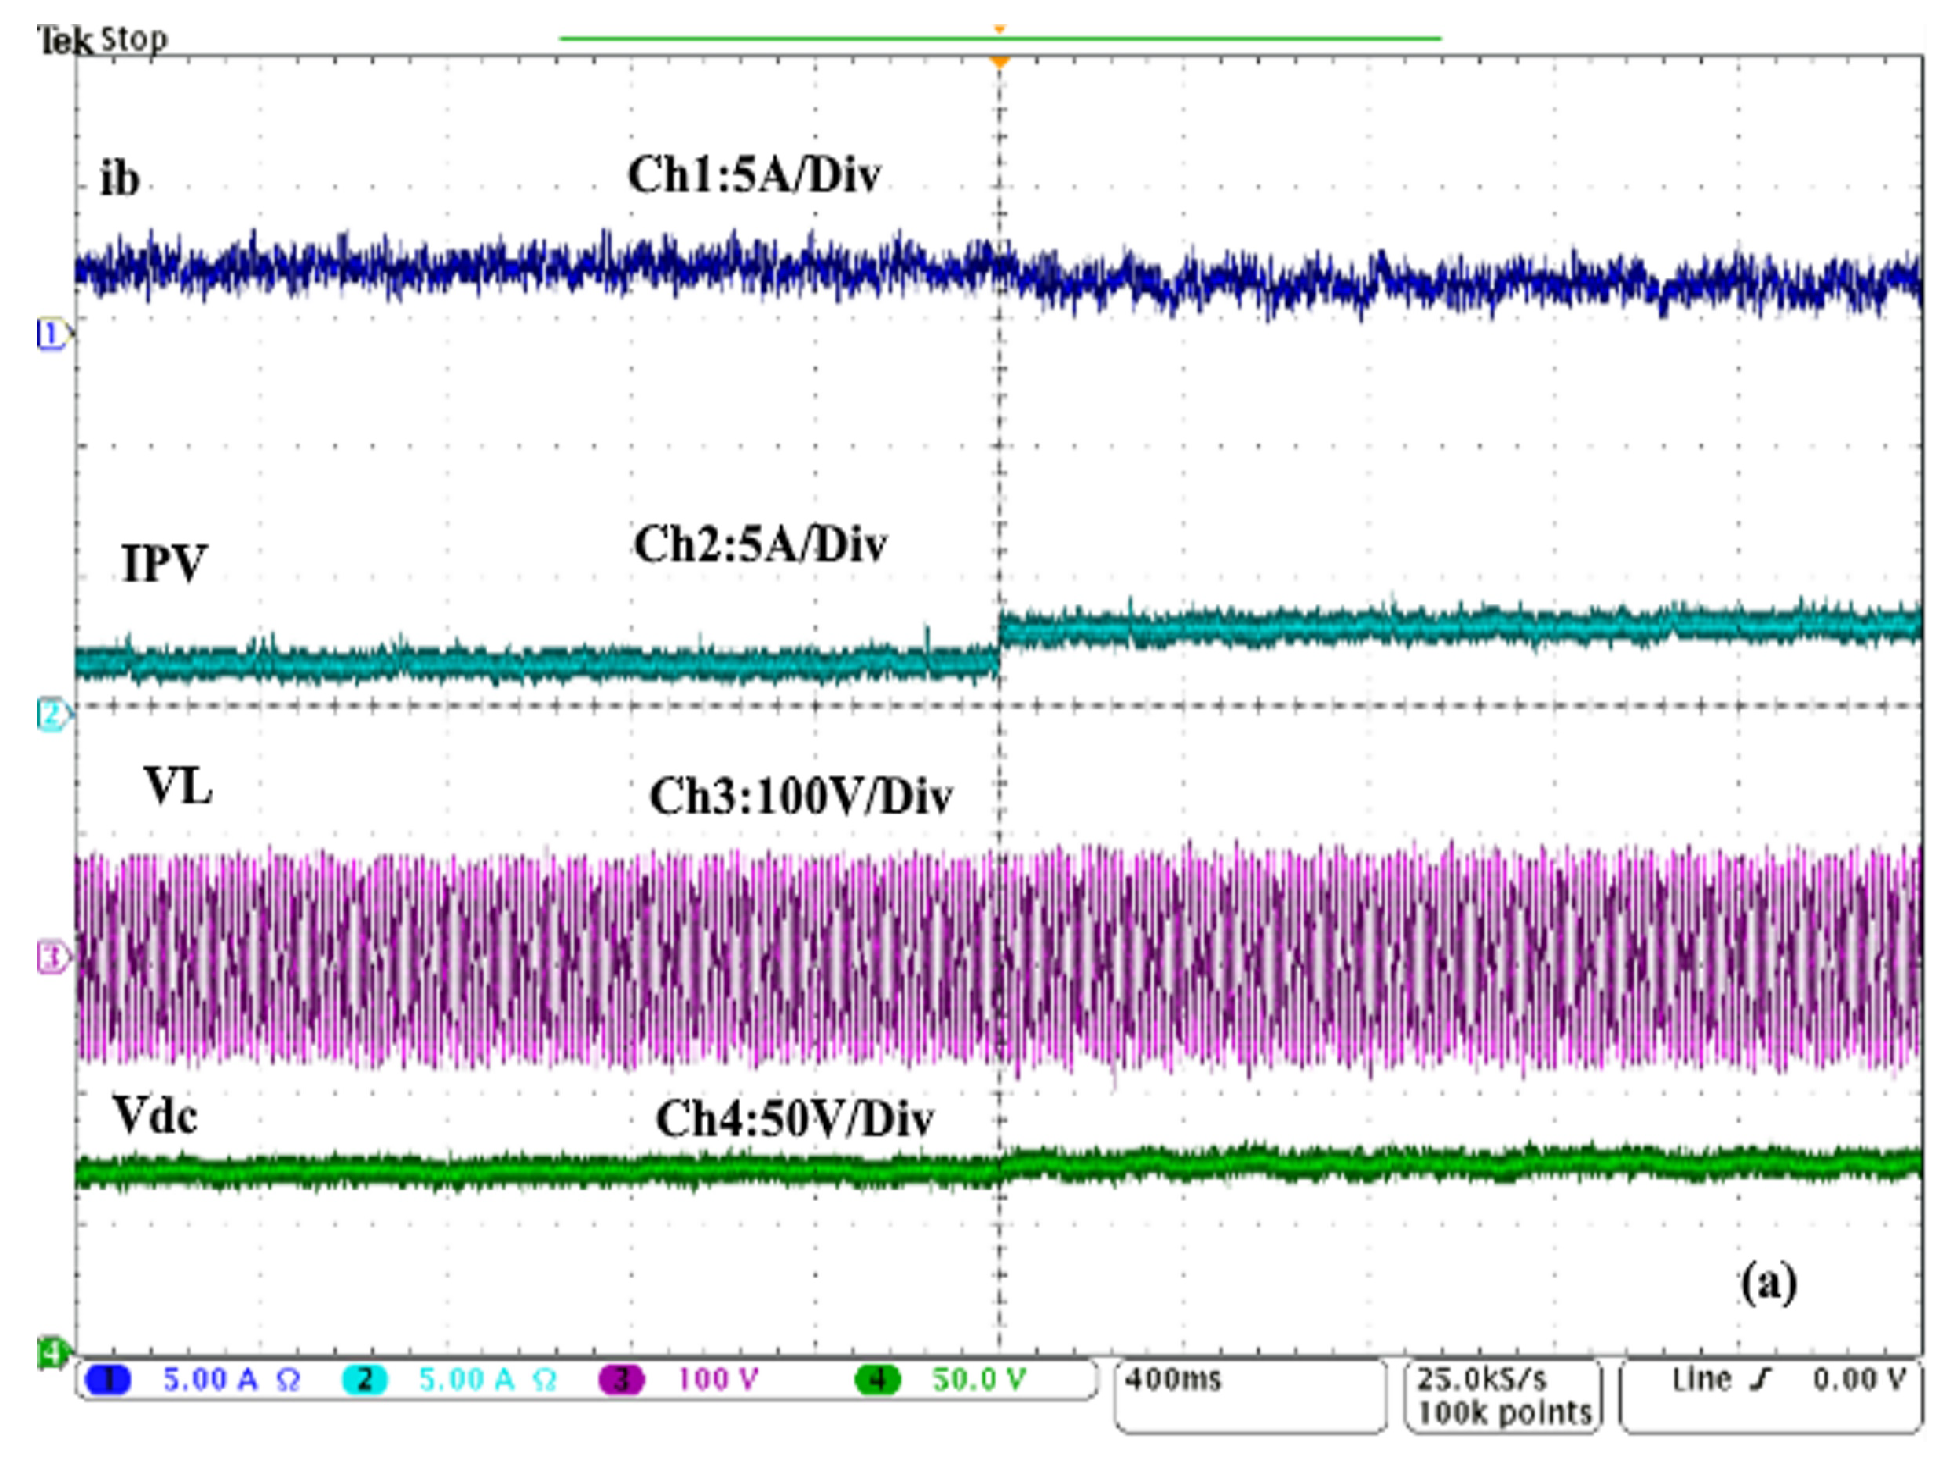
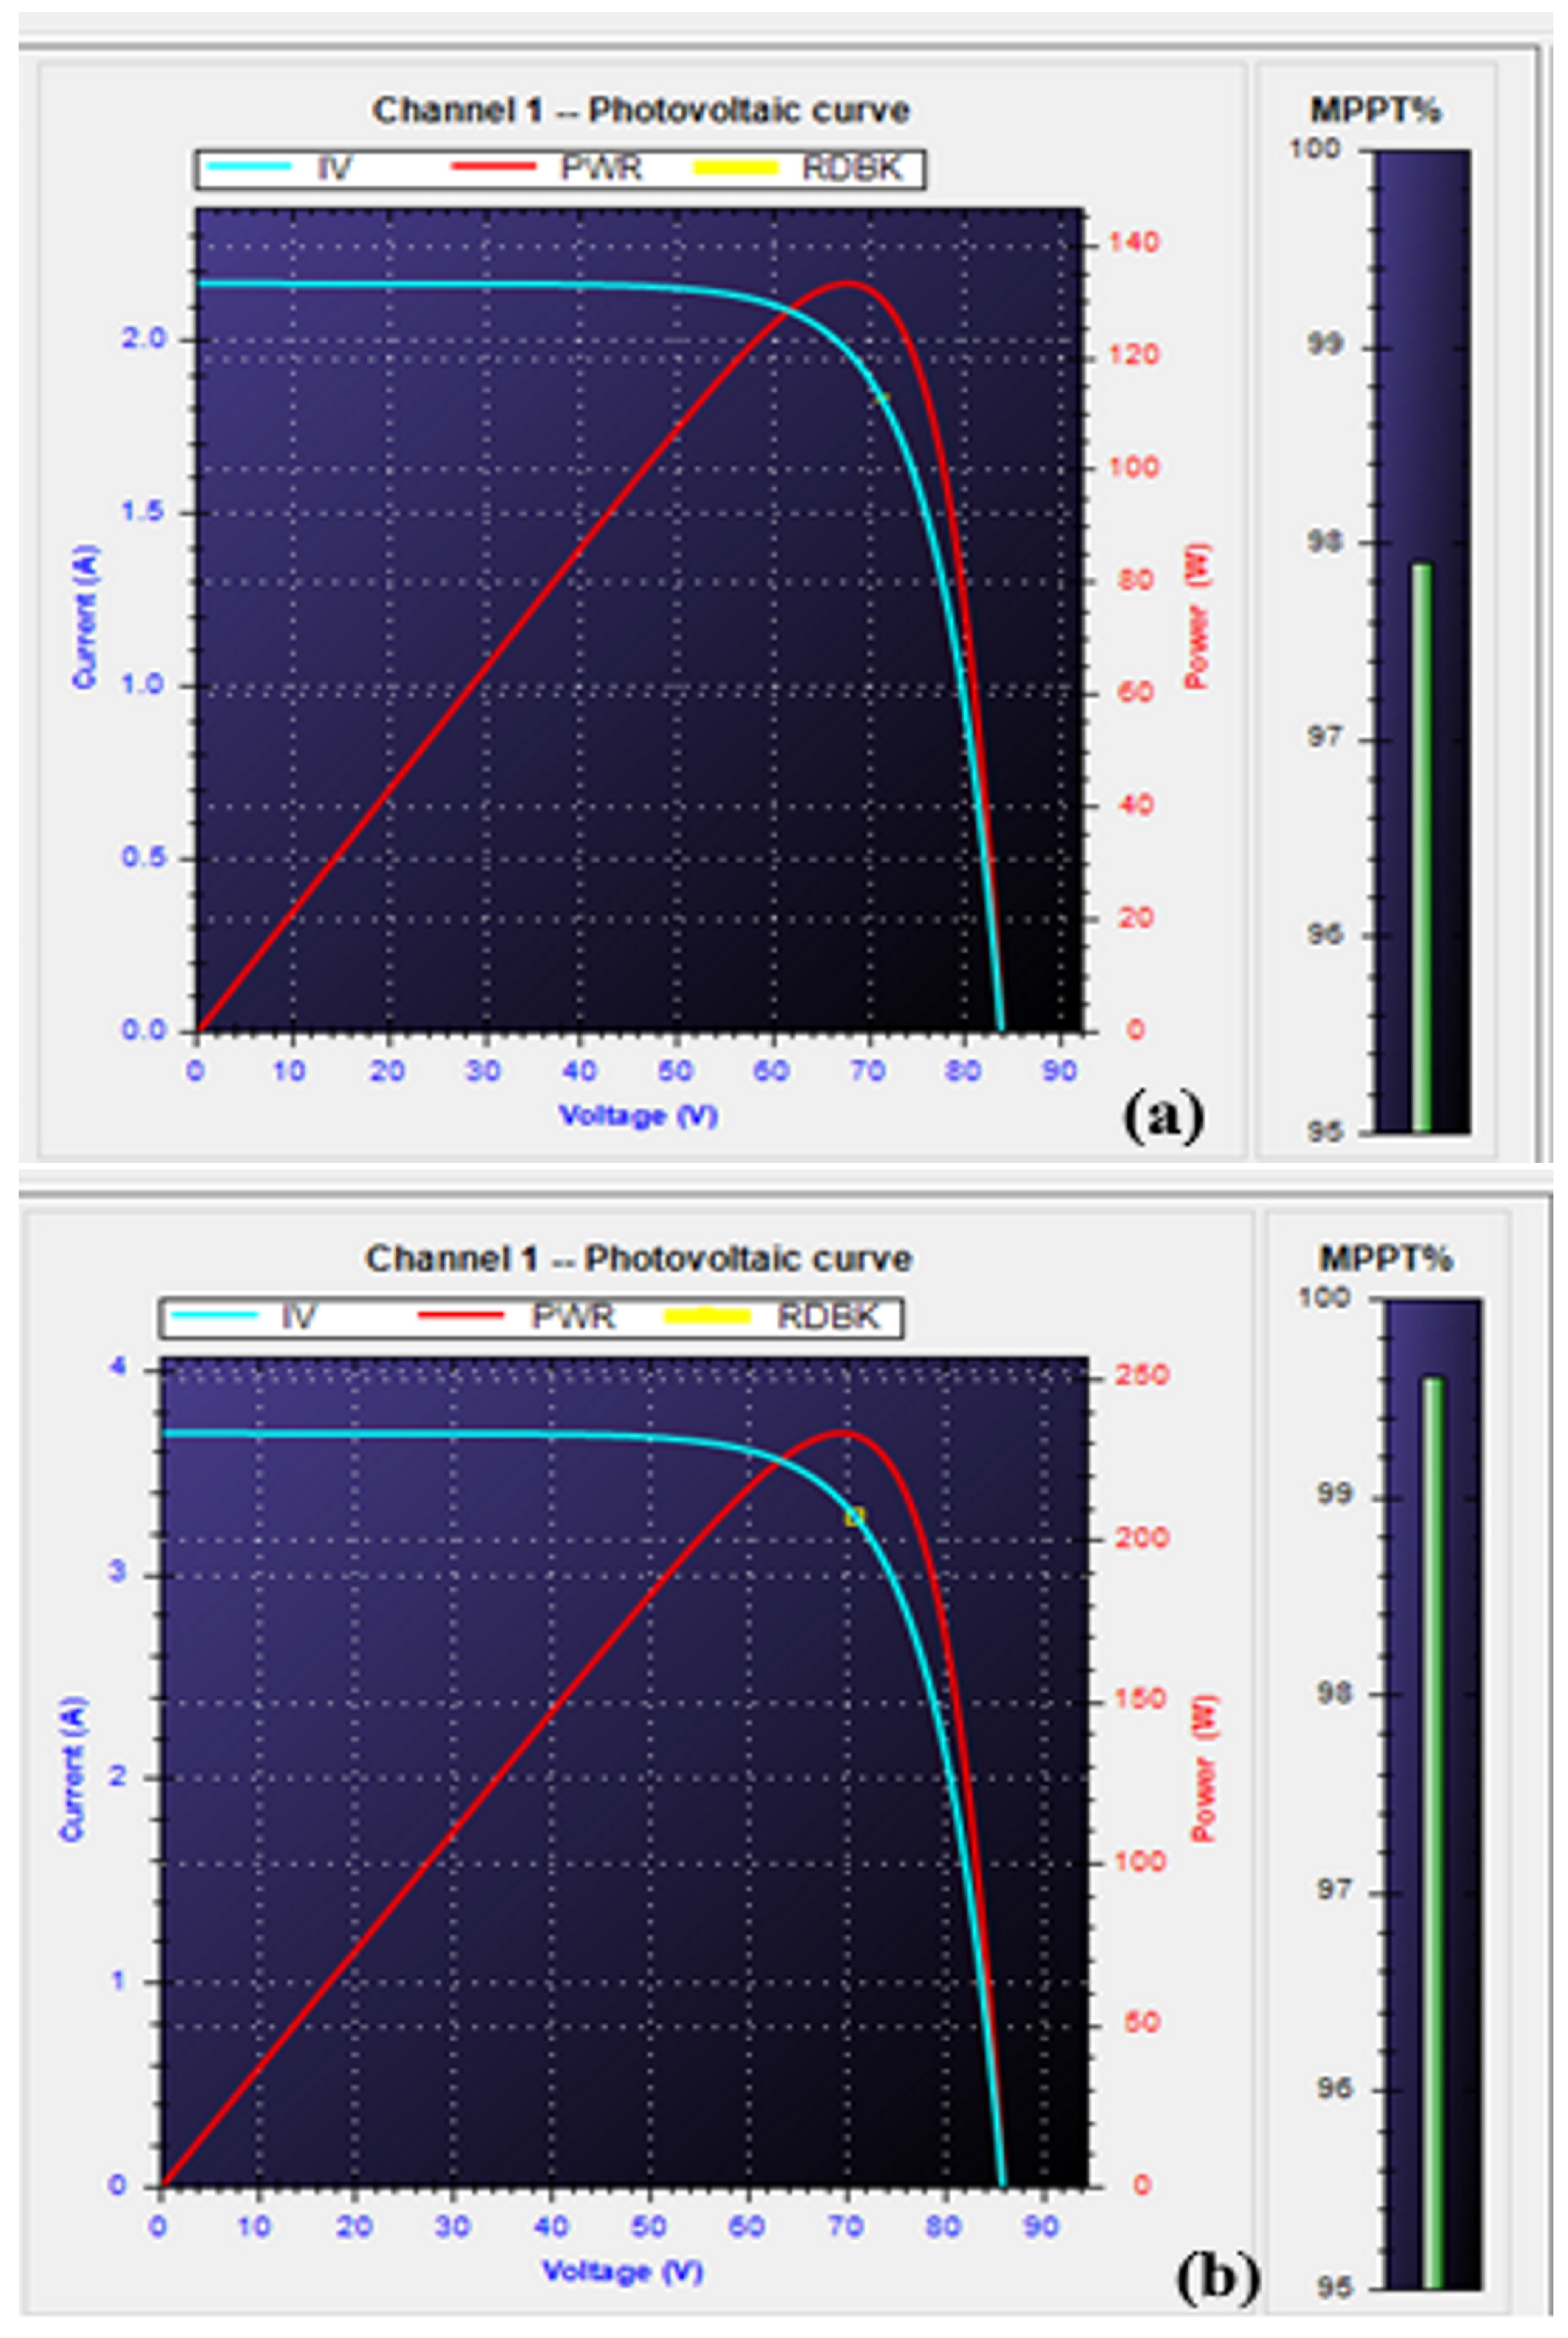
4.6. Performance Analysis under Fixed Load and during Solar Irradiation Change and Non-Existence of the Wind Speed

Figure 19a,b show the characteristics P P V = f ( V P V ) and i P V = f ( V P V ) when the system is subjected to 300 W/m2 and 700 W/m2, respectively. It is evident that when a system is exposed to high levels of solar radiation, one can obtain good efficiency, especially at the high level of irradiance from PVs without utilizing any MPP techniques.
Figure 20a–c show the dynamic responses of the battery current ( i b ), PV current ( i P V ), PCC voltage ( V L ), and DC link voltage ( V d c ). Figure 20a,b illustrate that the PCC voltage and the DC-link voltage are not affected by fluctuations in the PV current. To achieve equilibrium of the power in the system, the battery current is increased and decreased based on PVs current variation. The obtained results demonstrate that both cascade control strategies based on LADRC and LESO perform well during solar irradiation change and do not cause any divergence of the controllers.

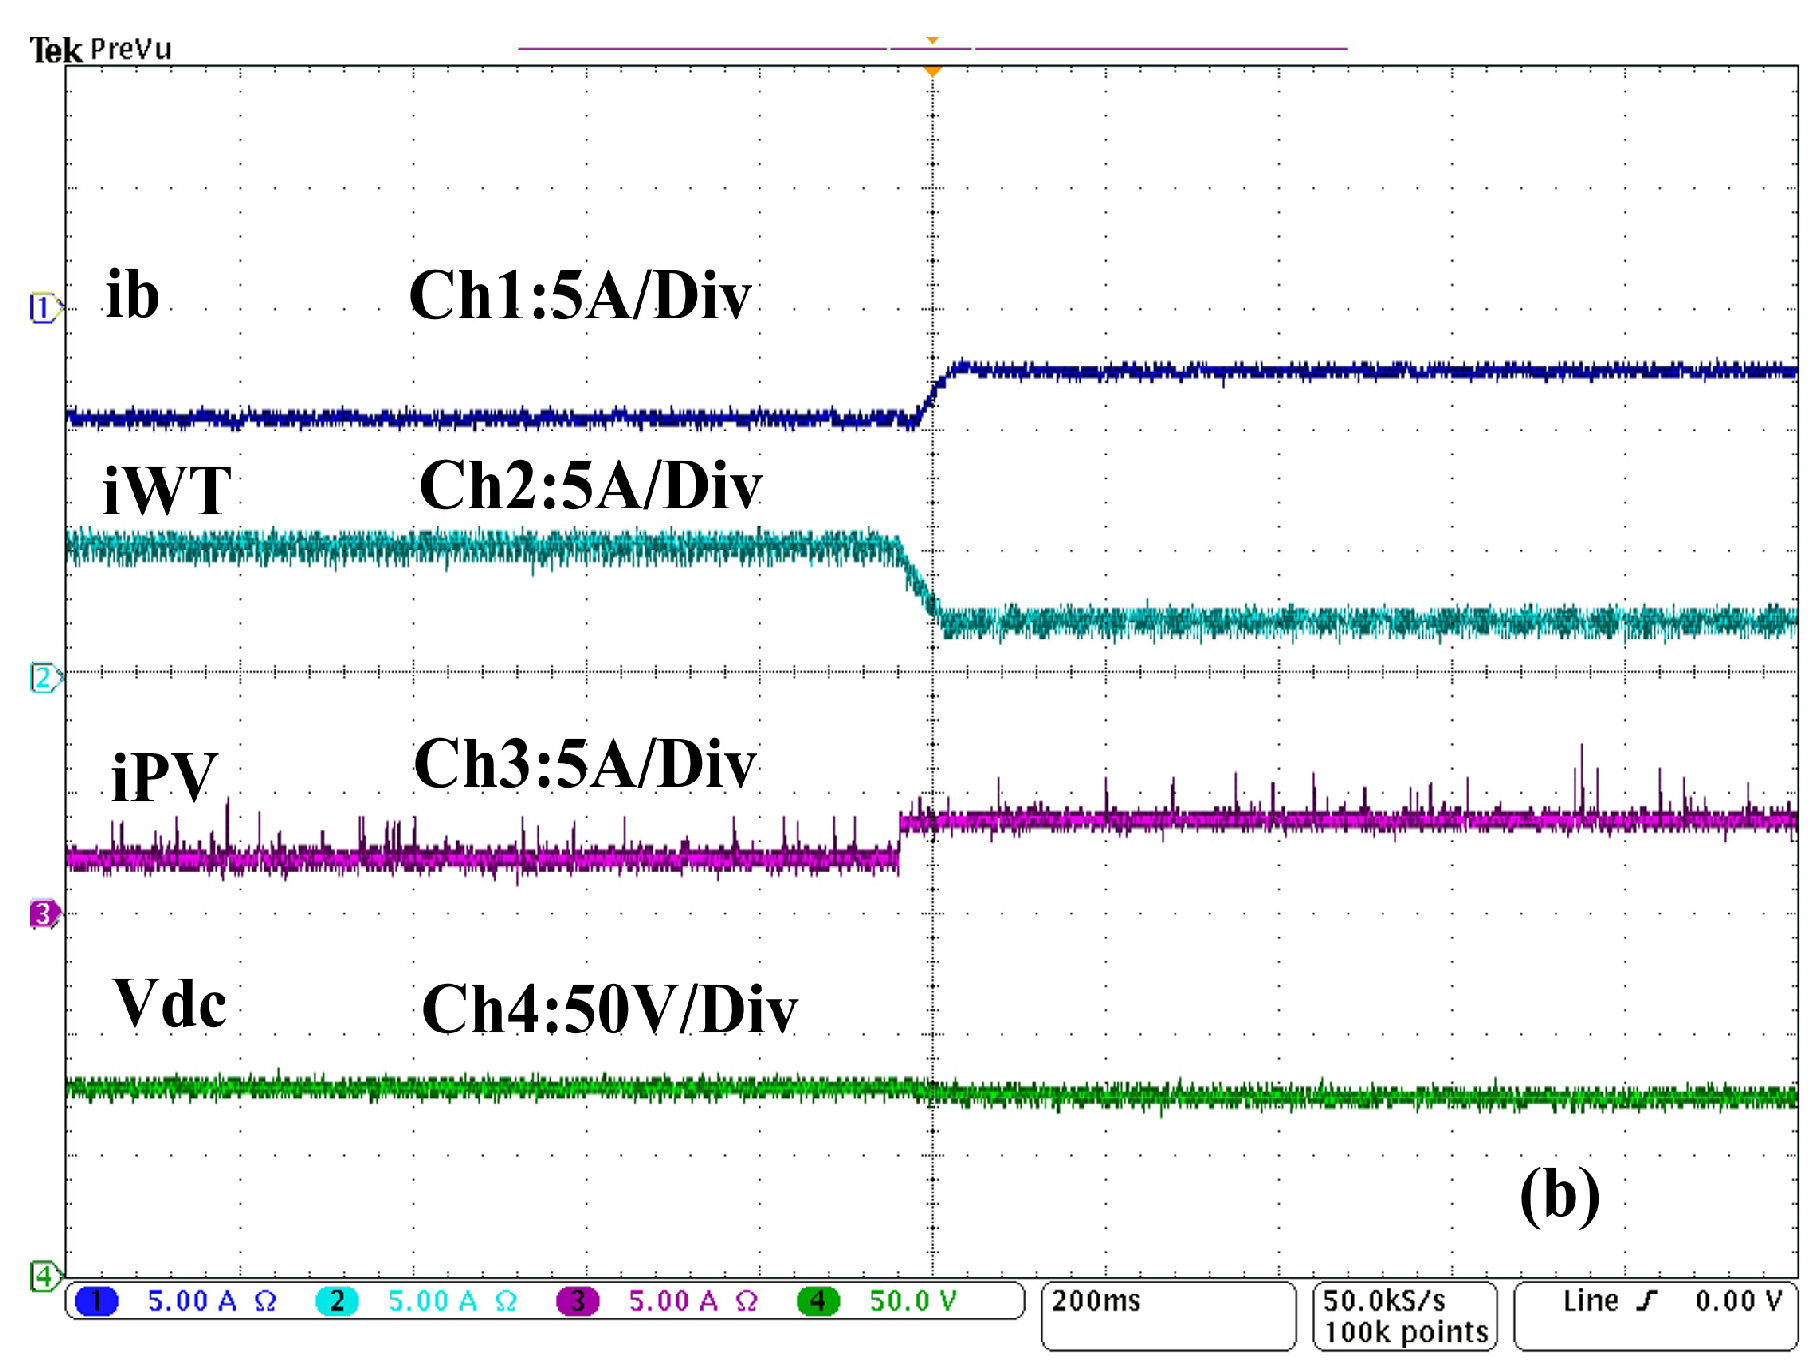
4.7. Performance Analysis under Fixed Load and during Solar Irradiation and Wind Speed Changes

Figure 21a,b show the dynamic responses of battery current ( i b ), load current ( i L ), PCC voltage ( V L ), WT current ( i W T ), PV current ( i p v ), and DC-link voltage ( V d c ). It is performed under fixed load, increasing solar irradiation, and decreasing wind speed. This demonstrates how the load is supplied with a fixed voltage and frequency under such severe conditions. The battery balances power in the system instantly, keeping the DC-link voltage constant without overshoots. Accordingly, the hybrid off-grid configuration’s decentralized control performs well under all operating conditions.

5. Conclusions

The solar–wind hybrid off-grid system with fewer power converters devices, sensors, and decentralized control has been presented and tested by simulation and through a small-scale power rating hardware prototype. It has been demonstrated that by constantly regulating the DC-link voltage, one can easily achieve good efficiency especially at high levels of irradiance and wind speed from PVs and WT without using any MPP technique. It has been demonstrated that the linear active disturbance rejection controllers (LADRCs) and their linear extended state observers (LESOs) with their optimal parameters tuning employed for outer and inner control loops for the power converters of the hybrid off-grid system perform well under severe conditions and in the presence of disturbance and noise. It has been shown that the load is supplied with constant voltage and frequency, and the batteries balance the power in the system for ideal and non-ideal conditions.

Author Contributions

M.R. was responsible for the simulations and implementations in the laboratory. M.R. drafted the original manuscript. A.C. provided theoretical guidance and revised content. H.I. worked together on the writing and editing process. All authors have read and agreed to the published version of the manuscript.

Funding

This research work is supported by the Innovation Catalyst for the Energy Transition in Quebec (CITEQ-FRQNT) and the Energy Intelligence Research and Innovation Center (Cr2ie).

Institutional Review Board Statement

Not applicable.

Informed Consent Statement

Not applicable.

Data Availability Statement

This study did not report any data.

Conflicts of Interest

The authors declare no conflicts of interest.

Nomenclature

β 1 , 2    Observer gains
ω 0 Observer bandwidth in [rad/s]
ω 1 , 2 Disturbance terms
ω c Controller bandwidth in [rad/s]
b 1 , 6 Control gains
C d c Capacitor of the common DC-link in [uF]
d d , q Control signal in d-q axis
i c d , q Output filter capacitor current in d-q axis in [A]
i d c DC current at the input of the interfacing single-phase inverter current in [A]
i i n v d , q Output interfacing single-phase inverter current in d-q axis in [A]
i L b Battery current in [A]
i L d , q Load current in d-q axis in [A]
i P V Output current from PVs in [A]
i R E S Generated current from PVs and WT in [A]
i W T Output current from WT in [A]
k p 1 , 6 Proportional gains
L b Inductor installed between battery and the buck–boost converter [mH]
sLaplace operator
T m Mechanical torque of the WT in [N.m]
v b Battery voltage in [V]
V d c DC-link voltage in [V]
V d c * Desired common DC-link voltage in [V]
v L d , q Load voltage in d-q axis in [V]
Z 1 , 11 Tracking signals
Z 2 , 12 Estimated disturbances

Appendix A

Table A1. Parameters of LADRCs and LESOs.
DC-DC BOOST
K P 1 = 60 K P 2 = 150 b 1 = 200 ω 0 = 500
b 2 = 20,000 β 1 = 1000 β 2 = 25,000
SINGLE-PHASE INVERTER
K P 3 = 75 K P 4 = 150 K P 5 = 75 K P 6 = 150
ω 0 = 500 b 3 = 25,000 b 4 = 48 , 000

References

  1. Rezkallah, M.; Chandra, A.; Singh, B.; Singh, S. Microgrid: Configurations, control and applications. IEEE Trans. Smart Grid 2017, 10, 1290–1302. [Google Scholar] [CrossRef]
  2. Rezkallah, M.; Singh, S.; Chandra, A.; Singh, B.; Ibrahim, H. Off-grid system configurations for coordinated control of renewable energy sources. Energies 2020, 13, 4950. [Google Scholar] [CrossRef]
  3. Bharatee, A.; Ray, P.K.; Subudhi, B.; Ghosh, A. Power Management Strategies in a Hybrid Energy Storage System Integrated AC/DC Microgrid: A Review. Energies 2022, 15, 7176. [Google Scholar] [CrossRef]
  4. Liu, X.; Wang, P.; Loh, P.C. A hybrid AC/DC microgrid and its coordination control. IEEE Trans. Smart Grid 2011, 2, 278–286. [Google Scholar]
  5. Wang, G.; Wang, X.; Wang, F.; Han, Z. Research on hierarchical control strategy of AC/DC hybrid microgrid based on power coordination control. Appl. Sci. 2020, 10, 7603. [Google Scholar] [CrossRef]
  6. Unamuno, E.; Barrena, J.A. Hybrid ac/dc microgrids—Part II: Review and classification of control strategies. Renew. Sustain. Energy Rev. 2015, 52, 1123–1134. [Google Scholar] [CrossRef]
  7. Singh, B.; Bhalla, K.K. Reduced converter topology for integrated wind and small-hydro energy generation system. IET Renew. Power Gener. 2015, 9, 520–529. [Google Scholar] [CrossRef]
  8. Yadav, V.; Singh, B.; Verma, A. Robust Control for PMBLDCG Based WEC System and Seamless Grid Synchronization. In Proceedings of the 2021 International Conference on Sustainable Energy and Future Electric Transportation (SEFET), Hyderabad, India, 21–23 January 2021; IEEE: Piscataway, NJ, USA, 2021; pp. 1–5. [Google Scholar]
  9. Pathak, G.; Singh, B.; Panigrahi, B.K. Control of wind-diesel microgrid using affine projection-like algorithm. IEEE Trans. Ind. Inform. 2016, 12, 524–531. [Google Scholar] [CrossRef]
  10. Sharma, R.; Singh, B. A robust control for solar and SyRG based hydro generation microgrid with grid synchronization. IEEE Trans. Ind. Appl. 2022, 58, 7595–7607. [Google Scholar] [CrossRef]
  11. Kalla, U.K.; Singh, B.; Murthy, S.S.; Jain, C.; Kant, K. Adaptive sliding mode control of standalone single-phase microgrid using hydro, wind, and solar PV array-based generation. IEEE Trans. Smart Grid 2017, 9, 6806–6814. [Google Scholar] [CrossRef]
  12. Kandari, R.; Neeraj, N.; Micallef, A. Review on recent strategies for integrating energy storage systems in microgrids. Energies 2022, 16, 317. [Google Scholar] [CrossRef]
  13. Singh, B.; Kushwaha, R. A PFC based EV battery charger using a bridgeless isolated SEPIC converter. IEEE Trans. Ind. Appl. 2019, 56, 477–487. [Google Scholar] [CrossRef]
  14. Pandey, R.; Singh, B. A power-factor-corrected LLC resonant converter for electric vehicle charger using Cuk converter. IEEE Trans. Ind. Appl. 2019, 55, 6278–6286. [Google Scholar] [CrossRef]
  15. Rezkallah, M.; Singh, S.; Singh, B.; Chandra, A.; Ibrahim, H.; Ghandour, M. Implementation of two-level coordinated control for seamless transfer in standalone microgrid. IEEE Trans. Ind. Appl. 2020, 57, 1057–1068. [Google Scholar] [CrossRef]
  16. Russo, A.; Cavallo, A. Stability and Control for Buck–Boost Converter for Aeronautic Power Management. Energies 2023, 16, 988. [Google Scholar] [CrossRef]
  17. Veerachary, M.; Khubchandani, V. Analysis, design, and control of switching capacitor based buck–boost converter. IEEE Trans. Ind. Appl. 2018, 55, 2845–2857. [Google Scholar] [CrossRef]
  18. Zhang, H.; Zhao, Q.; Wang, S.; Yue, X. Improved Repetitive Control for an LCL-Type Grid-Tied Inverter with Frequency Adaptive Capability in Microgrids. Electronics 2023, 12, 1736. [Google Scholar] [CrossRef]
  19. Zhu, G.r.; Wang, H.; Liang, B.; Tan, S.C.; Jiang, J. Enhanced single-phase full-bridge inverter with minimal low-frequency current ripple. IEEE Trans. Ind. Electron. 2015, 63, 937–943. [Google Scholar] [CrossRef]
  20. Cao, D.; Jiang, S.; Peng, F.Z.; Li, Y. Low cost transformer isolated boost half-bridge micro-inverter for single-phase grid-connected photovoltaic system. In Proceedings of the 2012 Twenty-Seventh Annual IEEE Applied Power Electronics Conference and Exposition (APEC), Orlando, FL, USA, 5–9 February 2012; IEEE: Piscataway, NJ, USA, 2012; pp. 71–78. [Google Scholar]
  21. Zeb, K.; Khan, I.; Uddin, W.; Khan, M.A.; Sathishkumar, P.; Busarello, T.D.C.; Ahmad, I.; Kim, H. A review on recent advances and future trends of transformerless inverter structures for single-phase grid-connected photovoltaic systems. Energies 2018, 11, 1968. [Google Scholar] [CrossRef]
  22. Bollipo, R.B.; Mikkili, S.; Bonthagorla, P.K. Hybrid, optimal, intelligent and classical PV MPPT techniques: A review. CSEE J. Power Energy Syst. 2020, 7, 9–33. [Google Scholar]
  23. Rezkallah, M.; Singh, S.; Chandra, A.; Singh, B.; Tremblay, M.; Saad, M.; Geng, H. Comprehensive controller implementation for wind-PV-diesel based standalone microgrid. IEEE Trans. Ind. Appl. 2019, 55, 5416–5428. [Google Scholar] [CrossRef]
  24. Wei, C.; Zhang, Z.; Qiao, W.; Qu, L. An adaptive network-based reinforcement learning method for MPPT control of PMSG wind energy conversion systems. IEEE Trans. Power Electron. 2016, 31, 7837–7848. [Google Scholar] [CrossRef]
  25. Pervez, I.; Pervez, A.; Tariq, M.; Sarwar, A.; Chakrabortty, R.K.; Ryan, M.J. Rapid and robust adaptive Jaya (Ajaya) based maximum power point tracking of a PV-based generation system. IEEE Access 2020, 9, 48679–48703. [Google Scholar] [CrossRef]
  26. Meng, X.; Gao, F.; Xu, T.; Zhang, C. Fast Two-Stage Global Maximum Power Point Tracking for Grid-Tied String PV Inverter Using Characteristics Mapping Principle. IEEE J. Emerg. Sel. Top. Power Electron. 2021, 10, 564–574. [Google Scholar] [CrossRef]
  27. Zhang, L.; Born, R.; Gu, B.; Chen, B.; Zheng, C.; Zhao, X.; Lai, J.S. A sensorless implementation of the parabolic current control for single-phase stand-alone inverters. IEEE Trans. Power Electron. 2015, 31, 3913–3921. [Google Scholar] [CrossRef]
  28. Sedo, J.; Kascak, S. Control of single-phase grid connected inverter system. In Proceedings of the 2016 ELEKTRO, Strbske Pleso, Slovakia, 16–18 May 2016; IEEE: Piscataway, NJ, USA, 2016; pp. 207–212. [Google Scholar]
  29. Arafat, M.N.; Palle, S.; Sozer, Y.; Husain, I. Transition control strategy between standalone and grid-connected operations of voltage-source inverters. IEEE Trans. Ind. Appl. 2012, 48, 1516–1525. [Google Scholar] [CrossRef]
  30. Garcia-Reyes, L.A.; Beltrán-Telles, A.; Bañuelos-Ruedas, F.; Reta-Hernández, M.; Ramírez-Arredondo, J.M.; Silva-Casarín, R. Level-shift pwm control of a single-phase full h-bridge inverter for grid interconnection, applied to ocean current power generation. Energies 2022, 15, 1644. [Google Scholar] [CrossRef]
  31. Yang, M.; Liu, P. Research on Sliding Mode Control of Dual Active Bridge Converter Based on Linear Extended State Observer in Distributed Electric Propulsion System. Electronics 2023, 12, 3522. [Google Scholar] [CrossRef]
  32. Feng, L.; Sun, X.; Tian, X.; Diao, K. Direct torque control with variable flux for an SRM based on hybrid optimization algorithm. IEEE Trans. Power Electron. 2022, 37, 6688–6697. [Google Scholar] [CrossRef]
  33. Ullah, F.; Ali, S.; Ying, D.; Saeed, A. Linear active disturbance rejection control approach base pitch angle control of variable speed wind turbine. In Proceedings of the 2019 IEEE 2nd International Conference on Electronics Technology (ICET), Chengdu, China, 10–13 May 2019; IEEE: Piscataway, NJ, USA, 2019; pp. 614–618. [Google Scholar]
  34. Herbst, G. A simulative study on active disturbance rejection control (ADRC) as a control tool for practitioners. Electronics 2013, 2, 246–279. [Google Scholar] [CrossRef]
  35. Tan, W.; Fu, C. Linear active disturbance-rejection control: Analysis and tuning via IMC. IEEE Trans. Ind. Electron. 2015, 63, 2350–2359. [Google Scholar] [CrossRef]
  36. Gao, Z. Scaling and bandwidth-parameterization based controller tuning. In Proceedings of the 2003 American Control Conference, Denver, CO, USA, 4–6 June 2003; pp. 4989–4996. [Google Scholar]
  37. Cao, Y.; Zhao, Q.; Ye, Y.; Xiong, Y. ADRC-based current control for grid-tied inverters: Design, analysis, and verification. IEEE Trans. Ind. Electron. 2019, 67, 8428–8437. [Google Scholar] [CrossRef]
  38. Fu, C.; Tan, W. Parameters tuning of reduced-order active disturbance rejection control. IEEE Access 2020, 8, 72528–72536. [Google Scholar] [CrossRef]
  39. Rezkallah, M.; Ibrahim, H.; Bekbouti, Y.; Chandra, A. Performance analysis of low-cost configuration based on single-phase inverter for microgrid application. In Proceedings of the 2021 IEEE Industry Applications Society Annual Meeting (IAS), Vancouver, BC, Canada, 10–14 October 2021; IEEE: Piscataway, NJ, USA, 2021; pp. 1–5. [Google Scholar]
Figure 1. Hybrid off-grid system under study.
Cleantechnol 06 00024 g001
Figure 2. Characteristics of P P V = f ( V P V ) and I P V = f ( V P V ) for different solar irradiation and at fixed temperature (25 °C).
Cleantechnol 06 00024 g002
Figure 3. Characteristic of i W T = f ( T m ) at different wind speed.
Cleantechnol 06 00024 g003
Figure 4. Cascade control strategy based on LADRC with LESO for two-switch buck–boost converters.
Cleantechnol 06 00024 g004
Figure 5. Model of the LESO employed for the outer control loop.
Cleantechnol 06 00024 g005
Figure 6. Influence of the observer bandwidth using Bode diagram.
Cleantechnol 06 00024 g006
Figure 7. Influence of the controller bandwidth using Bode diagram.
Cleantechnol 06 00024 g007
Figure 8. Cascade control based on LADRC with LESO for the FBSPI.
Cleantechnol 06 00024 g008
Figure 9. Hardware prototype: (1) current and voltage sensors, (2) buck–boost converter, (3) FBSPI, (4) solar photovoltaic emulator, (5) dSPACE and protection, (6) lead-acid batteries, (7) induction motor, (8) PMBLDC generator, (9) three-phase diode bridge, (10) speed and torque sensor, and (11) loads.
Cleantechnol 06 00024 g009
Figure 10. (a) Dynamic performance at the PCC voltage ( V L ) and load current ( i L ) under increasing and decreasing load, and (b) zoom-in waveforms between t = 0.35 s and t = 0.85 s.
Cleantechnol 06 00024 g010aCleantechnol 06 00024 g010b
Figure 11. Performance without MPPT technique of the mechanical torque ( T m ), stator voltage of phase ‘a’ ( v s a ), stator current of phase ‘a’ ( i s a ), and DC at the output of three-phase diode bridge ( i W T ) under wind speed variation.
Cleantechnol 06 00024 g011
Figure 12. Dynamic performance without MPPT technique of DC-link voltage ( V d c ) and its reference ( V d c ), battery current ( i b ) and its reference ( i b ), and PV current ( i P V ) and solar irradiation change.
Cleantechnol 06 00024 g012
Figure 13. Dynamic performance of the LADRC controllers of the buck-boost converter: (1) PWM and its zoomed waveform (red box) between (0.4 and 0.42 s) (2) DC link voltage error ( e V d c ) and its (3) tracking ( Z 1 ) and (4) disturbance ( Z 2 ) values, (5) battery current error ( e i b ), and its (6) tracking ( Z 3 ) and (7) disturbance ( Z 4 ) values and all operation conditions.
Cleantechnol 06 00024 g013
Figure 14. Dynamic performance of the LADRC controller LESO of the FBSPI in the d-axis: PWM and its zoom waveform between 0.4 s and 0.41 s (red box), the AC load voltage error ( e V L d ) on the d-axis and its tracking ( Z 5 ) and disturbance ( Z 6 ) values, converter current error on the d-axis ( e i n v d ), and its tracking ( Z 9 ) and the disturbance ( Z 10 ) values.
Cleantechnol 06 00024 g014
Figure 15. Dynamic performance of the LADRC controller LESO of the FBSPI in the q-axis: PWM and its zoom waveform (red box) between 0.4 s and 0.41 s, the AC load voltage error ( e V L q ) on the q-axis and its tracking ( Z 7 ) and disturbance ( Z 8 ) values, converter current error on the q-axis( e i n v q ), and its tracking ( Z 11 ) and the disturbance ( Z 12 ) values.
Cleantechnol 06 00024 g015
Figure 16. Performance of battery current ( i b ), load current ( i L ), load voltage ( v L ), and DC-link voltage ( v d c ) at (a) steady-state, (b) sudden increase in load, and (c) sudden decrease in load.
Cleantechnol 06 00024 g016
Figure 17. (a) Performance without MPPT technique under the absence of irradiation and wind of DC at the output of the TDB ( i W T ), stator current of phase ‘a’ ( i s a ), stator voltage of phase ‘a’ ( v s a ), and rotor speed ( ω r ), (b) the zoomed waveforms of (a).
Cleantechnol 06 00024 g017
Figure 18. Performance without the MPPT technique of DC at the output of TDB ( i W T ), battery current ( i b ), load voltage ( V L ), and DC link voltage ( V d c ) during (a) sudden increase, and (b) decrease in wind speed, and (c) the zoomed waveforms of (a).
Cleantechnol 06 00024 g018
Figure 19. Characteristics without MPPT technique of the P P V = f ( V P V ) , and i P V = f ( V P V ) under presence of solar irradiation, (a) 300 W/m2, and (b) 700 W/m2.
Cleantechnol 06 00024 g019
Figure 20. Performance without MPPT technique of the ESS current ( i b ), PV current ( i P V ), load voltage ( V L ), and DC link voltage ( V d c ) under sudden (a) increase in solar irradiation, (b) decrease in solar irradiation and (c) the zoomed waveforms of (a).
Cleantechnol 06 00024 g020aCleantechnol 06 00024 g020b
Figure 21. (a) Dynamic performance without MPPT technique of the battery current ( i b ), load current ( i L ), PCC voltage ( v L ), and DC link voltage ( V d c ), (b) battery current ( i b ), DC WT current ( i W T ), PV current ( i P V ), and DC-link voltage ( V d c ) under sudden increasing in the solar irradiation and decreasing in the wind speed.
Cleantechnol 06 00024 g021aCleantechnol 06 00024 g021b
Disclaimer/Publisher’s Note: The statements, opinions and data contained in all publications are solely those of the individual author(s) and contributor(s) and not of MDPI and/or the editor(s). MDPI and/or the editor(s) disclaim responsibility for any injury to people or property resulting from any ideas, methods, instructions or products referred to in the content.

