
On-Site Determination of Soil Organic Carbon Content: A Photocatalytic Approach


Abstract
:
1. Introduction
2. Materials and Methods
- %WBC: Organic carbon in the soil sample measured in the reaction.
- VBlank: Volume of titrant in blank titration.
- VSample: Volume of titrant in sample titration.
- M_(Fe2+): Concentration of ferrous sulfate.
- mcf: Moisture correction factor.
- W: Weight of the soil sample.
3. Results and Discussion
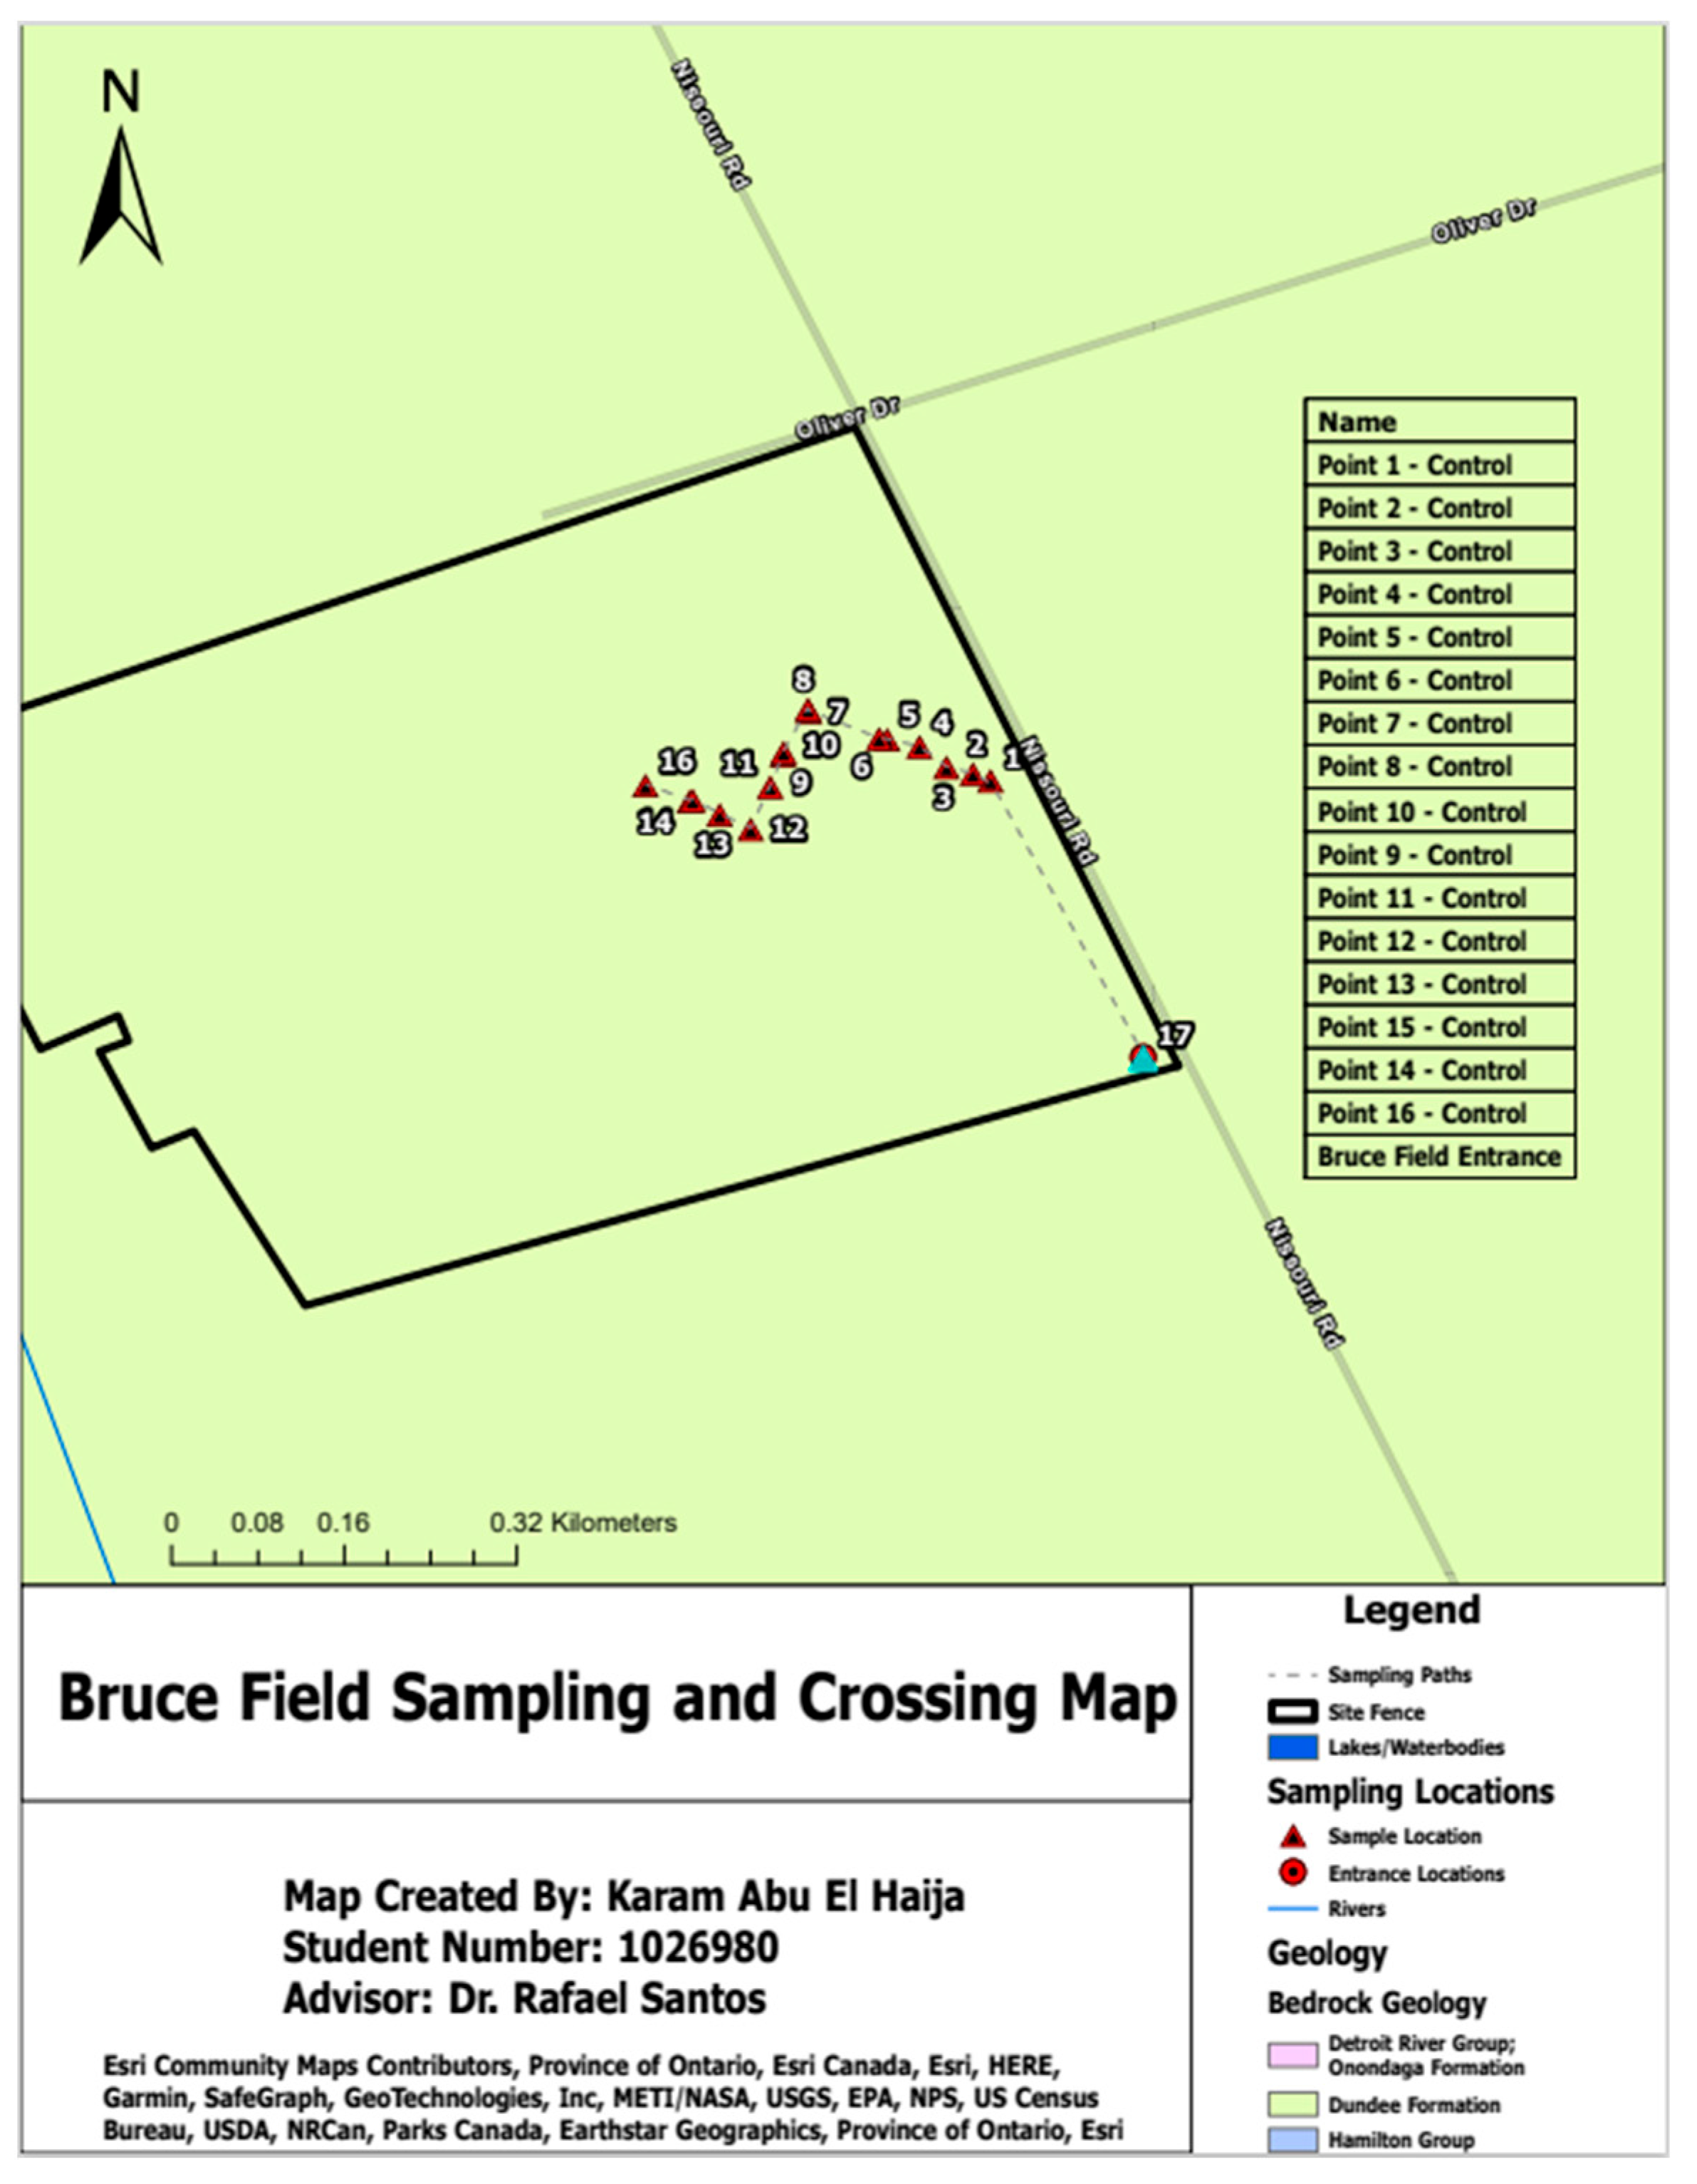
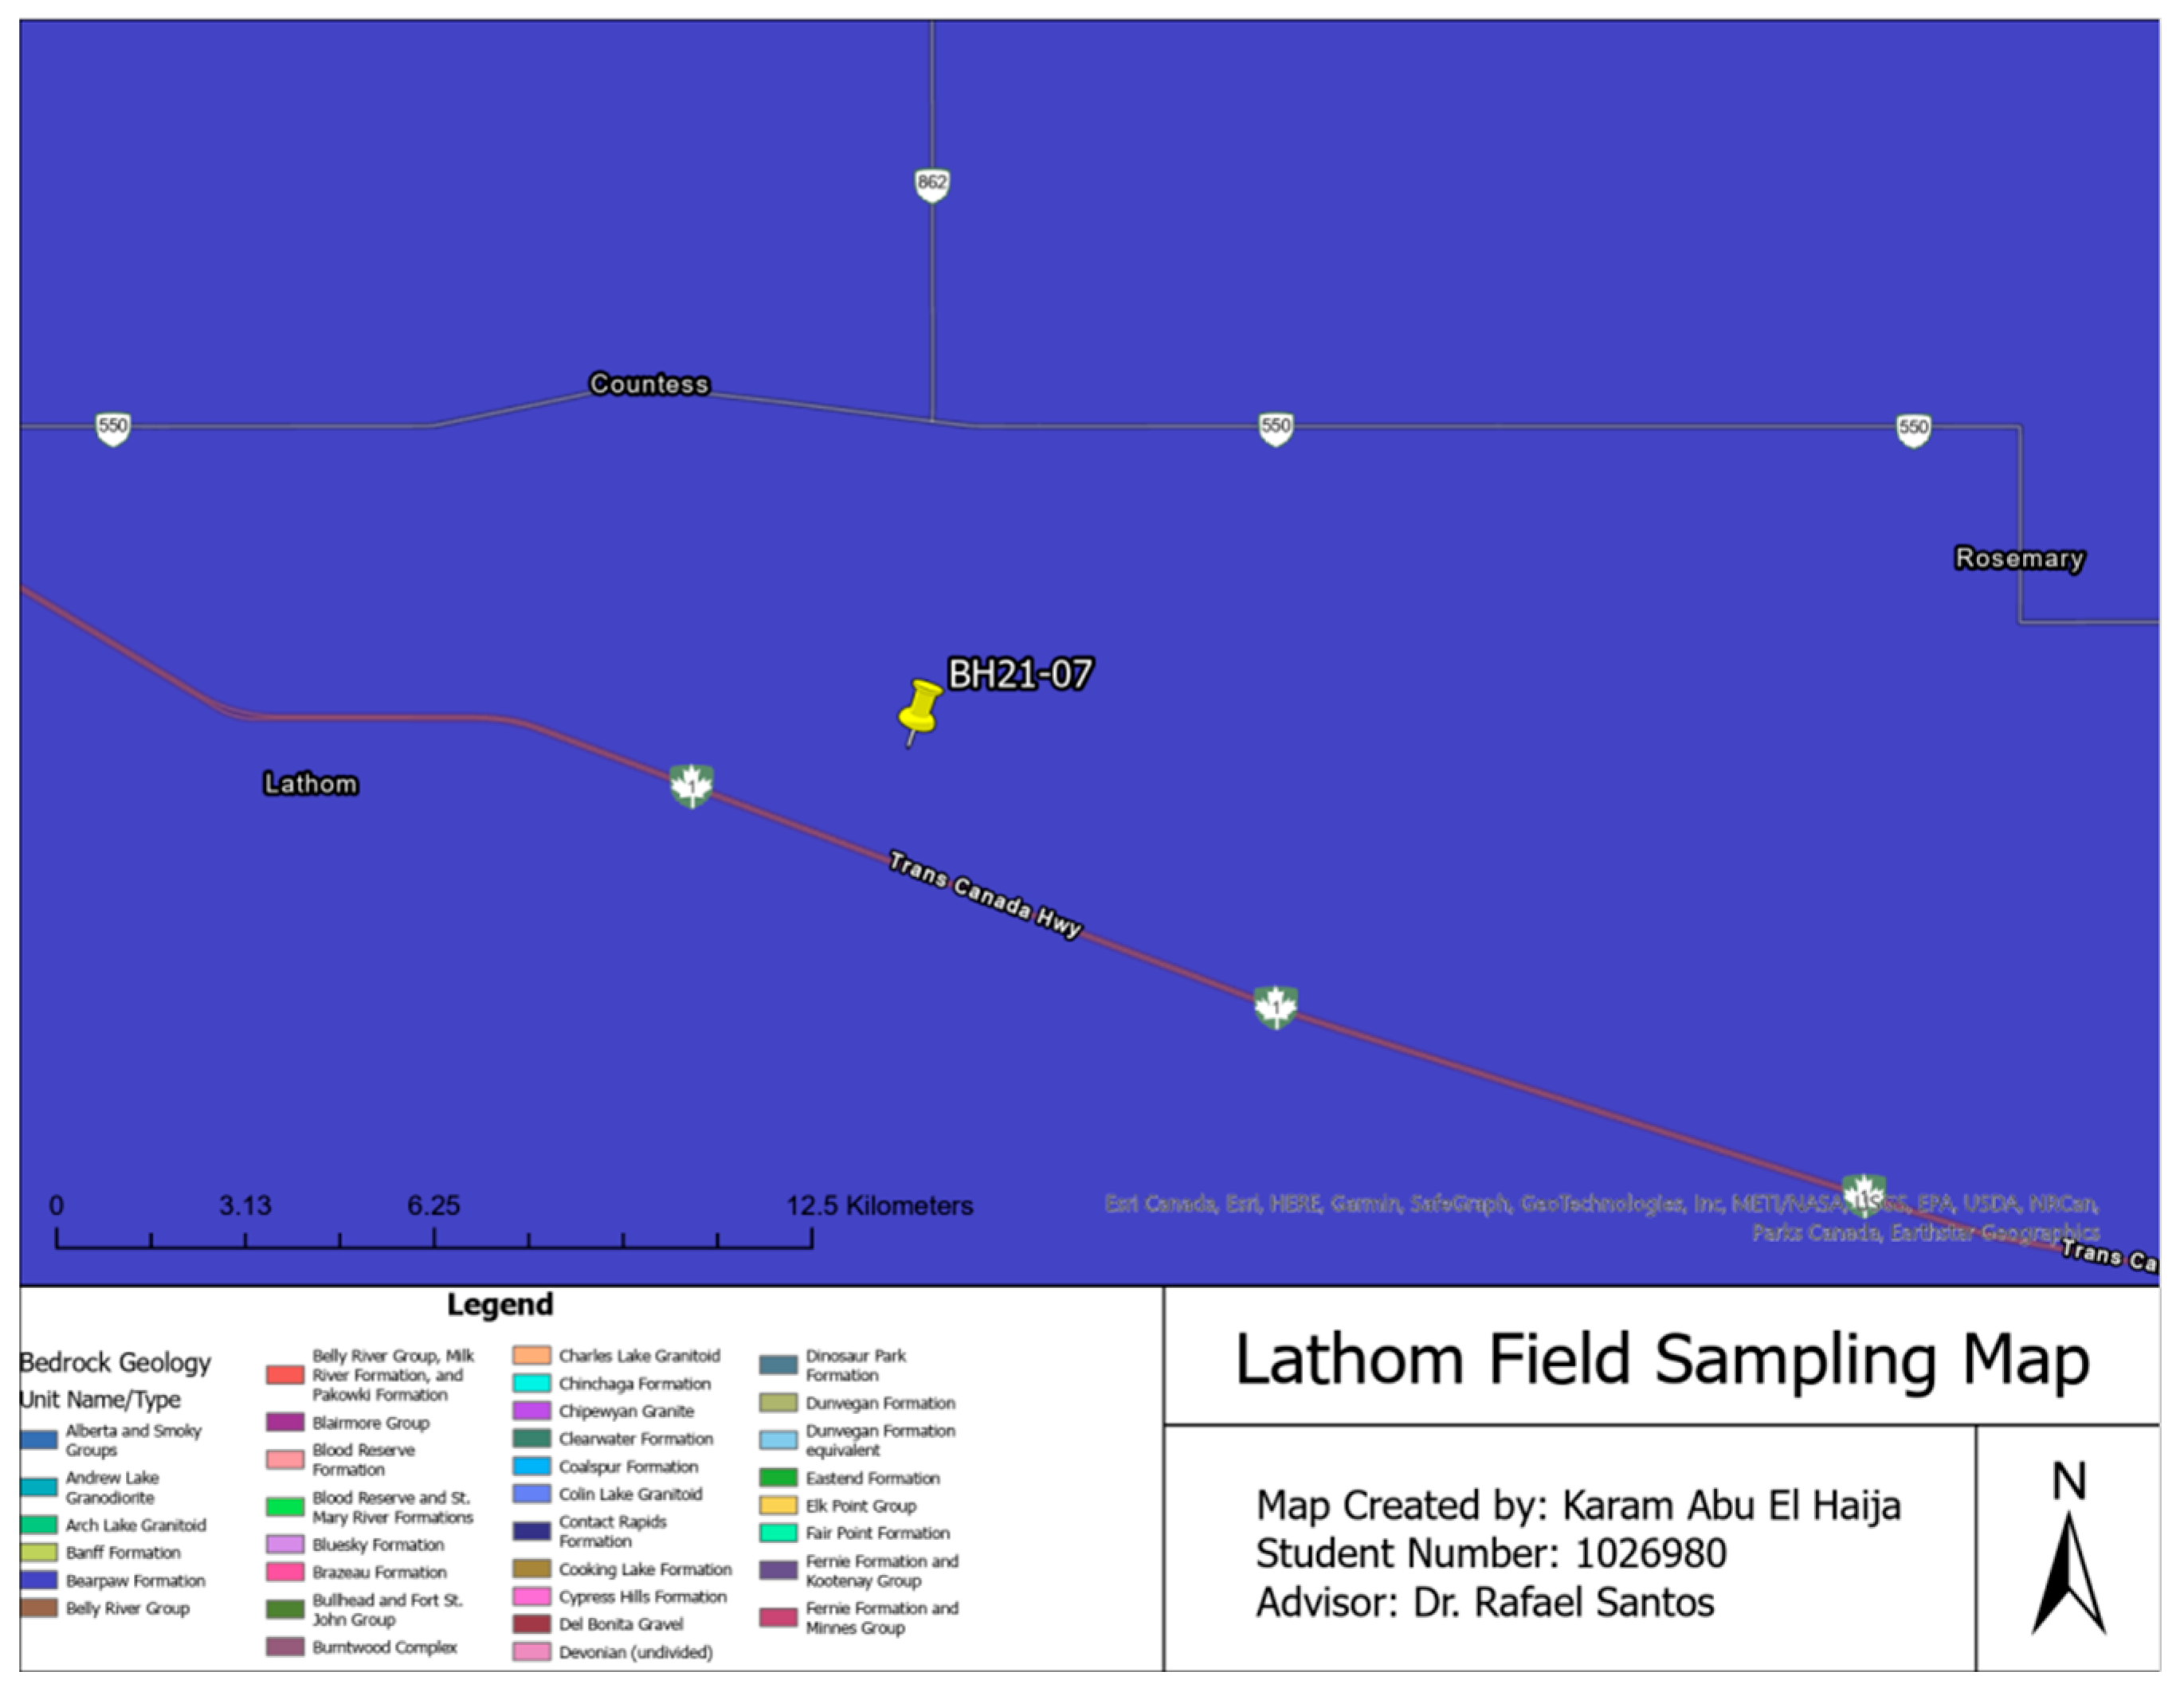
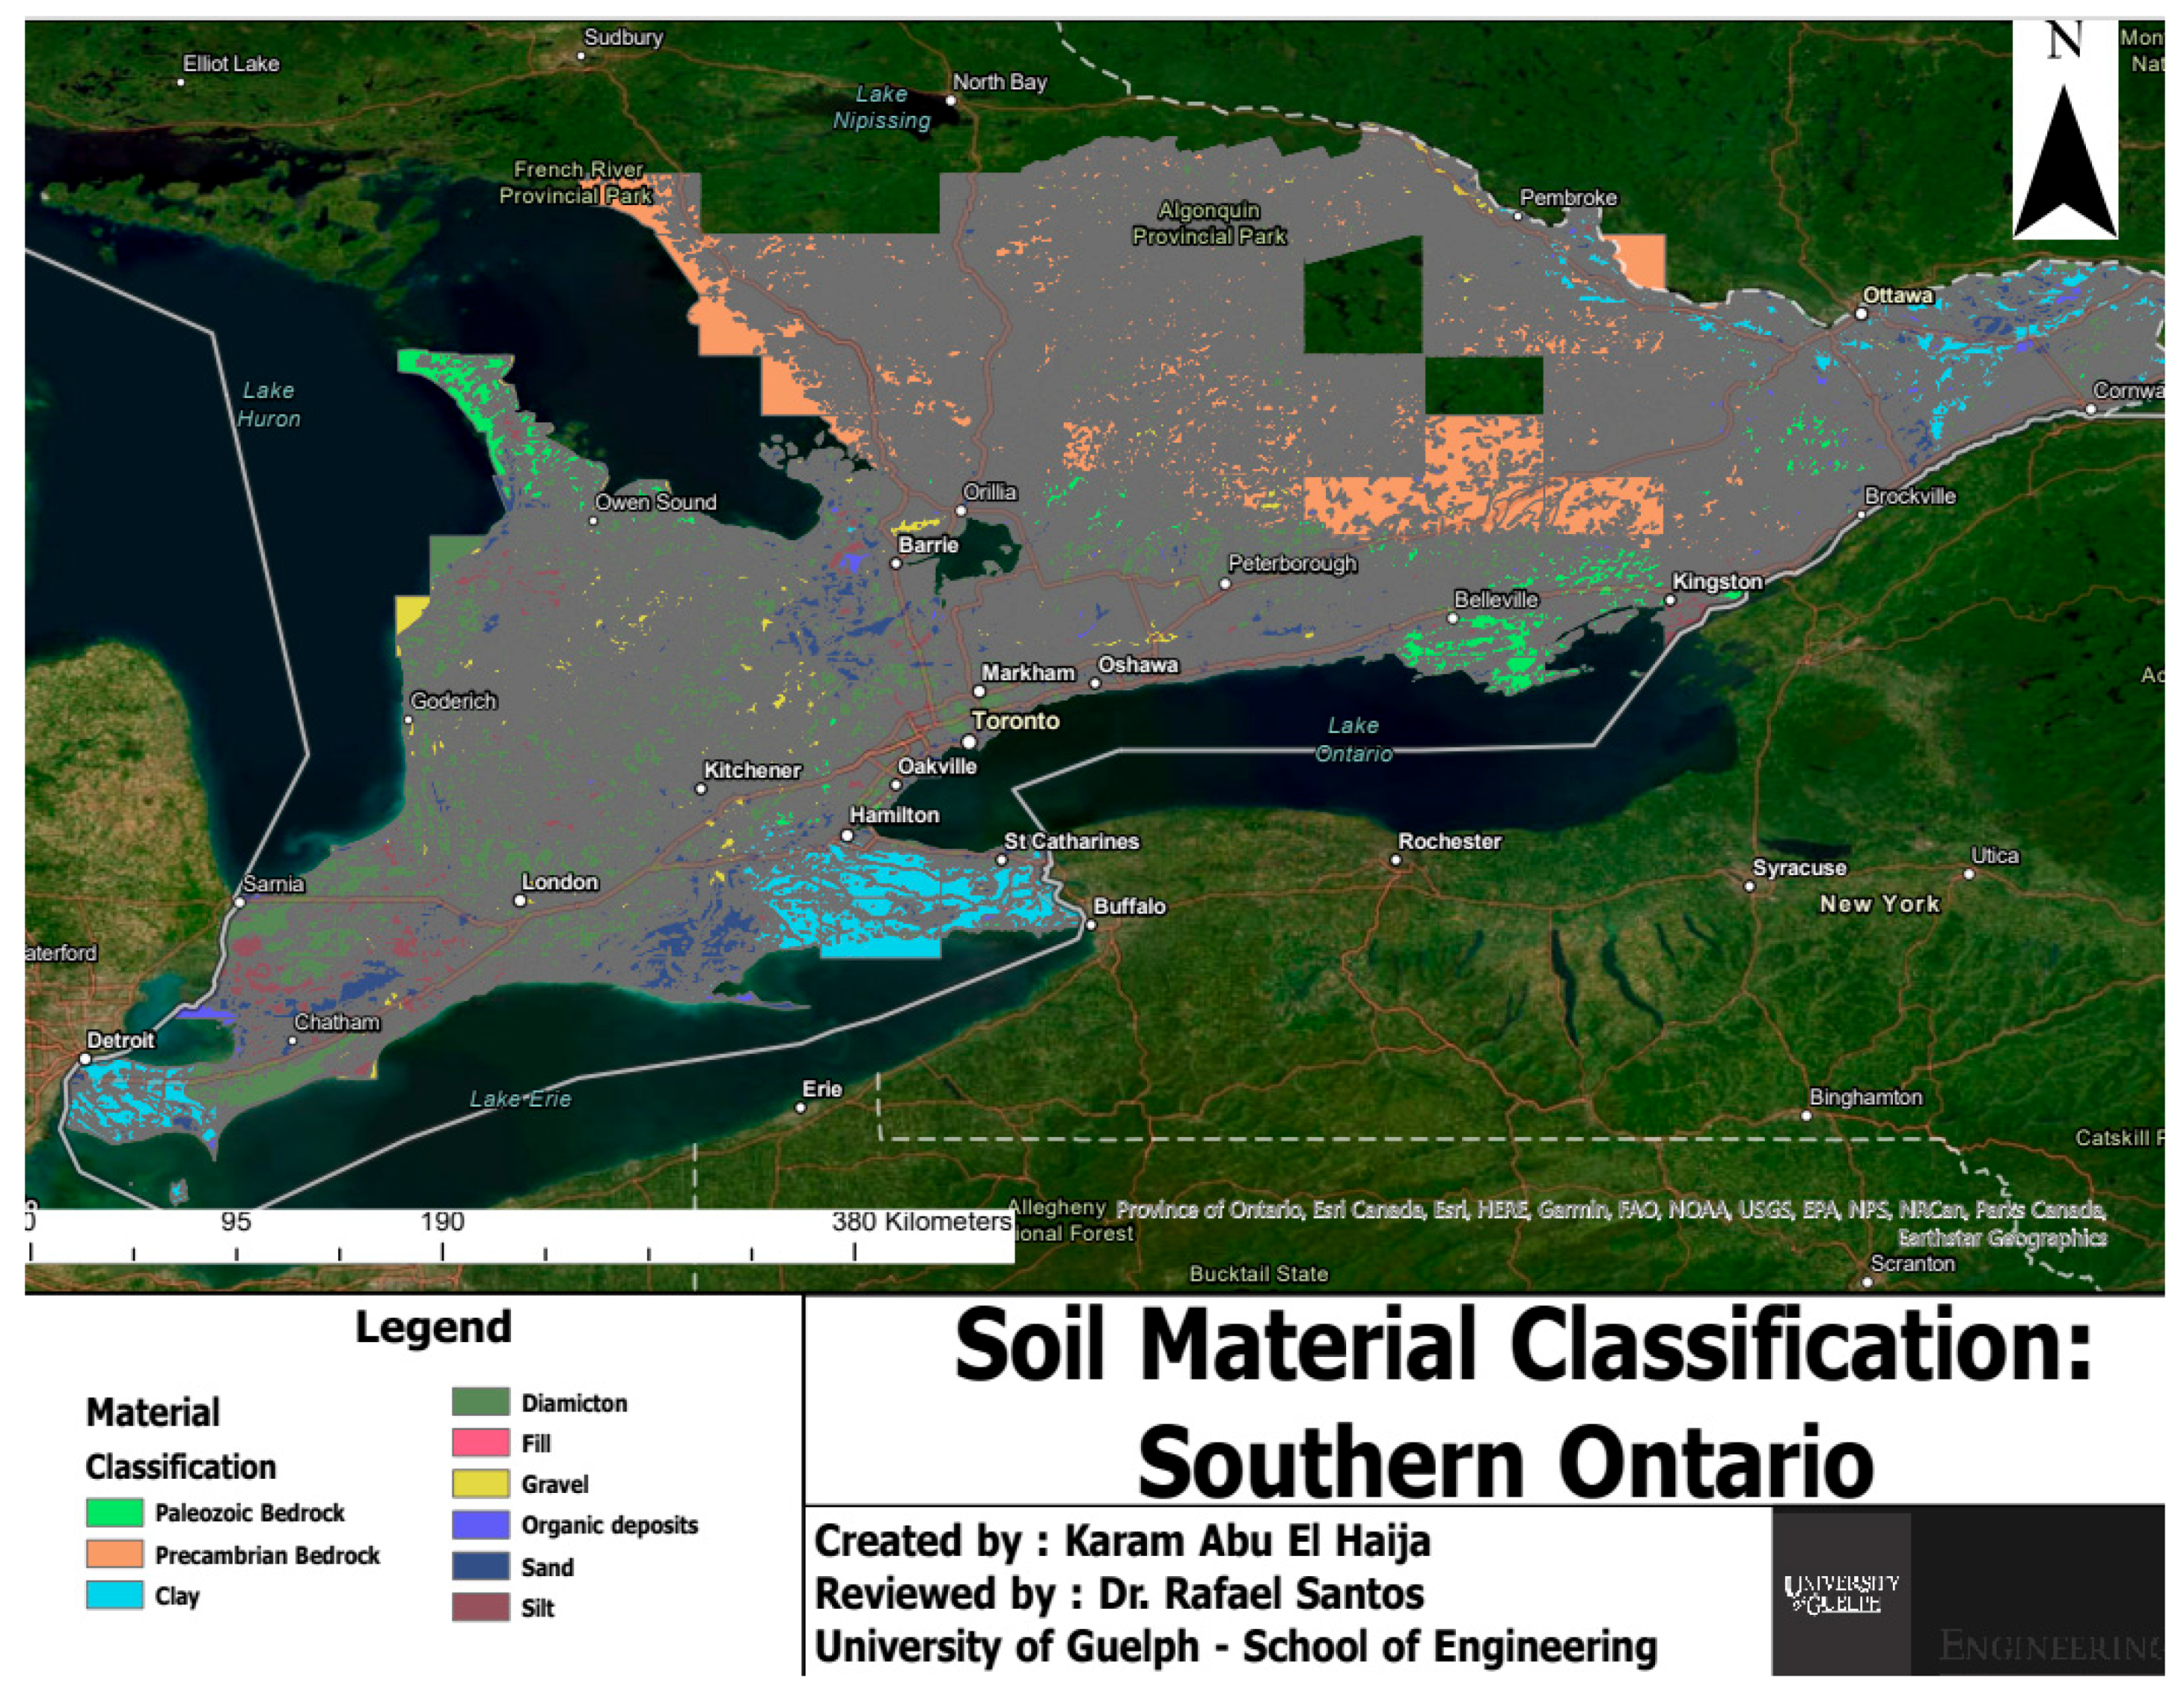
3.1. Sampling Locations
3.2. Physical Fractionation
3.3. Loss on Ignition (LOI) Method
3.4. Walkley–Black Method
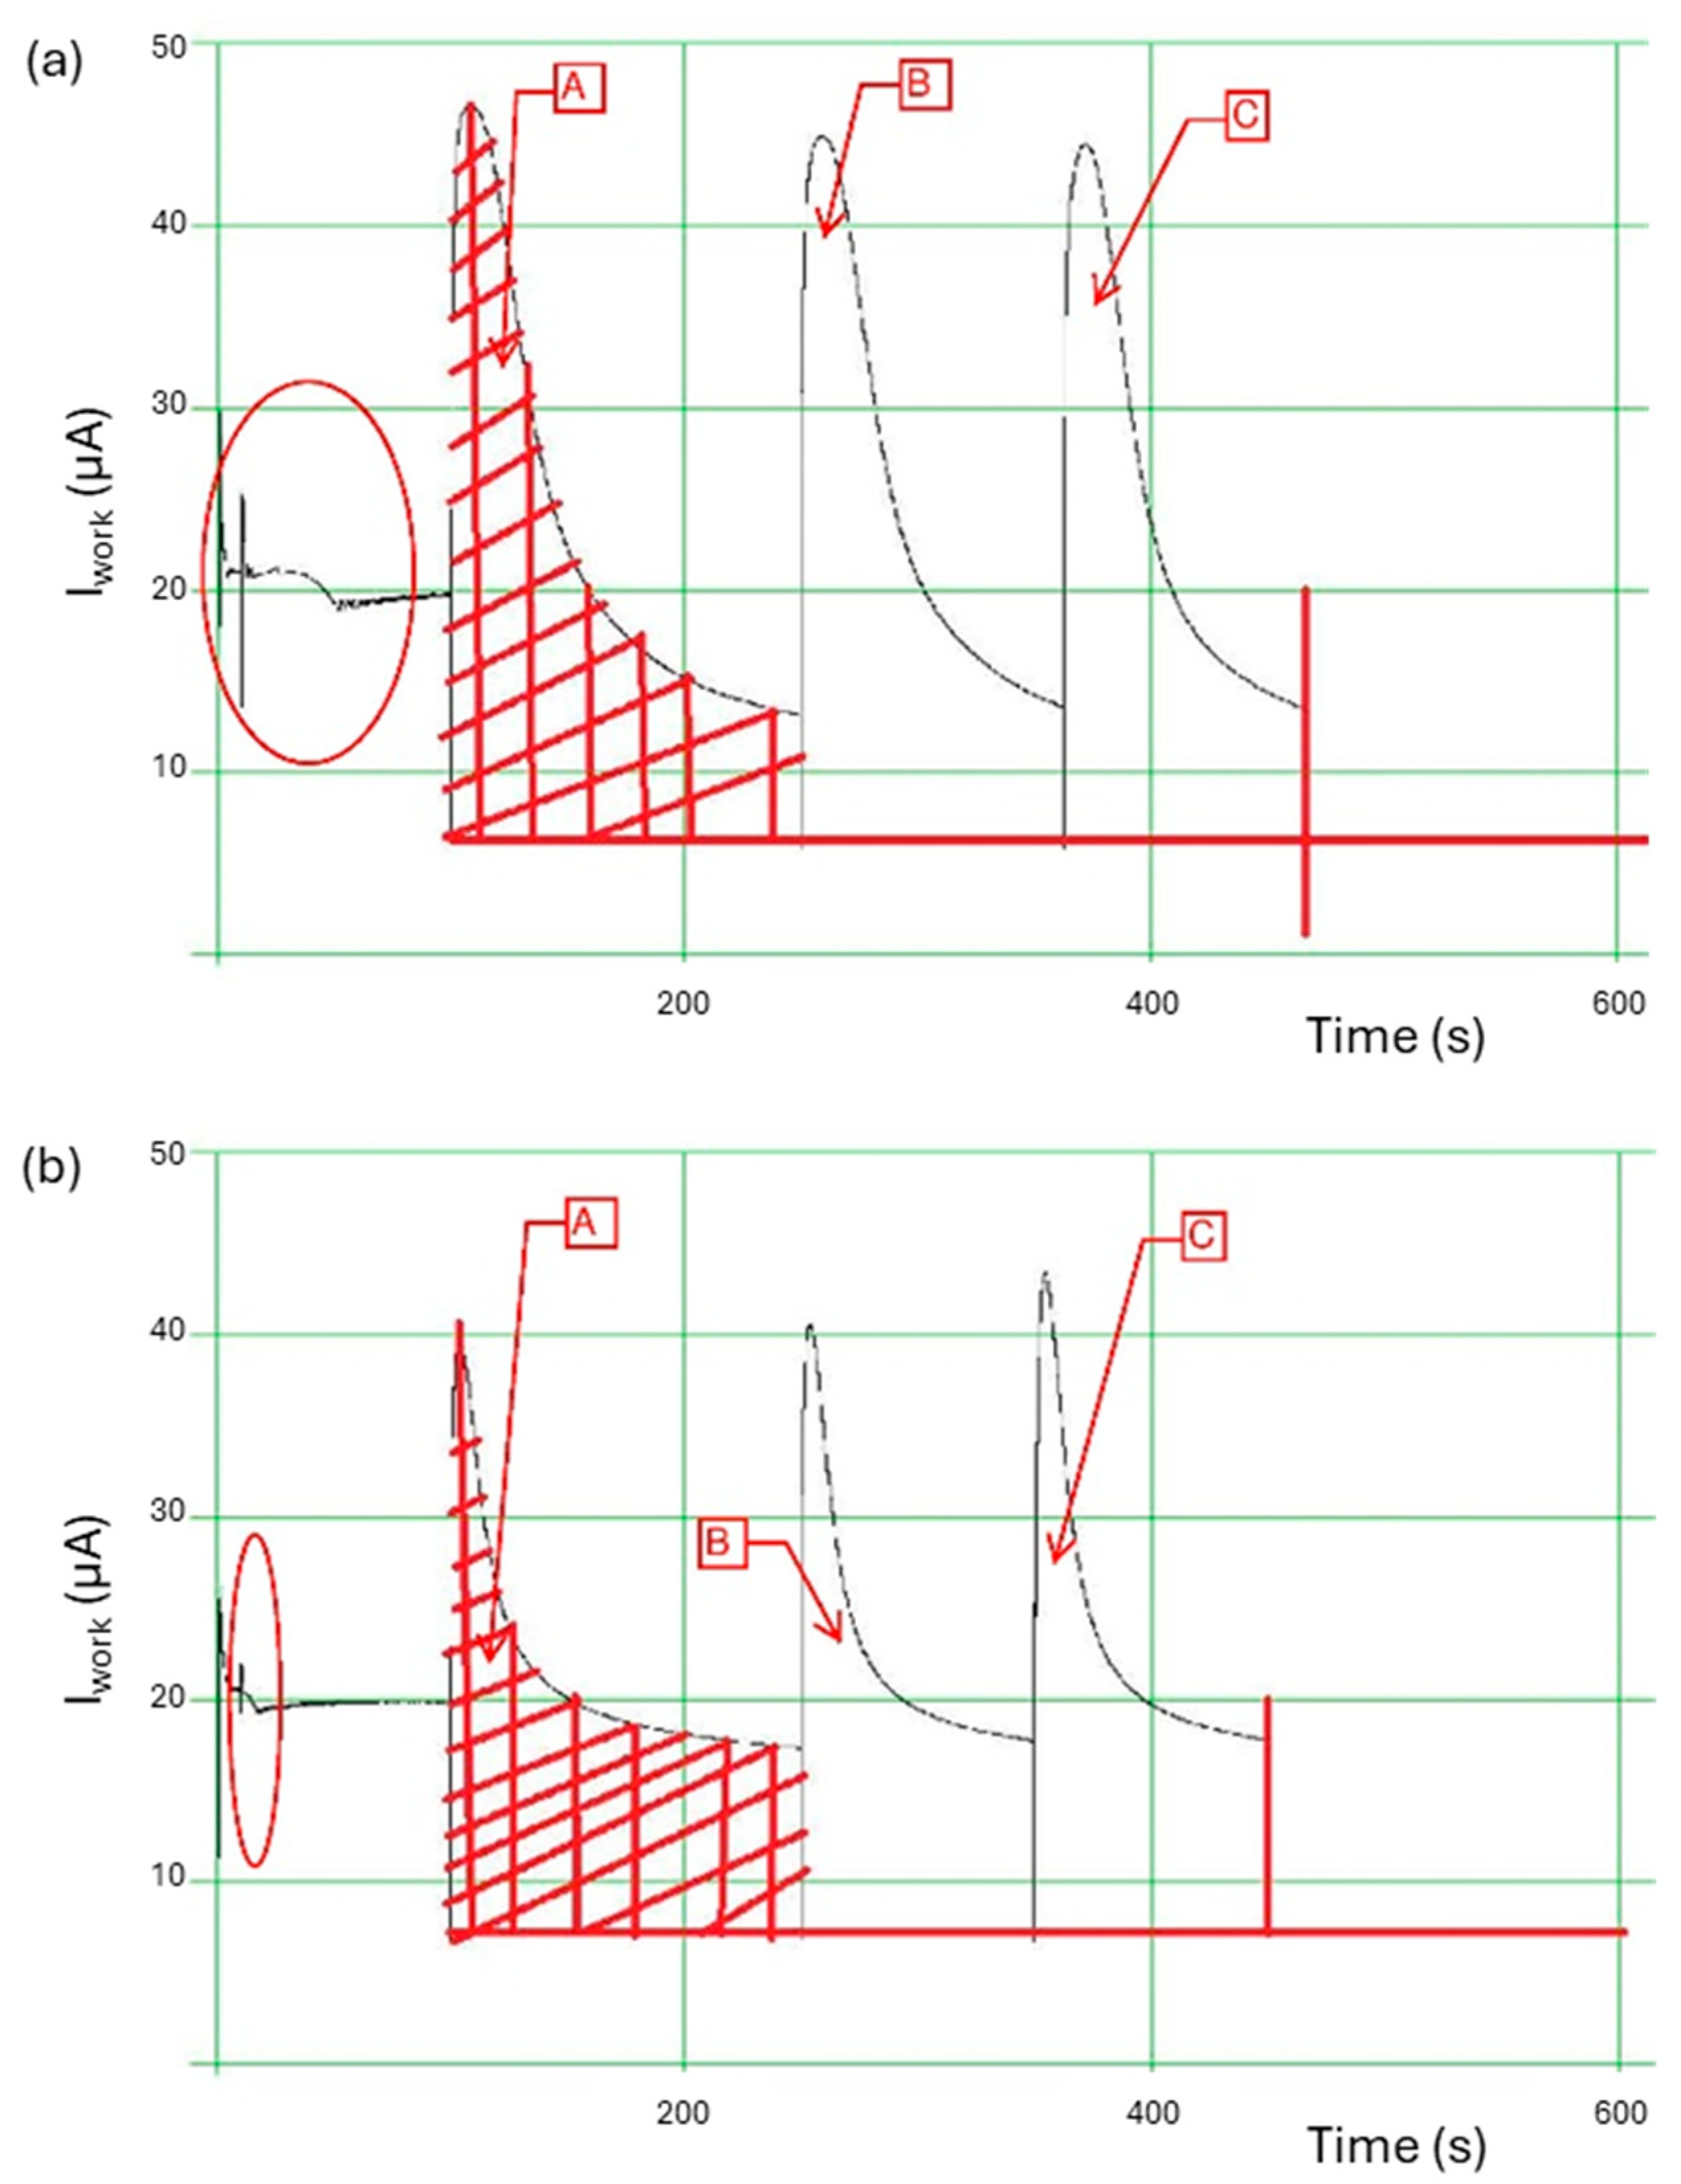
3.5. PeCOD Analysis
3.6. Geographic Information System (GIS)
4. Conclusions
Author Contributions
Funding
Data Availability Statement
Acknowledgments
Conflicts of Interest
References
- Agriculture and the Environment. Soil Organic Matter Indicator. 2022. Available online: https://agriculture.canada.ca/en/agriculture-and-environment/soil-and-land/soil-organic-matter-indicator (accessed on 13 April 2022).
- Statistics Canada. Table 32-10-0446-01 Farms Reporting Technologies Used on the Operation in the Year Prior to the Census. 2017. Available online: https://www150.statcan.gc.ca/t1/tbl1/en/tv.action?pid=3210044601 (accessed on 28 May 2024).
- Ontario Ministry of Agriculture, Food and Rural Affairs. Statistical Summary of Ontario Agriculture. 2016. Available online: http://www.omafra.gov.on.ca/english/stats/agriculture_summary.htm (accessed on 13 April 2022).
- Laamrani, A.; Voroney, P.R.; Berg, A.A.; Gillespie, A.W.; March, M.; Deen, B.; Martin, R.C. Temporal change of soil carbon on a long-term experimental site with variable crop rotations and tillage systems. Agronomy 2020, 10, 840. [Google Scholar] [CrossRef]
- Environment and Climate Change Canada. Pan-Canadian Framework on Clean Growth and Climate Change: Canada’s Plan to Address Climate Change and Grow the Economy. 2016. Available online: https://publications.gc.ca/pub?id=9.828774&sl=0 (accessed on 13 April 2022).
- Stockmann, U.; Adams, M.A.; Crawford, J.W.; Field, D.J.; Henakaarchchi, N.; Jenkins, M.; Minasny, B.; McBratney, A.B.; de Remy de Courcelles, V.; Singh, K.; et al. The knowns, known unknowns and unknowns of sequestration of soil organic carbon. Agric. Ecosyst. Environ. 2013, 164, 80–99. [Google Scholar] [CrossRef]
- Uyguner-Demirel, C.S.; Bekbolet, M. Significance of analytical parameters for the understanding of natural organic matter in relation to photocatalytic oxidation. Chemosphere 2011, 84, 1009–1031. [Google Scholar] [CrossRef] [PubMed]
- Stockmann, U.; Padarian, J.; McBratney, A.; Minasny, B.; de Brogniez, D.; Montanarella, L.; Hong, S.Y.; Rawlins, B.G.; Field, D.J. Global soil organic carbon assessment. Glob. Food Secur. 2015, 6, 9–16. [Google Scholar] [CrossRef]
- Lal, R. Soil health and carbon management. Food Energy Secur. 2016, 5, 212–222. [Google Scholar] [CrossRef]
- Lehmann, J.; Kleber, M. The contentious nature of soil organic matter. Nature 2015, 528, 60–68. [Google Scholar] [CrossRef] [PubMed]
- Chenu, C.; Angers, D.A.; Barré, P.; Derrien, D.; Arrouays, D.; Balesdent, J. Increasing organic stocks in agricultural soils: Knowledge gaps and potential innovations. Soil Tillage Res. 2015, 188, 41–52. [Google Scholar] [CrossRef]
- Wiesmeier, M.; Hübner, R.; Spörlein, P.; Geuß, U.; Hangen, E.; Reischl, A.; Schilling, B.; von Lützow, M.; Kögel-Knabner, I. Carbon sequestration potential of soils in southeast Germany derived from stable soil organic carbon saturation. Glob. Chang. Biol. 2014, 20, 653–665. [Google Scholar] [CrossRef]
- Kopittke, P.M.; Dalal, R.C.; Hoeschen, C.; Lia, C.; Menzies, N.W.; Mueller, C.W. Soil organic matter is stabilized by organo-mineral associations through two key processes: The role of the carbon to nitrogen ratio. Geoderma 2020, 357, 113974. [Google Scholar] [CrossRef]
- Dubber, D.; Gray, N.F. Replacement of chemical oxygen demand (COD) with total organic carbon (TOC) for monitoring wastewater treatment performance to minimize disposal of toxic analytical waste. J. Environ. Sci. Health Part A Toxic Hazard. Subst. Environ. Eng. 2010, 45, 1595–1600. [Google Scholar] [CrossRef]
- Dhillon, G.S.; Amichev, B.Y.; de Freitas, R.; Van Rees, K. Accurate and Precise Measurement of Organic Carbon Content in Carbonate-Rich Soils. Commun. Soil Sci. Plant Anal. 2015, 46, 2707–2720. [Google Scholar] [CrossRef]
- Davis, M.R.; Alves, B.J.R.; Karlen, D.L.; Kline, K.L.; Galdos, M.; Abulebdeh, D. Review of Soil Organic Carbon Measurement Protocols: A U.S. and Brazil Comparison and Recommendation. Sustainability 2018, 10, 53. [Google Scholar] [CrossRef]
- Nayak, A.K.; Rahman, M.M.; Naidu, R.; Dhal, B.; Swaina, C.K.; Nayak, A.D.; Tripathi, R.; Shahid, M.; Islam, M.R.; Pathak, H. Current and emerging methodologies for estimating carbon sequestration in agricultural soils: A review. Sci. Total Environ. 2019, 665, 890–912. [Google Scholar] [CrossRef] [PubMed]
- Smith, P.; Soussana, J.-F.; Angers, D.; Schipper, L.; Chenu, C.; Rasse, D.P.; Batjes, N.H.; van Egmond, F.; McNeill, S.; Kuhnert, M.; et al. How to measure, report and verify soil carbon change to realize the potential of soil carbon sequestration for atmospheric greenhouse gas removal. Glob. Chang. Biol. 2020, 26, 219–241. [Google Scholar] [CrossRef] [PubMed]
- Araujo, F.S.M.; Fantucci, H.; Lima, S.H.O.; Abreu, M.C.S.; Santos, R.M. Modeling Canadian farmer’s intention to adopt eco-friendly agricultural inputs and practices. Reg. Environ. Chang. 2022, 22, 44. [Google Scholar] [CrossRef]
- Fantucci, H.; Aguirre, M.; Santos, R.M. Wet air oxidation route for the synthesis of organomineral fertilizer from synergistic wastes (pomace and kimberlite). Ind. Eng. Chem. Res. 2021, 60, 11657–11675. [Google Scholar] [CrossRef]
- Haque, F.; Santos, R.M.; Chiang, Y.W. CO2 sequestration by wollastonite-amended agricultural soils—An Ontario field study. Int. J. Greenh. Gas Control 2020, 97, 103017. [Google Scholar] [CrossRef]
- Creamer, C.A.; Filley, T.R.; Boutton, T.W. Long-term incubations of size and density separated soil fractions to inform soil organic carbon decay dynamics. Soil Biol. Biochem. 2013, 57, 496–503. [Google Scholar] [CrossRef]
- Goovaerts, P. Geostatistics in soil science: State-of-the-art and perspectives. Geoderma 1999, 89, 1–45. [Google Scholar] [CrossRef]
- ASTM C136; Standard Test Method for Sieve Analysis of Fine and Coarse Aggregates. ASTM International: West Conshohocken, PA, USA, 2015.
- Six, J.; Conant, R.T.; Paul, E.A.; Paustian, K. Stabilization mechanisms of soil organic matter: Implications for C-saturation of soils. Plant Soil 2002, 241, 155–176. [Google Scholar] [CrossRef]
- Schweizer, S.A.; Mueller, C.W.; Hoschen, C.; Ivanov, P.; Kogel-Knabner, I. The role of clay content and mineral surface area for soil organic carbon storage in an arable toposequence. Biogeochemistry 2021, 156, 401–420. [Google Scholar] [CrossRef]
- Schumacher, B.A.; Methods for the Determination of Total Organic Carbon (TOC) in Soil and Sediments. United States Environmental Protection Agency. 2002. Available online: http://bcodata.whoi.edu/LaurentianGreatLakes_Chemistry/bs116.pdf (accessed on 28 May 2024).
- Walkley, A.; Black, I.A. An Examination of the Degtjareff Method for Determining Soil Organic Matter, and a Proposed Modification of the Chromic Acid Titration Method. Soil Sci. 1934, 37, 29–38. [Google Scholar]
- Food and Agriculture Organization of the United Nations (FAO). Standard Operating Procedure for Soil Organic Carbon. Walkley-Black Method: Titration and Colorimetric Method. 2019. Available online: http://www.fao.org/publications/card/en/c/CA7471EN/ (accessed on 28 May 2024).
- Aliste, M.; Garrido, I.; Flores, P.; Hellín, P.; Pérez-Lucas, G.; Navarro, S.; Fenoll, J. Photocatalytic degradation of four insecticides and their main generated transformation products in soil and pepper crop irrigated with reclaimed agro-wastewater under natural sunlight. J. Hazard. Mater. 2021, 414, 125603. [Google Scholar] [CrossRef] [PubMed]
- Anandhakumari, G.; Jayabal, P.; Balasankar, A.; Ramasundaram, S.; Oh, T.H.; Aruchamy, K.; Kallem, P.; Polisetti, V. Synthesis of strontium oxide-zinc oxide nanocomposites by co-precipitation method and its application for degradation of malachite green dye under direct sunlight. Heliyon 2023, 9, e20824. [Google Scholar] [CrossRef] [PubMed]
- Subramaniyan, R.; Athinarayanan, B.; Oh, T.H. Multi-usable titanium dioxide and poly (vinylidene fluoride) composite foam photocatalyst for degradation of organic pollutants. SSRN 2022, 4177577. [Google Scholar] [CrossRef]
- Canadian Council of Independent Laboratories (CCIL). List of Certified Laboratories. 2023. Available online: https://www.ccil.com/certification/list-of-certified-laboratories/ (accessed on 6 June 2024).
- Jobbágy, E.; Jackson, R. The Vertical Distribution of Soil Organic Carbon and Its Relation to Climate and Vegetation. Ecol. Appl. 2000, 10, 423–436. [Google Scholar] [CrossRef]
- Li, Q.; Li, A.; Dai, T.; Fan, Z.; Luo, Y.; Li, S.; Yuan, D.; Zhao, B.; Tao, Q.; Wang, C.; et al. Depth-dependent soil organic carbon dynamics of croplands across the Chengdu Plain of China from the 1980s to the 2010s. Glob. Chang. Biol. 2020, 26, 4134–4146. [Google Scholar] [CrossRef] [PubMed]
- Ćirić, V.I.; Manojlović, M.; Svarc-Gajic, J.; Šeremešić, S. The Assessment of Soil Organic Carbon Pools in Different Soils Using Four Fractionation Methods. Commun. Soil Sci. Plant Anal. 2023, 54, 1910–1922. [Google Scholar] [CrossRef]
- Smith, P.; Smith, J.U.; Powlson, D.S.; McGill, W.B.; Arah, J.R.M.; Chertov, O.G.; Coleman, K.; Franko, U.; Frolking, S.; Jenkinson, D.S.; et al. A comparison of the performance of nine soil organic matter models using datasets from seven long-term experiments. Geoderma 2018, 326, 50–67. [Google Scholar] [CrossRef]
- Environment and Parks Alberta. GeoDiscover Alberta. 2024. Available online: https://geodiscover.alberta.ca (accessed on 13 April 2024).
- Ministry of Mines of Ontario. GeologyOntario. 2024. Available online: https://www.geologyontario.mndm.gov.on.ca (accessed on 13 April 2024).


| Soil Samples | Sampling Location | Sampling Depth | Sampling Method |
|---|---|---|---|
| Bruce Field Samples (Control and Wollastonite Zones) | London, Ontario | Up to 30 cm | Strip sampling |
| Lathom Field Samples | Lathom, Alberta | Up to 120 cm | Boreholes |
| Loewith Field Samples | Hamilton, Ontario | Up to 30 cm | Test pits |
| Soil Fraction | Lathom Field | Bruce Field—Control Zone | Bruce Field—Wollastonite Zone | Loewith Field |
|---|---|---|---|---|
| Gravel (2 mm) | 0.0% | 0.1% | 0.0% | 0.0% |
| Coarse Sand (250 um) | 15% | 17% | 24% | 20% |
| Fine Sand (75 um) | 13% | 24% | 28% | 22% |
| Silt (<75 um) | 72% 1 | 59% 1 | 48% 1 | 58% 1 |
| Clay (<50 um) | - 2 | - 2 | - 2 | - 2 |
| Sample ID | Depth (mBGS) | Gravel 1 | Sand 2 | Silt 3 | Clay 4 |
|---|---|---|---|---|---|
| Lathom-BH7 | 1.2 | 0% | 16% | 55% | 29% |
| Type of Soil | 15 cm—Wollastonite Zone | 30 cm—Wollastonite Zone | Lathom Field | Loewith Field |
|---|---|---|---|---|
| Coarse Sand | 3.5% | 3.1% | 1.0% | 1.3% |
| Fine Sand | 3.8% | 3.2% | 1.2% | 1.3% |
| Silt | 4.4% | 4.4% | 1.5% | 1.4% |
| Mixed | 4.2% | 4.0% | 1.3% | 1.5% |
| Mean average | 3.9% | 3.7% | 1.2% | 1.4% |
| Standard deviation | 0.40% | 0.63% | 0.21% | 0.10% |
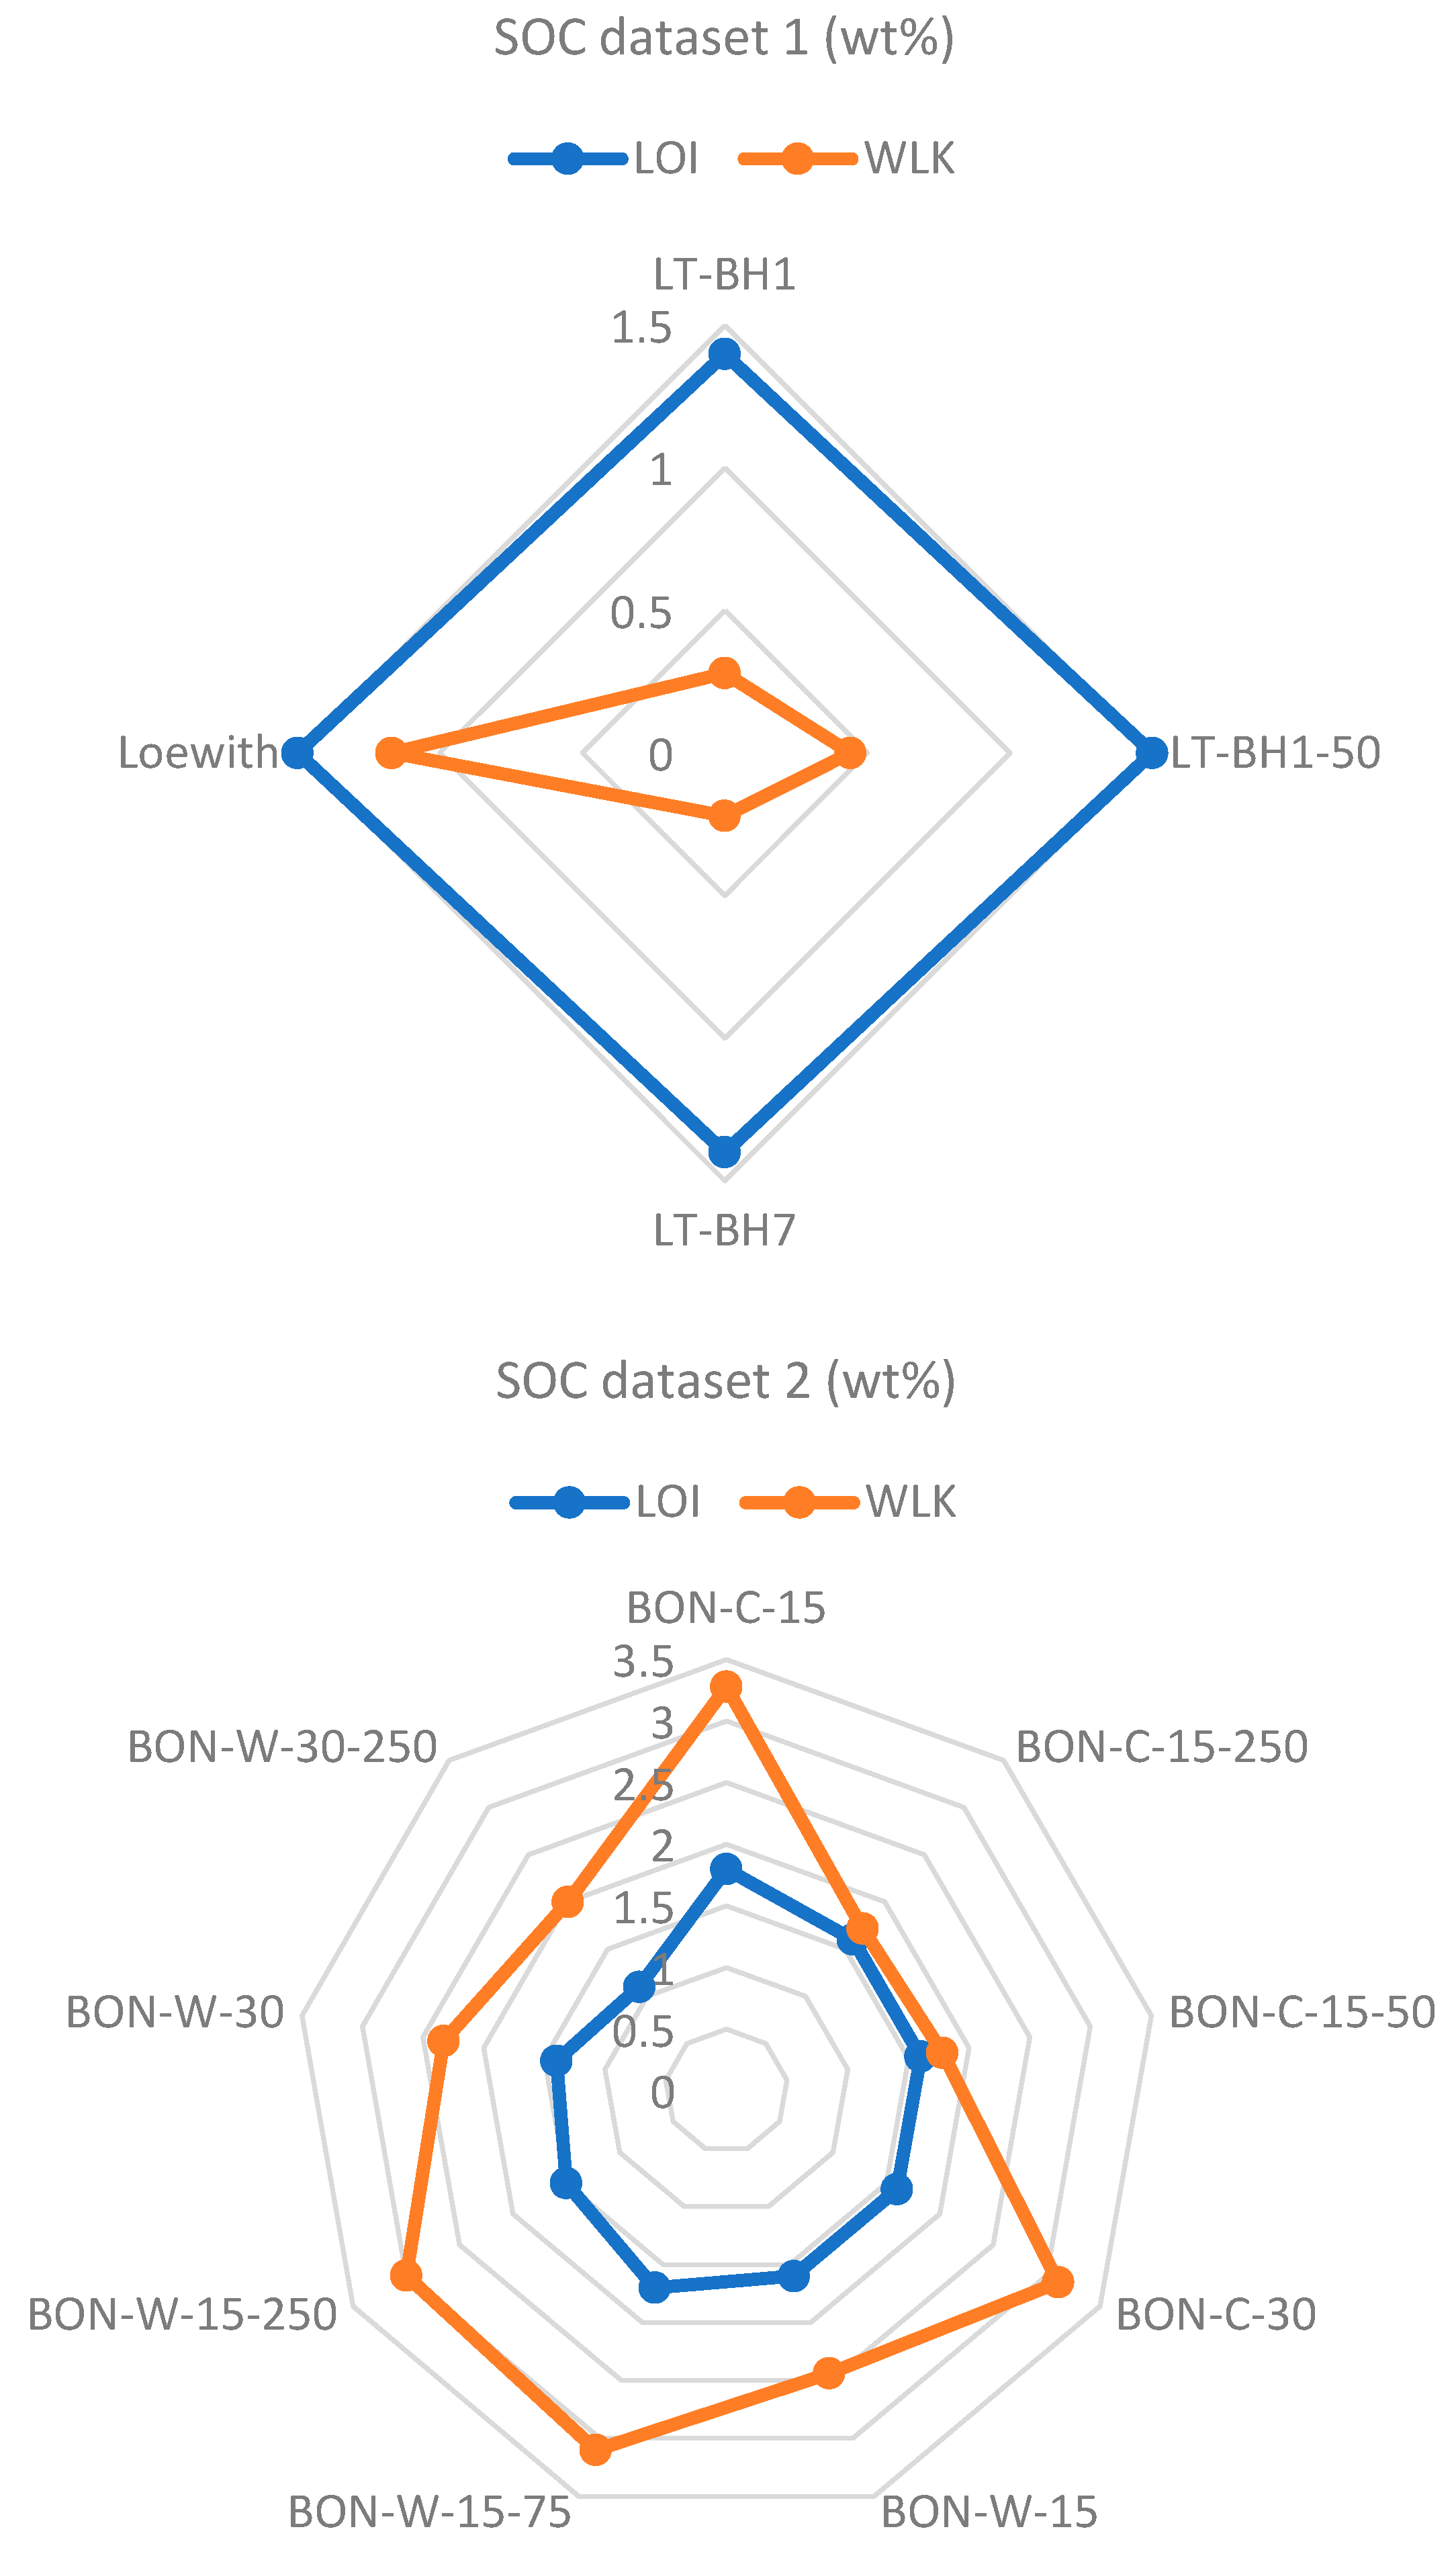
| Sample Name/ID | SOC (%) | Standard Deviation (Lathom) | Standard Deviation (Bruce—C) | Standard Deviation (Bruce—W) |
|---|---|---|---|---|
| LT-BH1 | 0.28 | 0.113 | ||
| LT-BH1-50 | 0.44 | |||
| LT-BH7 | 0.22 | |||
| Loewith | 1.17 | |||
| BON-C-15 | 3.28 | 0.837 | ||
| BON-C-15-50 | 1.78 | |||
| BON-C-15-250 | 1.72 | |||
| BON-C-30 | 3.11 | |||
| BON-W-15 | 2.44 | 0.465 | ||
| BON-W-15-75 | 3.1 | |||
| BON-W-15-250 | 3 | |||
| BON-W-30 | 2.33 | |||
| BON-W-30-250 | 2 |
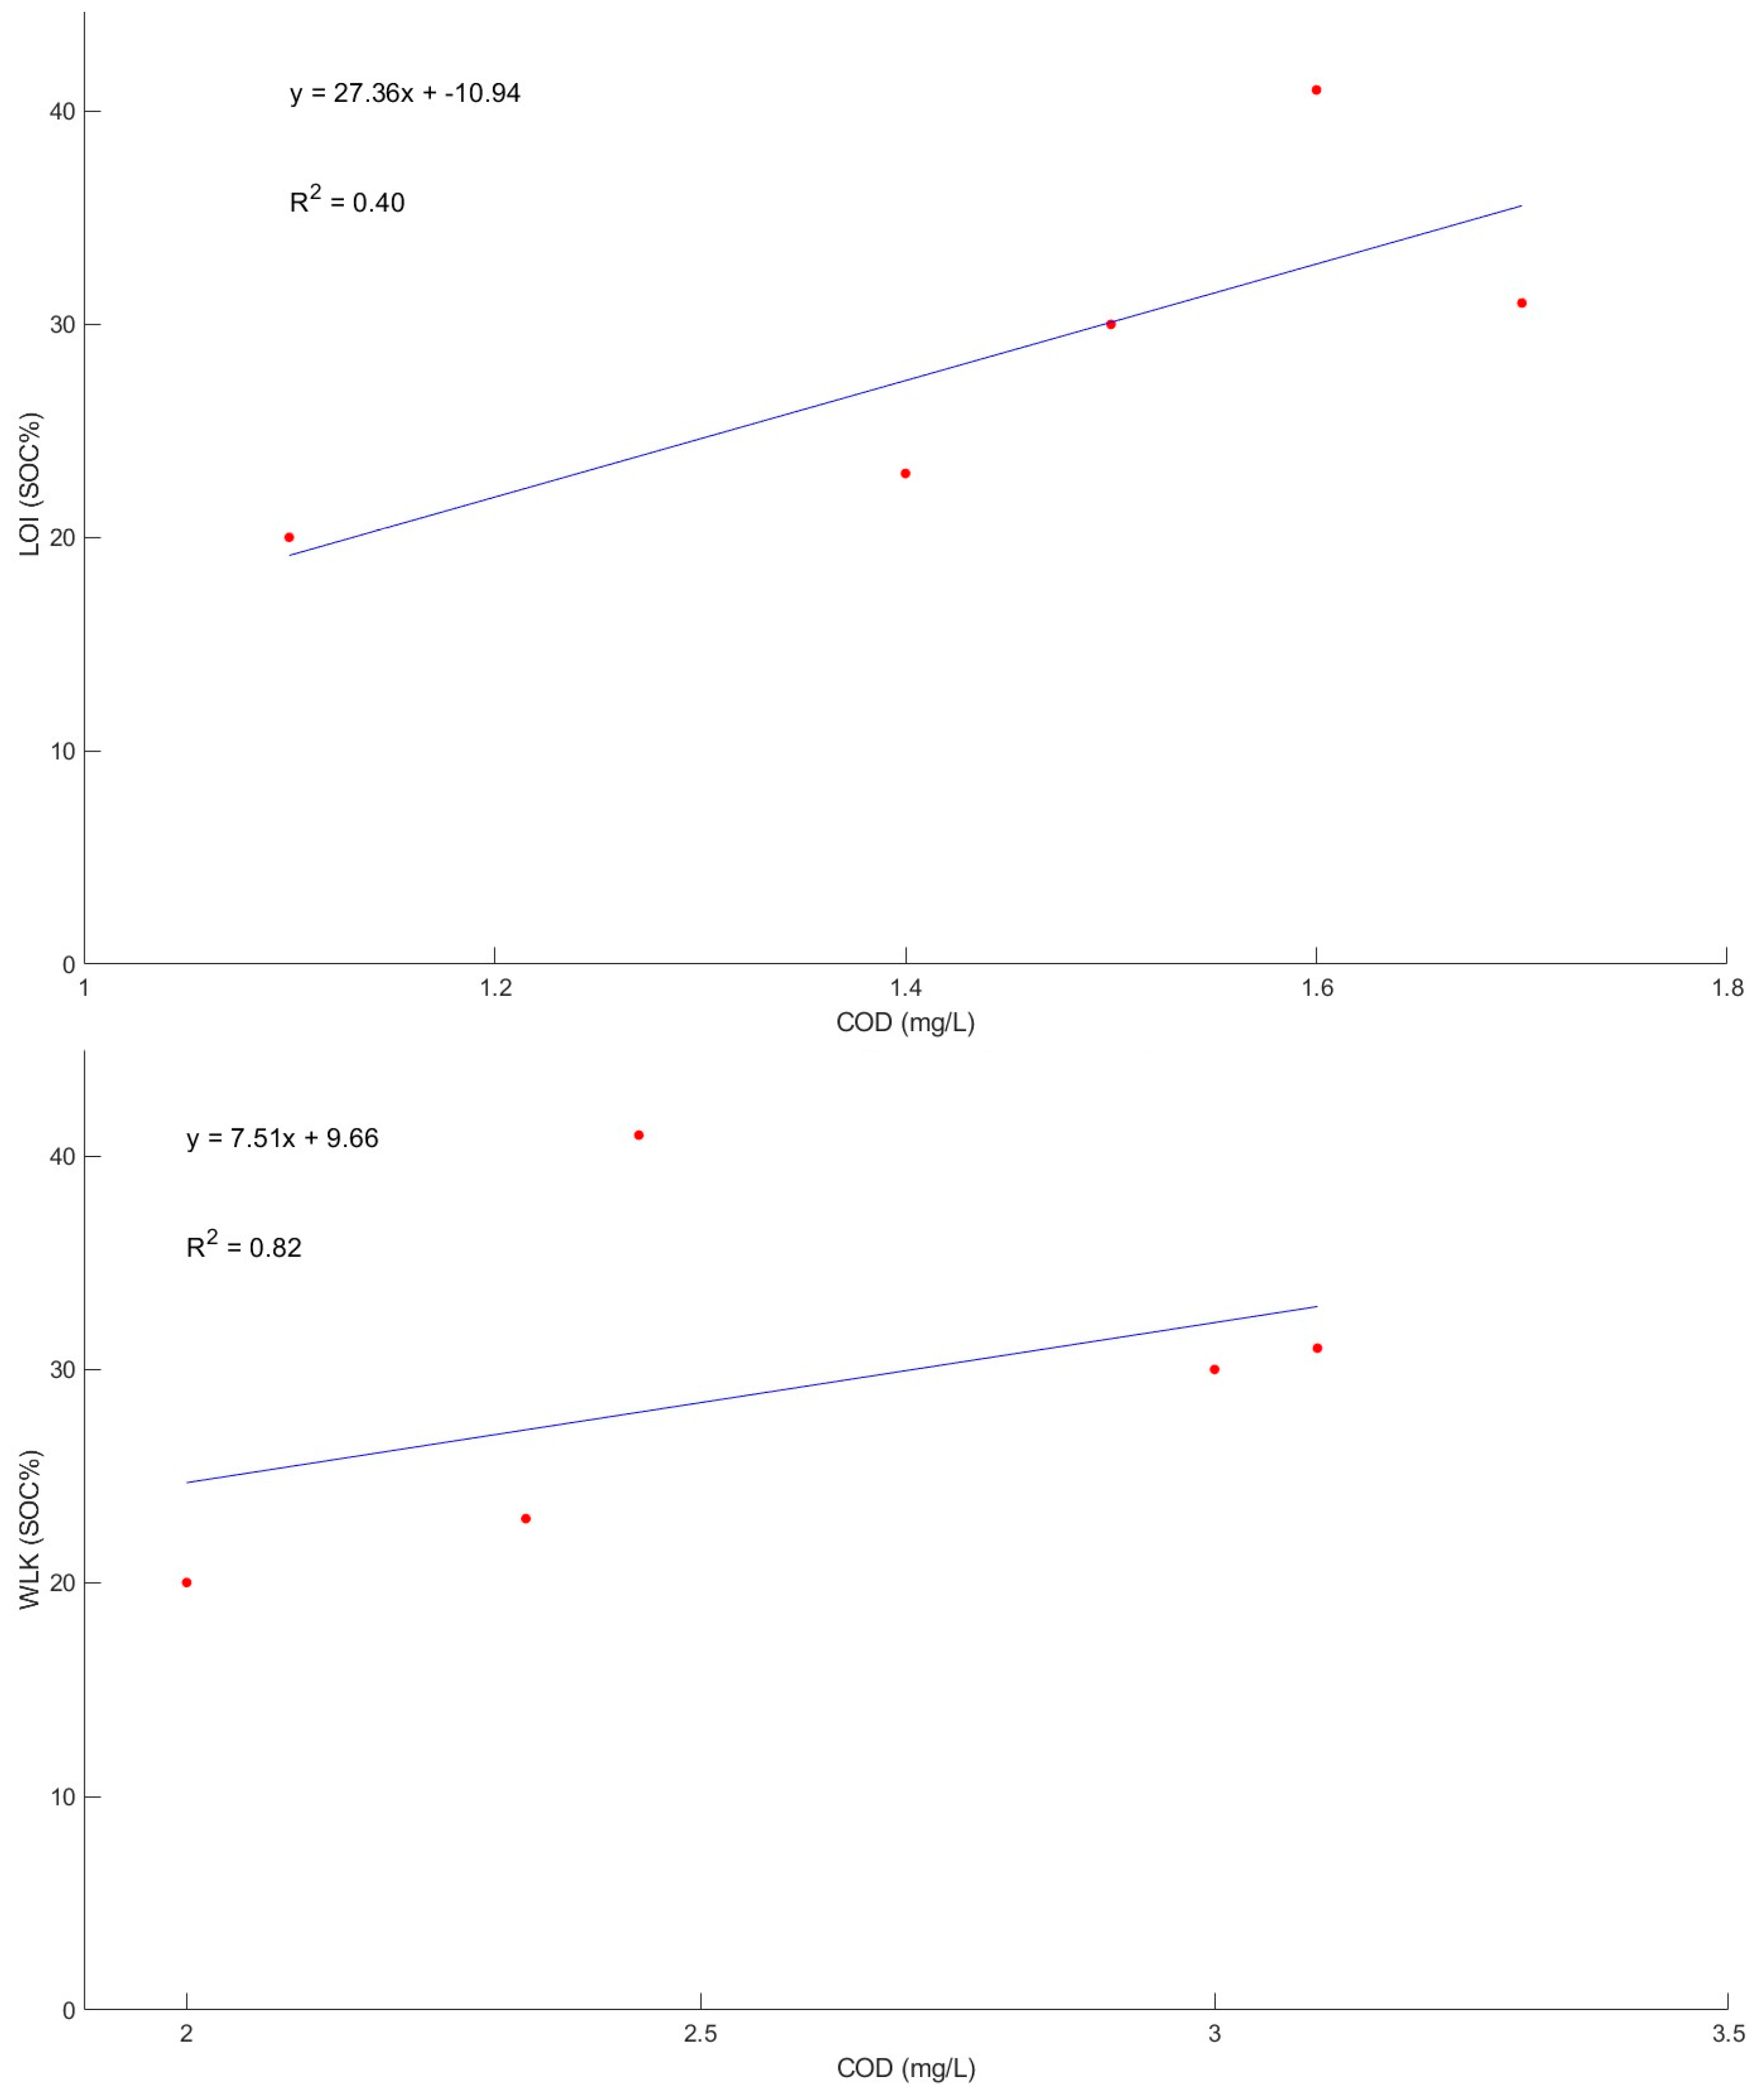
| Sample Name/ID | COD (mg/L) | Standard Deviation (Lathom) | Standard Deviation (Bruce—C) | Standard Deviation (Bruce—W) |
|---|---|---|---|---|
| LT-BH1 | 35 | 40.42 | ||
| LT-BH1-50 | 104 | |||
| LT-BH7 | 33 | |||
| Loewith | 59 | |||
| BON-C-15 | 148 | 71.28 | ||
| BON-C-15-50 | 256 | |||
| BON-C-15-250 | 236 | |||
| BON-C-30 | 106 | |||
| BON-W-15 | 41 | 8.15 | ||
| BON-W-15-75 | 31 | |||
| BON-W-15-250 | 30 | |||
| BON-W-30 | 23 | |||
| BON-W-30-250 | 20 |
Disclaimer/Publisher’s Note: The statements, opinions and data contained in all publications are solely those of the individual author(s) and contributor(s) and not of MDPI and/or the editor(s). MDPI and/or the editor(s) disclaim responsibility for any injury to people or property resulting from any ideas, methods, instructions or products referred to in the content. |
© 2024 by the authors. Licensee MDPI, Basel, Switzerland. This article is an open access article distributed under the terms and conditions of the Creative Commons Attribution (CC BY) license (https://creativecommons.org/licenses/by/4.0/).
Share and Cite
Abu El Haija, K.; Chiang, Y.W.; Santos, R.M. On-Site Determination of Soil Organic Carbon Content: A Photocatalytic Approach. Clean Technol. 2024, 6, 784-801. https://doi.org/10.3390/cleantechnol6020040
Abu El Haija K, Chiang YW, Santos RM. On-Site Determination of Soil Organic Carbon Content: A Photocatalytic Approach. Clean Technologies. 2024; 6(2):784-801. https://doi.org/10.3390/cleantechnol6020040
Chicago/Turabian StyleAbu El Haija, Karam, Yi Wai Chiang, and Rafael M. Santos. 2024. "On-Site Determination of Soil Organic Carbon Content: A Photocatalytic Approach" Clean Technologies 6, no. 2: 784-801. https://doi.org/10.3390/cleantechnol6020040
APA StyleAbu El Haija, K., Chiang, Y. W., & Santos, R. M. (2024). On-Site Determination of Soil Organic Carbon Content: A Photocatalytic Approach. Clean Technologies, 6(2), 784-801. https://doi.org/10.3390/cleantechnol6020040