Article

Wilcoxon-Type Control Charts Based on Multiple Scans

by
Ioannis S. Triantafyllou
Department of Statistics and Insurance Science, University of Piraeus, 18534 Piraeus, Greece
Stats 2024, 7(1), 301-316; https://doi.org/10.3390/stats7010018
Submission received: 21 January 2024 / Revised: 4 March 2024 / Accepted: 5 March 2024 / Published: 7 March 2024

Abstract

:
In this article, we establish new distribution-free Shewhart-type control charts based on rank sum statistics with signaling multiple scans-type rules. More precisely, two Wilcoxon-type chart statistics are considered in order to formulate the decision rule of the proposed monitoring scheme. In order to enhance the performance of the new nonparametric control charts, multiple scans-type rules are activated, which make the proposed chart more sensitive in detecting possible shifts of the underlying distribution. The appraisal of the proposed monitoring scheme is accomplished with the aid of the corresponding run length distribution under both in- and out-of-control cases. Thereof, exact formulae for the variance of the run length distribution and the average run length (ARL) of the proposed monitoring schemes are derived. A numerical investigation is carried out and depicts that the proposed schemes acquire better performance towards their competitors.

1. Introduction

Statistical process control is widely implemented to keep track of the quality of a manufacturing procedure, where in spite of how devotedly it is nourished, an inherent variability appears in any case. Control charts provide support to the practitioners for tracking down assignable sources of variability. Generally speaking, if the process has shifted, a monitoring scheme should hit upon it as fast as plausible and provide an out-of-control signal.
The majority of control charts are distribution-based tools, even though this presumption is not always met in the real world. To conquer this obstruction and yet preserve the traditional set-up of the common control charts, plenty nonparametric (or distribution-free) monitoring schemes have been introduced in the literature. Each one of them uses an appropriately chosen nonparametric monitoring statistic, while the framework of either Cumulative (CUSUM), Exponentially Weighted Moving Average (EWMA) or Shewhart-type schemes is followed.
In the last two decades, several EWMA-type distribution-free control charts have been introduced in the literature. For instance, adaptive nonparametric EWMA charts have been studied in [1,2,3], while some nonparametric EWMA-type schemes based on sign and signed-rank statistics have been proposed in [4,5,6,7,8]. An up-to-date and detailed overview of distribution-free EWMA charts has been presented in [9].
In addition, CUSUM-type control charts have also attracted a lot of research interest recently. For example, [10] proposed a nonparametric CUSUM chart for monitoring multivariate serially correlated processes, while different approaches under the CUSUM-type framework have been established and studied in some detail in [10,11,12,13]. An up-to-date and detailed overview of distribution-free CUSUM charts has been presented in [14].
It is widely accepted that Shewhart-type control schemes perform well, especially under large shifts of the underlying distribution. In this direction, several distribution-free control schemes based on rank-sum statistics have been proposed in the literature. For example, three distribution-free Shewhart-type control charts, which exploit run and Wilcoxon-type rank-sum statistics to detect possible shifts of the underlying continuous process, have been introduced by [15]. A single distribution-free control chart for monitoring simultaneously the unknown location and scale parameters of the underlying distribution has been established in [16]. The particular plotted statistic combines the Wilcoxon rank sum test for location and the Ansari–Bradley test for scale. Moreover, ref. [17] considered adding runs-rules to enhance the performance of the distribution-free Phase II Shewhart-type chart based on the well-known Mann Whitney statistic which was introduced by [18]. In some recent advances, a general class of nonparametric Shewhart-type control charts based on modified Wilcoxon-type rank sum statistics has been introduced in [19], while [20] generalized the monitoring schemes proposed in [15] by taking into account the ranks from a larger amount of test observations. For a thorough study and some interesting perspectives on Nonparametric Statistical Process Control, the interested reader is referred to [21,22,23,24,25], while some very recent advances on the topic can be found in [26,27,28,29,30].
In the present article, we introduce a new family of nonparametric Shewhart-type control charts based on ranks with signaling scans-type rules. In other words, the set-up proposed by [15,20] is enhanced by activating multiple scans in the decision rule. In Section 2, the setup of the proposed monitoring schemes is presented in detail, while explicit formulae are derived in Section 3 for determining the average and the variance of the corresponding run length. In Section 4, several numerical comparisons reveal the improved capability of the proposed charts in comparison to their competitors. For illustration purposes, a real-life example is studied in some detail in Section 5. Finally, the Conclusion section sums up the contribution of the present work, while some prospects are articulated for future research work.

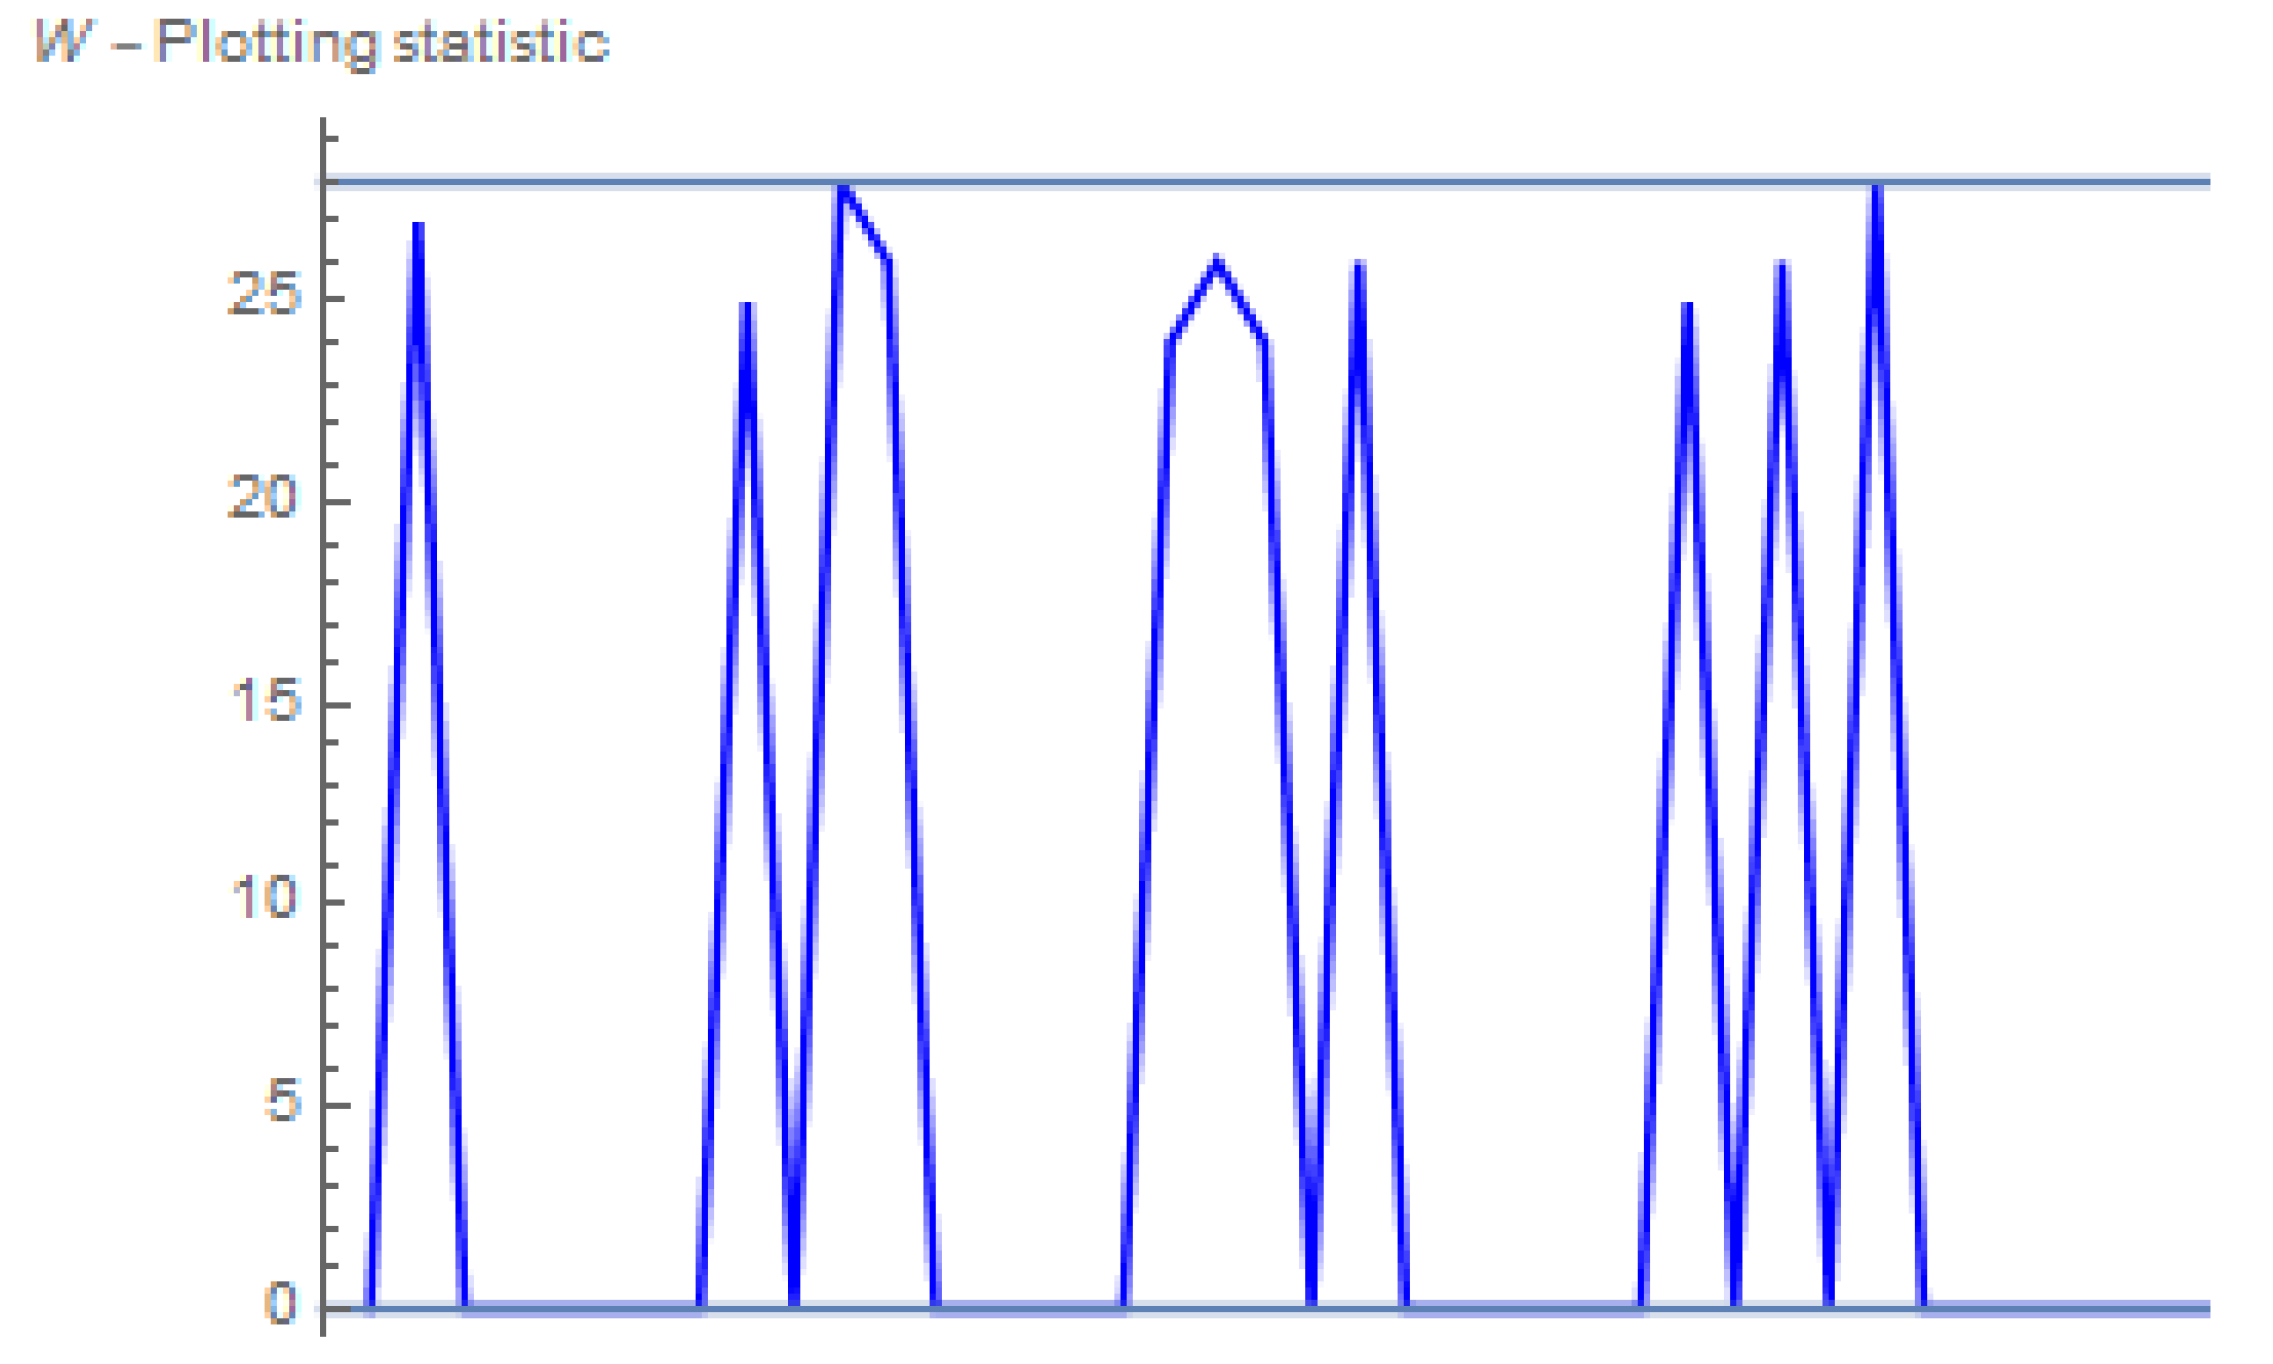
2. The Proposed Nonparametric Control Charts Based on Rank Sum Statistics and Multiple Scans

In this section, we introduce a new family of nonparametric monitoring schemes based on scans. More precisely, we implement two modified Wilcoxon-type rank-sum statistics and the resulting charts are enhanced by adding multiple scans rules in order to improve their ability to detect possible changes in the underlying process distribution.
The control limits of the new charts are based on reference observations drawn from the in-control process. In other words, for constructing the proposed monitoring schemes, a reference sample of size m, namely m observations, say X 1 , X 2 , , X m with cumulative distribution function F, is drawn from the process when it is in-control. The control limits of the proposed control charts coincide to judiciously determined observations of the corresponding ordered sample X 1 : m , X 2 : m , , X m : m . In order to decide whether the process is still in-control or not, test samples of size n, say Y 1 , Y 2 , , Y n with cumulative distribution function G, are then collected independently of each other (and of the reference sample). In statistical terms, our aim is to recognize a possible shift in the underlying distribution from F to G.
In the proposed framework, the testing procedure is based on the ranks of some test observations. Indeed, the monitoring statistic of the new charts is computed by the aid of the ranks of some judiciously determined observations from the test sample. Further details about the computation of the monitoring statistic shall be given later on.
Moreover, the performance of the proposed schemes is strengthened by applying multiple scans rules with integer-valued parameters r , k , s . In particular, when the latter rule is activated, an out-of-control signal is produced upon the completion of the r th occurrence of a k out s scan, where r , k , s 1 and k s . In other words, the proposed monitoring scheme declares that the underlying process has shifted to an out-of-control state, when exactly r subsequences of plotting points of length s (at most) are observed with the number of out of limits points contained in each one of them being at least k .
The general set-up of the proposed family of control charts are detailed in the following steps:
Step 1. Draw a reference sample of size m from the in-control process.
Step 2. Determine the control limits of the monitoring scheme by the aid of the corresponding reference ordered observations.
Step 3. Draw independent test samples of size n from the process.
Step 4. Compute the monitoring rank-based statistic by the aid of test observations.
Step 5. Activate a multiple scan rule with design parameters r , k , s .
Step 6. Declare whether the process is in- or out-of-control, by combining the plotting statistics and the multiple scan rule defined in the previous steps.
Before providing the primary results for the new family of control schemes, we should briefly put up some details about the underlying monitoring statistics. Throughout the lines of the present manuscript, we consider two different scenarios. Each one results in a slightly different nonparametric monitoring scheme. According to the first idea (see, e.g., [15]) two specific order statistics, say X a : m , X b : m , are used as control limits (say LCL, UCL), where 1 a < b m . Afterwards, after drawing the h t h test sample Y 1 h , Y 2 h , , Y n h ( h = 1 , 2 , ), the number of test sample observations that fall between successive reference observations should be determined. The resulting plotted statistic is given as
W 1 h = i = a + 1 b W i h ,  
where W i h corresponds to the sum of the ranks of those Y j s of the h t h test sample, which lie between X i 1 : m and X i : m . Note that these ranks are determined via the joint sample of size m + n .
If we next denote by M i h , i = 1 , 2 , , m the number of the h th test sample observations ( Y j h ) that fall between the i 1 th and i th order statistic of the reference sample, it is evident that W 1 h can be rewritten as (see, e.g., [15])
W 1 h = i = a + 1 b M i h ( i + j = a + 1 i 1 M j h ) + i = a + 1 b M i h ( M 0 h 1 ) + 1 2 i = a + 1 b ( M i h + ( M i h ) 2 ) ,
where M 0 h = i = 1 a M i h corresponds to the number of test observations before X a : m .
The statistic W 1 h defined in (1) (or equivalently in (2)) is made use of along with the statistic R h = R Y 1 h , Y 2 h , , Y n h ; X a : m , which corresponds to the number of observations of the h th test sample that lie before the LCL. The process is declared to be in-control, if the following conditions hold true:
W 1 h w   and   R h r 1 ,
where w , r 1 are positive design parameters.
Under the first proposed nonparametric monitoring scheme based on W 1 h , R h and the multiple scan-type rule with parameters r , k , s ( N M S 1 r , k , s , hereafter), the process is characterized as out-of-control whenever we observe r subsequences of test samples of length s (at most), which contain at least k samples having violated at least one condition stated in (3).
On the contrary, the second scenario, which gives birth to a slightly different nonparametric monitoring scheme, calls for four ordered reference observations, say X a : m , X b : m , X c : m , X d : m with 1 a < b < c < d m . Recalling the random variables M i h and W i h defined earlier, the proposed monitoring statistic is now given as (see [20])
W 2 h = i = a + 1 b W i h + i = c + 1 d W i h .
By the aid of M i h , i = 1 , 2 , , m , it is readily obtained that W 2 h can be expressed as
W 2 h = 1 2 i = a + 1 b M i h 2 i = a + 1 b M i h + i = c + 1 d M i h 2 i = c + 1 d M i h + i = a + 1 b M i h ( M 0 h + i ) + i = a + 1 b M i h M 0 h + i = a + 1 b M i h + N 0 h + i ,
where N 0 h denotes the number of test observations between X b : m and X c : m .
The statistic W 2 h defined in (4) (or equivalently in (5)) is made use of along with the statistics R 1 h = R Y 1 h , Y 2 h , , Y n h ; X a : m and R 2 h = R Y 1 h , Y 2 h , , Y n h ; X c : m , X d : m which correspond to the number of test observations that lie before X a : m and between X b : m , X c : m , respectively. The process is declared to be in-control, if the following conditions hold true:
W 2 h w ,   R 1 h r 1   and   R 2 h r 2 ,
where w , r 1 , r 2 are positive integer-valued parameters.
Under the second proposed nonparametric monitoring scheme based on W 2 h , R 1 h , R 2 h and the multiple scan-type rule with parameters r , k , s ( N M S 2 r , k , s , hereafter), the process is characterized as out-of-control whenever we observe r subsequences of test samples of length s (at most), which contain at least k samples having violated at least one condition stated in (6).
It is worth mentioning that some distribution-free control charts, which have been already introduced in the literature, can be considered as members of the new nonparametric family proposed in the present manuscript. More precisely, the nonparametric monitoring scheme proposed by [15] can be viewed as N M S 1 r , k , s , while the one established in [20] corresponds to N M S 2 r , k , s   w i t h r = k = s = 1 . It goes without saying that once the design parameters of the proposed distribution-free control charts take on different values, alternative monitoring schemes are built up. Thereof, the new class of nonparametric schemes can be considered as a generalization of the charts studied in [15,20].
As it is easily deduced from the above argumentation, the proposed control schemes utilize rank-based statistics to monitor the quality of the underlying process. This is not new, since several existing control charts are based on Wilcoxon-type or other rank-sum statistics (see, e.g., [15,18,19,20]). However, the significant novelty of the present study is in the implementation of multiple scans-type rules, which contributes to the enhancement of the performance of the resulting monitoring schemes.

3. Main Results

In this section, we shall provide some general results for the proposed distribution-free control charts. Two crucial characteristics of the run length of the new monitoring schemes are studied in some detail. In particular, we provide closed formulae for computing the average run length and the corresponding variance of the proposed N M S 1 r , k , s and N M S 2 r , k , s   for specific values of their design parameters.
The following proposition provides explicit expressions for the average run length and the corresponding variance of the proposed N M S 1 r , k , s schemes for k = 2 .
Proposition 1.
The unconditional Average Run Length and the unconditional Variance of the Run Length of the N M S 1 r , 2 , s charts are given by
A R L 1 r , 2 , s = 0 u a u a + 1 u b 1 r · ( 2 q 1 s 1 ) 1 q 1 1 q 1 s 1 f a : b u a , u a + 1 , , u b d u a d u a + 1 d u b
and
V a r 1 r , 2 , s = 0 u a u a + 1 u b 1 r q 1 ( 2 q 1 + q 1 2 s 1 q 1 s 1 1 2 q 1 1 q 1 + q 1 ) ( 1 q 1 ) 2 ( 1 q 1 s 1 ) 2 × f a : b u a , u a + 1 , , u b d u a d u a + 1 d u b ,
respectively, while  q 1 = q 1 ( G F 1 u a , G F 1 u a + 1 , , G F 1 u b ; r 1 )  is determined as
q 1 v a , v a + 1 , , v b ; r 1 = m 0 , m a + 1 , , m b A n ! m 0 ! j = a + 1 b m j ! n m 0 j = a + 1 b m j ! v a m 0 × j = a + 1 b v j v j 1 m j 1 v b n m 0 j = a + 1 b m j
where A is the space where the (integer) values of the random vector  ( M 0 , M a , M a + 1 , , M b )  should be in order for at least one condition stated in (3) to be violated and
f a : b u a , u a + 1 , , u b = m ! a 1 ! m b ! u a a 1 1 u b m b ,   0 u a u a + 1 u b 1
Proof .
Let us denote by T r , 2 , s 1 the waiting time until an out-of-control signal is produced by the N M S 1 r , 2 , s control chart. In simple words, T r , 2 , s 1 corresponds to the run length of the proposed N M S 1 r , 2 , s monitoring scheme. Given X a : m = x a , X a + 1 : m = x a + 1 , , X b : m = x b , the random variable T r , 2 , s 1 can be viewed as the r th convolution of the geometric distribution of order 2 / s . It is evident that the probability generating function of T r , 2 , s 1 can be expressed as
E z T r , 2 , s 1 = ( G z ) r ,
where G z corresponds to the probability generating function of the waiting time until the occurrence of the first scan, e.g., if we denote by p the success probability of the aforementioned distribution, then G z is given by (see [31])
G z = ( p z ) 2 1 1 p z p ( 1 p ) s 1 z s · 1 ( 1 p z ) s 1 1 1 p z .
Therefore, if G ( z ) and G ( z ) express the first and second derivative of G ( z ) , then the conditional expected value and variance of the run length T r , 2 , s 1 can be determined by the aid of the following formulae:
E T r , 2 , s 1 X a : m = x a , X a + 1 : m = x a + 1 , , X b : m = x b = r · G 1 = r · 2 p s 1 1 p 1 p s 1
and
V a r T r , 2 , s 1 X a : m = x a , X a + 1 : m = x a + 1 , , X b : m = x b = r · G 1 + G 1 G ( 1 ) 2 = r p 2 p + p 2 s 1 p s 1 1 2 p 1 p + p ( 1 p ) 2 ( 1 p s 1 ) 2
respectively. Under the N M S 1 r , 2 , s monitoring scheme, the success probability p of the aforementioned geometric distribution of order 2 / s coincides with the probability that the set of conditions stated in (3) is not satisfied. However, the latter probability is determined by the aid of the following multiple sum (see, e.g., [15])
m n ! v a m 0 j = a + 1 b v j v j 1 m j 1 v b n m 0 j = a + 1 b m j m 0 ! j = a + 1 b m j ! n m 0 j = a + 1 b m j !
where m = ( m 0 , m a + 1 , , m b ) T takes on values such that the set of conditions stated in (3) is not satisfied. We next combine the last expression with Equations (13) and (14) and the desired results are derived by averaging over the distribution of X a : m , X a + 1 : m , X b : m . □
The following proposition provides explicit expressions for the average run length and the corresponding variance of the proposed N M S 2 r , k , s schemes for k = 2 .
Proposition 2.
The unconditional Average Run Length and the unconditional Variance of the Run Length of the N M S 2 r , 2 , s charts are given by
A R L 2 ( r , 2 , s ) = 0 u a u a + 1 u b u c u c + 1 u d 1 r · ( 2 q 2 s 1 ) 1 q 2 1 q 2 s 1   × f a : b , c : d u a , u a + 1 , , u b , u c , u c + 1 , , u d d u a d u a + 1 d u b d u c d u c + 1 d u d
and
V a r 2 r , 2 , s = 0 u a u a + 1 u b u c u c + 1 u d 1 r q 2 ( 2 q 2 + q 2 2 s 1 q 2 s 1 1 2 q 2 1 q 2 + q 2 ) ( 1 q 2 ) 2 ( 1 q 2 s 1 ) 2 × f a : b , c : d u a , u a + 1 , , u b , u c , u c + 1 , , u d d u a d u a + 1 d u b d u c d u c + 1 d u d
respectively, while
q 2 = q 2 ( G F 1 u a , G F 1 u a + 1 , , G F 1 u b , G F 1 u c , G F 1 u c + 1 , , G F 1 u d ; r 1 , r 2 )
is determined as
q 2 v a , v a + 1 , , v b , v c , v c + 1 , , v d ; r 1 , r 2 = m 0 , m a + 1 , , m b , n 0 , m c + 1 , , m d A n ! m 0 ! n 0 ! j = a + 1 b m j ! j = c + 1 d m j ! n m 0 n 0 j = a + 1 b m j j = c + 1 d m j ! × v a m 0 j = a + 1 b v j v j 1 m j v c v b n 0 j = c + 1 d v j v j 1 m j × 1 v d n m 0 n 0 j = a + 1 b m j j = c + 1 d m j
where A is the space where the values of the random vector  ( M 0 , M a + 1 , , M b , N 0 , M c + 1 , , M d )  should be in order for at least one condition stated in (6) to be violated and
f a : b , c : d ( u a , u a + 1 , , u b , u c , u c + 1 , , u d ) = m ! a 1 ! c b 1 ! m d ! u a a 1 u c u b c b 1 1 u d m d ,   0 u a u a + 1 u b u c u c + 1 u d 1 .
Proof .
Let us denote by T r , 2 , s 2 the waiting time until an out-of-control signal is produced by the N M S 2 r , 2 , s control chart. In simple words, T r , 2 , s 2 corresponds to the run length of the proposed N M S 2 r , 2 , s monitoring scheme. Given X a : m = x a , X a + 1 : m = x a + 1 , , X b : m = x b , X c : m = x c , X c + 1 : m = x c + 1 , , X d : m = x d , the random variable T r , 2 , s 2 can be viewed as the r th convolution of the geometric distribution of order 2 / s . Having at hand the probability function of T r , 2 , s 2 (see Equations (11) and (12)), we follow similar steps as before and the conditional expected value and variance of the run length T r , 2 , s 2 are given as
E T r , 2 , s 2 X a : m = x a , X a + 1 : m = x a + 1 , , X b : m = x b , X c : m = x c , X c + 1 : m = x c + 1 , , X d : m = x d = r · 2 p s 1 1 p 1 p s 1
and
V a r T r , 2 , s 1 X a : m = x a , X a + 1 : m = x a + 1 , , X b : m = x b , X c : m = x c , X c + 1 : m = x c + 1 , , X d : m = x d = r p 2 p + p 2 s 1 p s 1 1 2 p 1 p + p ( 1 p ) 2 ( 1 p s 1 ) 2
respectively. Under the N M S 2 r , 2 , s monitoring scheme, the success probability p corresponds now to the probability that the set of conditions stated in (6) is not satisfied.
Taking into account that the latter probability can be expressed by the aid of the following sum (see, e.g., [20])
m n ! v a m 0 j = a + 1 b v j v j 1 m j v c v b n 0 j = c + 1 d v j v j 1 m j m 0 ! n 0 ! j = a + 1 b m j ! j = c + 1 d m j ! n m 0 n 0 j = a + 1 b m j j = c + 1 d m j ! × 1 v d n m 0 n 0 j = a + 1 b m j j = c + 1 d m j ,
where m = ( m 0 , m a + 1 , , m b , n 0 , m c + 1 , , m d ) T takes on values such that the set of conditions stated in (6) is not satisfied, formulae (17) and (18) lead effortlessly to the results we are chasing for. □
Having at hand the results proved in Propositions 1 and 2, the unconditional in-control Average Run Length and Variance of the in-control Run Length of both proposed monitoring schemes are readily obtained by substituting F = G in the corresponding formulae.
In Table 1, we present the in-control ARL values of N M S 1 r , 2 , s monitoring schemes under different choices of design parameters. Note that calculations for building up all entries of Table 1 were carried out by the aid of Proposition 1.
Based on Table 1, the practitioner can choose the appropriate design for constructing a distribution-free control chart that achieves a pre-determined in-control level of performance (ARL0). For example, let us assume that a reference sample of size m = 200 is available and we draw independent successive test samples of size n = 5 . Our aim is to construct a monitoring scheme that achieves an in-control Average Run Length equal to 370 (approximately). Based on Table 1, our goal shall be met, if we construct any of the following:
  • An N M S 1 2 , 2 , 3 chart with design parameters a = 30 , b = 32 , w = 44 ,   r 1 = 2 . In other words, the practitioner should select the 30th and the 32nd ordered reference observations as the control limits and determine the remaining parameters as w = 44 , r 1 = 2 . The resulting N M S 1 2 , 2 , 3 chart achieves an in-control ARL equal to 379.95.
  • An N M S 1 2 , 2 , 4 chart with design parameters a = 27 , b = 29 , w = 45 , r 1 = 2 . In other words, the practitioner should select the 27th and the 29th ordered reference observations as the control limits and determine the remaining parameters as w = 45 , r 1 = 2 . The resulting N M S 1 2 , 2 , 4 chart achieves an in-control ARL equal to 356.25.
  • An N M S 1 2 , 2 , 5 chart with design parameters a = 24 , b = 26 , w = 30 , r 1 = 2 . In other words, the practitioner should select the 24th and the 26th ordered reference observations as the control limits and determine the remaining parameters as w = 30 , r 1 = 2 . The resulting N M S 1 2 , 2 , 5 chart achieves an in-control ARL equal to 370.99.
In addition, a parallel computational effort has been made for illustrating the in-control performance of N M S 2 r , 2 , s control charts. More precisely, Table 2 displays the in-control ARL values under the N M S 2 r , 2 , s framework for several designs, which achieve the traditional ARL target values, e.g., 370 or 500.
Based on Table 2, one may investigate the in-control performance of the proposed nonparametric schemes. For instance, let us assume that, having at hand m = 100 reference observations, we aim at constructing a monitoring scheme with an in-control Average Run Length equal to 500 (approximately). If we draw successively test samples of size n = 5 , it seems that our requirement could be satisfied if we construct any of the following:
  • An N M S 2 3 , 2 , 3 chart with design parameters a = 12 , b = 14 , c = 22 , d = 24 , w = 39 , r 1 = 2 , r 2 = 1 (with exact in-control ARL equal to 493.02);
  • An N M S 2 3 , 2 , 4 chart with design parameters a = 13 , b = 15 , c = 22 , d = 24 , w = 39 , r 1 = 2 , r 2 = 1 (with exact in-control ARL equal to 484.68);
  • An N M S 2 3 , 2 , 5 chart with design parameters a = 12 , b = 14 , c = 23 , d = 25 , w = 26 , r 1 = 2 , r 2 = 2 (with exact in-control ARL equal to 511.04).
The out-of-control performance could be evaluated via the corresponding ARL that the control chart attains. If the process shifts out-of-control, the out-of-control ARL of the proposed charts depends on both the in-control and out-of-control distributions F and G. If we assume that G belongs to the so-called Lehmann alternatives (see [32]), the out-of-control distribution function takes on the form G = F γ for some fixed, positive number γ > 0 . Table 3 provides the out-of-control ARL values delivered by the N M S 1 r , 2 , 3 ,   N M S 1 r , 2 , 4   a n d   N M S 1 r , 2 , 5 monitoring schemes under the Lehmann-type alternatives for γ = 0.9 . Since all designs displayed in Table 3 are the same as the ones appearing in Table 1, the practitioner could now investigate both the in- and out-of-control performances of the proposed nonparametric control charts by the aid of Table 1 and Table 3.
Based on the numerical results displayed in Table 3, one may draw interesting conclusions. For instance, let us consider the same case study mentioned earlier, namely let us assume that the practitioner works with a reference sample of size m = 5 0 in order to reach an in-control ARL equal to 370. Then, under the Lehmann alternatives with parameter γ equal to 0.9, the N M S 1 1 , 2 , 4 , N M S 1 2 , 2 , 4   a n d   N M S 1 3 , 2 , 4 monitoring schemes appearing in Table 1 and Table 3, achieve an out-of-control ARL equal to 203.2, 191.78 and 201.31, respectively.
A similar numerical investigation has been carried out for the class of N M S 2 r , 2 , s charts. More precisely, in Table 4, the out−of−control ARLs of the N M S 2 r , 2 , 3 ,   N M S 2 r , 2 , 4   a n d   N M S 2 r , 2 , 5 monitoring schemes are provided for the same designs displayed in Table 2.
If we consider the same case study mentioned earlier, namely let us assume that the practitioner works with a reference sample of size m = 100 in order to reach an in-control ARL equal to 500. Then, under the Lehmann alternatives with parameter γ equal to 0.9, the N M S 2 3 , 2 , 3 , N M S 2 3 , 2 , 4   a n d   N M S 2 3 , 2 , 5 monitoring schemes appearing in Table 2 and Table 4, achieve an out-of-control ARL equal to 287.25, 268.90 and 248.36, respectively.
Generally speaking, the proposed control charts seem to provide a reliable framework for monitoring the quality of a process. Due to their nonparametric nature, the new schemes can be implemented in any case, even if the distribution of the underlying process is unknown. An additional advantage of the proposed schemes is that, due to the large number of their design parameters, the new charts are flexible in the sense that it is quite feasible to determine appropriately the values of their parameters in order to achieve a pre-specified level of in- or out-of-control performance. However, one may also argue that the large number of the design parameters of the proposed frameworks make their implementation quite complex (and that is also true). Moreover, a clear drawback of the nonparametric monitoring schemes, which are established throughout the lines of the present manuscript, is that due to the discrete nature of the rank-based monitoring statistics that are used therein, it is sometimes time consuming to determine the appropriate design that reaches the desired level of in- or out-of-control performance.

4. Numerical Comparisons

In this section, we carry out extensive numerical experimentation to shed light on the efficacy of the new control charts and their robustness features under out-of-control situations. The computations are accomplished with the aid of theoretical results proved in the previous section. All numerical computations have been accomplished through appropriate numerical approximations to the corresponding integral by using suitable adaptive algorithms, which recursively subdivide the integration region as needed. The Mathematica notebook to support this paper is available upon request.
A common approach of weighing two different control charts is to determine a common in-control ARL and then to examine the corresponding out control ARLs. Traditionally, whenever a new control chart is established as a generalization of some existing ones, direct comparisons against them are highly recommended. Therefore, we next compare the performance of the N M S 1 r , 2 , s and N M S 2 r , 2 , s charts monitoring schemes to the ones established in [15,20], respectively.
Note that the nonparametric chart, which has been established by [15] (Competitor 1, hereafter), is a Shewhart-type one that exploits run and Wilcoxon-type rank sum statistics to detect possible shifts of a monitored process. Moreover, the monitoring scheme proposed by [20] (Competitor 2, hereafter), combines the reference and test data in order to identify whether the observations of the test samples tend to take on significantly smaller (or significantly larger) values compared to the corresponding reference observations. Competitor 2 utilizes a rank-based statistic, which is computed by the aid of the ranks from the observations that lie in two different intervals.
Table 5 offers several numerical comparisons between the N M S 1 1 , 2 , 3 , N M S 1 1 , 2 , 4 and N M S 1 1 , 2 , 5 schemes and the nonparametric chart introduced in [15] (Competitor 1).
We assume that a reference sample of size m = 100 is available, while test samples of size n = 5 are then drawn from the process in order to decide whether it is in- or out-of-control. All competing schemes are designed such that an in-control ARL near to 500 is achieved. The design parameters of Competitor 1 have been copied by them (see Table 8 therein). More precisely, the parameters of the latter chart are determined as a = 18 , b = 20 , w = 78   a n d   r 0 = 2 , and its exact in-control ARL equals to 512.4.
Throughout the lines of Table 5, the in-control distribution of the underlying process is assumed to be the Exponential distribution with parameter λ = 2 . The out-of-control performance of the competing schemes is evaluated by the corresponding ARLs under several shifts θ in the process.
For example, let us consider the case where the process mean has shifted θ = 0.5 units. As it is easily observed by the aid of Table 5, the proposed C C 1 2 , 3 , C C 1 2 , 4   a n d   C C 1 2 , 5 monitoring schemes achieve an out-of-control ARL equal to 139.26, 128.80 and 138.38, respectively, while the corresponding ARL value for Competitor 1 is much larger and more precisely equal to 289.01.
In what follows, we investigate the out-of-control performance of the class of N M S 2 r , 2 , s control charts and provide several numerical comparisons versus the monitoring scheme introduced by [20]. As mentioned earlier, since the proposed N M S 2 r , 2 , s monitoring scheme bubbles up as a generalization of the control chart introduced by [20], it is of great interest to make direct comparisons between them and investigate whether the proposed scheme outperforms the existing one.
We next assume that a reference sample of size m = 50 is available, while the in-control process distribution is supposed to be the Exponential with parameter λ = 2 and the shifts we are wishing to capture are created by a change in the parameter λ. Τest samples of size n = 5 are then drawn from the process in order to decide whether it is in- or out-of-control. Both competing schemes are designed such that an in-control ARL near to 370 is achieved. To provide a fair comparison between the proposed charts and the one established by [20] (Competitor 2), we used a design given by the authors themselves. More precisely, the design parameters of the chart of [20] are determined as a = 6 , b = 8 , c = 10 , d = 12 , w = 32 , r 1 = 3   a n d   r 2 = 2 (see Table 7 therein) and its exact in-control ARL equals to 388.4.
As it is readily deduced, the N M S 2 r , 2 , s control chart is, under Exponential distribution, superior to Competitor 2 in all the cases examined. For instance, if the process mean of the underlying in-control distribution has shifted 0.5   ( 1 ) units, the N M S 2 1 , 2 , 3 , N M S 2 1 , 2 , 4   a n d   N M S 2 1 , 2 , 5 monitoring schemes achieve (see Table 6) an out-of-control ARL equal to 118.48 (29.27), 115.18 (28.95) and 117.40 (27.95), respectively, while the corresponding ARL value for Competitor 2 is larger and more precisely equal to 167.41 (54.3).
In addition, it is of some interest to compare the proposed monitoring schemes with other existing nonparametric control charts. More precisely, we next consider well-known rank-based monitoring frameworks and appraise their out-of-control performance versus the behavior of the proposed methods. Table 7 displays several numerical comparisons of the new control charts against four well-known distribution-free schemes. More specifically the N M S 1 1 , 2 , 4 chart and the N M S 2 1 , 2 , 4 chart are compared to the so-called W-CUSUM and W-EWMA control charts established by [33], to the Wmin-chart (see, [18]), as well as to the Mann–Whitney-based chart (MW chart hereafter) instituted by [19]. Note that the comparisons are made under the assumption that the underlying process is normally distributed with parameters 0 and 1.
The design parameters for all competitors were determined suitably so that the resulting rules achieve an in-control average run length approximately equal to 500. Then, the ARLout values under specific mean shifts of the underlying distribution were calculated.
Table 7 offers enough numerical evidence that the proposed monitoring schemes outperform their competitors. Indeed, the out-of-control ARLs of the N M S 1 1 , 2 , 4 chart and the N M S 2 1 , 2 , 4 chart are smaller than the corresponding ones of the competitive charts. That practically means that the proposed charts are capable of detecting the distribution shift faster than the remaining monitoring schemes. For instance, if the distribution shifts 0.25 units, then the N M S 1 1 , 2 , 4 chart ( N M S 2 1 , 2 , 4 chart) needs only 77.44 (93.12) test samples to detect the change, while the competitors seem to be much slower at detecting the shift. As we readily observe in the 2nd line of Table 7, the Wmin-chart achieves an ARLout equal to 100.82, while the corresponding ARLout for the MW-chart, the W-CUSUM and W-EWMA control charts are 428.03, 333.45 and 321.52, respectively.
As it is readily concluded from the above numerical investigation, the proposed schemes offer a competitive way to monitor the quality of the underlying process, no matter which specific distribution rules the process. In other words, the new control charts seem to detect faster possible shifts of the distribution process than their competitors in all cases considered. That seems to be a general conclusion, not only because the numerical comparisons provided in the above tables are based on both symmetric and non-symmetric distributions, but also due to the flexibility of the proposed frameworks which allows us to determine appropriately their design parameters in order to reach the desired level of performance under any requirements.

5. An Illustrative Real-Life Example

For illustration purposes, let us assume that we wish to establish nonparametric control charts using the data given in Tables 6.3 and 6E.7 of the classical textbook [34]. In this particular application, piston rings for an automotive engine are produced by a forging process and the aim is to monitor the inside diameter of the rings by exploiting quality control techniques.
Twenty-five samples, each of size five, were taken when the process was thought to be in-control. Traditional Shewhart X ¯ and R charts were constructed using the aforementioned data and no indication of an out-of-control condition was provided. Therefore, these data may be used as reference data (Phase I data) and the control limits needed for establishing an on-line process control, can be computed by the aid of these 125 ( 25 × 5 ) observations.
In order to monitor the process, we apply one of the proposed schemes, e.g., the N M S 1 1 , 2 , 3 chart. The design parameters of the underlying monitoring scheme are determined as m = 125 , n = 5 , a = 71 , b = 73 , w = 400   a n d   r 1 = 4 . Therefore, our interest focuses on the interval created by the 71st and 73rd ordered observations of the reference sample, and the number M i (for all i = 72 , 73 ) of observations of the test sample that fall between two successive observations of the reference sample has to be calculated. For example, M 72 denotes the number of Y observations that lie between X 71 : 125 and X 72 : 125 . Based on quantities M 72 , M 73 the value of W 1 h is determined by the aid of (2) for each test sample drawn from the production. The process will be declared in-control if the plotting statistic W 1 h of the test sample is equal to or less than 400 and simultaneously at most four observations of the test sample (collected from the future production process) lie before the order statistic X 71 : 125 = 74.003 . On the other hand, the process will be declared out-of-control if we observe subsequent test samples of length s = 3 (at most), which contain at least k = 2 samples having violated at least one condition stated before.
Fifteen additional samples from the piston-ring manufacturing process (see [34], Table 6E.7) were collected after the control charts were established. Figure 1 and Figure 2 provide plots for both plotting statistics ( W 1 h   and R h ) for all forty samples (reference and test).
It is not difficult to see that, while the Phase I samples are not creating an out-of-control signal (as expected), the distribution-free scheme signals on the 5th sample in the prospective phase (Phase II) or on the 30th overall since the 2-out-of-3 rule is activated.

6. Discussion

In the present article, a new class of distribution-free Shewhart-type control charts based on ranks and scans is introduced. The monitoring statistics correspond to rank-based statistics, while the decision whether the process is in- or out-of-control is made by utilizing multiple scan rules. The run length of the proposed nonparametric control charts is studied for both in- and out-of-control circumstances. Based on the numerical investigation carried out, we deduce that the new schemes are capable of quickly detecting possible shifts of the underlying distribution process. Is it highly recommended that the practitioner uses the tables displayed in previous sections of the present manuscript in order to build up the appropriate design for meeting his/her requirements. It is of some interest for future research, to implement scans- or runs-type rules to alternative nonparametric control charts for improving their capabilities.

Funding

This research received no external funding.

Institutional Review Board Statement

Not applicable.

Informed Consent Statement

Not applicable.

Data Availability Statement

Data are presented within the article.

Conflicts of Interest

The author declares no conflict of interest.

References

  1. Tang, A.; Sun, J.; Hu, X.; Castagliola, P. A new nonparametric adaptive EWMA control chart with exact run length properties. Comput. Ind. Eng. 2019, 130, 404–419. [Google Scholar] [CrossRef]
  2. Hu, X.; Castagliola, P.; Xhong, J.; Tang, A.; Qiao, Y. On the performance of the adaptive EWMA chart for monitoring time between events. J. Stat. Comput. Simul. 2021, 91, 1175–1211. [Google Scholar] [CrossRef]
  3. Xie, F.; Castagliola, P.; Sun, J.; Tang, A.; Hu, Y. A one-sided adaptive truncated exponentially weighted moving average scheme for time between events. Comput. Ind. Eng. 2022, 168, 108052. [Google Scholar] [CrossRef]
  4. Alevizakos, V.; Chatterjee, K.; Koukouvinos, C. A nonparametric triple exponentially weighted moving average sign control chart. Qual. Reliab. Eng. Int. 2021, 37, 1504–1523. [Google Scholar] [CrossRef]
  5. Alevizakos, V.; Koukouvinos, C.; Chatterjee, K. A nonparametric double generally weighted moving average signed-rank control chart for monitoring process location. Qual. Reliab. Eng. Int. 2020, 36, 2441–2458. [Google Scholar] [CrossRef]
  6. Tang, A.; Mukherjee, A.; Wang, X. Distribution-free Phase-II monitoring of high-dimensional industrial processes via origin and modified interpoint distance based algorithms. Comput. Ind. Eng. 2023, 179, 109161. [Google Scholar] [CrossRef]
  7. Perdikis, T.; Psarakis, S.; Castagliola, P.; Giner-Bosch, V.; Maravelakis, P.; Rakitzis, A.C. An EWMA sign chart for dispersion with exact run length properties. J. Stat. Comput. Simul. 2023, 93, 1799–1829. [Google Scholar] [CrossRef]
  8. Perdikis, T.; Psarakis, S.; Castagliola, P.; Maravelakis, P. An EWMA signed ranks control chart with reliable run length performances. Qual. Reliab. Eng. Int. 2021, 37, 1266–1284. [Google Scholar] [CrossRef]
  9. Chakraborti, S.; Graham, M. Nonparametric (distribution-free) control charts: An updated overview and some results. Qual. Eng. 2019, 31, 523–544. [Google Scholar] [CrossRef]
  10. Xue, L.; Qiu, P. A nonparametric CUSUM chart for monitoring multivariate serially correlated processes. J. Qual. Technol. 2021, 53, 396–409. [Google Scholar] [CrossRef]
  11. Wang, Z.; Wu, Q.; Qiu, P. Novel nonparametric control charts for monitoring dispersion of count data. Qual. Reliab. Eng. Int. 2023; to appear. [Google Scholar] [CrossRef]
  12. Tang, L.; Li, J. A nonparametric control chart for monitoring count data mean. Qual. Reliab. Eng. Int. 2024, 40, 722–736. [Google Scholar] [CrossRef]
  13. Tang, A.; Mukherjee, A.; Ma, Y. An optimally designed distribution-free CUSUM procedure for tri-aspect surveillance of continuous processes. Qual. Reliab. Eng. Int. 2023, 39, 2537–2557. [Google Scholar] [CrossRef]
  14. Triantafyllou, I.S.; Ram, M. Distribution-free CUSUM-type control charts for monitoring process location and scale: An overview and some results. Int. J. Math. Eng. Manag. Sci. 2021, 6, 975–1008. [Google Scholar]
  15. Balakrishnan, N.; Triantafyllou, I.S.; Koutras, M.V. Nonparametric control charts based on runs and Wilcoxon-type rank-sum statistics. J. Stat. Plan. Inference 2009, 139, 3177–3192. [Google Scholar] [CrossRef]
  16. Mukherjee, A.; Chakraborti, S. A distribution-free control chart for the joint monitoring of location and scale. Qual. Reliab. Eng. Int. 2012, 28, 335–352. [Google Scholar] [CrossRef]
  17. Malela-Majika, J.C.; Graham, M.A.; Chakraborti, S. Distribution-free Phase II Mann-Whitney control charts with runs-rules. Int. J. Adv. Manuf. Technol. 2016, 86, 723–735. [Google Scholar] [CrossRef]
  18. Chakraborti, S.; van de Wiel, M.A. A nonparametric control chart based on the Mann-Whitney statistic. In IMS Collections; Beyond parametrics in interdisciplinary research: Festschrift in Honour of Professor Pranab K. Sen; Institute of Mathematical Statistics: Waite Hill, OH, USA, 2008; Volume 1, pp. 156–172. [Google Scholar]
  19. Koutras, M.V.; Triantafyllou, I.S. A general class of nonparametric control charts. Qual. Reliab. Eng. Int. 2018, 34, 427–435. [Google Scholar] [CrossRef]
  20. Triantafyllou, I.S.; Panayiotou, N. A new distribution-free monitoring scheme based on ranks. Commun. Stat. Simul. Comput. 2022, 51, 6456–6478. [Google Scholar] [CrossRef]
  21. Qiu, P. Some perspectives on nonparametric statistical process control. J. Qual. Technol. 2018, 50, 49–65. [Google Scholar] [CrossRef]
  22. Qiu, P. Some recent studies in Statistical Process Control. In Statistical Quality Technologies; Springer: Cham, Switzerland, 2019; pp. 3–19. [Google Scholar]
  23. Chakraborti, S.; Graham, M. Nonparametric Statistical Process Control; John Wiley & Sons: Hoboken, NJ, USA, 2019. [Google Scholar]
  24. Qiu, P. Introduction to Statistical Process Control; Chapman and Hall/CRC: New York, NY, USA, 2013. [Google Scholar]
  25. Qiu, P. Big Data? Statistical Process Control can help. Am. Stat. 2020, 74, 329–344. [Google Scholar] [CrossRef]
  26. Perdikis, T.; Celano, G.; Chakraborti, S. Distribution-free control charts for monitoring scale in finite horizon productions. Eur. J. Oper. Res. 2023, 314, 1040–1051. [Google Scholar] [CrossRef]
  27. Dafnis, S.D.; Perdikis, T.; Koutras, M.V. Improved Shewhart-type control charts based on weak runs in multistate trials. Qual. Technol. Quant. Manag. 2024; to appear. [Google Scholar] [CrossRef]
  28. Nasrollahzadeh, S.; Bameni Moghadam, M.; Farnoosh, R. A Shewhart-type nonparametric multivariate depth-based control chart for monitoring location. Comm. Stat. Theory Methods 2023, 52, 7385–7404. [Google Scholar] [CrossRef]
  29. Hernández-Zamudio, G.; Tercero-Gómeza, V.; Conover, W.J.; Benavides-Vázquez, L.; Beruvides, M. On the power and robustness of phase I nonparametric Shewhart-type charts using sequential normal scores. J. Ind. Prod. Eng. 2023, 41, 276–305. [Google Scholar] [CrossRef]
  30. Diaz Pulido, A.J.; Cordero Franco, A.E.; Tercero Gómez, V.G. A distribution-free control chart for joint monitoring of location and scale in finite horizon productions. Comput. Stat, 2023; to appear. [Google Scholar] [CrossRef]
  31. Balakrishnan, N.; Koutras, M.V. Runs and Scan with Applications; John Wiley & Sons: New York, NY, USA, 2002. [Google Scholar]
  32. Lehmann, E.L. The power of rank tests. Ann. Math. Stat. 1953, 24, 23–43. [Google Scholar] [CrossRef]
  33. Li, S.-Y.; Tang, L.-C.; Ng, S.-H. Nonparametric CUSUM and EWMA control charts for detecting mean shifts. J. Qual. Technol. 2010, 42, 209–226. [Google Scholar] [CrossRef]
  34. Montgomery, D.C. Introduction to Statistical Quality Control; John Wiley & Sons: New York, NY, USA, 2009. [Google Scholar]
Figure 1. The plotting statistic W 1 h for piston-ring data.
Stats 07 00018 g001
Figure 2. The plotting statistic R h for piston-ring data.
Stats 07 00018 g002
Table 1. In-control Average Run Length of N M S 1 r , 2 , s charts for several designs.
Reference Sample Size m
50100200
ARLo(n, r)(a, b, w, r1)Exact ARLin(a, b, w, r1)Exact ARLin(a, b, w, r1)Exact ARLin
370(5, 1)(10, 12, 36, 2)
(16, 18, 39, 3)
(9, 11, 37, 2)
394.99
377.46
386.65
(11, 13, 22, 2)
(24, 26, 49, 3)
(17, 19, 37, 2)
390.87
366.74
366.47
(27, 29, 54, 2)
(30, 32, 61, 2)
(37, 39, 40, 3)
377.11
383.71
380.68
(5, 2)(9, 11, 19, 2)
(5, 7, 10, 2)
(8, 10, 17, 2)
361.66
352.83
356.36
(11, 13, 19, 2)
(20, 22, 43, 2)
(17, 19, 41, 2)
385.57
392.72
345.39
(30, 32, 44, 2)
(27, 29, 45, 2)
(24, 26, 30, 2)
379.95
356.25
370.99
(5, 3)(8, 10, 11, 3)
(9, 11, 19, 2)
(11, 13, 25, 2)
399.43
381.55
359.55
(10, 12, 18, 2)
(12, 14, 23, 2)
(18, 20, 37, 2)
374.94
349.00
355.98
(35, 37, 30, 2)
(31, 33, 30, 2)
(28, 30, 30, 2)
362.63
370.13
385.39
500(5, 1)(10, 12, 42, 2)
(9, 11, 41, 2)
(9, 11, 38, 2)
467.68
502.58
479.25
(15, 17, 31, 2)
(17, 19, 37, 2)
(16, 18, 45, 2)
476.19
473.51
509.30
(43, 45, 40, 3)
(37, 39, 40, 3)
(27, 29, 55, 2)
482.39
493.21
486.36
(5, 2)(10, 12, 22, 2)
(7, 9, 14, 3)
(9, 11, 20, 2)
514.80
483.21
508.85
(20, 22, 42, 2)
(19, 21, 43, 2)
(10, 12, 20, 2)
462.81
516.85
517.35
(27, 29, 44, 2)
(24, 26, 45, 2)
(21, 23, 31, 2)
506.04
475.79
500.53
(5, 3)(9, 11, 19, 2)
(8, 10, 16, 3)
(8, 10, 17, 2)
524.48
524.94
504.54
(12, 14, 24, 2)
(13, 15, 26, 2)
(12, 14, 24, 2)
503.69
517.25
503.69
(31, 33, 30, 2)
(28, 30, 30, 2)
(25, 27, 30, 2)
509.32
486.52
508.66
Each cell contains the in-control ARL values attained for N M S 1 r , 2 , 3 (upper entry), N M S 1 r , 2 , 4 (middle entry) and N M S 1 r , 2 , 5 (lower entry) charts.
Table 2. In-control Average Run Length of N M S 2 r , 2 , s charts for several designs.
Reference Sample Size m
50100200
ARLo(n, r) ( a ,   b ,   c ,   d ,   w ,   r 1 ,   r 2 )Exact ARLin ( a ,   b ,   c ,   d ,   w ,   r 1 ,   r 2 )Exact ARLin ( a ,   b ,   c ,   d ,   w ,   r 1 ,   r 2 )Exact ARLin
370(5, 1)(6, 8, 15, 17, 32, 2, 2)
(5, 7, 14, 16, 29, 2, 2)
(5, 7, 13, 15, 24, 2, 2)
378.89
367.01
389.21
(16, 18, 20, 22, 23, 2, 2)
(14, 16, 20, 22, 23, 2, 2)
(8, 10, 18, 20, 20, 2, 2)
372.91
380.82
363.57
(13, 15, 30, 32, 15, 2, 2)
(12, 14, 28, 30, 15, 2, 2)
(11, 13, 25, 27, 22, 2, 2)
355.45
384.88
373.20
(5, 2)(6, 8, 13, 15, 16, 2, 2)
(6, 8, 16, 18, 32, 2, 2)
(6, 8, 15, 17, 27, 2, 2)
382.10
363.38
368.12
(13, 15, 22, 24, 39, 2, 1)
(12, 14, 22, 24, 24, 2, 2)
(11, 13, 21, 23, 23, 2, 2)
377.02
381.07
359.54
(10, 12, 28, 30, 11, 2, 2)
(10, 12, 36, 38, 13, 2, 2)
(10, 12, 30, 32, 13, 2, 2)
364.96
385.78
388.40
(5, 3)(5, 7, 15, 17, 18, 2, 2)
(5, 7, 15, 17, 22, 2, 2)
(5, 7, 15, 17, 24, 2, 2)
374.41
374.20
380.89
(13, 15, 22, 24, 23, 2, 2)
(12, 14, 22, 24, 39, 2, 1)
(11, 13, 24, 26, 26, 2, 2)
374.79
361.81
383.59
(11, 13, 26, 28, 11, 2, 2)
(10, 12, 28, 30, 11, 2, 2)
(12, 14, 20, 22, 13, 2, 2)
366.81
388.65
367.68
500(5, 1)(5, 7, 13, 15, 22, 2, 2)
(5, 7, 13, 15, 24, 2, 2)
(5, 7, 12, 14, 22, 2, 2)
479.21
504.69
486.43
(16, 18, 25, 27, 27, 3, 2)
(12, 14, 20, 22, 23, 2, 2)
(10, 12, 20, 22, 23, 2, 2)
509.69
509.92
492.51
(12, 14, 30, 32, 15, 2, 2)
(13, 15, 23, 25, 16, 2, 2)
(8, 11, 21, 23, 19, 2, 2)
484.80
493.11
490.41
(5, 2)(6, 8, 14, 16, 19, 2, 2)
(6, 8, 15, 17, 32, 2, 2)
(6, 8, 15, 17, 34, 2, 2)
499.74
516.71
499.40
(12, 14, 23, 25, 25, 2, 2)
(11, 13, 21, 23, 23, 2, 2) (11, 13, 24, 26, 27, 2, 2)
484.34
478.38
518.66
(10, 12, 37, 39, 13, 2, 2)
(10, 12, 30, 32, 13, 2, 2)
(11, 13, 31, 33, 17, 2, 2)
503.88
495.89
486.75
(5, 3)(5, 7, 14, 16, 17, 2, 2)
(5, 7, 15, 17, 24, 2, 2)
(5, 7, 15, 17, 26, 2, 2)
509.29
482.47
516.10
(12, 14, 22, 24, 39, 2, 1)
(13, 15, 22, 24, 39, 2, 1)
(12, 14, 23, 25, 26, 2, 2)
493.02
484.68
511.04
(12, 14, 31, 33, 13, 2, 2)
(12, 14, 16, 18, 13, 2, 2)
(12, 14, 33, 35, 14, 2, 2)
488.98
476.48
489.10
Each cell contains the in-control ARL values attained for N M S 2 r , 2 , 3 (upper entry), N M S 2 r , 2 , 4 (middle entry) and N M S 2 r , 2 , 5 (lower entry) charts.
Table 3. Out-of-control Average Run Length of N M S 1 r , 2 , s charts for several designs.
Reference Sample Size m
50100200
ARLo(n, r)(a, b, w, r1)Exact ARLout(a, b, w, r1)Exact ARLout(a, b, w, r1)Exact
ARLout
370(5, 1)(10, 12, 36, 2)
(16, 18, 39, 3)
(9, 11, 37, 2)
150.31
170.29
139.57
(11, 13, 22, 2)
(24, 26, 49, 3)
(17, 19, 37, 2)
184.88
178.44
140.31
(27, 29, 54, 2)
(30, 32, 61, 2)
(37, 39, 40, 3)
176.45
154.21
228.70
(5, 2)(9, 11, 19, 2)
(5, 7, 10, 2)
(8, 10, 17, 2)
156.26
169.77
139.71
(11, 13, 19, 2)
(20, 22, 43, 2)
(17, 19, 41, 2)
218.61
167.78
143.53
(30, 32, 44, 2)
(27, 29, 44, 2)
(24, 26, 30, 2)
203.20
191.78
201.31
(5, 3)(8, 10, 11, 3)
(9, 11, 19, 2)
(11, 13, 25, 2)
269.67
170.21
154.83
(10, 12, 18, 2)
(12, 14, 23, 2)
(18, 20, 37, 2)
218.44
204.18
162.56
(35, 37, 30, 2)
(31, 33, 30, 2)
(28, 30, 30, 2)
199.73
203.92
212.75
500(5, 1)(10, 12, 42, 2)
(9, 11, 41, 2)
(9, 11, 38, 2)
168.03
177.79
160.72
(15, 17, 31, 2)
(17, 19, 37, 2)
(16, 18, 45, 2)
187.42
177.64
185.83
(43, 45, 40, 3)
(37, 39, 40, 3)
(27, 29, 55, 2)
283.86
293.25
185.91
(5, 2)(10, 12, 22, 2)
(7, 9, 14, 3)
(9, 11, 20, 2)
214.42
269.29
195.31
(20, 22, 42, 2)
(19, 21, 43, 2)
(10, 12, 20, 2)
195.63
211.75
256.27
(27, 29, 44, 2)
(24, 26, 45, 2)
(21, 23, 31, 2)
266.64
252.35
266.16
(5, 3)(9, 11, 19, 2)
(8, 10, 16, 3)
(8, 10, 17, 2)
234.39
317.09
209.56
(12, 14, 24, 2)
(13, 15, 26, 2)
(12, 14, 24, 2)
254.65
262.87
254.65
(31, 33, 30, 2)
(28, 30, 30, 2)
(25, 27, 30, 2)
279.25
263.34
183.99
Each cell contains the out-of-control ARL values attained for γ = 0.9 by N M S 1 r , 2 , s (upper entry), N M S 1 r , 2 , s (middle entry) and N M S 1 r , 2 , s (lower entry) charts.
Table 4. Out-of-control Average Run Length of the N M S 2 r , 2 , s charts for several designs.
Reference Sample Size m
50100200
ARLo(n,r) ( a ,   b ,   c ,   d ,   w ,   r 1 ,   r 2 )ARLout ( a ,   b ,   c ,   d ,   w ,   r 1 ,   r 2 )ARLout ( a ,   b ,   c ,   d ,   w ,   r 1 ,   r 2 )ARLout
370(5, 1)(6, 8, 15, 17, 32, 2, 2)
(5, 7, 14, 16, 29, 2, 2)
(5, 7, 13, 15, 24, 2, 2)
105.60
103.45
95.35
(16, 18, 20, 22, 23, 2, 2)
(14, 16, 20, 22, 23, 2, 2)
(8, 10, 18, 20, 20, 2, 2)
71.18
72.84
88.00
(13, 15, 30, 32, 15, 2, 2)
(12, 14, 28, 30, 15, 2, 2)
(11, 13, 25, 27, 22, 2, 2)
122.89
135.70
134.31
(5, 2)(6, 8, 13, 15, 16, 2, 2)
(6, 8, 16, 18, 32, 2, 2)
(6, 8, 15, 17, 27, 2, 2)
200.58
209.25
199.96
(13, 15, 22, 24, 39, 2, 1)
(12, 14, 22, 24, 24, 2, 2)
(11, 13, 21, 23, 23, 2, 2)
210.98
199.23
188.61
(10, 12, 28, 30, 11, 2, 2)
(10, 12, 36, 38, 13, 2, 2)
(10, 12, 30, 32, 13, 2, 2)
239.00
252.42
241.62
(5, 3)(5, 7, 15, 17, 18, 2, 2)
(5, 7, 15, 17, 22, 2, 2)
(5, 7, 15, 17, 24, 2, 2)
224.42
229.70
225.92
(13, 15, 22, 24, 23, 2, 2)
(12, 14, 22, 24, 39, 2, 1)
(11, 13, 24, 26, 26, 2, 2)
225.89
209.33
216.79
(11, 13, 26, 28, 11, 2, 2)
(10, 12, 28, 30, 11, 2, 2)
(12, 14, 20, 22, 13, 2, 2)
256.99
258.45
241.00
500(5, 1)(5, 7, 13, 15, 22, 2, 2)
(5, 7, 13, 15, 24, 2, 2)
(5, 7, 12, 14, 22, 2, 2)
122.03
119.63
104.97
(16, 18, 25, 27, 27, 3, 2)
(12, 14, 20, 22, 23, 2, 2)
(10, 12, 20, 22, 23, 2, 2)
179.45
97.57
100.74
(12, 14, 30, 32, 15, 2, 2)
(13, 15, 23, 25, 16, 2, 2)
(8, 11, 21, 23, 19, 2, 2)
172.33
154.18
176.00
(5, 2)(6, 8, 14, 16, 19, 2, 2)
(6, 8, 15, 17, 32, 2, 2)
(6, 8, 15, 17, 34, 2, 2)
273.54
283.85
258.56
(12, 14, 23, 25, 25, 2, 2)
(11, 13, 21, 23, 23, 2, 2)
(11,13,24,26,27,2,2)
249.89
236.14
262.64
(10, 12, 37, 39, 13, 2, 2)
(10, 12, 30, 32, 13, 2, 2)
(11, 13, 31, 33, 17, 2, 2)
327.24
304.58
311.87
(5, 3)(5, 7, 14, 16, 17, 2, 2)
(5, 7, 15, 17, 24, 2, 2)
(5, 7, 15, 17, 26, 2, 2)
294.09
281.34
294.85
(12, 14, 22, 24, 39, 2, 1)
(13, 15, 22, 24, 39, 2, 1)
(12, 14, 23, 25, 26, 2, 2)
287.25
268.90
248.36
(12, 14, 31, 33, 13, 2, 2)
(12, 14, 16, 18, 13, 2, 2)
(12, 14, 33, 35, 14, 2, 2)
323.14
302.00
309.04
Each cell contains the in-control ARL values attained for N M S 2 r , 2 , 3 (upper entry), N M S 2 r , 2 , 4 (middle entry) and N M S 2 r , 2 , 5 (lower entry) charts.
Table 5. ARL values of the N M S 1 1 , 2 , s control charts against competitive schemes under Exponential distribution and several shifts θ (m = 100, n = 5).
Exponential Distribution (λ)
Shift N M S 1 1 , 2 , 3 Chart
a = 15, b = 17,
w = 31, r1 = 2
N M S 1 1 , 2 , 4 Chart
a = 17, b = 19,
w = 37, r1 = 2
N M S 1 1 , 2 , 5 Chart
a = 16, b = 18,
w = 45, r1 = 2
Competitor 1
0.0476.19473.51509.30512.40
0.1380.01372.38400.43459.48
0.2300.41290.08311.85410.87
0.3235.09223.71240.44366.38
0.4181.99170.70183.43325.81
0.5139.26128.80138.38289.01
0.6105.2696.06103.19255.80
0.778.5370.7876.03226.00
0.857.7951.5255.34199.46
0.941.9237.0439.80176.02
1.029.9826.3228.29155.51
1.121.1518.5119.91137.79
1.214.7312.9213.90122.71
1.310.168.989.66110.15
1.46.986.266.7399.99
1.55.124.425.0392.12
Table 6. ARL values of the C C 2 2 , v control charts against competitive schemes under Exponential distribution and several shifts θ (m = 50, n = 5).
Exponential Distribution (λ)
Shift N M S 2 1 , 2 , 3 Chart
( a   =   6 ,   b   =   8 ,   c   =   15 ,   d   =   17 ,   w   =   32 ,   r 1   =   2 ,   r 2   =   2 )
N M S 2 1 , 2 , 4 Chart
( a   =   5 ,   b   =   7 ,   c   =   14 ,   d   =   16 ,   w   =   29 ,   r 1   =   2 ,   r 2   =   2 )
N M S 2 1 , 2 , 5 Chart
( a   =   5 ,   b   =   7 ,   c   =   13 ,   d   =   15 ,   w   =   24 ,   r 1   =   2 ,   r 2   =   2 )
Competitor 2
0.0378.89367.01389.21388.40
0.1305.33295.83311.58333.57
0.2244.12236.62247.39284.41
0.3193.56187.74194.75240.55
0.4152.13147.69151.92201.67
0.5118.48115.18117.40167.41
0.691.3989.0189.85137.46
0.769.8068.1468.09111.48
0.852.7751.6951.0989.17
0.939.5038.8537.9670.21
1.029.2728.9527.9554.30
1.121.4921.4020.4241.13
1.215.6515.7214.8330.39
1.311.3311.5110.7421.82
1.48.178.417.7815.15
1.55.916.185.6710.09
Table 7. ARL values of six different control charts under the N(0,1) distribution.
Shift N M S 1 1 , 2 , 4 Chart N M S 2 1 , 2 , 4 ChartWminMWW-CUSUMW-EWMA
0.0473.51501.92501.66502.48498.64502.94
0.2577.4493.12100.82428.03333.45321.52
0.5019.8721.8825.59292.77107.19103.15
1.003.273.463.5286.5713.0414.29
1.501.321.331.3328.526.257.52
Disclaimer/Publisher’s Note: The statements, opinions and data contained in all publications are solely those of the individual author(s) and contributor(s) and not of MDPI and/or the editor(s). MDPI and/or the editor(s) disclaim responsibility for any injury to people or property resulting from any ideas, methods, instructions or products referred to in the content.

