Article

Surface-Modified Chitosan: An Adsorption Study of a “Tweezer-Like” Biopolymer with Fluorescein

Department of Chemistry, University of Saskatchewan, 110 Science Place, Saskatoon, SK S7N 5C9, Canada
*
Author to whom correspondence should be addressed.
Surfaces 2019, 2(3), 468-484; https://doi.org/10.3390/surfaces2030035
Submission received: 25 July 2019 / Revised: 10 August 2019 / Accepted: 14 August 2019 / Published: 18 August 2019

Abstract

:
Tweezer-like adsorbents with enhanced surface area were synthesized by grafting aniline onto the amine sites of a chitosan biopolymer scaffold. The chemical structure and textural properties of the adsorbents were characterized by thermogravimetric analysis (TGA) and spectral methods, including Fourier transform infrared (FT-IR), nuclear magnetic resonance (1H- and, 13C-NMR) and scanning electron microscopy (SEM). Equilibrium solvent swelling results for the adsorbent materials provided evidence of a more apolar biopolymer surface upon grafting. Equilibrium uptake studies with fluorescein at ambient pH in aqueous media reveal a high monolayer adsorption capacity (Qm) of 61.8 mg·g−1, according to the Langmuir isotherm model. The kinetic adsorption profiles are described by the pseudo-first order kinetic model. 1D NMR and 2D-NOESY NMR spectra were used to confirm the role of π-π interactions between the adsorbent and adsorbate. Surface modification of the adsorbent using monomeric and dimeric cationic surfactants with long hydrocarbon chains altered the hydrophile-lipophile balance (HLB) of the adsorbent surface, which resulted in attenuated uptake of fluorescein by the chitosan molecular tweezers. This research contributes to a first example of the uptake properties for a tweezer-like chitosan adsorbent and the key role of weak cooperative interactions in controlled adsorption of a model anionic dye.

Graphical Abstract

1. Introduction

Water pollution by different contaminants from industrial activities remains a topic of major environmental concern [1]. Various techniques for the removal of contaminants include precipitation [2], ion exchange [3], filtration [4], solvent extraction [5], reverse osmosis [6], coagulation-flocculation [7,8], adsorption [9], and others. Among these approaches, adsorption-based techniques have been extensively studied as an efficient mode of contaminant removal from water, due to their low cost, process flexibility, easy handling and limited usage of secondary chemicals [10,11,12]. Recently, researchers have focused on the controlled separation of various kinds of contaminants, such as dyes, metal cations, anions and pharmaceuticals from water resources. The presence of trace amounts of pollutants will produce a large volume of contaminated water which poses some health concerns for human and ecosystem health [13]. Dye-based chemicals with complex molecular structures are often recalcitrant and negatively affect photosynthetic processes. Fluorescein (FL) or uranine is a highly water-soluble red powder, a well-known dye that is widely used in water tracing [14,15], fluorescent probing for analyte detection [16], leakage detection of anti-freezes [17], the textile industry [18], and in medicine [19,20,21]. Although FL is not considered highly toxic [22] (LC50 = 3800–5000 mg/L) relative to other synthetic dyes, the problem of intense water coloration that occurs with trace amounts of this dye is understood due to aesthetic considerations. It is noteworthy that comparatively few studies have investigated fluorescein removal from aqueous media using adsorption techniques [23,24,25,26,27,28,29,30,31].
Chitosan is the second most abundant biopolymer with N-acetyl-d-glucosamine and glucosamine monomer units. The presence of polar functional groups in chitosan, hydroxyl (-OH) and -NHR (amine, R = H; or amide, R = acetyl) groups are suitable for adsorption [32,33], where some variability of its properties is known according to its molecular weight and degree of acetylation (DAC). Muzzarelli first described the synthesis and adsorption properties of chitosan in 1969, [34] and a body of published work followed thereafter on the removal of waterborne pollutants, including organic or inorganic species [35]. Chitosan flakes are a common material form in practical applications due to its moderate dye removal adsorption properties. However, the structural and chemical properties of pristine chitosan, including its high crystallinity, low surface-to-volume ratio and its relatively low mechanical strength, limit its wider application as an adsorbent material [36].
The surface grafting of functional groups onto biopolymer surfaces is a key modification technique that increases the number of adsorption sites and the surface area of chitosan, as shown by improved adsorption capacity [37,38]. The grafting of pendant aromatic rings to the biopolymer backbone of chitosan yields a tweezer-like adsorbent that finds its origin in the term “molecular tweezers” that was coined over 40 years ago by Chen and Whitlock [39]. Therein, a synthetic molecular host with at least two receptor sites are attached together via a rigid or flexible spacer unit. These kinds of hosts can make a sandwich with proper guests through weak intramolecular interactions including π-π stacking, van der Waals, ion-π, and so on [40,41,42,43]. From this point of view, it is possible to develop molecular tweezer-based adsorbents using a chitosan backbone to target aromatic guest species via adsorption [44].
Herein, we report the preparation and characterization of molecular tweezers obtained by grafting phenyl units onto chitosan, where we demonstrate the utility of such chitosan-based tweezers as an adsorbent for FL uptake with notable adsorption capacity. This study is a first example that reports on the textural, surface chemical properties, and adsorption of fluorescein for such chitosan-based molecular tweezers adsorbents. The functional pendant units of the molecular tweezers are inferred to play a key role in the adsorption process, where the pendant aromatic rings afford molecular recognition via weak cooperative interactions. This study contributes to the design of a unique class of modified chitosan materials via a facile synthetic approach with tunable adsorption properties.

2. Materials and Methods

2.1. Materials

Low molecular weight chitosan (∼75%–85% deacetylation), acetaldehyde, aniline, acetic acid, fluorescein as sodium salt (FL), dodecyl trimethyl ammonium bromide (DTAB) and didodecyl dimethyl ammonium bromide (DDAB), deuterium oxide (D2O), hydrochloric acid, ethanol 95%, sodium hydroxide, DMF and acetone (all ACS grade) were purchased from Sigma-Aldrich and used without further purification. Millipore water was used for the preparation of all aqueous samples.

2.2. Synthesis of Tweezers-Like Adsorbent (CS-Ac-An)

Low-molecular weight chitosan (1.2 g) was dissolved in 60 mL (2% acetic acid) solution in a 150 mL round bottom flask equipped with a Teflon-coated magnetic stir bar. The solution was stirred for 30 min at 23 °C, followed by addition of aniline (470 µL, 5.1 × 10⁻³ mmol) to the light yellow viscous chitosan solution whilst stirring for 30 min further. Acetaldehyde (285 µL, 5.1 × 10⁻³ mmol) was added to the mixture, and a white low-viscous solution was formed. The reaction mixture was stirred at 70 °C for 18 h. A 3 M NaOH solution was added gradually to the reaction mixture with vigorous stirring up to pH 7 was attained, where a pink precipitate was formed.
The precipitate was separated from the supernatant using centrifuge for 10 min and washed several times with water and ethanol 70%, dried in vacuum oven at 50 °C for 6 h and stored in a glass vial. Scheme 1 illustrates the synthetic route of grafting the aniline to the chitosan backbone to afford the molecular tweezers-like adsorbent.

2.3. Characterization

2.3.1. Thermogravimetric Analysis (TGA)

For thermal gravimetric analysis of the materials, a TA Instruments Q50 TGA system (TA instruments, New Castle, DE, USA) was used, where the heating rate was 5 °C per minute from 23 °C up to 500 °C with a N2 carrier gas. First derivative (DTG) plots are shown as weight change (%) with temperature (%/°C) vs. temperature (°C) to analyze the thermal stability of the materials.

2.3.2. Fourier Transform Infrared (FT-IR) Spectroscopy

FT-IR spectra of solid samples were recorded using Bio-RAD FTS-40 spectrophotometer (Bio-RAD Laboratories, Inc., Hercules, CA, USA). Samples were mixed with spectroscopic grade KBr with a 1:10 (w/w; sample: KBr) ratio by grinding in mortar and pestle. The diffuse reflectance infrared Fourier transform (DRIFT) spectra were recorded in reflectance mode between 500 to 4000 cm−1 with multiple (n = 64) scans and a spectral resolution of 4 cm−1. All spectra were corrected relative to pure KBr as background at 23 °C.

2.3.3. 1H- and 13C- Nuclear Magnetic Resonance (NMR) Spectroscopy

All NMR spectra were acquired using a Bruker Advance DRX 500 Hz NMR spectrometer operating (Bruker BioSpin Corp., Billerica, MA, USA) at 500.13 MHz. NMR samples were obtained in D2O/HCl at 23 °C. Chemical shifts were internally referenced to tetramethylsilane (TMS, δ = 0.0 ppm). The acquisition parameters for 1H-NMR are given: number of scans (n = 16), recycle delay (2 s), and acquisition time = 10 µs. The respective parameters for 13C-NMR spectra are given: number of scans (n = 6352), recycle delay (2 s), and acquisition time = 20 µs. 1D and 2D-NOESY spectra were recorded with mixing time of 350 ms, recycle delay of 2 s with 16 scans and 3k data points.

2.3.4. Degree of Substitution (DS)

The 1H-NMR spectrum of CS-Ac-An was used to evaluate the DS of grafted chitosan using Equation (1), based on the relative integrals of H2 of the chitosan and aromatic protons [45,46] (cf. Figure S1, inset).
D S = I A r o m a t i c s / 5 I H 2 × 100
Here, IAromatics and IH2 represent the integrals of aromatic protons (grafted aniline to chitosan backbone) and the H2 proton signals, respectively.

2.3.5. Swelling Properties of the Tweezer-like Adsorbent at Equilibrium

Swelling tests were performed at ambient pH (7.0) by mixing 100 mg of CS-Ac-An with 7 mL of water for 24 h. The weight of swollen CS-Ac-An samples was determined after drying to constant on a pre-weighed filter paper (Ws). The dry weight (Wd) was determined after drying the hydrated adsorbent in a vacuum oven for 12 h at 50 °C [47]. The swelling ratio was obtained according to Equation (2).
S % = W s W d W d × 100

2.3.6. Scanning Electron Microscopy (SEM)

The surface morphology of CS-Ac-An sample was mapped using scanning electron microscopy (SEM Model SU8000, HI-0867-0003, JEOL, Ltd., Tokyo, Japan) without gold coating. The instrument conditions were: accelerating voltage (3.0 kV), working distance (9.1 mm), and magnification (50k×).

2.3.7. Adsorption Studies

Equilibrium Dye Adsorption

FL dye adsorption was studied under batch conditions using a fixed amount of the CS-Ac-An (ca. 10 mg) in a sealed 10 mL glass vials and 7 mL of FL solution at ambient pH (7.0) with variable concentration (10–1000 µM). A 1 mM FL stock was prepared by dissolving 0.332 g FL in 1 L of Millipore water and diluted accordingly. A linear calibration curve for FL absorbance at 485 nm was used to determine the concentration of unknown samples. Vials sealed with parafilm were agitated on a horizontal shaker (SCILOGEX SK-O330-Pro) for 24 h at 23 °C at 150 rpm. After achieving equilibrium, the adsorbent settled within 2 min and the supernatant was sampled. The optical absorption of FL was determined using a Thermo Scientific Spectronic-200 UV–Vis spectrophotometer at λmax = 490 nm directly in aqueous solution using Beer’s law. Dilution was used when necessary. The concentration of FL before (Co; mmol L−1) adsorption and after (Ce; mmol L−1) the process was measured. The uptake of FL at equilibrium was determined using Equation (3).
Q e = C o C e V m
Here, Qe (mg g−1) is FL uptake per gram of adsorbent, V (L) is the volume of FL solution and m (g) is the mass of the CS-Ac-An used in each vial, considering the dye molecular weight (FL = 332.31 g mol−1). Adsorption isotherms were obtained by plotting the adsorption capacity at equilibrium (Qe) as a function of the residual equilibrium concentration (Ce).
The adsorbent surface area (SA; m2 g−1) in its hydrated form was calculated using Equation (4), where Qm (mol·g−1) is the maximum monolayer adsorption capacity at equilibrium, N is Avogadro’s number (6.022 × 10²³ mol−1), σ (m2) is the cross sectional area of the fluorescein dye (7.13 × 10⁻¹⁹ m2 mol−1 for co-planar orientation) [48] and Y is the coverage factor (2 for FL since it makes aggregates when the concentration is higher than 5 µM) [49].
SA =   Q m N   σ Y
The removal efficiency (%R) of FL in solution was defined by Equation (5) as Co and Ce are defined by Equation (3).
% R = C o C e C e × 100
The surface-modified adsorbent was prepared by adding 0.1 g of CS-Ac-An to 10 mL of water and decreasing the pH with concentrated HCl solution until pH 2 to result in solubilization of adsorbent and to yield a clear solution. Then 0.05 g of DTAB or 0.007 g of DDAB was added and mixed thoroughly for 5 min. The surface-modified adsorbent precipitated when the pH increased to 7 using NaOH (3 M), then the product was washed with water and oven dried at 50 °C overnight. The adsorption properties of these surface-modified adsorbents (CS-Ac-An-DTAB and CS-Ac-An-DDAB) were carried out at ambient pH, as described above.

Adsorption Kinetics

The kinetics of FL adsorption by CS-Ac-An were studied using a one-pot method. Briefly, 200 mg of adsorbent was encased within a filter paper (Whatman No. 2) which was saturated with FL solution prior to the adsorption process. The system was immersed in 200 mL of 10 μM FL solution at ambient pH. Sample aliquots (3 mL) removed at different times (t = 0 to t = 180 min) where samples were taken at 3–5 min intervals in first hour and at 30 min intervals in the last hour. The adsorbed amount of FL was evaluated at λ = 485 nm, where the uptake capacities at variable time were determined using Equation (6).
Q t = C o C t V m
Here, Qt (mg g−1) is FL uptake per gram of adsorbent at different times, Cₒ (μM) is the initial concentration of FL solution after adsorption by the filter paper, Ct (μM) is FL concentration at variable time, V (L) is the volume of FL solution after sampling and m (g) is the mass of the wrapped adsorbent; considering the molecular weight of FL = 332.31 g·mol−1. Isotherms were plotted of adsorption capacity at each time Qt (mg g−1) vs. time (min).

Adsorption Isotherms and Data Modelling

The equilibrium adsorption profile was analyzed using Langmuir and Sips adsorption isotherm models (Equations (7) and (8); respectively). The Langmuir model [50] defines homogenous and monolayer adsorption while the Sips [51] isotherm describes heterogeneous monolayer adsorption by an adsorbent with non-uniform adsorption sites.
Q e = Q m   K L   C e 1 + K L   C e
Q e = Q m ( K S   C e ) n s 1 + ( K s C e ) n s
Qe (mg g−1) is the adsorbed FL per gram of adsorbent at equilibrium, Qm (mg g−1) is maximum adsorption capacity, KL (L mmol−1) is the Langmuir affinity constant, Ks (L mmol−1) is the Sips isotherm constant that relates to the adsorption energy, ns is a parameter which shows the surface heterogeneity of the adsorbent and Ce (mmol L−1) is concentration of FL at equilibrium. Comparison between chi-square values was used to find the “best-fit” model, which was confirmed by correlation coefficient (adjusted R2). To quantify the preference of adsorption process a dimensionless constant called the separation factor or equilibrium parameter (RL) was used, which is defined by Equation (9).
R L = 1 1 + C 0 K L
C0 (mmol L−1) is the initial concentration of FL and KL is the Langmuir constant (L mmol−1). For favorable interactions RL values were between zero and one, while an unfavorable interaction indicated an RL value greater than unity. RL = 0 and 1 indicated irreversible and linear interactions, respectively. The separation factor was calculated for different initial concentrations [52].
The time-dependent adsorption data were tested using the pseudo first order (PFO) [53] and the pseudo second order (PSO) [54] kinetic models, given in Equations (10) and (11).
Q t = Q e 1 e k 1 t
Q t = Q e 2   k 2 t 1 + Q e k 2 t
Qt (μg g−1) is FL uptake at different time intervals; k1 (min−1) and k2 (g mg−1 min−1) are the adsorption rate constants for the PFO and PSO models, respectively. The minimized Chi-square was used to find the “best-fit” kinetic model to the experimental results.

Adsorbent Regeneration Studies

CS-Ac-An was studied for regeneration for up to five cycles. About 10 mg of adsorbent was encased within a filter paper that was added to a 10 mL glass vial followed by addition of 7 mL of FL solution (120 µM) at ambient pH and agitated for 24 h. The FL content was analyzed using UV-vis spectroscopy. The spent adsorbent was decanted, soaked in DMF (3 mL) for 20 min and sonicated for 10 min, followed by further soaking in acetone (3 mL) for 20 min and sonication for another 10 min [27]. Then the mixture was filtered and vacuum dried at 50 °C overnight.

3. Results and Discussion

As outlined in the introduction section above, the grafting of phenyl units onto a chitosan scaffold has not been reported as a design strategy for the preparation of molecular tweezer-like systems. Therefore, structural characterization using different instrumental techniques was carried out to study the unique structure of the modified chitosan. As well, structural characterization is a key aspect to gaining an improved understanding of the adsorption properties and the role of active functional groups involved in the adsorption process. Complementary adsorption studies with fluorescein (FL) was carried out at equilibrium and dynamic conditions to accompany the characterization results, as outlined in the accompanying sections below.

3.1. Characterization of the Tweezers-Like Adsorbent (CS-Ac-An)

3.1.1. TGA

TGA curves were recorded as DTG plots from 25 to 500 °C under nitrogen gas, as shown in Figure 1. The profile of pure chitosan (CS, Figure 1a) has three major decomposition stages, the first event appears up to 120 °C due to loss of bound water (8–10%), while ca. 75–80% of it decomposes between 215 °C and 380 °C and a remaining weight loss (10%) occurs above this temperature. The tweezer-like adsorbent (CS-Ac-An) decomposes as two broad events. The initial decomposition temperature (IDT) decreases to 200 °C and continues to 350 °C, in this step about 60% of the sample decomposed, while a minor loss appeared between 365 °C and 500 °C for decomposition of 20% of the material. As can be seen in Figure 1, there is no water loss below 100 °C, in comparison with pristine chitosan. The trend relates to the higher lipophilicity of the tweezer-like biopolymer structure versus pristine chitosan. The molecular structure of the adsorbent was further characterized by FT-IR and NMR spectra, as outlined in Section 3.1.2 and Section 3.1.3.

3.1.2. FT-IR Spectroscopy

The FT-IR spectra of pristine CS and CS-Ac-An are shown in Figure 2. The IR spectrum of pristine chitosan is characterized by a broad band at 3000–3500 cm−1 which is due to the strong intermolecular hydrogen bonds of -OH and -NH2 (amide II) groups. Bands near 2900 cm−1 relate to C-H stretching, 1652 cm−1 to amide I (C=O), 1593 cm−1 to amide II (N-H) bending, 1380 cm−1 to -CH and -CHOH and 1140 cm−1 to C-O-C in agreement with another report [52]. The spectra of CS-Ac-An shows similar features, where the intensity of 3000–3500 cm−1 band decreased due to grafting of -NH2 groups and disruption of the intermolecular hydrogen bonds. The signature of the grafted rings due to N-H bending and C=C stretching of aromatic bonds appeared as sharp bands at 1607 and 1496 cm−1, and also at 749 cm−1, which is attributed to aromatic C-H bending. These results provide evidence that the aromatic rings were successfully grafted onto chitosan the backbone. The grafting is further supported by the 1H- and 13C-NMR spectral results in Section 3.1.3.

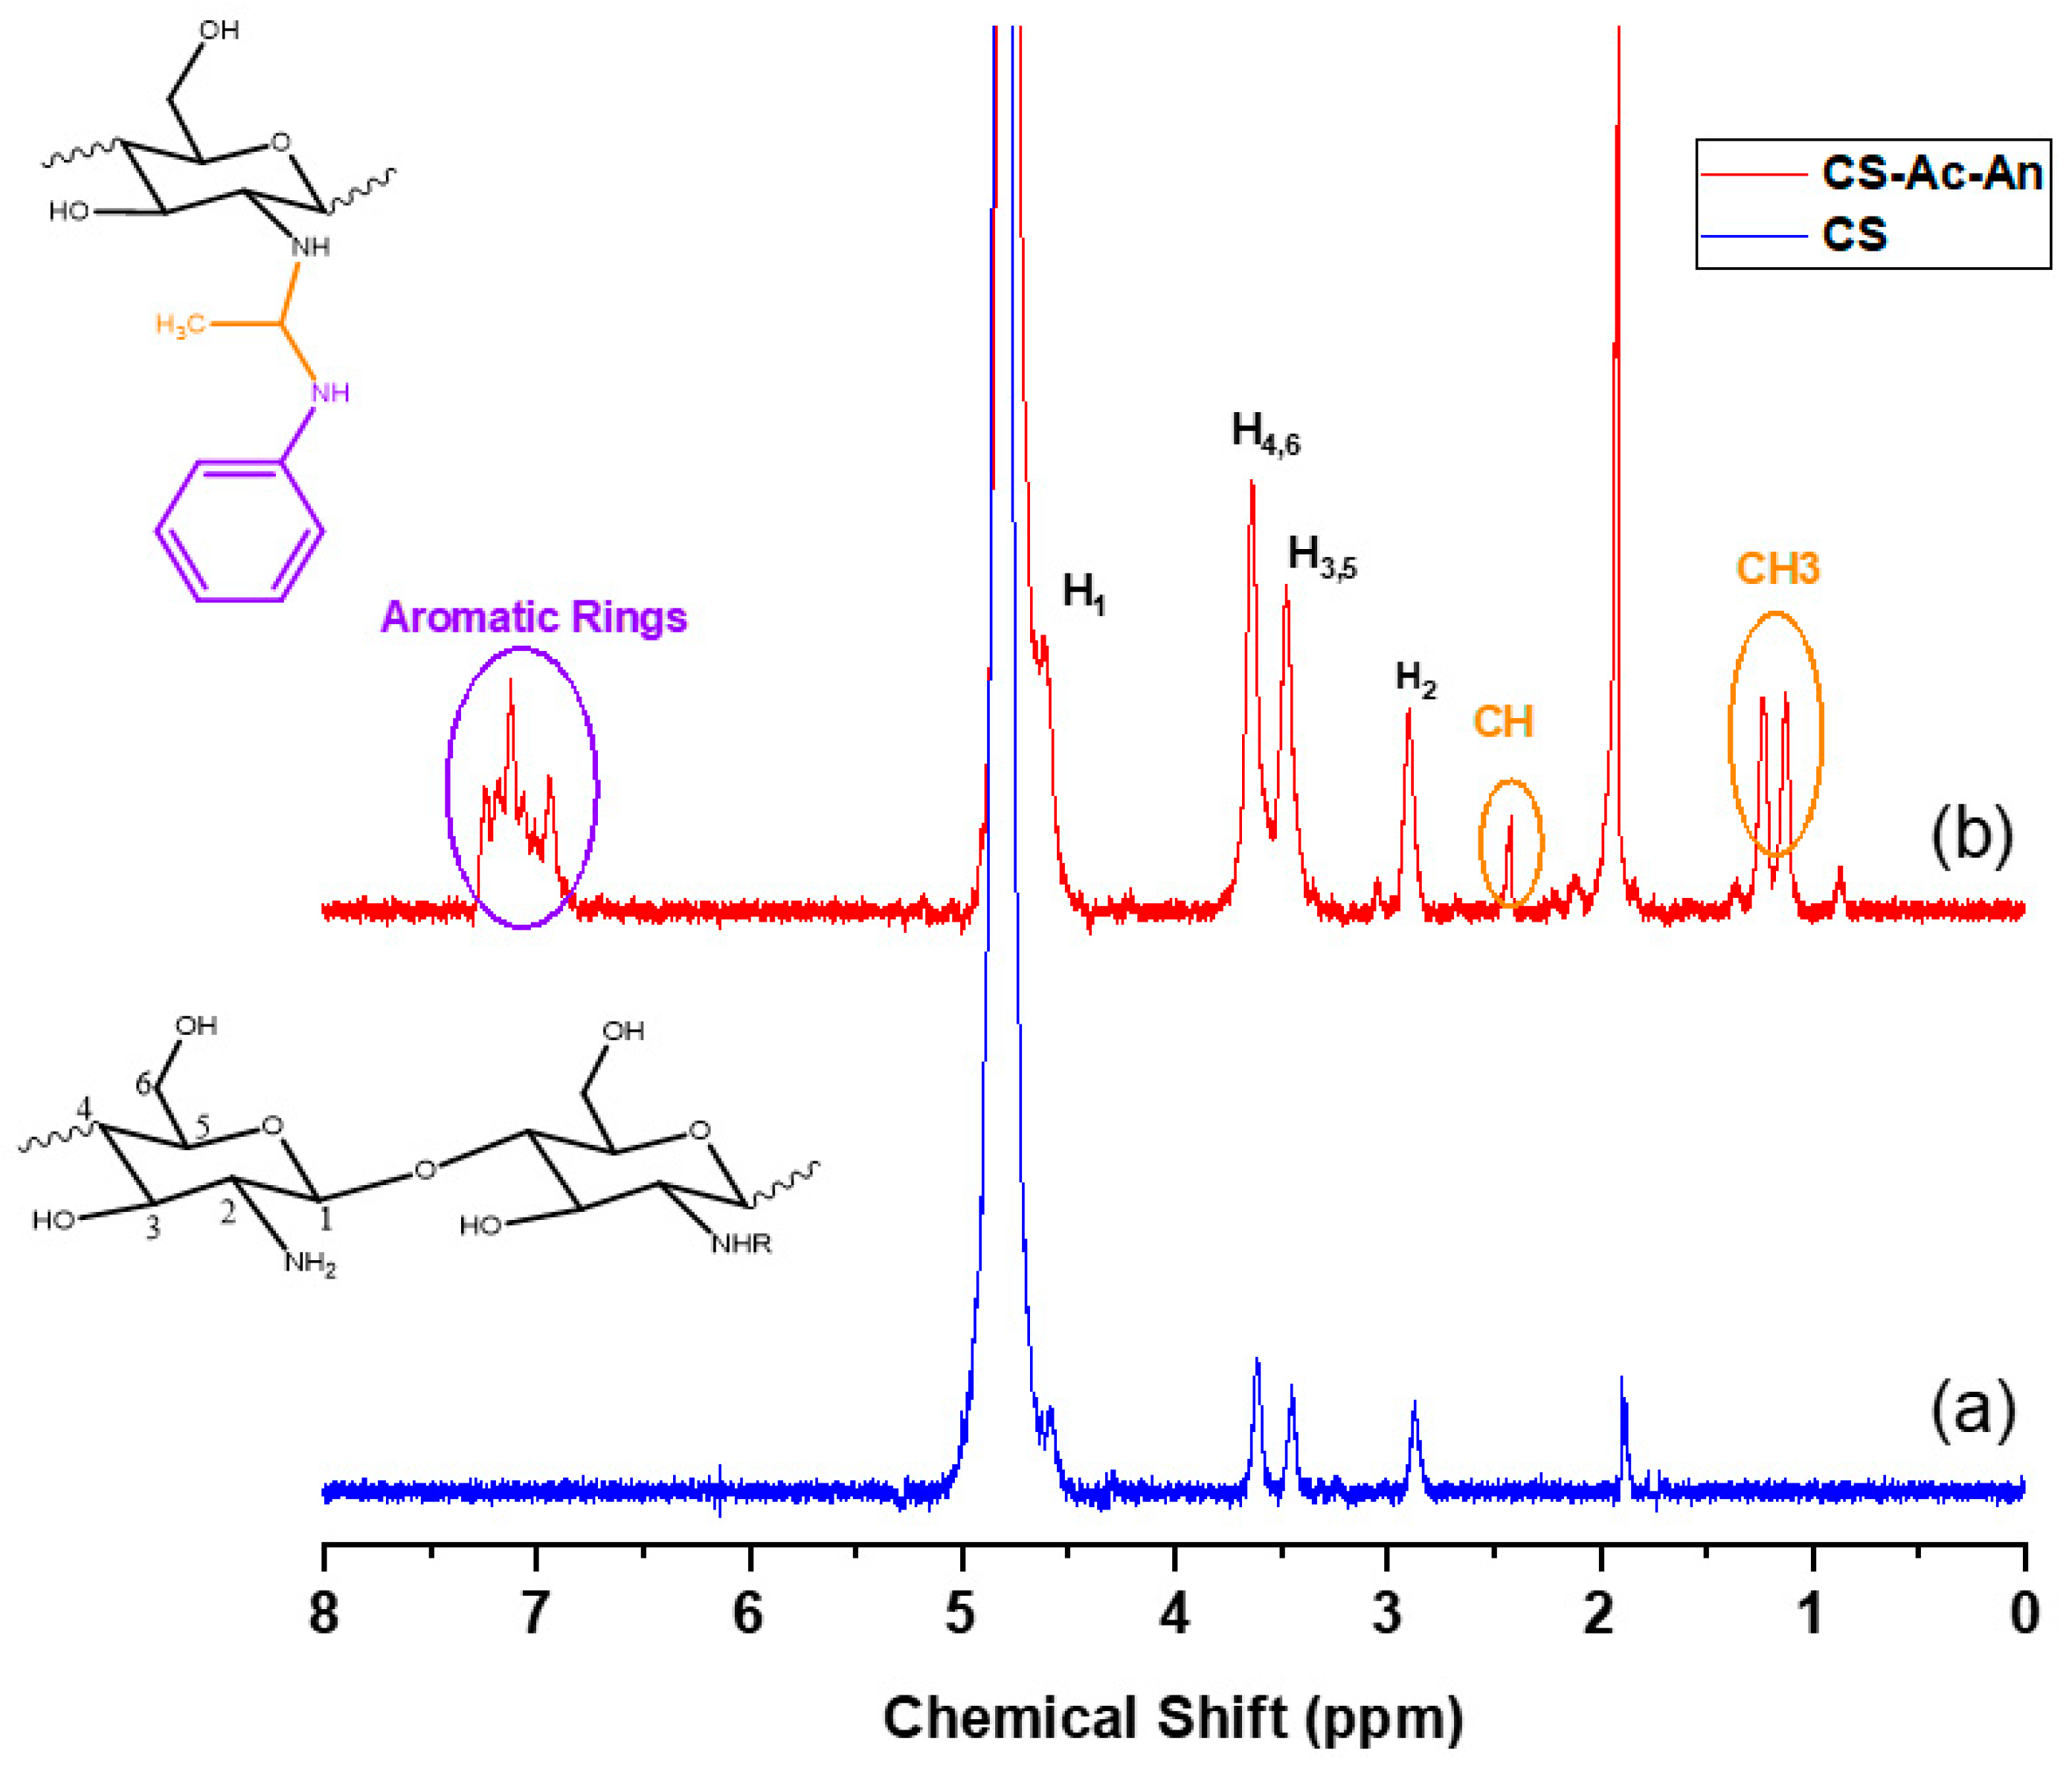
3.1.3. 1H-NMR and 13C-NMR Spectroscopy

1H-NMR spectra of pristine chitosan (CS) and tweezer-like adsorbent (CS-Ac-An) are presented in Figure 3, where strong evidence for the grafting reaction is shown. The signal at 1.88 ppm is attributed to the methyl protons for the acetyl group of chitosan, while the resonance line at 2.87 ppm relates to the 1H nuclei for C2. Signatures at 3.45 ppm and 3.60 ppm relate to 1H nuclei of the C3-C5 and C4-C6, respectively. The 1H nuclei of C1 appeared as a shoulder at 4.58 ppm, where spectral overlap occurs with a prominent solvent peak (HOD) at ~4.63–4.97 ppm. These spectral assignments are in good agreement with other reports [55,56,57]. As shown in Figure 3b, 1H-NMR spectra of CS-Ac-An reveal characteristic peaks as a doublet, which is attributed to the spacer methyl group between chitosan backbone and the pendant aromatic ring of aniline (see inset of Figure 3a). This methyl group appeared as a doublet at 1.32–1.42 ppm due to coupling with the adjacent methylene group. The multiplet signal at 2.40–2.47 ppm relates to methylene spacer, which is coupled with methyl and also N-H protons. Signatures are noted between 6.99–7.25 ppm that arise from aromatic protons of the grafted aniline to chitosan structure. The other glucopyranose signatures have similar chemical shift values to that of pristine chitosan. The DS of aniline rings to the chitosan was calculated to be 40% using the integrated peak areas of the 1H-NMR signatures defined by Equation (1). The 1H-NMR spectra of CS-Ac-An with an integrated peak area are shown in Figure S1 in the supporting information (SI).
The 13C-NMR spectrum of CS-Ac-An, shown in Figure S2 (SI), confirmed the structure of the CS-Ac-An. Signatures of the glucopyranose nuclei chitosan backbone appeared at 32 ppm for methyl of acetyl group, 55 ppm for C2, 59 ppm for C6, 70 ppm for C3, 74 ppm for C5, 76 ppm for C4. Signal at 97 ppm attributed C1. (See inset Figure 3a,b for the chemical structure). Spectral lines at 17 and 47 ppm were assigned to spacer methylene and methylene groups. Signals between 122–132 ppm correspond to pendant aromatic carbons which are grafted onto the chitosan backbone, in agreement with the TGA and FT-IR spectral results.

3.1.4. Equilibrium Swelling Properties of the Chitosan Adsorbent
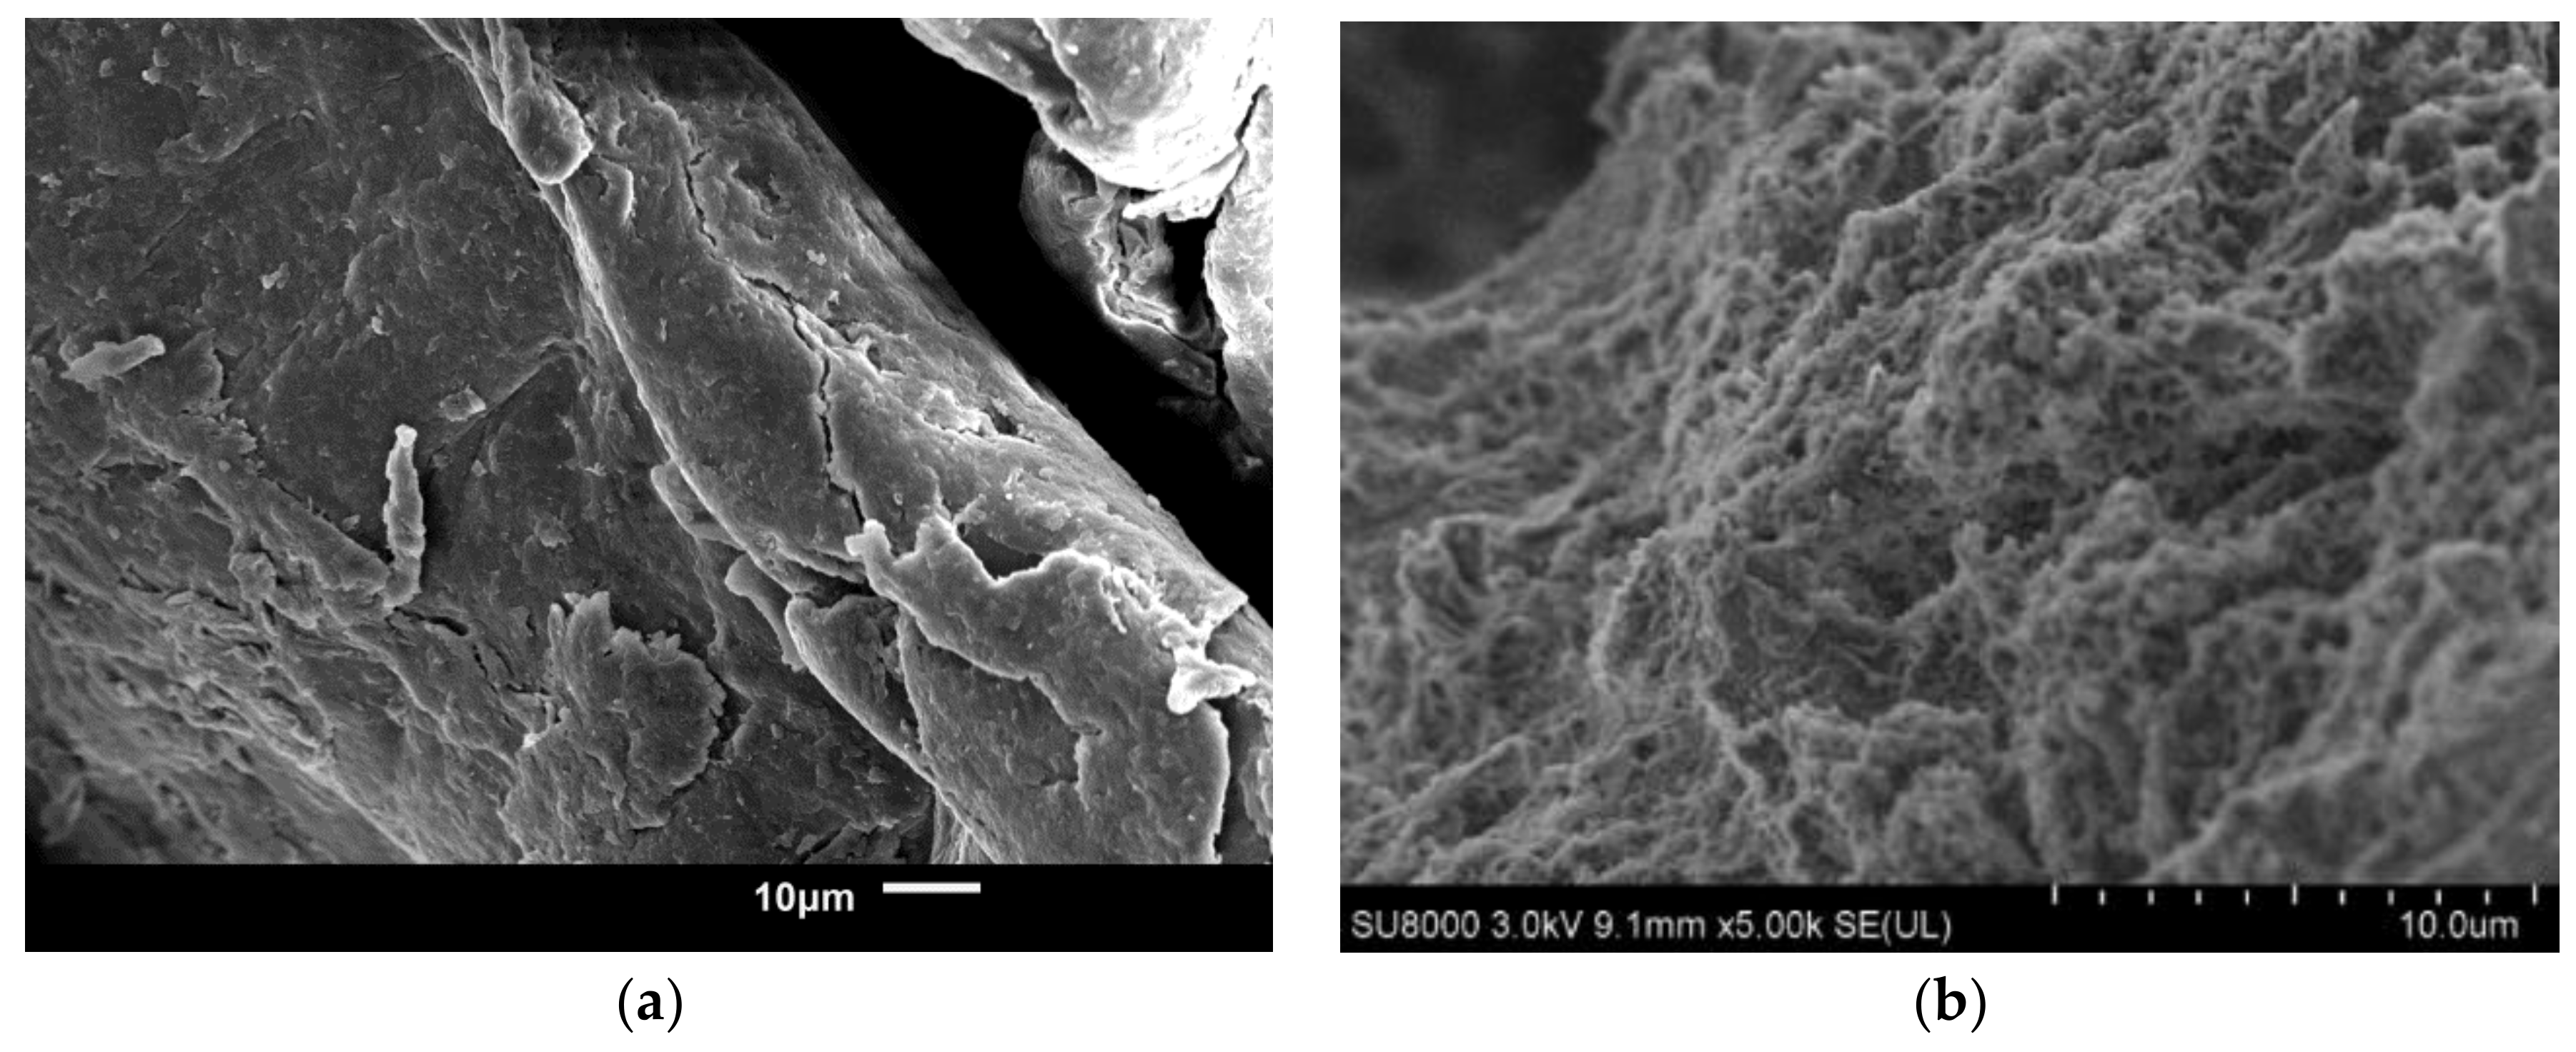
The ability of an adsorbent to retain solvent was studied by equilibrium solvent swelling in water. This method provides insight related to the presence of accessible hydrophilic functional groups of an adsorbent and a measure of its hydrophile-lipophile balance (HLB). The swelling percentage of CS-Ac-An was 40%, in comparison to 400% for pristine chitosan [47]. This considerable drop was related to a reduction of the surface hydrophilicity after grafting of aniline and the reduction in the number of free -NH2 groups that may undergo hydrogen bonding.

3.1.5. SEM

Figure 4a,b illustrates SEM micrographs for chitosan and CS-Ac-An. The images reveal that the grafted chitosan has a different morphology when compared against pristine chitosan. SEM images of chitosan reveal a smooth and regular surface topology, while CS-Ac-An presents a sponge-like surface structure. The SEM results provide evidence that grafting increased the porosity and yields a rougher surface. According to the SEM images, the pendant aromatic rings on the chitosan backbone result in a variable surface topology with greater porosity and surface roughness, in comparison to unmodified chitosan, as shown by the TGA and spectral (FT-IR and NMR) results.

3.1.6. Surface Area (SA)

A dye-based SA calculation was used to evaluate the textural properties of the adsorbents in their hydrated form [58]. The surface area of CS-Ac-An in the FL solution was calculated 40.2 m2 g−1 at ambient pH using Equation (4). The adsorption was inferred to occur via a co-planar mode of adsorption onto the adsorbent surface, where the calculated SA is comparable to a previous report for a chitosan dye-based adsorption study [59].

3.2. Adsorption Studies

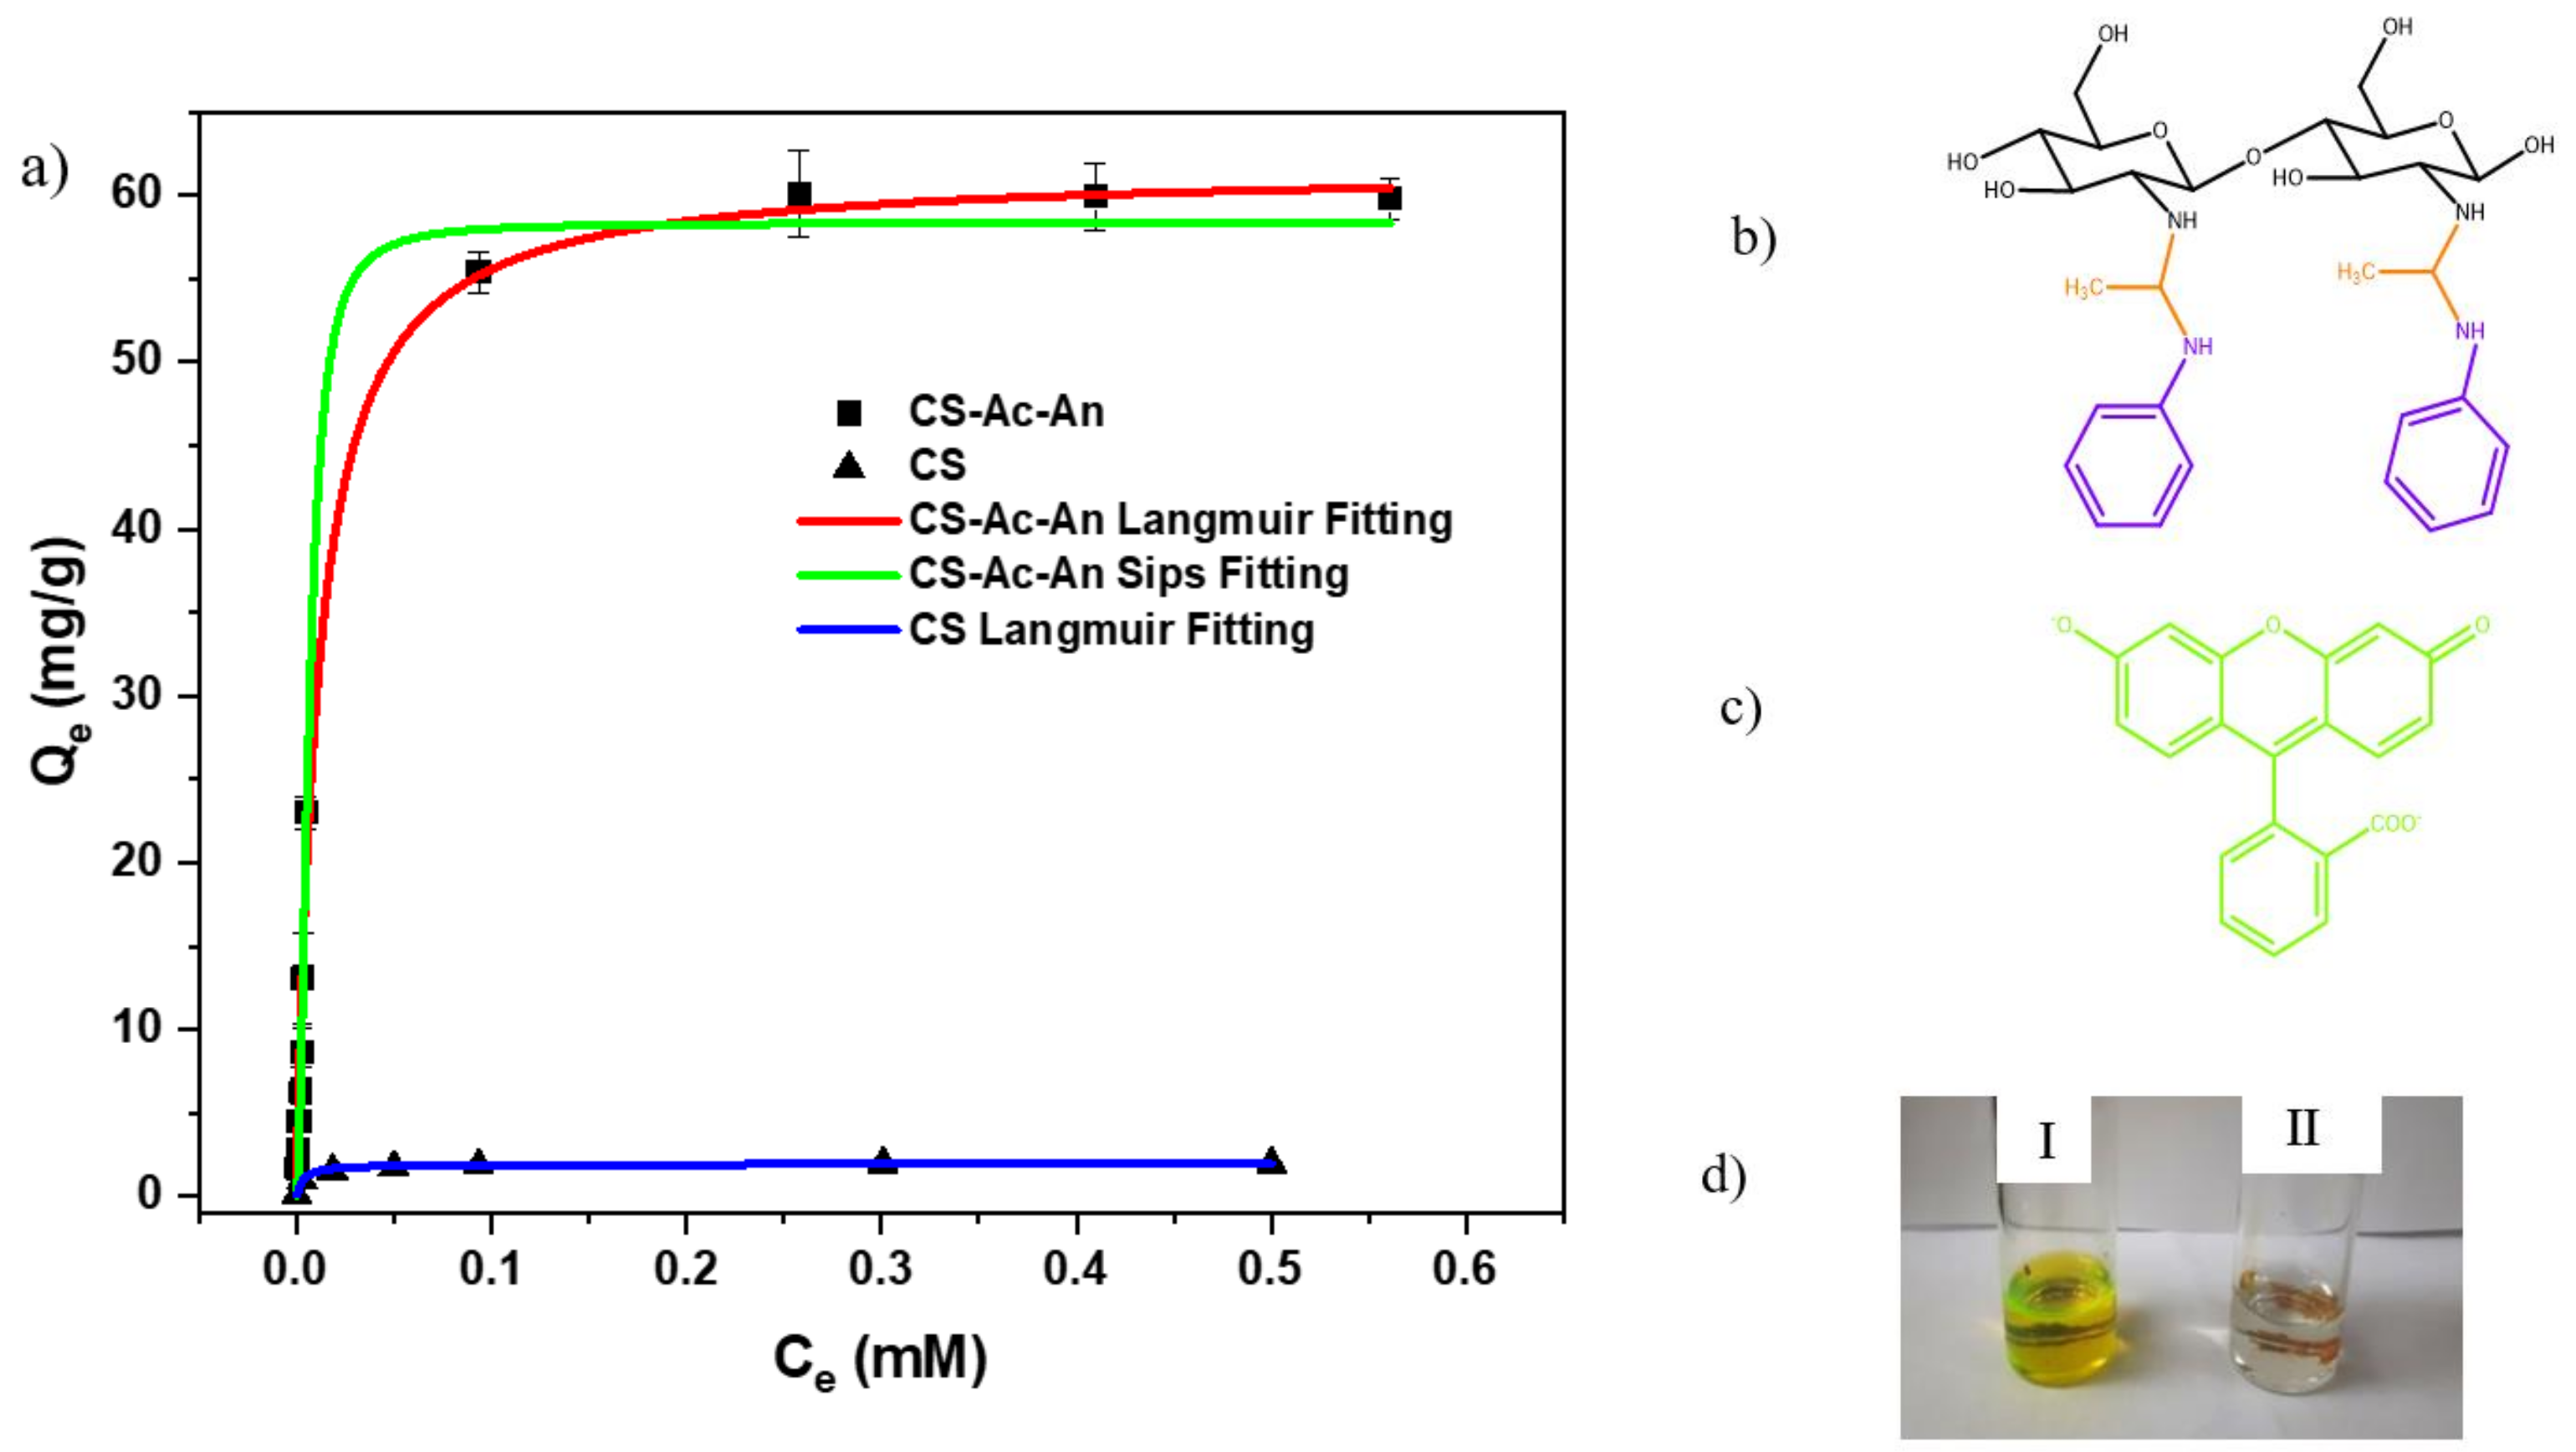
3.2.1. Equilibrium Adsorption of FL

The uptake properties of CS-Ac-An was compared against FL at ambient pH. While chitosan shows negligible adsorption for FL, CS-Ac-An exhibited notable adsorption with the dianion form of FL at ambient pH [60]. It appears that strong adsorption interactions occur between FL and the tweezers-like adsorbent, where a concentrated solution of FL (Co = 80 µmol L−1) with an initially intense yellow color turned completely colorless upon addition of ~10 mg of CS-Ac-An at equilibrium conditions.
The adsorption isotherms provide insight into the nature of the adsorbent-adsorbate interactions [61]. In Figure 5, the Langmuir and Sips models were used to evaluate and the isotherm fitting parameters, as listed in Table 1 and Table S2 (cf. SI). These parameters appear to be comparable for the Langmuir and Sips isotherm models. Table 1 illustrates that the Langmuir model had a lower Chi-square (2.12) as compared with the Sips model (3.68). In addition, the Langmuir model had a higher correlation coefficient (0.993) in comparison to the Sips model (0.985). The poor fit obtained by the Freundlich model was revealed by the values of Chi-square and the adjusted R2 (cf. Figure S3). By contrast, the adsorption process was well-described by the Langmuir model. According to these results, the tweezer-like adsorbent has features consistent with homogeneous sites, monolayer adsorption, and cooperative π-π interactions. These results are consistent with the modified chemical structure of CS-Ac-An due to the presence of the grafted phenyl groups. The monolayer adsorption capacity (Qm) for FL is 61.8 mg·g−1 which is comparable to other reports for adsorbents used for FL uptake (cf. Table S1) [26,30]. This high adsorption capacity may be due to the greater surface area in accordance with surface modification of chitosan, according to the SEM results. The role of π-π stacking, OH-π, CH-π, anion-π and apolar interactions between accessible aromatic rings of tweezers-like adsorbent and FL are likely to be important contributions to the enhanced adsorption properties [62,63,64,65,66]. The RL values calculated (0.01 to 0.55) for different FL concentrations (0.010–1.000 mmol·L−1) demonstrate favorable interaction, especially at higher dye concentration [52,67]. It is worth noting that the removal efficiency of the adsorbent did not change with the solution pH between neutral to highly alkaline conditions (cf. Figure S4 in SI), consistent with the chemical structure of adsorbent. While the adsorbent is soluble in acidic media, it is not practical to study the role of pH effects for such solid-liquid equilibria below pH 6 due to dissolution of the polymer at such acidic pH conditions.

3.2.2. Equilibrium Adsorption of FL Using Surfactant Modified CS-Ac-An

The adsorption properties of surfactant-modified CS-Ac-An with FL were studied with the use of DTAB and DDAB under equilibrium conditions. In previous studies, different surfactants were used to study the improvement of the adsorption capacity of chitosan and its modified forms with various target pollutants [68,69,70,71]. Herein, two cationic surfactants (DTAB and DDAB) were selected to study the role of surface effects of cationic surfactant doping on the adsorption properties with the FL dianion. The concentrations used for both surfactants were above their respective CMC values (cf. Table S3 in SI) to favor formation of the strong chitosan-surfactant complexes [70]. It can be seen that the results are comparable when both surfactants are in their micellar form and polymer chain becomes saturated. Previous structural characterization results provide evidence of favourable apolar interactions of the chitosan chain with the apolar chain of the surfactants [33,37,72].
Figure 6 shows the effect of surfactant impregnation of CS-Ac-An on removal efficiency of a FL solution (120 µmol L−1) at equilibrium. As can be seen, the removal efficiency of FL decreased from 98.5% to 73.9% for CS-Ac-An-DTAB and 19.8% for CS-Ac-An-DDAB. Firstly, this can be explained by the role of strong cation-π interaction between polar head group of cationic surfactants and electron rich aromatic rings of tweezer-like adsorbent which involved them enough to decline their interaction with FL [73], and secondly, by steric effects of the long alkyl tails of the surfactant that hinders an effective adsorbent-adsorbate interaction. In the other words, hydrocarbon tails of the surfactants made the surface of the adsorbent more lipophilic in nature, whereas the FL dye is hydrophilic in nature, as evidenced by its relatively high water solubility and low solubility in organic solvents [74,75]. A greater decrease in the FL uptake upon applying dimeric surfactant (DDAB) instead of monomeric type (DTAB) provided further confirmation of these results. This difference in adsorption of FL may be due to greater steric hindrance for two long hydrophobic tails of the surfactant with FL that renders an effective adsorbent-adsorbate interaction while the phenyl rings participate in cation-π interactions (cf. Scheme 2). A similar effect was reported by Karoyo et al. [76] upon doping of starch biopolymers with cationic surfactants, where HLB character and adsorption properties of the biopolymer were dramatically altered for the resulting starch-surfactant complex. An apparent decrease of the HLB of the adsorbent surface had an adverse effect on the adsorption of FL that was more evident in the case of DDAB [77].

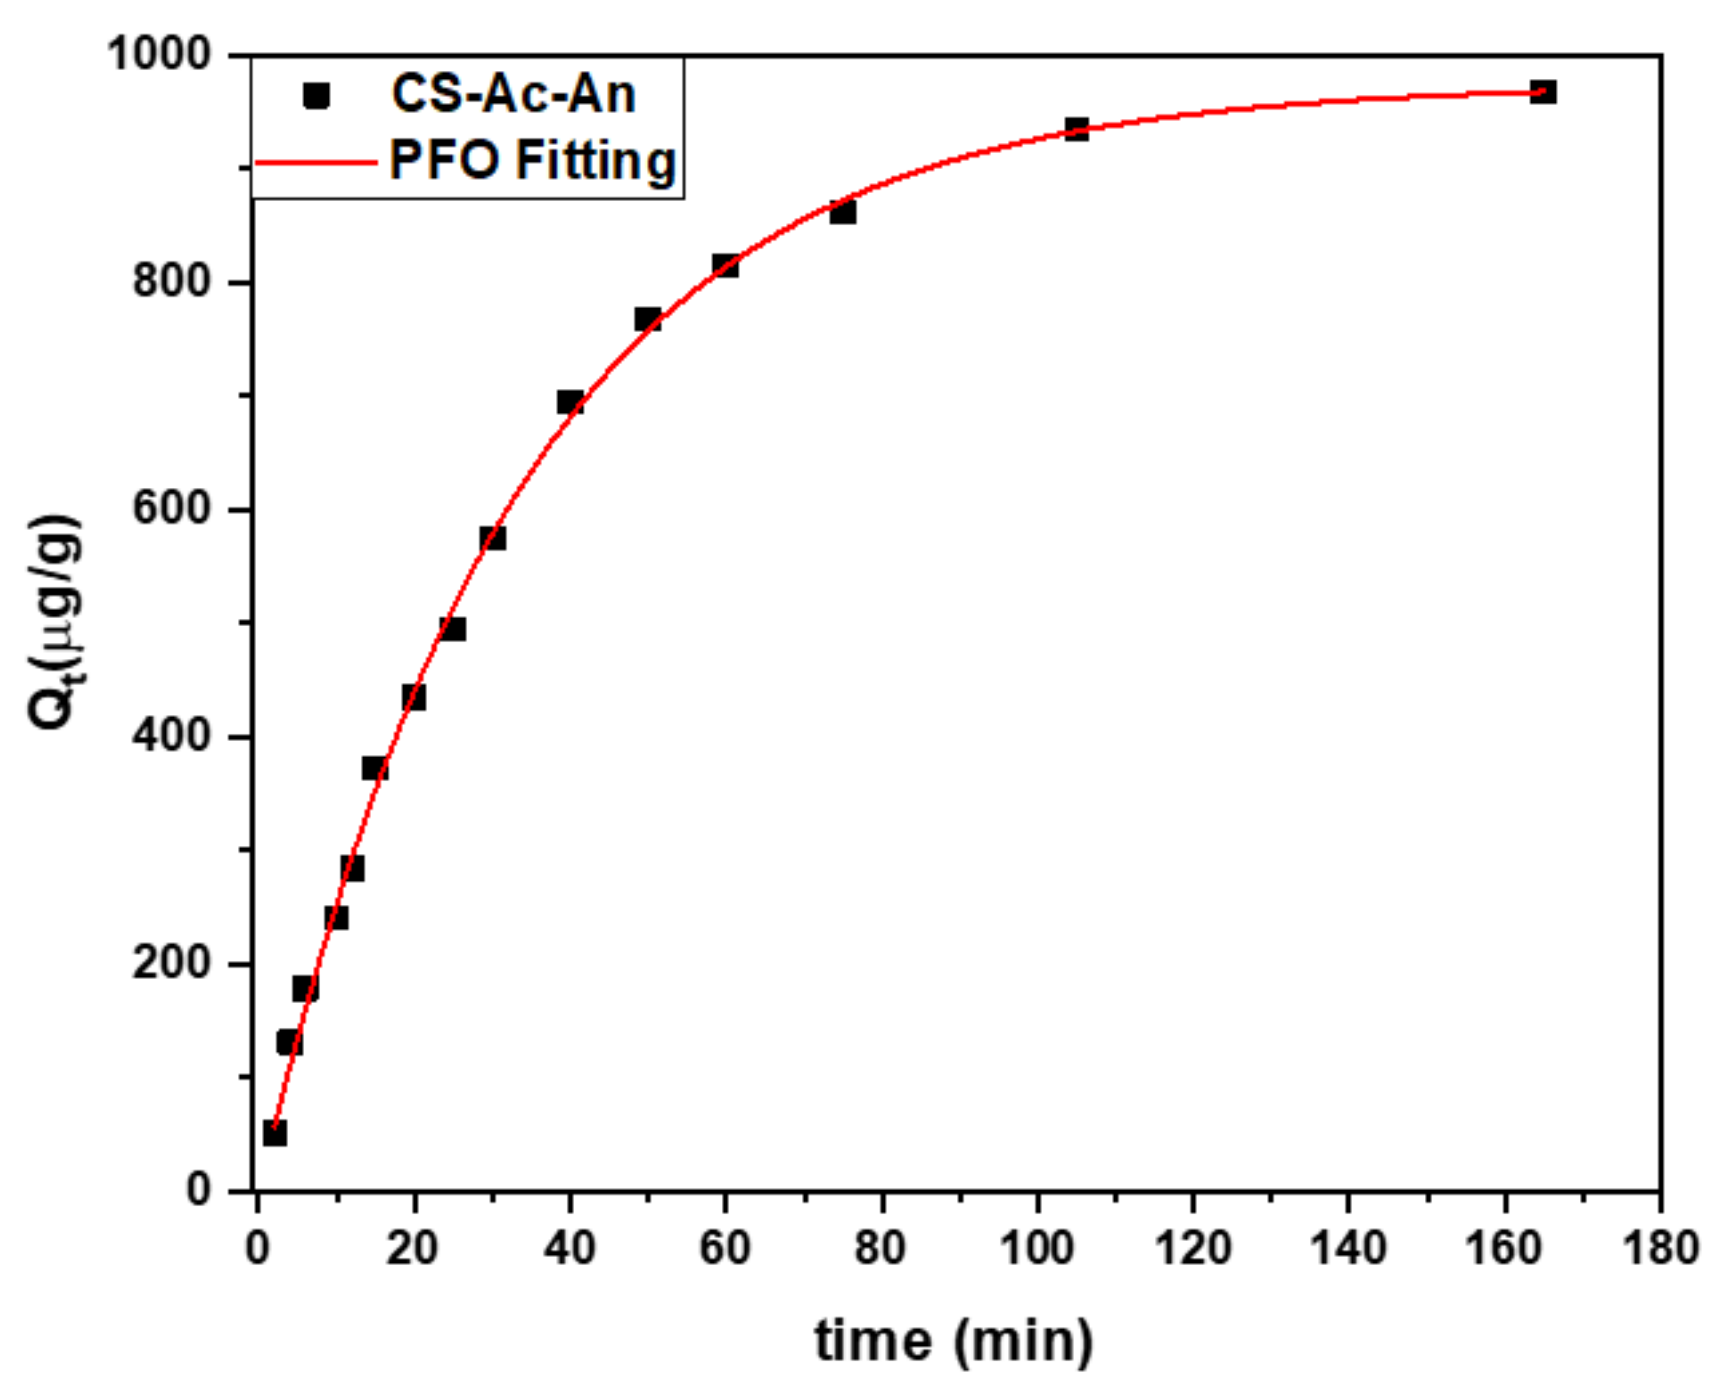
3.2.3. Kinetic Studies of FL Using CS-Ac-An

The kinetic uptake profile of FL against time with CS-Ac-An was obtained using a one-pot kinetic method [78]. The results of the kinetic study at 23 °C are shown in Figure 7, where the adsorption capacity (Qt) increased in the first 60 min and remained constant thereafter. The trend can be interpreted by the high number of adsorption sites in the initial stage of the experiment, while after saturation of the adsorption sites, Qt was constant. The PFO kinetic model was observed to be the preferred kinetic model, based on its lower chi-square value (17.1) and high correlation coefficient (0.998), in contrast to the PSO model (cf. Figure S6 for PSO profile). The best-fit parameters for the kinetic adsorption process are summarized in Table 2 for the PSO and PFO models.

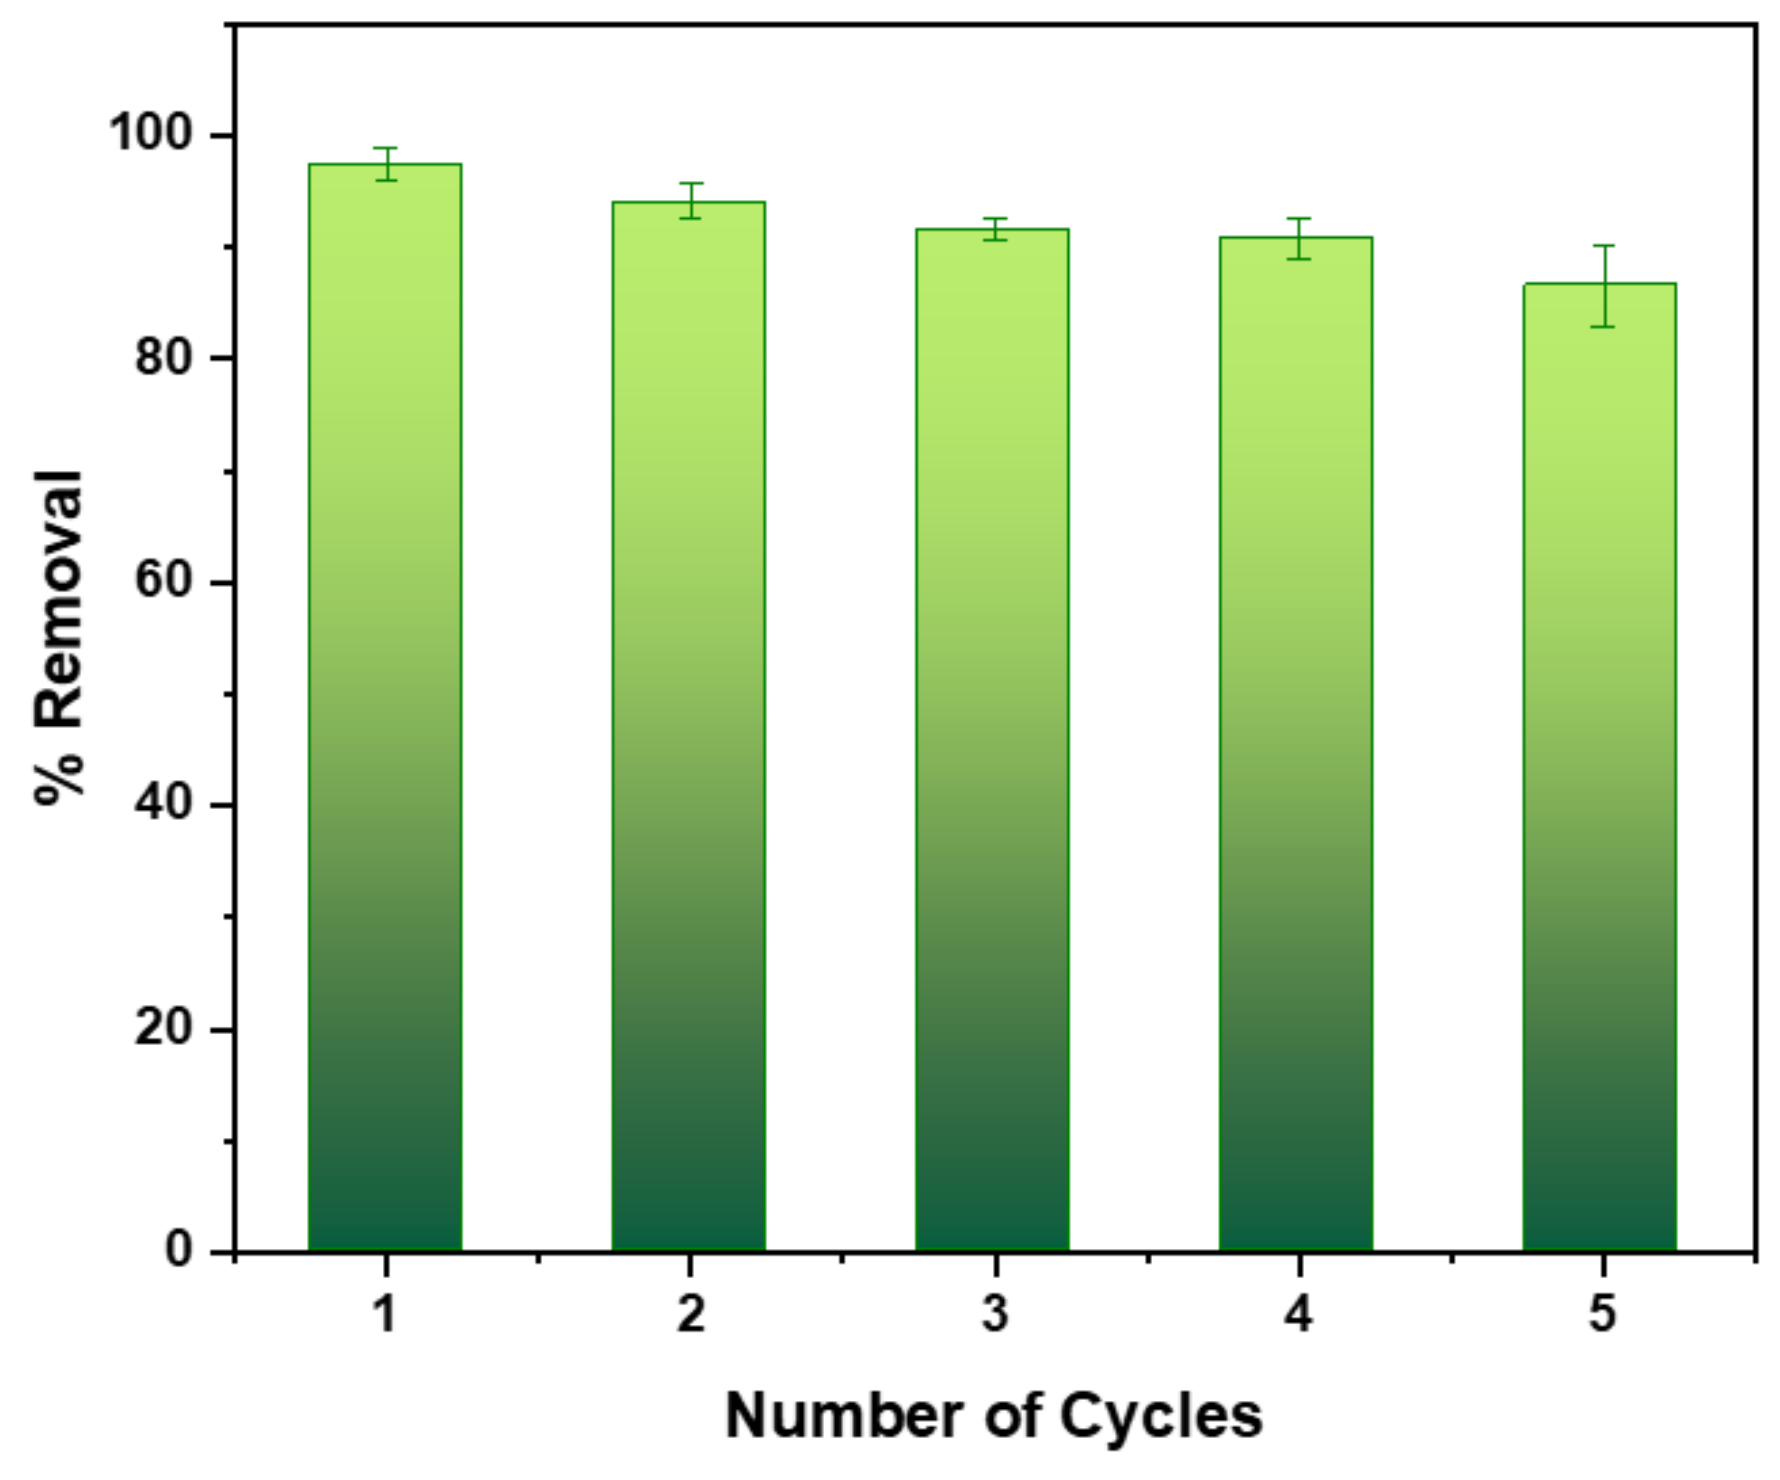
3.2.4. Regeneration Studies

To make adsorption an economic and environmental friendly process for wastewater treatment, regeneration and reuse of the adsorbent should be a consideration in scale-up processes [79]. The regeneration for CS-Ac-An was studied by solvent washing to determine the removal efficiency for adsorbed FL using Equation (5). The process was repeated for five consecutive cycles. As observed in Figure 8, the tweezers-like adsorbent did not show any notable loss of its high adsorption capacity through five cycles, where it changed from 98.5% in first cycle to 89.3% in fifth cycle. This shows CS-Ac-An can be used effectively for potential industrial scale wastewater treatment processes.

3.2.5. Adsorption Mechanism, 1D/2D NOESY Study

A 2D NOESY spectrum for adsorbent-adsorbate complex was obtained to further investigate the adsorption process between the tweezer-like adsorbent with FL. The 2D NOESY spectrum in Figure S7 reveals a cross-peak that occurs between 1H nuclei of FL and the grafted aniline ring of the CS-Ac-An, provides further confirmation of through-space π-π interactions. Since the NOESY cross-peaks are somewhat weak in intensity, a more sensitive 1D NOESY technique was used to provide further support for the adsorption mechanism by selective irradiation of the desired nuclei [80], where the results are shown in Figure 9. To establish the role of π-π interactions between FL and the phenyl grafted units of CS-Ac-An, selective double irradiation of the grafted aniline proton (δ = 7.33 ppm), the entire aromatic region including FL proton was inverted. Similarly, the inversion of grafted aniline protons was observed due to irradiation of the FL signature at δ = 6.92 ppm.

4. Conclusions

A unique aniline-grafted chitosan adsorbent was prepared using a low-cost synthetic method that was based on a green design strategy in water under mild conditions. The resulting surface modification of chitosan yielded a porous adsorbent with high adsorption capacity. Complementary spectral characterization (FT-IR, 1H/13C-NMR) and TGA revealed covalent grafting of aniline onto chitosan. This study highlights a first example of fluorescein dye adsorption using chitosan with aniline pendant tweezer arms, as supported via 1D- and 2D-NOESY NMR spectral results. SEM results showed a greater surface area of the covalent grafted chitosan versus unmodified chitosan. The unique adsorption properties of the tweezer-like adsorbent with an anionic fluorescein (FL) dye were studied at ambient pH using isotherms at equilibrium and kinetic conditions in aqueous media. The monolayer adsorption capacity (Qm) of the tweezer-like chitosan with FL was 61.8 mg·g−1, where the notable removal efficiency was well-described by the Langmuir and PFO models under equilibrium and kinetic conditions. Attenuated adsorption of FL was demonstrated upon surfactant doping of the tweezer-like adsorbent with co-adsorbed cationic surfactants, which provided support of strong cation-π interaction between the surfactant and tweezer-like adsorbent, apart from changes to the HLB of the surface that decreased the FL uptake. Furthermore, the tweezer-like adsorbent was regenerated without notable loss in the adsorption capacity. This study contributes to a greater understanding of adsorption processes for hydrophilic anion species such as fluorescein, using a novel tweezer-like biopolymer system. Surface-modified materials of this type are anticipated to occupy an increasing role in advanced adsorption-based treatment processes due to their adaptive structural properties.

Supplementary Materials

The following are available online at https://www.mdpi.com/2571-9637/2/3/35/s1, Adsorption data at equilibrium and kinetic conditions, along with literature comparison of fluorescein with different adsorbents systems. Materials characterization (1D and 2D (NOESY) 1H NMR spectra, 1D 13C-NMR spectra of fluorescein-adsorbent systems, pHPZC results for CS-Ac-An and the effect of pH on the removal efficiency of the adsorbent.

Author Contributions

Conceptualization, B.V. and L.D.W.; methodology, B.V.; validation, B.V. and L.D.W.; formal analysis, B.V.; investigation, B.V.; resources, L.D.W.; data curation, B.V.; writing—original draft preparation, B.V.; writing—review and editing, B.V. and L.D.W.; visualization, B.V.; supervision, L.D.W.; project administration, L.D.W.; funding acquisition, L.D.W.

Funding

This research was funded by the Government of Canada through the Natural Sciences and Engineering Research Council (NSERC), Discovery Grant Number: RGPIN 2016-06197. B.V. acknowledges support provided by the University of Saskatchewan through a Dean’s scholarship. The APC was funded by the publisher (https://www.mdpi.com/journal/surfaces).

Conflicts of Interest

The authors declare no conflict of interest.

References

  1. Edokpayi, J.; Odiyo, J.; Popoola, O.; Msagati, T. Assessment of Trace Metals Contamination of Surface Water and Sediment: A Case Study of Mvudi River, South Africa. Sustainability 2016, 8, 135. [Google Scholar] [CrossRef]
  2. Chen, Q.; Luo, Z.; Hills, C.; Xue, G.; Tyrer, M. Precipitation of Heavy Metals from Wastewater Using Simulated Flue Gas: Sequent Additions of Fly Ash, Lime and Carbon dioxide. Water Res. 2009, 43, 2605–2614. [Google Scholar] [CrossRef] [PubMed]
  3. Hubicki, Z.; Kolodynska, D. Selective Removal of Heavy Metal Ions from Waters and Waste Waters Using Ion Exchange Methods. Ion Exch. Technol. 2012, 7, 193–240. [Google Scholar]
  4. Bessbousse, H.; Rhlalou, T.; Verchère, J.F.; Lebrun, L. Removal of Heavy Metal Ions from Aqueous Solutions by Filtration with a Novel Complexing Membrane Containing Poly(ethyleneimine) in a Poly(vinyl alcohol) Matrix. J. Membr. Sci. 2008, 307, 249–259. [Google Scholar] [CrossRef]
  5. Ulewicz, M.; Walkowiak, W.; Gega, J.; Pospiech, B. Zinc(II) Selective Removal from other Transition Metal Ions by Solvent Extraction and Transport through Polymer Inclusion Memebranes with D2EHPA. Ars Separatoria Acta 2003, 2, 47–55. [Google Scholar]
  6. Ozaki, H.; Sharma, K.; Saktaywin, W. Performance of an Ultra-low-pressure Reverse Osmosis Membrane (ULPROM) for Separating Heavy Metal: Effects of Interference Parameters. Desalination 2002, 144, 287–294. [Google Scholar] [CrossRef]
  7. Agbovi, H.K.; Wilson, L.D. Design of Amphoteric Chitosan Flocculants for Phosphate and Turbidity Removal in Wastewater. Carbohydr. Polym. 2018, 189, 360–370. [Google Scholar] [CrossRef] [PubMed]
  8. Agbovi, H.K.; Wilson, L.D.; Tabil, L.G. Biopolymer Flocculants and Oat Hull Biomass to Aid the Removal of Orthophosphate in Wastewater Treatment. Ind. Eng. Chem. Res. 2017, 56, 37–46. [Google Scholar] [CrossRef]
  9. Faust, S.D.; Osman, A.M. Adsorption Processes for Water Treatment and Purification; Bonilla-Petriciolet, A., Mendoza-Castillo, D.I., Reynel-Ávila, H.E., Eds.; Springer: Cham, Switzerland, 2017; pp. 8–14. [Google Scholar]
  10. Babel, S.; Kurniawan, T.A. Low-cost Adsorbents for Heavy Metals Uptake from Contaminated Water: A Review. J. Hazard. Mater. 2003, 97, 219–243. [Google Scholar] [CrossRef]
  11. Bailey, S.E.; Olin, T.J.; Bricka, R.M.; Adrian, D.D. A Review of Potentially Low-cost Sorbents for Heavy Metals. Water Res. 1999, 33, 2469–2479. [Google Scholar] [CrossRef]
  12. Demirbas, A. Heavy Metal Adsorption onto Agro-based Waste Materials: A Review. J. Hazard. Mater. 2008, 157, 220–229. [Google Scholar] [CrossRef] [PubMed]
  13. Zhang, L.; Zeng, Y.; Cheng, Z. Removal of Heavy Metal Ions Using Chitosan and Modified Chitosan: A Review. J. Mol. Liq. 2016, 214, 175–191. [Google Scholar] [CrossRef]
  14. Lyons, R.G. Identification and Separation of Water Tracing Dyes Using pH Response Characteristics. J. Hydrol. 1993, 152, 13–29. [Google Scholar] [CrossRef]
  15. Arsnow, G.F.; Vancil, M.A.; Schreiber, R.P.; Ramacciotti, C.N. Dye Tracer Study-Tried and True Method Yields Surprising Results. In Proceedings of the Annual International Conference on Soils, Sediments, Water and Energy, Amherst, MA, USA, 18–21 October 2010; pp. 337–350. [Google Scholar]
  16. Yan, F.; Fan, K.; Bai, Z.; Zhang, R.; Zu, F.; Xu, J.; Li, X. Fluorescein Applications as Fluorescent Probes for the Detection of Analytes. TrAC Trends Anal. Chem. 2017, 97, 15–35. [Google Scholar] [CrossRef]
  17. Wenderoth, B.; Gonzalez, M.F.; Dambach, S.; Machetanz, L.; Nitzschke, U. Glycol-free Aqueous Antifreeze Compositions Comprising Dicarboxylic Acid Salts. U.S. Patent 7,704,406, 27 April 2010. [Google Scholar]
  18. Clark, M. Christie Fluorescent dyes. In Handbook of Textile and Industrial Dyeing Principles, Processes and Types of Dyes; Woodhead Publishing: Cornwall, UK, 2011; pp. 562–587. [Google Scholar]
  19. Campardelli, R.; Trucillo, P.; Reverchon, E. A Supercritical Fluid-Based Process for the Production of Fluorescein-Loaded Liposomes. Ind. Eng. Chem. Res. 2016, 55, 5359–5365. [Google Scholar] [CrossRef]
  20. Kaido, M.; Matsumoto, Y.; Shigeno, Y.; Ishida, R.; Dogru, M. Corneal Fluorescein Staining Correlates with Visual Function in Dry Eye Patients. Investig. Ophthalmol. Vis. Sci. 2011, 52, 9516–9522. [Google Scholar] [CrossRef] [PubMed]
  21. Lin, H.; Yiu, S.C. Dry Eye Disease: A Review of Diagnostic Approaches and Treatments. Saudi J. Ophthalmol. 2014, 28, 173–181. [Google Scholar] [CrossRef]
  22. Stockton, K.A.; Moffitt, C.M.; Farmer, C.N. Acute Toxicity of Sodium Fluorescein to Ashy Pebblesnails Fluminicola fuscus. Northwet Sci. 2012, 86, 190–197. [Google Scholar] [CrossRef]
  23. Pirillo, S.; Cornaglia, L. Removal of Fluorescein Using Different Iron Oxides as Adsorbents: Effect of pH. Spectrochim. Acta Part A Mol. Biomol. Spectrosc. 2008, 71, 636–643. [Google Scholar] [CrossRef]
  24. Pirillo, S. Adsorption of Alizarin, Eriochrome Blue Black R and Fluorescein Using Different Iron Oxides as Adsorbents. Ind. Eng. Chem. Res. 2007, 46, 8255–8263. [Google Scholar] [CrossRef]
  25. Sugita, H.; Komai, T.; Yanagisawa, N.; Matsunaga, I. Study on Adsorption Behavior of Fluorescein on Soils. J. MMIJ 2008, 124, 513–518. [Google Scholar] [CrossRef]
  26. Tella, A.C.; Owalude, S.O.; Ojekanmi, A. Synthesis of Copper–Isonicotinate Metal–Organic Frameworks Simply by Mixing Solid Reactants and Investigation of Their Adsorptive Properties for the Removal of the Fluorescein dye. New J. Chem. 2014, 38, 4494–4500. [Google Scholar] [CrossRef]
  27. Shi, B.; Guan, H.; Shangguan, L.; Wang, H.; Xia, D.; Kong, X.; Huang, F. A Pillar arene-based 3D Network Polymer for Rapid Removal of Organic Micropollutants from Water. J. Mater. Chem. A 2017, 5, 24217–24222. [Google Scholar] [CrossRef]
  28. Abdus-Salam, N.; Buhari, M. Adsorption of Alizarin and Fluorescein Dyes on Adsorbent prepared from Mango Seed. Pac. J. Sci. Technol. 2014, 15, 232–244. [Google Scholar]
  29. Costantino, U.; Coletti, N.; Nocchetti, M.; Aloisi, G.G.; Elisei, F.; Latterini, L. Surface Uptake and Intercalation of Fluorescein Anions into Zn-Al-Hydrotalcite. Photophysical Characterization of Materials Obtained. Langmuir 2000, 16, 10351–10358. [Google Scholar] [CrossRef]
  30. Cvetkovic, A.; Zomerdijk, M.; Straathof, A.; Krishna, R.; Van Der Wielen, L. Adsorption of Fluorescein by Protein Crystals. Biotechnol. Bioeng. 2004, 87, 658–668. [Google Scholar] [CrossRef]
  31. Silva, P.M.O.; Francisco, J.E.; Cajé, J.C.M.; Cassella, R.J.; Pacheco, W.F.; Francisco, J.E.; Cajé, J.C.M.; Cassella, R.J. A Batch and Fixed Bed Column Study for Fluorescein Removal Using Chitosan Modified by Epichlorohydrin. J. Environ. Sci. Health Part A 2017, 53, 55–64. [Google Scholar] [CrossRef]
  32. Crini, G. Recent Developments in Polysaccharide-based Materials Used as Adsorbents in Wastewater Treatment. Prog. Polym. Sci. 2005, 30, 38–70. [Google Scholar] [CrossRef]
  33. Mahaninia, M.H.; Wilson, L.D. Cross-linked Chitosan Beads for Phosphate Removal from Aqueous Solution. J. Appl. Polym. Sci. 2016, 133, 1–10. [Google Scholar] [CrossRef]
  34. Muzzarelli, R.A.A.; Tubertini, O. Chitin and Chitosan as Chromatographic Supports and Adsorbents for Collection of Metal Ions from Organic and Aqueous Solutions and Sea-Water. Talanta 1969, 16, 1571–1577. [Google Scholar] [CrossRef]
  35. Kyzas, G.Z.; Bikiaris, D.N. Recent Modifications of Chitosan for Adsorption Applications: A Critical and Systematic Review. Mar. Drugs 2015, 13, 312–337. [Google Scholar] [CrossRef] [PubMed]
  36. Piron, E.; Accominotti, M.; Domard, A. Interaction Between Chitosan and Uranyl Ions. Role of Physical and Physicochemical Parameters on the Kinetics of Sorption. Langmuir 1997, 13, 1653–1658. [Google Scholar] [CrossRef]
  37. Pestov, A.; Bratskaya, S. Chitosan and Its Derivatives as Highly Efficient Polymer Ligands. Molecules 2016, 21, 330. [Google Scholar] [CrossRef] [PubMed]
  38. Ugraskan, V.; Torman, A.; Yoruc, A.B.H. Chitosan-Based Adsorbents for Wastewater Treatment; Naser, A., Ed.; Materials Research Forum LLC: Millersville, PA, USA, 2018; pp. 2–17. [Google Scholar]
  39. Chen, C.W.; Whitlock, H.W. Molecular Tweezers: A Simple Model of Bifunctional Intercalation. J. Am. Chem. Soc. 1978, 100, 4921–4922. [Google Scholar] [CrossRef]
  40. Zimmerman, S.C. Rigid Molecular Tweezers as Hosts for the Complexation of Neutral Guests. Top. Curr. Chem. 1993, 165, 71–102. [Google Scholar]
  41. Leblond, J.; Petitjean, A. Molecular tweezers: Concepts and applications. ChemPhysChem 2011, 12, 1043–1051. [Google Scholar] [CrossRef] [PubMed]
  42. Klärner, F.G.; Kahlert, B. Molecular Tweezers and Clips as Synthetic Receptors. Molecular Recognition and Dynamics in Receptor-Substrate Complexes. Acc. Chem. Res. 2003, 36, 919–932. [Google Scholar] [CrossRef]
  43. Hardouin–Lerouge, M.; Hudhomme, P.; Sallé, M. Molecular Clips and Tweezers Hosting Neutral Guests. Chem. Soc. Rev. 2011, 40, 30–43. [Google Scholar] [CrossRef]
  44. Brouwer, E.B.; Enright, G.D.; Ratcliffe, C.I.; Facey, G.A.; Ripmeester, J.A. Weak Intermolecular Interactions and Molecular Recognition: Structure and Dynamics of the Benzene and Pyridine p-tert-butylcalix arene Inclusions. J. Phys. Chem. B 1999, 103, 10604–10616. [Google Scholar] [CrossRef]
  45. Bismarck, A.; Chan-park, M.B. Modified Chitosan Emulsifiers: Small Compositional Changes Produce Vastly Different High Internal Phase Emulsion Types. J. Mater. Chem. B 2015, 3, 4118–4122. [Google Scholar]
  46. Mahanta, A.K.; Mittal, V.; Singh, N.; Dash, D.; Malik, S.; Kumar, M.; Maiti, P. Polyurethane-Grafted Chitosan as New Biomaterials for Controlled Drug Delivery. Macromolecules 2015, 48, 2654–2666. [Google Scholar] [CrossRef]
  47. Mohamed, M.H.; Wilson, L.D. Sequestration of Agrochemicals from Aqueous Media Using Cross-linked Chitosan-based Sorbents. Adsorption 2016, 22, 1025–1034. [Google Scholar] [CrossRef]
  48. Lowell, S.; Shields, J.E. Powder Surface Area and Porosity, 3rd ed.; Springer: Hong Kong, China, 1991. [Google Scholar]
  49. Inel, O.; Tumsek, F. The Measurement of Surface Areas of Some Silicates by Solution Adsorption. Turk. J. Chem. 2000, 24, 9–19. [Google Scholar]
  50. Ayawei, N.; Ebelegi, A.N.; Wankasi, D. Modelling and Interpretation of Adsorption Isotherms. J. Chem. 2017, 2017, 11. [Google Scholar] [CrossRef]
  51. Sips, R. On the Structure of a Catalyst Surface. J. Chem. Phys. 1948, 16, 490–495. [Google Scholar] [CrossRef]
  52. Dolatkhah, A.; Wilson, L.D. Magnetite/Polymer Brush Nanocomposites with Switchable Uptake Behavior Toward Methylene Blue. ACS Appl. Mater. Interfaces 2016, 8, 5595–5607. [Google Scholar] [CrossRef] [PubMed]
  53. Ho, Y.S.; Mckay, G. Sorption of Dye from Aqueous Solution by Peat. Chem. Eng. J. 1998, 70, 115–124. [Google Scholar] [CrossRef]
  54. Sreelatha, G.; Ageetha, V.; Parmar, J.; Padmaja, P. Equilibrium and Kinetic Studies on Reactive Dye Adsorption Using Palm Shell Powder (An Agrowaste) and Chitosan. J. Chem. Eng. Data 2010, 56, 35–42. [Google Scholar] [CrossRef]
  55. La, M.; Xia, Z.; Serreqi, A.N.; Berrada, M.; Rodrigues, A.; Wang, D. A validated 1H-NMR Method for the Determination of the Degree of Deacetylation of Chitosan. J. Pharm. Biomed. Anal. 2003, 32, 1149–1158. [Google Scholar]
  56. Rinaudo, M.; Le Dung, P.; Gey, C.; Milas, M. Substituent Distribution on O,N-carboxymethylchitosans by 1H and 13C-NMR Marguerite. Int. J. Biol. Macromol. 1992, 14, 122–128. [Google Scholar] [CrossRef]
  57. Wang, H.Y.; Jia, H.R.; Lu, X.; Chen, B.; Zhou, G.; He, N.; Chenb, Z.; Wu, F.G. Imaging Plasma Membranes without Cellular Reagents based on Glycol Cchitosan Derivatives. J. Mater. Chem. B 2015, 3, 6165–6173. [Google Scholar] [CrossRef]
  58. Dehabadi, L.; Shakouri, M.; Simonson, C.J.; Arjmand, M.; Sundararaj, U.; Wilson, L.D. Vapour and Solution Uptake Properties of Starch and Cellulose Biopolymers. J. Geosci. Environ. Prot. 2018, 6, 101–117. [Google Scholar] [CrossRef] [Green Version]
  59. Iqbal, J.; Watoo, F.H.; Watoo, M.H.S.; Malik, R.; Trimizi, S.A.; Imran, M.; Ghangro, A.B. Adsorption of Acid Yellow Dye on Flakes of Chitosan Prepared from Fishery Wastes. Arab. J. Chem. 2011, 4, 389–395. [Google Scholar] [CrossRef]
  60. Panchompoo, J.; Aldous, L.; Baker, M.; Wallace, M.I.; Compton, R.G. One-step Synthesis of Fluorescein Modified Nano-Carbon for Pd(II) Detection via Fluorescence Quenching. Analyst 2012, 137, 2054–2062. [Google Scholar] [CrossRef] [PubMed]
  61. Ogunmodede1, O.T.; Ojo, A.A.; Adewole, E.; Adebayo, O.L. Adsorptive Removal of Anionic Dye from Aqueous Solutions by Mixture of Kaolin and Bentonite Clay: Characteristics, Isotherm, Kinetic and Thermodynamic Studies. Iran. J. Energy Environ. 2016, 6, 147–153. [Google Scholar]
  62. Schottel, B.L.; Chifotides, H.T.; Dunbar, K.R.; Gale, P.A.; García-garrido, S.E.; Garric, J.; Schottel, B.L.; Chifotides, H.T.; Dunbar, K.R. Anion-π interactions. Chem. Soc. Rev. 2008, 37, 68–83. [Google Scholar] [CrossRef] [PubMed]
  63. Mohan, N.; Vijayalakshmi, K.P.; Koga, N.; Suresh, C.H. Comparison of Aromatic NHπ, OHπ, and CHπ Interactions of Alanine Using MP2, CCSD, and DFT Methods. J. Comput. Chem. 2010, 16, 2874–2882. [Google Scholar]
  64. Meyer, E.E.; Rosenberg, K.J.; Israelachvili, J. Recent Progress in Understanding Hydrophobic Interactions. Proc. Natl. Acad. Sci. USA 2006, 103, 15739–15746. [Google Scholar] [CrossRef] [PubMed]
  65. Karthikeyan, S.; Ramanathan, V.; Mishra, B.K. Influence of the Substituents on the CHπ Interaction: Benzene—Methane Complex. J. Phys. Chem. A 2013, 117, 6687–6694. [Google Scholar] [CrossRef]
  66. Hunter, C.A.; Sanders, J.K.M. The Nature of π-π Interactions. J. Am. Chem. Soc. 1990, 112, 5525–5534. [Google Scholar] [CrossRef]
  67. Meroufel, B.; Benali, O.; Benyahia, M.; Benmoussa, Y.; Zenasni, M.A. Adsorptive Removal of Anionic Dye from Aqueous Solutions by Algerian Kaolin: Characteristics, Isotherm, Kinetic and Thermodynamic Studies. J. Mater. Environ. Sci. 2013, 4, 482–491. [Google Scholar]
  68. Pal, P.; Pal, A. Surfactant-Modified Chitosan Beads for Cadmium Ion Adsorption. Int. J. Biol. Macromol. 2017, 104, 1548–1555. [Google Scholar] [CrossRef] [PubMed]
  69. Lin, C.; Li, S.; Chen, M.; Jiang, R. Removal of Congo Red Dye by Gemini Surfactant C12-4-C12 2Br-Modified Chitosan Hydrogel Beads. J. Dispers. Sci. Technol. 2017, 38, 46–57. [Google Scholar] [CrossRef]
  70. Chiappisi, L.; Gradzielski, M. Co-assembly in Chitosan–Surfactant Mixtures: Thermodynamics, Structures, Interfacial Properties and Applications. Adv. Colloid Interface Sci. 2015, 220, 92–107. [Google Scholar] [CrossRef] [PubMed]
  71. Chatterjee, S.; Lee, D.S.; Lee, M.W.; Woo, S.H. Enhanced Molar Sorption Ratio for Naphthalene Through the Impregnation of Surfactant into Chitosan Hydrogel Beads. Bioresour. Technol. 2010, 101, 4315–4321. [Google Scholar] [CrossRef] [PubMed]
  72. Wei, Y.C.; Hudson, S.M. Binding of Sodium Dodecyl Sulfate to Polyelectrolyte Based on Chitosan. Macromolecules 1993, 26, 4151–4154. [Google Scholar] [CrossRef]
  73. Dougherty, D.A. The Cation-π Interaction. Chem. Res. 2013, 46, 885–893. [Google Scholar] [CrossRef]
  74. Zhao, Z.; Shent, T.A.O. The Absorption and Structure of Fluorescein and its Ethyl Derivatives in Various Solutions. Spectrochim. Acta Part A Mol. Spectrosc. 1989, 45, 1113–1116. [Google Scholar] [CrossRef]
  75. Diehl, H.; Markuszewski, R. Studies on Fluorescein-II. Talanta 1985, 32, 159–165. [Google Scholar] [CrossRef]
  76. Karoyo, A.; Dehabadi, L.; Wilson, L.D. Renewable Starch Carrieres with Switchable Adsorption Properties. ACS Sustain. Chem. Eng. 2018, 6, 4603–4613. [Google Scholar] [CrossRef]
  77. Udoetok, I.A.; Wilson, L.D.; Headley, J.V. Self-Assembled and Cross-Linked Animal and Plant-Based Polysaccharides: Chitosan-Cellulose Composites and Their Anion Uptake Properties. ACS Appl. Mater. Interfaces 2016, 8, 33197–33209. [Google Scholar] [CrossRef] [PubMed]
  78. Danquah, M.K.; Aruei, R.C.; Wilson, L.D. Phenolic Pollutant Uptake Properties of Molecular Templated Polymers Containing β-Cyclodextrin. J. Phys. Chem. B 2018, 122, 4748–4757. [Google Scholar] [CrossRef] [PubMed]
  79. Kulkarni, S.; Kaware, J. Regeneration and Recovery in Adsorption—A Review. Int. J. Innov. Sci. Eng. Technol. 2014, 1, 61–64. [Google Scholar]
  80. Poorghorban, M.; Karoyo, A.H.; Grochulski, P.; Verrall, R.E.; Wilson, L.D.; Badea, I. A 1H-NMR Study of Host/Guest Supramolecular Complexes of a Curcumin Analogue with β-Cyclodextrin and a β-Cyclodextrin-Conjugated Gemini Surfactant. Mol. Pharm. 2015, 12, 2993–3006. [Google Scholar] [CrossRef] [PubMed]
Scheme 1. One-step synthetic procedure for conversion of chitosan (CS) to the molecular tweezers-like (CS-Ac-An) adsorbent. Note: R is the acetyl group, and its number depends on the degree of deacetylation. Grafted aniline rings are shown in purple while the acetaldehyde spacer is in orange.
Surfaces 02 00035 sch001
Figure 1. First derivative (DTG) profile of (a) CS and (b) CS-Ac-An.
Surfaces 02 00035 g001
Figure 2. Fourier transform infrared (FT-IR) spectra of CS and CS-Ac-An obtained in reflectance mode and normalized. The black circled areas show the main changes in the product spectra in comparison to the parent compound.
Surfaces 02 00035 g002
Figure 3. 1H- nuclear magnetic resonance (NMR) spectra of (a) CS and (b) CS-Ac-An in D2O/HCl (5% v/v). Circles represent the grafted groups to chitosan backbone while protons of chitosan are assigned in 3b. Inset: chemical structure of chitosan and CS-Ac-An.
Surfaces 02 00035 g003
Figure 4. SEM micrographs that reveal variable porosity of (a) CS and (b) CS-Ac-An.
Surfaces 02 00035 g004
Figure 5. (a) Adsorption isotherm for fluorescein (FL) uptake with CS and CS-Ac-An at ambient pH fitted with Langmuir and Sips models. Representative error bars show standard deviation of three replicates, (b) fragment of the molecular structure of CS-Ac-An, (c) molecular structure of FL, and (d) FL aqueous solution (I) before and (II) after adsorption at ambient pH.
Surfaces 02 00035 g005
Scheme 2. Schematic representation of (a) FL and CS-Ac-An interaction, (b) after surface modification with dodecyl trimethyl ammonium bromide (DTAB), (c) after surface modification with didodecyl dimethyl ammonium bromide (DDAB).
Surfaces 02 00035 sch002
Figure 6. Removal efficiency of a surface-modified adsorbent using DTAB and DDAB. Experimental conditions: surface-modified adsorbent dosage: 10 mg, initial FL concentration (120 µm) and volume of the solution (7 mL) at ambient pH. Error bars represent standard deviation of the two replicates.
Surfaces 02 00035 g006
Figure 7. Kinetic adsorption profile for the uptake of FL with CS-Ac-An at ambient pH and 23 °C, where 20 mg of CS-Ac-An was immersed in 200 mL, and the initial concentration of FL was 20 µM. The solid line shows the best-fit line by the pseudo first order (PFO) model to the experimental data.
Surfaces 02 00035 g007
Figure 8. Regeneration of CS-Ac-An for adsorption-desorption cycles with FL at 23 °C. Error bars represent standard deviation of the two replicates.
Surfaces 02 00035 g008
Figure 9. Expansion of 1D-NOESY spectra of FL/CS-Ac-An in D2O/HCl (5% v/v) with irradiation at (a) δ = 6.92 ppm (FL proton) and (b) δ = 7.33 ppm (grafted aniline proton). The arrows denote the irritated peaks which cause peak inversion of other nuclei that undergo through-space (π-π) interaction between FL and CS-Ac-An.
Surfaces 02 00035 g009
Table 1. Equilibrium adsorption parameters for the FL uptake with CS-Ac-An and chitosan (CS) according to the Langmuir isotherm model.
CSCS-Ac-An
Qm (mg g−1)KL (L mg−1)Chi-SquareAdj-R2Qm (mg g−1)KL (L mg−1)Chi-SquareAdj-R2
1.961543.470.99261.891.82.120.993
Table 2. Kinetic adsorption parameters for the FL uptake with CS-Ac-An at 23 °C.
Pseudo First Order (PFO)Pseudo Second Order (PSO)
Qm (µg g−1)k1 (min−1)Chi-SquareAdj-R2Qm (µg g−1)k2 (g μg−1 min−1)Chi-SquareAdj-R2
975.20.03710.99823994.77850.991

