Abstract
Water–ethanol mixtures are largely exploited for many different applications, from industrial processes to pharmaceutical formulations. Surfactants are often added to tune their interfacial properties. Sustainability concerns require redesigning such blends to minimize their environmental impact. A successful approach is to replace synthetic oil-based components with affordable unpurified bio-derived alternatives. In this respect, we have characterized aqueous mixtures of bioethanol, obtained by the fermentation of algae, and rhamnolipids, biosurfactants of microbial origin. The physico-chemical characterization of water–bioethanol binary mixtures in terms of refractive index, density, viscosity, and surface tension indicates that bioethanol behaves like pure ethanol with negligible effects of impurities. Analysis of tensiometric titrations shows that, at bioethanol contents higher than 20–30% bioethanol mass percent, rhamnolipid aggregation is impaired, whereas surface adsorption at the water–air interface remains poorly affected. Overall, bio-derived components can be proposed as a promising alternative to oil-derived chemicals in eco-sustainable formulations.
1. Introduction
Water–ethanol mixtures are largely exploited for many different applications. They are used as solvent media for separation processes and chemical reactions, cosolvents in supercritical fluid extraction of bio-actives [1], heat carriers for solar energy collectors [2], and refrigerants in adsorption cooling systems [3]. Water–ethanol mixtures have also been proposed to reduce the environmental impact of relevant industrial processes such as dyeing [4]. Ethanol has long been a key component in many kinds of pharmaceuticals and cosmetic water-based formulations with direct exposure to the human skin (e.g., antiseptics, disinfectants, mouthwashes, aftershaves, hairsprays, and perfumes), even though the safety of such topical applications has not been yet assessed [5,6]. The use of ethanol-based hand sanitizers dramatically increased during the recent severe acute respiratory syndrome coronavirus 2 (SARS-CoV-2) pandemics, as they are the recommended standard of care to inactivate viruses and other infectious agents [7,8].
In many water–ethanol-based formulations, surfactants are added with the aim of improving the dispersibility of solid particles or immiscible oils (thus avoiding deposit formation or stabilizing emulsions [9]), and to tune interfacial properties (thus regulating wetting and foaming ability [10,11]). Successful formulation requires fine control of colloidal phenomena, which in turn depend on surfactant adsorption processes at liquid interfaces and are affected by the presence of additives such as salts [12], cosurfactants [13], or cosolvents [14]. From a physico-chemical viewpoint, the presence of ethanol significantly affects surfactant behavior [11], and this is reflected in the functional properties of the mixtures.
The multiplication and diversification of the fields of application and the growth in demand on the market pose the problem of sustainable formulation production [15]. In this direction, the use of natural or bio-derived chemical components is recognized as a promising premise.
Ethanol is obtained on a large scale via petrochemical processes such as ethylene hydration. A green alternative is its natural production by the fermentation process of sugars operated by yeasts, resulting in the so-called bioethanol. This is probably the oldest biotechnological process exploited by humans, having been known since prehistoric times. Traditionally, bioethanol is obtained from agricultural crops such as corn, sugarcane, and sugar beet, thus competing with food and feed production. The individuation of alternative raw materials is an active field of research [16,17]. Among the possible carbon sources that have been proposed, algae appear very promising since they neither compete with the production of food nor consume fresh water to grow [18].
Biosurfactants, glycolipids produced by bacteria and yeasts, are suitable candidates to replace traditional surfactants in formulations [19]. Recent biotechnological advancements have made some of these natural products economically affordable. However, it is becoming increasingly clear that biosurfactants present a peculiar behavior in solution which determines different performance profiles with respect to conventional amphiphiles [20,21], thus pointing out that the design of innovative sustainable formulations requires the physico-chemical features of the specific components and their mixtures to be carefully characterized.
In the present work, we analyze the behavior of rhamnolipids in water–bioethanol mixtures. Rhamnolipids are glycolipids formed by one or two rhamnose units acetylated with up to three long-chain 3-hydroxy fatty acids. They are produced by Pseudomonas aeruginosa and other bacteria and are generally obtained as complex mixtures of congeners [22] whose relative amounts affect the sample aggregation properties. In this work, a relatively inexpensive commercial sample was used as such, in order to obtain information relevant for eventual future applications. In the same sustainability perspective, a bioethanol sample obtained from the fermentation of brown seaweed was used [23,24]. These components were used without further purification, since the application of an actual circular economy approach should rely on the use of affordable unpurified bio-derived components.
In order to assess whether these bio-derived unpurified products have the actual potential to replace currently employed purified and oil-derived analogs and whether their behavior in possible formulations can be predicted/rationalized on the basis of the behavior of these analogs, we preliminarily investigated the physico-chemical properties of water–bioethanol binary mixtures as a function of the bioethanol content and compared the obtained results with those reported for analogous mixtures containing pure ethanol. In particular, we focused on those macroscopic properties that could most affect formulation properties: density and viscosity, which affect not only mass and heat transfer in solutions but also industrial processability, refractive index, which determines the appearance of the formulations and is usually strongly affected by the presence of impurities, and surface tension, which determines the spreading and wetting properties of the formulations. We also fitted the data to obtain reliable equations to be used to predict the value of a certain property in defined mixtures. For what concerns the ternary mixtures water–bioethanol–rhamnolipids, they were studied by surface tension measurements performed as a function of both rhamnolipid concentration and bioethanol content, to determine aggregation and surface behavior. The obtained results were compared with those reported for systems composed of purified mono- and di-rhamnolipids.
The results show that in aqueous mixtures, bioethanol behaves like pure ethanol up to a high content (bioethanol mass percent wBE~40–50%), with small differences due to impurities being detectable only above this threshold. The adsorption of rhamnolipids at the water–air interface is poorly affected by the presence of bioethanol. On the other hand, in water–ethanol solution, the rhamnolipid aggregation is hindered at bioethanol content higher than wBE 20–30%. Interestingly, this behavior is similar to that of conventional surfactants. Altogether, these findings indicate that bio-derived components may offer a suitable alternative to oil-derived chemicals, thus paving the way to the rational design of eco-sustainable formulations.
2. Materials and Methods
2.1. Materials
Sodium phosphate mono- and dihydrate (purity > 99%), used to prepare the aqueous buffer, were purchased from Sigma-Aldrich (Milan, Italy). Ultrapure deionized water from a Millipore Milli-Q system was used as a solvent for all sample preparation.
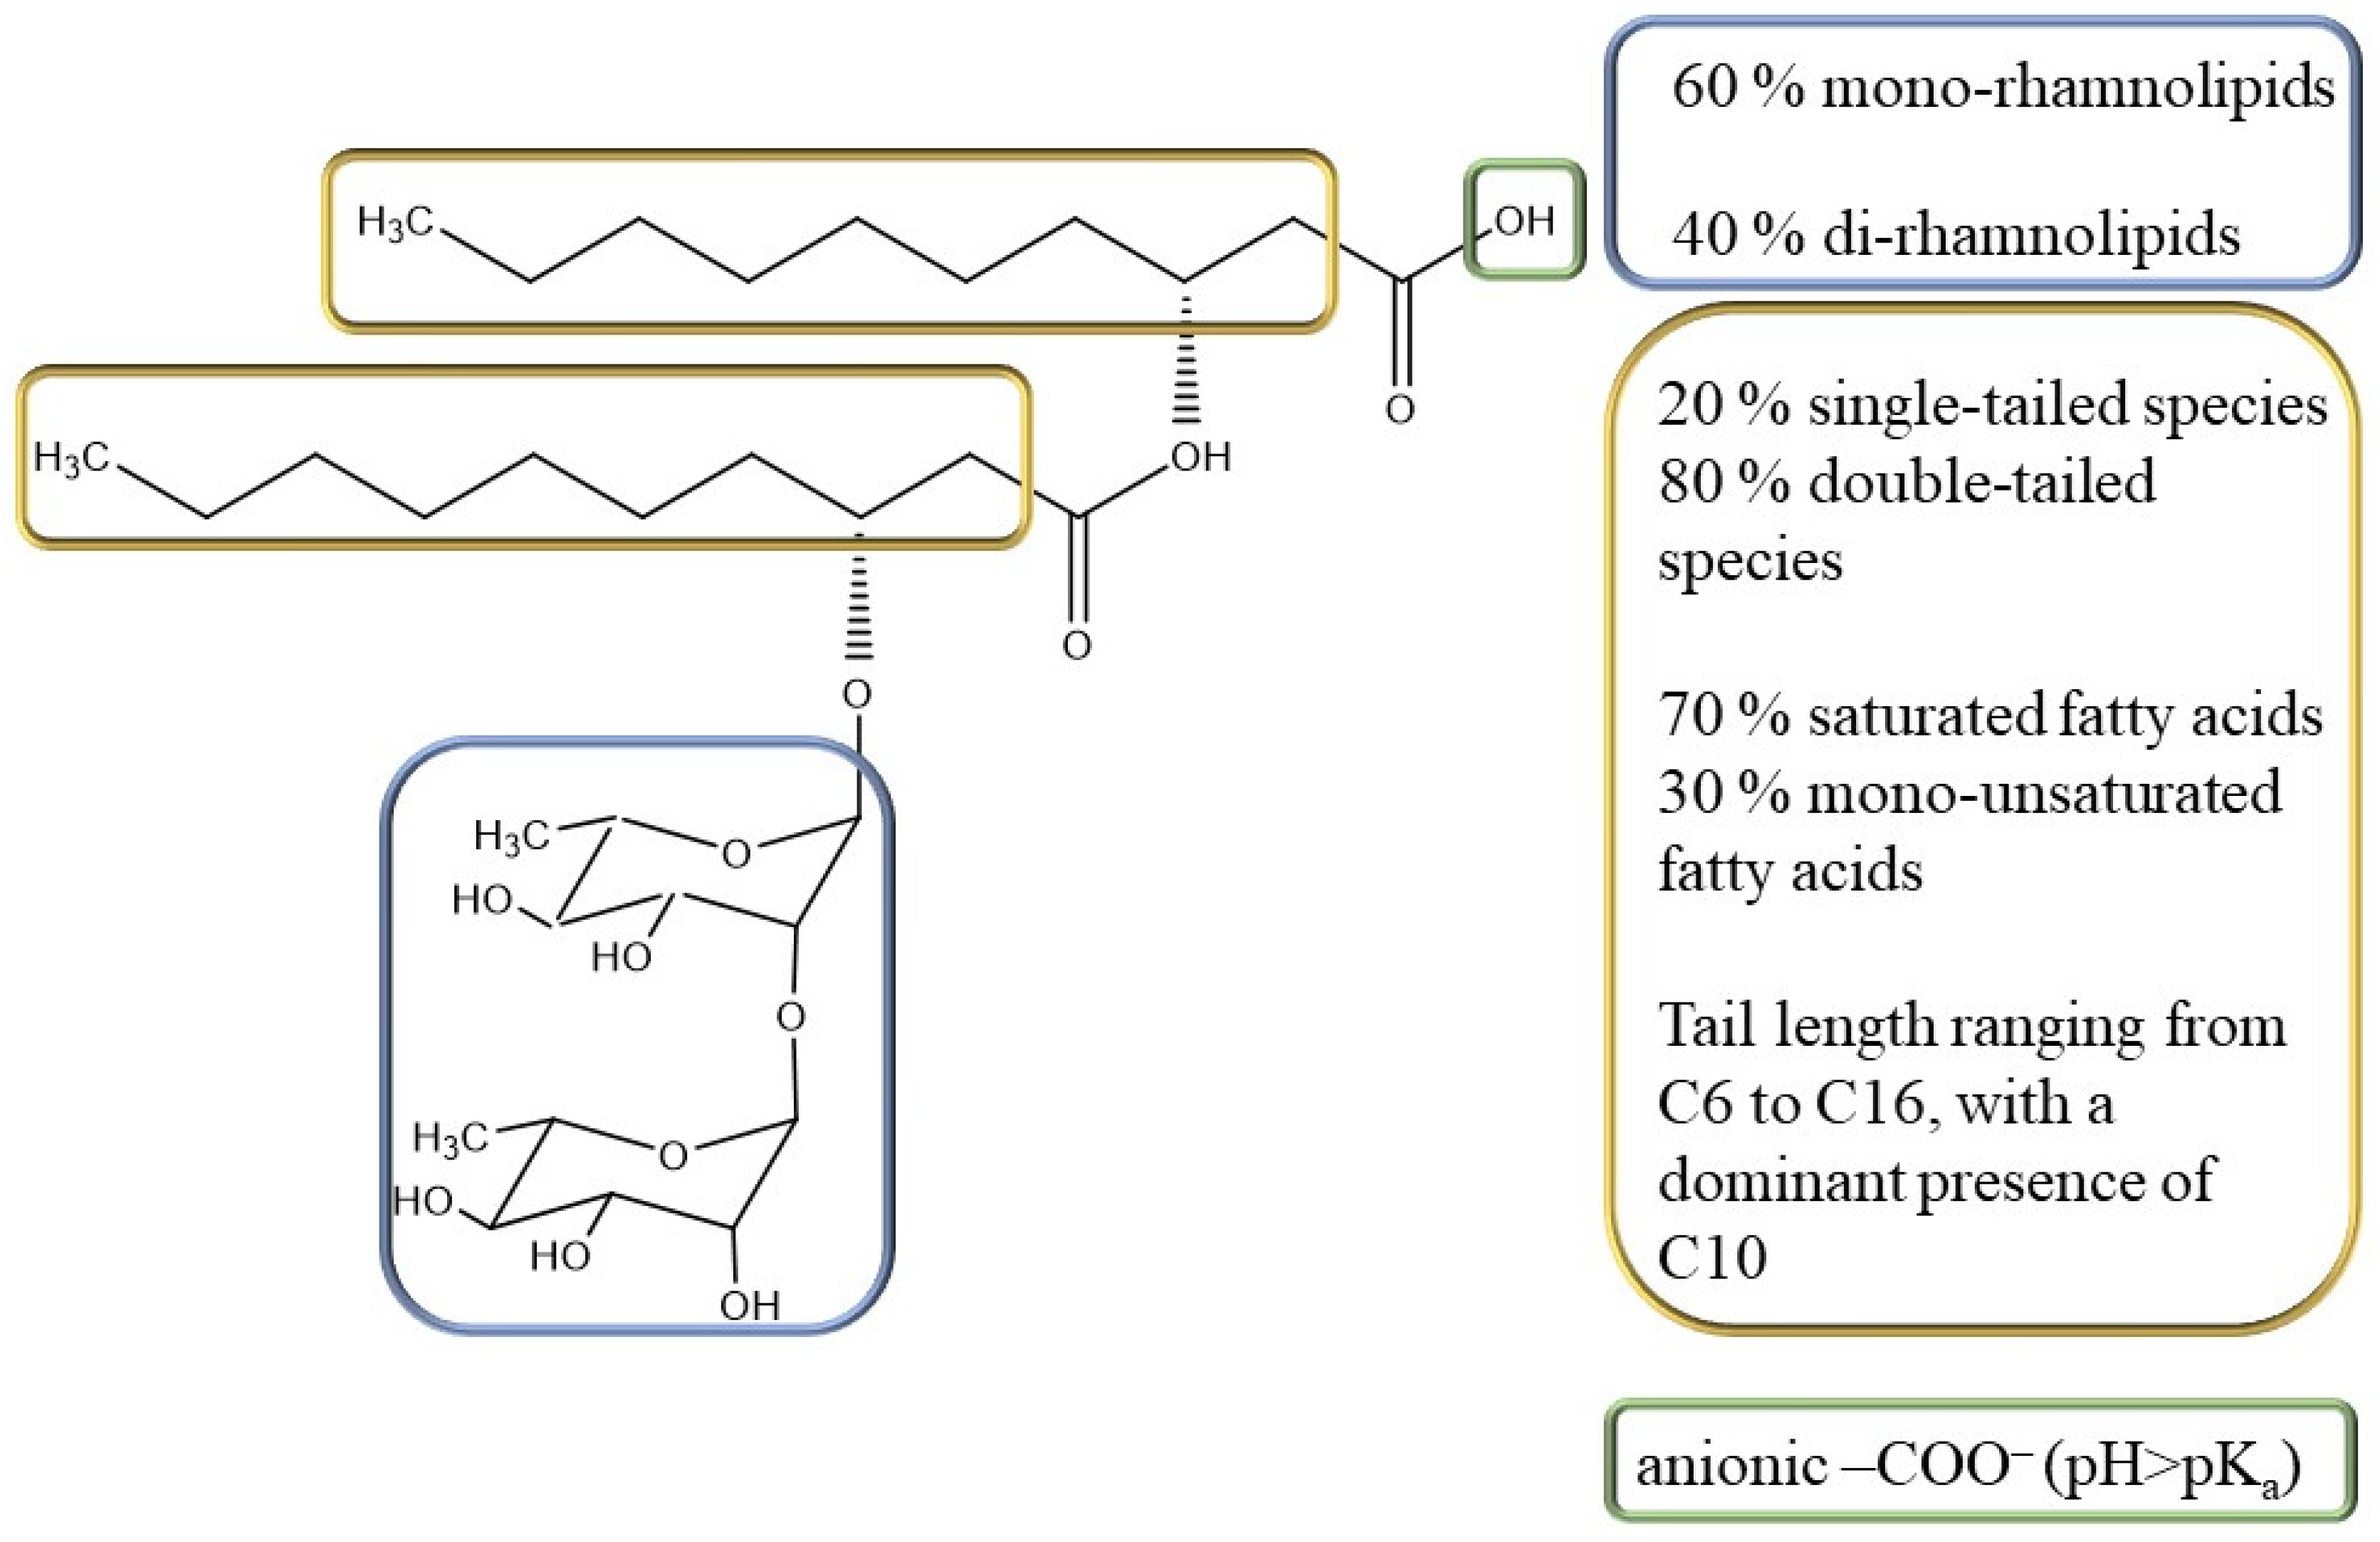
The rhamnolipid sample used in this study (Rha) was purchased from AGAE Technologies (Corvallis, OR, USA) as a biotechnological product obtained by P. aeruginosa culture using vegetable oils as the carbon source, containing 90% by mass of rhamnolipids. In respect to the total rhamnolipid content, 60% were mono-rhamnolipids and 40% were di-rhamnolipids; 20% were single-tailed species and 80% were double-tailed species; and 70% were saturated and 30% were mono-unsaturated fatty acids. The tail length was polydisperse, ranging from C6 to C16, with a dominant presence of C10 [25] (Figure 1).
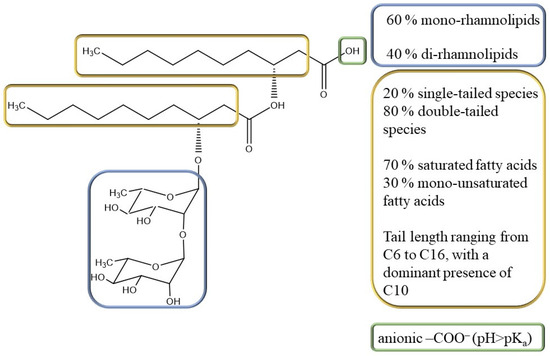
Figure 1.
Rhamnolipid molecular structure and composition of the rhamnolipid mixture produced by P. aeruginosa used in this work. The rhamnolipid regions that are source of heterogeneity and the corresponding composition in the used sample are highlighted with the same color, i.e., sugar moieties in blue, hydrophobic tails in yellow and the carboxylic group in green.
Bioethanol was obtained by the biofermentation of the brown seaweed Sargassum crassifolium operated by the yeast Saccharomyces cereviceae, following a protocol reported in the literature [23,24]. Briefly, S. cereviceae cells (JCM 3012) were cultured in a 100 mL of CYG (Casein Yeast Glucose) medium and incubated at a temperature of 30 °C, pH 5.5 for 24 h. They were then streaked onto a PDA (Potato Dextrose Agar) medium and incubated at 30 °C, pH 5.5 for 3 days. The obtained S. cereviceae preparation (0.15 g mL−1) was added into 100 g L−1 of the pulp of Sargassum crassifolium, pretreated with sulfuric acid. The mixture was adjusted to anaerobic condition and incubated at 30 °C, pH 5.5, 200 rpm for a fermentation period of 48 h. At the end of the reaction, the following composition was obtained: 43.9 g L−1 bioethanol, and 1.1 g L−1 remaining glucose in the reaction system. The obtained final bioethanol conversion was 91%, separated then from the remaining sugar by distillation, obtaining a mixture of 95% bioethanol by mass and 5% water. Bioethanol samples were analyzed by ICP-MS in triplicate on an Agilent 7700 ICP-MS (Santa Clara, CA, USA) equipped with a frequency-matching RF generator and 3rd generation Octopole Reaction System (ORS), operating with helium as cell gas. The parameters were set as follows: radiofrequency power 1550 W; plasma gas flow 14 L min−1; carrier gas flow 0.99 L min−1; and He gas flow 4.3 mL min−1. Multi-element calibration standards were prepared in 5% HNO3 at 4 different concentrations (1, 10, 50, and 100 µg L−1). The standard addition approach for calibration on 4 concentration levels was used in order to keep the matrix-induced variations to a minimum. Moreover, in order to correct possible instrumental drifts, 103Rh was used as an internal standard (final concentration: 50 µg L−1). The metal content was found to be as follows: V (36.057 µg L−1), Mn (25.852 µg L−1), Fe (284.261 µg L−1), Co (1.772 µg L−1), Cu (26.724 µg L−1), Zn (522.089 µg L−1), As (5.887 µg L−1), Mo (13.086 µg L−1), Cd (1.267 µg L−1), Sn (6.097 µg L−1), Sb (19.692 µg L−1), Tl (9.038 µg L−1), and Pb (108.308 µg L−1), while the Be, Al, Cr, Ni, Se, Ba contents were under the limit of detection. Although bioethanol is not intended for drinking purposes, it is worth noting that all these values were below the maximum limits recommended by the AMPHORA (Alcohol Measures for Public Health Research Alliance) project and thus could be considered safe for health [26].
2.2. Determination of Refractive Index, Density, and Viscosity of Bioethanol Aqueous Mixtures
The macroscopic properties (refractive index, density, and viscosity) of mixtures of bioethanol and aqueous buffered solutions of sodium phosphate 4 mM at pH 7.1 were determined at 25 °C in the whole composition range, i.e., from wBE = 0 to 95%.
The refractive index was measured with an Abbe Refractometer NAR-3T (Atago, Tokyo, Japan) [27]. The density was determined by means of a Densimeter DMA 5000 (Anton Paar, Graz, Austria) [28]. Before each measurement, the capillary of the densimeter was properly washed with hydrochloric acid and the instrument was calibrated using double-distilled water and dry air. The kinematic viscosity of bioethanol mixtures was measured with a Ubbelohde viscometer with a water flow time of 110 s (Cannon, State College, PA, USA) [29]. Refractive index and density measurements were performed on independently prepared samples, whereas viscosity measurements were performed starting from wBE = 100% and gradually diluting it in the viscometer by adding a known weighted quantity of the aqueous buffered solution. All measurements were performed in triplicate and the average value, as well as the standard deviation, was calculated.
2.3. Determination of Surface Tension of Rha-Bioethanol Aqueous Mixtures
The surface tension, γ, of the Rha aqueous solutions buffered at pH = 7.1 with 4 mM sodium phosphate in the presence of increasing amounts of bioethanol, namely wBE = 1, 3, 5, 8, 15, 20, 25, and 30%, was measured at 25 °C with a Sigma 70 tensiometer (KSV, Stockholm, Sweden) using the Du Noüy ring method (the radius of the ring measured to the center of the circular wire was 9.545 mm, and the radius of the circular cross-section of the wire was 0.185 mm) [30]. The γ value of the bioethanol aqueous mixtures in the absence of rhamnolipids was also determined. γ was correlated with the force required to raise the ring from the surface of the air/liquid interface. The measurements were performed following a procedure previously reported [31]. Successive aliquots of a concentrated buffered Rha solution with a given bioethanol content, previously filtered with a 0.22 µm filter, were added to the vessel with a known volume of the buffered solution with the same cosolvent content. After each aliquot addition, the sample was mixed using a magnetic stirrer and allowed to equilibrate 5 min prior to measuring the surface tension. At the end of each titration experiment, the pH of the final mixture was checked to verify it remained within 0.3 units of the initial value.
The packing of Rha molecules at the air/water interface has been evaluated by calculating the maximal surface excess concentration by means of the Gibbs adsorption isotherm equation:
where R is the gas constant, T is the absolute temperature, (dγ/d ln c) is the slope of the plot of γ versus the logarithm of surfactant concentration c in the pre-micellar region, and n is a coefficient that takes into account the dissociation of ionic surfactants, known as the Gibbs pre-factor. In this case, a value of 2 was used because of the dissociation of the rhamnolipid carboxylic group at pH = 7.1 > pKa = 5.5 [22] and because of the low concentration of the buffer used, so we cannot assume an effective charge screening. We also calculated the minimum area occupied by a surfactant molecule at the air/solution interface at saturation, Amin, as
where NA is the Avogadro constant.
2.4. Data Representation and Fitting
Plots of the physico-chemical properties of water–bioethanol binary systems, i.e., refractive index, viscosity, density, and surface tension, as a function of the bioethanol content, as well as tensiometric curves and surface and aggregation properties of rhamnolipids as a function of the bioethanol content, were generated using Origin 2018 (OriginLab Corporation, Northampton, MA, USA). In all cases, we plotted the mean values obtained from three independent measurements and the standard deviations as uncertainties. Data fitting was also performed using Origin 2018, with the quality of the fit evaluated based on the R-squared value, i.e., the coefficient of determination.
In the case of the refractive index and density of the water–bioethanol binary system, the data were satisfactorily fitted to a cubic polynomial expression; the viscosity data were fitted to an exponential expression, while the surface tension values followed an exponential decay.
cmc values were determined from tensiometric titration plots as the intersection concentration between the lines fitting the data in the concentration range where surface tension decreases with rhamnolipid concentration (pre-micellar region) and the data in the range where surface tension remains approximately constant with increasing rhamnolipid concentration. When using this procedure, cmc values are affected by a maximum uncertainty of 10%. The slope of the line fitting the surface tension data in the pre-micellar region was used to calculate the surface excess according to the Gibbs adsorption isotherm equation (Equation (1)).
3. Results and Discussion
3.1. Physico-Chemical Characterization of Bioethanol Aqueous Mixtures
As a preliminary part of this research, we performed a thorough physico-chemical characterization of the water–bioethanol binary system, highlighting any differences potentially arising from impurities in the biotechnological product, with respect to the water–ethanol mixtures. Indeed, a well-conceived and finely controlled solvent–cosolvent mixture is fundamental for the rational formulation design. Since it is crucial to be able to predict the behavior of a given solvent mixture on the basis of properties of similar systems with different compositions, in all the cases we fitted the experimental data to equations that are as simple as possible.
Initially, we analyzed the refractive index of the mixtures at 25 °C (n25), as this property is highly sensitive to the presence of impurities in an unspecific manner [32,33]. The density and viscosity of the water–bioethanol mixtures were investigated since they are important properties that affect mass and heat transfer in solutions, which, in turn, affect formulation properties. Lastly, the surface tension of the liquid mixtures was also determined, as it allows the formulation spreading and wetting properties to be optimized [34].
The refractive index increases with the concentration of bioethanol, reaching a plateau value of about 1.365 at wBE = 80%, as shown in Figure 2a. Experimental data are in good agreement with those reported in the literature for similar ethanol mixtures [35], with deviations only at high bioethanol concentrations above wBE = 50–60%, as the contribution of impurities becomes detectable. The data satisfactorily fit the quadratic polynomial (R-square = 0.997):
n25 = (1.3326 ± 0.0003) + (7.4 ± 0.2) × 10−4 wBE + (−4.5 ± 0.3) × 10−6 (wBE)2.
The variation of the density (ρ) in mixtures of buffered phosphate aqueous solutions at pH = 7.1 and bioethanol as a function of bioethanol content is reported in Figure 2b. The density decreases as the bioethanol content increases. The data are in very good agreement with those reported in the literature for aqueous mixtures of pure ethanol [35,36,37,38]. The data satisfactorily fit the cubic polynomial (R-square = 0.999):
ρ/g cm−3 = (0.996040 ± 0.000013) + (−1.230 ± 0.013) × 10−3 wBE + (−1.007 ± 0.004) × 10−8 (wBE)2 + (1.89 ± 0.03) × 10−12 (wBE)3.
The viscosity (η) of the aqueous buffered solution increases with the addition of bioethanol reaching values as high as about 2.3 mPa s at wBE~45%, above which it decreases until it goes back to a very low value at wBE = 95%, as shown in Figure 2c. The data were quite satisfactorily fitted to the following equation (R-square = 0.985), whose form is based on that proposed by Cheng for the water–glycerol binary system [39]:
Our experimental data present a good agreement with data in the literature reported for aqueous mixtures of synthetic ethanol [37] up to the bioethanol concentration corresponding to the maximum viscosity. However, at higher concentrations, a significant deviation is observed, with experimental values systematically lower than literature values. This is likely due to the presence of impurities in the bioethanol samples.
Although an in-depth analysis of the molecular determinants of the observed trends in the physico-chemical properties studied is beyond the scope of the present work, the close similarity of our results with those reported in the literature for water–ethanol mixtures makes us confident that the same interpretation holds. The variation of the properties of the aqueous mixtures with the ethanol content has been explained in the literature by the structural changes in the solution. The bell-shaped profile of viscosity data suggests a mutual strengthening of the molecular interactions played by water and ethanol molecules in a synergistic way, which slows down the flow of the mixture, in agreement with previous findings [34,40]. In the ethanol aqueous solution, the alcohol molecules tend to form clusters whose size increases with concentration [41], eventually resulting in an extended H-bond network that intertwines well with the H-bond network of water [42]. At the same time, the water structure on the hydrophobic surface is enhanced [43]. Support for the existence of associates between water and ethanol molecules can be found in the non-linear variation of the refractive index of the binary mixture. Finally, as the alcohol content increases, the density of the mixture decreases non-linearly, as would be the case for an ideal mixture, but the effects of the solvent structure are smoothed out by the general decrease in the density of the mixture as it moves from the denser water to the less dense ethanol [44].
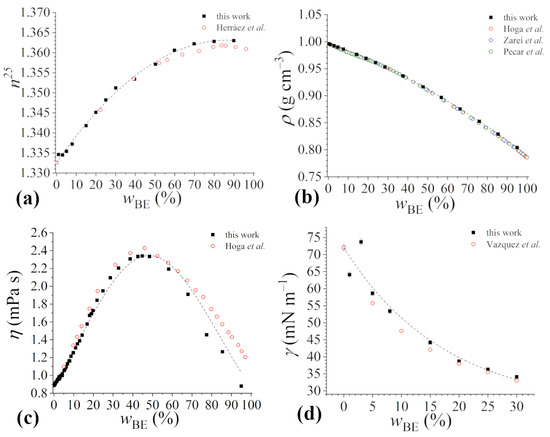
Figure 2.
Physico-chemical properties of bioethanol mixtures in 4 mM sodium phosphate buffer solution at pH 7.1, reported as a function of bioethanol content . (a) refractive index, (b) density, (c) viscosity, (d) surface tension. Since data uncertainties are within 0.1%, they are not visible in panels (a–c). Data in the literature for water–ethanol mixtures are reported for comparison. In particular, (a) refractive index data as reported by Herràez et al. [35]; (b) density data reported by Hoga et al. [37], Zarei et al. [38], and Pečar et al. [36]; (c) viscosity data reported by Hoga et al. [37]; (d) surface tension data as reported by Vazquez et al. [45]. Best-fitting curves are also shown as dashed lines.
The surface tension of the aqueous buffered solutions decreases with the addition of bioethanol, as shown in Figure 2d. In this respect, we have investigated a bioethanol composition range 0 30%, as this is the range in which the effect of the addition of Rha will be considered (see Section 3.2). The trend is non-linear, the decrease in surface tension being larger at low bioethanol contents than at high ones. The data were satisfactorily fitted to the exponential decay (R-square = 0.936):
The experimental data agrees very well with the data in the literature [45]. The effectiveness of (bio)ethanol in lowering the surface tension is related to its molecular structure, in which the polar –OH group, capable of H-bonding, coexists with a short hydrocarbon tail which confers an amphiphilic character to alcohol molecules and the ability to adsorb at the water–air interface [46].
As seen, all the newly determined data for mixtures of bioethanol and aqueous buffered solutions of sodium phosphate 4 mM at pH 7.1 well agree with those reported in the literature for similar water–ethanol mixtures at the same temperature, differences due to the presence of several impurities becoming detectable only above ~50%. Moreover, variations in the macroscopic properties of water–bioethanol mixtures as a function of bioethanol content are described by quite simple equations.
3.2. Aggregation Behaviour of Rhamnolipids in Water–Bioethanol Mixtures
Amphiphiles position themselves at the air–water interface and decrease the solution surface tension (γ). As the amphiphile concentration increases, the decrease in γ value continues until the adsorption of surfactant at the air–water interface reaches a maximum. Above a certain concentration, the γ value does not change. This concentration is the critical micellar concentration, cmc, and the corresponding surface tension is known as γcmc. In the pseudo-phase separation model of surfactant micellization, the cmc corresponds to the saturation concentration, above which the added surfactant forms the micellar aggregates, considered as a micro-dispersed separate phase [47,48]. On the other hand, γcmc is a measure of the efficiency of the surfactant to populate the air–water interface. In this respect, we characterized the behavior of the biosurfactant Rha in the presence of bioethanol as a cosolvent by performing tensiometric titrations. In each experiment, the Rha concentration was progressively increased in mixtures of buffered phosphate aqueous solutions at pH 7.1 and bioethanol at constant contents of bioethanol. Different titrations were conducted, with bioethanol content varying from = 1% to = 30%; the surface tension of Rha in buffered phosphate aqueous solutions at pH 7.1 in the absence of bioethanol was also measured for comparison. No evidence of coacervation or precipitation was observed in any surfactant mixture composition.
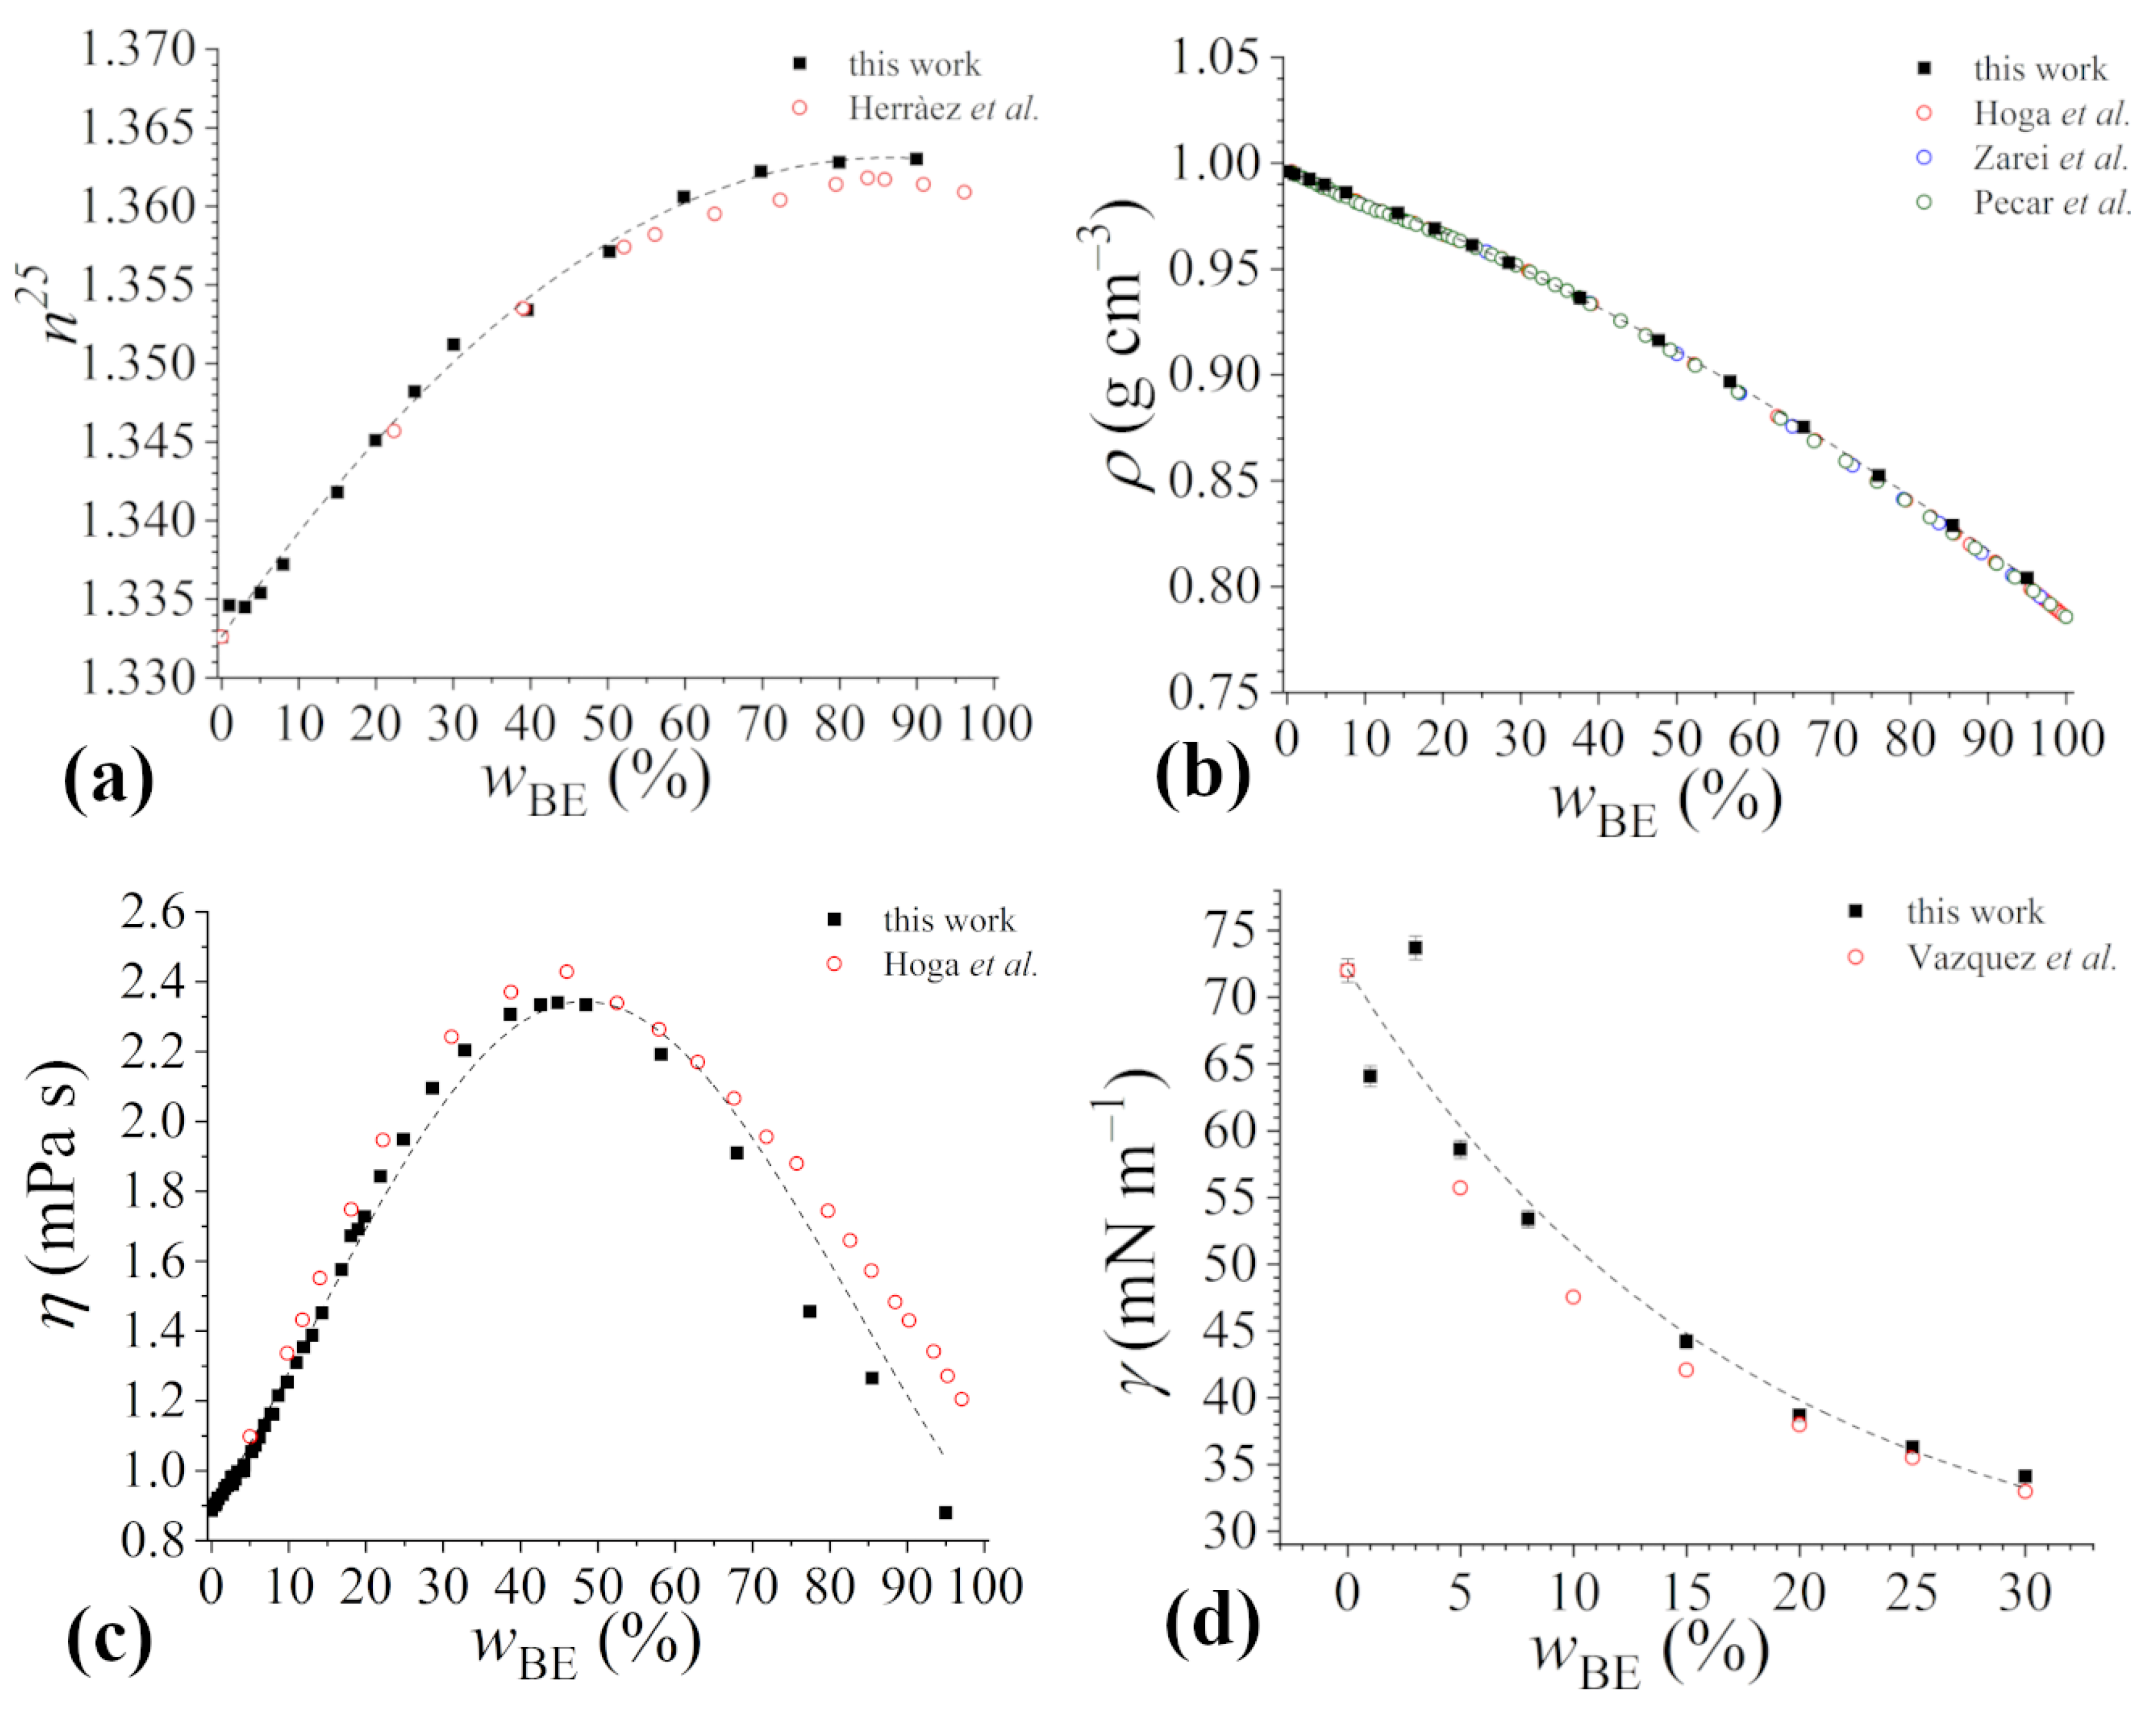
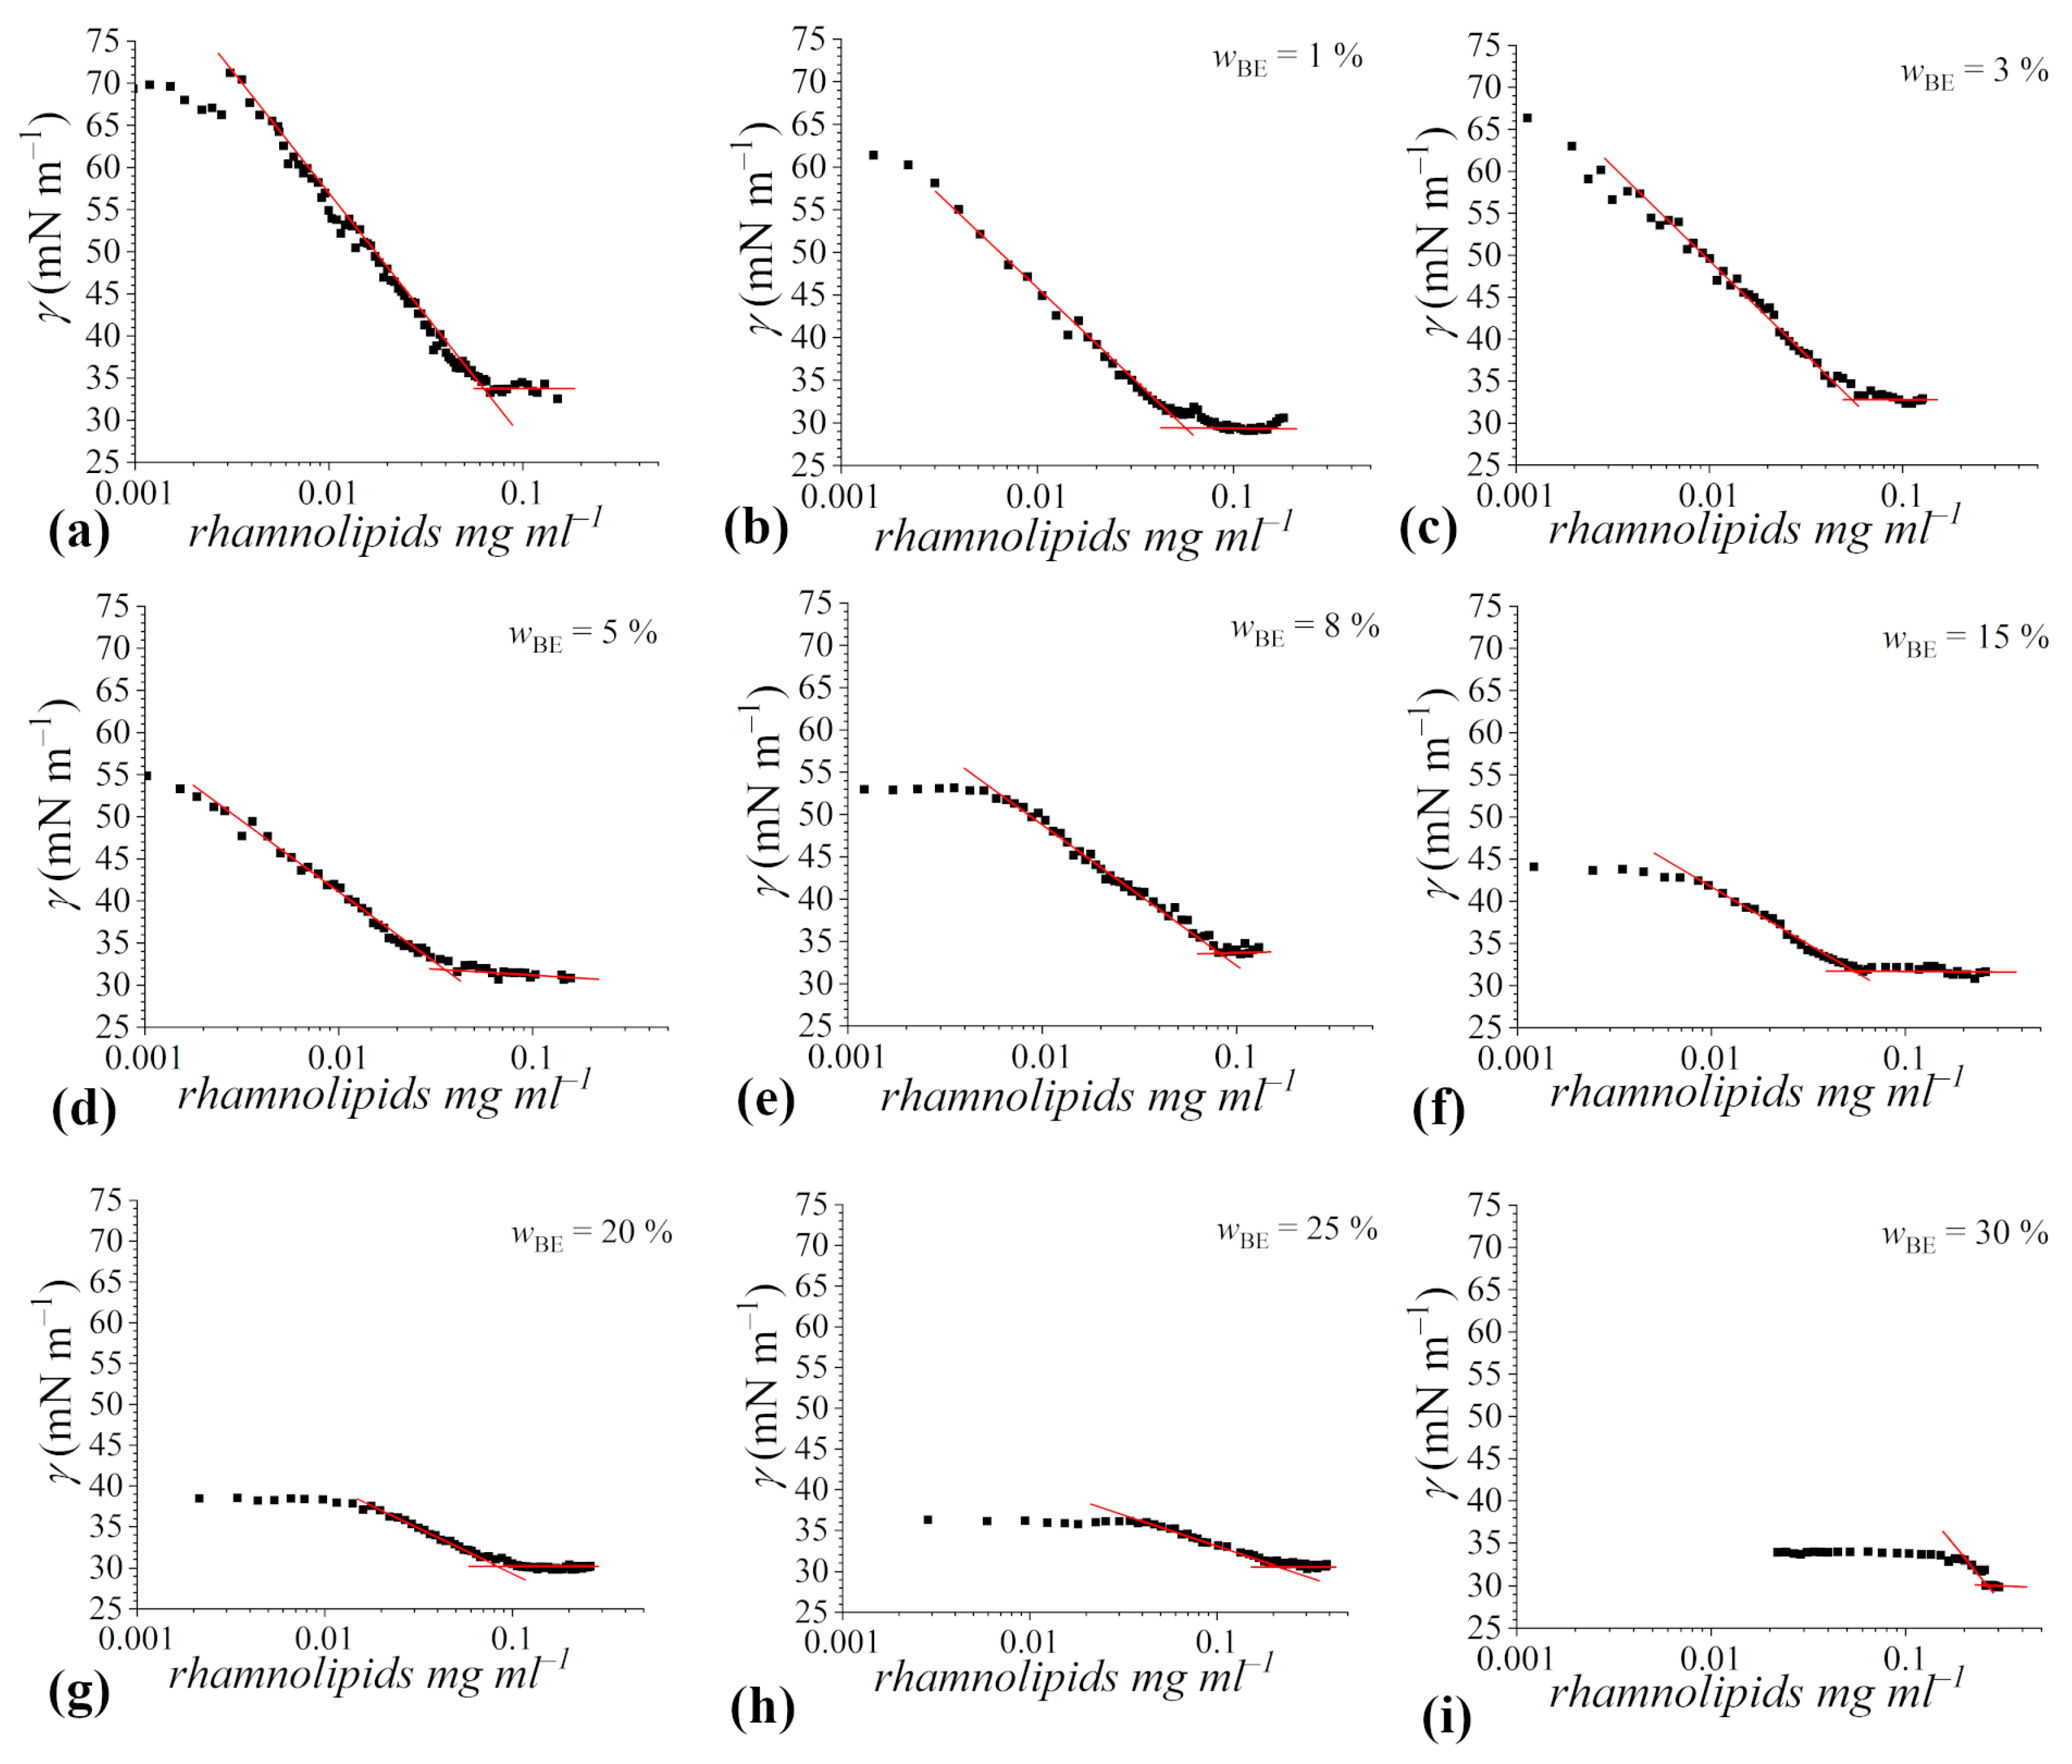
The γ values, reported as a function of the Rha concentration at the considered bioethanol content, are shown in Figure 3.
Figure 3.
Tensiometric titration curves of rhamnolipids in 4 mM sodium phosphate buffer solution at pH 7.1 in the presence of increasing contents of bioethanol: (a) no bioethanol, (b) = 1%, (c) = 3%, (d) = 5%, (e) = 8%, (f) = 15%, (g) = 20%, (h) = 25%, (i) = 30%. Experimental data are represented by black squares, while red lines represent the best fitting of data in the pre-micellar and post-micellar regions, in this way inflection points corresponding to cmc values are explicitly shown.
In all trends, the typical features expected for surfactant aqueous mixtures are observed: a marked inflection point, corresponding to the cmc, is detectable, and a well-defined γcmc can be determined as the average of the γ values measured above the cmc. Particularly, γcmc seems to be independent of the bioethanol content. On the other hand, several differences among the different titration curves can be envisaged: (i) the initial value of the surface tension decreases with the increasing content of bioethanol because of the surface activity of alcohols (as commented in the previous subsection); (ii) at higher than 8%, the surface tension remains constant up to significant Rha concentrations prior to decrease; and (iii) the cmc shifts towards increasingly higher rhamnolipid concentrations with the bioethanol content.
The cmc of Rha in buffered aqueous solution is about 0.065 mg mL−1; this value well agrees with those reported in the literature for the same rhamnolipid mixture [25], as well as for purified mono- and di-rhamnolipids, in water or in buffered aqueous solution at pH > pKa [22,49].
Overall, the presence of bioethanol results in small cmc variations up to = 15–20% (Figure 4a).
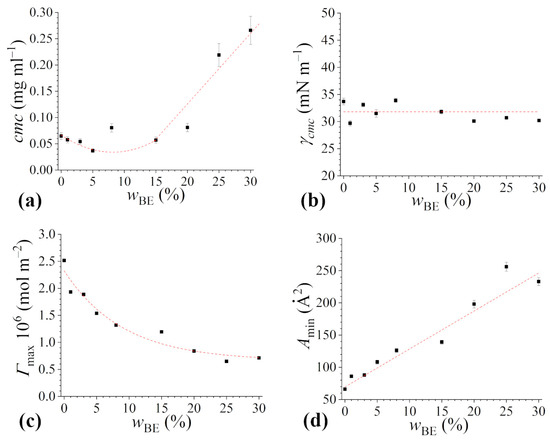
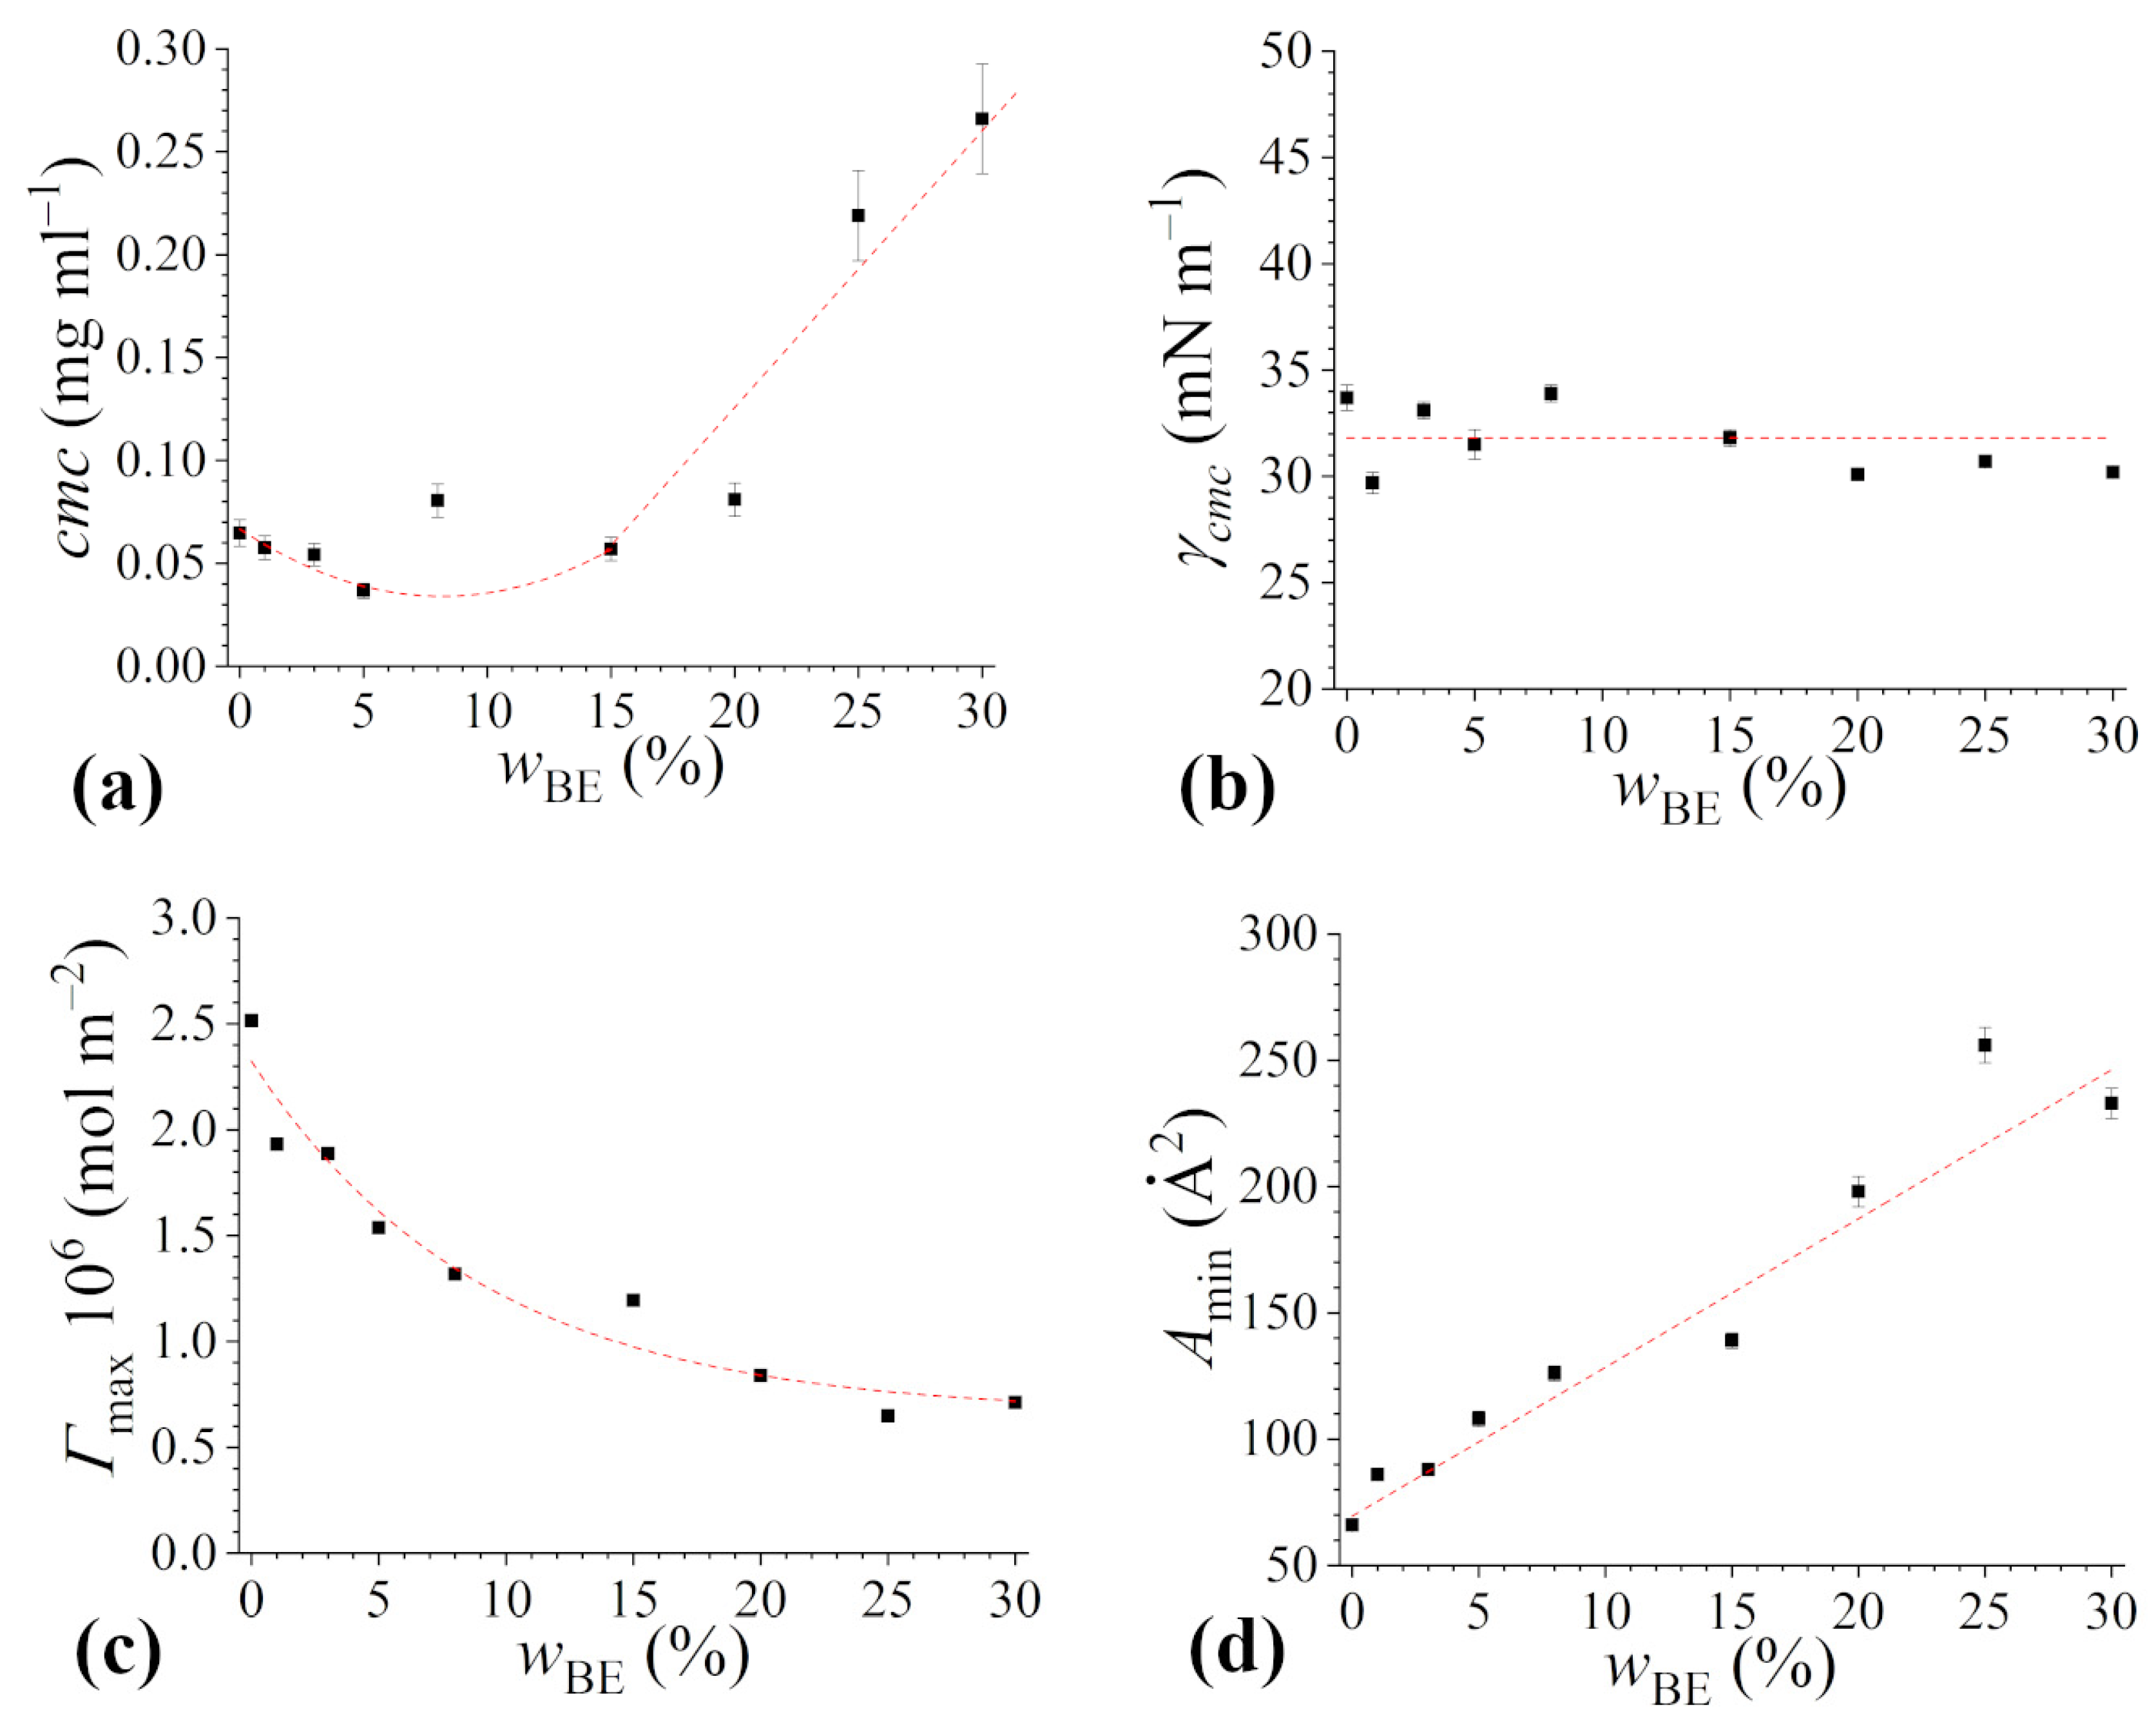
Figure 4.
Aggregation and surface properties of rhamnolipids in 4 mM sodium phosphate buffer solution at pH 7.1 as a function of bio-ethanol content: (a) critical micelle concentration (cmc), (b) minimal surface tension (γcmc), (c) maximum surface excess concentration (Γmax), (d) area occupied by a surfactant molecule at the air/solution interface (Amin). Red dotted lines are a guide to the eye.
At higher cosolvent concentrations the cmc steeply increases, reaching the value of about 0.27 mg mL−1 in the case of the system with = 30%. Going deeper into the details, a perusal of the data reveals a slight decrease up to = 5% bioethanol. This behavior well agrees with that reported in the literature for aqueous mixtures of short-chain alcohols and conventional surfactants [50,51,52], and can be interpreted in terms of the current understanding of the ethanol effect on amphiphile self-aggregation [11]. Alcohol molecules (less polar than water) are partitioned between the surfactant micelles and the bulk of the medium, which leads to mixed micelle formation. However, ethanol (hydrophilic alcohol) dissolves very little in micelles while mostly dissolves in the aqueous solution, and this affects the micellization process by modifying the solvent medium and hence the chemical potential of the free surfactants [53,54,55]. At low content, ethanol interacts with the micellizing Rha molecules, prompting the formation of the aggregates and lowering the cmc values [54,56,57]. At higher ethanol content, alcohol has a dual effect on Rha micellization, eventually resulting in an increase in the cmc. The inhibitory effect of the cosolvent depends on the nature of (bio)ethanol: it is a polar protic structured solvent with a dielectric constant value of 24.5, lower than that of water. Thus, the dielectric constant decreases with the increasing ethanol percentage in the mixture. This is expected to cause an increase in the electrostatic repulsions between the ionic headgroups of rhamnolipids (that are negatively charged at neutral pH) at the micellar surface, as well as to decrease the hydrophobic interaction between the hydrocarbon tails [58], even if such an effect is stronger for longer chained alcohols. Moreover, as discussed in the previous subsection, bioethanol is able to affect the H-bond network in aqueous solution. As a result, the entropic gain due to rhamnolipid micellization is lower than in pure water or in buffered aqueous solution, and this further hinders micellization [59,60].
As already mentioned, the presence of the cosolvent does not affect the ability of Rha to decrease the surface tension of water solutions (Figure 4b), with the γcmc values remaining constant around 32 mN m−1, irrespective of the bioethanol content. This value is in good agreement with that reported in the literature for the same rhamnolipid system [25], as well as for mono-rhamnolipid in water/ethanol mixtures [46], and it is only slightly higher than the values reported for purified mono- and di-rhamnolipid forms [22]. This finding indicates that rhamnolipids are able to effectively replace bioethanol at the air–water interface thanks to their more pronounced amphiphilicity and surface activity, and that the co-solvent scarcely contributes to the biosurfactant monolayer at saturation within the range of bioethanol concentration investigated. In this respect, it has been previously shown that, independently of the type of surfactants, the values of surface tension at concentrations higher than the cmc are similar to those of the surfactant solutions in water [11,61,62,63]. However, prior to monolayer saturation by rhamnolipids, it is found that as the bioethanol concentration increases, higher concentrations of rhamnolipids are required to observe a significant decrease in surface tension with respect to the binary water/bioethanol mixture, likely due to the higher occupancy of the air/water interface by alcohol molecules and the necessity to displace them by surfactants to properly populate the solution surface. Thus, for rhamnolipid too, the addition of an alcohol in general, and of bioethanol in particular, affects the micellization process, but not the ability to adsorb at the interface and decrease the surface tension of aqueous systems [46].
Finally, we calculated the surface excess Γmax and the average area occupied by a surfactant molecule at the air/solution interface, Amin, and reported the obtained values as a function of cosolvent content (Figure 4c,d). The area occupied by a rhamnolipid molecule at the interface between air and the aqueous buffered solution is 70 Å2, not dissimilar from the values obtained for purified rhamnolipids in similar conditions and in good agreement with results previously obtained [22,25]. It is worth noting that Amin values crucially depend on the choice of the Gibbs pre-factor and some artifacts may arise due to an overestimation of dissociation. Therefore, a qualitative analysis of the Amin trend can be more significant than a focus on the absolute values. As can be seen in Figure 4d, the area occupied by a rhamnolipid molecule at the interface increases with the bioethanol content. Considering the constancy of the γcmc values, interpreted as due to the displacement of alcohol molecules from the interface by surfactant molecules, the increase in Amin is unlikely to be ascribable to the co-adsorption of the two kinds of surface-active molecules, but rather this finding could be justified by taking into account the properties of alcohol and how they affect the bulk properties of the water solution. In particular, the addition of bioethanol, characterized by a lower dielectric constant than water, results, as said before, in increasing the electrostatic repulsion between the ionic rhamnolipid headgroups adsorbed at the air–liquid interface [64]. Moreover, the reduction in dielectric constant also weakens the hydrophobic interaction among tails, inducing surfactant molecules to lie flat at the air–liquid interface [65]. This further disfavors the adsorption of surfactant molecules at the air-liquid interface. Both factors concur to decrease the Γmax value, and, as a consequence, to increase the Amin value.
4. Conclusions
In this work, we have investigated the surface and aggregation properties of rhamnolipids in aqueous mixtures containing significant amounts of ethanol. To remain consistent with the purpose of the research, bioethanol, obtained by biotechnological means, was used. Both rhamnolipids and bioethanol were used, avoiding expensive purification steps which would have reduced the applicative relevance of the results. Therefore, in the first part of the paper, we analyzed the physico-chemical properties of aqueous bioethanol blends, focusing on those properties that could affect the structure and functionality of formulations. The data show that the aqueous mixtures of bioethanol are indistinguishable from those of pure ethanol up to ~40%, and only limited differences are detected above this value. The results indicate a significant effect of the cosolvent on the solution properties: the viscosity data show a bell-shaped trend, highlighting a synergistic effect of water and (bio)ethanol in the formation of an H-bond network that slows down the flow. On the other hand, the surface tension decreases with increasing (bio)ethanol content due to the positioning of the alcohol molecules at the solution–air interface.
Surface tension isotherms constructed by gradually increasing the rhamnolipid concentration in bioethanol aqueous mixtures indicate that the biosurfactant cmc is only weakly affected by the presence of bioethanol as cosolvent up to = 20%. Only a slight decrease is observed at low bioethanol content, which is ascribed to the weak adsorption of ethanol at the micelle surface reducing repulsion among the negative charges of rhamnolipid carboxylate groups. Direct interactions with surfactant monomers and/or micelles have also been invoked to interpret the effects of other cosolvents and/or cosolutes on the cmc at low concentrations [66]. With increasing bioethanol content above = 20%, the cmc increases steeply, an effect of the decreased dielectric constant, which enhances the repulsions between the ionic headgroups of the surfactants [31]. On the other hand, the surface tension of the micellar solution is independent of the bioethanol content, since the biosurfactant molecules replace the alcohol molecules at the solution–air interface. Overall, the rhamnolipid behavior in water–bioethanol mixtures is identical to that observed for conventional surfactants in water–ethanol mixtures, despite the evident differences of the biosurfactant molecular structure with respect to those of typical surfactant [67]. This evidence highlights that the (bio)surfactant behavior in (bio)ethanol aqueous solutions is rooted in the fundamental cosolvent effect on amphiphilic self-aggregation rather than being determined by specific interactions, and suggests that the effects of cosolvents on biosurfactants could be foreseen on the basis of findings for conventional surfactants, simplifying the rational design of eco-sustainable formulations.
On this basis, we can conclude that rhamnolipids and bioethanol are a valid alternative to synthetic counterparts, contributing to paving the way for future applications of green and sustainably designed industrial formulations.
Author Contributions
Conceptualization, I.R.K. and G.D.; methodology, V.R. and G.D.; formal analysis, I.R.K. and G.D.; investigation, R.E. and F.T.; resources, V.R. and G.D.; data curation, I.R.K. and G.D.; writing—original draft preparation, I.R.K. and G.D.; writing—review and editing, V.R., I.R.K. and G.D.; visualization, I.R.K. and G.D.; supervision, G.D.; project administration G.D.; funding acquisition, I.R.K. and G.D. All authors have read and agreed to the published version of the manuscript.
Funding
This research was funded by PON Ricerca e Innovazione 2014–2020, project title “Prodotti e processi innovativi per la filiera ortofrutticola della IV gamma—ProFood IV”, funded by the Italian Ministry of University and Research (MUR). We acknowledge financial support under the National Recovery and Resilience Plan (NRRP), Mission 4, Component 2, Investment 1.1, Call for tender No. 1409, published on 14 September 2022 by the Italian MUR, funded by the European Union—NextGenerationEU—Project Title: Structure and flow dynamics of Concentrated AMphiphilic BIOmolecules (CAmBio): driving the change to eco-sustainable surfactant formulations (Project number P202229ME2)—CUP E53D23015540001—Grant Assignment Decree No. 1386, adopted on 1 September 2023 by the Italian MUR. This study was carried out within the Agritech National Research Center and received funding from the European Union NextGenerationEU (NRRP)—Mission 4, Component 2, Investment 1.4—D.D. 1032 17 June 2022, CN00000022.
Data Availability Statement
The data presented in this study are available on request from the corresponding author.
Acknowledgments
Maria Lourdes Di Maio is gratefully acknowledged for technical support in the surface tension experiments.
Conflicts of Interest
The authors declare no conflicts of interest.
References
- Hassim, N.; Markom, M.; Rosli, M.I.; Harun, S. Scale-up approach for supercritical fluid extraction with ethanol–water modified carbon dioxide on Phyllanthus niruri for safe enriched herbal extracts. Sci. Rep. 2021, 11, 15818. [Google Scholar] [CrossRef] [PubMed]
- Shafieian, A.; Khiadani, M.; Nosrati, A. A review of latest developments, progress, and applications of heat pipe solar collectors. Renew. Sust. Energ. Rev. 2018, 95, 273–304. [Google Scholar] [CrossRef]
- Dzigbor, A.; Chimphango, A. Evaluating the potential of using ethanol/water mixture as a refrigerant in adsorption cooling system by using activated carbon-sodium chloride composite adsorbent. Int. J. Refrig. 2019, 97, 132–142. [Google Scholar] [CrossRef]
- Xia, L.; Wang, A.; Zhang, C.; Liu, Y.; Guo, H.; Ding, C.; Wang, Y.; Xu, W. Environmentally friendly dyeing of cotton in an ethanol–water mixture with excellent exhaustion. Green Chem. 2018, 20, 4473–4483. [Google Scholar] [CrossRef]
- Lachenmeier, D.W. Safety evaluation of topical applications of ethanol on the skin and inside the oral cavity. J. Occup. Med. Toxicol. 2008, 3, 26. [Google Scholar] [CrossRef] [PubMed]
- Maier, A.; Ovesen, J.L.; Allen, C.L.; York, R.G.; Gadagbui, B.K.; Kirman, C.R.; Poet, T.; Quiñones-Rivera, A. Safety assessment for ethanol-based topical antiseptic use by health care workers: Evaluation of developmental toxicity potential. Regul. Toxicol. Pharmacol. 2015, 73, 248–264. [Google Scholar] [CrossRef] [PubMed]
- Herdt, B.L.; Ikner, L.A. Inactivation kinetics of benzalkonium chloride and ethanol-based hand sanitizers against a betacoronavirus and an alphacoronavirus. Infect. Prev. Pract. 2023, 5, 100293. [Google Scholar] [CrossRef] [PubMed]
- Kratzel, A.; Todt, D.; V’kovski, P.; Steiner, S.; Gultom, M.; Thao, T.T.N.; Ebert, N.; Holwerda, M.; Steinmann, J.; Niemeyer, D.; et al. Inactivation of severe acute respiratory syndrome coronavirus 2 by WHO-recommended hand rub formulations and alcohols. Emerg. Infect. Dis. 2020, 26, 1592–1595. [Google Scholar] [CrossRef] [PubMed]
- Ribeiro, N.M.; Pinto, A.C.; Quintella, C.M.; da Rocha, G.O.; Teixeira, L.S.G.; Guarieiro, L.L.N.; do Carmo Rangel, M.; Veloso, M.C.C.; Rezende, M.J.C.; Serpa da Cruz, R.; et al. The role of additives for diesel and diesel blended (ethanol or biodiesel) fuels: A review. Energy Fuels 2007, 21, 2433–2445. [Google Scholar] [CrossRef]
- Samanta, S.; Ghosh, P. Coalescence of air bubbles in aqueous solutions of alcohols and nonionic surfactants. Chem. Eng. Sci. 2011, 66, 4824–4837. [Google Scholar] [CrossRef]
- Zdziennick, A.; Jańczuk, B. Modification of adsorption, aggregation and wetting properties of surfactants by short chain alcohols. Adv. Colloid Interface Sci. 2020, 284, 102249. [Google Scholar] [CrossRef] [PubMed]
- Russo Krauss, I.; Cavasso, D.; Ciccarelli, D.; Heenan, R.K.; Ortona, O.; D’Errico, G.; Paduano, L. A Hofmeister series perspective on the mixed micellization of cationic and non-ionic surfactants. J. Mol. Liq. 2021, 335, 116205. [Google Scholar] [CrossRef]
- Russo Krauss, I.; Imperatore, R.; De Santis, A.; Luchini, A.; Paduano, L.; D’Errico, G. Structure and dynamics of cetyltrimethylammonium chloride-sodium dodecylsulfate (CTAC-SDS) catanionic vesicles: High-value nano-vehicles from low-cost surfactants. J. Colloid Interface Sci. 2017, 501, 112–122. [Google Scholar] [CrossRef]
- Farooq, U.; Malik, N.A.; Shalla, A.H. Thermodynamics of cosolvent effect of surface-active ionic liquids on the micellization of conventional surfactant. Colloid Polym. Sci. 2021, 299, 1237–1246. [Google Scholar] [CrossRef]
- Jessop, P.G.; Ahmadpour, F.; Buczynski, M.A.; Burns, T.J.; Green, N.B., II; Korwin, R.; Long, D.; Massad, S.K.; Manley, J.B.; Omidbakhsh, N.; et al. Opportunities for greener alternatives in chemical formulations. Green Chem. 2015, 17, 2664–2678. [Google Scholar] [CrossRef]
- Jayakumar, M.; Gindaba, G.T.; Gebeyehu, K.B.; Selvakumar Periyasamy, S.; Jabesa, A.; Baskar, G.; John, B.I.; Pugazhendhi, A. Bioethanol production from agricultural residues as lignocellulosic biomass feedstock’s waste valorization approach: A comprehensive review. Sci. Total Environ. 2023, 879, 163158. [Google Scholar] [CrossRef] [PubMed]
- Triantafyllos Roukas, Y.; Kotzekidou, P. From food industry wastes to second generation bioethanol: A review. Rev. Environ. Sci. Biotechnol. 2022, 21, 299–329. [Google Scholar] [CrossRef]
- Chandrasekhar, T.; Varaprasad, D.; Gnaneswari, P.; Swapna, B.; Riazunnisa, K.; Anu Prasanna, V.; Korivi, M.; Wee, Y.-J.; Lebaka, V.R. Algae: The reservoir of bioethanol. Fermentation 2023, 9, 712. [Google Scholar] [CrossRef]
- Marchant, R.; Banat, I.M. Biosurfactants: A sustainable replacement for chemical surfactants? Biotechnol. Lett. 2012, 34, 1597–1605. [Google Scholar] [CrossRef]
- Kleinen, J. Will biosurfactants replace conventional surfactants? Curr. Opin. Colloid Interface Sci. 2023, 68, 101764. [Google Scholar] [CrossRef]
- Baccile, N. Are microbial biosurfactants actually only surfactants? Curr. Opin. Colloid Interface Sci. 2023, 68, 101747. [Google Scholar] [CrossRef]
- Esposito, R.; Speciale, I.; De Castro, C.; D’Errico, G.; Russo Krauss, I. Rhamnolipid self-aggregation in aqueous media: A long journey toward the definition of structure–property relationships. Int. J. Mol. Sci. 2023, 24, 5395. [Google Scholar] [CrossRef] [PubMed]
- Widyaningrum, T.; Prastowo, I.; Parahadi, M.; Prasetyo, A.D. Production of bioethanol from the hydrolysate of brown seaweed (Sargassum crassifolium) using a naturally β-glucosidase producing yeast Saccharomyces cereviceae JCM 3012. Biosci. Biotech. Res. Asia 2016, 13, 1333–1340. [Google Scholar] [CrossRef]
- Borines, M.G.; de Leon, R.L.; Cuello, J.L. Bioethanol production from the macroalgae Sargassum spp. Bioresour. Technol. 2013, 138, 22–29. [Google Scholar] [CrossRef]
- Esposito, R.; Ingenito, L.; Cavasso, D.; Siciliano, A.; Alfieri, M.L.; Chiappisi, L.; Fragneto, G.; Ottaviani, M.F.; Guida, M.; Paduano, L.; et al. Rhamnolipid–SLES aqueous mixtures: From the molecular self-aggregation to the functional and ecotoxicological properties. J. Mol. Liq. 2022, 367, 120547. [Google Scholar] [CrossRef]
- Torovic, L.; Srdjenovic-Conic, B.; Kladar, N.; Lukic, D.; Bijelovic, S. Elemental profile of recorded and unrecorded fruit spirits and health risk assessment. J. Food Compos. Anal. 2022, 114, 104807. [Google Scholar] [CrossRef]
- Dodd, L.E. Calibration of Abbe refractometer with compensating prisms, to measure refractive index for any wave length. Rev. Sci. Instrum. 1931, 2, 466–501. [Google Scholar] [CrossRef]
- Prokopová, O.; Blahut, A.; Čenský, M.; Součková, M.; Vinš, V. Comments on temperature calibration and uncertainty estimate of the vibrating tube densimeter operated at atmospheric pressure. J. Chem. Thermodyn. 2022, 173, 106855. [Google Scholar] [CrossRef]
- Sariyerli, G.S.; Sakarya, O.; Yuksel Akcadag, U. Comparison tests for the determination of the viscosity values of reference liquids by capillary viscometers and stabinger viscometer SVM 3001. Int. J. Metrol. Qual. Eng. 2018, 9, 7. [Google Scholar] [CrossRef]
- Harkins, W.D.; Young, T.F.; Cheng, L.H. The ring method for the determination of surface tension. Science 1926, 64, 333–336. [Google Scholar] [CrossRef]
- D’Errico, G.; Ciccarelli, D.; Ortona, O. Effect of glycerol on micelle formation by ionic and nonionic surfactants at 25 °C. J. Colloid Interface Sci. 2005, 286, 747–754. [Google Scholar] [CrossRef] [PubMed]
- Antony, A.; Mitra, J. Refractive index-assisted UV/Vis spectrophotometry to overcome spectral interference by impurities. Anal. Chim. Acta 2021, 1149, 238186. [Google Scholar] [CrossRef] [PubMed]
- Synovec, R.E.; Yeung, E.S. Quantitative analysis without analyte identification by refractive index detection. Anal. Chem. 1983, 55, 1599–1603. [Google Scholar] [CrossRef]
- Khattab, I.S.; Bandarkar, F.; Fakhree, M.A.A.; Jouyban, A. Density, viscosity, and surface tension of water+ethanol mixtures from 293 to 323 K. Korean J. Chem. Eng. 2012, 29, 812–817. [Google Scholar] [CrossRef]
- Herráez, J.V.; Belda, R. Refractive indices, densities and excess molar volumes of monoalcohols + water. J. Solut. Chem. 2006, 35, 1315–1328. [Google Scholar] [CrossRef]
- Pečar, D.; Doleček, V. Volumetric properties of ethanol–water mixtures under high temperatures and pressures. Fluid Phase Equilibria 2005, 230, 36–44. [Google Scholar] [CrossRef]
- Hoga, H.E.; Torres, R.B.; Volpe, P.L.O. Thermodynamics properties of binary mixtures of aqueous solutions of glycols at several temperatures and atmospheric pressure. J. Chem. Thermodyn. 2018, 122, 38–64. [Google Scholar] [CrossRef]
- Zarei, H.A.; Jalili, F.; Assadi, S. Temperature dependence of the volumetric properties of binary and ternary mixtures of water (1) + methanol (2) + ethanol (3) at ambient pressure (81.5 kPa). J. Chem. Eng. Data 2007, 52, 2517–2526. [Google Scholar] [CrossRef]
- Cheng, N.-S. Formula for the viscosity of a glycerol-water mixture. Ind. Eng. Chem. Res. 2008, 47, 3285–3288. [Google Scholar] [CrossRef]
- González, B.; Calvar, N.; Gómez, E.; Domínguez, Á. Density, dynamic viscosity, and derived properties of binary mixtures of methanol or ethanol with water, ethyl acetate, and methyl acetate at T=(293.15, 298.15, and 303.15)K. J. Chem. Thermodyn. 2007, 39, 1578–1588. [Google Scholar] [CrossRef]
- Jia, X.-Q.; Li, Y.; Zhang, C.-X.; Gao, Y.-C.; Wu, Y. Supramolecular clusters clarification in ethanol-water mixture by using fluorescence spectroscopy and 2D correlation analysis. J. Mol. Struct. 2020, 1219, 128569. [Google Scholar] [CrossRef]
- Choi, S.; Parameswaran, S.; Choi, J.-H. Understanding alcohol aggregates and the water hydrogen bond network towards miscibility in alcohol solutions: Graph theoretical analysis. Phys. Chem. Chem. Phys. 2020, 22, 17181–17195. [Google Scholar] [CrossRef] [PubMed]
- Deng, G.-H.; Shen, Y.; Chen, H.; Chen, Y.; Jiang, B.; Wu, G.; Yang, X.; Yuan, K.; Zheng, J. Ordered-to-disordered transformation of enhanced water structure on hydrophobic surfaces in concentrated alcohol−water solutions. J. Phys. Chem. Lett. 2019, 10, 7922–7928. [Google Scholar] [CrossRef] [PubMed]
- Kuchuk, V.I.; Shirokova, I.Y.; Golikova, E.V. Physicochemical properties of water–alcohol mixtures of a homological series of lower aliphatic alcohols. Glass Phys. Chem. 2012, 38, 460–465. [Google Scholar] [CrossRef]
- Vazquez, G.; Alvarez, E.; Navaza, J.M. Surface tension of alcohol + water from 20 to 50 °C. J. Chem. Eng. Data 1995, 40, 611–614. [Google Scholar] [CrossRef]
- Rekiel, E.; Zdziennicka, A.; Jańczuk, B. Adsorption properties of rhamnolipid and ethanol at water/ethanol solution-air interface. J. Mol. Liq. 2022, 308, 113080. [Google Scholar] [CrossRef]
- Shinoda, K.; Hutchinson, E. Pseudo-phase separation model for thermodynamic calculations on micellar solutions. J. Phys. Chem. 1962, 66, 577–582. [Google Scholar] [CrossRef]
- Ambrosone, L.; Costantino, L.; D’Errico, G.; Vitagliano, V. Thermodynamic and dynamic properties of micellar aggregates of nonionic surfactants with short hydrophobic tails. J. Colloid Interface Sci. 1997, 190, 286–293. [Google Scholar] [CrossRef] [PubMed]
- Esposito, R.; Gallucci, N.; Niccoli, M.; Cavalcanti, L.P.; Russo Krauss, I.; Paduano, L.; D’Errico, G. Synergism and molecular mismatch in rhamnolipid/CTAC catanionic surfactant mixtures. Colloids Surf. A 2023, 674, 131931. [Google Scholar] [CrossRef]
- Üner, O.; Akkurt, N. Micellization and thermodynamics study of N-alkyl-4-methylpyridinium bromides in water and mixed water–ethanol media. J. Mol. Liq. 2022, 352, 118765. [Google Scholar] [CrossRef]
- Shilova, S.V.; Tret’yakova, A.Y.; Barabanov, V.P. Association of quaternized poly(4-vinylpyridine) and sodium dodecyl sulfate in water-alcohol solvents. Polym. Sci. Ser. A 2010, 52, 1283–1291. [Google Scholar] [CrossRef]
- Moreira, L.A.; Firoozabadi, A. Thermodynamic modeling of the duality of linear 1-alcohols as cosurfactants and cosolvents in self-assembly of surfactant molecules. Langmuir 2009, 25, 12101–12113. [Google Scholar] [CrossRef] [PubMed]
- Zana, R. Aqueous surfactant-alcohol systems: A review. Adv. Colloid Interface Sci. 1995, 57, 1–64. [Google Scholar] [CrossRef]
- Zana, R.; Yiv, S.; Strazielle, C.; Lianos, P. Effect of alcohol on the properties of micellar systems: I. Critical micellization concentration, micelle molecular weight and ionization degree, and solubility of alcohols in micellar solutions. J. Colloid Interface Sci. 1981, 80, 208–223. [Google Scholar] [CrossRef]
- Førland, G.M.; Samseth, J.; Gjerde, M.I.; Høiland, H.; Jensen, A.Ø.; Mortensen, K. Influence of alcohol on the behavior of sodium dodecylsulfate micelles. J. Colloid Interface Sci. 1998, 203, 328–334. [Google Scholar] [CrossRef] [PubMed]
- Sidim, T.; Acar, G. Alcohols effect on critic micelle concentration of polysorbate 20 and cetyl trimethyl ammonium bromine mixed solutions. J. Surfactants Deterg. 2013, 16, 601–607. [Google Scholar] [CrossRef] [PubMed]
- Akhter, M.S. Effect of solubilization of alcohols on critical micelle concentration of non-aqueous micellar solutions. Colloids Surf. A 1999, 157, 203–210. [Google Scholar] [CrossRef]
- Niraula, T.P.; Shah, R.; Kumar, D.; Dominguez, H.; Ríos-López, M.; Salazar-Arriaga, A.B.; De, R.; Bhattarai, A. Influence of solvent permittivity and divalent salt on micellization behavior of sodium dodecyl sulfate: Conductivity measurements and simulation study. J. Mol. Liq. 2022, 349, 118186. [Google Scholar] [CrossRef]
- Soni, S.S.; Panjabi, S.H.; Sastry, N.V. Effect of non-electrolyte additives on micellization and clouding behavior of silicone surfactant in aqueous solutions. Colloids Surf. A 2011, 377, 205–211. [Google Scholar] [CrossRef]
- Castronuovo, G.; Elia, V.; Moniello, V.; Velleca, F.; Perez-Casas, S. Effect of a cosolvent on the hydrophobic interactions. A calorimetric study of alkane-m,n-diols in concentrated aqueous solutions of ethanol. Phys. Chem. Chem. Phys. 1999, 1, 1887–1892. [Google Scholar] [CrossRef]
- Zdziennicka, A.; Jańczuk, B. Behavior of anionic surfactants and short chain alcohols mixtures in the monolayer at the water–air interface. J. Surfactants Deterg. 2011, 14, 257–267. [Google Scholar] [CrossRef]
- Rekiel, E.; Zdziennicka, A.; Jańczuk, B. Adsorption of surfactin at water with ethanol mixture-air interface. J. Mol. Liq. 2020, 300, 112240. [Google Scholar] [CrossRef]
- Zdziennicka, A. Surface behavior of Triton X-165 and short chain alcohol mixtures. Langmuir 2010, 26, 1860–1869. [Google Scholar] [CrossRef] [PubMed]
- Sheng, R.; Ding, Q.Y.; Ren, Z.H.; Li, D.N.; Fan, S.C.; Cai, L.L.; Quan, X.F.; Wang, Y.; Yi, M.T.; Zhang, Y.X.; et al. Interfacial and Micellization Behavior of Binary Mixture of Amino Sulfonate Amphoteric Surfactant and Octadecyltrimethyl Ammonium Bromide: Effect of Short Chain Alcohol and Its Chain Length. J. Mol. Liq. 2021, 334, 116064. [Google Scholar] [CrossRef]
- Rosen, M.J.; Kunjappu, J.T. Surfactants and Interfacial Phenomena; John Wiley & Sons: Hoboken, NJ, USA, 2012; pp. 235–271. [Google Scholar]
- Costantino, L.; D’Errico, G.; Roscigno, P.; Vitagliano, V. Effect of urea and alkylureas on micelle formation by a nonionic surfactant with short hydrophobic tail at 25 °C. J. Phys. Chem. B 2000, 104, 7326–7333. [Google Scholar] [CrossRef]
- Russo Krauss, I.; Esposito, R.; Paduano, L.; D’Errico, G. From composite molecular structures to a multiplicity of supramolecular aggregates: The role of intermolecular interactions in biosurfactant self-assembly. Curr. Opin. Colloid Interface Sci. 2024, 70, 101792. [Google Scholar] [CrossRef]
Disclaimer/Publisher’s Note: The statements, opinions and data contained in all publications are solely those of the individual author(s) and contributor(s) and not of MDPI and/or the editor(s). MDPI and/or the editor(s) disclaim responsibility for any injury to people or property resulting from any ideas, methods, instructions or products referred to in the content. |
© 2024 by the authors. Licensee MDPI, Basel, Switzerland. This article is an open access article distributed under the terms and conditions of the Creative Commons Attribution (CC BY) license (https://creativecommons.org/licenses/by/4.0/).