Article

Microstructure Refinement or Increased Copper Solubility: Factors That Contribute to the Pitting Corrosion Tendency in Aluminum–Copper Alloys

by
Akbar Niaz
1,2,* and
Muhammad Mudassir Ahmad Alwi
1,2
1
Materials Engineering Department, College of Engineering, King Faisal University, Hufof 31982, Saudi Arabia
2
Mechanical Engineering Department, College of Engineering, King Faisal University, Hufof 31982, Saudi Arabia
*
Author to whom correspondence should be addressed.
Surfaces 2025, 8(1), 9; https://doi.org/10.3390/surfaces8010009
Submission received: 23 December 2024 / Revised: 21 January 2025 / Accepted: 23 January 2025 / Published: 25 January 2025
(This article belongs to the Special Issue Advancements in Surface Engineering for Metallic Alloys)

Abstract

:
Aluminum–copper alloys are commonly used in the aerospace industry due to their low density and high strength. Pitting corrosion is the major problem of Al-Cu alloys due to the presence of largely separated electrochemical potential difference phases. Microstructure refinement and phase homogenization of the alloys are believed to be the factors that contribute to decreasing the galvanic coupling between phases, hence decreasing the pitting tendency. In this work, we investigate whether microstructure refinement is the only factor that contributes to pitting or whether some other factors are involved in the pitting tendency. The investigation was conducted on two frequently used aerospace aluminum–copper alloys, Al-2024 T3 and Al-2014 T6. The surface refinement was conducted by laser surface melting, and microstructure characterization was conducted by scanning electron microscopy with an energy-dispersive X-ray analysis. Phase identification before and after the laser surface melting was conducted by X-ray diffraction, while pitting tendency was measured by a polarization test in 1 molar sodium chloride solution. These experimental results revealed that the enrichment of copper in the α-matrix phase was the major contributing factor in pitting as compared to the largely believed microstructural phase refinement.

1. Introduction

Aluminum–copper alloys are commonly used in aerospace applications due to their high strength and low density [1]. The strength of these alloys is attributed to multiple phases, and intermetallics exist in the microstructure. The phases and intermetallics are formed in these alloys due to the limited solid solubility of copper in aluminum at room temperature [2,3]. These phases and intermetallics, on the one hand, provide strength, but on the other hand, decrease the corrosion resistance. The corrosion problem of aluminum copper alloys is largely reported due to the galvanic drive that exists between the matrix and second-phase particles. The magnitude of the galvanic drive depends on the type of second phases that exist in the alloy [4,5].
The metallic aluminum forms a thin oxide layer as soon as it is exposed to air, the layer grows with time and temperature and works as a barrier to corrosion [6,7]. The presence of phases and intermetallics limits the formation of adherent regular oxide layers. The problem becomes even worse when phases with highly different electrochemical potential difference exist either of a cathodic or anodic nature [8,9]. The cathodic phases like Al2Cu and Al3Cu and the anodic phase like Al2CuMg exist in Al-Cu alloys. These phases cause preferential attacks on matrix or second-phase particles. The irregular formation of the oxide layer and preferential attack on the alloy surface cause decreasing corrosion resistance as well as strength [10,11,12,13].
Researchers in the past studied corrosion problems in Al-alloys and how to overcome the corrosion problem. Most of the corrosion study was carried out by examining the microstructure, detecting phases of different electrochemical potential difference, composition analysis, and corrosion testing [14,15]. This was conducted by scanning electron microscopy, X-ray photoelectron spectroscopy, X-ray diffraction, and electrochemical corrosion testing. The improvement in corrosion resistance of Al-Cu alloy was reported by bulk heat treatment, coatings, inhibitors, and surface modification processes. A brief outlook of the past research on improving the corrosion study of Al-Cu alloys will be given here with more influence on the laser surface modification [16,17,18].
Stonica et al. reported that in 2024-T3 aluminum alloys, Al2CuMg, Al2Cu, and Al6 (Cu, Fe, Mn), are the major phases responsible for pitting corrosion. The phases with high copper content like Al2Cu function as cathode while Al2CuMg functions as the anode. The corrosion around Al2CuMg starts with de-alloying alongside pitting around these phases [19]. The localized corrosion goes along the second-phase particles and grain boundaries. In extreme cases, the pitting of the Mg-containing phases on the surface goes with complete disbondment from the matrix. The suppression of Mg-rich particles by coating or inhibitors can decrease the localized corrosion of these alloys. One such treatment has been conducted by Cammila et al. They de-oxidized the 2024-T3 alloy surface with different acids and found enriched copper content at the metal/oxide interface without any significant change in the aluminum oxide layer [20].
The Mg-rich phases are present in around 60% of the second-phase particles, in the 2024-T3 aluminum alloy. The Al-Cu-Fe-Mn is the second most abundant second-phase particle reported in 2024-T-3 alloys, which are cathodic in nature. The cathodic nature of these particles allows the oxygen reduction reaction of these sites alongside enhancing the galvanic drive between Al2CuMg and Al-Cu-Fe-Mn phases. The presence of different constituents in the phases and occurrence of anodic/cathodic reactions simultaneously cause the formation of complex products. The formation of these complex products changes the local electrochemical activity on these sites due to the redistribution of Cu.
The continuous and localized corrosion in 2024-T3 and Al-Cu-lithium alloys is studied by Chen et al. [11]. They reported that corrosion initially occurs around second-phase particles. Their intensities are largely dependent on the size of the pit, pH in the pit area, and a cluster of other second-phase particles. If the size of the pit is smaller to hold a current density of 10−2 A/cm2, the pit will re-passivate rather than grow any further [11]. Similarly, a pH of less than three is required with the pit vicinity to grow the pit. These conditions are not fulfilled at the start; hence, general pitting occurs in isolated second phases, which proceeds with localized pitting in the regions where high galvanic drive exists. Boag et al. reported in their research that high pitting density is achieved by the coupling effect of other intermetallic phases like Al-Cu-Fe-Mn [21]. A series of research works suggest corrosion of Al-Cu alloys starts with initial pitting of the scattered places on the second-phase particles, followed by the severe subsurface particle clusters [22,23,24]. Access to these clusters occurs due to the dissolution of the second-phase particles around the matrix phase.
The galvanic corrosion of Al-Cu alloys is also studied by Jonthan et al. [25]. They reported in their work that the number of second-phase particles on the surface is different from sample to sample. Even the composition wt. % within the particles is different. The Al2CuMg phases contained 38% Cu and 16% Mg, while the AlCuMnFe phase contained 27% Cu, 11% Fe, and 6% Mn. Upon immersing the electrolytic solution, they develop a more complex reaction due to the depletion of second-phase particles in the solution. The variation in reactivity also occurs due to the nature of the electrolyte as well; e.g., sulfate ions containing electrolytes inhibit a reaction with aluminum while enhancing the corrosion of copper. Hence, changing the overall electrochemical reactivity of these alloys. They concluded in their research that galvanic corrosion in Al-Cu alloys is highly dependent on the difference in the copper contents between matrix and second-phase particles [25].
Another interesting study on the contribution of Al2CuMg in AA 2024 is conducted by Christine et. al. [26]. The model AA 2024 alloy was developed by using magnetron sputtering. The coarse Al2CuMg phase dissolves homogeneously when polarized in sulfate solution. Once chloride ions are added to the solution, the intermetallics preferentially attacked due to the synergetic effect of sulfate and chloride ions on copper. They suggested a three-step process of pitting Al-Cu alloys: homogeneous dissolution, copper redeposition, and local dissolution of the matrix. The pitting process is slightly contradictory to that reported by Zhu et al., where they proposed de-alloying of Al2CuMg (Al and Mg removal) followed by vigorous dissolution of the surrounding matrix [27]. They further reported the galvanic coupling being more intense between the passive layer and matrix rather than between the intermetallic and phases [26].
The pitting corrosion was also studied on a model Al-Cu alloy analyzing the native oxide film by P. Cornette [28]. They quantify the corrosion potential of distinct phases and intermetallics of the Al-Cu alloy. The pure Al2Cu produces a potential of −473 mV/SCE as compared to −507 mV/SCE of Al. The presence of second-phase particles and intermetallics in the oxide layer causes inhomogeneity, which increases the propensity to pitting corrosion. To investigate further they conducted current–voltage measurements of Al2O3 and the interface between Al2O3/Al2Cu. Their results revealed the higher conductivity surrounding the Al2O3/Al2Cu interface as compared to oxide. The higher conductivity was attributed to the presence of Cu in these regions [28].
The bulk heat treatment is said to increase the Al-Cu alloys overall strength and resistance to corrosion [29,30]. Aging after solution treatment is one of the main processes that improves microstructural uniformity and strength. In order to dissolve second-phase particles, the alloys are heated above the solvus temperature followed by quenching [31]. The procedure acquired homogeneity but produces stress in the structure. Although it increases strength, the rapid cooling reduces toughness. Additionally, the residual strains cause microcracks as well. The purpose of both artificial and natural aging is to increase microstructural uniformity and strength. Known as “natural aging,” the solution-treated samples are allowed to age for a long time in their natural surroundings [30,32]. To remove stress and redistribute microstructural phases, a process known as artificial aging, the alloy was reheated for three to nine hours to a lower temperature (160 to 210 °C). Overall corrosion is improved by microstructural homogeneity and the release of residual stress [30].
In Al-Cu alloys, localized corrosion issues such as stress corrosion, intergranular corrosion, hydrogen damage, and pitting corrosion are well-known problems [33,34]. The corrosion issue is exacerbated by the externally imposed stresses or residual stresses that result from any secondary fabrication process. Intergranular corrosion is made more likely by the over-aging of Al-Cu alloys as well as the development of intermetallics and their buildup at grain boundaries [33,34]. Most alloying additions in Al-Cu systems have relatively larger atomic sizes, which typically result in the formation of substitution solid-solution. Smaller atoms, such as hydrogen, occupy the interstitial spaces. When aluminum and its alloys are being produced and fabricated, these gases adsorb. Ionic hydrogen converts to atomic hydrogen due the surplus electrons produced during the anodic reaction, followed by merging of atoms to form molecular hydrogen [35,36]. The pressure created by the development of hydrogen gas causes cracks to form around intermetallics and inclusions.
Researchers also improve the galvanic and pitting corrosion of Al-Cu alloys, one of the main reported processes for improving the corrosion resistance of these alloys is laser surface melting (LSM). It is largely reported that dispersion of phases in LSM improves material pitting performance. One such study was carried out by Embuka [37]. They reported that LSM modifies the near-surface microstructure due to rapid melting and solidification. The 3–5 mm layer develops a refined microstructure with almost no intermetallic responsible for localized corrosion. The refined microstructure provides better resistance to galvanic corrosion [37]. The improved microstructure by LSM toward increasing pitting corrosion resistance is also reported by some other authors by using Nd-YAG and CO2 lasers [38,39].
Contrary to the above work, some researchers do not find any improvement in Al-Cu alloys due to LSM treatment. They consider the relatively slow cooling rate in CO2 and Nd-YAG laser, i.e., 108 K/s. The low cooling rate promotes the formation of a dendritic microstructure [40]. The segregation of Cu with the cellular and interdendritic space increases the galvanic drive between main matrix phase and redistributed Cu-phase, hence no real improvement after the laser treatment [34,40].
The use of a UV laser source with pulse duration in nanoseconds achieved a much faster cooling rate, i.e., 1011 K/s. The extremely fast cooling rate provides a more homogeneous microstructure and large dissolution of intermetallic particles [41]. The microstructure can be further modified by changing excimer laser pulses to the same area. The improvement in pitting corrosion by using excimer laser is also reported by some other researchers in 6013 and 7075 alloys [42,43]. Researchers also found the anodized film produced on the excimer LSM samples is more uniform and has fewer defects. The continuous anodized layer in aluminum alloys is a guarantee of improved corrosion resistance. The microstructure acquired from the excimer laser surface melting process is thermally more stable than CO2 and the Nd-YAG process for growing functional polymer layers on these alloys [41,42,44].
The advancements in laser technologies make it possible to achieve highly directional and focused laser heats, which cause melting and vaporization of some constituents. Furthermore, using micro-ns duration of a pulse laser opens up new areas of research of micro-texturing [45]. Micro-texturing enhances surface functionalizing and topographic properties. The process can be used for introducing compressive stress on the surface to resist enhanced stress corrosion cracking resistance. It can further be used to improve adhesion, wetting, and abrasion properties of the Al-Cu alloys [45,46,47].
It can be summarized from the above literature survey that in Al-Cu alloys; phases and intermetallic compounds are major causes of galvanic corrosion. Depending on the composition of the phases, it produces a driving force between the matrix and second phase. The higher copper percentage in the second phase makes the phase work as a cathode while higher percentage of magnesium in the second phase makes the phase work as an anode. It is also possible that phases may enrich or deplete a certain constituent during the corrosion degradation. The second phases present in the Al-Cu alloy do not allow the formation of a continuous oxide layer; hence, localized corrosion occurs. The resistance against localized corrosion can be enhanced by eliminating or minimizing second phase particles. Laser surface treatment is one of the processes largely reported for improvement in localized corrosion resistance, but opinion is divided between improvement and no improvement by using CO2 and Nd-YAG laser. An effort is made in this work to study the role of microstructure refinement and Cu-enrichment of the matrix phase toward pitting tendency. Microstructure refinement and analysis were conducted by laser surface melting and scanning electron microscopy. The phase identification and modification were conducted by EDX and XRD, while anodic polarization testing was conducted for checking pitting propensity.

2. Materials and Methods

2.1. Sample for Laser Surface Melting

Al-2014 T-6 and Al-2024 T-3 alloy specimens measuring 6 cm × 10 cm were extracted from an 8 mm thick plate. The surfaces of the samples were sandblasted to enhance cleanliness and facilitate laser absorption. Prior to the laser surface melting process, the samples underwent solution treatment at 490 ± 5 °C for a period of 3 h in a muffle-box furnace, followed by water quenching. The Al-2024 alloy samples were kept in the lab environment for 7 days. The Al-2014 alloy samples were reheated to 180 ± 5 °C for 10 h and allowed to cool in the furnace. To ensure uniform melting during the laser surface melting (LSM) process, the samples were straightened. The nominal composition of the alloys analyzed through spark emission is presented in Table 1.

2.2. Laser Surface Melting

Laser surface melting was carried out by using CO2 laser with a power of 1.6 kW and a beam diameter of 1 mm. The laser surface melting was conducted from 20, 50, 80, 100, 150, and 180 mm/s to optimize the scan rate that produces minimum defects. The melt pool was surrounded by argon gas to avoid oxidation during the treatment. A 50% overlapping of the bead was carried out for homogenization of microstructure. Table 2 shows the details of the laser process parameters for surface modification.

2.3. Samples for Microscopy

Samples were embedded in epoxy for the purposes of grinding and polishing, both as received and laser-surface-treated ones. Progressive grinding was conducted using sandpapers with grit sizes of 800, 1200, and 4000. To avoid creating deep scratches, the orientation of the grinding scratches was kept perpendicular to the sandpaper for each change of the sandpaper. After cleaning with ethanol, the samples were rinsed with deionized water. Following the grinding process, the samples were polished using a velvet cloth polisher along with diamond paste, achieving a surface finish of under 1 µm. The microstructure was exposed by etching the sample surfaces for 30 to 60 s with freshly prepared Kroll’s reagent. This reagent was prepared by mixing 5 mL of lab-grade nitric acid into deionized water, followed by the addition of 1.5 mL of hydrofluoric acid to the mixture. Samples were dried by the heater to avoid leaving marks on the sample due to water. Both electron and optical microscopy analyses were conducted on the etched surfaces.

2.4. X-Ray Diffraction

As received, and laser surface melted samples were cut into a size of 20 × 8 × 5 mm size to fit in the sample holder. Samples were ground and polished from 1000 to 4000 grit size grinding paper to avoid errors due to surface roughness. Philip-expert MPD (PW3040), Manchester, UK, with thin-film attachment at the given-below scanning parameters were used for XRD tests. The selection parameters for the XRD experiment are given in Table 3.

2.5. Potentiodynamic Polarization

The samples were cut down to 1 cm × 1 cm size from both as received and laser surface melted samples. The laser scan rate of 80 mm/s produces minimum defects; hence, this laser scan speed was used for corrosion testing samples with 50% bead overlap in transverse direction. The electrical connection was established by spot welding Nichrome wire, which was later covered with a flexible tube and submerged in liquid epoxy to settle down. The surfaces were ground and polished to 4000 grit-size sandpaper. The ACM-Gill potentiostat-958 sequencer, Manchester, UK. was used for the polarization test at the given-below conditions. The summary of the process parameters is given in Table 4. The experiments were conducted in a 1 M sodium chloride solution within a standard 3-electrode corrosion cell. The cell was maintained in a water bath at 25 °C. Nitrogen gas was bubbled through a glass tube with a perforated ceramic end for 1 h prior to the commencement of the experiment. The gas pressure was adjusted to produce 2–3 bubbles in the cell to reduce noise during the polarization test.

3. Results and Discussion

3.1. Laser Surface Treatment

A single laser bead was conducted at a scan rate of 20, 50, 80, 100, 150, and 180 mm/s to see the how width and depth changes with scan rate, as shown in Figure 1. The width and depth of the bead decreases with increase in the scan rate. A scale of 1 mm was used at the same magnification as that of the bead micrograph. The measured values of bead width and depth are presented in Table 5. The width and depth of the bead decrease with the increase in the laser scan rate, hence melting, and depth of the bead can be controlled by adjusting the laser scan rate. The micrograph taken from the melted cross-section shows black spots at bead contour. These spots were more visible at the low laser scan rate and the bottom section of the bead. These spots are probably the porosity produced due to release of adsorbed gases. These adsorbed gases escaped from the near surface, while due to the fast cooling, they did not gain enough time to escape from the bead contour. The porosity was more pronounced in the Al-2024 alloy at a low laser scan rate probably due to the adsorbed gases in during the natural aging stage. This exposure allows gases to adsorb on the surface with further settling in the interstitial spaces.
Single to multiple cracks were observed above the 80 mm/s laser scan rate. It is suggested that cracks are produced due to development of high thermal stresses in the melted region due to fast cooling. As laser surface modification is a highly surface localized melting process, the core of the sample stays at a moderately low temperature. The fusion at the surface with a moderately low temperature in the core produces high thermal stresses. Furthermore, partial evaporation of magnesium and accumulation of brittle intermetallics around the grain boundaries may also contribute to the crack formation. A laser scan rate of 80 mm/s with a 50% transverse bead overlap was used for corrosion test samples while a 150 mm/s scan rate was used alongside 80 mm/s to study the microstructure and phase changes.

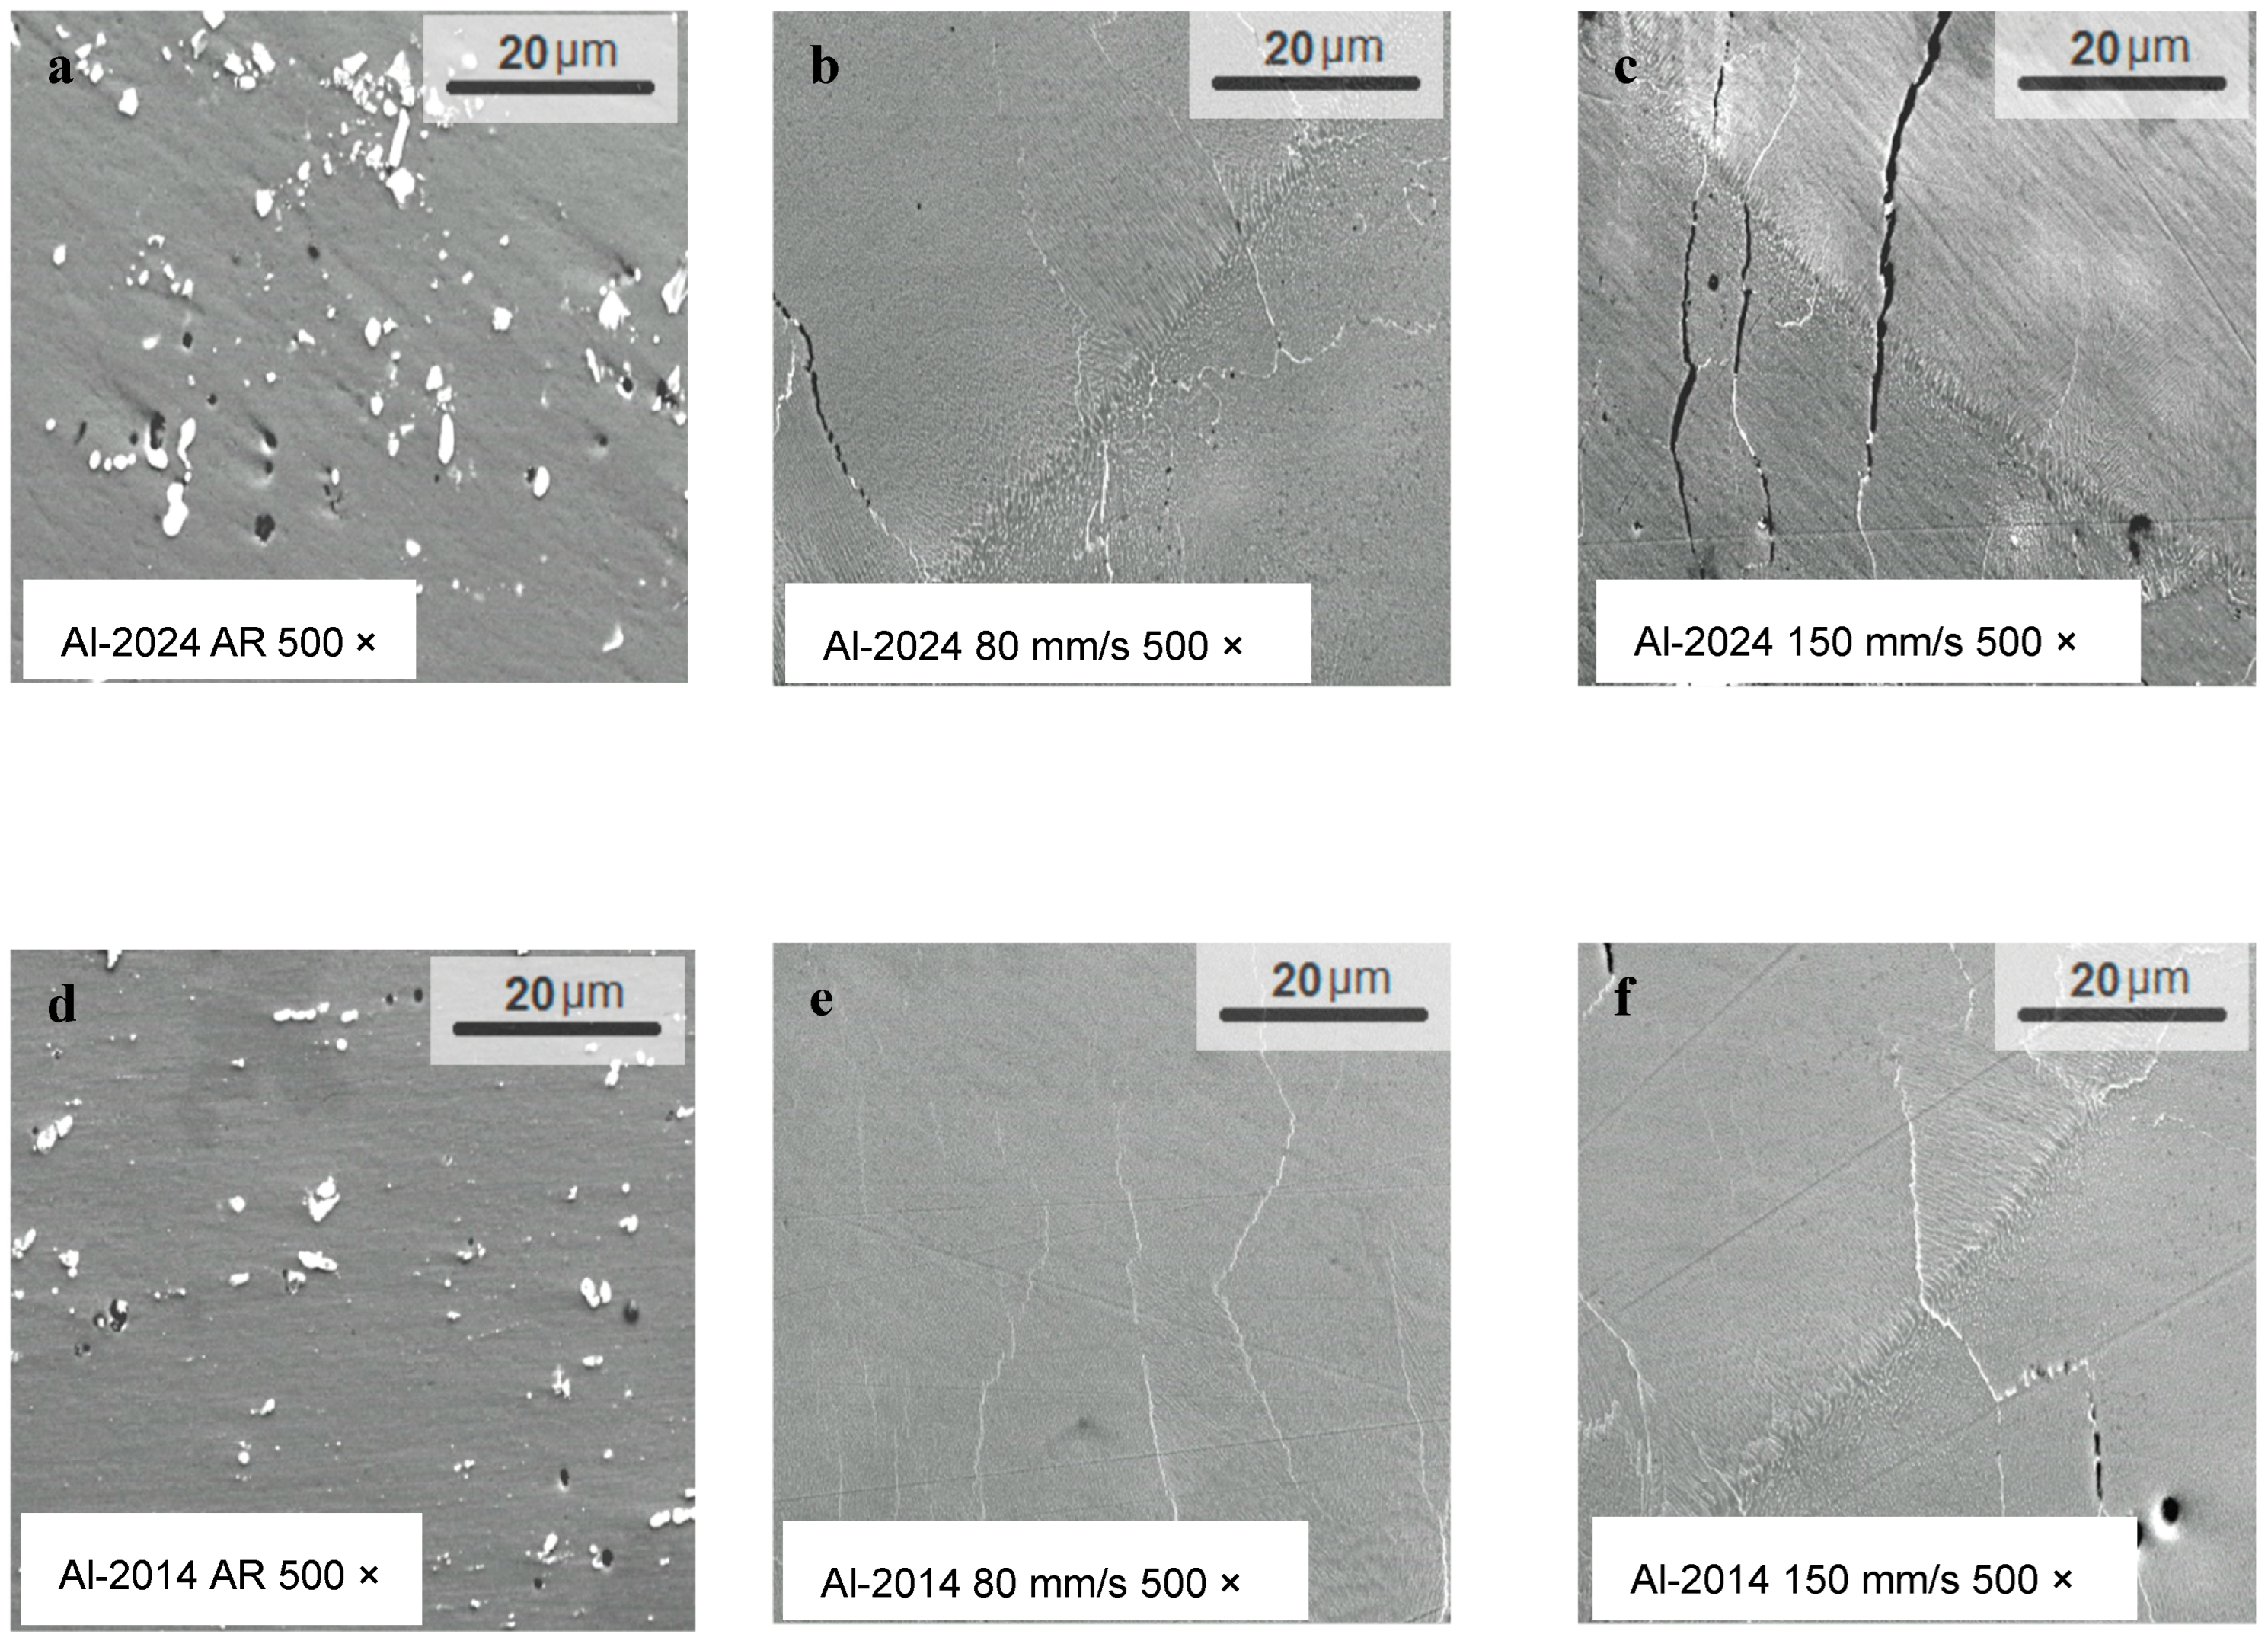
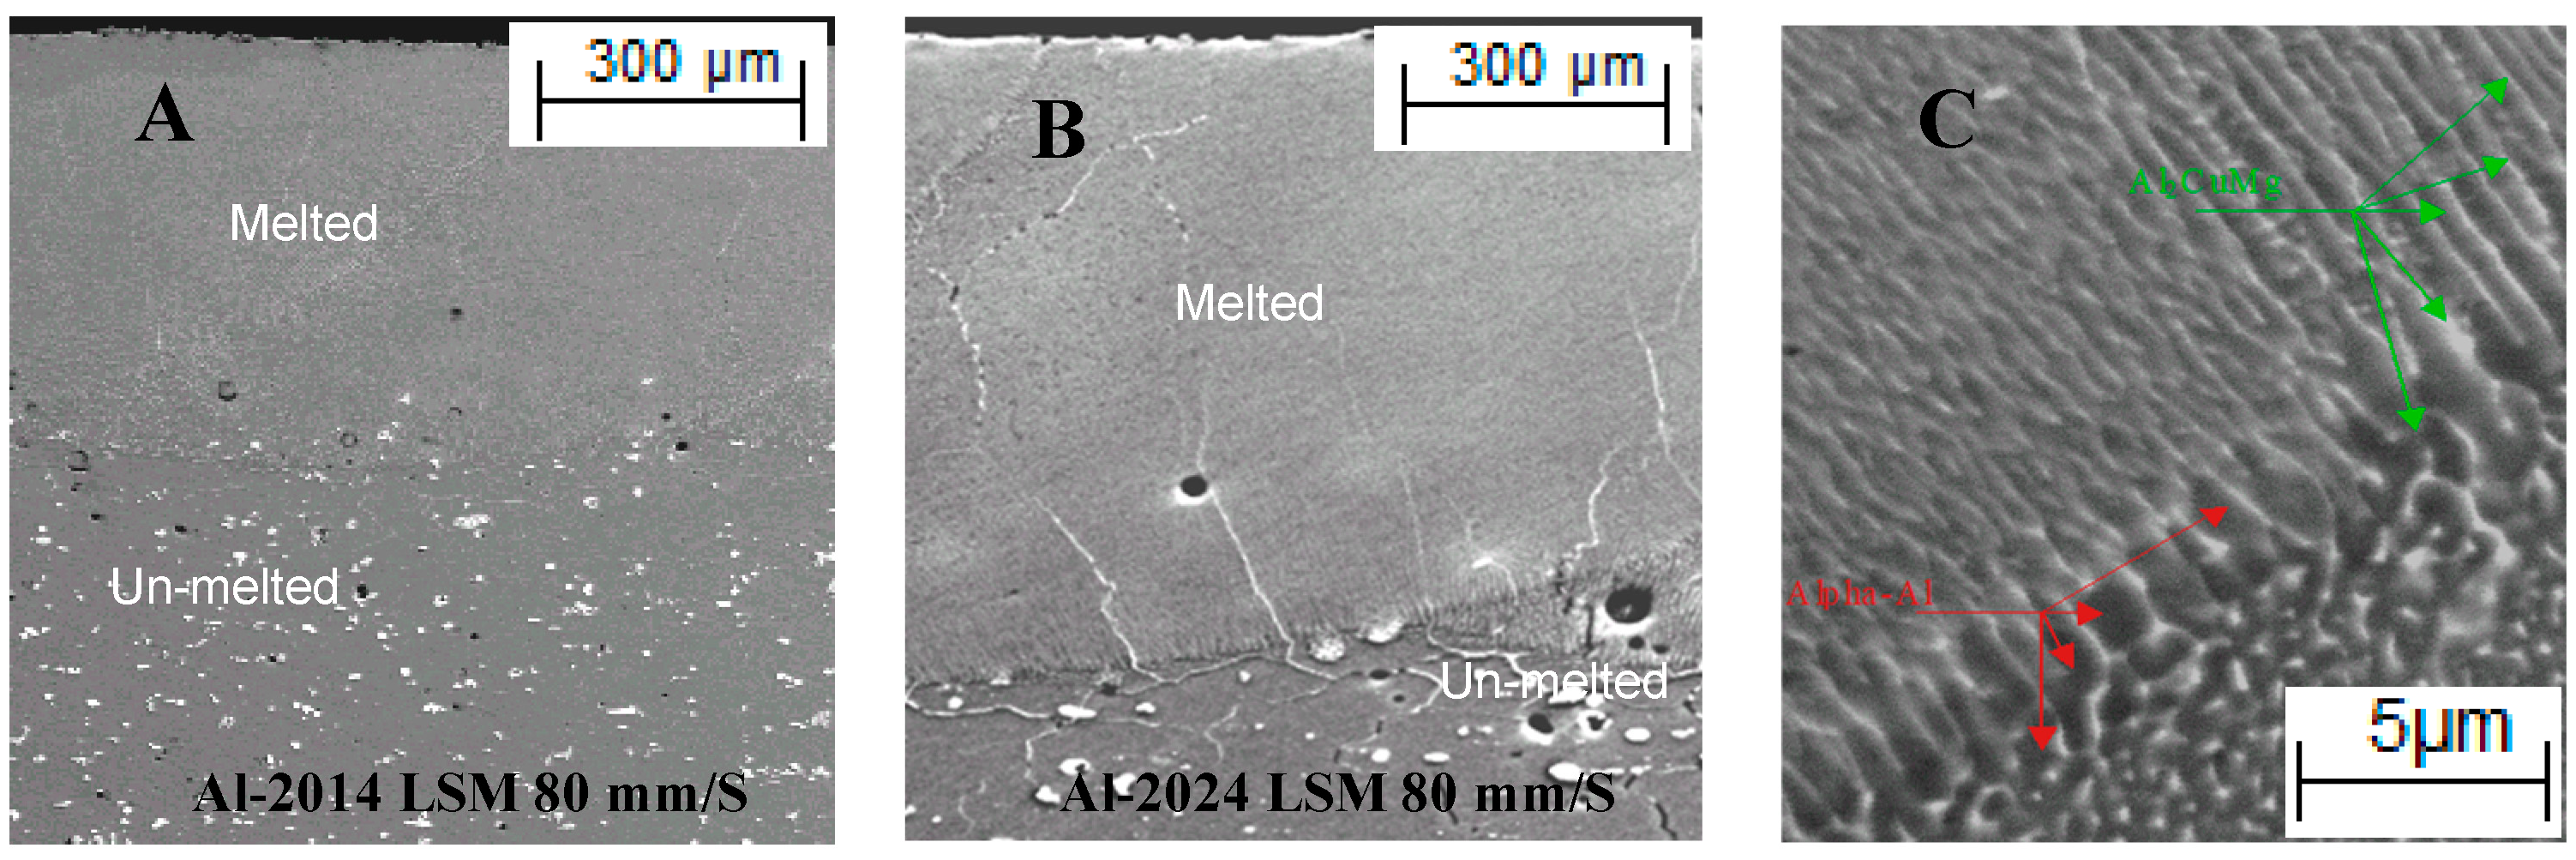
3.2. Microstructure Study
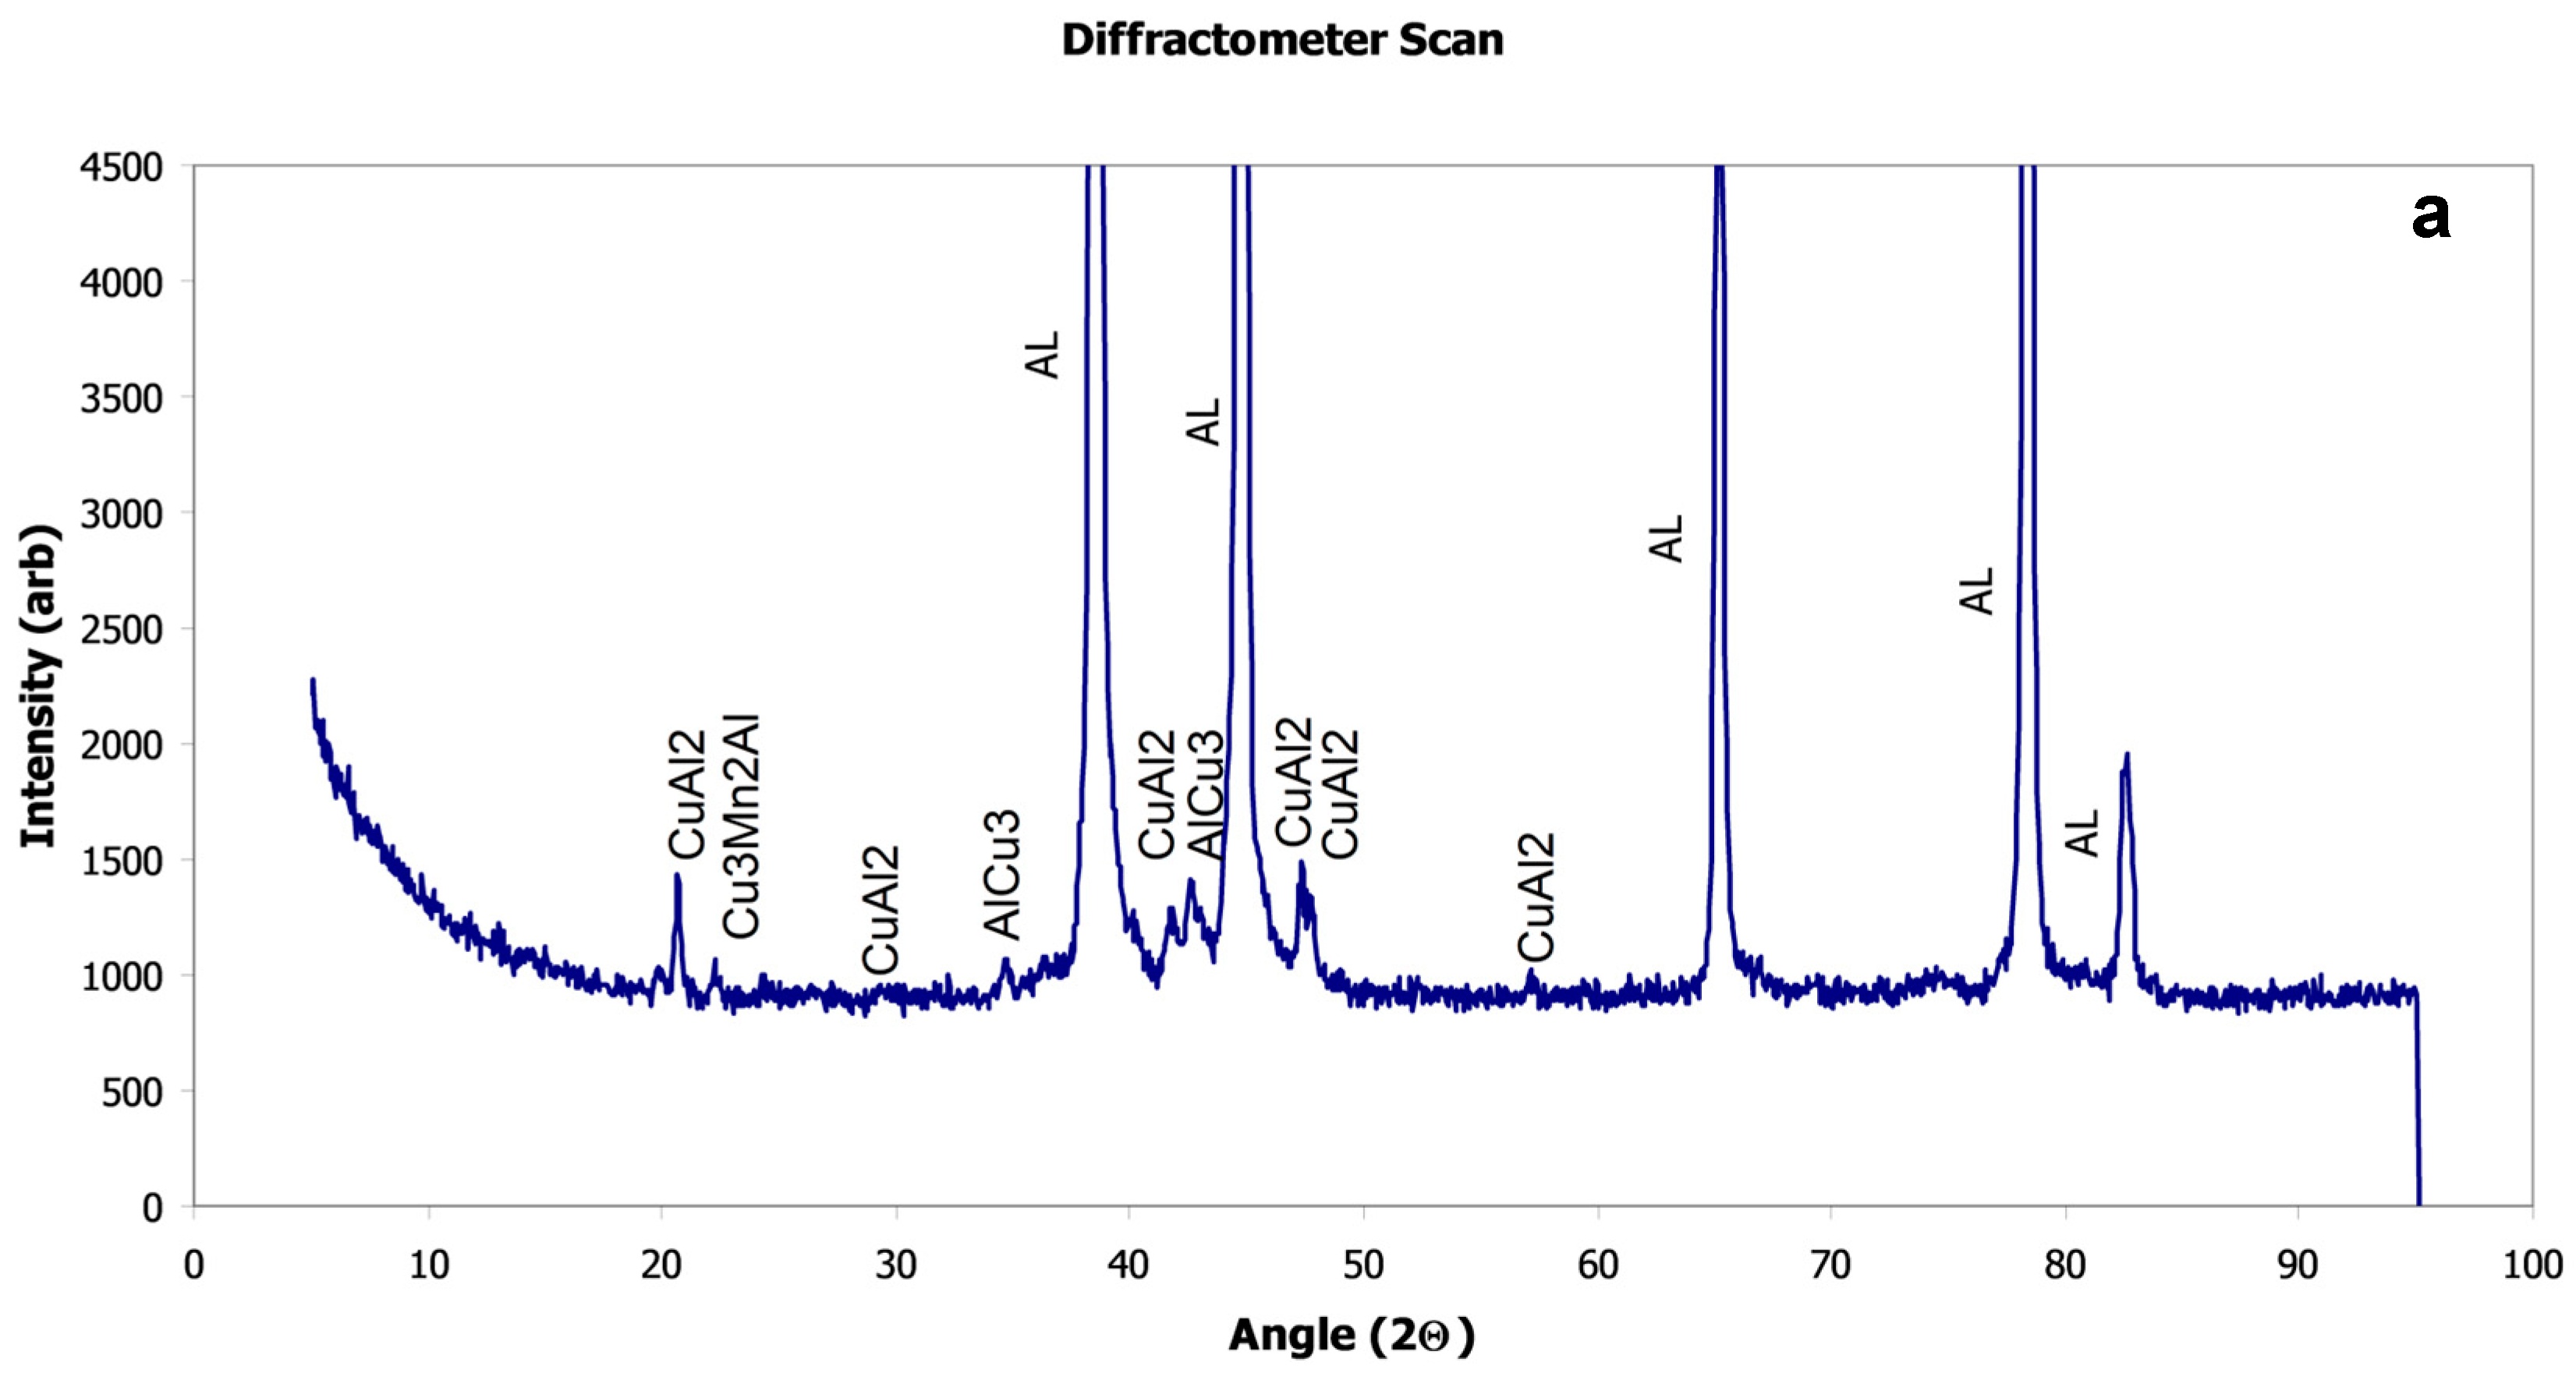
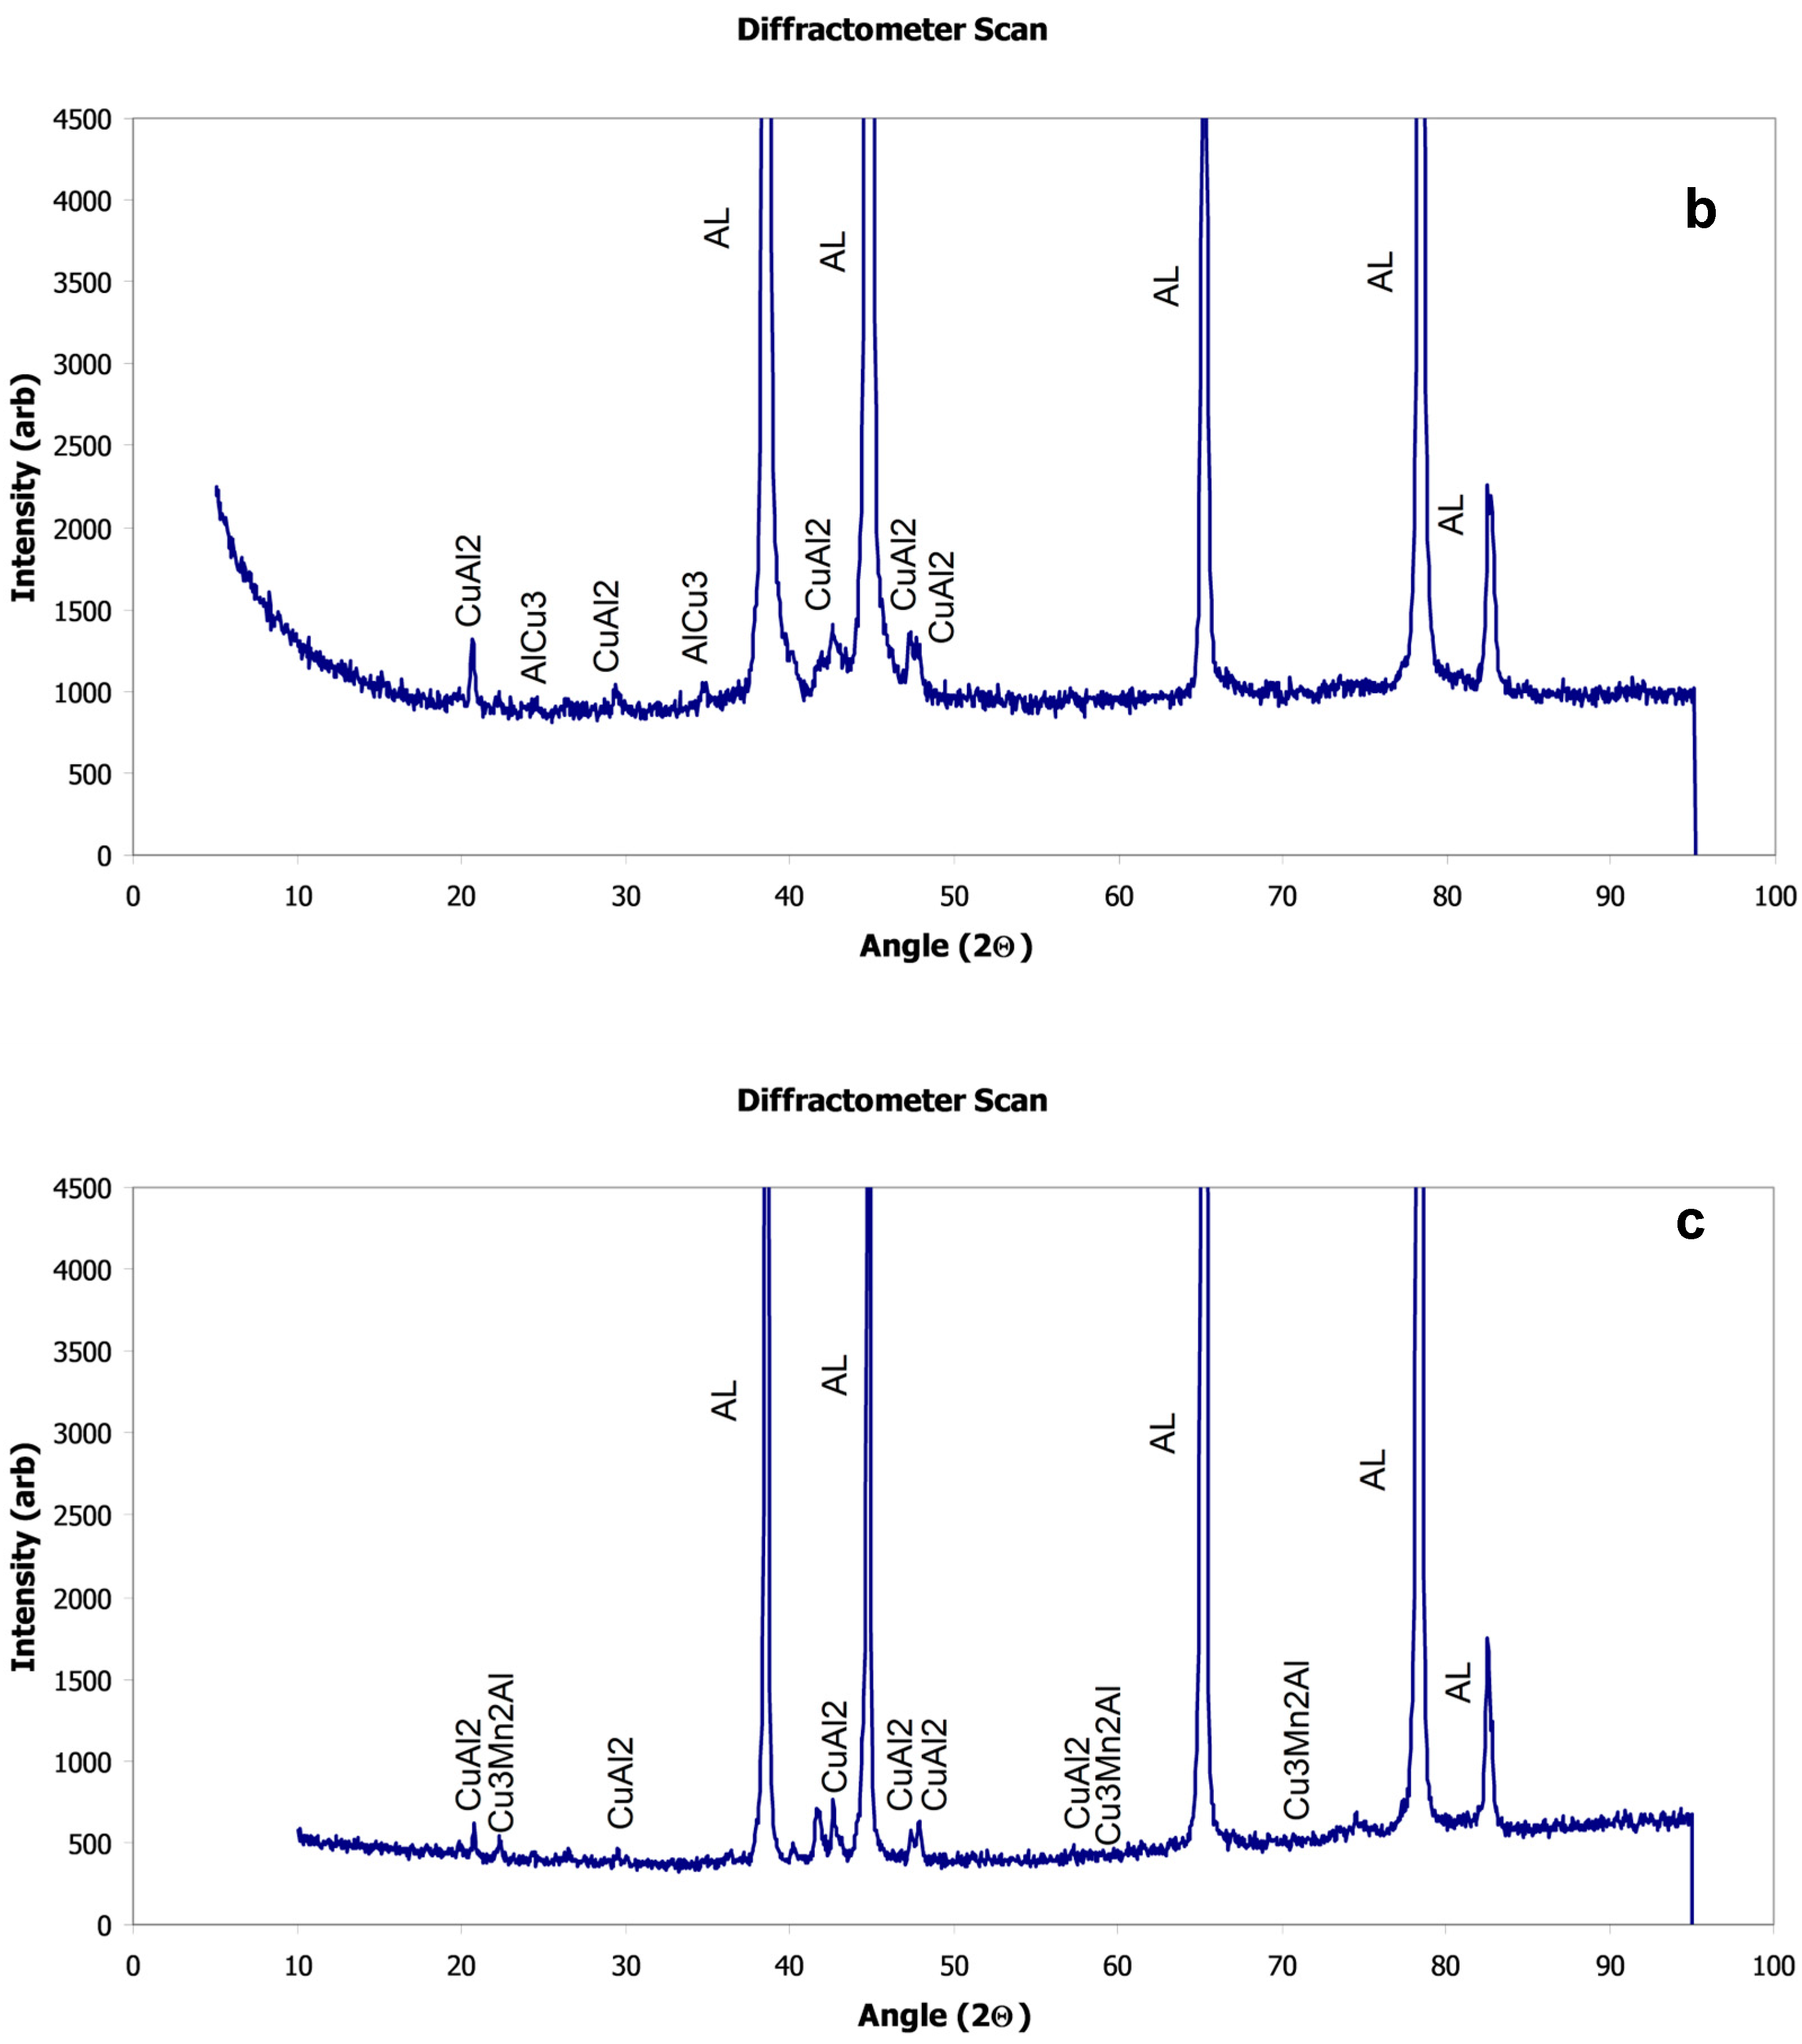
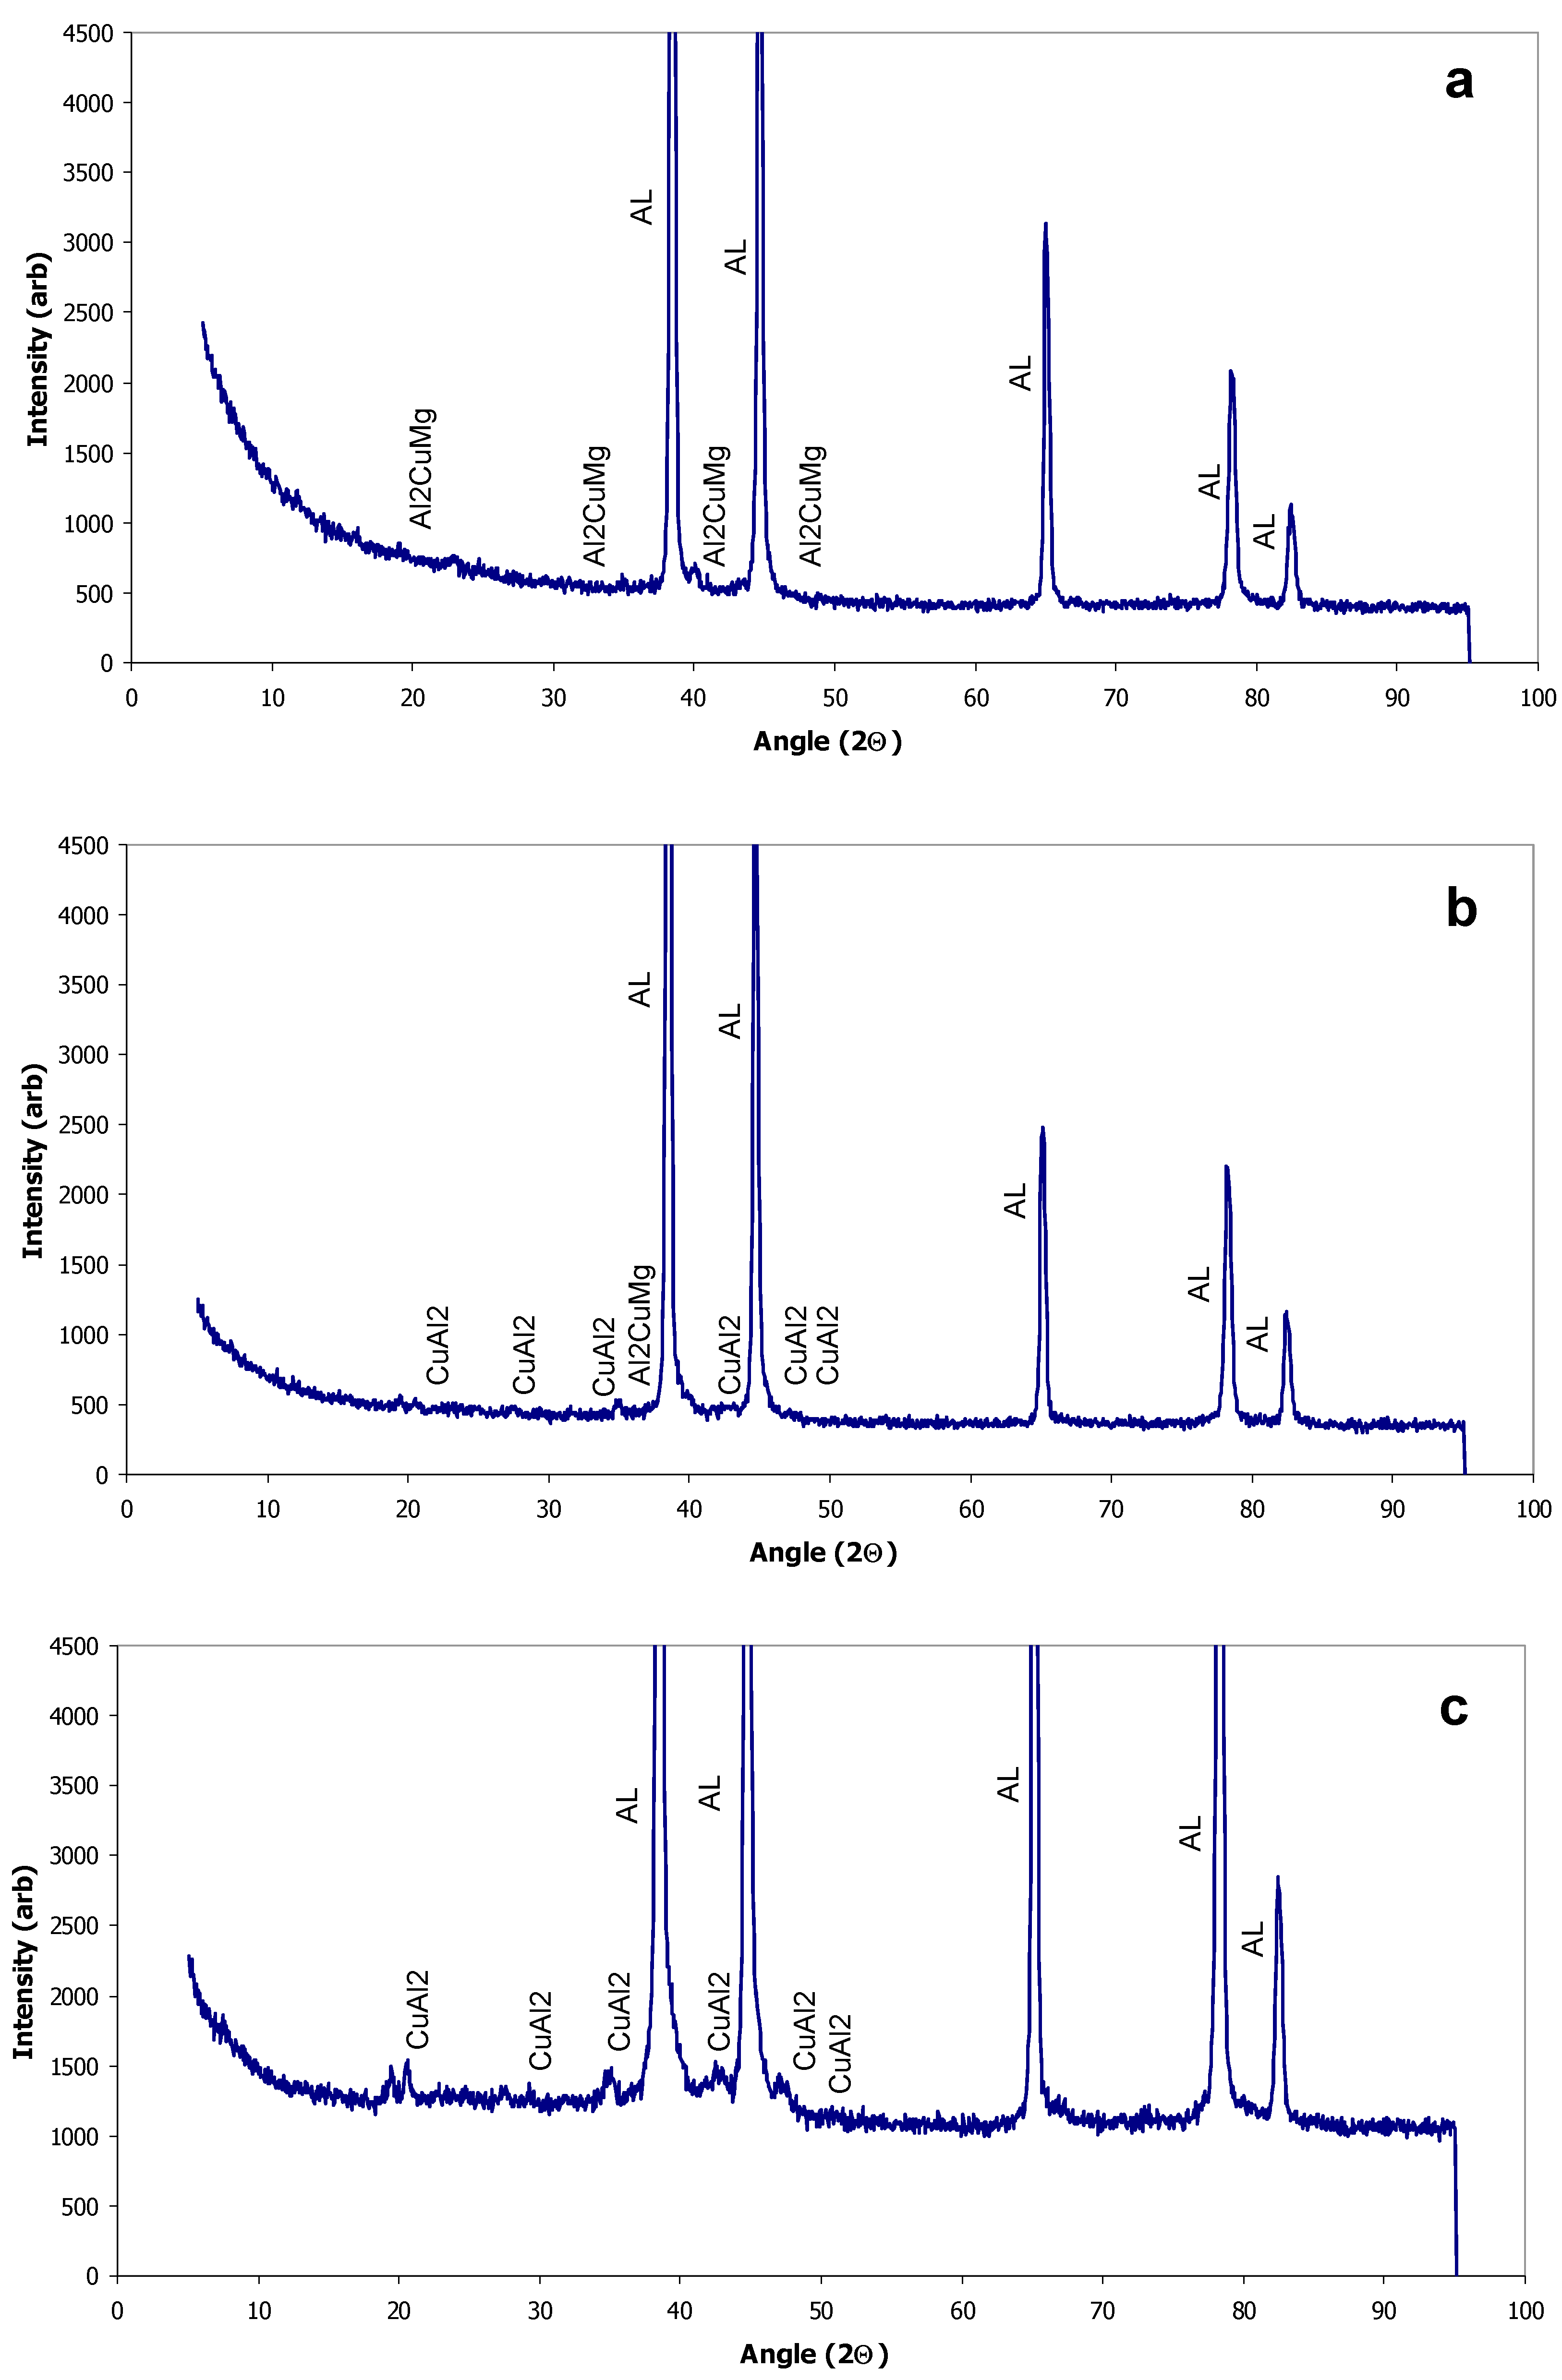
The microstructure of the as-received and laser-treated samples was studied by scanning electron microscopy, as shown in Figure 2. Irregular white color second-phase particles were observed all over the surface of both AR Al-2024 and AR Al-2014 alloys in Figure 2a,d. The micrograph also showed some black spots, which are the possible cause of second-phase removal during the grinding and polishing process. The gray phase was the main matrix, called the alpha phase, which has a restricted solubility of Cu ≈ 0.1 wt. % at room temperature and ≈ 4.8 wt. % around 550 °C. The energy dispersive analysis of the white phase reveals that the phase consists of Al2CuMg with the gray field as an alpha solid solution in the Al-2024 alloy, while it is AlCu2 in the Al-2014 alloy. The second-phase particles are homogenized with the laser surface melting, as shown from Figure 2b,e. The higher magnification micrographs show accumulation of fine white phases at the grain boundaries. The EDX spot analysis was carried out at melted and un-melted regions, as shown in Figure 3A for AA-2014, and Figure 3B for AA-2024 samples. The results extracted from EDX analysis are summarized in Table 6 and revealed that the melted region is rich in copper content. It is suggested that part of the second-phase particles in Al-2024 is re-melted with evaporation of some magnesium and accumulated at the grain boundaries, as shown in Figure 2b. The EDX analysis in Table 6 shows the region has low amount of magnesium in the melted region as compared to the un-melted region for the Al-2024 alloy. Furthermore, it is also expected that some amount of Cu moves into the matrix phase due to the higher solubility of Cu at higher temperatures. This causes an enriched α-matrix phase. The accumulation of second-phase particles around the grain boundaries was also observed in the Al-2014 alloy, as shown in Figure 2f. The phases before and after the laser surface treatment have not changed; hence, less change is expected in the matrix phase. The micrograph in Figure 3C at 2000 × shows dendritic structure around the bead overlapped region of the substrate. The dendritic structure is due to the fast cooling taking place in the bead overlapping region. The bright part of dendrite is the Cu-rich phase while the black interdendrimer is the Al-Cu alpha phase. The multiple overlap bead also shows cracks at a higher laser scan rate i.e., 150 mm/s. As shown in Figure 2c, these cracks are more pronounced in the Al-2024 alloy as compared to the Al-2014 alloy. The residual stress produced at a high scan speed was the main reason, while the more-pronounced cracks in the Al-2024 alloy sample were probably due to the instant heating and evaporation of Mg from the Al-2024 alloy. The idea is further supported by XRD results, which show less defined Mg-phase peaks.

X-Ray Diffraction

XRD was carried out to examine the phases exists in as-received and laser surface melting samples. The graphs taken from Al-2014 and Al-2024 are presented in Figure 4 and Figure 5. The XRD graph from the Al-2014 alloy in Figure 4a shows the CuAl2 and CuAl3 and intermetallic Cu3Mn2Al. The Cu2Al peak is visible around 20, 42, and 48 angle 2θ along with some traces at other locations. The major CuAl3 is visible around 38 and 44 angle 2θ. The Cu3Mn2Al was visible around 23 angle 2θ. The visibility of these peaks, i.e., peak height, is lowered and in some peaks is eliminated, as shown in Figure 4b,c, due to laser surface melting. The CuAl2 peak height is decreased in the LSM sample at a scan rate of 80 mm/s and is overcast in the LSM sample at a scan rate of 50 mm/s. The CuAl3 peak around 38 angle 2θ is fully eliminated in the sample laser scanned at 150 mm/s. It is also expected that the variation in phases exists due to different samples. The intermetallic Cu3Mn2Al that was fully eliminated in the sample at 80 mm/s shows few traces in the sample LSM at 150 mm/s.
The as-received sample of Al-2024, in Figure 5a, shows the major phase of AlCu2Mg along with sharp crystalline peaks of Al. The amount of Mg is limited to less than 2%; this amount is enough to form AlCu2Mg, but due to a low percentage, the phase peaks were not noticeably clear in XRD graph. Most of this phase vanished when the sample was laser-treated to 80 mm/s and 150 mm/s. The Mg phase transferred to the CuAl2 phase with the vaporization of Mg from the surface phases shown in the XRD graphs in Figure 5b,c. Mg vaporization is due to the low boiling point, i.e., 1107 °C, as compared to Al and Cu, which have a boiling temperature of 2467 °C and 2840 °C, respectively. The laser-treated sample is also expected to have an enriched matrix phase due to high Cu solubility at elevated temperatures. It can be summarized from the XRD graphs that phase largely changes due to the fast heating and cooling cycle of laser surface melting. The phases containing a low boiling temperature constituent disappeared, and the excess amount of Cu is readjusted in the formation of new phases alongside the enrichment of Cu in the matrix phase.

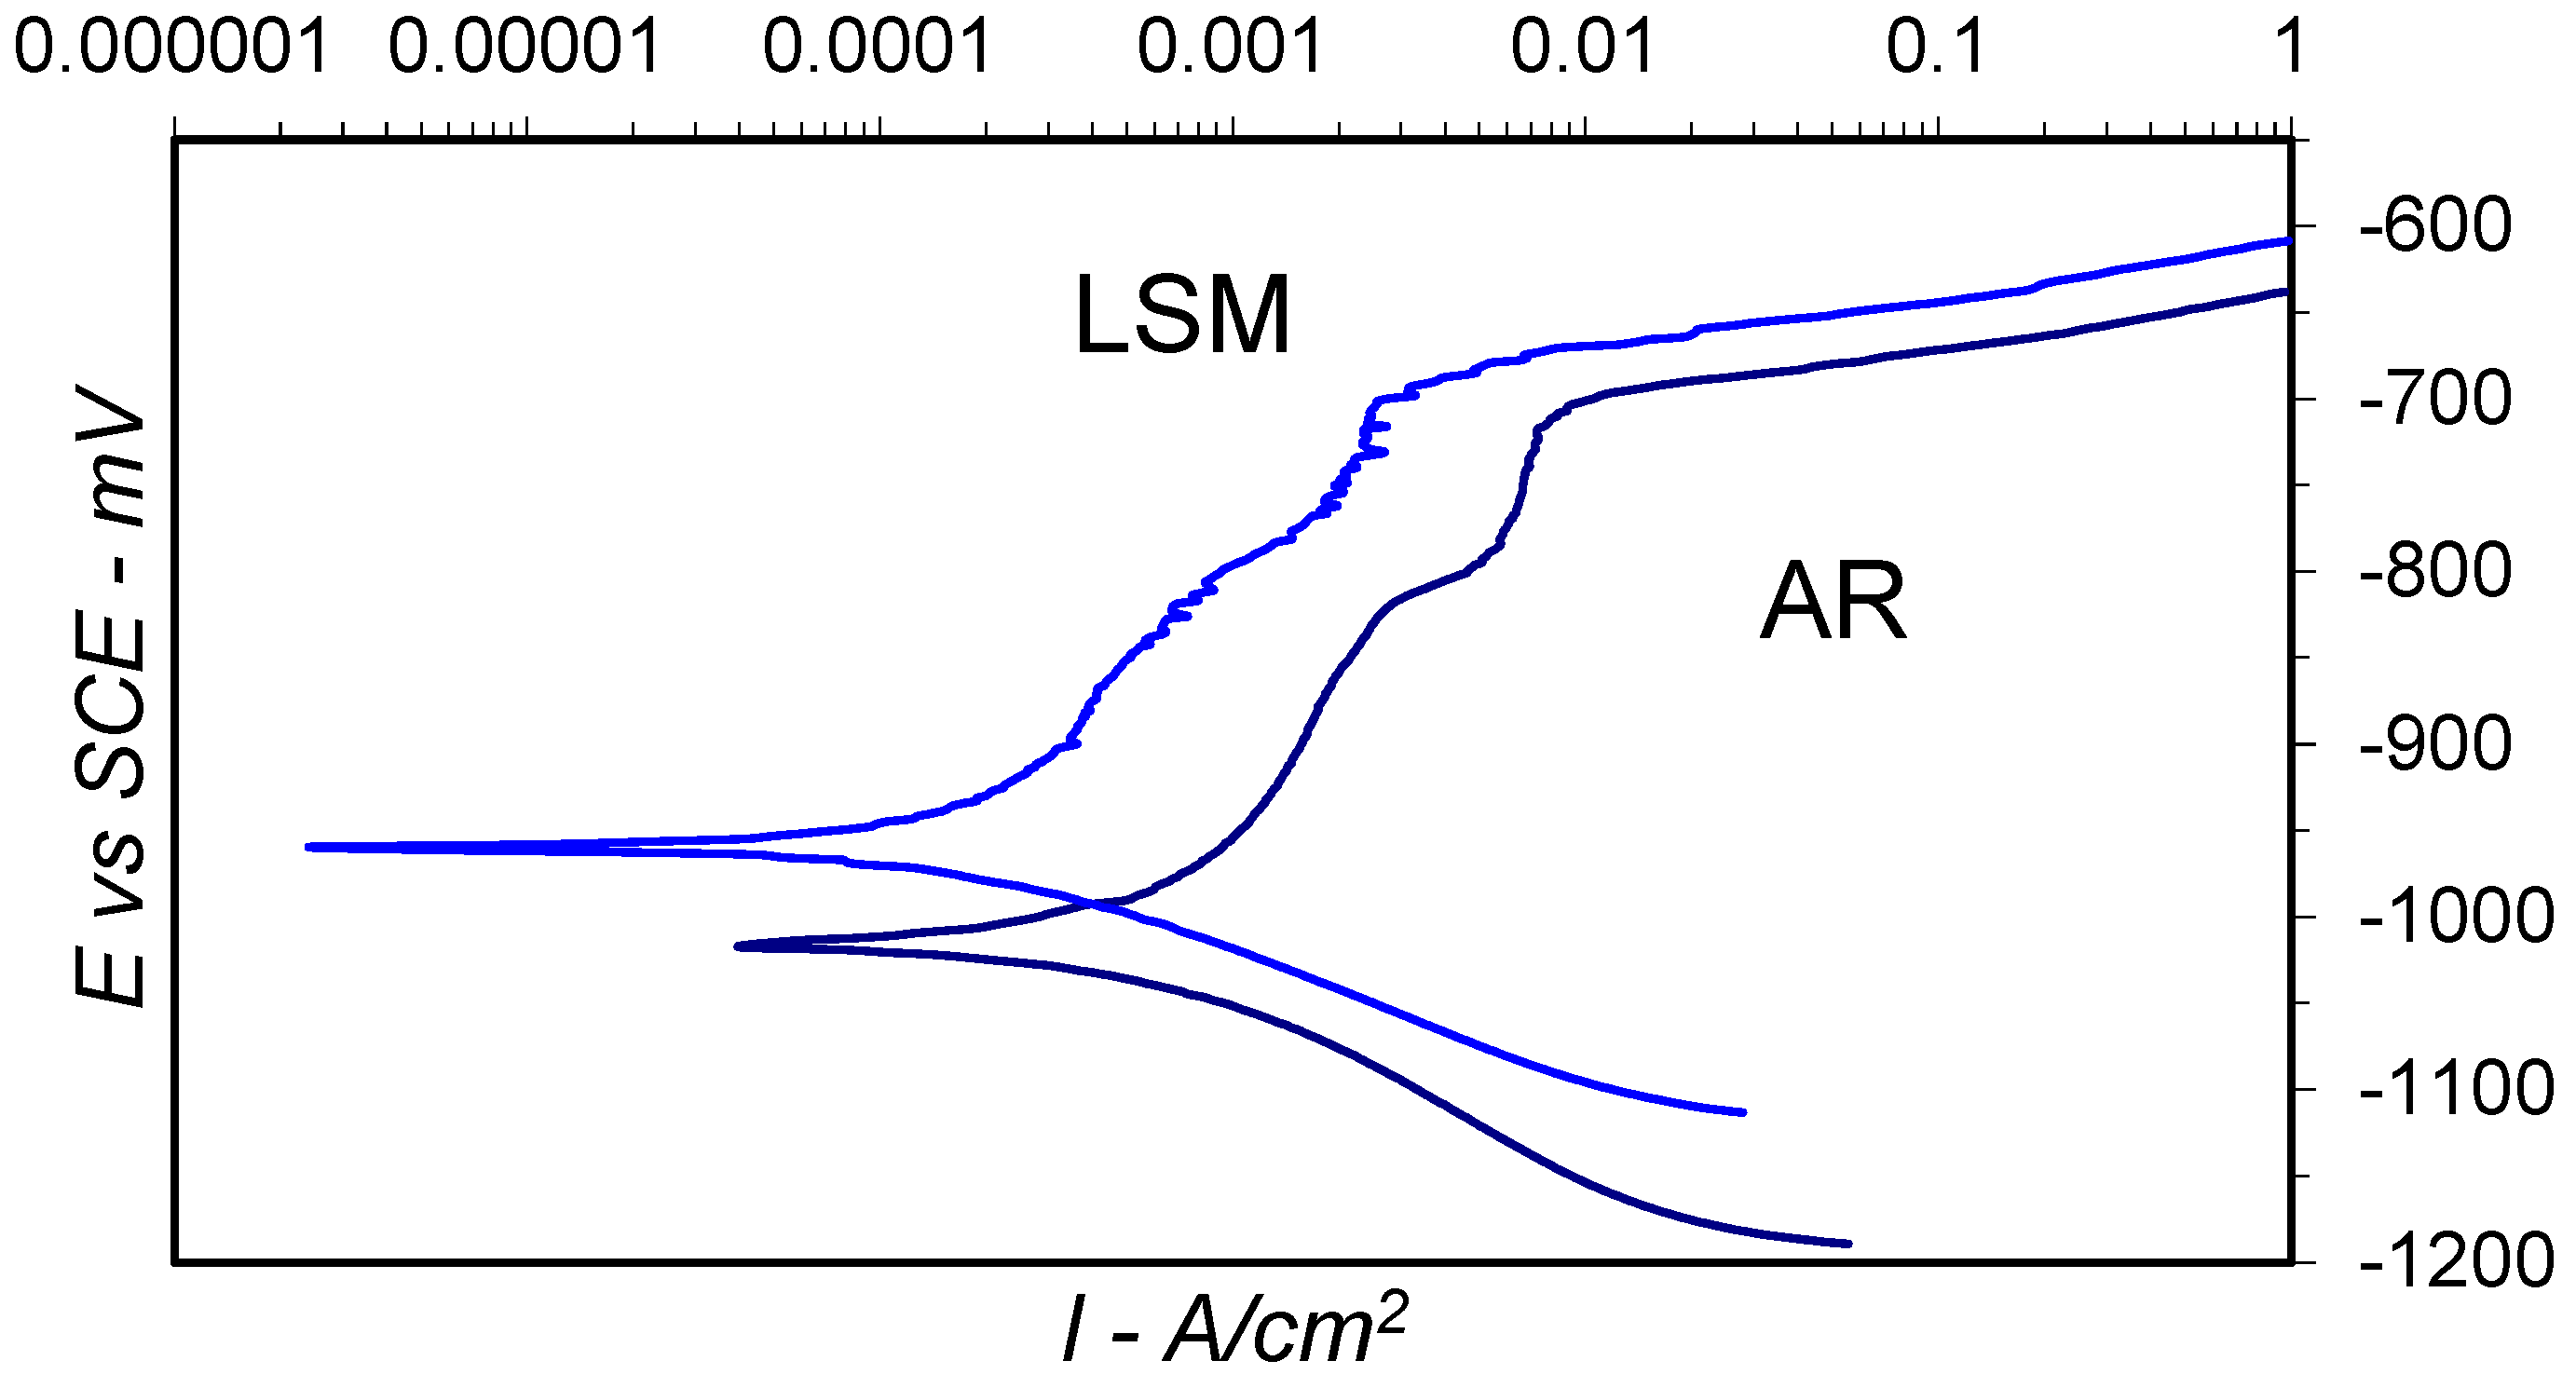
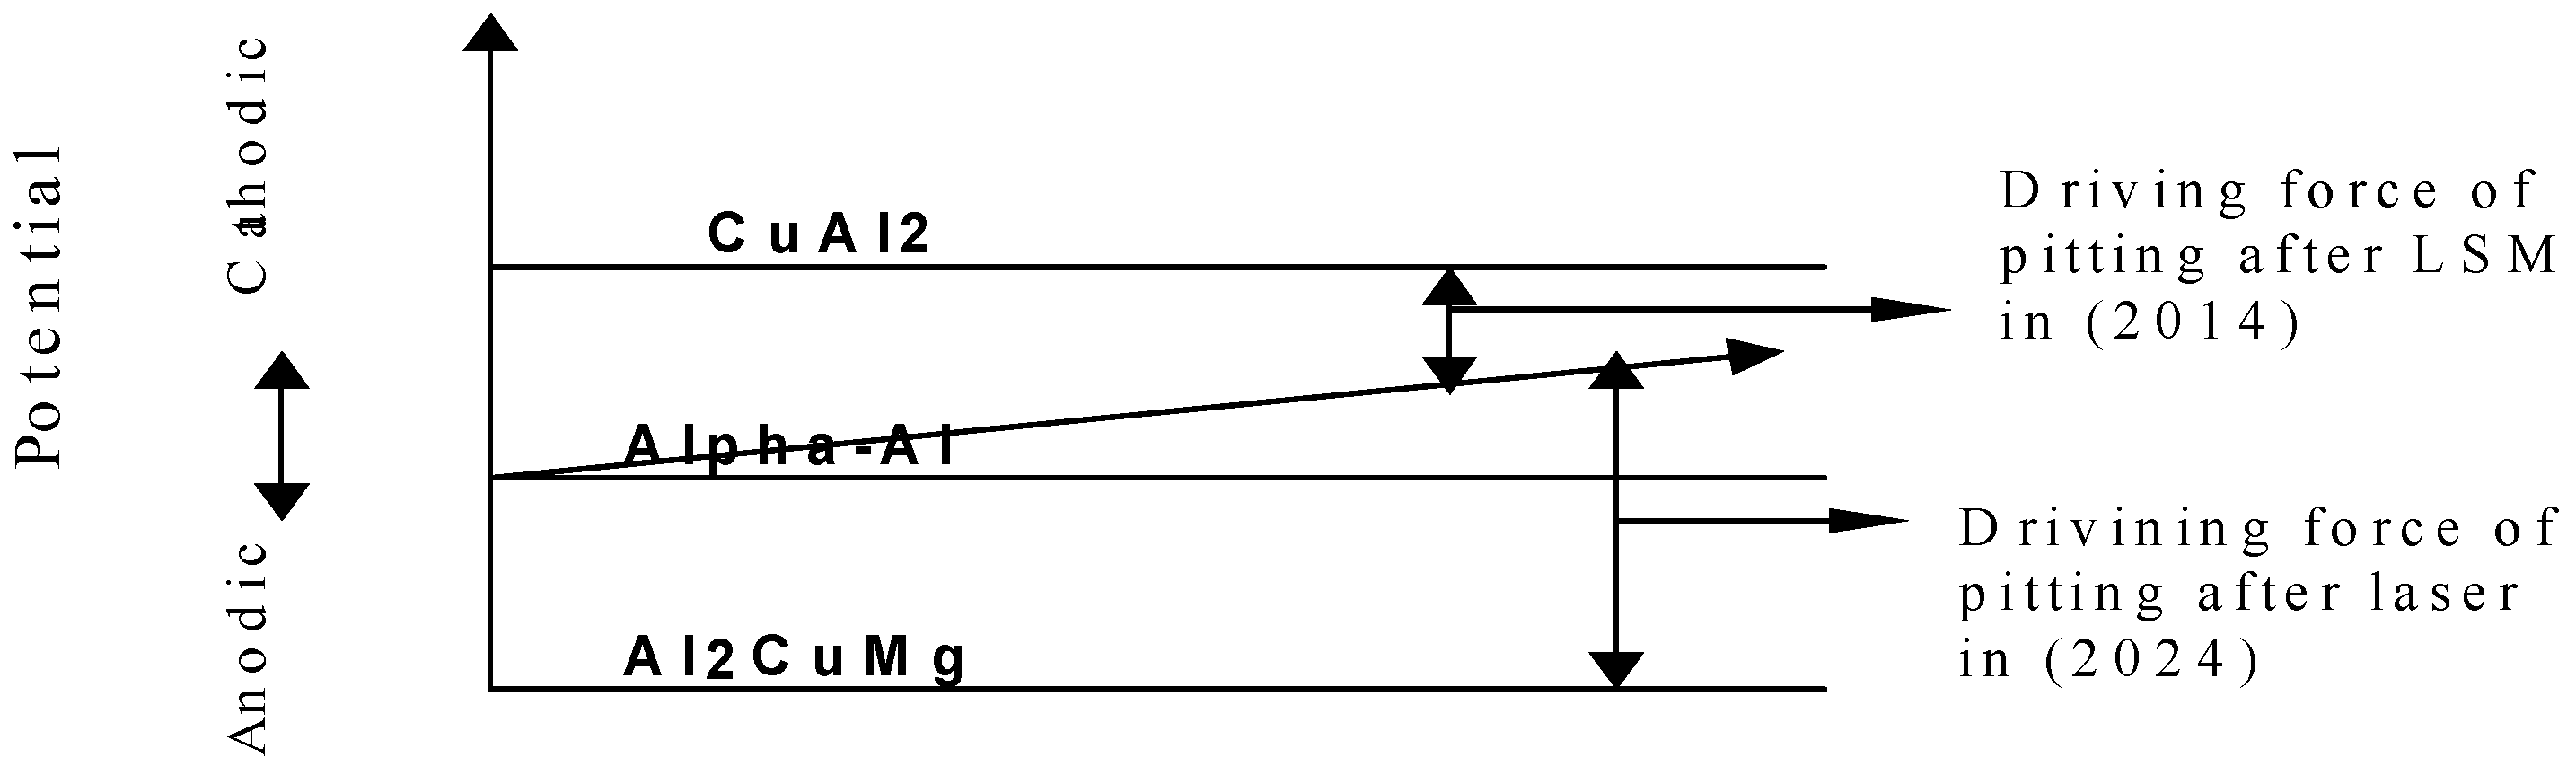
3.3. Electrochemical Testing

Figure 6 and Figure 7 show the anodic polarization curves for AR Al-2024 and LSM Al-2014 alloys at a laser scan rate of 80 mm/s and 50% bead overlap in the transverse direction. The results extracted from the polarization curves are summarized in Table 7. The Ecorr of the Al-2014 was measured −1017 mV as −1029 mV for the Al-2024 sample. The Ecorr is the net voltage on the surface due to anodic and cathodic reactions on the surface driven by external potential. Both alloys have approximately the same amount of Cu, the major constituent of the cathodic reaction. The slight variation is probably due to the availability of distinct phases at the reacting surfaces. The Ecorr of the LSM-2014 alloy shifted to a positive direction (−960 mV), while the Ecorr of the LSM-2024 alloy shifted to a negative direction (−1072 mV). As there is no appreciable phase change taking place in the Al-2014 alloy due to the LSM, the positive shift in potential is attributed to distribution of second-phase particles. The negative potential shift in Al-2024 is probably due to diminishing of the Al2CuMg phase. The phase converts into a electrochemically more active phase (CuAl2), which causes an overall shift of the Ecorr to a negative direction. The current density is an indicator of the corrosion rate. Although uniform corrosion is not such a crucial factor in Al-alloys corrosion, it still gives some indication about the rate of corrosion. The corrosion takes place at a faster rate on the Al-2024 alloy as compared to the Al-2014 alloy due to the presence of the Al2CuMg anodic phase. A decrease in the current density occurs due to laser surface melting, which is attributed to homogenization and dispersion of the phases in the sample surface. The decrease in the current density is more in the Al-2014 alloy (3.02 A/cm2) as compared to the Al-2024 alloy (2.67 A/cm2).
The Al-2024 alloy shows an extra hump from −800 mV to −700 mV before reaching the pitting potential in Figure 6. The potential where the current magnitude is enough to propagate pit. This hump is believed to be due to localized corrosion at the Mg-rich phase in the Al-2024 alloy. Once oxidation of this phase is completed, the matrix phase starts forming a uniform oxidation layer. The breakdown of the layer causes the pit to propagate. The sample was laser-treated and so was this hump, but its appearance is not as clear as that of the AR-sample. This indicates the Mg-rich phase still exists but of finer size and accumulated around the grain boundaries. Due to the small particle size, a metastable behavior appears where current momentarily increases before decreasing, indicating pit formation and passivation.
Figure 7 shows that the pitting potential for AR-2014 was measured as −708 mV, while for LSM-2014, it was measured as −679 mV, this means the pitting potential of the 2014 alloy is increased 29 mV. The pitting potential of the AR-2024 alloy was measured as −633 mV as against −678 mV for the LSM sample. This indicates that the pitting potential appears 45 mV earlier than the AR sample. The decrease in pitting potential of the Al-2014 alloy and increase in pitting potential of the Al-2024 alloy can partially be related to the second-phase refinement, but a major cause of this behavior is believed to be enrichment of the matrix phase.
These changes can be explained by the schematic given in Figure 8. The y-axis shows the potential, and X-axis is considered a parallel representation of phases. Moving from bottom of the schematic to the top phases is cathodic to anodic. The α-Al is cathodic to second-phase Al2CuMg Al-2024 and anodic to second-phase Al2Cu Al-2014. Increasing the amount of copper in the alpha phase makes it more cathodic as copper is less active than aluminum. Increasing the Cu content in the alpha phase makes it more cathodic as compared to the AR sample. The move toward Al2Cu means decreasing the potential drive between the alpha matrix phase and second-phase Al2Cu. The decrease in driving potential between phases means less susceptibility to pitting. Contrary to this, in the Al-2024 alloy, the potential drive between second-phase Al2CuMg and the enriched alpha phase increases, hence making it more susceptible to pitting.

4. Conclusions

The fast heating and cooling cycle of the LSM process produces physical and microstructural phase changes in Al-Cu alloys. The low laser scan rate makes adsorbed gases release and become porous at the bead contour while the high laser scan rate causes the formation of cracks. The fast heating and cooling cycles cause the production of a dendritic phase and a fine second phase accumulates around the dendrite boundaries. Furthermore, in the Al-2024 alloy, the Al2CuMg phase diminishes after laser surface treatment with the formation of some Al2Cu phases. There were no appreciable phase changes found in the Al-2014 alloy. Phase changes and particle refining only partially contribute to improving the pitting performance of the Al-2024 alloy, while the enrichment of Cu in the matrix phase at elevated temperatures is the major contributor to improving pitting performance.

Author Contributions

Methodology, A.N. and M.M.A.A.; Formal analysis, A.N.; Resources, M.M.A.A.; Data curation, M.M.A.A.; Writing—original draft, A.N. All authors have read and agreed to the published version of the manuscript.

Funding

This work was supported by the Deanship of Scientific Research, Vice Presidency for Graduate Studies and Scientific Research, King Faisal University, Saudi Arabia [Grant No. KFU250244].

Institutional Review Board Statement

Not applicable.

Informed Consent Statement

Not applicable.

Data Availability Statement

The original contributions presented in this study are included in the article. Further inquiries can be directed to the corresponding authors.

Conflicts of Interest

The authors declare no conflict of interest.

References

  1. Zhu, H.; Li, J. Advancements in corrosion protection for aerospace aluminum alloys through surface treatment. Int. J. Electrochem. Sci. 2024, 19, 100487. [Google Scholar] [CrossRef]
  2. Li, S.S.; Yue, X.; Li, Q.Y.; Peng, H.L.; Dong, B.X.; Liu, T.S.; Yang, H.Y.; Fan, J.; Shu, S.L.; Qiu, F.; et al. Development and applications of aluminum alloys for aerospace industry. J. Mater. Res. Technol. 2023, 27, 944–983. [Google Scholar] [CrossRef]
  3. Sarker, S.; Haque, M.S.; Alvy, M.S.A.; Abir, M.M.H. The effects of solution heat treatment on the microstructure and hardness of an aluminum-4% copper alloy with added nickel and tin. J. Alloys Metall. Syst. 2023, 4, 100042. [Google Scholar] [CrossRef]
  4. Ikeuba, A.I.; Njoku, C.N.; Ekerenam, O.O.; Njoku, D.I.; Udoh, I.I.; Daniel, E.F.; Uzoma, P.C.; Etim, I.-I.N.; Okonkwo, B.O. A review of the electrochemical and galvanic corrosion behavior of important intermetallic compounds in the context of aluminum alloys. RSC Adv. 2024, 14, 31921–31953. [Google Scholar] [CrossRef]
  5. Sabry, I. Exploring the effect of friction stir welding parameters on the strength of AA2024 and A356-T6 aluminum alloys. J. Alloys Metall. Syst. 2024, 8, 100124. [Google Scholar] [CrossRef]
  6. Neuß, D.; McCarroll, I.E.; Zhang, S.; Woods, E.; Delis, W.J.; Tanure, L.; Springer, H.; Sandlöbes, S.; Yang, J.; Todorova, M.; et al. High-resolution chemical and structural characterization of the native oxide scale on a Mg-based alloy. Corros. Sci. 2024, 227, 111776. [Google Scholar] [CrossRef]
  7. Schneider, M.; Liebmann, T.; Langklotz, U.; Michaelis, A. Microelectrochemical investigation of anodic oxide formation on the aluminum alloy AA2024. Electrochim. Acta 2017, 249, 198–205. [Google Scholar] [CrossRef]
  8. Xu, J.; Song, Y.; He, K.; Zhang, H.; Dong, K.; Cai, Y.; Han, E.-H. Role of oxidants in the anodic oxidation of 2024 aluminum alloy by dominating anodic and cathodic processes. Colloids Surf. A Physicochem. Eng. Asp. 2024, 703, 135229. [Google Scholar] [CrossRef]
  9. Jian-jun, Y.; Shi-yang, Y.; Cai-he, F.; Ling, O.; Jia-hu, W.; Hai, P.; Bo-wen, W.; Deng, L.; Shi-yun, D.; Zai-yu, Z. Effect of voltage on structure and properties of 2024 aluminum alloy surface anodized aluminum oxide films. Surf. Coat. Technol. 2024, 479, 130508. [Google Scholar] [CrossRef]
  10. Erdemir, F.; Canakci, A.; Varol, T.; Ozkaya, S. Corrosion and wear behavior of functionally graded Al2024/SiC composites produced by hot pressing and consolidation. J. Alloys Compd. 2015, 644, 589–596. [Google Scholar] [CrossRef]
  11. Luo, C.; Albu, S.P.; Zhou, X.; Sun, Z.; Zhang, X.; Tang, Z.; Thompson, G.E. Continuous and discontinuous localized corrosion of a 2xxx aluminium–copper–lithium alloy in sodium chloride solution. J. Alloys Compd. 2016, 658, 61–70. [Google Scholar] [CrossRef]
  12. Chiu, L.-H.; Tsai, C.-Y.; Chen, K.-H.; Hu, C.-J.; Chang, H. Effect of Coarse Second-Phase Particles on Galvanic Corrosion of Anodized 6061 Aluminum Alloy Coupled with C1100 Copper. Int. J. Electrochem. Sci. 2015, 10, 6572–6585. [Google Scholar] [CrossRef]
  13. Musa, A.Y.; Mohamad, A.B.; Kadhum, A.A.H.; Chee, E.P. Galvanic Corrosion of Aluminum Alloy (Al2024) and Copper in 1.0 M Nitric Acid. Int. J. Electrochem. Sci. 2011, 6, 5052–5065. [Google Scholar] [CrossRef]
  14. Williams, G.; Coleman, A.J.; McMurray, H.N. Inhibition of Aluminium Alloy AA2024-T3 pitting corrosion by copper complexing compounds. Electrochim. Acta 2010, 55, 5947–5958. [Google Scholar] [CrossRef]
  15. Wang, Z.; Qian, H.; Chang, W.; Yu, Z.; Qiao, Q.; Zhou, M.; Guo, D.; Zhang, D.; Kwok, C.T.; Tam, L.M. Microstructure and localized corrosion properties of 2219 aluminum alloy manufactured by additive friction stir deposition. Corros. Sci. 2024, 240, 112508. [Google Scholar] [CrossRef]
  16. Pinto, M.A.; Cheung, N.; Ierardi, M.C.F.; Garcia, A. Microstructural and hardness investigation of an aluminum–copper alloy processed by laser surface melting. Mater. Charact. 2003, 50, 249–253. [Google Scholar] [CrossRef]
  17. Vivas, J.; Aldanondo, E.; Dufour, P.; Delgado, C.; Fernández-Calvo, A.I. Laser beam welding of T joints for aluminum–Copper–lithium aircraft panels: Effect of filler wire on recyclability and weldability. J. Mater. Res. Technol. 2024, 33, 5809–5820. [Google Scholar] [CrossRef]
  18. Cheng, M.; Luo, G.; Xiao, X.; Song, L. Microstructure evolution of pulsed laser melting 2219 aluminum alloy: Solidification modes and inter-pulse thermal cycles. Mater. Lett. 2022, 313, 131768. [Google Scholar] [CrossRef]
  19. Stoica, A.-I.; Światowska, J.; Romaine, A.; Di Franco, F.; Qi, J.; Mercier, D.; Seyeux, A.; Zanna, S.; Marcus, P. Influence of post-treatment time of trivalent chromium protection coating on aluminium alloy 2024-T3 on improved corrosion resistance. Surf. Coat. Technol. 2019, 369, 186–197. [Google Scholar] [CrossRef]
  20. Trinidad, C.; Światowska, J.; Zanna, S.; Seyeux, A.; Mercier, D.; Viroulaud, R.; Marcus, P. Effect of surface preparation treatments on copper enrichment on 2024 aluminium alloy surface. Appl. Surf. Sci. 2021, 560, 149991. [Google Scholar] [CrossRef]
  21. Boag, A.; Hughes, A.E.; Glenn, A.M.; Muster, T.H.; McCulloch, D. Corrosion of AA2024-T3 Part I: Localised corrosion of isolated IM particles. Corros. Sci. 2011, 53, 17–26. [Google Scholar] [CrossRef]
  22. Hughes, A.E.; Boag, A.; Glenn, A.M.; McCulloch, D.; Muster, T.H.; Ryan, C.; Luo, C.; Zhou, X.; Thompson, G.E. Corrosion of AA2024-T3 Part II: Co-operative corrosion. Corros. Sci. 2011, 53, 27–39. [Google Scholar] [CrossRef]
  23. Birbilis, N.; Zhu, Y.M.; Kairy, S.K.; Glenn, M.A.; Nie, J.F.; Morton, A.J.; Gonzalez-Garcia, Y.; Terryn, H.; Mol, J.M.C.; Hughes, A.E. A closer look at constituent induced localised corrosion in Al-Cu-Mg alloys. Corros. Sci. 2016, 113, 160–171. [Google Scholar] [CrossRef]
  24. Hashimoto, T.; Zhang, X.; Zhou, X.; Skeldon, P.; Haigh, S.J.; Thompson, G.E. Investigation of dealloying of S phase (Al2CuMg) in AA 2024-T3 aluminium alloy using high resolution 2D and 3D electron imaging. Corros. Sci. 2016, 103, 157–164. [Google Scholar] [CrossRef]
  25. Idrac, J.; Mankowski, G.; Thompson, G.; Skeldon, P.; Kihn, Y.; Blanc, C. Galvanic corrosion of aluminium–copper model alloys. Electrochim. Acta 2007, 52, 7626–7633. [Google Scholar] [CrossRef]
  26. Blanc, C.; Freulon, A.; Lafont, M.-C.; Kihn, Y.; Mankowski, G. Modelling the corrosion behaviour of Al2CuMg coarse particles in copper-rich aluminium alloys. Corros. Sci. 2006, 48, 3838–3851. [Google Scholar] [CrossRef]
  27. Zhu, D.; van Ooij, W.J. Corrosion protection of AA 2024-T3 by bis-[3-(triethoxysilyl)propyl]tetrasulfide in sodium chloride solution.: Part 2: Mechanism for corrosion protection. Corros. Sci. 2003, 45, 2177–2197. [Google Scholar] [CrossRef]
  28. Cornette, P.; Zanna, S.; Seyeux, A.; Costa, D.; Marcus, P. The native oxide film on a model aluminium-copper alloy studied by XPS and ToF-SIMS. Corros. Sci. 2020, 174, 108837. [Google Scholar] [CrossRef]
  29. Mei, L.; Chen, X.P.; Wang, C.; Xie, J.; Liu, Q. Good combination of strength and corrosion resistance in an Al-Cu-Mg alloy processed by a short-cycled thermomechanical treatment. Mater. Charact. 2021, 181, 111469. [Google Scholar] [CrossRef]
  30. Liu, X.Y.; Li, M.J.; Gao, F.; Liang, S.X.; Zhang, X.L.; Cui, H.X. Effects of aging treatment on the intergranular corrosion behavior of Al–Cu–Mg–Ag alloy. J. Alloys Compd. 2015, 639, 263–267. [Google Scholar] [CrossRef]
  31. Qi, H.; Liu, X.Y.; Liang, S.X.; Zhang, X.L.; Cui, H.X.; Zheng, L.Y.; Gao, F.; Chen, Q.H. Mechanical properties and corrosion resistance of Al–Cu–Mg–Ag heat-resistant alloy modified by interrupted aging. J. Alloys Compd. 2016, 657, 318–324. [Google Scholar] [CrossRef]
  32. Kurmanaeva, L.; Topping, T.D.; Wen, H.; Sugahara, H.; Yang, H.; Zhang, D.; Schoenung, J.M.; Lavernia, E.J. Strengthening mechanisms and deformation behavior of cryomilled Al–Cu–Mg–Ag alloy. J. Alloys Compd. 2015, 632, 591–603. [Google Scholar] [CrossRef]
  33. Qin, J.; Zhao, W.; Yan, Z.; Wang, R.; Yu, Z.; Shi, Z.; Liu, C.; Wang, B. Intergranular corrosion and stress corrosion cracking properties evaluation and mechanism study of multi-microalloyed 2519 Al alloy. Corros. Sci. 2024, 236, 112288. [Google Scholar] [CrossRef]
  34. Galvele, J.R.; de De Micheli, S.M. Mechanism of intergranular corrosion of Al-Cu alloys. Corros. Sci. 1970, 10, 795–807. [Google Scholar] [CrossRef]
  35. Wang, X.; Li, G.; He, Q.; Xiao, E.; Jiang, J.; Shao, W.; Zhen, L. Hydrogen trapping and embrittlement susceptibility in Al-Cu-Li alloys. Corros. Sci. 2024, 226, 111628. [Google Scholar] [CrossRef]
  36. Kamoutsi, H.; Haidemenopoulos, G.; Bontozoglou, V.; Pantelakis, S. Corrosion-induced hydrogen embrittlement in aluminum alloy 2024. Corros. Sci. 2006, 48, 1209–1224. [Google Scholar] [CrossRef]
  37. Embuka, D.; Coy, A.E.; Hernandez-Barrios, C.A.; Viejo, F.; Liu, Z. Thermal stability of excimer laser melted films formed on the AA2024-T351 aluminium alloy: Microstructure and corrosion performance. Surf. Coat. Technol. 2017, 313, 214–221. [Google Scholar] [CrossRef]
  38. Bonelli, M.; Miotello, A.; Mosaner, P. Morphological changes induced on aluminum surfaces by excimer laser irradiation. Appl. Surf. Sci. 2002, 186, 211–215. [Google Scholar] [CrossRef]
  39. Guillaumin, V.; Mankowski, G. Localized corrosion of 2024 T351 aluminium alloy in chloride media. Corros. Sci. 1998, 41, 421–438. [Google Scholar] [CrossRef]
  40. Cui, Z.-q.; Shi, H.-x.; Wang, W.-x.; Xu, B.-s. Laser surface melting AZ31B magnesium alloy with liquid nitrogen-assisted cooling. Trans. Nonferrous Met. Soc. China 2015, 25, 1446–1453. [Google Scholar] [CrossRef]
  41. Khalfaoui, W.; Valerio, E.; Masse, J.E.; Autric, M. Excimer laser treatment of ZE41 magnesium alloy for corrosion resistance and microhardness improvement. Opt. Lasers Eng. 2010, 48, 926–931. [Google Scholar] [CrossRef]
  42. Yue, T.M.; Yan, L.J.; Chan, C.P.; Dong, C.F.; Man, H.C.; Pang, G.K.H. Excimer laser surface treatment of aluminum alloy AA7075 to improve corrosion resistance. Surf. Coat. Technol. 2004, 179, 158–164. [Google Scholar] [CrossRef]
  43. Xu, W.L.; Yue, T.M.; Man, H.C.; Chan, C.P. Laser surface melting of aluminium alloy 6013 for improving pitting corrosion fatigue resistance. Surf. Coat. Technol. 2006, 200, 5077–5086. [Google Scholar] [CrossRef]
  44. Liu, Y.; Curioni, M.; Dong, S.; Liu, Z. Understanding the effects of excimer laser treatment on corrosion behavior of biodegradable Mg-1Ca alloy in simulated body fluid. J. Magnes. Alloys 2022, 10, 1004–1023. [Google Scholar] [CrossRef]
  45. Ahuir-Torres, J.I.; Arenas, M.A.; Perrie, W.; Dearden, G.; de Damborenea, J. Surface texturing of aluminium alloy AA2024-T3 by picosecond laser: Effect on wettability and corrosion properties. Surf. Coat. Technol. 2017, 321, 279–291. [Google Scholar] [CrossRef]
  46. Ibatan, T.; Uddin, M.S.; Chowdhury, M.A.K. Recent development on surface texturing in enhancing tribological performance of bearing sliders. Surf. Coat. Technol. 2015, 272, 102–120. [Google Scholar] [CrossRef]
  47. Kromer, R.; Costil, S.; Cormier, J.; Courapied, D.; Berthe, L.; Peyre, P.; Boustie, M. Laser surface patterning to enhance adhesion of plasma sprayed coatings. Surf. Coat. Technol. 2015, 278, 171–182. [Google Scholar] [CrossRef]
Figure 1. Single beads were conducted on Al-2014 and Al-2024 at different scan speeds at × 100.
Surfaces 08 00009 g001
Figure 2. Microstructure of as received and laser treat Al-alloys at different scan rates (a) Scattered second phases in Al-2024 AR, (b) Phase homogenization in Al-2024 at 80 mm/s, (c) Crack formation in Al-2024 at 150 mm/s, (d) Scattered second phases in Al-2014 AR, (e) Phase homogenization in Al-2014 at 80 mm/s,(f) Second phase accumulation around grain boundaries in Al-2014 at 150 mm/s.
Surfaces 08 00009 g002
Figure 3. X-Section micrographs for EDX Composition analysis (A) Al-2014 melted and un-melted region, (B) Al-2024 melted and un-melted region, (C) Dendritic structure, red arrows low copper black dendrite core and green arrows bright copper rich outer dendrite.
Surfaces 08 00009 g003
Figure 4. XRD graphs showing phases present in Al-2014 alloys: (a) as received, (b) LSM at 80 mm/s, (c) LSM at 150 mm/s.
Surfaces 08 00009 g004aSurfaces 08 00009 g004b
Figure 5. XRD graphs showing phases present in Al-2024 alloys: (a) as received, (b) LSM at 80 mm/s, (c) LSM at 150 mm/s.
Surfaces 08 00009 g005
Figure 6. Anodic polarization curves for laser surface melted Al-2024 (LSM) and as received Al-2024 samples (AR) in deaerated 1 M sodium chloride solution.
Surfaces 08 00009 g006
Figure 7. Anodic polarization curves for laser surface melted Al-2014 (LSM) and as received Al-2014 samples (AR) in deaerated 1 M sodium chloride solution.
Surfaces 08 00009 g007
Figure 8. Enrichment of alpha phase contribution in pitting driving force (without scale).
Surfaces 08 00009 g008
Table 1. Composition of Al-Cu alloys in weight %.
Al-Cu 2014 AlloyAl-Cu 2024 Alloy
Cu3.9–5Cu3.8–4.9
Mg0.2–0.8Mg1.2–1.8
Si0.5–1.2Si0.5
Mn0.4–1.2Mn0.3–0.9
Cr0.1Cr0.1
Zn0.25Zn0.25
Ti0.15Ti0.15
Fe0.7Fe0.5
Table 2. Laser process parameters for surface modification.
SpecimenPower
W
Overlap
% Bead
Type of LaserShielding GasScanning Speed
mm/s
20141.650CO2Argon20, 50, 80, 100, 120, 150
20241.650CO2Argon20, 50, 80, 100, 120, 150
Table 3. X-ray diffraction process parameters for laser laser-treated samples.
Scan Range
Step Size
mm
Counting Time
s/step
Incident Angle
X-Ray
Copper Anode
X-Ray Tube
5° to 95°0.052530°50 kV/40 mA
Table 4. Potentiodynamic polarization test parameters for Al-Cu alloys samples.
ElectrolyteDe-Aeration Gas PurgePotential
mV
Sweep Rate
mV/min
Current Limit
mA/cm2
Temperature
°C
Reference Electrode
1M NaClN2−200 to 120060125Calomel
Table 5. Bead depth and width variation with the laser scan rate and corresponding defects.
Scanning Speed (mm/s)Depth of Bead (mm)Width of Bead (mm)Microstructure
201.290.37Porosity at root bead
501.240.34Porosity at root bead
801.140.29Single crack, no porosity
1001.040.24Multiple cracks
1201.010.23
1500.990.21
1800.970.2
Table 6. EDX analysis of laser melted and un-melted Al-2014 and Al-2024 alloys.
Element wt. %CopperMagnesiumSiliconManganese
Melted (2014)5.25 ± 0.150.11 ± 0.021.00 ± 0.120.59 ± 0.08
Un-melted (2014) 4.78 ± 0.750.04 ± 0.010.37 ± 0.020.14 ± 0.02
Melted (2024)4.87 ± 0.211.28 ± 0.120.11 ± 0.050.62 ± 0.03
Un-melted (2024) 3.97 ± 0.010.59 ± 0.030.04 ± 0.010.46 ± 0.01
Table 7. Results extracted from polarization curves and XRD graphs of Al-2014 and Al-2024 alloys.
SpecimenEcorr (mV)Icorr (A/cm2)Epit (mV)Phases Present
Al-20014 AR−10178.31 × 10−3−708α-Al, Cu3Mn2Al, CuAl2
Al-2014 LSM−9605.51 × 10−3−679α-Al, Cu3Mn2Al, CuAl2
Al-2024 AR−102911.27 × 10−3−633α-Al, Al2CuMg
Al-2024 LSM−10728.6 × 10−3−678α-Al, Al2CuMg, CuAl2
Disclaimer/Publisher’s Note: The statements, opinions and data contained in all publications are solely those of the individual author(s) and contributor(s) and not of MDPI and/or the editor(s). MDPI and/or the editor(s) disclaim responsibility for any injury to people or property resulting from any ideas, methods, instructions or products referred to in the content.

