Article

Shear-Wave Elastography Using Commercially Available Ultrasound in a Mouse Model of Chronic Liver Disease

1
Department of Advanced Metabolic Hepatology, Osaka University Graduate School of Medicine, Suita 565-0871, Japan
2
Department of Molecular Biochemistry & Clinical Investigation, Osaka University Graduate School of Medicine, Suita 565-0871, Japan
3
Department of Medical Physics and Engineering, Division of Health Sciences, Osaka University Graduate School of Medicine, Suita 565-0871, Japan
4
Department of Hepatology, Graduate School of Medicine, Osaka Metropolitan University, Osaka 545-8585, Japan
5
Division of Innovative Medicine for Hepatobiliary & Pancreatology, Faculty of Medicine, Kagawa University, Kita-gun, Kagawa 761-0793, Japan
6
Department of Advanced Medical Technologies, National Cardiovascular and Cerebral Research Center, Suita 654-8565, Japan
*
Author to whom correspondence should be addressed.
These authors contributed equally to this work.
Gastrointest. Disord. 2022, 4(3), 153-164; https://doi.org/10.3390/gidisord4030015
Submission received: 2 July 2022 / Revised: 21 July 2022 / Accepted: 22 July 2022 / Published: 25 July 2022

Abstract

:
Elastography is currently used clinically to diagnose the degree of liver stiffness. We sought to develop a shear-wave elastography (SWE) measurement method using ultrasound in mice and to compare its results with those of other noninvasive tests for liver fibrosis. We divided male mice into three groups (normal (G1), liver fibrosis (G2), and fatty liver (G3)). We measured mouse liver SWE values and compared them with T1rho and T2 values from magnetic resonance imaging results. We also compared the SWE values with the expression levels of a serum liver fibrosis biomarker (Mac-2-binding protein (M2BP)) and hepatic genes. SWE values significantly increased over time in G2 but did not change in G3. T1rho values in G2 and G3 were significantly increased compared with those in G1. T2 values in G2 did not increase compared with those in group 1. T2 values in G3 significantly increased compared with those in groups 1 and 2. In G2, SWE values significantly and positively correlated with T1rho values. SWE values significantly correlated with serum M2BP levels in G2 but did not correlate with inflammatory gene expression. We could measure SWE values to assess the degree of liver fibrosis in mouse models of liver disease.

1. Introduction

Liver fibrosis occurs as a reparative action after chronic liver injury and often progresses to cirrhosis [1]. The degree of progression determines the prognosis of patients with chronic liver disease, including those with virus-associated hepatitis and nonalcoholic fatty liver disease (NAFLD) [2,3]. Generally, the stage of liver fibrosis is determined by examining a liver biopsy specimen. However, an invasive liver biopsy is unsuitable as a diagnostic test for large numbers of patients with chronic liver disease. Therefore, the development of a reproducible, noninvasive test (NIT) that can be used to accurately diagnose the stage of liver fibrosis is urgently needed. Currently, biomarkers of blood liver fibrosis and imaging methods are representative NITs.
Elastography (using ultrasound or magnetic resonance imaging (MRI)) for measuring liver stiffness has been used to diagnose liver fibrosis. For quantitative measurements of liver stiffness, shear-wave elastography (SWE) is used clinically. This method can be integrated with ultrasound imaging to latitudinally generate propagating shear waves using acoustic radiation forces and to track their velocity. If SWE can be implemented for rodents, it is expected to have a wide range of applications in various animal experiments. Studies using SWE measurements in rat models of liver disease have been previously reported [4,5]. However, there are few reports on studies using SWE measurements in mice [6].
We developed a serum biomarker of liver fibrosis, Mac-2-binding protein (M2BP) [7,8,9,10,11]. Serum M2BP levels increase with the progression of liver fibrosis in humans and mice, and measurements of its levels are useful to assess the stage of liver fibrosis. Our previous study demonstrated that mouse serum M2BP levels increased with the stage of liver fibrosis in a carbon tetrachloride (CCl4)-induced liver fibrosis model and an NAFLD model [7]. In addition, serum M2BP levels positively correlated with hepatic fibrosis-related gene expression.
Certain imaging modalities can be used to evaluate liver fibrosis noninvasively. While ultrasound elastography is commonly used in hospitals, MRI is superior to those methods in terms of objectivity. To develop a biomarker for imaging liver fibrosis with higher quality, we investigated liver injury assessment methods using 7T-MRI. Our recent study used T1rho and T2 values to evaluate acute liver injury after CCl4 administration; we found that T1rho mapping could be used to diagnose acute liver injury more accurately than T2 mapping [12]. Another group reported that T1rho quantification could also be used to assess the degree of liver fibrosis in a rat model of fibrosis after chronic CCl4 administration [13].
The purpose of our study was to develop an SWE measurement method using a commercially available ultrasound system in mice. In addition, we compared the results of SWE values in two different mouse models of liver disease with other liver fibrosis NITs (blood fibrosis biomarkers and MRI), as well as with hepatic gene expression levels. The determination of the utility of SWE measurements via commercially available US in mouse liver disease models is important to both verify the effectiveness of therapeutic drugs and for experiments using genetically modified mice.

2. Materials and Methods

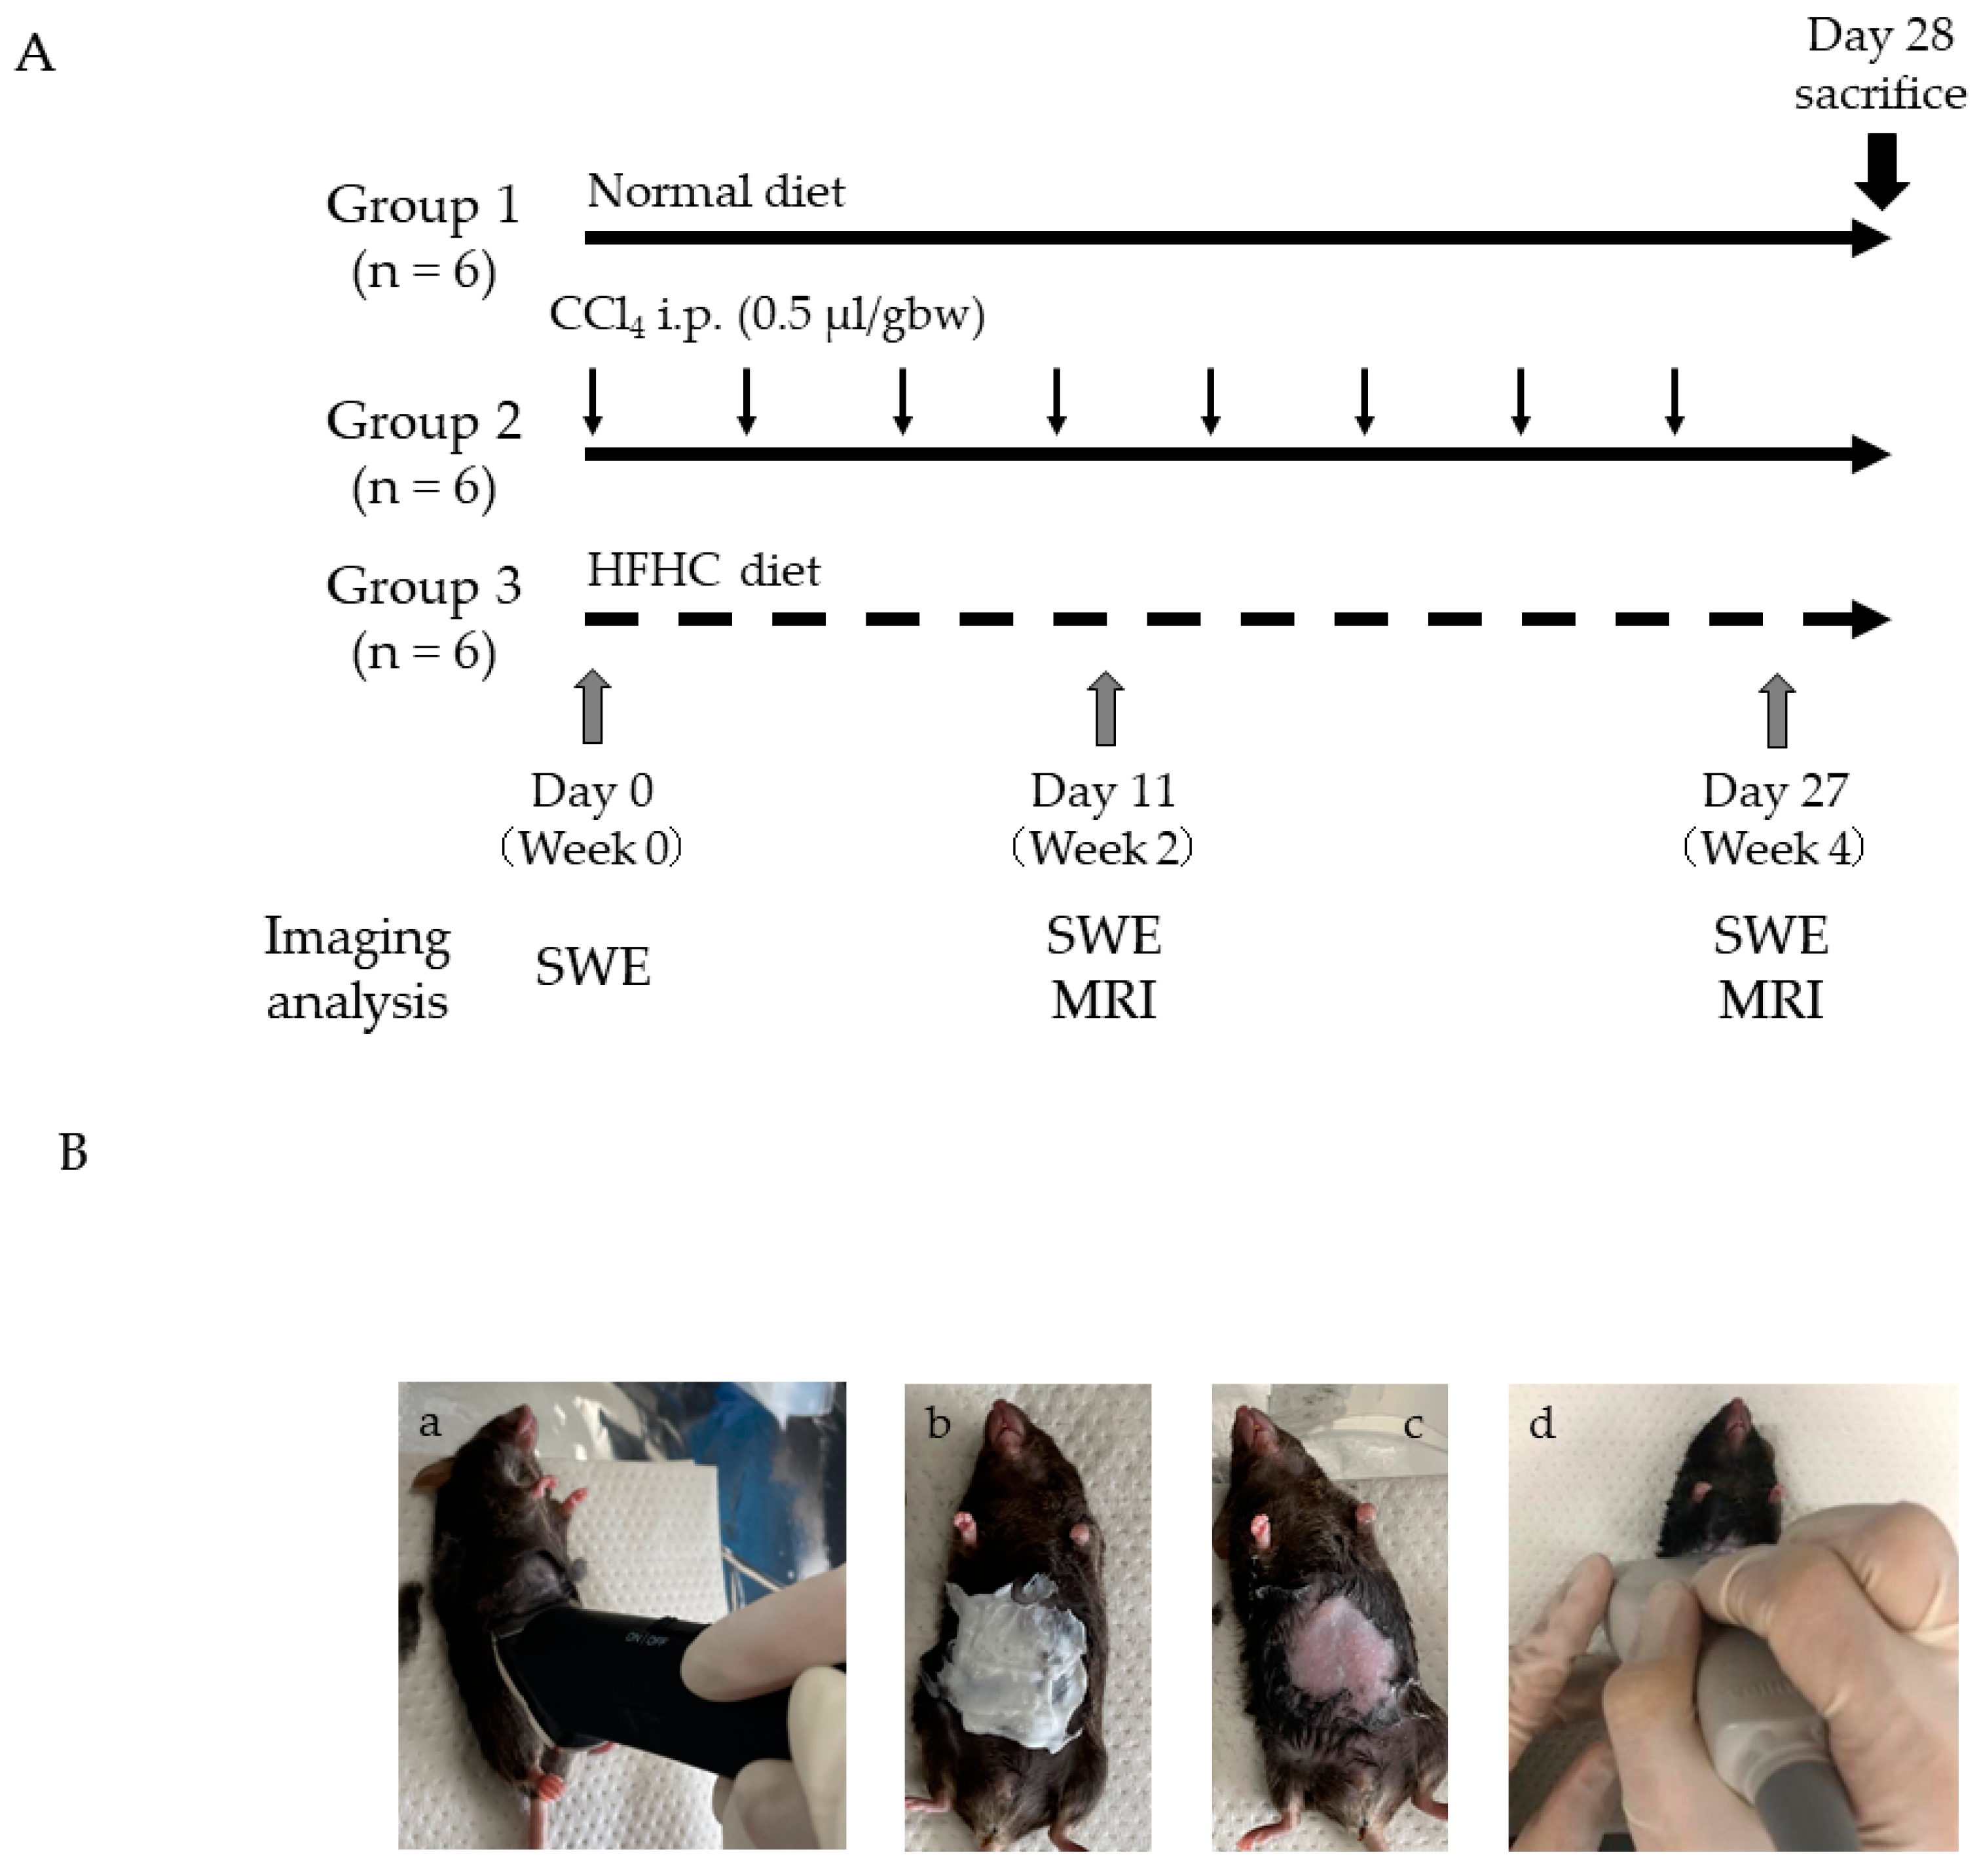
2.1. Experimental Protocol

All experimental protocols described in this study were approved by the Ethics Review Committee for Animal Experimentation of Osaka University Graduate School of Medicine. C57BL/6J mice were purchased from Oriental Yeast (Suita, Osaka, Japan). The animals were provided with unrestricted amounts of food and water, housed in temperature- and humidity-controlled rooms, and maintained on a 12/12 h light/dark cycle.
Male mice (n = 18) were divided into three groups that received different experimental protocols (Figure 1A). Both high-fat/high-cholesterol diet (HFHC; 15% cocoa butter fat, 1.25% cholesterol, and 0.5% cholic acid) and normal diet (ND) feed were purchased from Oriental Yeast (Suita, Osaka, Japan). The ND group (group 1; n = 6) was fed an MF diet for 4 weeks. The CCl4 group (group 2; n = 6) was injected with CCl4 (500 μL/kg body weight) intraperitoneally twice per week for 4 weeks to induce persistent liver damage and liver fibrosis. The HFHC group (group 3; n = 6) was fed an HFHC diet for 4 weeks. Mice were killed 3 days after the final CCl4 injection. For each experiment, mice were fasted for 5 h with free access to water and then were weighed and killed. Blood was collected aseptically from the inferior vena cava and centrifuged (13,000× g, 5 min, 4 °C) to collect the serum, and the samples were frozen at –80 °C until measurements were performed. Livers were harvested and fixed with 10% buffered paraformaldehyde or were immediately frozen in liquid nitrogen for mRNA extraction and lipid analysis, as previously described [14].

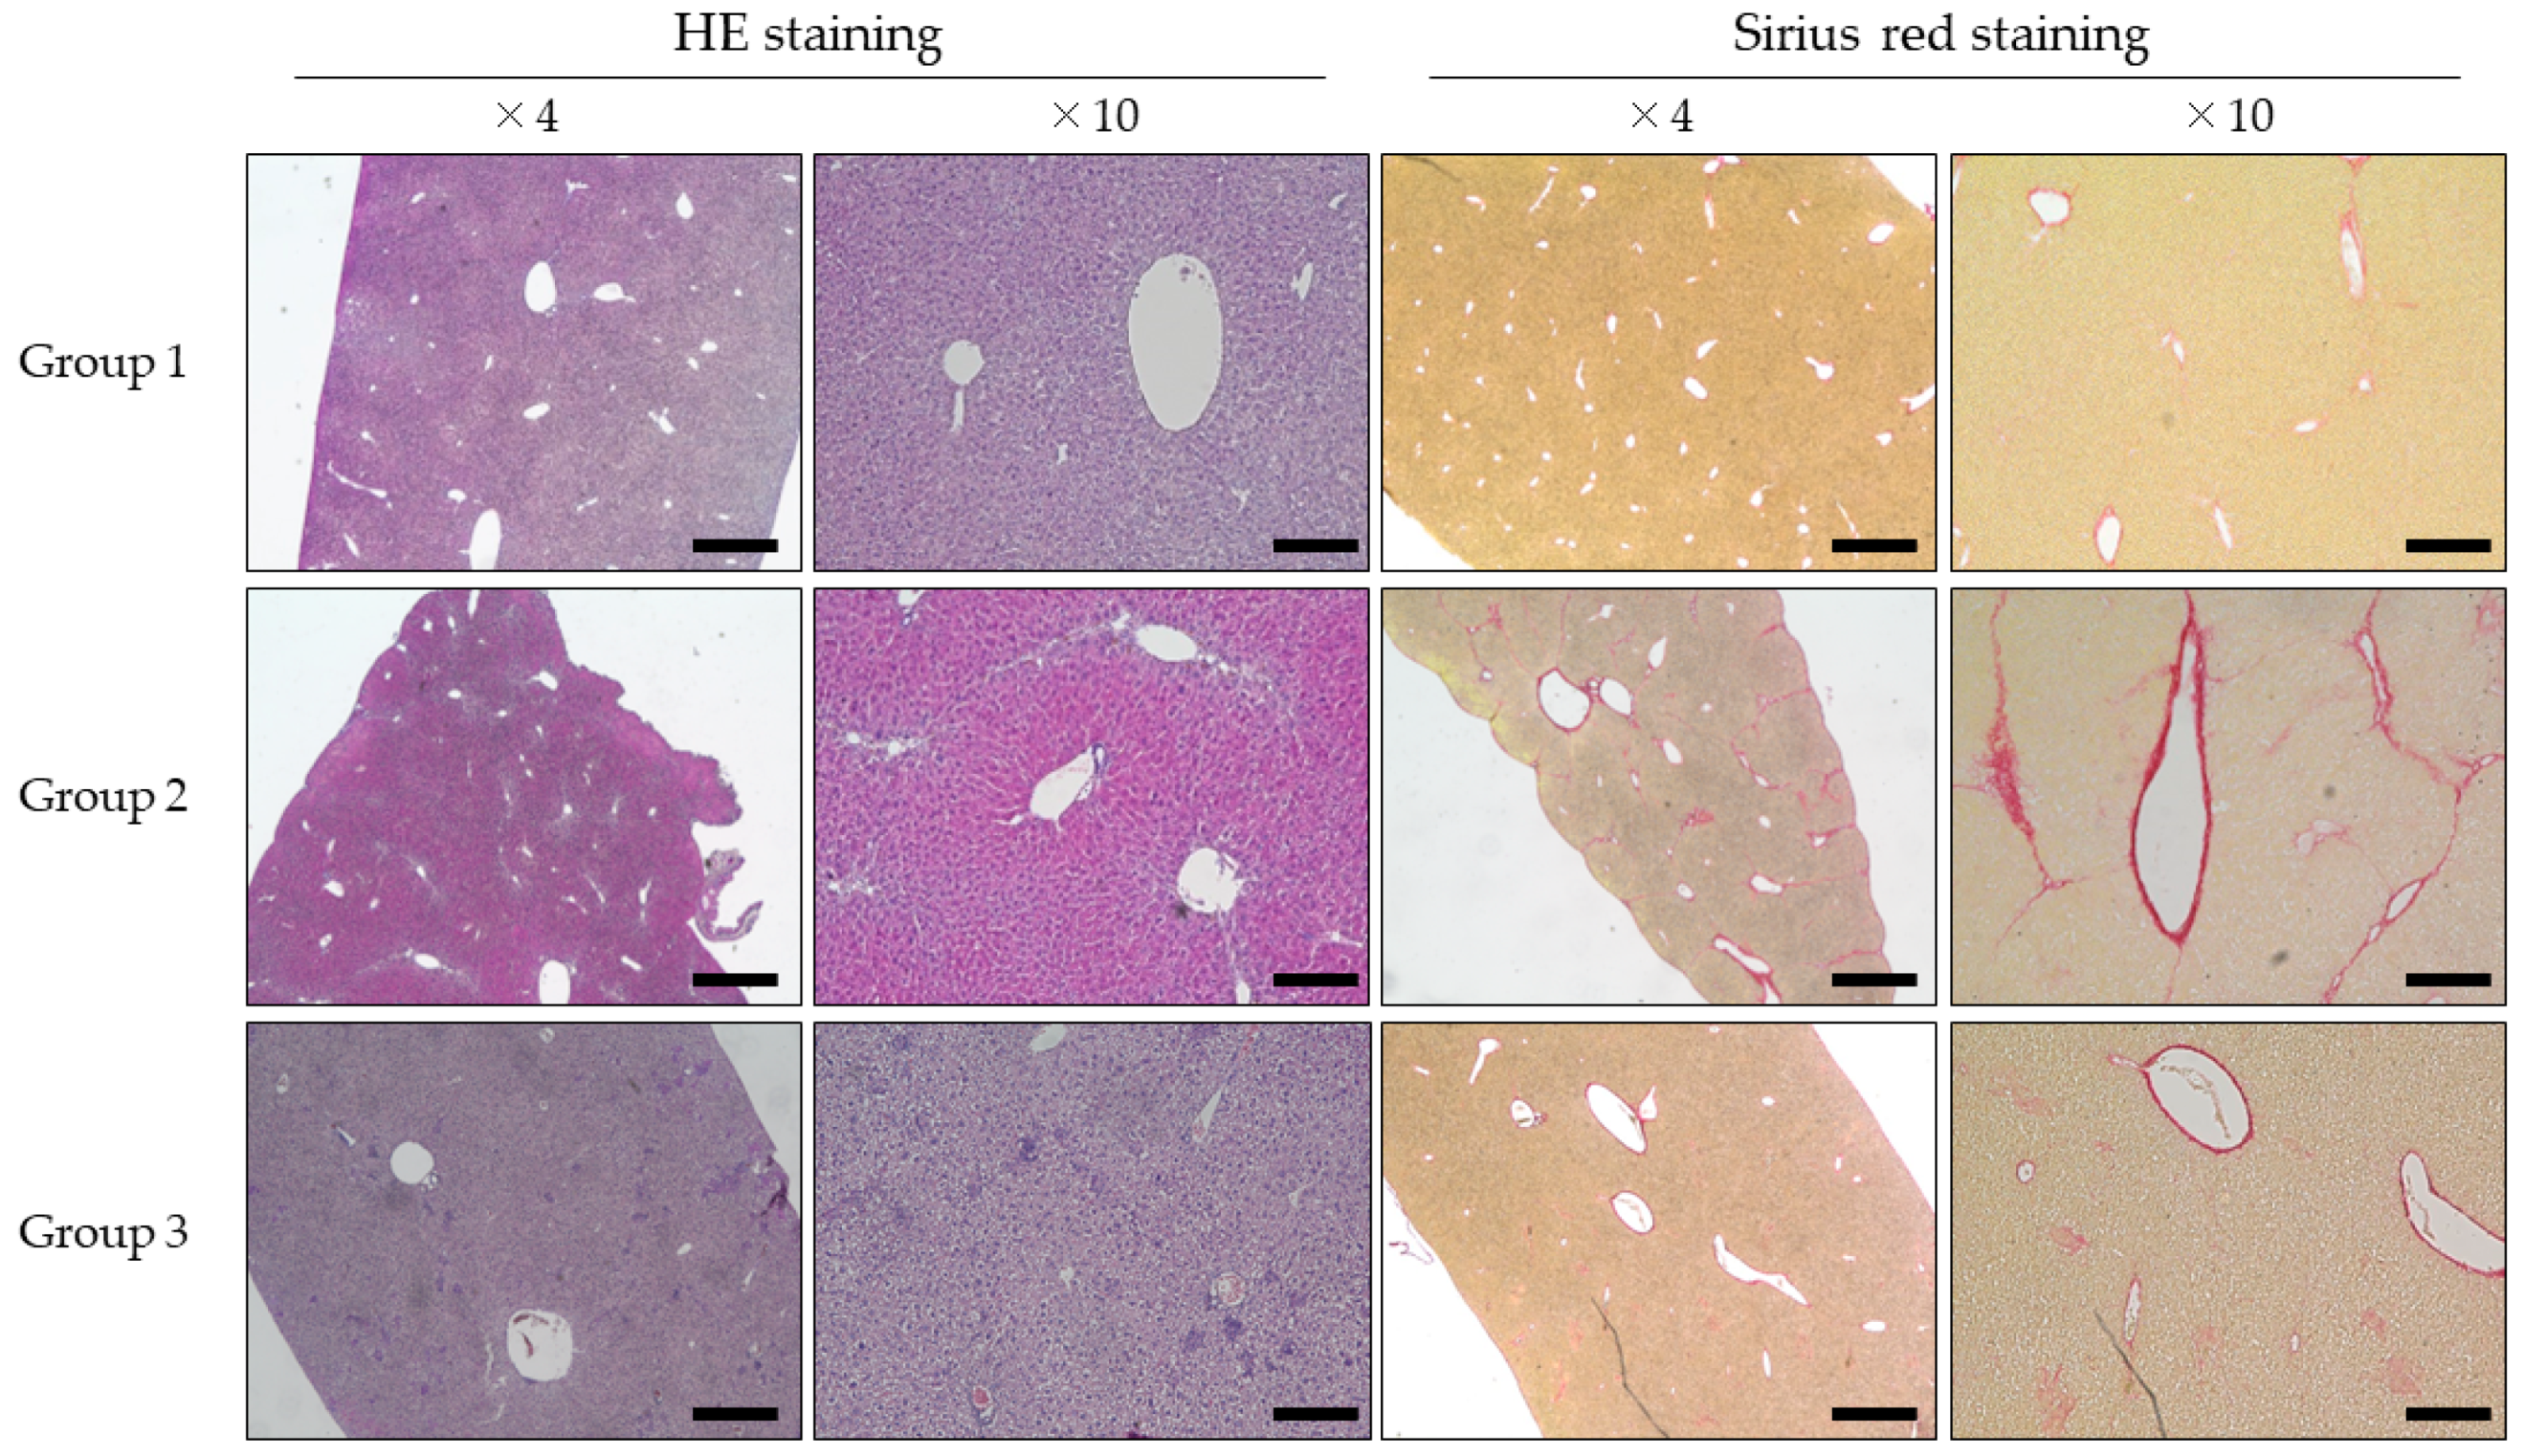
2.2. Hematoxylin-and-Eosin (H&E) Staining and Picrosirius Red Staining

Liver sections were stained with H&E or Picrosirius red (Sigma-Aldrich, Saint Louis, MO, USA).

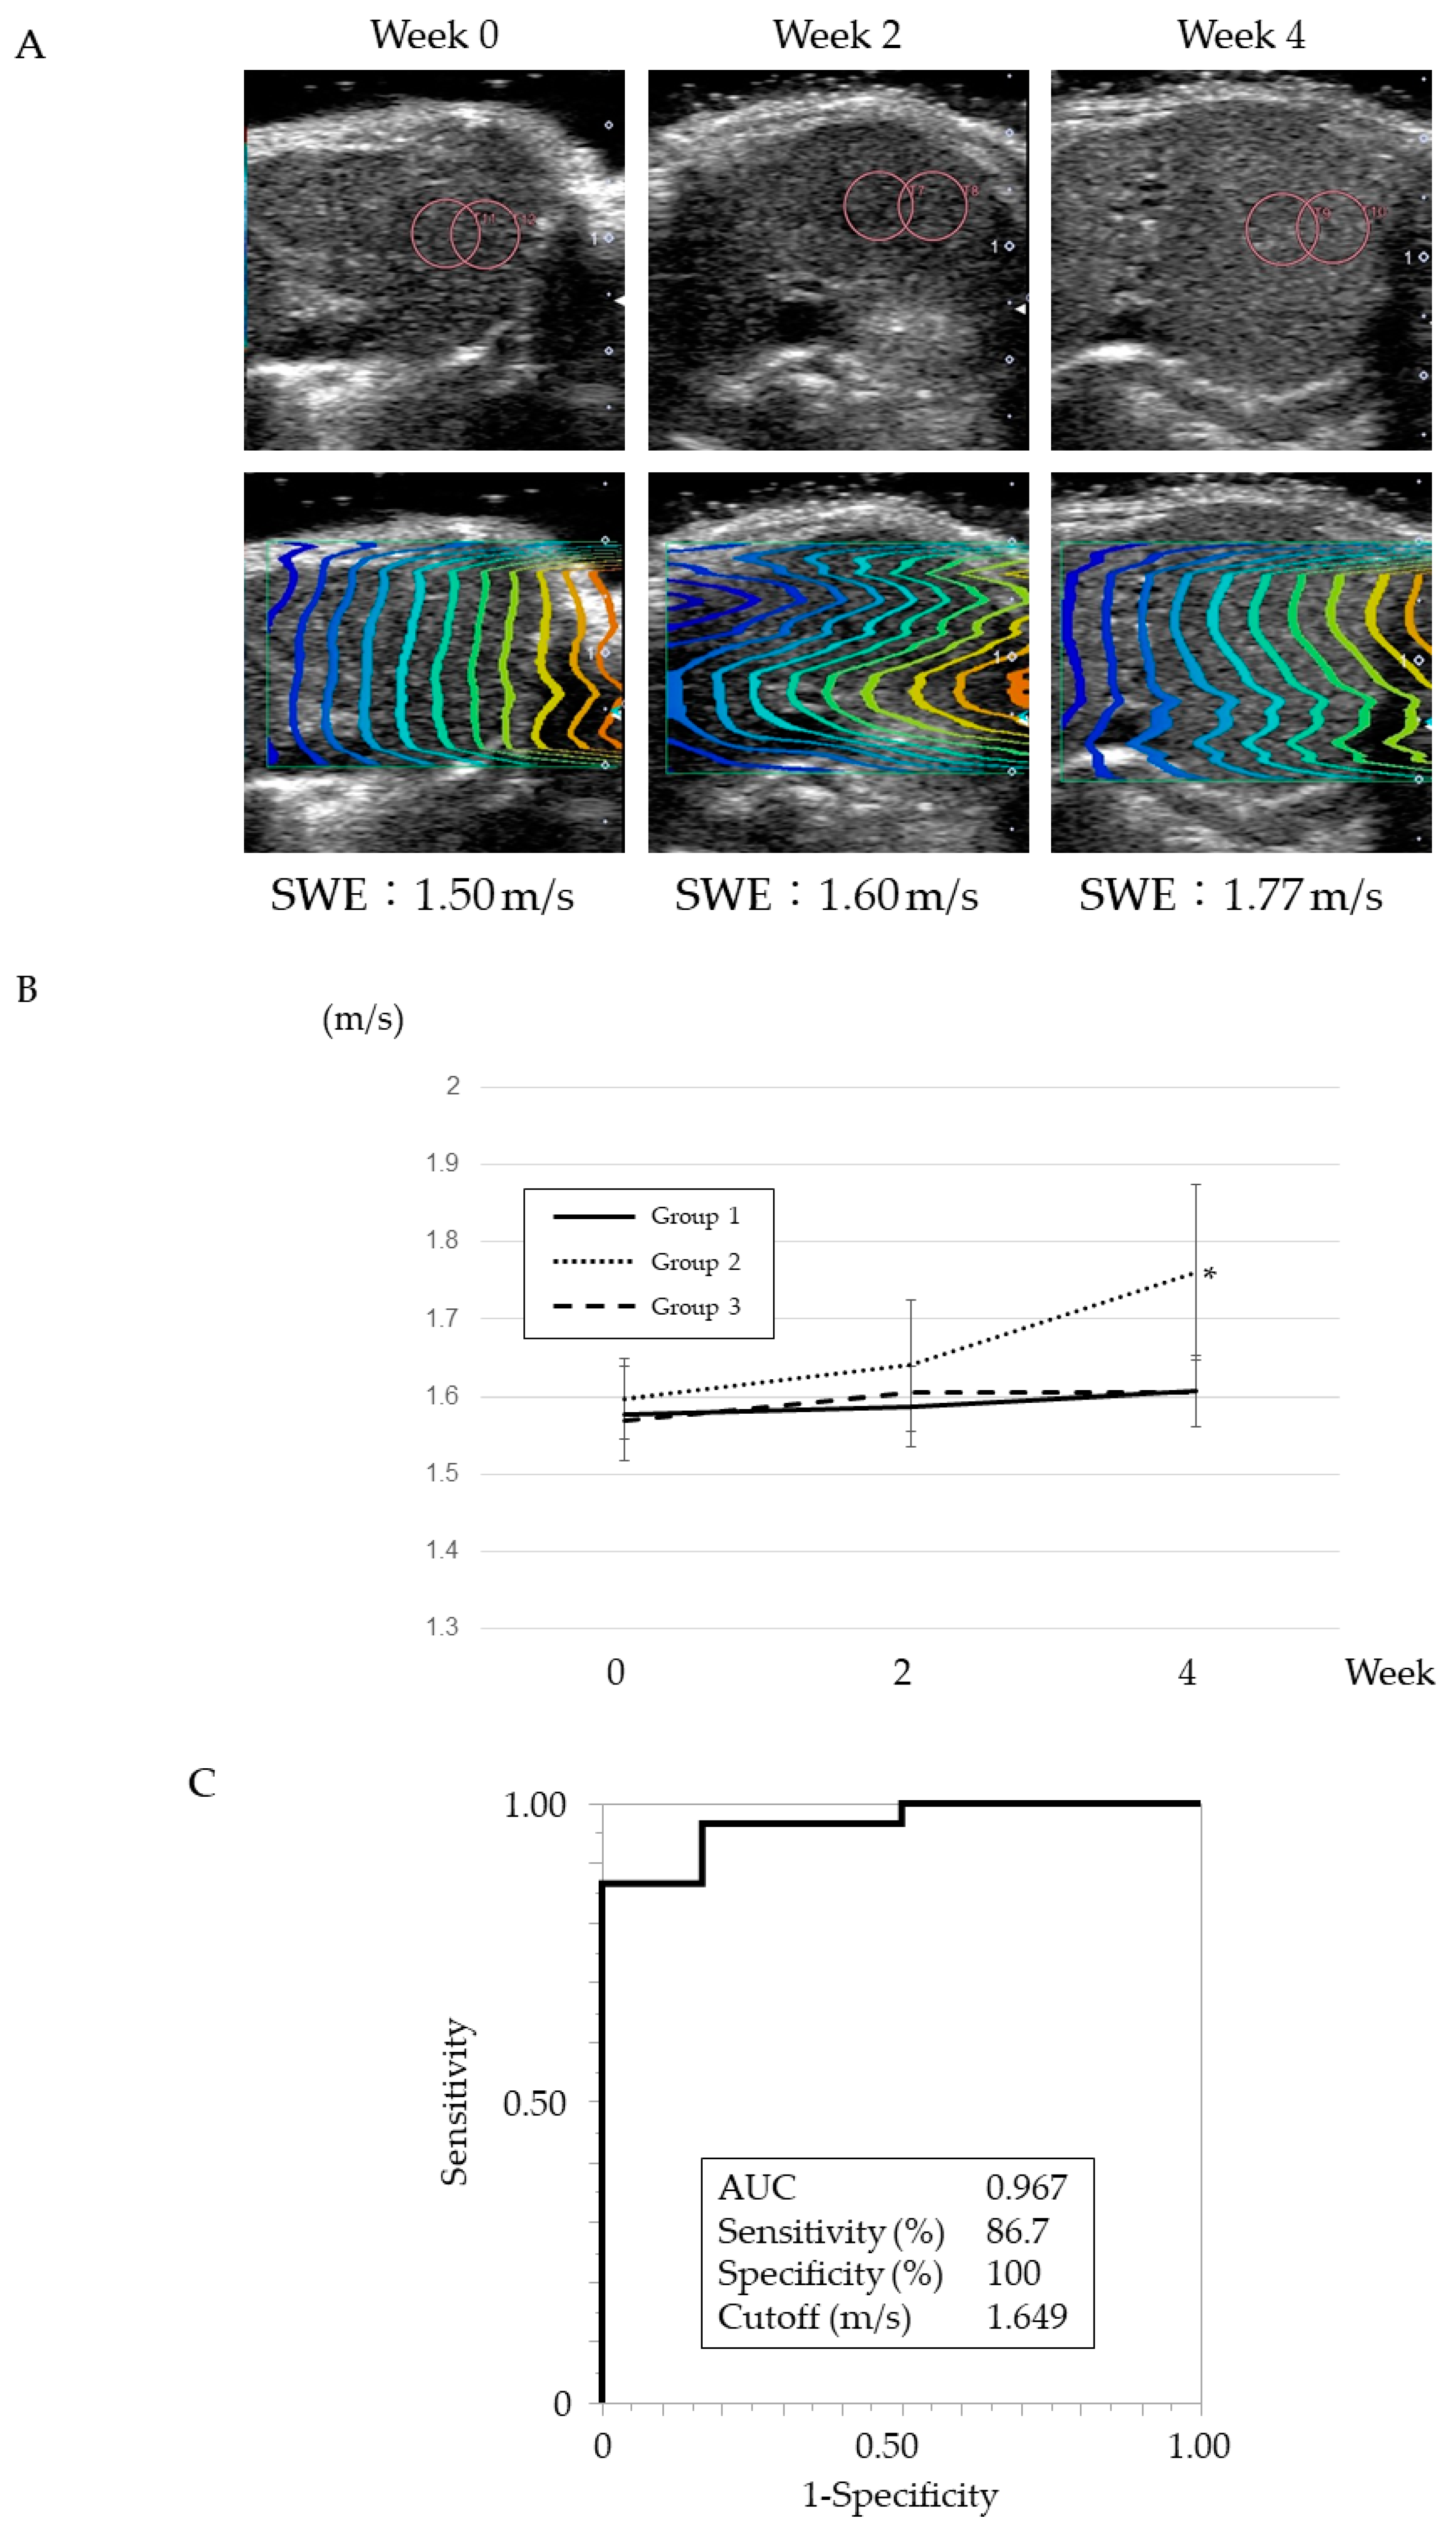
2.3. SWE Measurements

We measured mouse liver SWE values using a diagnostic ultrasound scanner (Aplio 500) equipped with a probe (PLT-1005BT; Canon Medical Systems, Otawara, Tochigi, Japan), as described in a previous study [5] (Figure 1B).
Before SWE measurements, mice were fasted for 4 h and anesthetized by an intraperitoneal injection of medetomidine (0.75 mg/kg), midazolam (4.0 mg/kg), and butorphanol (5.0 mg/kg). Mice then had their abdominal hair shaved; residual abdominal hair was removed using a chemical depilation cream (Veets, Reckitt Benckiser Japan, Tokyo, Japan) (Figure 1Ba–c). A probe was placed in the median fossa region for imaging with taking care not to put pressure on the mouse liver (Figure 1Bd), and the SWE measurement was performed. Ten consecutive and distinct SWE images of mouse liver parenchyma were acquired in the same image plane. For each image, an SW speed map and a propagation map were displayed, and two circular regions of interest (ROI; 3 mm in diameter) were identified in the liver parenchyma. After a few seconds of immobilization to allow the SWE image to stabilize, the images were captured and saved. An average of nine acquisitions was documented for each mouse. After the SWE measurements, we administered an anesthetic antagonist (0.75 mg/kg) to awaken the mice.

2.4. MRI

Experiments to acquire MR images of animal livers were performed using a horizontal 7T scanner (PharmaScan 70/16 US; Bruker Biospin, Ettlingen, Germany) equipped with a 30 mm diameter volume coil. To obtain MR images, the mice were positioned in a stereotaxic frame to prevent movements during acquisition [15]. The body temperatures of the mice were maintained at 36.5 °C with regulated water flow that was continuously monitored using a physiological monitoring system (SA Instruments Inc., Stony Brook, NY, USA). All liver MRI experiments were performed under general anesthesia induced with isoflurane (3.0% for induction and 2.0% for maintenance). Under respiratory gating, T1rho images were acquired using fast-spin echo and the following parameters: TR = 2500 ms; TE = 30 ms; rapid acquisition with relaxation enhancement (RARE) factor = 8; spin lock frequency = 1500 Hz; times of spin lock = 2, 12, 22, 32, 42 and 52 ms; slice thickness = 1 mm; field of view = 32 × 32 mm2; matrix size = 192 × 192; slice number = 1; slice orientation = transaxial; resolution = 167 μm × 167 μm and scan time = 6 min. T2-mapped images were acquired using RARE with the following parameters: TR = 2500 ms; TE = 9, 18, 27, 36, 45, 54, 63, 72, 81, 90, 99, 108, 117, 126, 135, 144, 153, 162, 171, 180, 189, 198, 207, 216, and 225 ms; RARE factor = 8; slice thickness = 1 mm; field of view = 32 × 32 mm2; matrix size = 160 × 160; slice number = 1; slice orientation = transaxial; resolution = 200 μm × 200 μm, and scan time = 6 min 40 s. The MR images were acquired at weeks 2 and 4 during the 4 weeks of the experimental protocol. One ROI for each slice was indicated, and T1rho and T2 values were measured by two observers. Large vessels and stomach areas were avoided.

2.5. RNA Isolation and Quantitative Real-Time Polymerase Chain Reaction (RT-PCR)

Total RNA was extracted from whole livers or cells using the QIAshredder and an RNeasy Mini Kit, according to the manufacturer’s instructions (QIAGEN, Hilden, Germany), and then transcribed into cDNA using a ReverTra Ace qPCR RT Kit (TOYOBO, Osaka, Japan). Quantitative RT-PCR was performed using a THUNDERBIRD SYBR qPCR Mix (TOYOBO) in a QuantStudioTM Real-Time PCR (Life Technologies, Carlsbad, U.S.), according to the manufacturer’s instructions. The primers used in this study were mouse-transforming growth factor-β (Tgf-β), tumor necrosis factor-α (Tnf-α), inducible nitric oxide synthase (iNos), and glyceraldehyde 3-phosphate dehydrogenase (Gapdh). The primers used in this study were mouse-transforming growth factor-β (Tgf-β) (forward: 5′- TCAGACATTCGGGAAGCAGTG -3′; reverse: 5′-GTTCCACATGTTGCTCCACAC-3′); tumor necrosis factor-α (Tnf-α) (forward: 5′-ACCCTCACACACTCAGATCATC-3′; reverse: 5′-GAGTAGACAAGGTACAACCC-3′); inducible nitric oxide synthase (iNos) (forward: 5′-CCACGGACGAGACGGATAG-3′; reverse: 5′-TGGGAGGAGCTGATGGAGTAG-3′); and glyceraldehyde 3-phosphate dehydrogenase (Gapdh) (forward: 5′-TGGTGCTGCCAAGGCTGTGG-3′; reverse: 5′-GGCAGGTTTCTCCAGGCGGC-3′). Tgf-β promotes fibrosis formation, Tnf-α is a typical inflammatory gene, and iNos elevates with the macrophage infiltration. The mRNA expression levels were normalized using Gapdh mRNA expression levels and expressed in arbitrary units.

2.6. M2BP ELISA Measurement

We measured mouse serum M2BP levels using an ELISA system at a 50-fold dilution (Immuno-Biological Laboratory Co., Ltd., Fujioka, Japan, code # 27796), as previously reported [7].

2.7. Statistical Analysis

Statistical analyses were conducted using JMP Pro 16.1 software (SAS Institute, Inc., Cary, NC, USA). Results are presented as the mean ± standard deviation. Statistical analyses included analysis of variance, the Wilcoxon and Kruskal–Wallis tests, and Spearman R correlations. The diagnostic performance of the SWE value was assessed by analyzing receiver operating characteristic (ROC) curves. The probabilities of true-positive (sensitivity) and true-negative (specificity) assessments were determined for selected cutoff values, and the area under the curve (AUC) was calculated. The Youden index was used to identify the optimal cutoff point of the SWE value. Differences were considered statistically significant at P values less than 0.05.

3. Results

3.1. Evaluation of Mouse Liver Histology

To compare the histological changes in each group, we stained mouse livers with H&E and Picrosirius red (Figure 2). Compared with normal liver (group 1), injured hepatocytes and bridging liver fibrosis were observed in group 2. In group 3 mouse livers, significant inflammatory cell infiltration, abundant steatosis, and mild liver fibrosis were observed.

3.2. Changes in SWE Values

In group 2 mice, liver SWE values significantly increased over time (Figure 3A,B). At week 4, the SWE values of group 2 mice were significantly higher than those of mice in groups 1 and 3. In group 3 mice, liver SWE values did not change during the experimental time course. Using ROC analyses, we set the cutoff values of SWE values for the stiffness of the liver in a mouse liver fibrosis model treated by CCL4 for 4 weeks using group 1 and group 2 (Figure 3C). The cutoff value was 1.649 m/s, and the AUC, sensitivity, and specificity of this cutoff value were 0.967, 86.7%, and 100%, respectively.

3.3. MRI (T1rho, T2) Maps

Figure 4A shows the color-coded T1rho maps and T2 maps in mouse livers at weeks 2 and 4. Figure 4B shows T1rho and T2 relaxation times in mouse livers. T1rho relaxation times in groups 2 and 3 were significantly longer at week 4 than those in group 1. T2 relaxation times in group 3 were significantly longer at week 4 than those in groups 1 and 2. T2 relaxation times in group 2 were not longer than those in group 1.

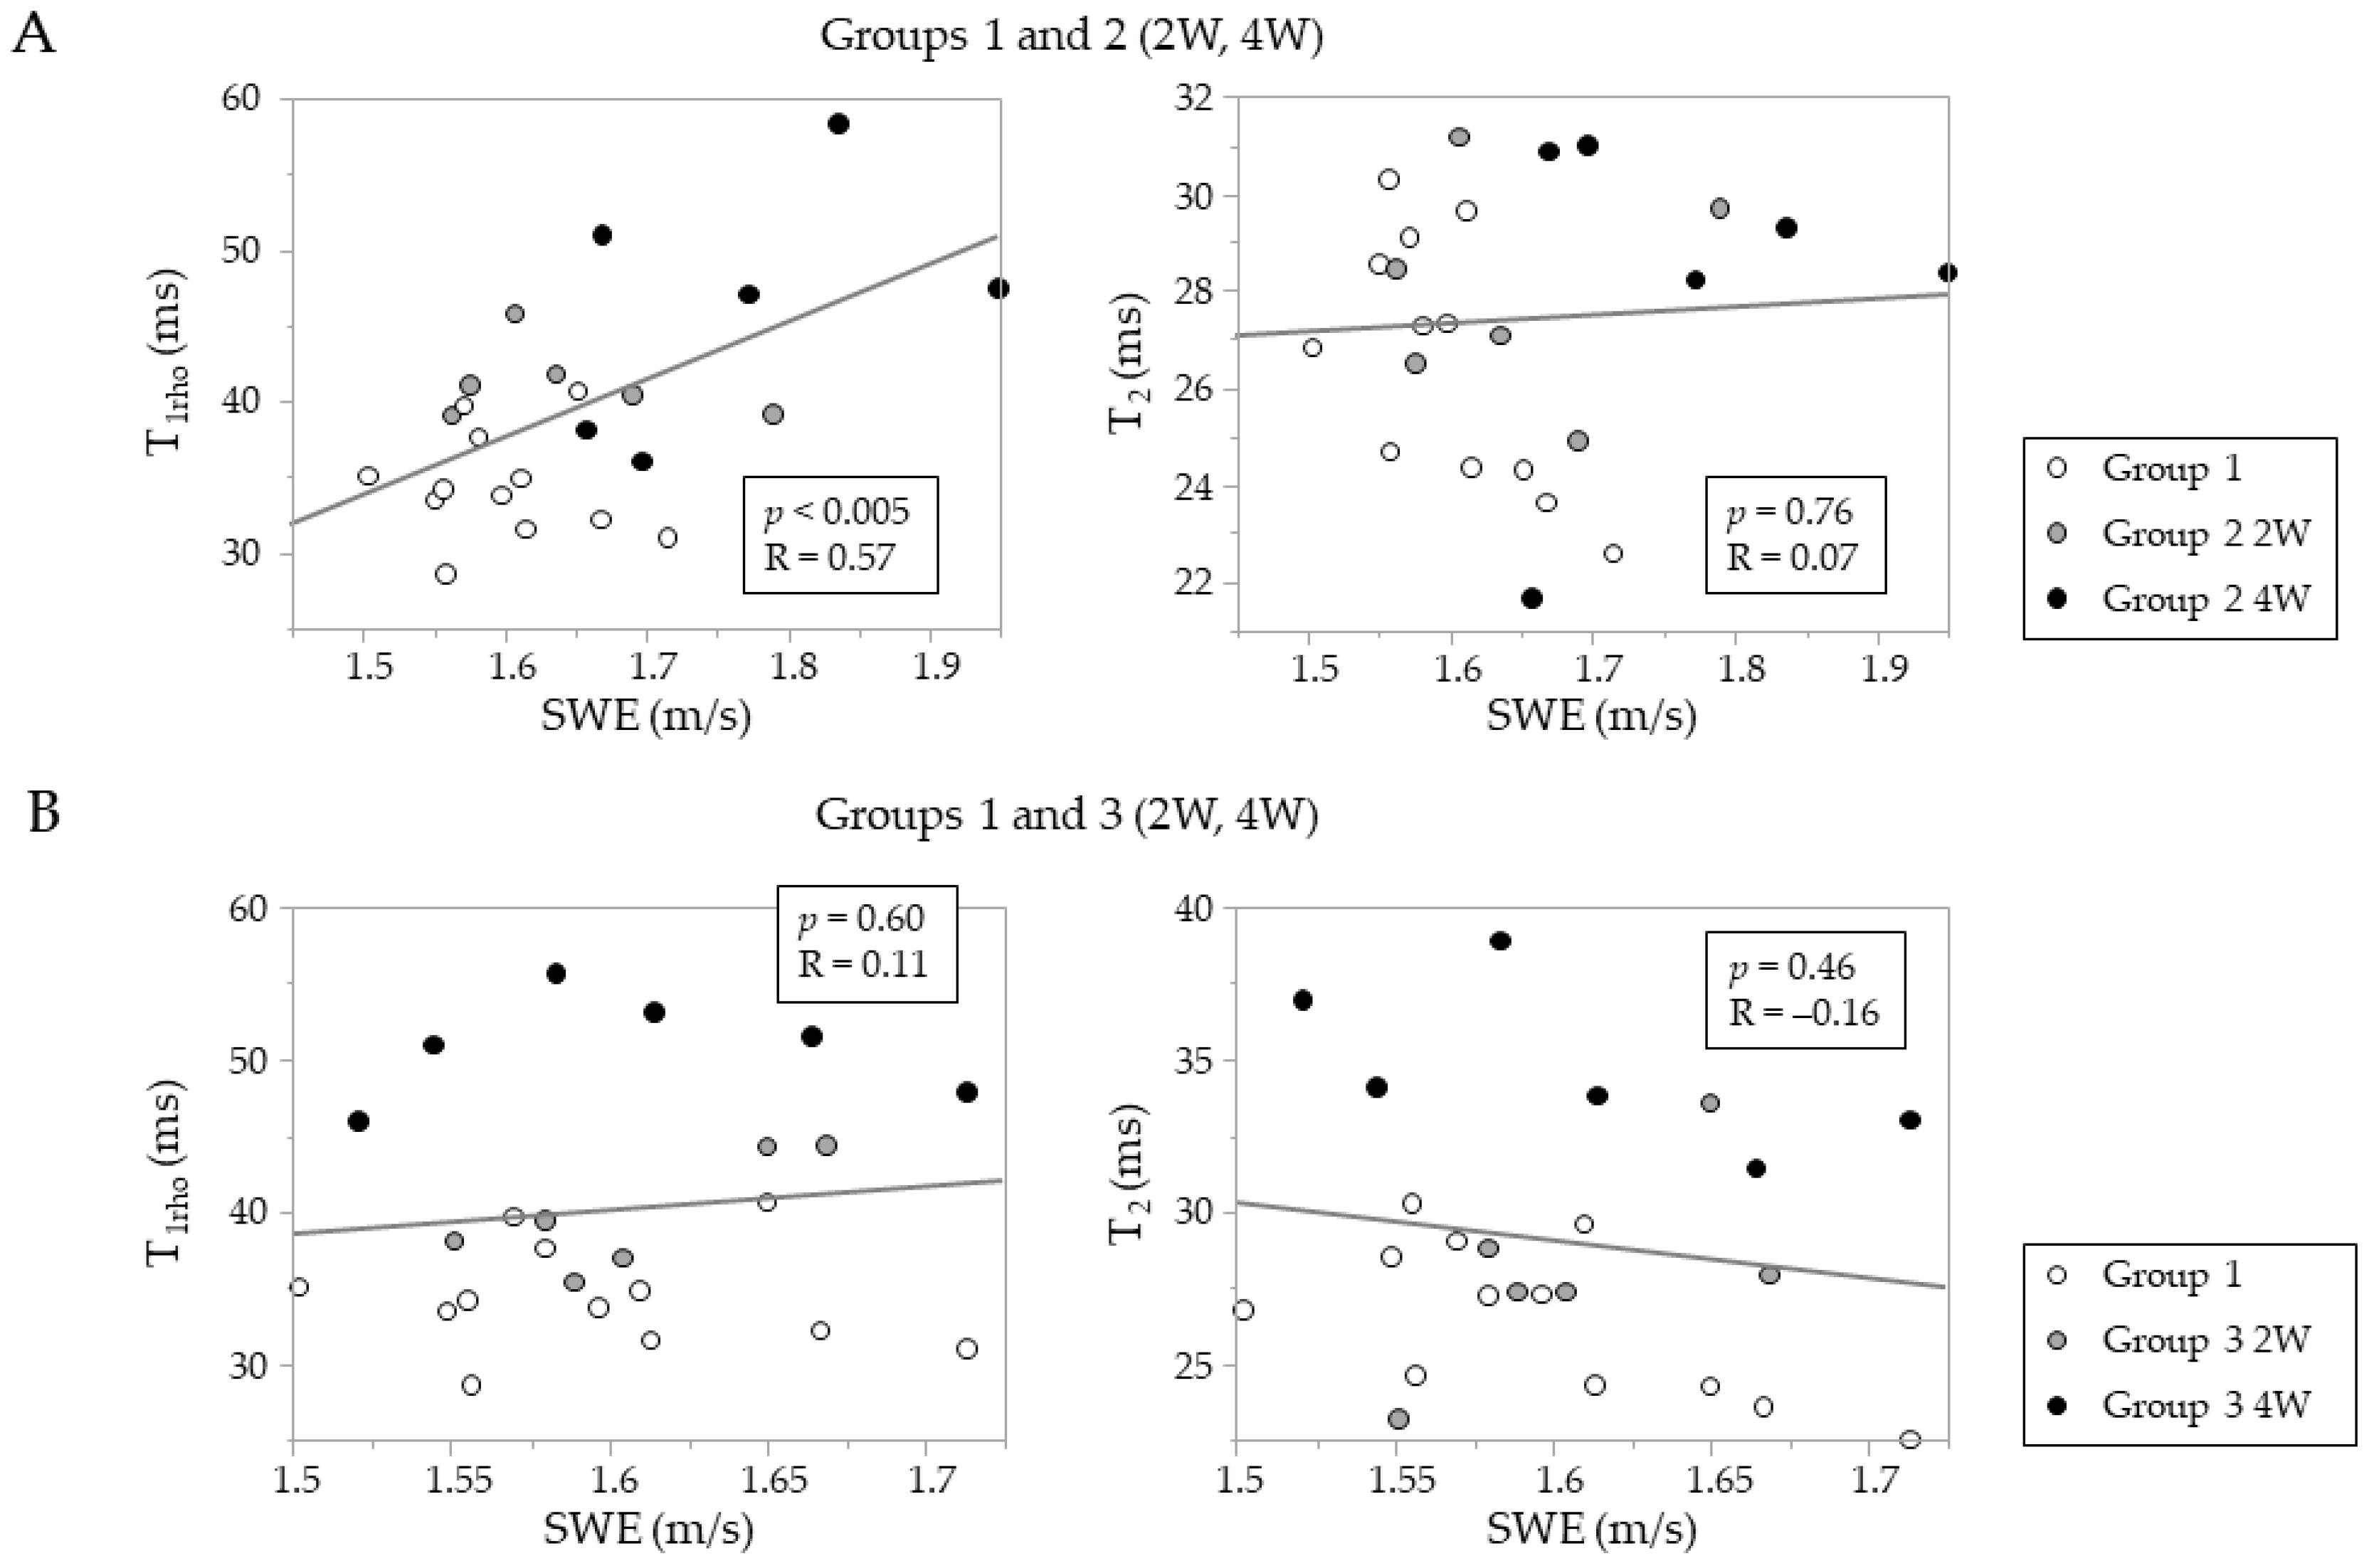
3.4. Relationship between SWE Values and MRI Parameters

We investigated the relationship between SWE values and MRI parameters in this study (Figure 5). In group 2 mice, SWE values significantly and positively correlated with T1rho relaxation times but not with T2 relaxation times (Figure 5A). In group 3 mice, SWE values did not correlate with either T1rho or T2 relaxation times (Figure 5B).

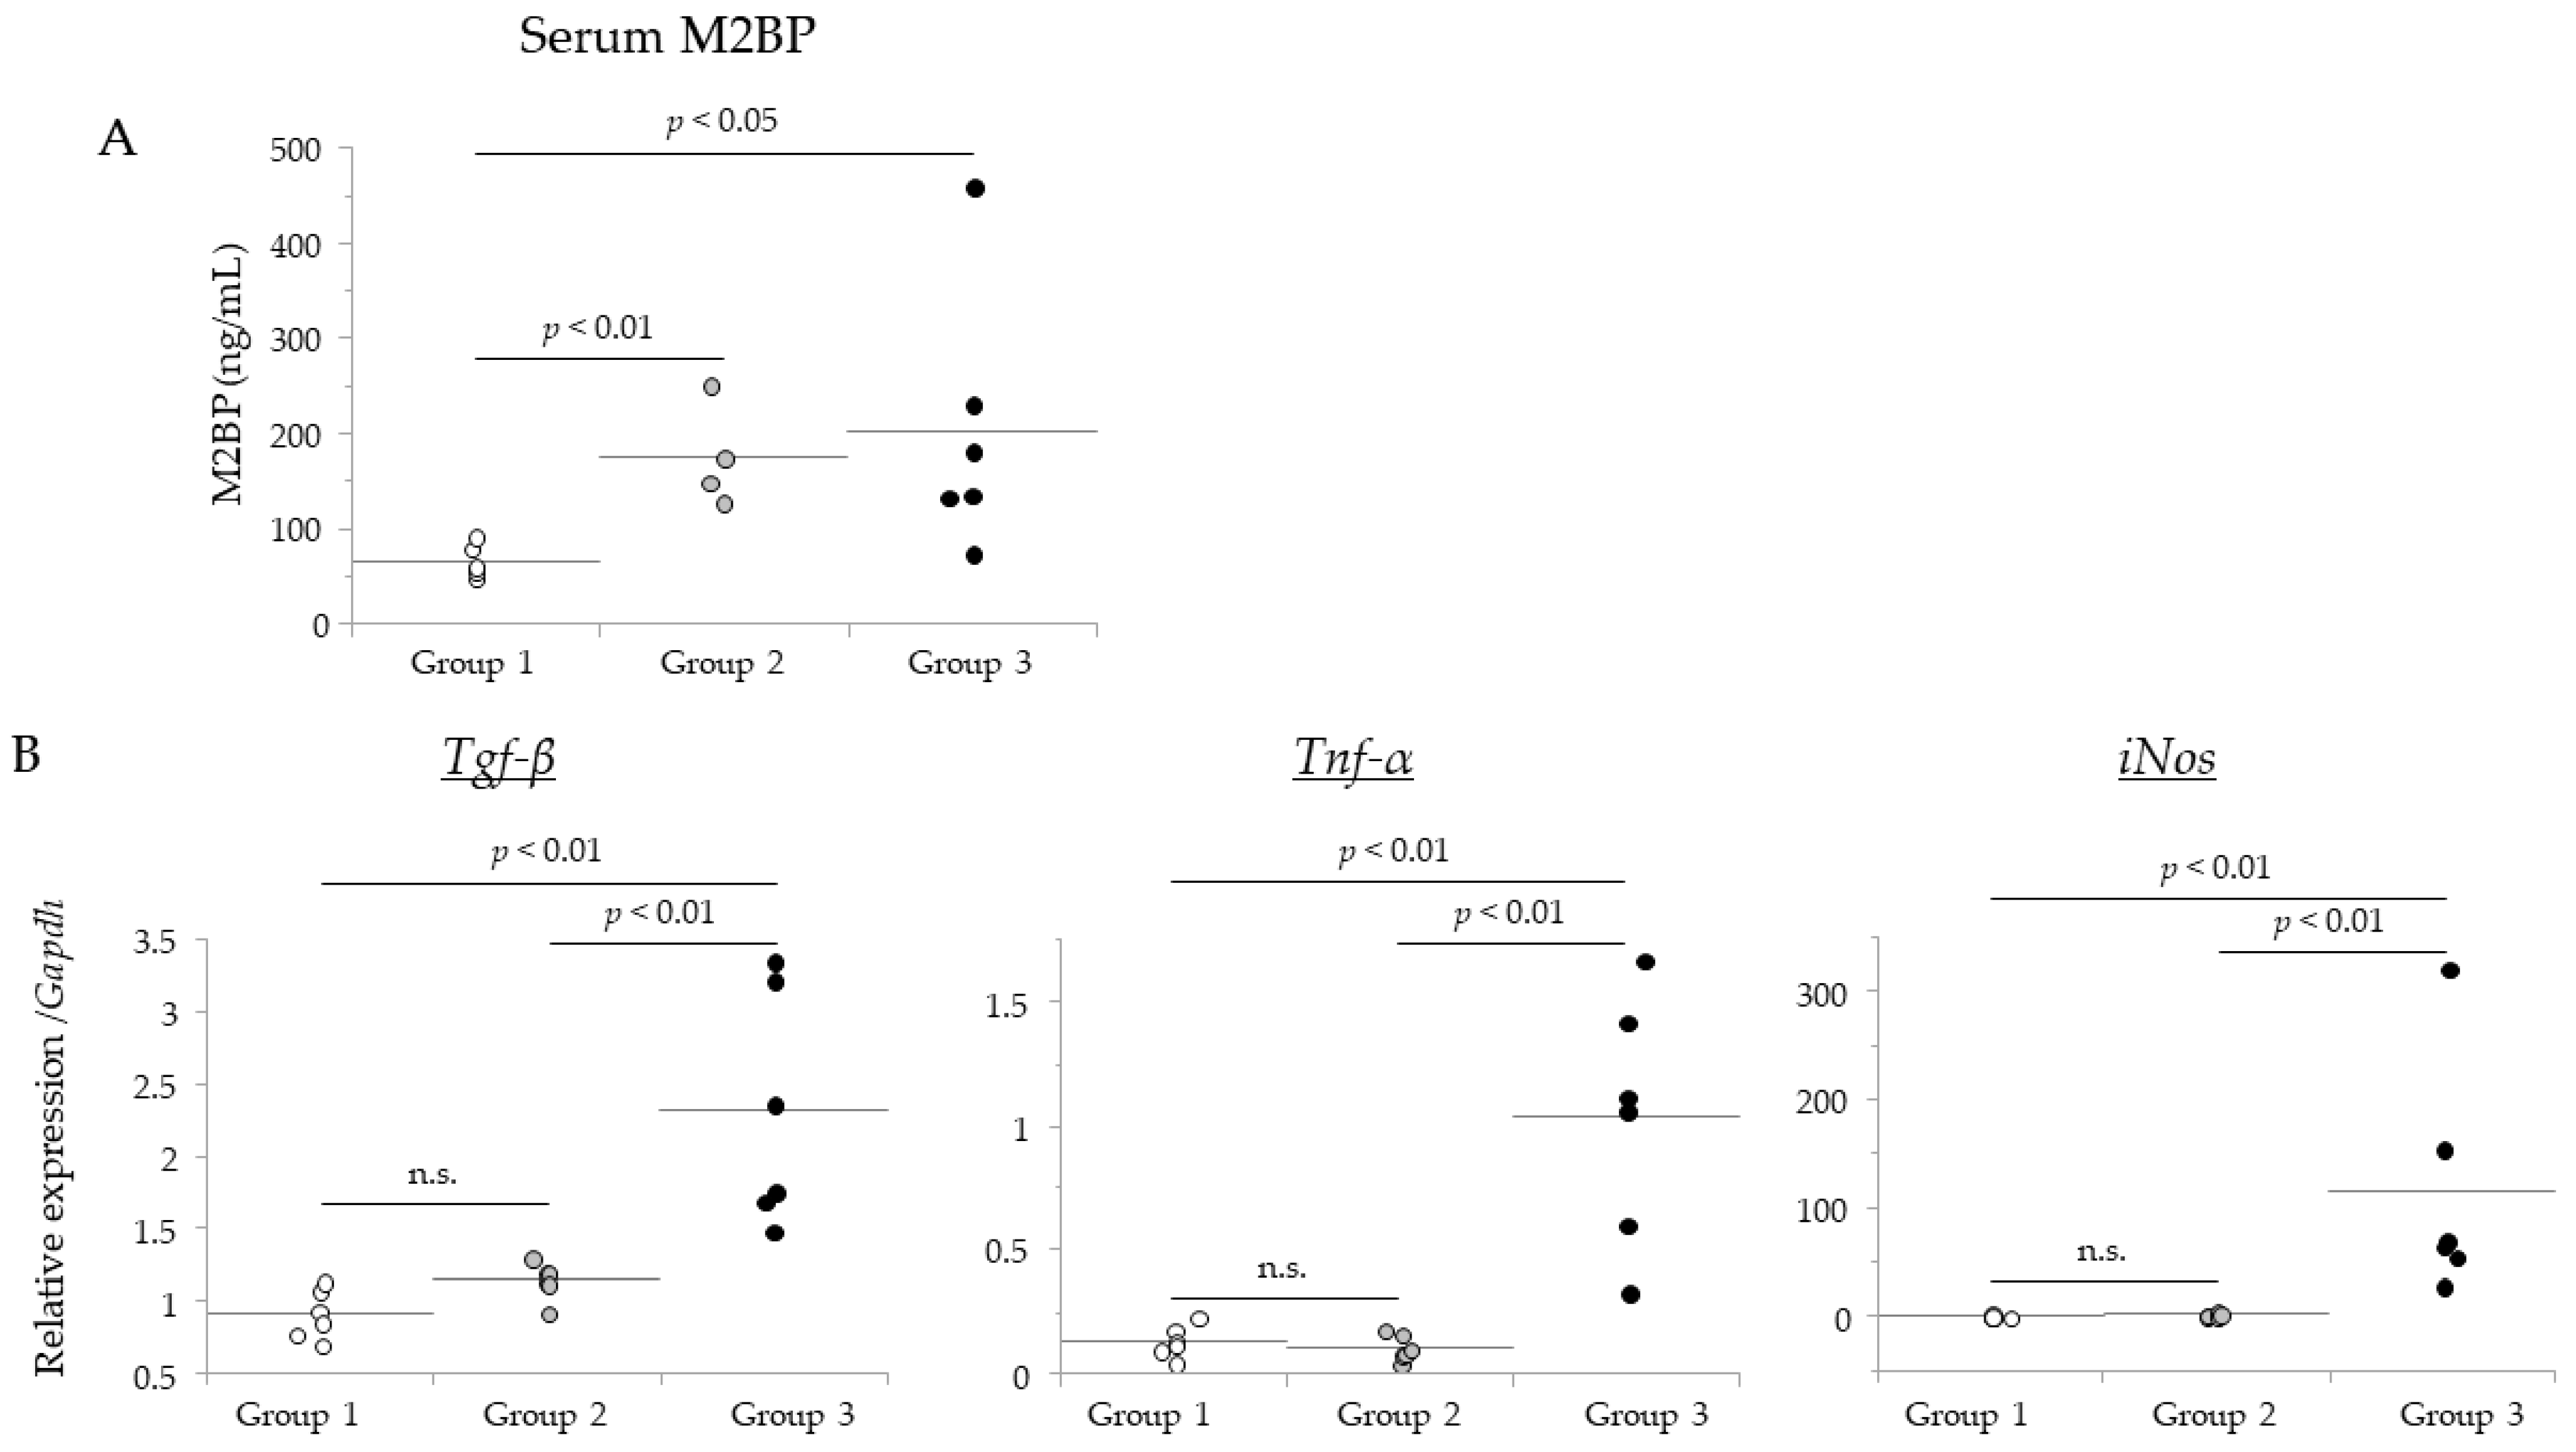
3.5. Comparison of SWE Results with Levels of a Liver Fibrosis Biomarker and Hepatic Genes

Next, we measured the serum levels of the liver fibrosis biomarker, M2BP, and liver gene expression levels (Figure 6). Serum M2BP levels were significantly higher in groups 2 and 3 than those in group 1 (group 1, 65.8 ± 16.8 ng/mL; group 2 175.9 ± 41.8 ng/mL, and group 3, 202.8 ± 136.4 ng/mL). Hepatic gene expression levels of Tgf-β, Tnf-α, and iNos were significantly higher in group 3 than the levels in groups 1 and 2. These levels were not increased in group 2 compared with group 1.
Next, we investigated the relationship between M2BP and liver gene expression levels with imaging values (SWE, T1rho, T2; Table 1). In group 2, we found there were significant, positive relationships between serum M2BP levels and SWE values and T1rho relaxation times (Table 1A). In addition, hepatic iNos gene expression was positively correlated with T1rho and T2 relaxation times. In group 3, serum M2BP levels significantly correlated with T1rho and T2 relaxation times (Table 1B). Hepatic gene expression levels (Tgf-β, Tnf-α, and iNos) also significantly correlated with T1rho and T2 relaxation times. There was no significant correlation with SWE values in group 3 mice.

4. Discussion

To the best of our knowledge, our study is the first approach for the measurement of mouse liver stiffness to assess the progression of mouse liver disease in vivo using a commercially available US machine. In this study, we compared the SWE results with the MRI results, serum liver fibrosis biomarker levels, and hepatic gene expression levels. In a CCl4-induced liver fibrosis model (group 2), SWE values significantly increased with liver disease progression. In the HFHC diet induced-NAFLD model (group 3), SWE values did not change during the experiment. One of the reasons for the lack of change in the SWE values in group 3 mice may be because there was very mild hepatic fibrosis but ample hepatic steatosis (soften mouse liver stiffness) in mice fed an HFHC diet for 4 weeks.
In group 2 mice, SWE values positively correlated with T1rho values and serum M2BP levels but did not correlate with T2 values. In a previous report, T1rho and T2 values were associated with the severity of liver fibrosis in experimental models of rat liver fibrosis (4 weeks in a bile duct ligation model, 16 weeks in a CCl4-induced liver fibrosis model) [16]. In a study evaluating disease severity in a rat model of CCl4-induced liver fibrosis, T1rho values were shown to be more useful than T2 values [17]. However, Xie et al. reported that edema and inflammation had a greater impact on liver T1rho values than liver fibrosis [18]. T2 values are reported to increase with the grade of steatosis and inflammation [19,20]. Serum M2BP levels are increased not only by the progression of liver fibrosis but also by increased steatosis and inflammation [7]. Considering these findings together, SWE values appear to be less susceptible to edema and inflammation and would be superior to other NITs used in this study for evaluations of disease progression in a mouse model of CCl4-induced liver fibrosis.
In group 3 mice, the SWE values did not change during our experiment. Four weeks of an HFHC diet induced very mild liver fibrosis and fatty changes in mice. According to our study results, we believe the SWE measurements were insufficient for the detection of such mild fibrotic changes in group 3 mice. In addition, the grade of liver steatosis is known to affect liver stiffness as measured with ultrasound-based elastography [21,22,23]. The effects of steatosis could thus offset elevations in liver stiffness induced after 4 weeks of an HFHC diet. The SWE values did not correlate with either serum M2BP levels or hepatic gene expression levels in group 3 mice. These results also indicate that SWE values are less susceptible to factors other than liver stiffness. On the other hand, T1rho and T2 values are well-correlated with serum M2BP levels and hepatic gene expression levels. These results indicate that T1rho and T2 values are affected by inflammation and/or steatosis.
In addition to SWE, there are other methods (e.g., MR elastography (MRE), transient elastography) for measuring liver stiffness in mice, as described in preclinical studies [6,24,25,26]. MRE requires expensive equipment, and US elastography measurement methods for mice reported to date have required special equipment [6]. Yeh et al. firstly demonstrated the quantitative determination of the mouse liver stiffness in vivo using two single-element high-frequency transducers. In this study, we could measure hepatic SWE in mice in vivo using a commercially available US machine and probe. We could measure liver stiffness using SWE over time in the same individual mouse. Our findings could promote the utility of SWE measurements in mouse liver disease models to both verify the effectiveness of therapeutic drugs and for experiments using genetically modified mice. From an animal welfare perspective, the SWE measurement using commercially available US in mice could contribute to reducing the number of mice sacrificed.
Our study has several limitations. First, the experimental duration was relatively short (4 weeks) for the detection of obvious changes in SWE values in mouse liver. To detect changes in SWE values in an NAFLD model, a longer duration of diet feeding is needed to achieve obvious progression of liver fibrosis. Second, mouse liver histological data at baseline and 2 weeks were not available in this study. Therefore, we could not investigate the precise data at 2 weeks. However, our study is significant in that we took imaging data over time on the same mouse. Third, our study did not investigate the effects of NITs in a regression model (e.g., one group of mice receives continuous CCl4 administration during the experimental protocol (progressive disease model), while another group of mice receives a limited duration of CCl4 administration and are then monitored without CCl4 administration (regression model)). The measurements of each NIT in these mice could then be used to assess the strength of each test for the detection of therapeutic effects.

5. Conclusions

In conclusion, we could measure SWE values using a commercially available US machine to evaluate the degree of liver fibrosis in a mouse liver disease model. After comparing SWE values with other test values (the MRI results and levels of a serum biomarker of liver fibrosis and hepatic genes), SWE was found to be a more specific tool for assessing the degree of liver fibrosis in mouse liver disease than other NITs. Our findings promote the utility of SWE measurements by commercially available US in mouse liver disease models to both verify the effectiveness of therapeutic drugs and for experiments using genetically modified mice.

Author Contributions

Conceptualization, Y.K.; methodology, Y.K. and S.S.; formal analysis, Y.F., M.H., R.M. and S.H.; investigation, Y.F., M.H., R.N., M.U. and N.A.; data curation, Y.F. and M.H.; writing—original draft preparation, Y.F., M.H. and Y.K.; writing—review and editing, H.F., M.O., E.M., S.S. and Y.K.; supervision, Y.K.; project administration, Y.K.; funding acquisition, Y.K. All authors have read and agreed to the published version of the manuscript.

Funding

This study was supported by JSPS KAKENHI grants (grant numbers 20K08383 (to Y.K.)) from the Japan Society for the Promotion of Science.

Institutional Review Board Statement

All experimental protocols described in this study were approved by the Ethics Review Committee for Animal Experimentation of Osaka University Graduate School of Medicine (no. R03-01-0).

Informed Consent Statement

All experimental protocols described in this study were approved by the Ethics Review Committee for Animal Experimentation of Osaka University Graduate School of Medicine.

Data Availability Statement

Not applicable.

Conflicts of Interest

The authors disclose no conflict of interest.

References

  1. Bataller, R.; Brenner, D.A. Liver fibrosis. J. Clin. Investig. 2005, 115, 209–218. [Google Scholar] [CrossRef] [PubMed]
  2. Sarin, S.K.; Kumar, M.; Eslam, M.; George, J.; Al Mahtab, M.; Akbar, S.M.F.; Jia, J.; Tian, Q.; Aggarwal, R.; Muljono, D.H.; et al. Liver diseases in the Asia-Pacific region: A Lancet Gastroenterology & Hepatology Commission. Lancet Gastroenterol. Hepatol. 2020, 5, 167–228. [Google Scholar] [PubMed] [Green Version]
  3. Angulo, P.; Kleiner, D.E.; Dam-Larsen, S.; Adams, L.A.; Bjornsson, E.S.; Charatcharoenwitthaya, P.; Mills, P.R.; Keach, J.C.; Lafferty, H.D.; Stahler, A.; et al. Liver Fibrosis, but No Other Histologic Features, Is Associated With Long-term Outcomes of Patients With Nonalcoholic Fatty Liver Disease. Gastroenterology 2015, 149, 389–397.e10. [Google Scholar] [CrossRef] [Green Version]
  4. Sugimoto, K.; Moriyasu, F.; Oshiro, H.; Takeuchi, H.; Yoshimasu, Y.; Kasai, Y.; Furuichi, Y.; Itoi, T. Viscoelasticity Measurement in Rat Livers Using Shear-Wave US Elastography. Ultrasound. Med. Biol. 2018, 44, 2018–2024. [Google Scholar] [CrossRef] [PubMed]
  5. Morin, J.; Swanson, T.A.; Rinaldi, A.; Boucher, M.; Ross, T.; Hirenallur-Shanthappa, D. Application of Ultrasound and Shear Wave Elastography Imaging in a Rat Model of NAFLD/NASH. J. Vis. Exp. 2021, 170, e62403. [Google Scholar] [CrossRef] [PubMed]
  6. Yeh, C.L.; Chen, B.R.; Tseng, L.Y.; Jao, P.; Su, T.H.; Li, P.C. Shear-wave elasticity imaging of a liver fibrosis mouse model using high-frequency ultrasound. IEEE Trans. Ultrason. Ferroelectr. Freq. Control. 2015, 62, 1295–1307. [Google Scholar] [CrossRef]
  7. Iwata, A.; Kamada, Y.; Ebisutani, Y.; Yamamoto, A.; Ueda, Y.; Arai, H.; Fujii, H.; Takamatsu, S.; Maruyama, N.; Maeda, M.; et al. Establishment of mouse Mac-2 binding protein enzyme-linked immunosorbent assay and its application for mouse chronic liver disease models. Hepatol. Res. 2017, 47, 902–909. [Google Scholar] [CrossRef]
  8. Kamada, Y.; Fujii, H.; Fujii, H.; Sawai, Y.; Doi, Y.; Uozumi, N.; Mizutani, K.; Akita, M.; Sato, M.; Kida, S.; et al. Serum Mac-2 binding protein levels as a novel diagnostic biomarker for prediction of disease severity and nonalcoholic steatohepatitis. Proteom. Clin. Appl. 2013, 7, 648–656. [Google Scholar] [CrossRef]
  9. Kamada, Y.; Ono, M.; Hyogo, H.; Fujii, H.; Sumida, Y.; Yamada, M.; Mori, K.; Tanaka, S.; Maekawa, T.; Ebisutani, Y.; et al. Use of Mac-2 binding protein as a biomarker for nonalcoholic fatty liver disease diagnosis. Hepatol. Commun. 2017, 1, 780–791. [Google Scholar] [CrossRef]
  10. Kamada, Y.; Morishita, K.; Koseki, M.; Nishida, M.; Asuka, T.; Naito, Y.; Yamada, M.; Takamatsu, S.; Sakata, Y.; Takehara, T.; et al. Serum Mac-2 Binding Protein Levels Associate with Metabolic Parameters and Predict Liver Fibrosis Progression in Subjects with Fatty Liver Disease: A 7-Year Longitudinal Study. Nutrients 2020, 12, 1770. [Google Scholar] [CrossRef]
  11. Kamada, Y.; Ono, M.; Hyogo, H.; Fujii, H.; Sumida, Y.; Mori, K.; Tanaka, S.; Yamada, M.; Akita, M.; Mizutani, K.; et al. A novel noninvasive diagnostic method for nonalcoholic steatohepatitis using two glycobiomarkers. Hepatology 2015, 62, 1433–1443. [Google Scholar] [CrossRef]
  12. Arihara, N.; Saito, S.; Sawaya, R.; Onishi, R.; Tsuji, K.; Ohki, A.; Ueda, J.; Morimoto-Ishiwaka, D. Evaluation of liver T(1rho) and T(2) values in acute liver inflammation models using 7T-MRI. Magn. Reson. Imaging 2022, 88, 20–24. [Google Scholar] [CrossRef] [PubMed]
  13. Zhao, F.; Yuan, J.; Deng, M.; Lu, P.X.; Ahuja, A.T.; Wang, Y.X. Further exploration of MRI techniques for liver T1rho quantification. Quant. Imaging Med. Surg. 2013, 3, 308–315. [Google Scholar] [PubMed]
  14. Kamada, Y.; Mori, K.; Matsumoto, H.; Kiso, S.; Yoshida, Y.; Shinzaki, S.; Hiramatsu, N.; Ishii, M.; Moriwaki, K.; Kawada, N.; et al. N-Acetylglucosaminyltransferase V regulates TGF-beta response in hepatic stellate cells and the progression of steatohepatitis. Glycobiology 2012, 22, 778–787. [Google Scholar] [CrossRef] [PubMed] [Green Version]
  15. Saito, S.; Takahashi, Y.; Ohki, A.; Shintani, Y.; Higuchi, T. Early detection of elevated lactate levels in a mitochondrial disease model using chemical exchange saturation transfer (CEST) and magnetic resonance spectroscopy (MRS) with 7T MR imaging. Radiol. Phys. Technol. 2019, 12, 232–233. [Google Scholar] [CrossRef]
  16. Luetkens, J.A.; Klein, S.; Träber, F.; Schmeel, F.C.; Sprinkart, A.M.; Kuetting, D.L.R.; Block, W.; Uschner, F.E.; Schierwagen, R.; Hittatiya, K.; et al. Quantification of Liver Fibrosis at T1 and T2 Mapping with Extracellular Volume Fraction MRI: Preclinical Results. Radiology 2018, 288, 748–754. [Google Scholar] [CrossRef]
  17. Zhao, F.; Wang, Y.X.; Yuan, J.; Deng, M.; Wong, H.L.; Chu, E.S.; Go, M.Y.; Teng, G.J.; Ahuja, A.T.; Yu, J. MR T1ρ as an imaging biomarker for monitoring liver injury progression and regression: An experimental study in rats with carbon tetrachloride intoxication. Eur. Radiol. 2012, 22, 1709–1716. [Google Scholar] [CrossRef]
  18. Xie, S.; Qi, H.; Li, Q.; Zhang, K.; Zhang, L.; Cheng, Y.; Shen, W. Liver injury monitoring, fibrosis staging and inflammation grading using T1rho magnetic resonance imaging: An experimental study in rats with carbon tetrachloride intoxication. BMC Gastroenterol. 2020, 20, 14. [Google Scholar] [CrossRef]
  19. Idilman, I.S.; Celik, A.; Savas, B.; Idilman, R.; Karcaaltincaba, M. The feasibility of T2 mapping in the assessment of hepatic steatosis, inflammation, and fibrosis in patients with non-alcoholic fatty liver disease: A preliminary study. Clin. Radiol. 2021, 76, e13–e709. [Google Scholar] [CrossRef]
  20. Kim, S.H.; Lee, S.J.; Yu, S.M. Study of lipid proton difference evaluation via 9.4T MRI analysis of fatty liver induced by exposure to methionine and choline-deficient (MCD) diet and high-fat diet (HFD) in an animal model. Chem. Phys. Lipids 2022, 242, 105164. [Google Scholar] [CrossRef]
  21. Petta, S.; Maida, M.; Macaluso, F.S.; Di Marco, V.; Cammà, C.; Cabibi, D.; Craxì, A. The severity of steatosis influences liver stiffness measurement in patients with nonalcoholic fatty liver disease. Hepatology 2015, 62, 1101–1110. [Google Scholar] [CrossRef] [PubMed]
  22. Karlas, T.; Petroff, D.; Sasso, M.; Fan, J.G.; Mi, Y.Q.; de Lédinghen, V.; Kumar, M.; Lupsor-Platon, M.; Han, K.H.; Cardoso, A.C.; et al. Impact of controlled attenuation parameter on detecting fibrosis using liver stiffness measurement. Aliment. Pharmacol. Ther. 2018, 47, 989–1000. [Google Scholar] [CrossRef] [PubMed]
  23. Wong, V.W.; Vergniol, J.; Wong, G.L.; Foucher, J.; Chan, H.L.; Le Bail, B.; Choi, P.C.; Kowo, M.; Chan, A.W.; Merrouche, W.; et al. Diagnosis of fibrosis and cirrhosis using liver stiffness measurement in nonalcoholic fatty liver disease. Hepatology 2010, 51, 454–462. [Google Scholar] [CrossRef]
  24. Tang, H.; Li, J.; Zinker, B.; Boehm, S.; Mauer, A.; Rex-Rabe, S.; Glaser, K.J.; Fronheiser, M.; Bradstreet, T.; Nakao, Y.; et al. Evaluation of a PEGylated Fibroblast Growth Factor 21 Variant Using Novel Preclinical Magnetic Resonance Imaging and Magnetic Resonance Elastography in a Mouse Mdel of Nonalcoholic Steatohepatitis. J. Magn. Reson. Imaging 2022, in press. [Google Scholar] [CrossRef]
  25. Bastard, C.; Bosisio, M.R.; Chabert, M.; Kalopissis, A.D.; Mahrouf-Yorgov, M.; Gilgenkrantz, H.; Mueller, S.; Sandrin, L. Transient micro-elastography: A novel non-invasive approach to measure liver stiffness in mice. World J. Gastroenterol. 2011, 17, 968–975. [Google Scholar] [CrossRef]
  26. Czernuszewicz, T.J.; Aji, A.M.; Moore, C.J.; Montgomery, S.A.; Velasco, B.; Torres, G.; Anand, K.S.; Johnson, K.A.; Deal, A.M.; Zukić, D.; et al. Development of a Robotic Shear Wave Elastography System for Noninvasive Staging of Liver Disease in Murine Models. Hepatol. Commun. 2022, 6, 1827–1839. [Google Scholar] [CrossRef] [PubMed]
Figure 1. Experimental protocol and SWE measurements: (A) experimental protocol. Group 1: Mice were fed an ND. Group 2: Mice were injected with CCl4 intraperitoneally twice per week for 4 weeks. Group 3: Mice were fed an HFHC diet for 4 weeks. Imaging analyses (SWE, MRI) were performed as shown. ND, normal diet; CCl4, carbon tetrachloride; HFHC, high fat and high cholesterol; gbw, gram body weight; (B) SWE measurements: (a) shaving the mouse; (b) application of hair removal cream; (c) removal of the cream; (d) examination of the cardiac fossa of a mouse with a linear probe (PLT-1005BT).
Gastrointestdisord 04 00015 g001
Figure 2. Histological images of mouse liver tissue in each group. Left panels: H&E staining, right panels: Picrosirius red staining. Scale bars: 500 μm (original magnification ×4), 200μm (original magnification ×10).
Gastrointestdisord 04 00015 g002
Figure 3. SWE measurements in mouse liver: (A) changes in SWE values in the same mouse (group 2). A longitudinal image of the same mouse at the time of SWE measurements. B-mode images with ROIs (upper panels), and with propagation maps (lower panels). Red circles indicated ROIs (3 mm in diameter) in the liver parenchyma; (B) changes in SWE over time in each group. Data are presented as the mean ± SD. Significance levels in group 2 were compared with groups 1 and 3. * p < 0.05 (compared group 2 with group 1 and group 3); (C) ROC analysis of SWE value for the stiffness of liver in mouse liver fibrosis model treated by CCL4 for 4 weeks.
Gastrointestdisord 04 00015 g003
Figure 4. MRI results: (A) color-coded T1rho and T2 maps showing representative results at 2 and 4 weeks. ms: millisecond; (B) changes in T1rho relaxation times in each group. Data are presented as the mean ± SD. Significance levels in group 2 and group 3 are compared with groups 1. * p < 0.05 (compared groups 2 and 3 with group 1); (C) changes in T2 relaxation times in each group. Data are presented as the mean ± SD. Significance levels in group 3 are compared with groups 1 and group 2. ** p < 0.01 (compared group 3 with other groups).
Gastrointestdisord 04 00015 g004
Figure 5. Relationship between SWE values and MRI parameters in this study: (A) relationship between SWE values and T1rho (left panel) and T2 (right panel) values in groups 1 and 2 (2 weeks (2W) and 4 weeks (4W)); (B) relationship between SWE values and T1rho (left panel) and T2 (right panel) values in groups 1 and 3 (2 W and 4 W).
Gastrointestdisord 04 00015 g005
Figure 6. Comparison of serum liver M2BP levels and liver gene expression levels in each group: (A) serum M2BP levels in each group; (B) liver gene expression levels in each group.
Gastrointestdisord 04 00015 g006
Table 1. Relationships between imaging results and liver-injury-related factors in each group.
A. Comparison of factors of mice in groups 1 and 2.
M2BPTgf-βTnf-αiNos
RpRpRpRp
SWE0.7<0.050.21n.s.−0.500.10.02n.s.
T1rho0.9<0.0010.27n.s.−0.33n.s.0.60<0.05
T20.530.080.11n.s.−0.23n.s.0.64<0.05
B. Comparison of factors of mice in groups 1 and 3.
M2BPTgf-βTnf-αiNos
RpRpRpRp
SWE−0.28n.s.0.17n.s.0.23n.s.−0.21n.s.
T1rho0.6<0.050.77<0.0050.83<0.0010.66<0.05
T20.6<0.050.77<0.0050.73<0.010.80<0.005
n.s., not significant.
Publisher’s Note: MDPI stays neutral with regard to jurisdictional claims in published maps and institutional affiliations.

