Article

Advanced Thermogravimetric Analyses of Stem Wood and Straw Devolatilization: Torrefaction through Combustion

Department of Chemical and Materials Engineering, San Jose State University, One Washington Square, San Jose, CA 95192-0082, USA
Reactions 2024, 5(2), 350-360; https://doi.org/10.3390/reactions5020018
Submission received: 13 March 2024 / Revised: 30 May 2024 / Accepted: 31 May 2024 / Published: 7 June 2024

Abstract

:
Process design critically depends on the characterization of fuels and their kinetics under process conditions. This study steps beyond the fundamental methods of thermogravimetry to modulated (MTGA) and Hi-Res™ (high resolution) techniques to (1) add characterization detail and (2) increase the utility of thermal analysis data. Modulated TGA methods overlay sinusoidal functions on the heating rates to determine activation energy as a function of temperature with time. Under devolatilization conditions, Hi-Res™ TGA maintains a constant mass loss with time and temperature. These two methods, run independently or overlaid, offer additional analysis in which multiple samples at different heating rates are run to different final temperatures. Advanced methods allow researchers to use fewer samples by conducting fewer runs, targeting practical experimental designs, and quantifying errors easier. The parameters of the studies included here vary the heating rate at 10, 30, and 50 °C/min; vary gas-phase oxygen for pyrolysis or combustion conditions; and particle size ranges of 100–125 µm, 400–425 µm, and 600–630 µm. The two biomass fuels used in the studies are pinewood from Northern Sweden and wheat straw. The influence of torrefaction is also included at temperatures of 220, 250, and 280 °C. Apparent activation energy results align with the previous MTGA data in that combustion conditions yield higher values than pyrolysis conditions—200–250 kJ/mol and 175–225 kJ/mol for pine and wheat combustion, respectively, depending on pre-treatment. Results show the dependence of these parameters upon one another from a traditional thermal analysis approach, e.g., the Ozawa-Flynn-Wall method, as well as MTGA and Hi-Res™ thermogravimetric investigations to show future directions for thermal analysis techniques.

1. Introduction

Fuel devolatilization studies are important for any industrially significant process since better understanding of feedstocks likely results in improved efficiency and favorable economics. Bench-scale studies have been used at length in the past and they have proven to be quite helpful [1]. Specifically, biomass resources are investigated as a means to decrease the use of fossil fuels and mitigate the effects of climate change through sustainable process development. Investigations have used conventional analysis methods to advance fundamental understanding of specific biomass fuels [2,3,4]; these require time and analytical capabilities. Efforts have been made to construct optimal designs to better use laboratory resources [5].
Advanced techniques have been established [6,7] to understand in-depth kinetics of fuel devolatilization. These techniques, namely modulated thermogravimetry (MTGA) [8] and high resolution (Hi-Res™) [9] slow down the heating rate to capture kinetic information in more detail. This elucidates side and competing reactions, secondary devolatilization curves, and other phenomena that are of interest to reactor design, and thus process operations.
Conventional thermogravimetric tests were performed using a design of experiments approach to investigate the effect of torrefaction temperature, particle size range, and heating rate on fuel type in combustion and pyrolysis conditions. Advanced techniques of MTGA and Hi-Res™ were used to compare phenomena with conventional methods. Results detail their significance and offer insight to applications.
Torrefaction is a thermochemical pretreatment process conducted in an inert atmosphere, between 200 and 300 °C, modifies biomass into a fuel with improved properties [10,11]. Mass loss is initially seen in a TGA test which signifies moisture loss from the sample. More significant mass loss occurs as temperature is increased due to the breakdown of hemicellulose. The extent of this decomposition is dependent upon the levels of hemicellulose and cellulose as well as the degree of torrefaction [12]. These data aid in optimizing torrefaction conditions to better pretreat the biomass for subsequent particle reduction processes.

2. Materials and Methods

2.1. Materials and Preparation

The pine stem wood originated in Northern Sweden along with the wheat straw. These fuels have been used in previous studies [13,14,15] and are well characterized in Wagner and Broström [15] with ash analyses. Abbreviated ultimate and proximate analyses are presented in Table 1 on a dry basis.
All virgin fuels were dried at 105 °C for four hours and milled using a Retsch SM 2000 cutting mill. Batches were sieved to particle size ranges or 125–150, 400–425, and 600–630 microns. The fuels were stored in air-tight PET plastic bottles until use.

2.2. Apparatus and Procedure

A thermogravimetric analyzer (TGA) model 5500 manufactured by TA Instruments (New Castle, DE, USA) was used for all devolatilization studies. Subsequent analyses were performed with TRIOS software from TA Instruments. Samples of 10–20 mg were loaded on open platinum pans and heated to 700 °C. Particles were loaded as close to a mono-layer thickness as possible or reasonable to limit mass transfer interference. A furnace air or nitrogen gas flow rate of 25 mL/min was used, and a nitrogen purge flow rate of 10 mL/min was used for the balance.
Run conditions varied for traditional mass loss experiments with those of advanced modulated [8,16] and high resolution (Hi-Res™) [6,9] testing. All initial torrefaction steps were consistent between runs. These first utilized the ‘jump’ heating rate in the control software to reach the desired torrefaction temperatures of 220, 250, or 280 °C. The ‘jump’ setting is ballistic and slows when reaching the setpoint temperature to avoid overshoot. Post-run heating rates were calculated to be between 800 and 1500 °C/min, resulting in torrefaction heat up times of approximately 15 s. Typical constant-heating-rate experiments, e.g., 10 C/min, were not used because they do not represent realistic heating rates that would be present in industrial applications, which are estimated to be103 to 104 °C per second [17,18,19]. Torrefaction temperatures were held for 20 min. Samples were then cooled to 40 °C. Traditional runs analyzed by the Ozawa-Flynn-Wall (OFW) method (ASTM 1641) [20] were then heated to 700 °C with varied heat rates of 10, 30, or 50 °C/min. After equilibration at 40 °C, other modulated tests (different subset than the OFW runs) were heated to 700 °C at 2 °C/min with a modulated temperature amplitude of 5 °C and a period of 200 s. All Hi-Res™ tests were performed at a heating rate of 5 °C/min to final temperatures of 700 °C in nitrogen with the same modulation settings, a resolution number of six, and sensitivity value of one.
Table 2 shows the factors for the experiments analyzed via the OFW method per ASTM standard 1641 [20], which leads to three heating-rate experiments for each of 18 distinct sets of conditions for each material. Pyrolysis (zero volume percent gas-phase oxygen) and combustion (20.9 volume percent gas-phase oxygen) tests were performed separately for both pine stem wood and wheat straw fuels for all traditional and modulated experiments. Three heating rates were run to final temperatures per subset of three particle size ranges of the two fuels in either pyrolysis and combustion regimes. This resulted in 158 individual runs including replicates.

2.3. Overview of Pertinent Kinetics

An extensive review of Arrhenius kinetics and the numerous derived methods are not detailed herein, but the reader is advised to see Aburto et al. [21], Budrugeac [22], Cai, et al. [23], Keuleers et al. [24], and Mishra and co-authors [25,26] for model-based mechanisms. Of particular interest to the reader may be the works of the ICTAC Kinetics Committee. The International Confederation for Thermal Analysis and Calorimetry (ICTAC) has published recommendation on the analysis of thermal decomposition mechanisms [27,28]. In summary of these extensive reviews, mass loss kinetics of thermogravimetric methods are determined by the Arrhenius method. The general form of the analysis equations is shown in Equation (1); this approximates the conversion with time for decomposition kinetics [29]. Here, α is conversion of initial material, t is time, Z is the pre-exponential factor, f α is the kinetic expression, E is activation energy, R is the gas constant, and T is absolute temperature.
d α d t = Z f α e E / R T
Equation (1) is the basis for the OFW method. Extended this to modulated experiments introduced ‘peaks’ and ‘valleys’ of the sinusoidal wave that is overlaid upon the linear heating rate. This periodic rate of reaction then becomes Equation (2) [30]. Subscripts p and v indicate peaks and valleys, respectively. The ratio of d α p / d α v approaches unity if the fraction reacted changes between adjacent cycles. The resulting activation energy is then expressed as Equation (3). This equation reduces to Equation (4) if we use the parameter L to be the difference between minimum and maximum values of conversion of adjacent modulation cycles. A is temperature amplitude.
d α p / d t d α v / d t = Z f α p e E / R T p Z f α v e E / R T v
E = R T p T v l n d α p / d α v T p T v
E = R T 2 A 2 L 2 A
Rigorous derivations and discussions of these and extensions of these equations are presented by other authors [30,31].

3. Results

Numerous investigators have theorized on the utility of modulated thermogravimetric methods. Some are proponents of the approach [32,33,34,35] and others are skeptical [22,24]. This study hoped to clarify some apprehension of using the technique and offer another view of the utility of the data produced. Analysis methods of these data include the conventional OFW approach (ASTM 1641) and complementary modulated (MTGA) and Hi-Res™ analyses.

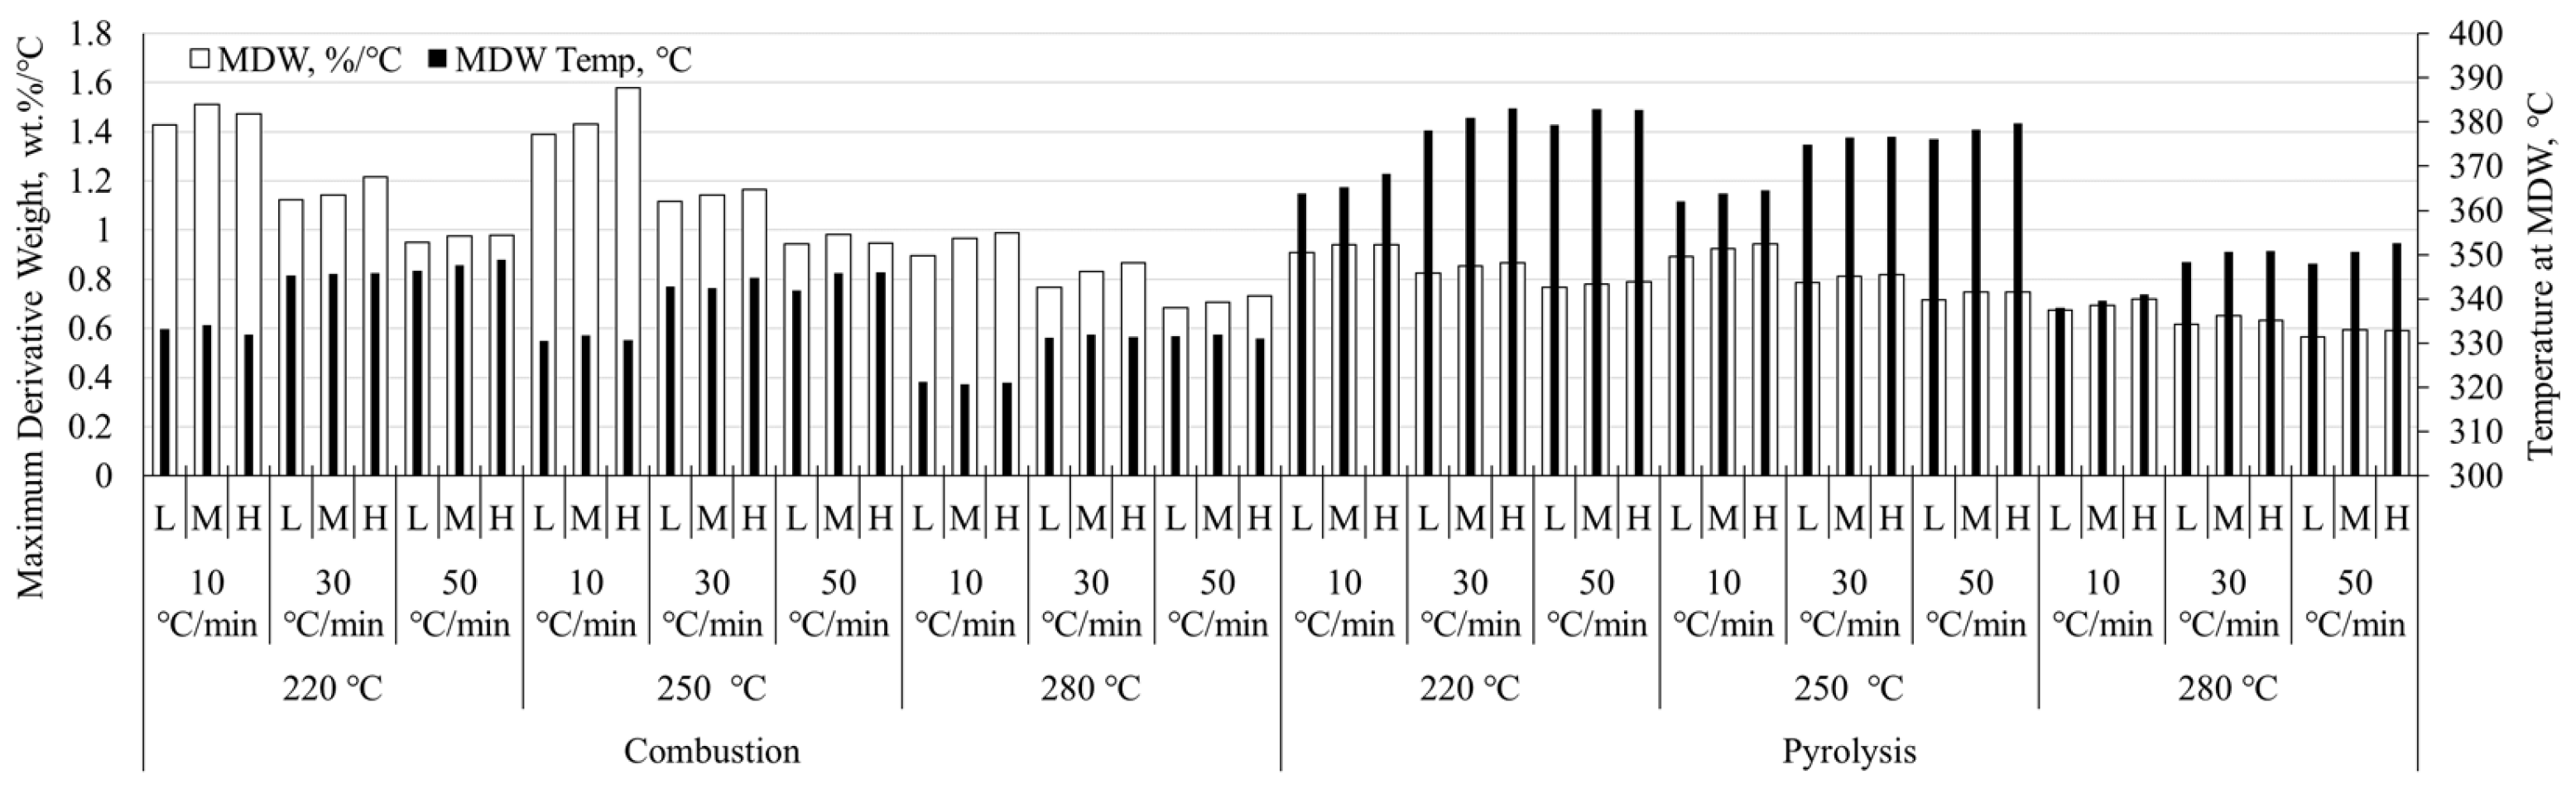
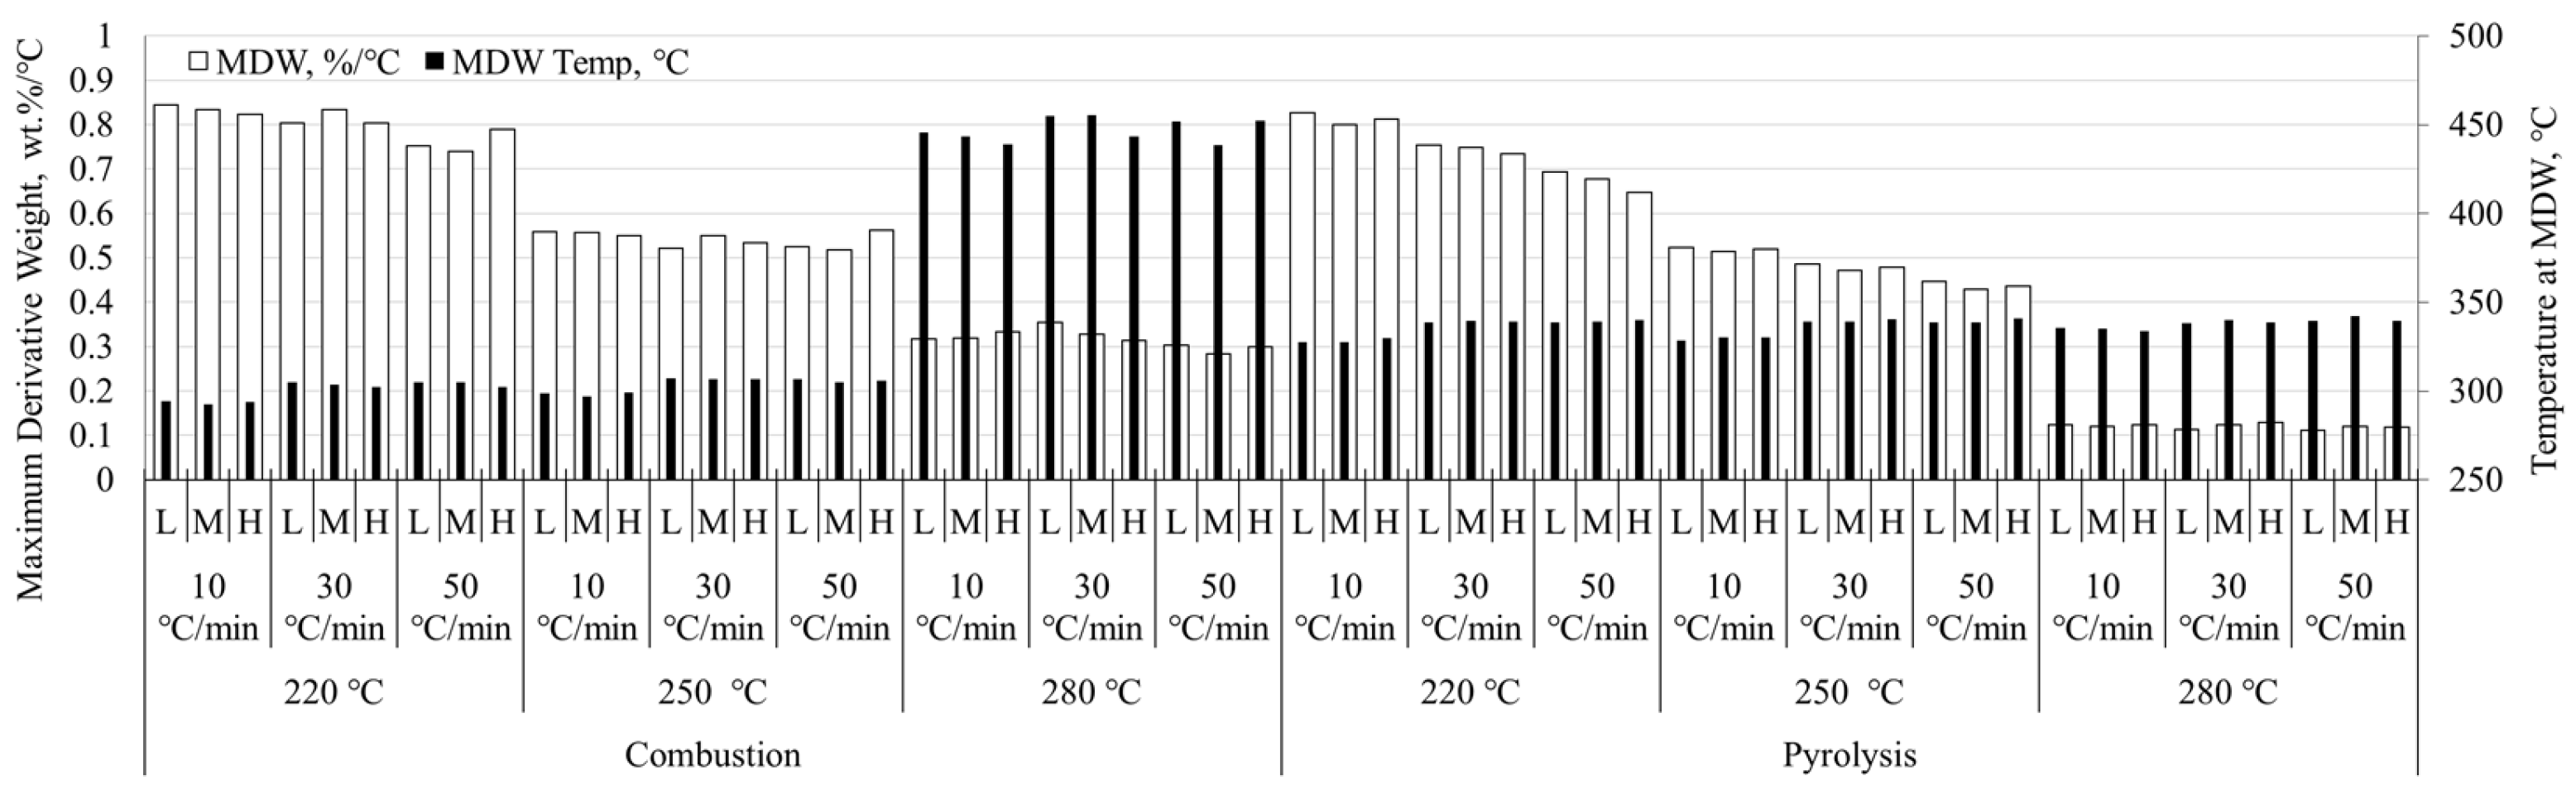
3.1. Maximum Derivative Weight Comparisons of Linearly Heated Samples

The comparison of linearly-heated samples is meant to better frame any discussion of differential thermal analysis as it applies to modulated and Hi-Res™ techniques. These are not expounded here as additional studies are required to satisfy a worthwhile discussion of the advanced techniques. Figure 1 and Figure 2 show the maximum derivative weight (MDW) and the temperature at which the MDW occurs (TMDW) for pine stem wood and wheat straw, respectively. Both of these figures present data for particle size range within heating rate within torrefaction temperature within combustion and pyrolysis conditions. Particle size ranges are shown as L, M, H for low (125–150 μm), medium (400–425 μm), and high (600–630 μm) particle sizes shown in Table 2.
Pine stem wood data shown in Figure 1 exhibit higher MDW under pyrolysis conditions relative to combustion. Higher MDW values are also expressed for larger particles and faster heating rates as if a step change occurs between 10 and 30 °C/min; this trend is also seen in the value of TMDW. Conversely, increased torrefaction temperature results in decreased MDW and TMDW values. Some small variations are apparent with increased particle size.
Similarly, for wheat straw (Figure 2), pyrolysis conditions resulted in higher TMDW except for combustion of char pretreated at 280 °C where the temperature at MDW increases approximately 100 °C. Step-wise decreases are seen with increases in torrefaction temperature for both pyrolysis and combustion, with combustion values having lower variability.

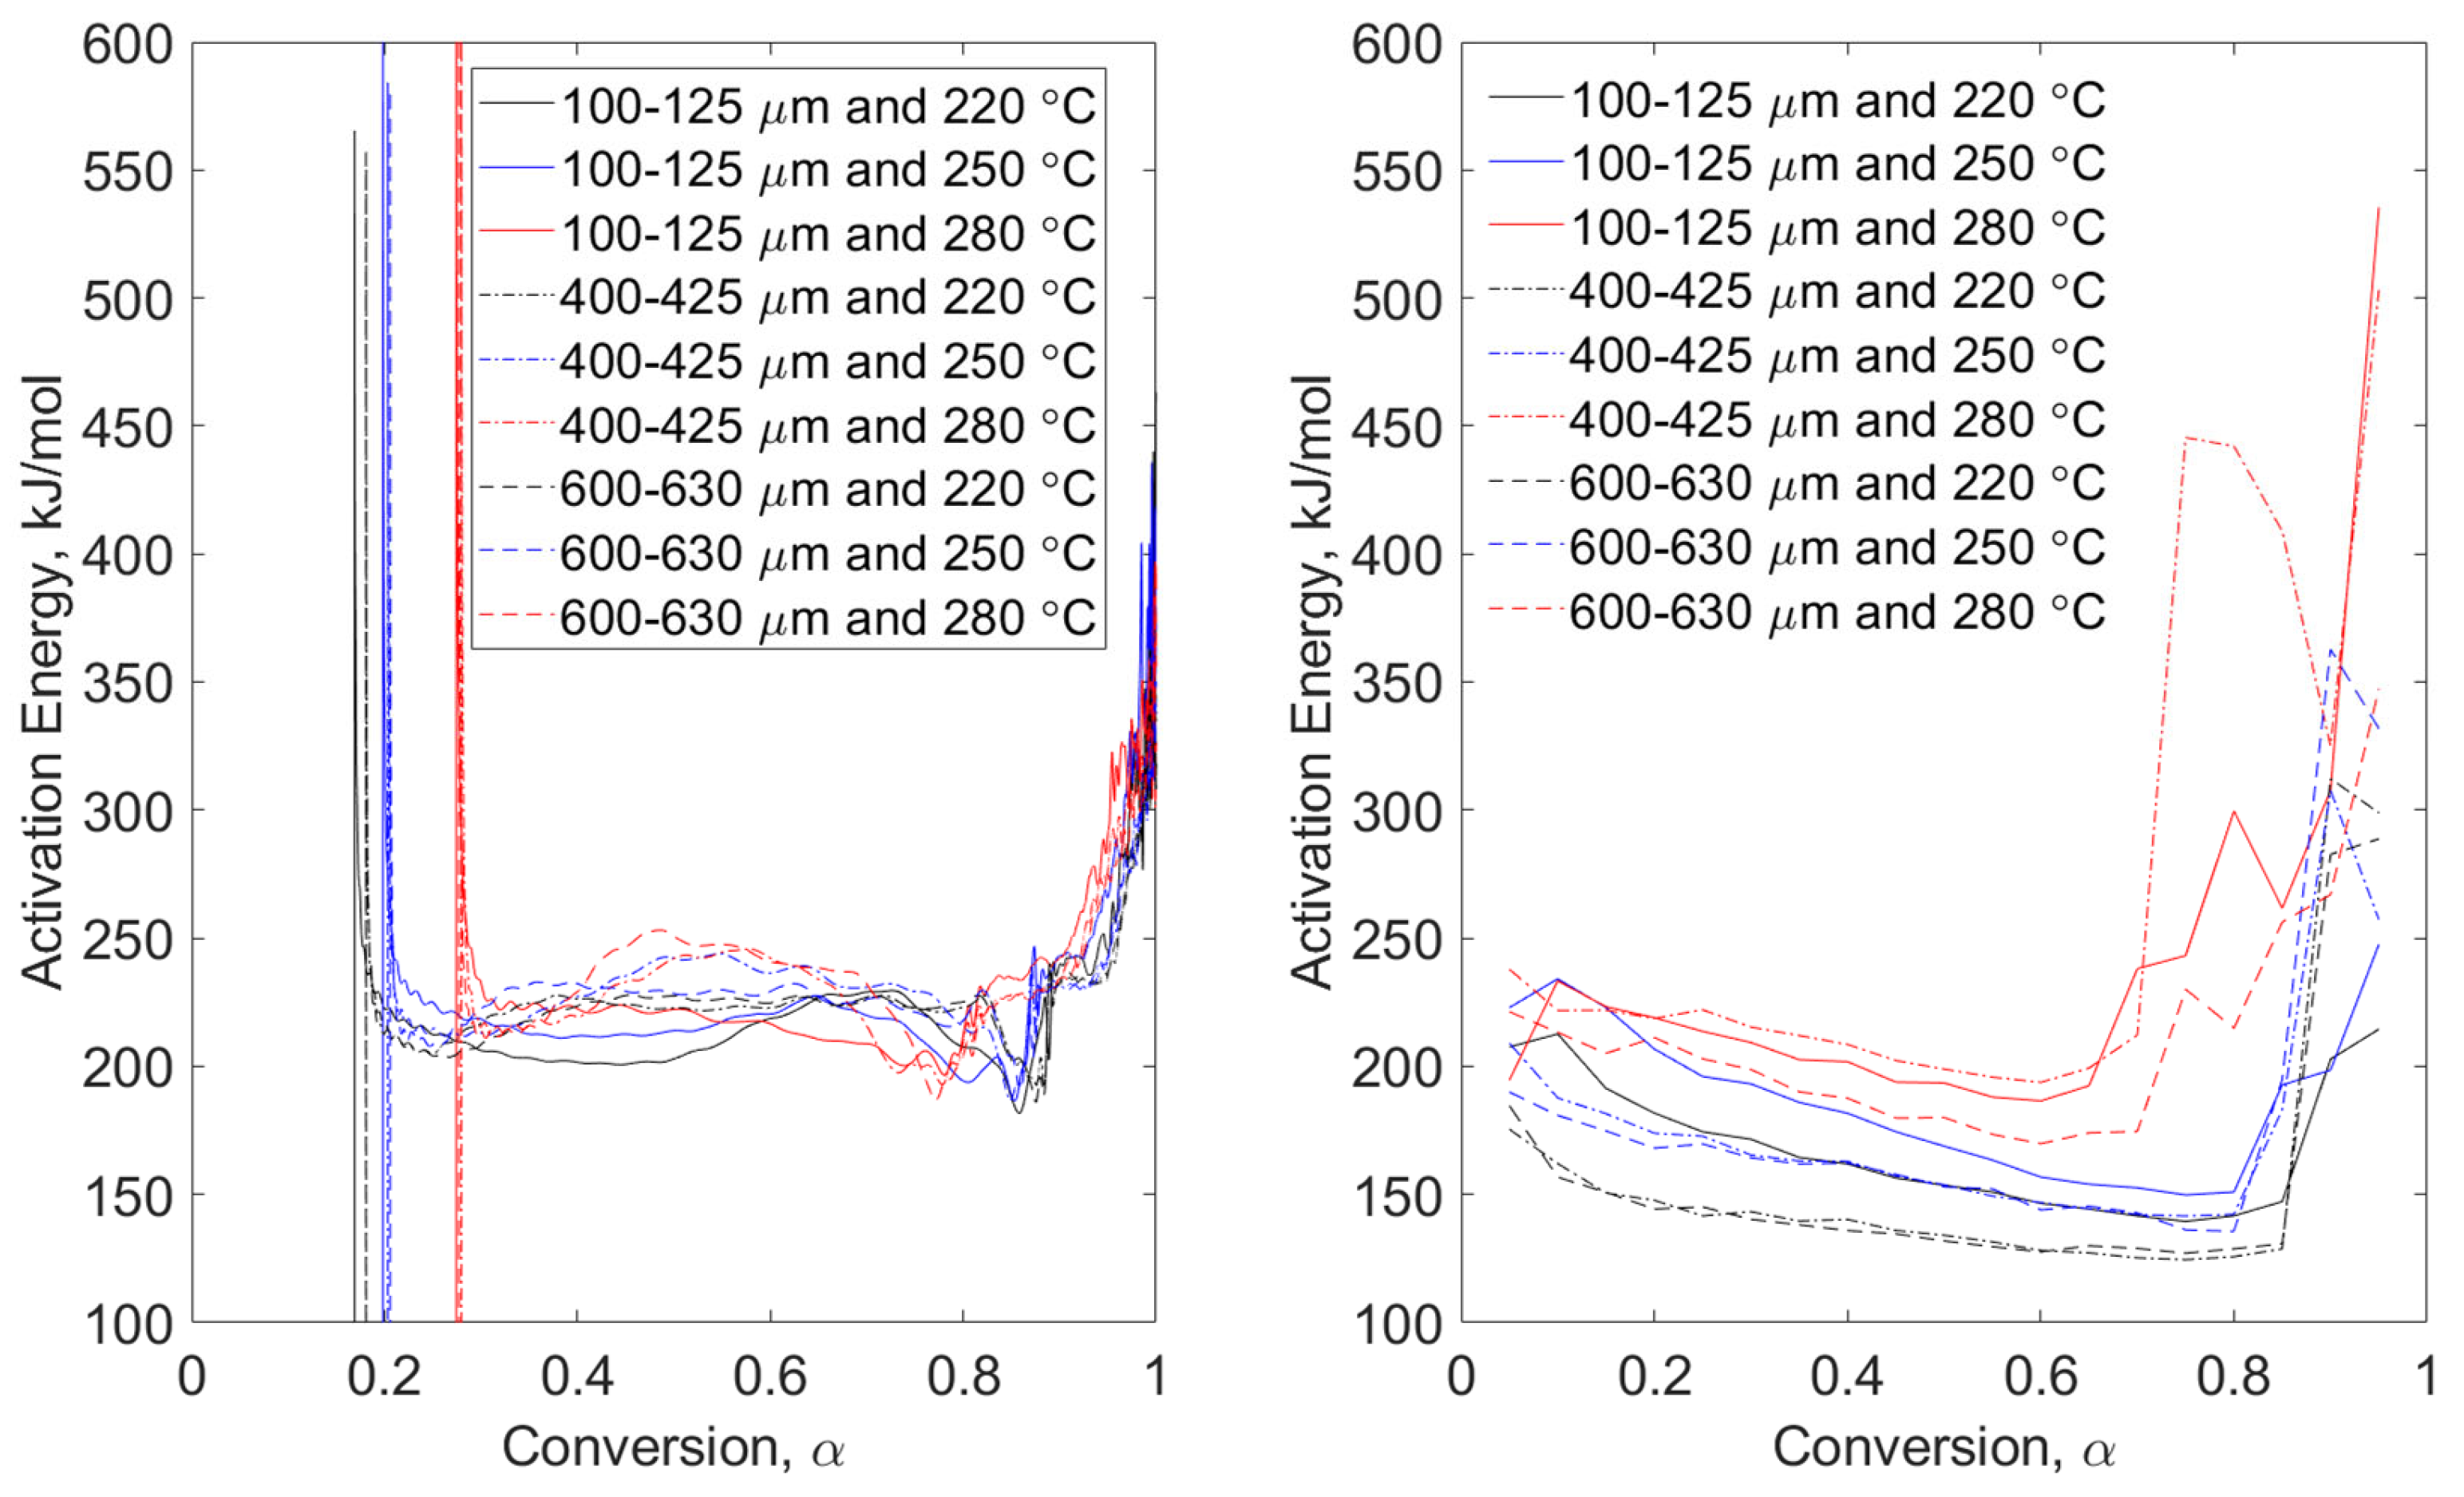
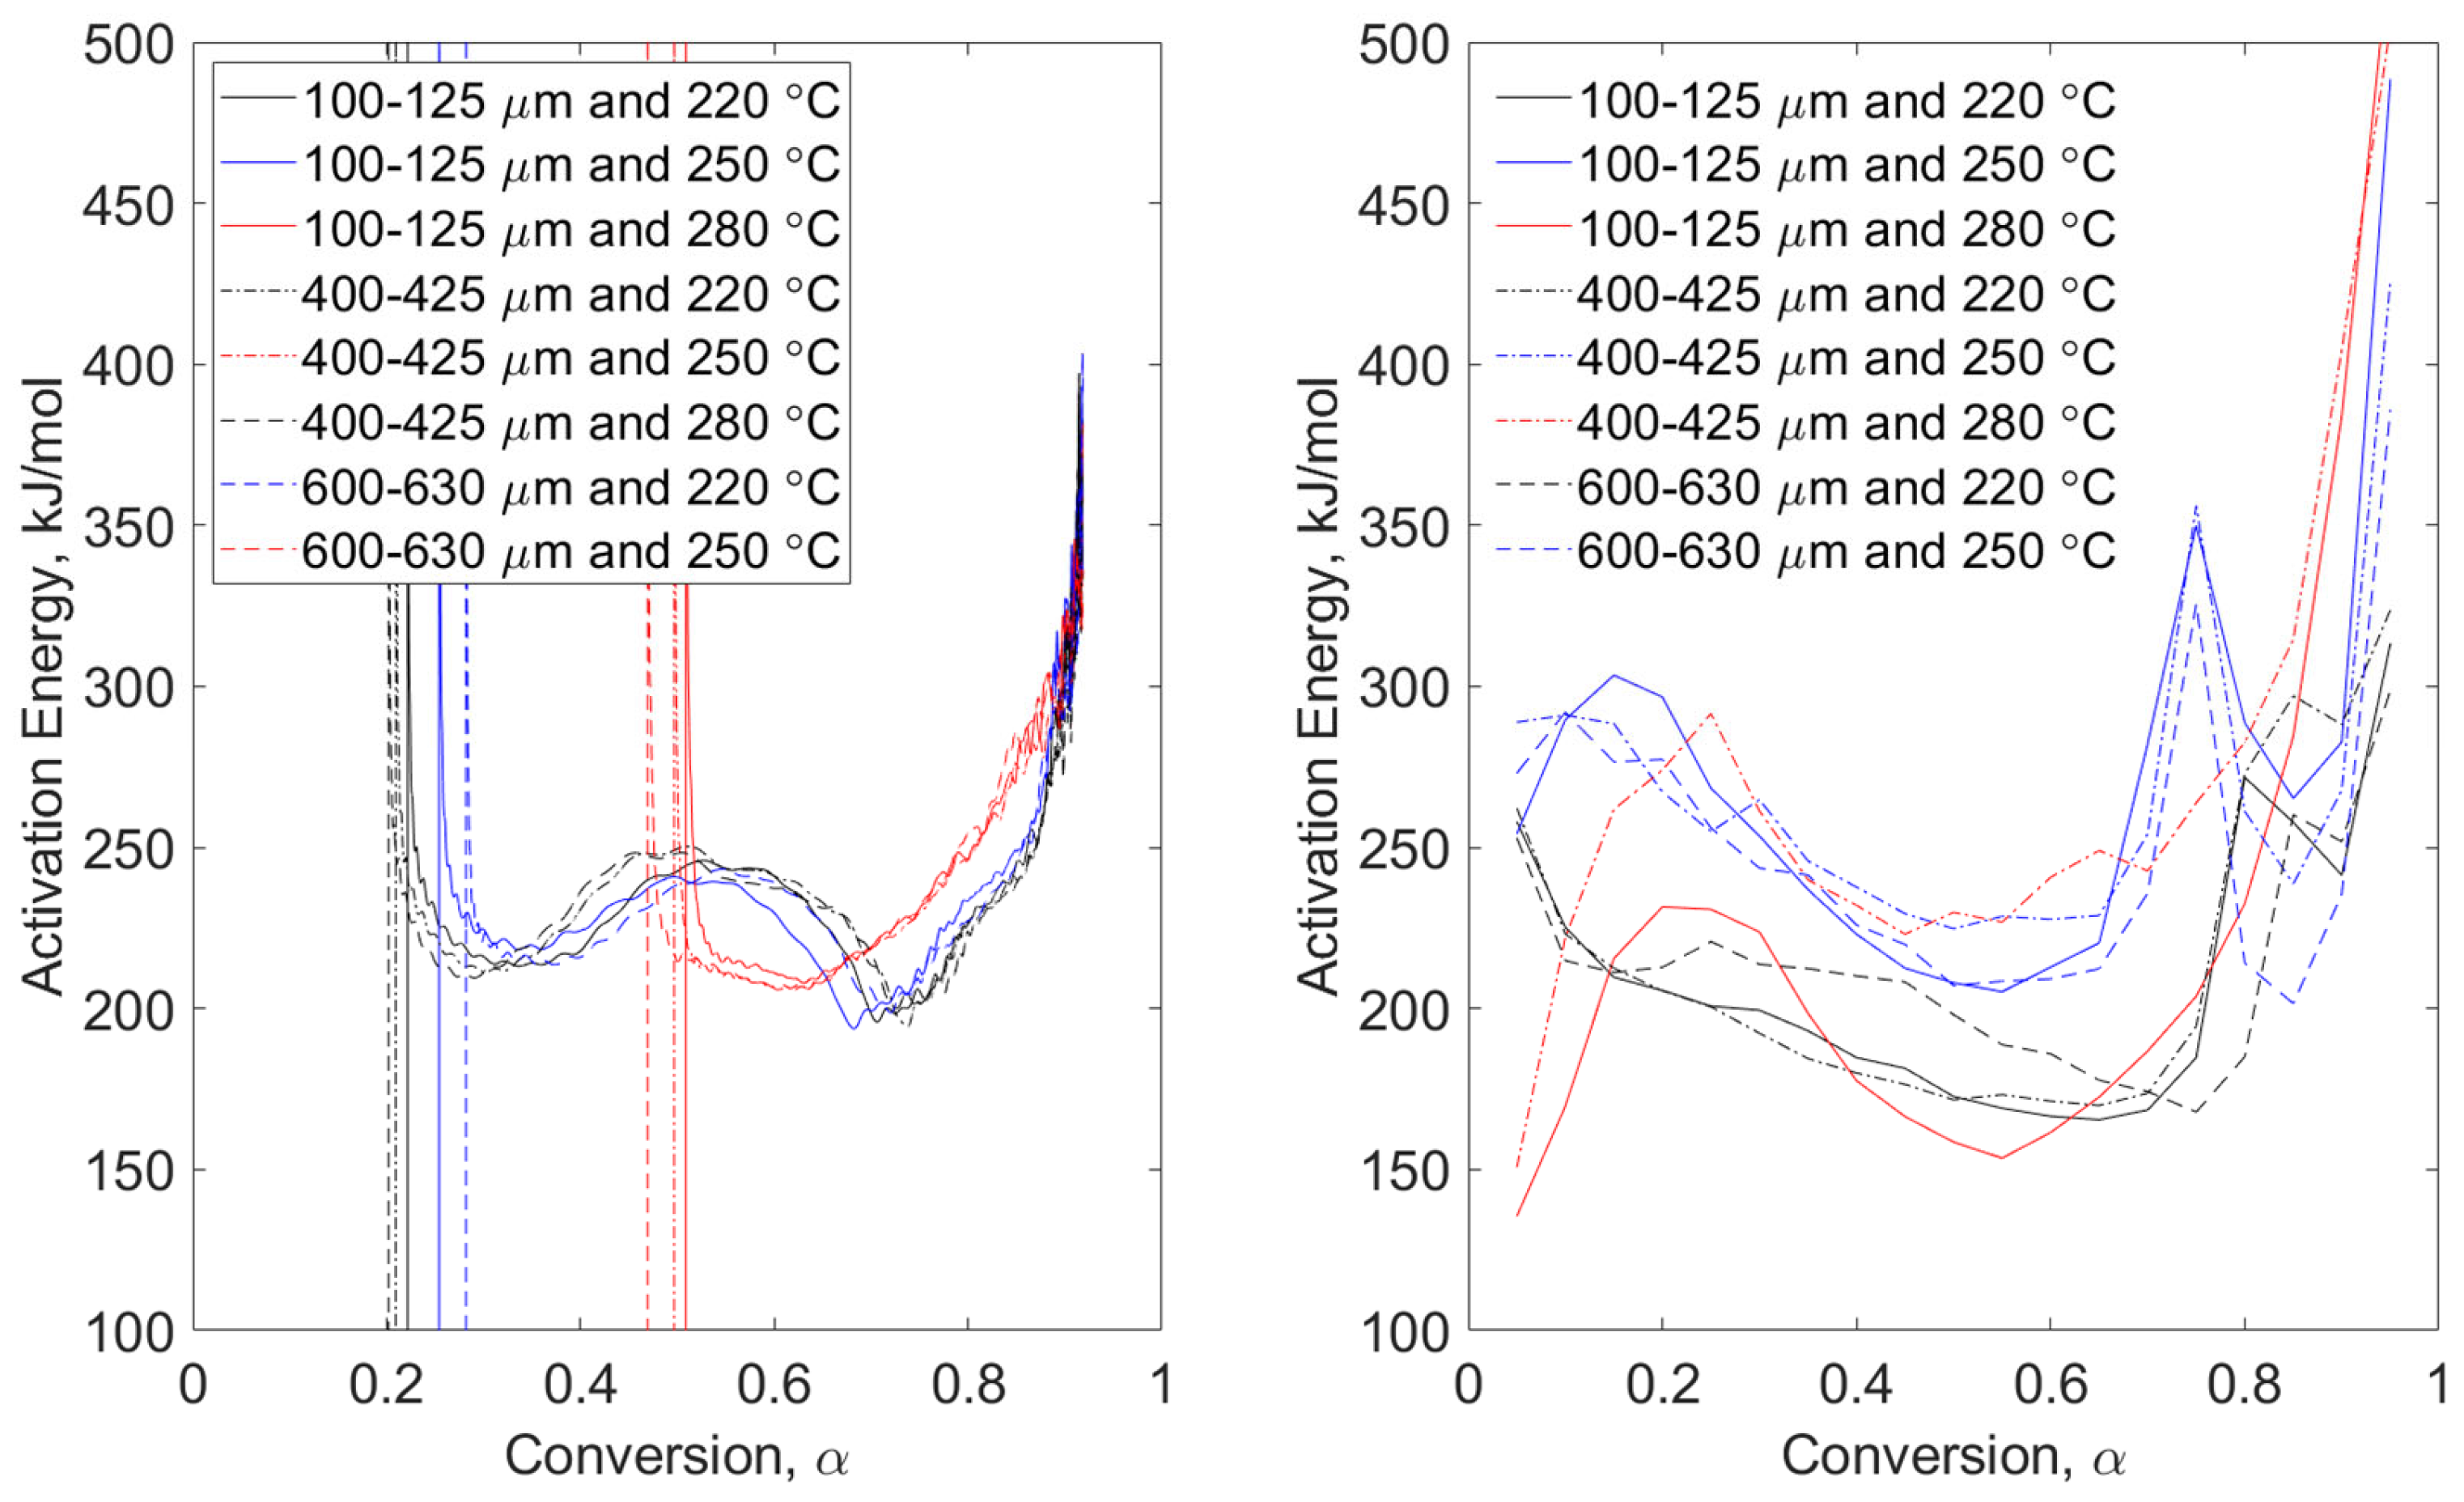
3.2. Comparison of Modulated TGA and OFW Methods

Figure 3, Figure 4, Figure 5 and Figure 6 show direct comparisons of the conventional and MTGA methods in terms of apparent activation energy as a function of fuel conversion. In these figures, particle size range data are grouped by line type (solid, dashed, and dot-dashed) and torrefaction temperature data are grouped by color (black, blue, and red). These data are then compared to non-torrefied fuels in Figure 7 and Figure 8 for modulated and Hi-Res™ methods, respectively. Comparisons are followed by a discussion of maximum derivative weight relating to conventional mass loss data, i.e., the design of experiments shown in Table 2.
Pyrolysis conditions of pine stem wood (Figure 3) show a progressive difference on apparent activation energy as conversion increases. The high magnitude in energies is attributable to the fact that no volatiles remain with limited char structure, resulting in excessive noise in the data. The high energies are essentially a result of the system attempting to devolatilize ash-forming elements and agglomerations. These trends are also seen in the MTGA data and some OFW runs of wheat straw, seen in Figure 4. Modulated tests of wheat straw show higher magnitudes at lower conversion than do the pine stem wood tests due to the difference in ash content per Table 1. In both figures, higher torrefaction temperatures are converted faster. This makes sense since higher pretreatment temperature will promote higher levels of devolatilization.
Although it is difficult to conclude much about the dependence on particle size in the left-hand plots of Figure 3 and Figure 4, pine stem wood conversion of the small particle size range (100–125 μm) results in lower apparent activation energies with conversions up to approximately 0.5. The same cannot be concluded for the OFW-analyzed tests seen in the right-hand plots. Here, no particle size range conclusions can be drawn as easily. Qualitative temperature trends indicate that higher torrefaction temperatures result in higher apparent activation energies. The same cannot be concluded for modulated methods. Consistency in high energies at higher conversion (above α = 0.65) is seen in Figure 3 and Figure 4, indicating practical limits of activation energy for fuel conversion. The value of this practical limit has been investigated by Wagner and Broström [15] under rapid heating conditions, e.g., 103 °C/s. This earlier work shows asymptotic devolatilization behavior at approximately 93% and 81% conversion for pine stem wood and wheat straw, respectively.
Combustion conditions of pine stem wood (Figure 5) and wheat straw (Figure 6) show different behaviors of apparent activation energies for the same particle size ranges and torrefaction temperatures. While the variations in magnitude between modulated datasets of pine stem wood and wheat straw energies are consistent (comparing Figure 3 with Figure 5, and Figure 4 with Figure 6), the trends are distinctly different. While this could be attributable to particle morphology [14], detailed investigation is required. Figure 6 shows strong indicators for considerations of morphology due to narrow groupings of modulated data relative to those seen in Figure 5. This is because the wheat straw particles have a larger aspect ratio than do the pine stem wood particles, essentially comparing sticks (wheat straw) to balls (pine stem wood). Therefore, the dimension of width of wheat straw particles will essentially remain constant regardless of particle “size”. Pine stem wood particles will scale width and length, appearing more sphere-like. This conclusion is reinforced by the grouping of torrefaction temperatures regardless of particle size range of the left-hand plot of Figure 6.
Right-hand plots of Figure 5 and Figure 6 show more consistent grouping of OFW data than those of pyrolysis conditions. The effect of torrefaction temperature is seen in both plots. Pine stem wood combustion (Figure 5) exhibits local maxima at approximate conversion of 0.5, 0.65, and 0.7 for pretreatment temperatures of 280, 250, and 280 °C, respectively. This phenomenon is seen in other data, but additional investigations are required to determine the extent of torrefaction temperature and early conversion dynamics. Apparent activation energies of wheat straw combustion (Figure 6) also show strong dependency on temperature. There is a leftward shift in conversion with higher pretreatment temperatures, which is also seen in modulated tests for both pine stem wood and wheat straw.

3.3. Modulated and Hi-Res™ Thermogravimetry

Additional testing was performed without any pretreatment to quantify the impact of torrefaction. Figure 7 displays modulated TGA data of virgin fuel apparent activation energy versus conversion for pyrolysis (left) and combustion (right) of pine stem wood and wheat straw. Figure 8 shows the Hi-Res™ modulated technique under pyrolysis conditions for pine stem wood and wheat straw with three particle size ranges per fuel. In these figures, line type shows different particle size ranges and red versus black color shows different fuels.
It is clear from these figures that no discernible trends are evident when varying particle size range. This is likely due to the low heating rates necessitated by the methods (2 °C/min) and indicates that fuel devolatilization is taking place in the kinetic regime. Mass transfer is restricted at these low rates and gas-phase component competition is not as limited as with higher heating rates. As with the previous modulated tests, more variability is seen under combustion conditions as opposed to pyrolysis, likely attributable to char oxidation. These apparent activation energy results align with the previous MTGA data in that combustion conditions yield higher values than pyrolysis conditions—200–250 kJ/mol and 175–225 kJ/mol for pine and wheat combustion, respectively, depending on pretreatment.
Hi-Res™ data show no discernible variation in energies with particle size ranges per fuel. Similar to the other pyrolysis tests, distinct energy trends between fuels exist with the influence of fuel-ash percentage being a limiting right-hand maximum activation energy, as the asymptotic behavior indicates. Additional work is required to determine the utility of Hi-Res™ technique for industrial process and reactor design as the applications are case-specific.

4. Discussion

The studies described herein reinforce the importance of lab- and bench-scale experimentation to better understand fuel devolatilization kinetics. Conventional thermogravimetric tests were performed using a design of experiments approach to investigate the effect of torrefaction temperature, particle size range, and heating rate on fuel type under combustion and pyrolysis conditions. Results shows that the application of the Ozawa-Flynn-Wall (OFW) method exhibited comparable apparent activation energies with advanced techniques that include modulated TGA and Hi-Res™ methods. These advanced techniques offered more detail of apparent activation energy trends relative to fuel conversion that indicated side reactions, secondary devolatilization. These advanced methods are not as widespread since advanced or patented software is required, but they do show the need to continue to move the discipline of thermal analysis forward. Table 3 shows a summary of directional effects determined from these studies by parameter tested.
These data highlight the utility of differential thermal analysis for variable heating rates, among the other tested parameters. The heating rate plays an important role in the devolatilization as real systems do not operate in ideal kinetic regimes in which reactions are said to dominate. Instead the influence of mass transfer is important to understand in order to apply fuel kinetics to real systems in terms of reactor and process design. The importance of understanding kinetic limitations is a fundamental concept of process design. Hi-Res™ and modulated techniques, while not perfect, offer a view of optimal reactor design. By understanding at what temperature side reactions, secondary devolatilization, and other events occur, engineers can design state-of-the-art geometries and potentially incorporate fundamentals of process intensification to increase efficiencies, sustainability, and resource management. Solutions to each kinetic dataset will be case-specific, and future work will detail thermochemical conversion applications pertaining to power production. It is vital, however, to include metrics of sustainability to limit harmful environmental effects while still providing optimal economic impact.

5. Conclusions

Conventional and advanced thermogravimetric studies were performed to determine the utility of advanced methods of modulated TGA and Hi-Res™ in future reactor and process design. There is strong potential for these techniques to be used in design. The methods capture greater detail in both reactions and resulting energy usage as a function of temperature and fuel conversion. Results detail the effect of torrefaction temperature, particle size range, and heating rate in combustion and pyrolysis conditions for a Northern Sweden pine stem wood and a wheat straw.
Apparent activation energy results align with the previous MTGA data in that combustion conditions yield higher values than pyrolysis conditions—200–250 kJ/mol and 175–225 kJ/mol for pine and wheat combustion, respectively, depending on pretreatment. The pretreatment method used was torrefaction as this technique has promise as means of transporting fuel in a number of forms, most commonly as pellets or briquettes. Additional studies are required to investigate the utility of such fundamental testing applied to a large-scale application, e.g., fuel preparation or manufacturing for trans-Atlantic or -continental distribution. Future work will detail the sustainability of performing such practices.

Funding

This research received no external funding.

Data Availability Statement

The raw data supporting the conclusions of this article will be made available by the authors on request.

Acknowledgments

The author thanks Markus Broström of Umeå University for support with fuel characterization.

Conflicts of Interest

The author declares no conflict of interest.

References

  1. Haines, P.J. (Ed.) Principles of Thermal Analysis and Calorimetry; The Royal Society of Chemistry: London, UK, 2002. [Google Scholar]
  2. Mao, Z.; Campbell, C.T. Apparent Activation Energies in Complex Reaction Mechanisms: A Simple Relationship via Degrees of Rate Control. ACS Catal. 2019, 9, 9465–9473. [Google Scholar] [CrossRef]
  3. Peterson, C.A.; Hornbuckle, M.K.; Brown, R.C. Biomass pyrolysis devolatilization kinetics of herbaceous and woody feedstocks. Fuel Process Technol. 2022, 226, 107068. [Google Scholar] [CrossRef]
  4. Hu, M.; Chen, Z.; Wang, S.; Guo, D.; Ma, C.; Zhou, Y.; Chen, J.; Laghari, M.; Fazal, S.; Xiao, B.; et al. Thermogravimetric kinetics of lignocellulosic biomass slow pyrolysis using distributed activation energy model, Fraser–Suzuki deconvolution, and iso-conversional method. Energy Convers. Manag. 2016, 118, 1–11. [Google Scholar] [CrossRef]
  5. Dirion, J.-L.; Reverte, C.; Cabassud, M. Kinetic parameter estimation from TGA: Optimal design of TGA experiments. Chem. Eng. Res. Des. 2008, 86, 618–625. [Google Scholar] [CrossRef]
  6. TA Instruments. High Resolution Thermogravimetric Analysis—A New Technique for Obtaining Superior Analytical Results; TA Instruments: New Castle, DE, USA, 1992. [Google Scholar]
  7. Gill, P.S.; Sauerbrunn, S.R.; Crowe, B.S. High resolution thermogravimetry. J. Therm. Anal. 1992, 38, 255–266. [Google Scholar] [CrossRef]
  8. Blaine, R.L. Method and Apparatus of Modulated-Temperature Thermogravimetry. US6113261A, 5 September 2000. [Google Scholar]
  9. Crowe, B.S.; Sauerbrunn, S.R. Method and Apparatus for High Resolution Analysis. US5165792A, 24 November 1992. [Google Scholar]
  10. Teh, J.S.; Teoh, Y.H.; How, H.G.; Sher, F. Thermal Analysis Technologies for Biomass Feedstocks: A State-of-the-Art Review. Processes 2021, 9, 1610. [Google Scholar] [CrossRef]
  11. Grycova, B.; Pryszcz, A.; Krzack, S.; Klinger, M.; Lestinsky, P. Torrefaction of biomass pellets using the thermogravimetric analyser. Biomass Conv. Bioref. 2021, 11, 2837–2842. [Google Scholar] [CrossRef]
  12. Chen, W.H.; Kuo, P.C. A study on torrefaction of various biomass materials and its impact on lignocellulosic structure simulated by a thermogravimetry. Energy 2010, 35, 2580–2586. [Google Scholar] [CrossRef]
  13. Strandberg, A.; Holmgren, P.; Wagner, D.R.; Molinder, R.; Wiinikka, H.; Umeki, K.; Broström, M. Effects of Pyrolysis Conditions and Ash Formation on Gasification Rates of Biomass Char. Energy Fuels 2017, 31, 6507–6514. [Google Scholar] [CrossRef]
  14. Holmgren, P.; Wagner, D.R.; Strandberg, A.; Molinder, R.; Wiinikka, H.; Umeki, K.; Broström, M. Size, shape, and density changes of biomass particles during rapid devolatilization. Fuel 2017, 206, 342–351. [Google Scholar] [CrossRef]
  15. Wagner, D.R.; Broström, M. Time-dependent variations of activation energy during rapid devolatilization of biomass. J. Anal. Appl. Pyrolysis 2016, 118, 98–104. [Google Scholar] [CrossRef]
  16. TA Instruments. Modulated Thermogravimetric Analysis: A New Approach for Obtaining Kinetic Parameters; TA Instruments: New Castle, DE, USA, 1992. [Google Scholar]
  17. Hindmarsh, C.; Thomas, K.; Wang, W.; Cai, H.; Güell, A.; Dugwell, D.; Kandiyoti, R. A comparison of the pyrolysis of coal in wire-mesh and entrained-flow reactors. Fuel 1995, 74, 1185–1190. [Google Scholar] [CrossRef]
  18. Gibbins, J.R.; King, R.A.V.; Wood, R.J.; Kandiyoti, R. Variable-heating-rate wire-mesh pyrolysis apparatus. Rev. Sci. Instrum. 1989, 60, 1129–1139. [Google Scholar] [CrossRef]
  19. Guell, A.J.; Kandiyoti, R. Development of a gas-sweep facility for the direct capture of pyrolysis tars in a variable heating rate high-pressure wire-mesh reactor. Energy Fuels 1993, 7, 943–952. [Google Scholar] [CrossRef]
  20. E1641-16; Standard Test Method for Decomposition Kinetics by Thermogravimetry Using the Ozawa/Flynn/Wall Method. International ASTM: West Conshohocken, PA, USA, 2013; pp. 1–7.
  21. Aburto, J.; Moran, M.; Galano, A.; Torres-García, E. Non-isothermal pyrolysis of pectin: A thermochemical and kinetic approach. J. Anal. Appl. Pyrolysis 2015, 112, 94–104. [Google Scholar] [CrossRef]
  22. Budrugeac, P. Critical study concerning the use of sinusoidal modulated thermogravimetric data for evaluation of activation energy of heterogeneous processes. Thermochim. Acta 2020, 690, 178670. [Google Scholar] [CrossRef]
  23. Cai, J.; Xu, D.; Dong, Z.; Yu, X.; Yang, Y.; Banks, S.W.; Bridgwater, A.V. Processing thermogravimetric analysis data for isoconversional kinetic analysis of lignocellulosic biomass pyrolysis: Case study of corn stalk. Renew. Sustain. Energy Rev. 2018, 82, 2705–2715. [Google Scholar] [CrossRef]
  24. Keuleers, R.R.; Janssens, J.F.; Desseyn, H.O. Comparison of some methods for activation energy determination of thermal decomposition reactions by thermogravimetry. Thermochim. Acta 2002, 385, 127–142. [Google Scholar] [CrossRef]
  25. Mishra, G.; Bhaskar, T. Non isothermal model free kinetics for pyrolysis of rice straw. Bioresour. Technol. 2014, 169, 614–621. [Google Scholar] [CrossRef]
  26. Mishra, G.; Kumar, J.; Bhaskar, T. Kinetic studies on the pyrolysis of pinewood. Bioresour. Technol. 2015, 182, 282–288. [Google Scholar] [CrossRef]
  27. Vyazovkin, S.; Burnham, A.K.; Favergeon, L.; Koga, N.; Moukhina, E.; Pérez-Maqueda, L.A.; Sbirrazzuoli, N. ICTAC Kinetics Committee recommendations for analysis of multi-step kinetics. Thermochim. Acta 2020, 689, 178597. [Google Scholar] [CrossRef]
  28. Koga, N.; Vyazovkin, S.; Burnham, A.K.; Favergeon, L.; Muravyev, N.; Pérez-Maqueda, L.A.; Saggese, C.; Sánchez-Jiménez, P.E. ICTAC Kinetics Committee recommendations for analysis of thermal decomposition kinetics. Thermochim. Acta 2023, 719, 179384. [Google Scholar] [CrossRef]
  29. Mamleev, V.; Bourbigot, S. Modulated thermogravimetry in analysis of decomposition kinetics. Chem. Eng. Sci. 2005, 60, 747–766. [Google Scholar] [CrossRef]
  30. Blaine, R.L.; Hahn, B.K. Obtaining kinetic parameters by modulated thermogravimetry. J. Therm. Anal. Calorim. 1998, 54, 695–704. [Google Scholar] [CrossRef]
  31. Flynn, J.H.; Wall, L.A. A quick, direct method for the determination of activation energy from thermogravimetric data. J. Polym. Sci. Part. B Polym. Lett. 1966, 4, 323–328. [Google Scholar] [CrossRef]
  32. Kubo, S.; Kadla, J.F. Thermal decomposition study of isolated lignin using temperature modulated TGA. J. Wood Chem. Technol. 2008, 28, 106–121. [Google Scholar] [CrossRef]
  33. Schawe, J.E.K. A general approach for temperature modulated thermogravimetry: Extension to non-periodical and event-controlled modulation. Thermochim. Acta 2014, 593, 65–70. [Google Scholar] [CrossRef]
  34. Slough, C.G. Parameter dependency of activation energy in modulated thermogravimetry. J. Test. Eval. 2014, 42, 1343–1354. [Google Scholar] [CrossRef]
  35. Cheng, K.; Winter, W.T.; Stipanovic, A.J. A modulated-TGA approach to the kinetics of lignocellulosic biomass pyrolysis/combustion. Polym. Degrad. Stab. 2012, 97, 1606–1615. [Google Scholar] [CrossRef]
Figure 1. Maximum derivative weight with corresponding temperature of pine stem wood. Data presented for particle size range within heating rate within torrefaction temperature within combustion and pyrolysis conditions.
Reactions 05 00018 g001
Figure 2. Maximum derivative weight with corresponding temperature of wheat straw. Data presented for particle size range within heating rate within torrefaction temperature within combustion and pyrolysis conditions.
Reactions 05 00018 g002
Figure 3. Pyrolysis conditions of pine stem wood—model-free, non-isothermal, MTGA (left) and non-isothermal OFW (right). Particle size range data are grouped by line type (solid, dashed, and dot-dashed) and torrefaction temperature data are grouped by color (black, blue, and red).
Reactions 05 00018 g003
Figure 4. Pyrolysis conditions of wheat straw—model-free, non-isothermal, MTGA (left) and non-isothermal OFW (right). Particle size range data are grouped by line type (solid, dashed, and dot-dashed) and torrefaction temperature data are grouped by color (black, blue, and red).
Reactions 05 00018 g004
Figure 5. Combustion conditions of pine stem wood—model-free, non-isothermal, MTGA (left) and non-isothermal OFW (right). Particle size range data are grouped by line type (solid, dashed, and dot-dashed) and torrefaction temperature data are grouped by color (black, blue, and red).
Reactions 05 00018 g005
Figure 6. Combustion conditions of wheat straw—model-free, non-isothermal, MTGA (left) and non-isothermal OFW (right). Particle size range data are grouped by line type (solid, dashed, and dot-dashed) and torrefaction temperature data are grouped by color (black, blue, and red).
Reactions 05 00018 g006
Figure 7. Pyrolysis (left) and combustion (right) of MTGA tests for pine stem wood and wheat straw.
Reactions 05 00018 g007
Figure 8. Pyrolysis apparent activation energy determined by Hi-Res™ MTGA versus conversion for pine stem wood and wheat straw particle size ranges.
Reactions 05 00018 g008
Table 1. Fuel analyses for pine stem wood and wheat straw. All values are presented on a dry basis.
AnalysisPine [wt.%]Wheat Straw [wt.%]
Ash Content0.48.2
Volatile Matter84.873.4
Carbon50.645.2
Hydrogen6.25.7
Nitrogen0.20.8
Oxygen (diff.)42.640.1
Table 2. Non-isothermal OFW design of experiments outline per fuel.
FactorLevels
LowMidHigh
Pretreatment Temperature [°C]220250280
Particle Size Ranges [micron]125–150400–425600–630
Heating Rate [°C/min]103050
Gas-phase O2 [vol%]0-21
Table 3. Summary of directional effects from all tested parameters and fuels.
Increase inDirectional Effect
Pretreatment (Torrefaction) Temperature
  • Increase in apparent activation energy under pyrolysis, but decrease in energy for under combustion conditions using OFW method.
  • Decrease in apparent activation energy for combustion conditions using MTGA; no definitive trend for pyrolysis conditions.
  • Increase in TMDW for wheat straw combustion and pyrolysis, but a decrease in TMDW for pine in both cases.
  • Decrease in pine stem wood and wheat straw MDW during pyrolysis and combustion.
Particle Size Range
  • Limited particle size range conclusions can be drawn from OFW method, likely due to low heating rates in the kinetic regime. The same is true for MTGA and Hi-Res™.
  • Decrease in conversion rate as torrefaction temperature is increased.
  • Upward trend in TMDW for both fuels under pyrolysis conditions, but flat for combustion conditions.
Heating Rate
  • Increase in TMDW for pine stem wood combustion and pyrolysis, but no influence of heating rate is seen with wheat straw, likely due to particle morphology.
  • Decrease in pine stem wood MDW during pyrolysis and combustion; large decreases under combustion conditions.
Disclaimer/Publisher’s Note: The statements, opinions and data contained in all publications are solely those of the individual author(s) and contributor(s) and not of MDPI and/or the editor(s). MDPI and/or the editor(s) disclaim responsibility for any injury to people or property resulting from any ideas, methods, instructions or products referred to in the content.

