Abstract
The aim of this work was to develop a kinetic model based on the power law to describe the evolution of glycerol conversion and product distribution in the crude glycerol (G) acetylation reaction with acetic acid (AA) without the use of a catalyst. For this purpose, experimental tests were carried out with analytical glycerol under different reaction conditions (T = 80–160 °C, AA/G = 1–9 molar ratio, t = 0.25–2 h). The results showed the formation of mono- (MAG), di- (DAG) and tri- (TAG) acetylglycerols, liquid products with multiple applications in the chemical industry. From these results, a kinetic model based on the power law was implemented, which could acceptably estimate the experimental concentrations with an average relative error of 14.9%. Then, crude glycerol samples from different biodiesel industries were characterized by identifying and quantifying the impurities present in them (H2O, CH3OH, NaOH, NaCOOH, MONG and NaCl), and employed as reactants in the reaction tests. Given the significant differences observed in the glycerol conversion values compared to those obtained with analytical glycerol, further reaction tests were conducted to elucidate the effect of each impurity over the glycerol conversion. In these tests, the different impurities were added individually, maintaining the same concentration range as that of the crude glycerol samples. From the results obtained, global activity factors were introduced, which allowed us to modify the kinetic model to estimate glycerol conversions in the crude glycerol samples with an average relative error of 7%. It is hoped that this kinetic model will be a powerful tool useful for designing reactors on an industrial scale.
1. Introduction
The global expansion of the biodiesel industry has resulted in an increase in the supply of glycerol, a byproduct of its synthesis process. Given its chemical functionality, glycerol can be used as a platform molecule to obtain valuable chemicals and energy.
In this context, glycerol biorefineries represent a sustainable and eco-compatible business model. They are environmentally focused establishments that integrate different technological processes to produce chemical products and energy from glycerol [1].
Among the possible glycerol conversion reactions, reforming [2], hydrogenolysis [3,4], ketalization [5,6] and acetylation [7] are trendline topics nowadays. In particular, acetylation has gained relevance in recent years, due to the particular interest in the products obtained from the reaction [8].
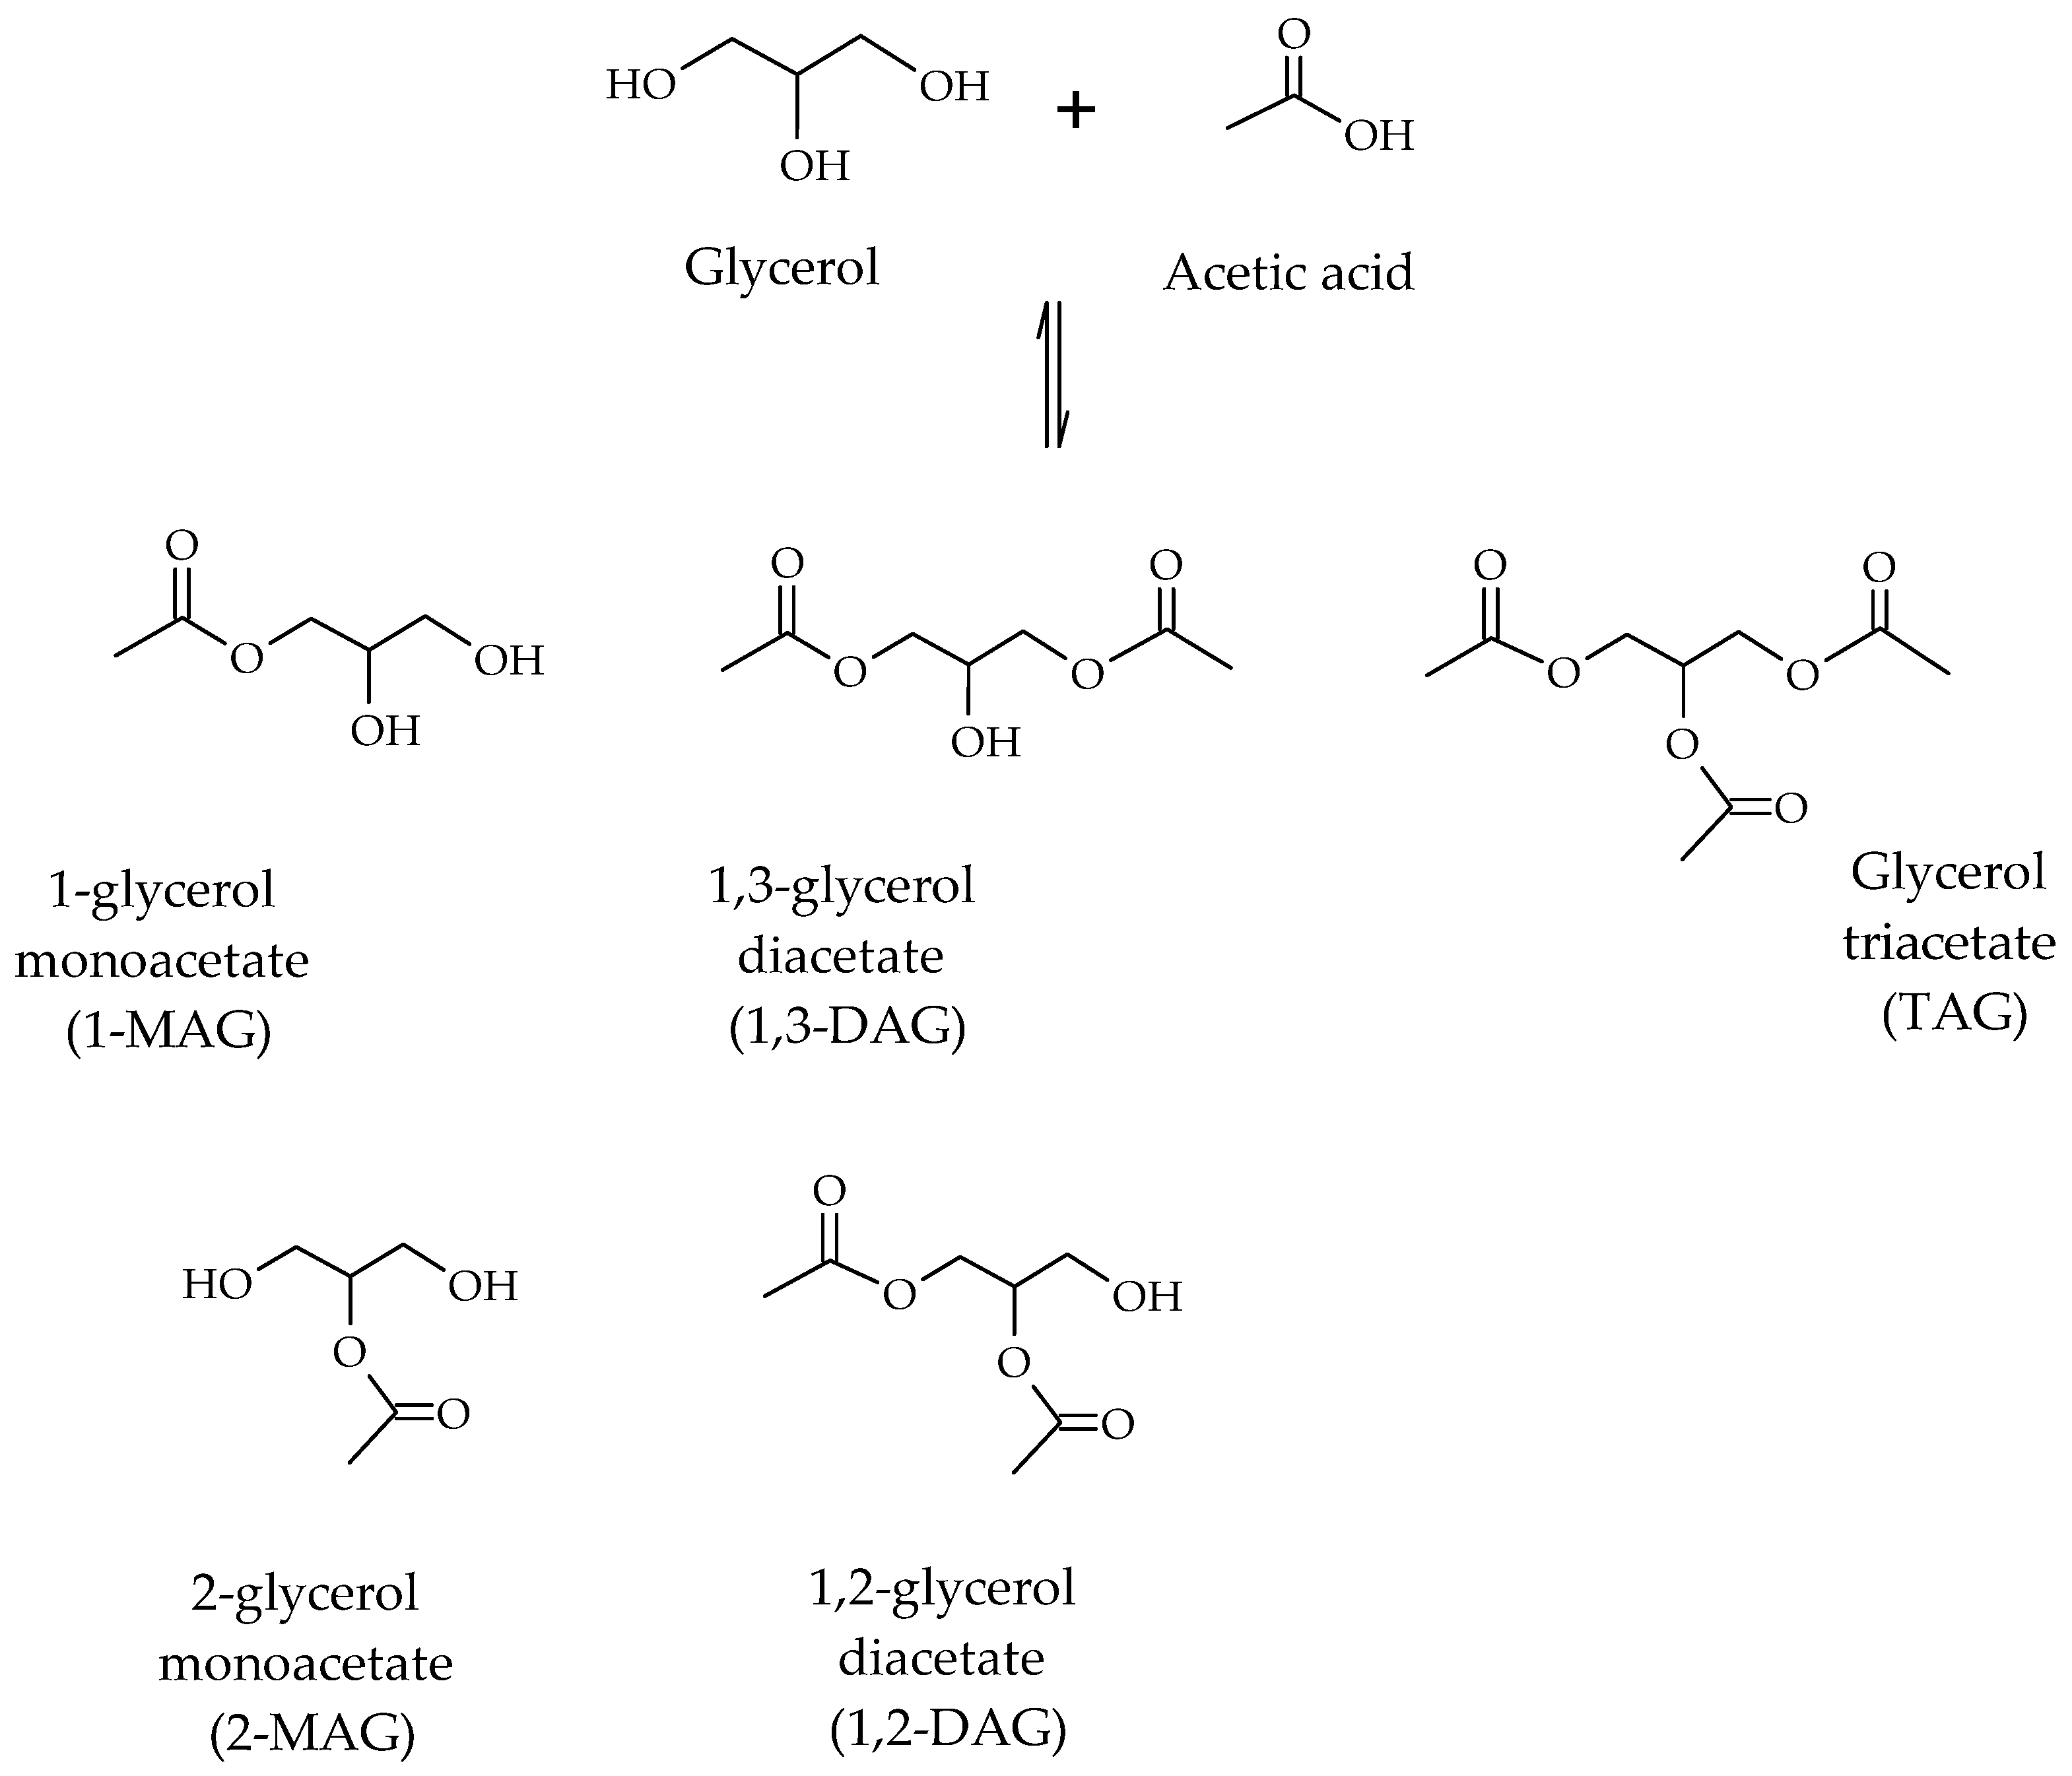
Glycerol acetylation is carried out in the presence of acetic acid, leading to the formation of mono-, di- and tri-esters of glycerol due to the presence of multiple hydroxyl groups on the glycerol molecule (Scheme 1).

Scheme 1.
Scheme of reactions involved in glycerol acetylation [8].
The mono-, di- and tri-acetylglycerols have diverse industrial applications. With regards to mono-acetylglycerols (MAGs) and di-acetylglycerols (DAGs), they are used to produce biodegradable polyesters and food additives [9]. In particular, MAGs are used as additives in the pharmaceutical and food industries, and for the manufacture of explosives and smokeless gunpowder. DAGs are found in cocoa butter and are used as intermediates in the structural synthesis of lipids. With respect to triacetylglycerol, also called triacetin (TAG), this is used in the production of cosmetics, plasticizers and solvents [10]. In addition, the high O/C ratio in its molecule makes it a promising biocomponent for fuels, improving their performance, facilitating their transport at low temperatures and reducing the emission of harmful gases in their combustion.
Glycerol acetylation is an esterification-type reaction, and therefore, is a reversible reaction limited by the thermodynamic equilibrium. In a previous work, our group studied the effect of temperature (80–230 °C) and the initial molar ratio of acetic acid to glycerol (1–12) on glycerol conversion and selectivity to MAG, DAG and TAG products, in a thermodynamic study. The results of this research determined that the AA/G molar ratio affects the glycerol conversion to a greater extent than temperature, and higher values of AA/G should be employed to displace the reaction for the formation of more substituted products [11].
For this reaction, two catalytic mechanisms have been proposed, one in the presence of Brønsted acid sites [12,13,14,15,16] and the other in the presence of Lewis’s acid sites [17].
As acetic acid is a Brønsted acid, its presence generates an autocatalytic reaction, leading to the formation of MAG, DAG and TAG, without the need for any catalyst. In this case, the acetic acid firstly dissociates and generates the proton that catalyzes the reaction. Then, in Step 1, the carbonyl group of the acid is protonated, increasing the positive charge on the carboxyl carbon and enhancing its reactivity towards nucleophiles (Scheme 2). In Step 2, glycerol attacks the carbonyl carbon of the protonated acid, forming a new C-O bond. Step 3 consists of the protonation of the -OH group, improving its leaving-group capability, so in Step 4, the intermediate loses a water molecule. Then, in Step 5, the molecule loses and regenerates a proton, forming MAG, and the mechanism continues sequentially to form DAG and TAG [12].
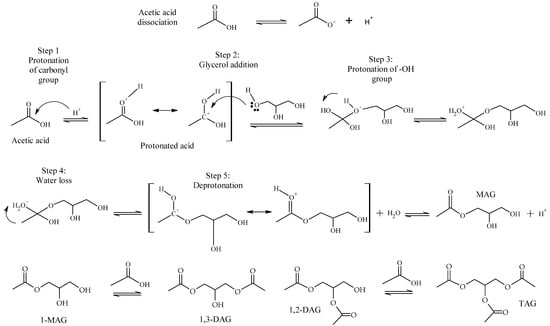
Scheme 2.
Mechanism of autocatalyzed glycerol acetylation.
The esterification reaction between glycerol and acetic acid has been studied in the homogeneous phase without a catalyst [13] and using sulfuric acid [14,15,16].
With regards to kinetics models, only a few studies have been published in the presence of solid acid catalysts, using the power law model [18,19,20], Langmuir–Hinshelwood–Hougen–Watson expressions [21,22], the Eley–Rideal model [23] and the pseudo-homogeneous model [24]. Among these, the power law kinetic models are the simplest ones as they allow for expressing the reaction rate by employing simple mathematical expressions that are involved in balance mass equations, which depend on the reactor type and model flow. Commercial software can be used to solve these equations for the design of industrial reactors.
Patel et al. employed tungstophosphoric acid (TPA) supported on MCM-41 and ZrO2 as catalysts, and developed a kinetic expression that follows a first-order dependence on glycerol (Equation (1)) [18].
Subsequently, Rane et al. employed a sulfated alumina (SO42−/γ-Al2O3) as a catalyst, determining that the reaction rate follows a pseudo-second-order dependence on glycerol (Equation (2)) [19].
In turn, Veluturla et al. employed a partially Cs-exchanged heteropolyacid (CsPWA), from which they determined that each stage of the esterification reaction can be described by the power law with a pseudo-first order for each compound involved [20].
The triglyceride transesterification reaction produces approximately 10 wt.% of glycerol as a byproduct, called crude glycerol, with a degree of purity between 55 and 90 wt.% depending on the source of triglycerides used, the catalyst employed and the conditions of the synthesis process. Generally, the impurities encountered include traces of unreacted triglycerides and short-chain alcohol, biodiesel, grade acids, soaps and other minority compounds [25,26,27].
Crude glycerol can be further refined for use in various applications, which will establish the specifications it must meet. Once treated, it can be used in the food and beverage industry, as a humectant, sweetener and preservative, and in the cosmetics industry, as an ingredient in toothpastes, lotions, shaving creams, deodorants, make-up and creams. It has also been reported to be used in the pharmaceutical industry, as an active agent in veterinary drugs [28]. As the processes required to refine crude glycerol can be expensive, one of the biggest challenges in the biorefinery concept is to use crude glycerol samples as they come from the biodiesel industry, untreated.
The aim of this work was to develop a power-law-based kinetic model to describe the evolution of glycerol conversion and product distribution in the crude glycerol acetylation reaction with acetic acid without the use of a catalyst.
2. Materials and Methods
2.1. Reaction Tests
Reaction tests were carried out in a stainless-steel high-pressure reactor BR-100 system, from Berghof Instruments (Berghof Products + Instruments, Eningen unter Achalm, Germany), with a volume of 100 mL, operated in batch mode. The magnetic stirring was set at 1000 rpm to ensure kinetically controlled conditions.
In a typical experiment, certain amounts of glycerol (G) and acetic acid (AA) were loaded into the reactor, using AA/G molar ratios between 1 and 9. Then, the reactor was pressurized to 2 MPa with N2 and heated to the desired temperature (80–160 °C). In some reaction tests, analytical glycerol (99.99% p/p, Cicarelli, Santa Fe, Argentina) was employed, while in other cases, crude glycerol samples were used.
After the reaction, the system was cooled to an ambient temperature and liquid and gaseous samples were collected. For the analysis and quantification of liquid products, a GCMS-QP505A Shimadzu chromatograph was used (Shimadzu Corporation, Tokyo, Japan), equipped with a PE-Elite-Wax capillary column (30 m × 0.25 mm × 0.5 µm) purchased by Perkin Elmer (Bradford, PA, USA) and with FID and MS detectors (Shimadzu Corporation, Tokyo, Japan).
The total glycerol conversion (X) was determined using Equation (6), where stands for the initial moles of glycerol and stands for the final moles of glycerol.
The selectivity to each liquid product (Si) was defined by Equation (7), where stands for the final moles of the compound i.
The carbon balance (C) was calculated using Equation (8), where stands for the moles of carbon in the products and stands for the initial moles of acetic acid.
2.2. Kinetic Model
In Scheme 1, it can be observed that the formation of MAG proceeds through the reaction between glycerol (G) and acetic acid (AA). Then, the formation of DAG proceeds through the reaction between MAG and AA, and finally, TAG is formed from DAG and AA. In all steps, there is a release of water (W) (Equations (9)–(11)).
In order to describe the evolution of glycerol conversion and the distribution of liquid products in the reactor, a power-law-type kinetic model was implemented to represent the reaction rates of each reaction step, considering that all of them are elementary and reversible (Equations (12)–(14)).
Then, the rate of glycerol and acetic acid consumption and the formation rates of each liquid product can be expressed as Equations (15)–(20).
The rate of glycerol and acetic acid consumption, and the formation rates for each liquid product (MAG, DAG, TAG) were determined from concentration profiles obtained from the activity tests using the differential method. Then, the kinetic coefficients (k1, k1′, k2, k2′, k3 and k3′) were then calculated using multiple linear regression. In the estimation of the parameters, a confidence level of 95% was established. Once the kinetic parameters were determined, the balance equations were numerically integrated using Euler’s method.
According to the Arrhenius law, the kinetic coefficients follow the expression presented in Equation (21).
The apparent activation energy (Eaj) and the pre-exponential factor (koj) can be obtained by linearizing Equation (21).
2.3. Characterization of Crude Glycerol Samples
To study the effect of impurities, different types (A, B, C, D and E) of crude glycerol were used, supplied by chemical plants located in the province of Buenos Aires, Argentina. They were characterized according to their density, pH and concentrations of glycerol, water, methanol, ash and matter organic non-glycerol (MONG).
The pH was determined using 1 g of crude glycerol dissolved in 50 mL of distilled water using a digital pH meter (Ohaus ST20, Greifensee, Switzerland) at room temperature.
Density was determined using a pycnometer at room temperature according to ASTM 891-95 [29]. Glycerol and methanol concentrations were determined using dilute solutions of crude glycerol by gas chromatography employing a Shimadzu GCMS-QP505A instrument (Shimadzu Corporation, Tokyo, Japan) equipped with a PE-Elite-Wax capillary column (30 m × 0.25 mm × 0.5 µm) and FID detector. The water content was measured using a Karl Fischer titrator (SI Analytics TitroLine Alpha 20 Plus, Xylem Analytics, Weilheim, Germany) according to ISO 760-1978 [30]. The ash content was determined by burning 1 g of crude glycerol in a muffle at 750 °C for 3 h (ISO 2098-1972) [31]. The matter organic non-glycerol (MONG) content was calculated as shown in Equation (22). This set of compounds does not include methanol, which was determined by gas chromatography, as mentioned above.
MONG (wt.%) = 100 − glycerol content (wt.%) −
ash content (wt.%) − water content (wt.%)
ash content (wt.%) − water content (wt.%)
2.4. Activity Factor and Modified Kinetic Model
As crude glycerol samples affect the reaction rate of glycerol consumption, the kinetic model must be modified so as to contemplate the effect of the crude glycerol composition over glycerol conversion.
The impurities contained in crude glycerol samples contribute to decreasing the reaction rate in a certain extension, so their presence can be quantified considering a global activity factor that acts as an activity deactivation factor. This global activity factor (a) can be expressed as a concentration activity factor (ac) that depends on the total concentration of impurities (C) and a time activity factor (at) that depends on the reaction time (t) (Equation (23)).
As crude glycerol samples contain more than one impurity (i = 1… N), the concentration activity factor must be expressed in terms of each impurity concentration (Ci), considering an individual activity factor (ai), using Equation (24).
The experimental tests using analytical glycerol and each impurity of crude glycerol samples allowed us to calculate the individual activity factor, which concerns the effect of the impurity over the glycerol acetylation reaction, according to Equation (25).
In Equation (25), (−rG) is the rate of glycerol consumption in the absence of impurities and (−rG′) is the rate of glycerol consumption in the presence of a certain impurity.
As the individual activity factors are an exclusive function of the concentration of each impurity, they can be fitted using the expression presented in Equation (26).
In Equation (26), it is verified that when Ci = 0, ai = 1 and (−rG′) = (−rG). By linearizing this equation, their characteristic parameters (n, ki, Ki) can be obtained.
Combining Equations (24) and (26), the activity factor depending on the total concentration of impurities can be expressed by Equation (27).
So as to obtain the time activity factor, the model considering by Bartholomew and Farrauto was adopted [32]. According to this model, the change in the global activity factor with respect to the reaction time is proportional to the global activity factor at that moment raised to a certain exponent (d) (Equation (28)).
The proportionality constant (kd) must take into account the concentration of each impurity in crude glycerol samples, as they affect the global activity as time passes by. To consider this effect, the proportionality constant can be set equal to the concentration activity factor (ac). Considering a first-order dependence (d = 1), and the definition of the global activity factor in Equation (23), Equation (29) was obtained.
Integrating Equation (29), Equation (30) was obtained.
Then, combining Equations (27) and (30), the global activity factor was expressed by Equation (31).
Based on the global activity factor, the rate of glycerol consumption in the presence of all impurities is expressed by Equation (32).
Using Equation (32) and employing the Euler method, the values of glycerol conversion predicted by the model were estimated for the different crude glycerol samples.
Finally, to establish a quantitative deviation of the experimental values with respect to those predicted by the model, the average relative errors (E) were calculated individually for the concentrations of glycerol and the liquid products according to Equation (33).
In Equation (33), j represents the j-th experiment, M represents the number of experiments, Cexp is the concentration obtained from the experiments and Cmod is the concentration predicted from the model.
3. Results and Discussion
3.1. Reaction Tests Employing Analytical-Grade Glycerol
In order to develop a kinetic model of the autocatalytic reaction using analytical-grade glycerol (99.99%), the effect of the reaction time (0.25–2 h) and the AA/G molar ratio (1–9) was studied in the range of 80–160 °C. The reaction products identified in the liquid phase were mono-acetylglycerols (MAGs), di-acetylglycerols (DAGs) and tri-acetylglycerol (TAGs). In all cases, the carbon balance was close to 98%.
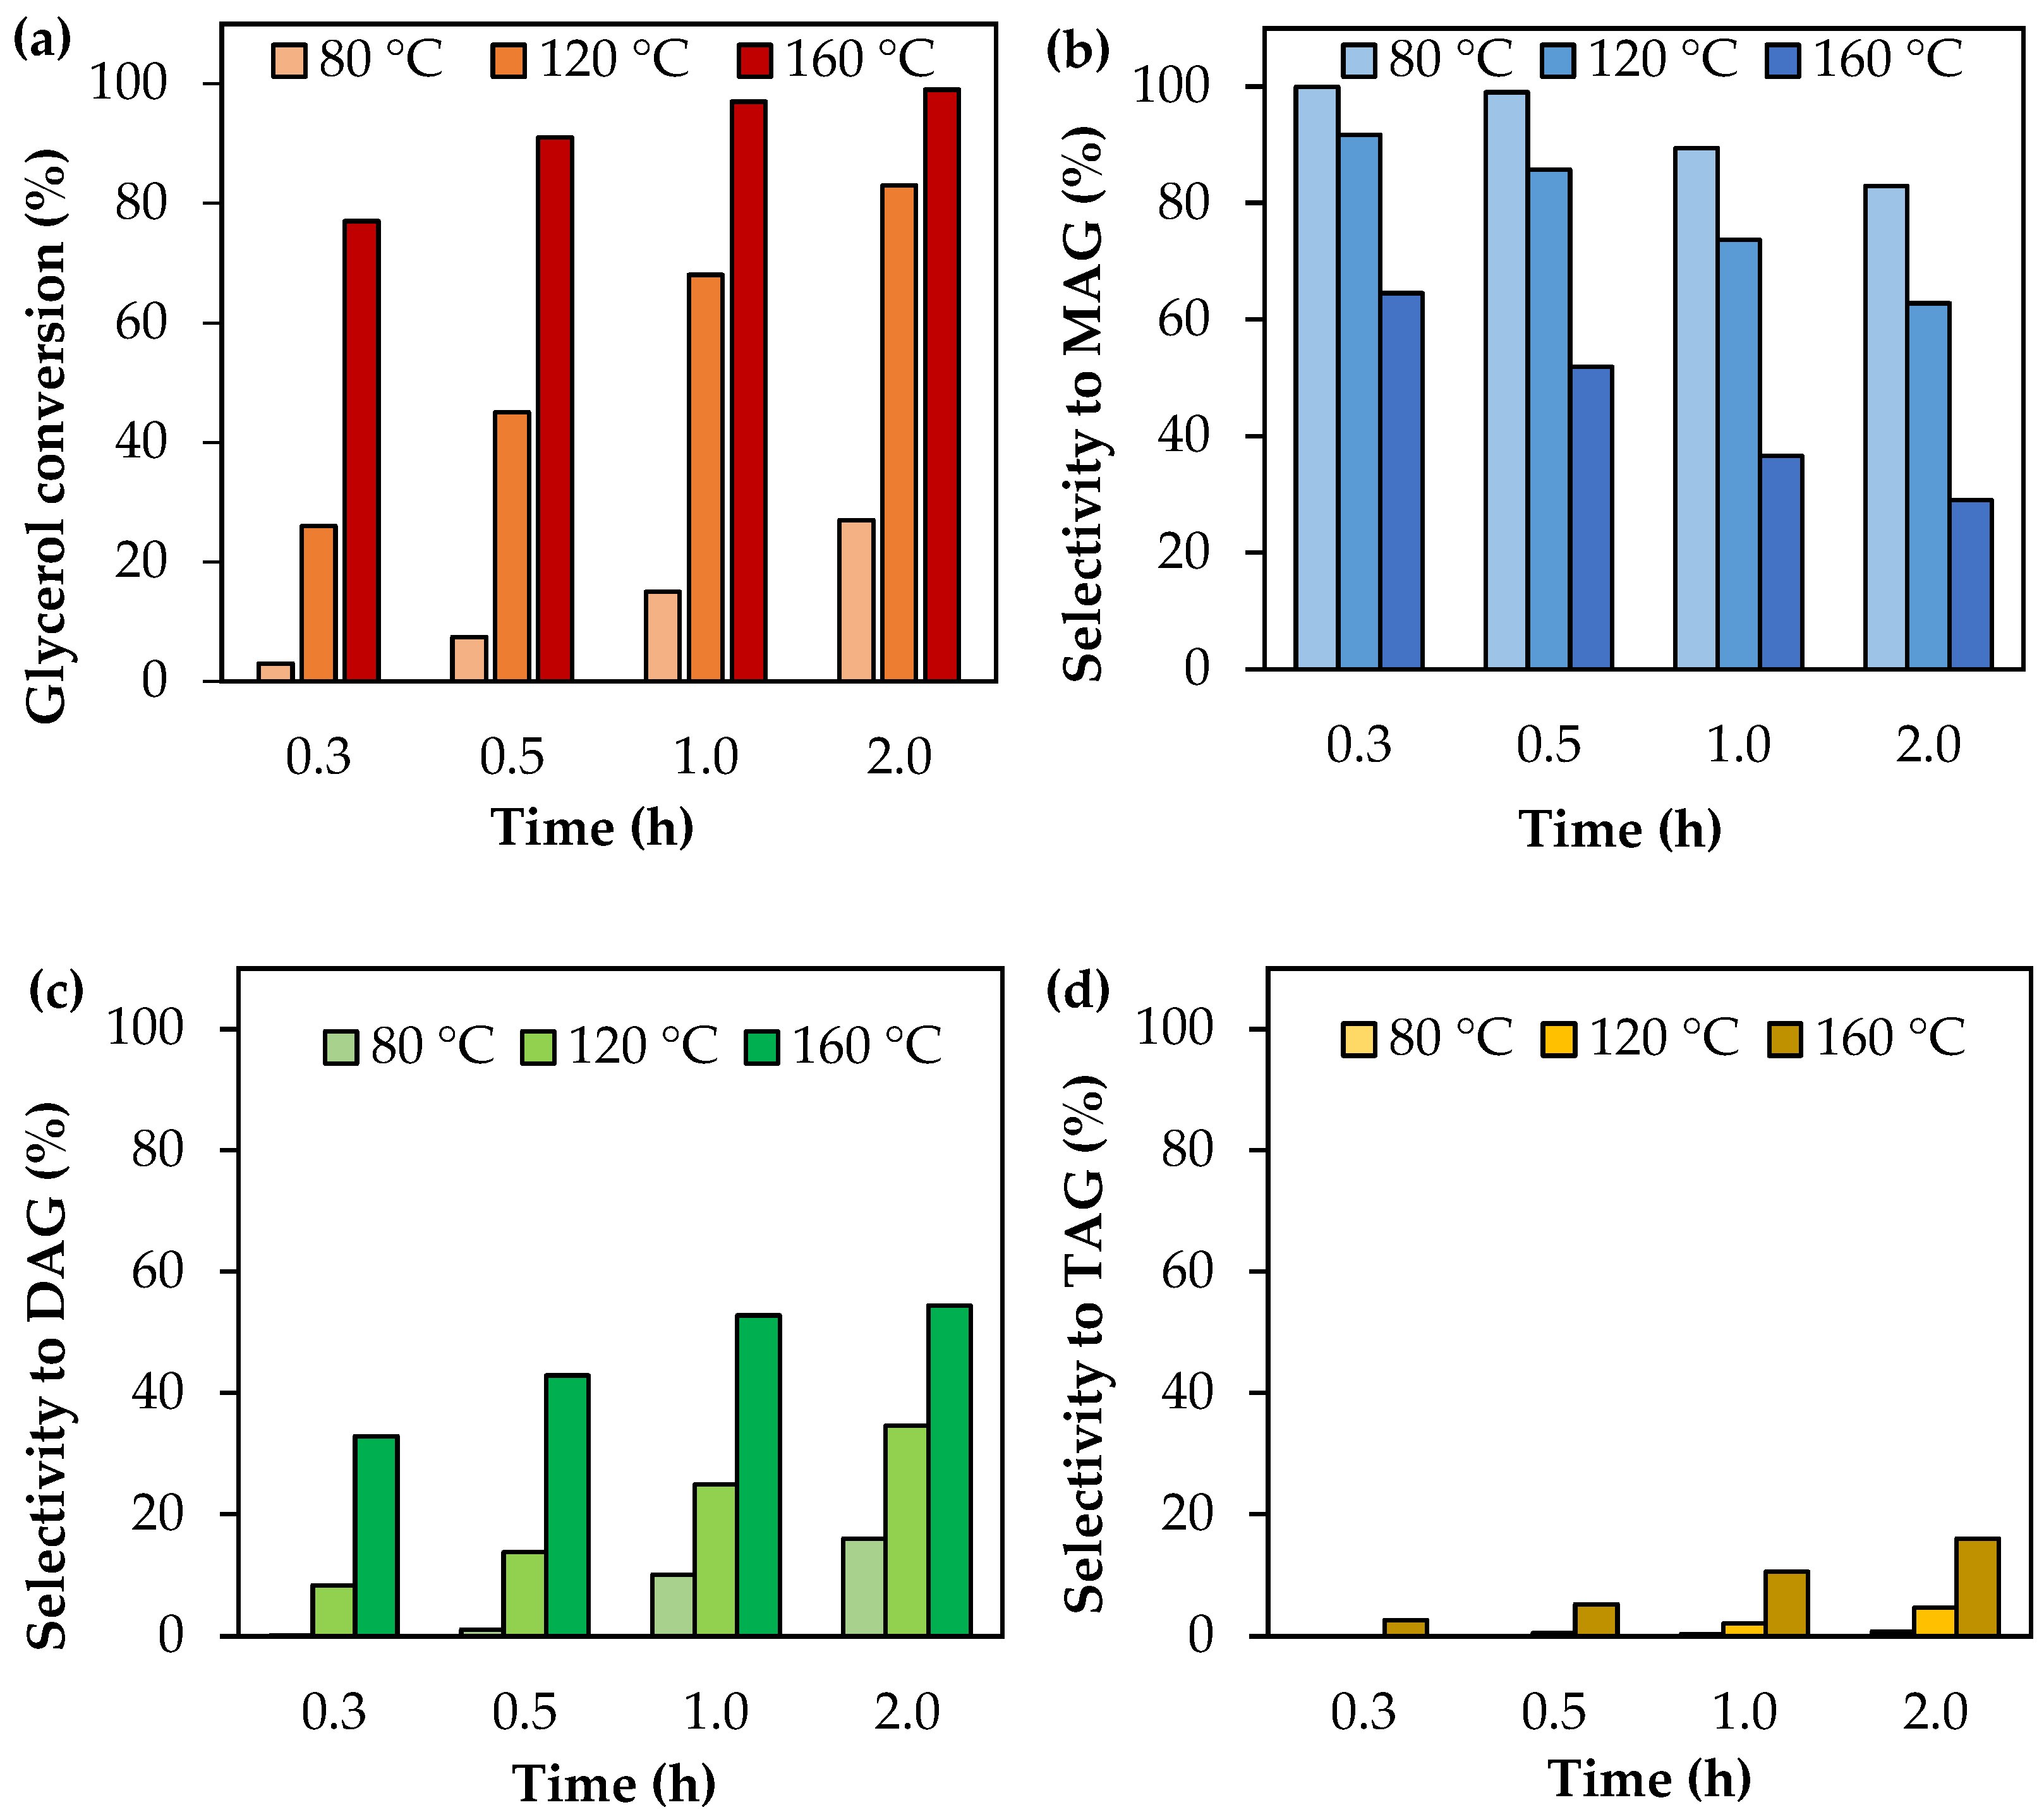
Figure 1 shows glycerol conversion and selectivity to liquid products as a function of the reaction time in the range of 80–160 °C. As can be seen, glycerol conversion increases with the reaction time, as is expected for reactions carried out in batch systems. Higher temperatures also led to high conversions, as predicted by the Arrhenius law.
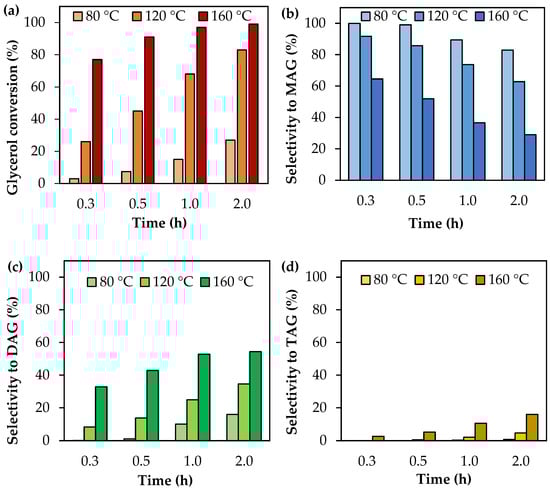
Figure 1.
Activity tests as a function of time using analytical-grade glycerol. (a) Glycerol conversion. (b) Selectivity to MAG. (c) Selectivity to DAG. (d) Selectivity to TAG. Reaction conditions: 80–160 °C, AA/G = 6, P = 2 MPa N2 initial pressure.
With respect to product distribution, selectivity to MAG is higher than selectivity to DAG and TAG, indicating that the first step of glycerol acetylation is faster than the others. As time goes on, MAG leads to the formation of DAG and then DAG is converted to TAG, following the mechanism of acetylation. Increasing the temperature also favors the formation of most substituted products, but TAG does not exceed 16% of selectivity even at 160 °C and 2 h of reaction time.
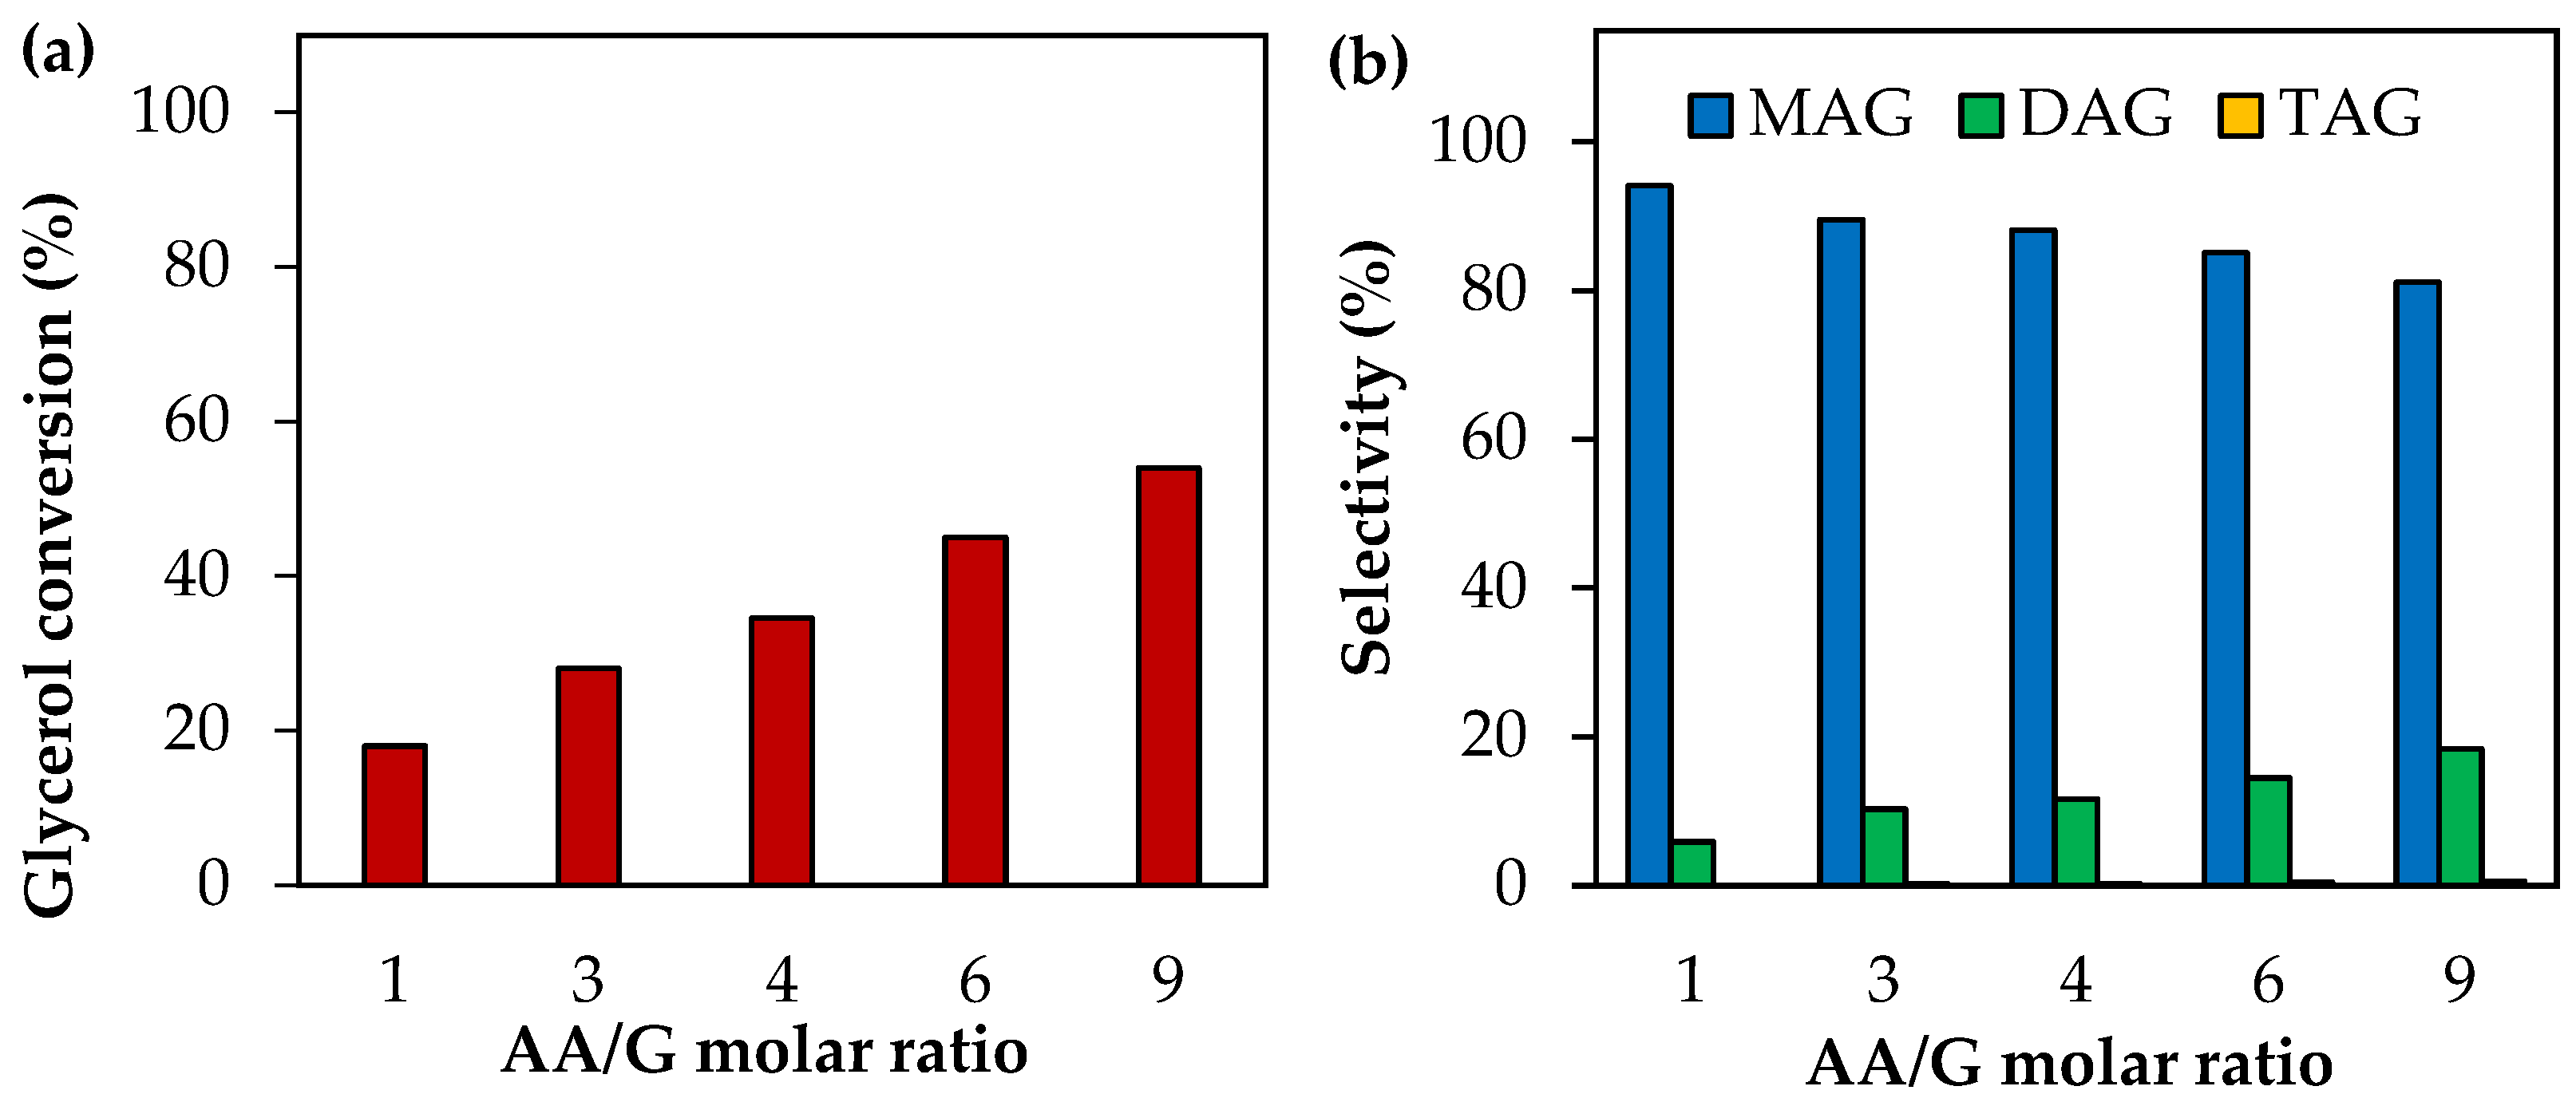
Figure 2 shows the results of the effect of the AA/G molar ratio at 120 °C and 0.5 h of reaction time. As can be seen, AA/G molar ratios between 1 and 9 produce an increase in glycerol conversion followed by a decrease in MAG selectivity and an increase in DAG selectivity. In all cases, TAG selectivity remains almost unchanged. This can be explained by the mechanism of acetylation (Equations (9)–(11)); a supply of AA causes an increase in glycerol conversion and a shift of the reaction towards the formation of more substituted products. This has been reported by several authors using different solid catalysts, such as supported heteropolyacids [33], inorganic compounds [34] and functionalized zirconia [35], among others.

Figure 2.
Activity tests as a function of the AA/G molar ratio using analytical-grade glycerol. (a) Glycerol conversion. (b) Selectivity to MAG, DAG and TAG. Reaction conditions: 120 °C, 0.5 h, P = 2 MPa N2 initial pressure.
3.2. Kinetic Model
The reaction tests of the concentration as a function of the reaction time and the results for the effects of the AA/G molar ratio at different temperatures allowed us to determine the kinetic coefficients of the three reaction steps at 80 °C, 120 °C and 160 °C, using multiple linear regression with a confidence level of 95%. The results are shown in Table 1.

Table 1.
Kinetic coefficients at 80 °C, 120 °C and 160 °C, obtained by multiple linear regression. Confidence level 95%.
As can be seen, the results show a good agreement with the lineal model, as the multiple correlation coefficients (R2) are between 0.84 and 0.99.
As regards the kinetic coefficients, there are differences between the three reaction steps. Values of k1 and k1′ increase with temperature, but the ratio of k1/k1′ decreases, revealing the global exothermicity of the system [11]. As regards the second and third steps, k2 and k3 decrease with temperature, while k2′ and k3′ increase, causing the quotients k2/k2′ and k3/k3′ to increase with temperature, indicating that the formation of DAG and TAG is favored, which is in accordance with the experimental tests.
Having established the kinetic coefficients at 80 °C, 120 °C and 160 °C, the pre-exponential factors and the apparent activation energies can be estimated from the Arrhenius law. These results are presented in Table 2, and the adjustments are shown in the Supplementary Materials (Figure S1).
Table 2.
Apparent activation energy (Eaj) and natural logarithm of the pre-exponential factor (koj) obtained from the linearization of the Arrhenius equation for direct reaction steps 1–3.
The results presented in Table 2 show that the estimated parameters are in good agreement with the experimental results, with linear correlation coefficients (R2) near to ~1. For the first reaction step, which is linked to glycerol consumption, lower values of activation energy were estimated, employing different catalytic systems, such as TPA/MCM-41 (22.3 kJ mol−1), TPA/ZrO2 (25.2 kJ mol−1) [18] and CsPWA (24.99 kJ mol−1) [20], indicating the benefits of employing a catalyst over glycerol conversion. Similar values of activation energy were obtained for the second and third steps, as reported by Bonet et al. [13], but the value of the pre-exponential factor is higher for the second step. This indicates that the frequency with which MAG and AA molecules effectively collide to form DAG and water is greater than the frequency with which DAG and AA molecules collide to form TAG and water. The overall result is that the formation of DAG is favored over that of TAG, as observed in the experimental results.
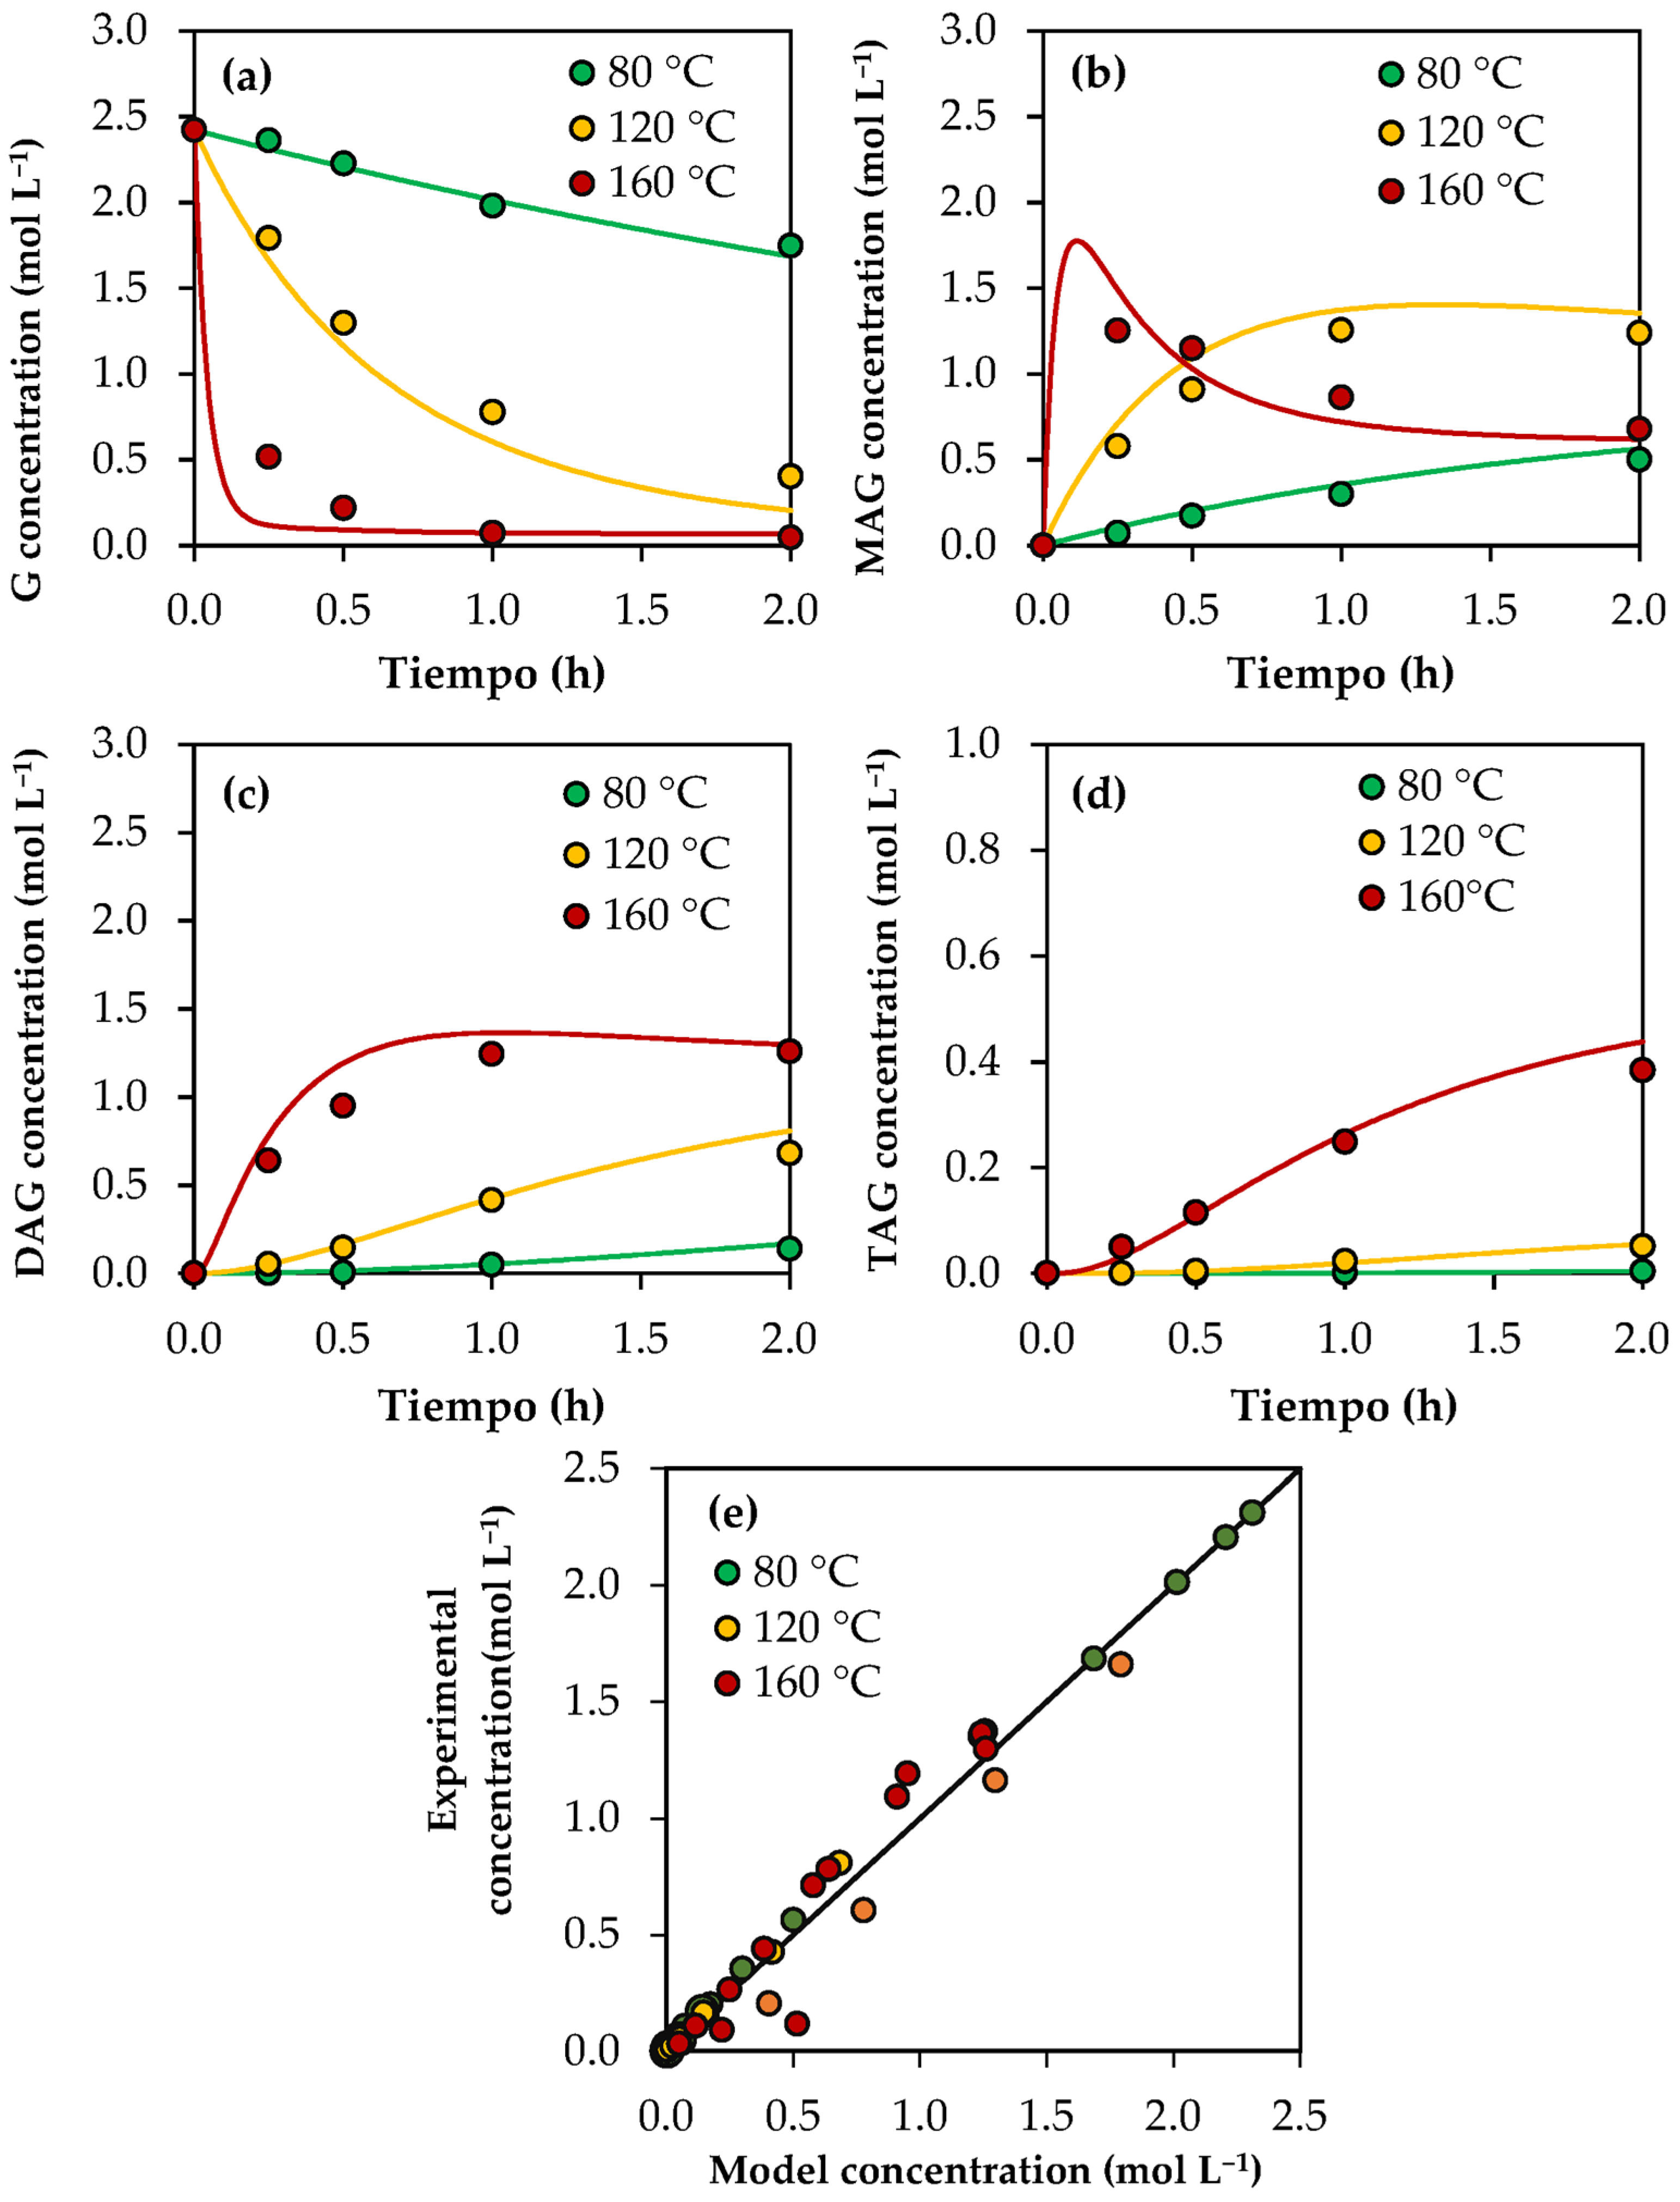
Figure 3a–d show the experimental results (dots) and those predicted with the kinetic model (solid lines) for the concentrations of glycerol and products as a function of time. The parity plot of the predicted and experimental concentrations is shown in Figure 3e. As can be seen, there is a good agreement between the experimental and predicted values, indicating that the kinetic model can acceptably estimate the experimental concentrations. Using Equation (33), an average relative error of 14.9% was calculated.
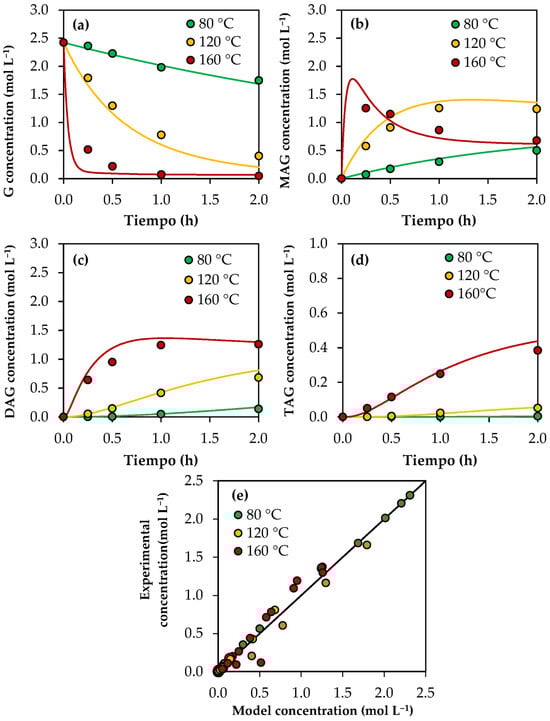
Figure 3.
Results of the kinetic model using analytical-grade glycerol. (a) Glycerol concentration as a function of time. (b) MAG concentration as a function of time. (c) DAG concentration as a function of time. (d) TAG concentration as a function of time. (e) Experimental concentration vs. model concentration in a parity plot. Reaction conditions: 80–160 °C, AA/G = 6, P = 2 MPa N2 initial pressure.
3.3. Characterization of Crude Glycerol Samples
Crude glycerol samples (A–E) were obtained from different biodiesel industries located in Argentina. Their characterization is presented in Table 3.
Table 3.
Physicochemical characterization of crude glycerol samples obtained from the biodiesel industry.
The results in Table 3 show that samples A, B and D had a pH of 6, which indicates that they had been neutralized post-reaction and that their ashes derived from the salts formed by neutralization. In this regard, A and D were neutralized with HCl, which explains the presence of NaCl in these samples. In the case of sample B, which was neutralized with HCOOH, the salt formed by this neutralization was NaCOOH. However, as the sample was treated at 750 °C for 3 h, its decomposition produced Na2O, which hydrated to form NaOH. The quantified ash was therefore NaOH resulting from the decomposition of NaCOOH. Samples C and E were not neutralized, which explains their values of pH > 7. Their ash content was therefore based on NaOH (free NaOH, which generates alkalinity in the medium, and sodium associated with soaps). For all samples, the glycerol content was about 80 wt.%, except for sample C, which had a glycerol content of about 53 wt.%. In all cases, the water content was less than 20 wt.%.
In relation to organic compounds, the term MONG includes the matter organic non-glycerol formed by free fatty acids, oils, fats and phospholipids that come from the transesterification reaction in biodiesel production. Methanol is also included in its definition, but its content can be discounted since it is already quantified independently.
Samples E and C had the higher methanol contents (6 wt.% and 10 wt.%, respectively), and both had the lower values of density. In turn, methanol was not detected in sample D. With regards to other organic compounds, Table 3 indicates that the MONG content reached a maximum concentration of 16 wt.% in sample C.
3.4. Reaction Tests Using Crude Glycerol Samples
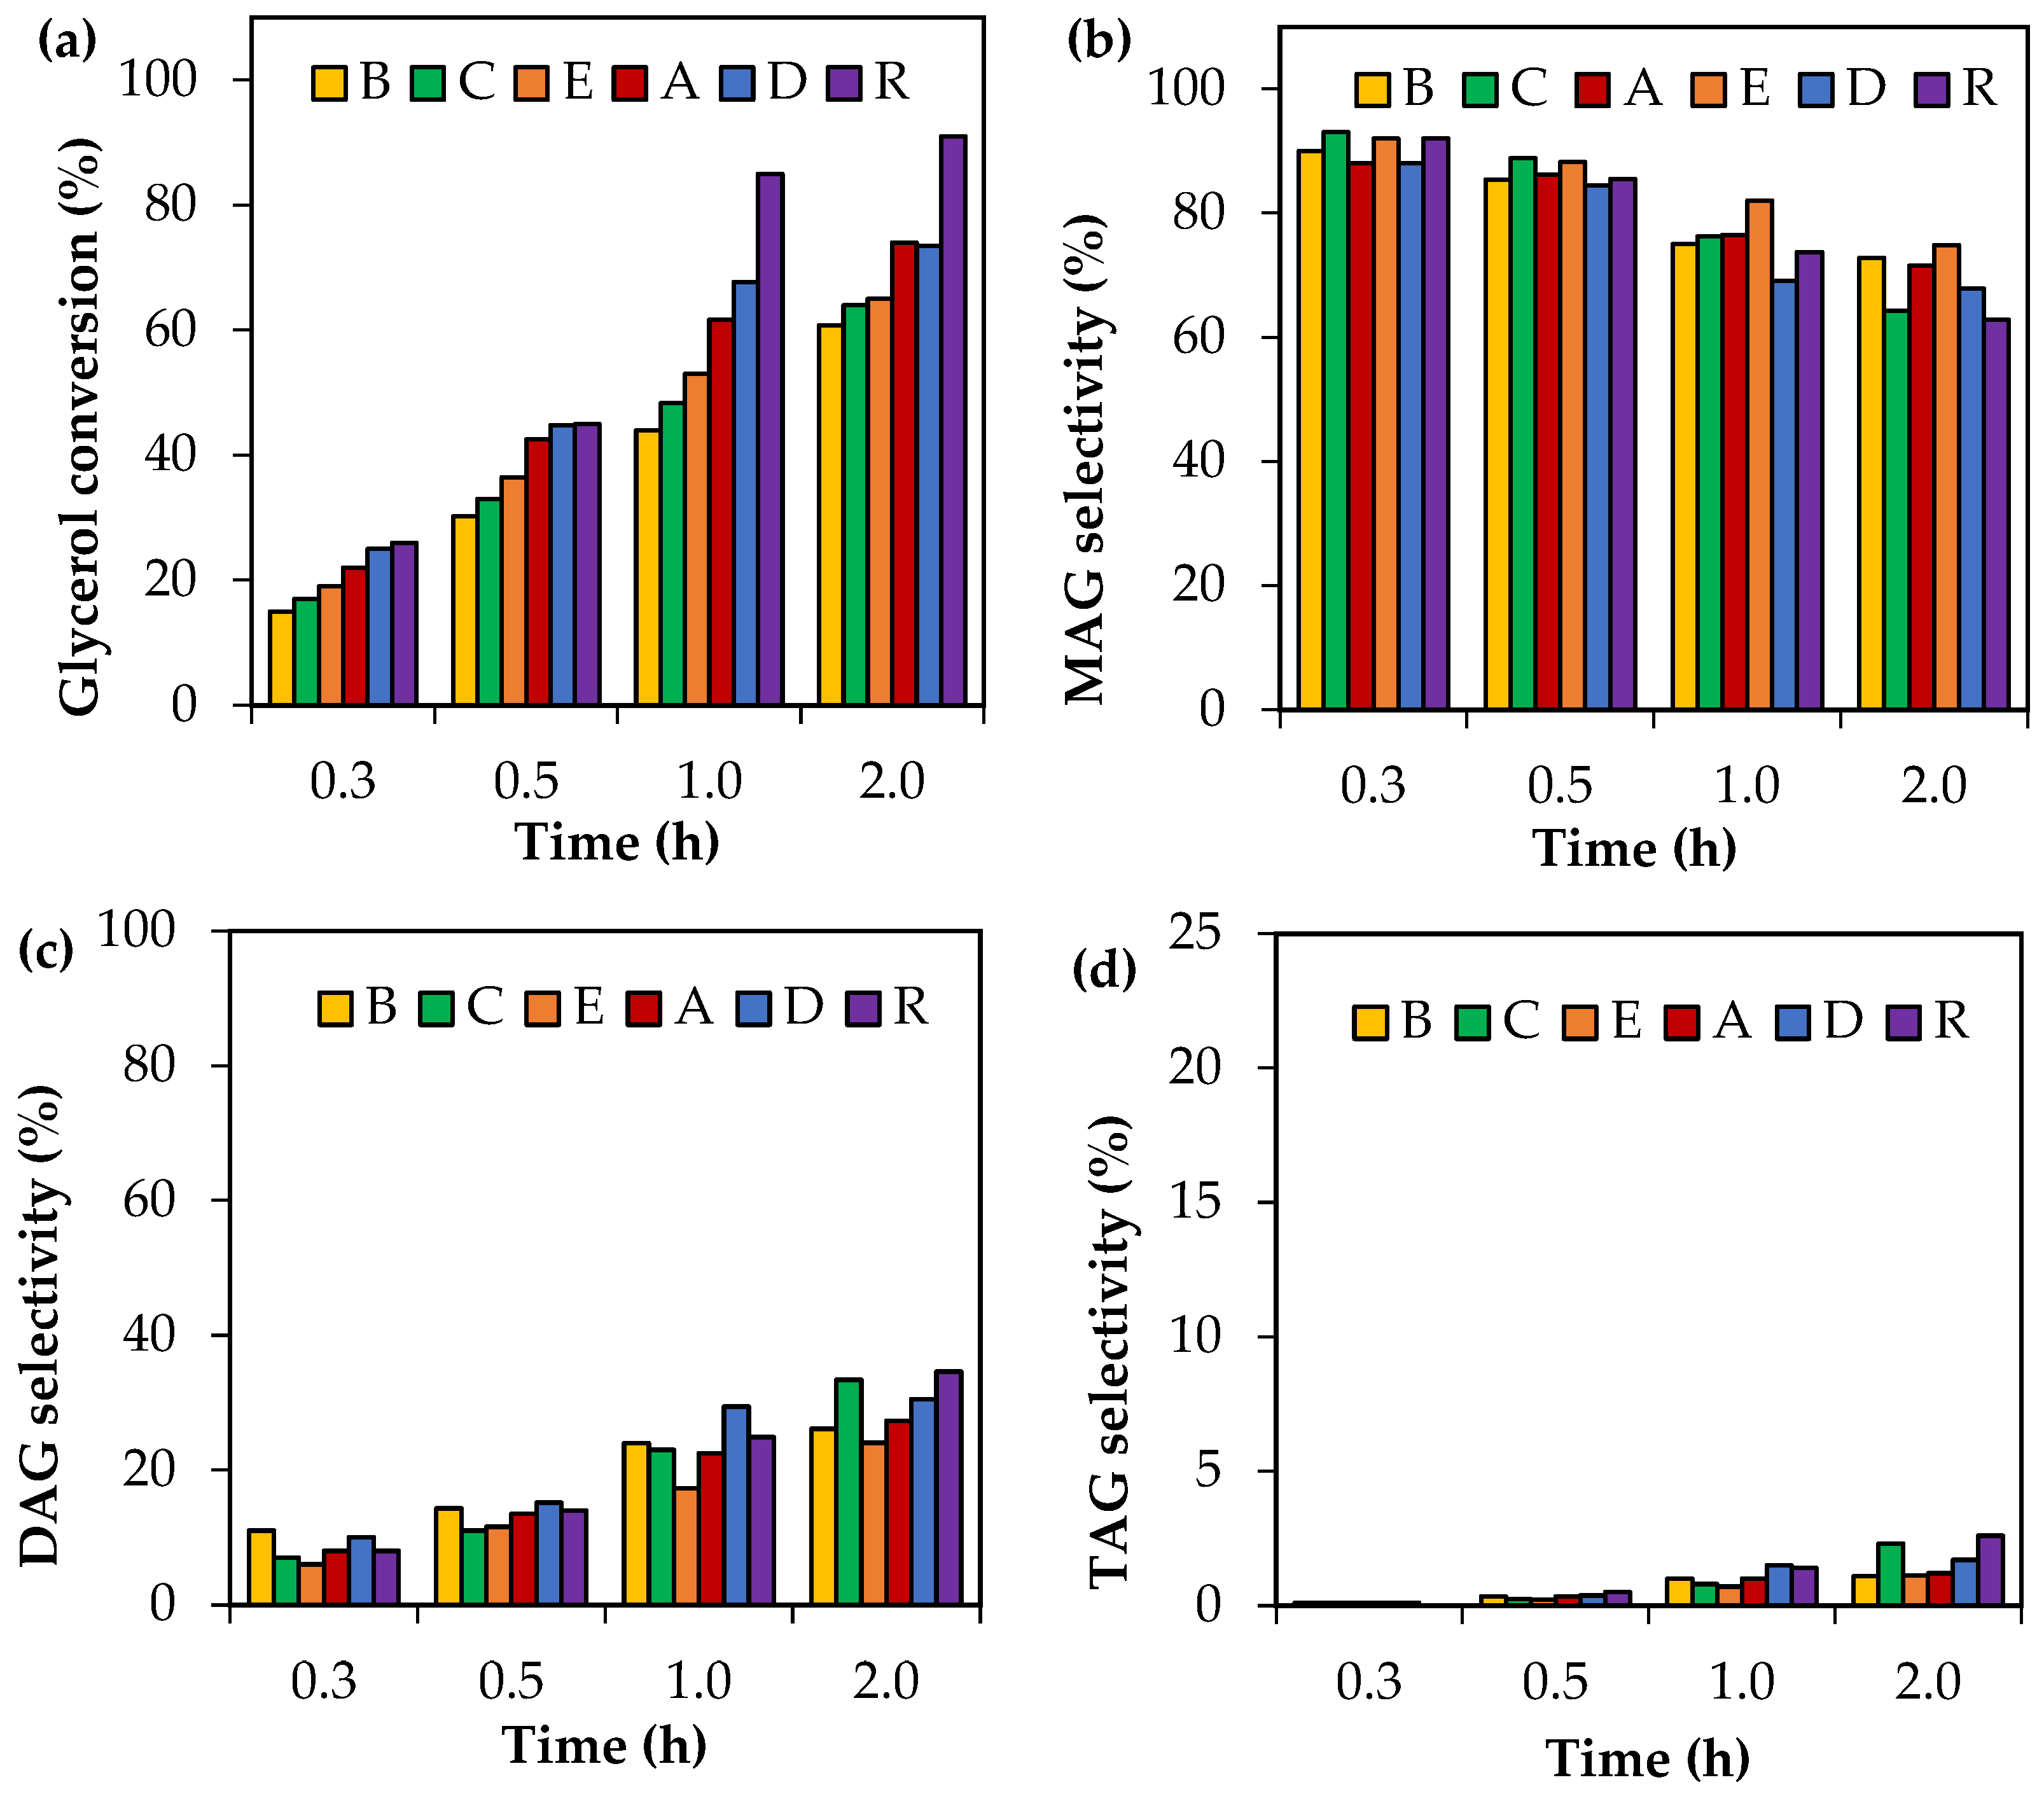
Crude glycerol samples were tested in the acetylation reaction at 120 °C using an AA/G = 6. The results are shown in Figure 4. A reference sample (R) consisting of analytical-grade glycerol was added for a direct comparison.

Figure 4.
Activity tests as a function of time using crude glycerol. (a) Glycerol conversion. (b) Selectivity to MAG. (c) Selectivity to DAG. (d) Selectivity to TAG. Reaction conditions: 80–160 °C, AA/G = 6, P = 2 MPa N2 initial pressure.
As can be seen, the most significant differences among the crude glycerol samples were associated with glycerol conversion. In all cases, crude glycerol samples A–E showed less glycerol conversion than those obtained with analytical glycerol (R). This indicates that the composition of the crude glycerol samples affects the level of activity in glycerol acetylation.
As regards the distribution of liquid products, the selectivity to MAG, DAG and TAG did not present any significant differences for each reaction time. MAG selectivity values, for example, were in the following ranges: 88–93%, 84–88%, 69–82% and 62–75% for reaction times of 0.25 h, 0.5 h, 1 h and 2 h, respectively.
In order to elucidate the role of the crude glycerol composition over glycerol conversion and selectivity, reaction tests were carried out by employing analytical-grade glycerol (99.99%) as a reactant, adding individually the different impurities present in crude glycerol (H2O, CH3OH, NaOH, NaCOOH, NaCl and MONG).
Table 4 shows the composition of the impurities in the crude glycerol samples expressed in terms of the molar ratio of each impurity with respect to glycerol (mol mol−1). The effect of each impurity on catalytic activity was studied individually in the concentration range shown in Table 4.
Table 4.
Composition of the impurities of crude glycerol samples in terms of the glycerol-based molar ratio.
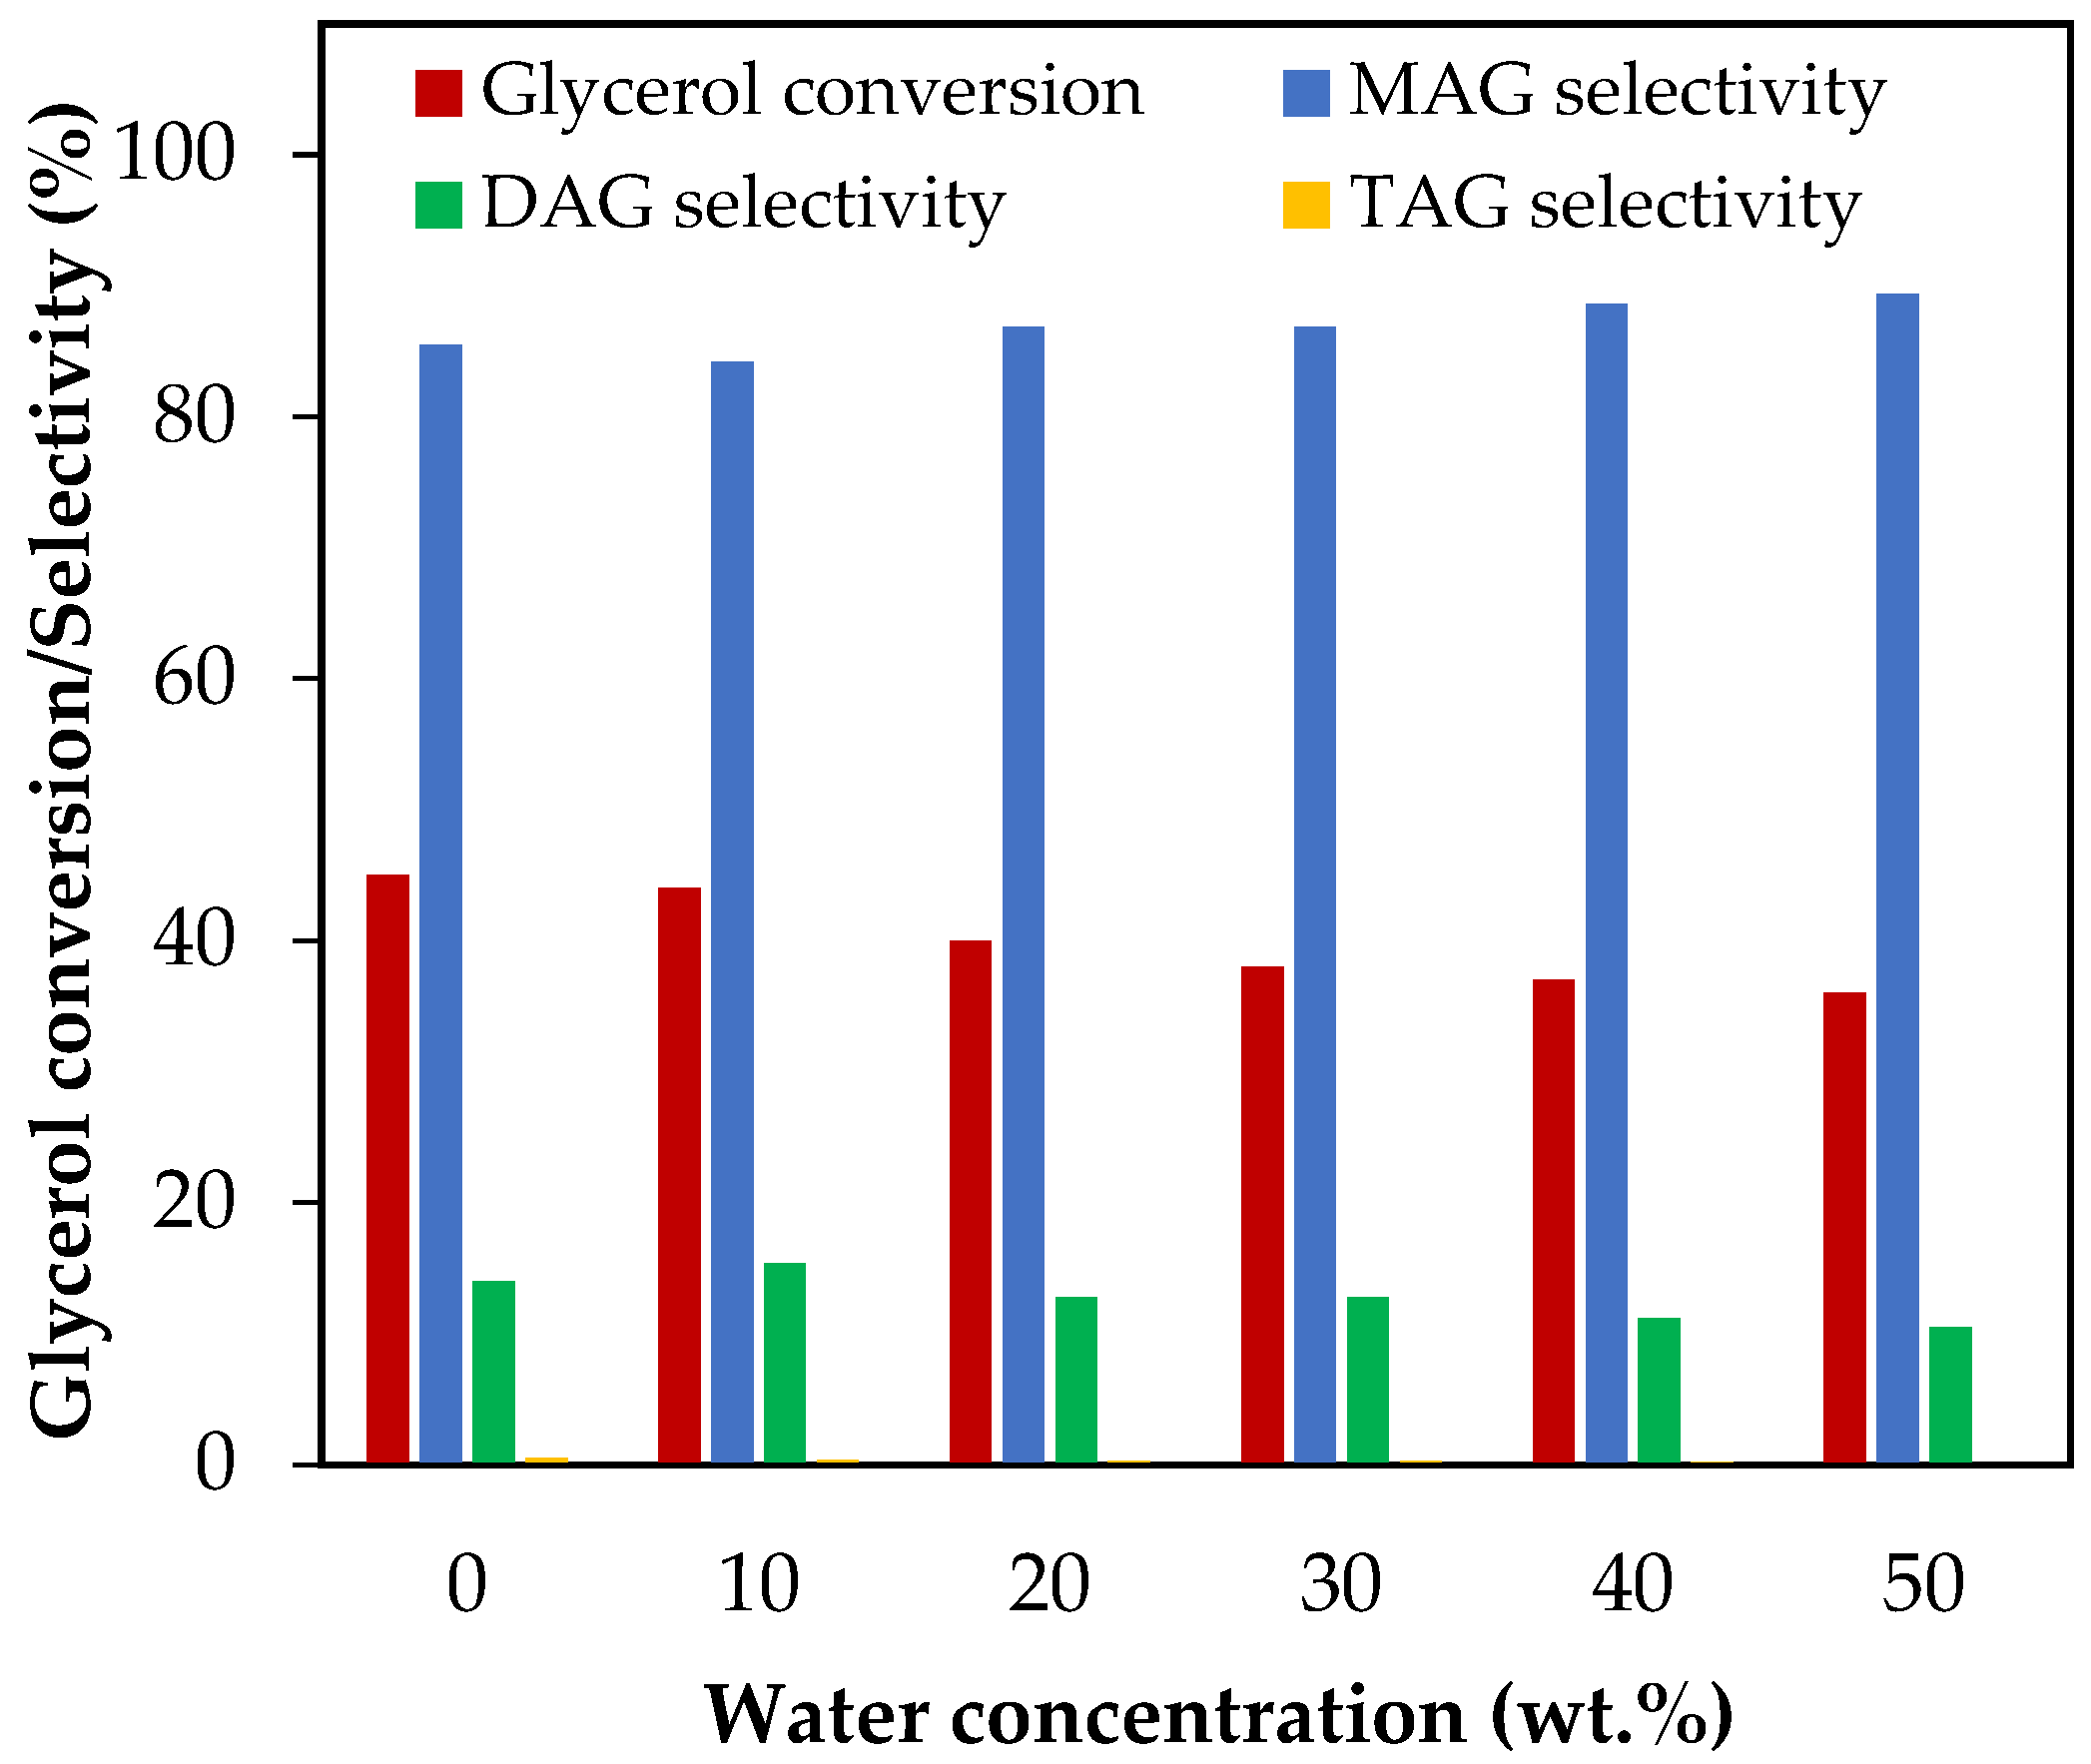
3.4.1. Effect of Water Concentration
Figure 5 shows the results of glycerol conversion and selectivity to liquid products when the initial water concentration varied from 10 wt.% to 50 wt.%, which corresponds to water/glycerol molar ratios between 0.51 and 2.56. As can be seen, only glycerol conversion was affected by the initial amount of water, while selectivity to MAG and DAG remained constant, and selectivity to TAG was practically negligible. The glycerol conversion decreased from 44% to 36% as the water concentration increased from 10 wt.% to 50 wt.%. In a previous study, we concluded that, for an AA/G molar ratio of 6 and a temperature of 120 °C, the presence of 40 wt.% initial water reduces the equilibrium conversion by 0.4% [11]. The results showed that, under the same conditions, conversion decreased by almost 18% after 2 h, indicating that the effect of dilution on the reaction kinetics is greater than that of the thermodynamics of the reaction.

Figure 5.
Effect of H2O addition in the range of 10–50 wt.% over glycerol conversion and selectivity to liquid products. Reaction conditions: 120 °C, AA/G = 6, 0.5 h, P = 2 MPa N2 initial pressure.
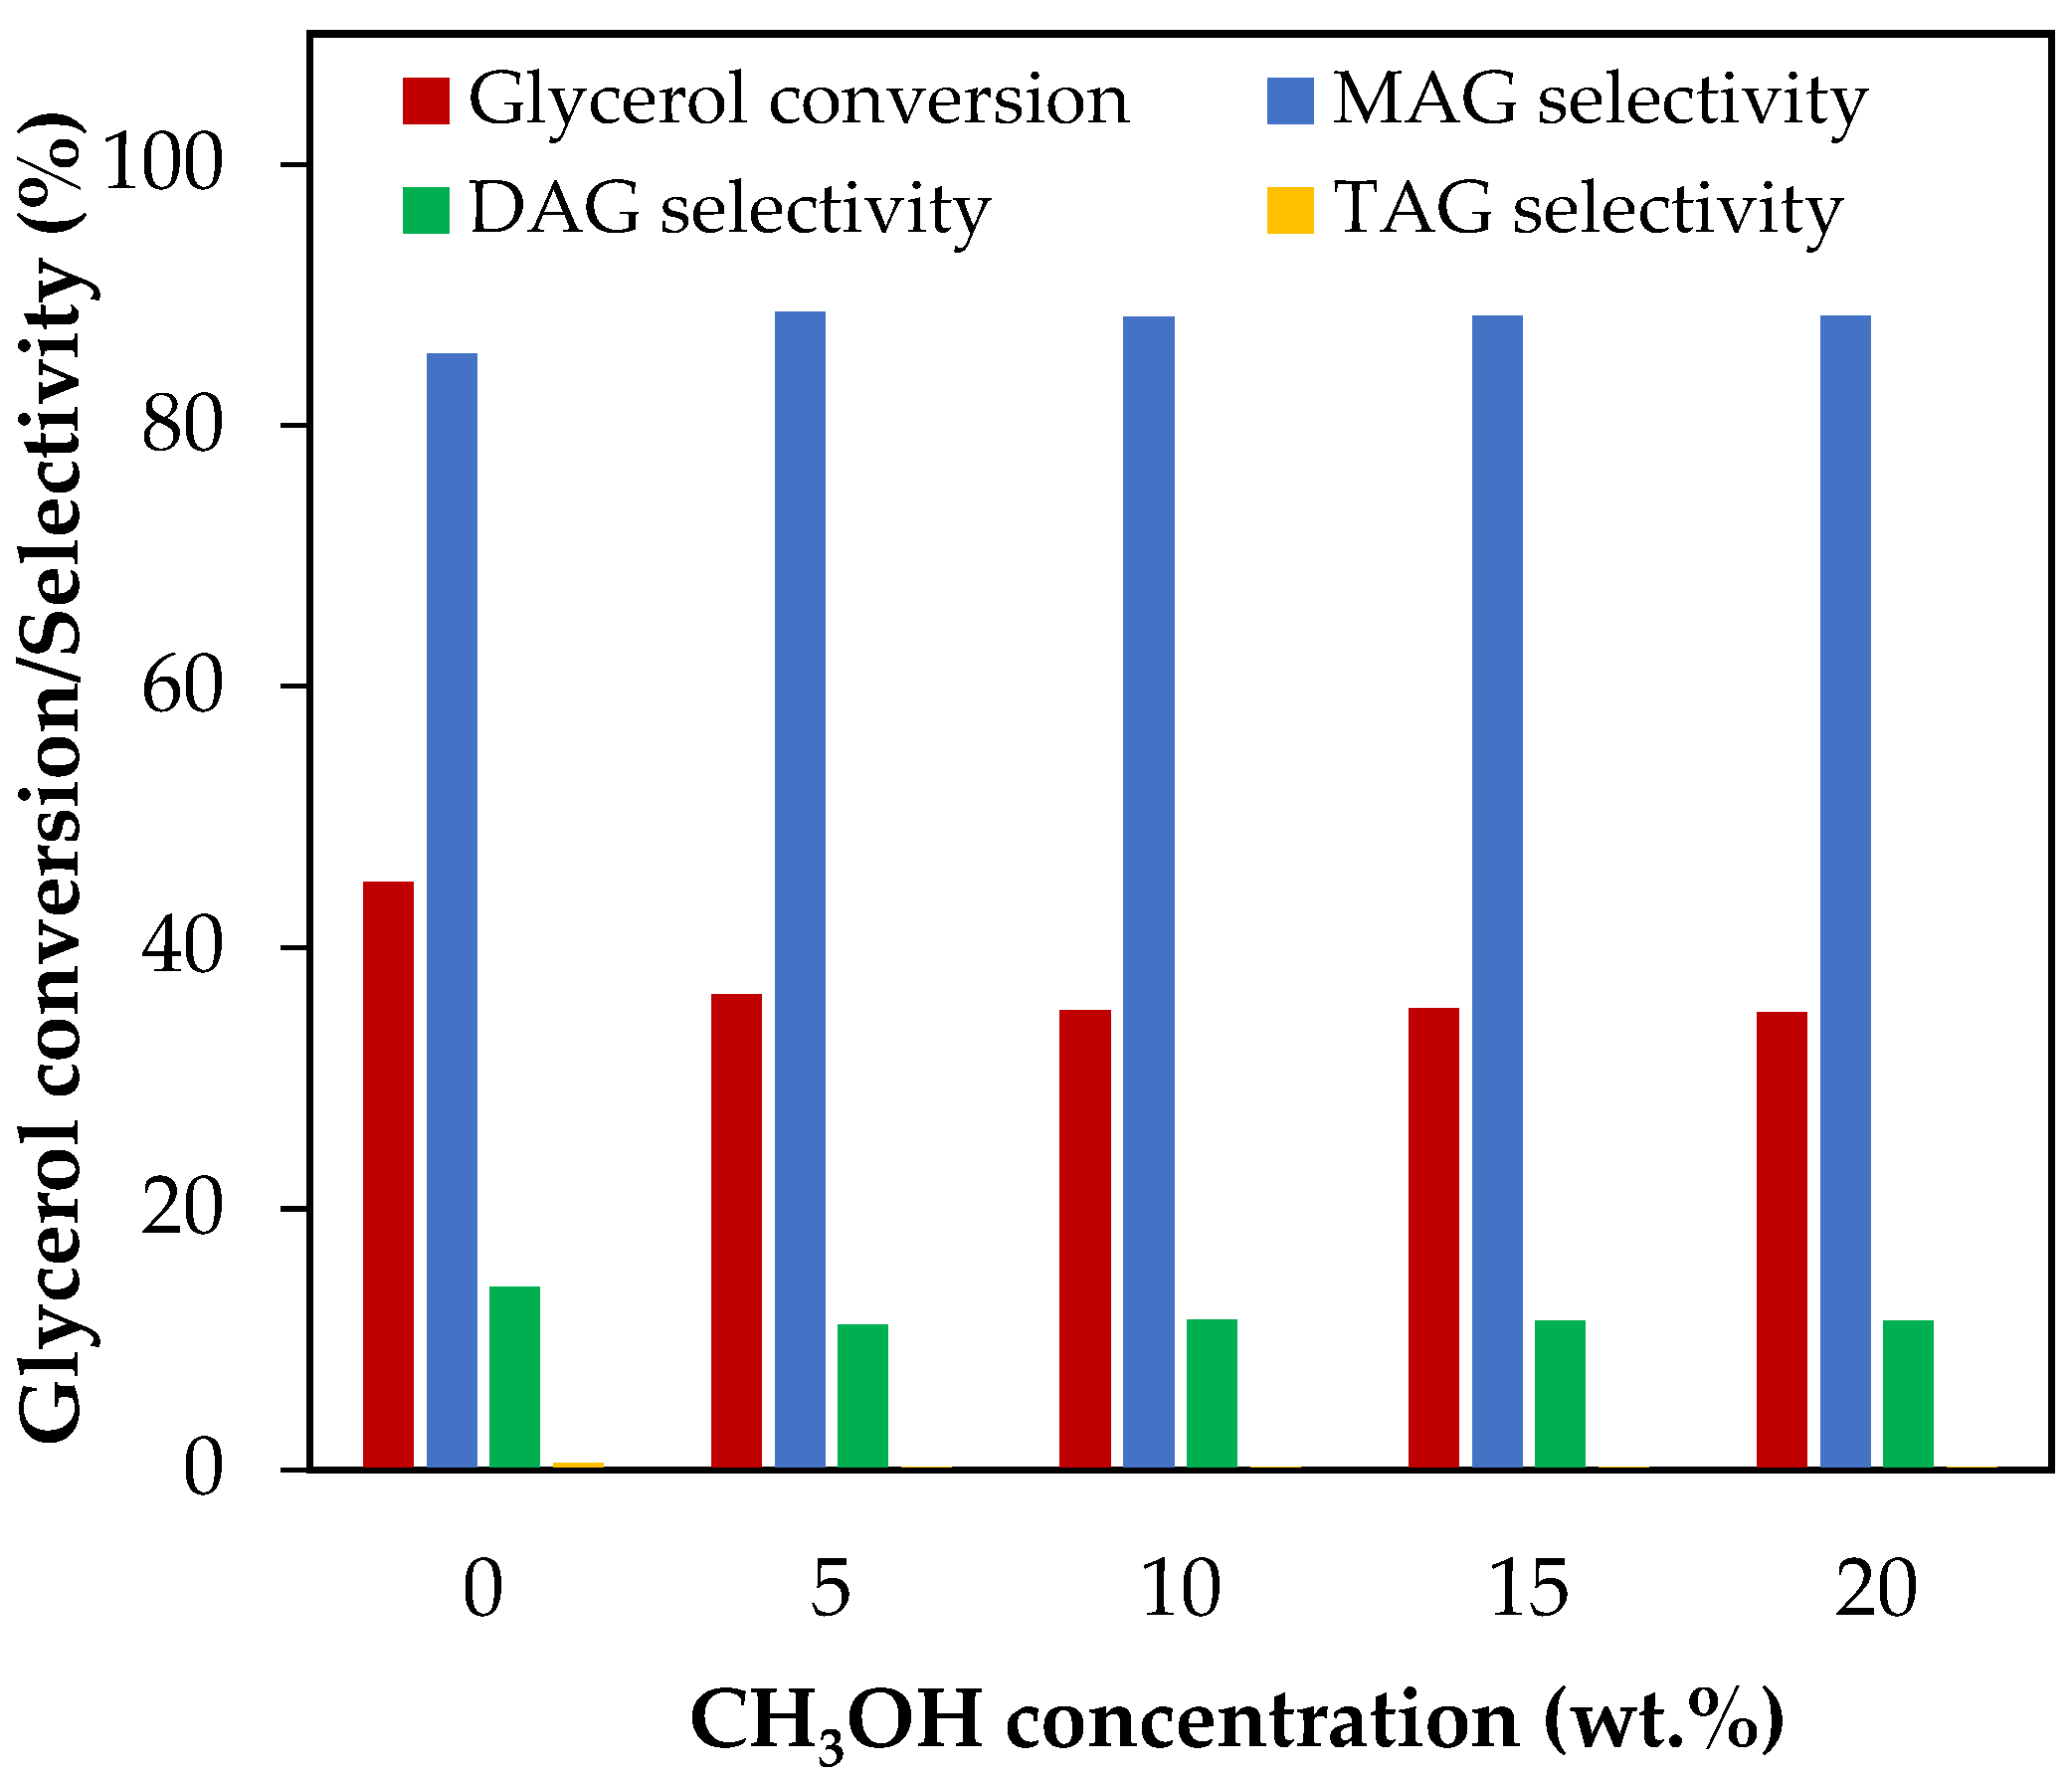
3.4.2. Effect of Methanol Concentration
Figure 6 shows the results of glycerol conversion and selectivity to liquid products for methanol concentrations between 5 wt.% and 20 wt.%, which corresponds to CH3OH/glycerol molar ratios between 0.14 and 0.57.
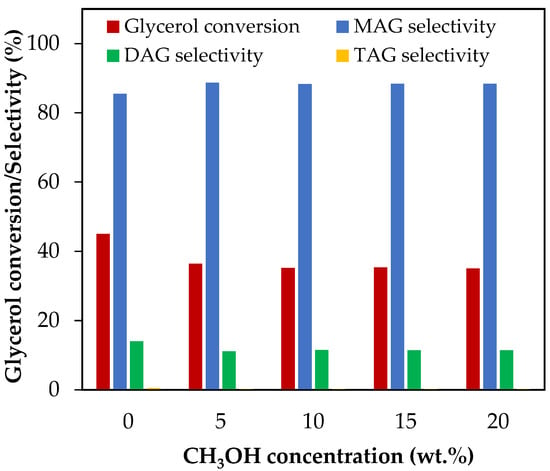
Figure 6.
Effect of CH3OH addition in the range of 5–20 wt.% over glycerol conversion and selectivity to liquid products. Reaction conditions: 120 °C, AA/G = 6, 0.5 h, P = 2 MPa N2 initial pressure.
As can be seen from Figure 6, with only 5 wt.% of methanol, glycerol conversion decreased from 45% to 35% and then remained almost unchanged. Selectivity to MAG, DAG and TAG remained almost constant. We detected the presence of methyl acetate (CH3COCH3) by gas chromatography, a compound that can be formed by the reaction between methanol and AA, according to Equation (34).
CH3OH + CH3COOH ⇌ CH3COCH3 + H2O
The presence of methanol will reduce glycerol conversion as it will react with AA to form methyl acetate rather than with glycerol to form MAG, DAG and TAG.
3.4.3. Effect of Neutralization
The effect of NaOH addition was evaluated between 5 wt.% and 30 wt.%, which corresponds to NaOH/glycerol molar ratios between 0.11 and 0.69. The results are presented in Figure 7.
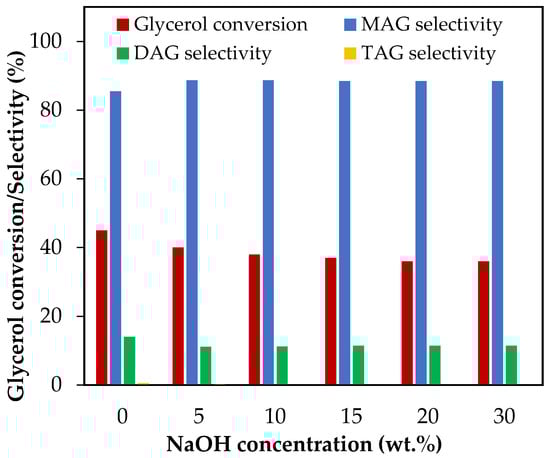
Figure 7.
Effect of neutralization via NaOH addition in the range of 5–30 wt.% over glycerol conversion and selectivity to liquid products. Reaction conditions: 120 °C, AA/G = 6, 0.5 h, P = 2 MPa N2 initial pressure.
As can be seen, NaOH negatively affects glycerol conversion. The results show that when the NaOH concentration increased from 5 wt.% to 20 wt.%, glycerol conversion decreased from 45% to 36%. Neutralization of part of the AA with NaOH generated sodium acetate and thus the presence of an acetic–acetate buffer, which could have affected the availability of protons in the reaction medium and, consequently, the glycerol conversion.
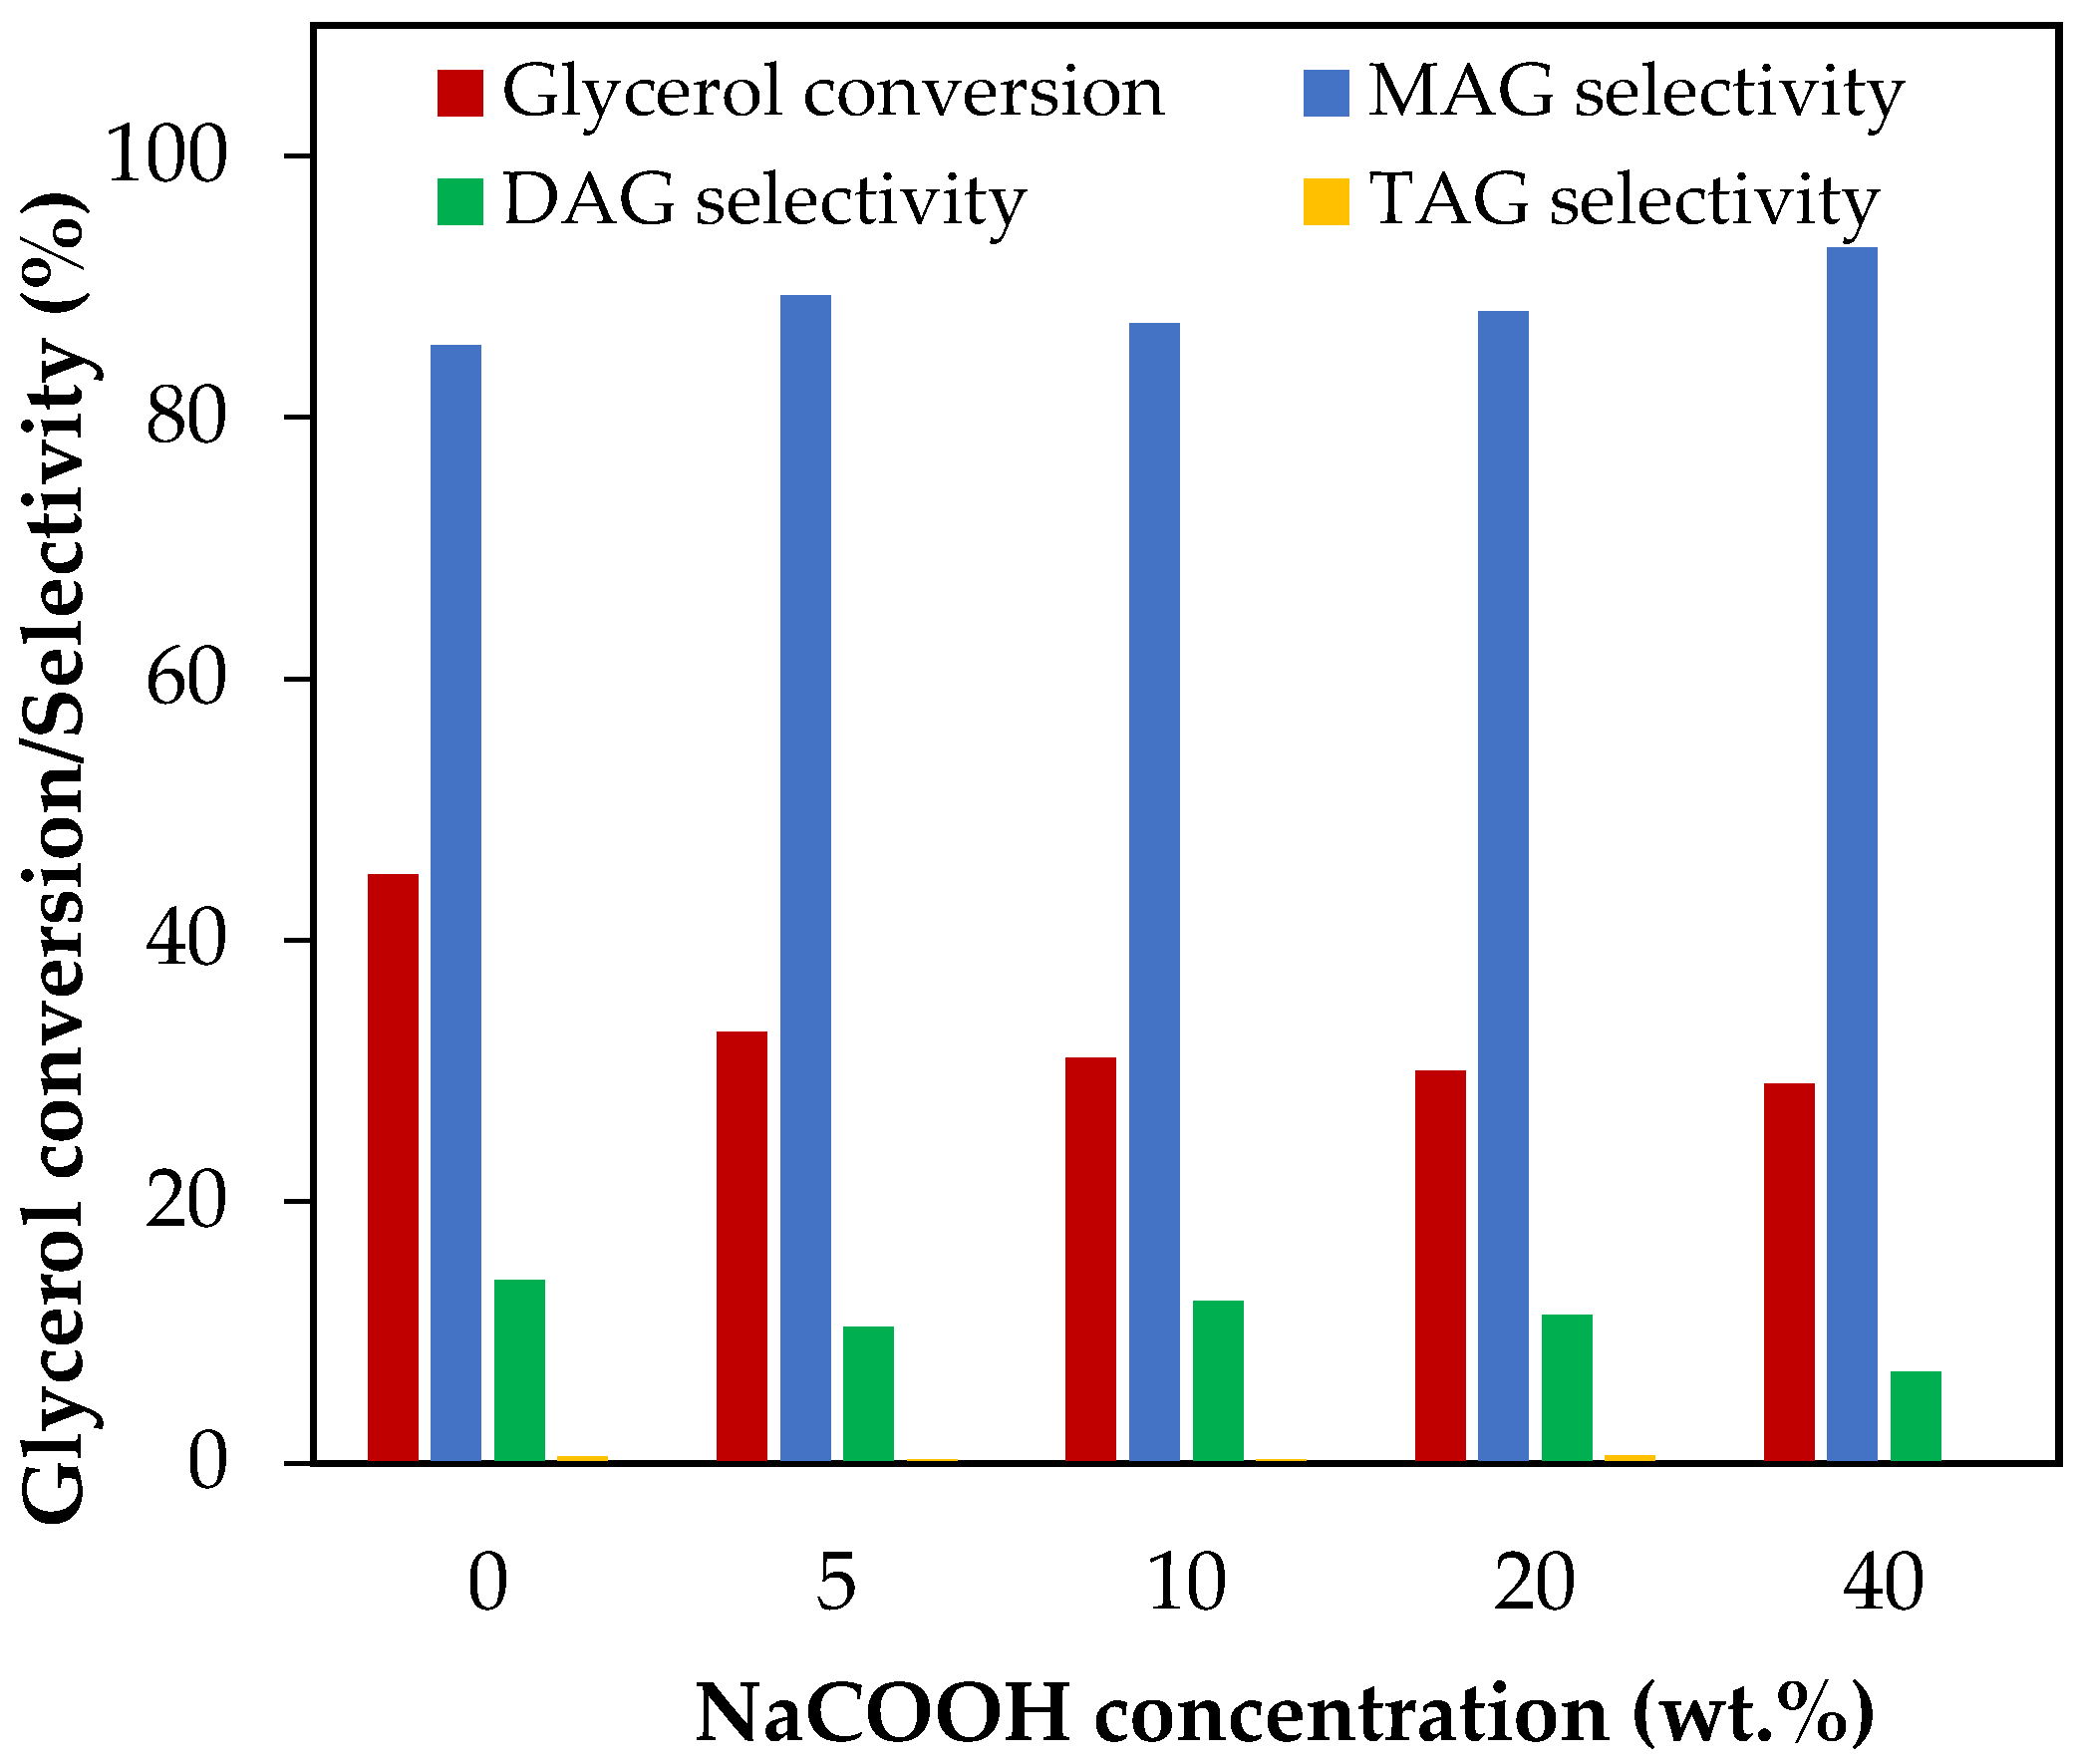
3.4.4. Effect of NaCOOH Concentration
The effect of NaCOOH addition was evaluated between 5 and 40 wt.%, which corresponds to NaCOOH/glycerol molar ratios between 0.06 and 0.54. The results are presented in Figure 8.

Figure 8.
Effect of NaCOOH addition in the range of 5–20 wt.% over glycerol conversion and selectivity to liquid products. Reaction conditions: 120 °C, AA/G = 6, 0.5 h, P = 2 MPa N2 initial pressure.
As can be seen, glycerol conversion decreased from 45% to 30% when the NaCOOH content increased from 0 wt.% to 20 wt.%. Hydrolysis of sodium formate generated oxhydriles, resulting in a lower availability of protons, which would explain the decrease in glycerol conversion.
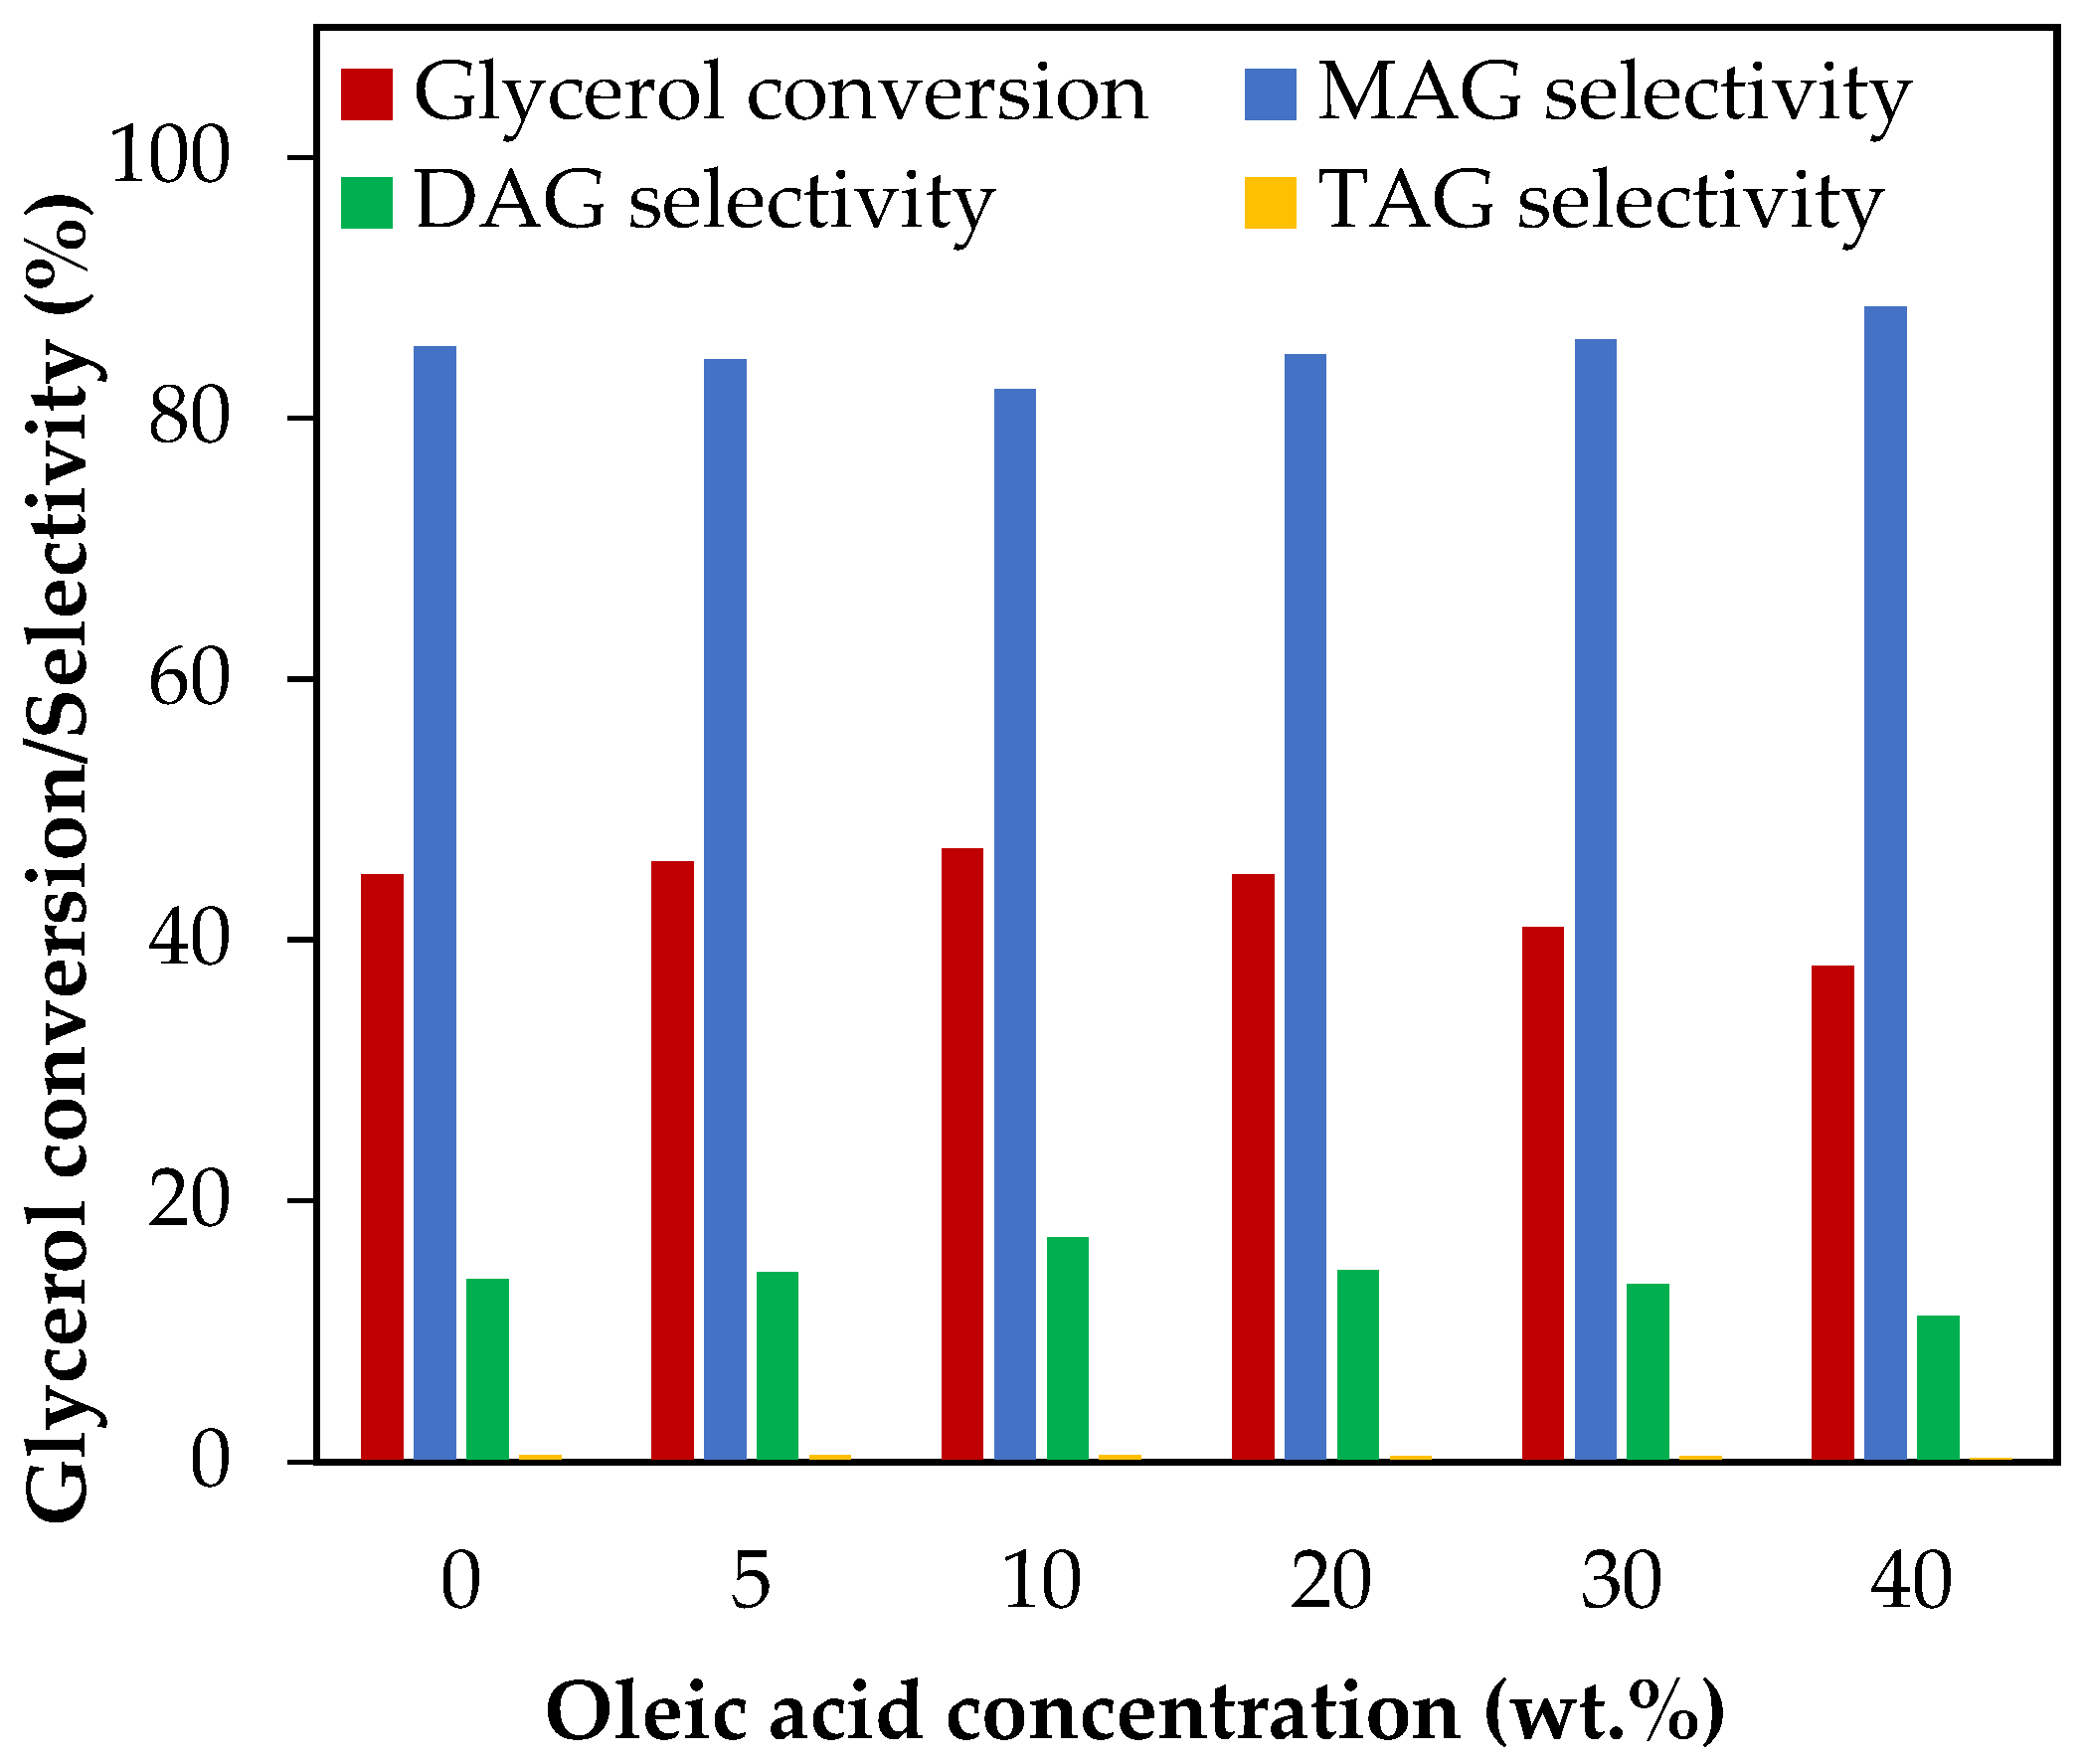
3.4.5. Effect of MONG Concentration
MONG constitutes the non-glycerol organic matter, apart from methanol, that crude glycerol samples will contain in a certain concentration range, and it depends on the origin of the sample. It includes a variety of compounds, such as triglycerides, free fatty acids, soap and organic colorants, among others.
It is really difficult to represent the behavior of the MONG, but some molecules can be used as model ones to gain a general idea about their effect over glycerol conversion and selectivity to liquid products.
Figure 9 shows the results of adding oleic acid as a test molecule for evaluating the effect of MONG in the range of 5–40 wt.%, which corresponds to MONG/glycerol molar ratios between 0.01 and 0.13. As can be seen from the results, no changes in glycerol conversion nor in selectivity to liquid products were observed up to 20 wt.% oleic acid, which corresponds to a MONG/glycerol molar ratio equal to 0.06. When the oleic concentration exceeded 20 wt.%, glycerol conversion decreased from 45% to 38%, and liquid product selectivity experiments revealed a slight variation, following the acetylation mechanism. This would indicate that MONG may play a role in the catalytic activity of acetylation just in cases of high concentration levels.
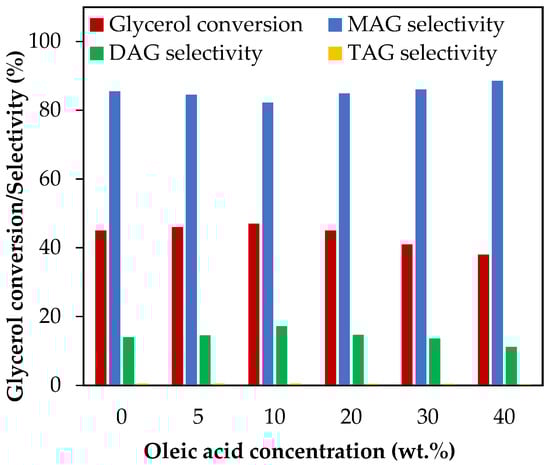
Figure 9.
Effect of oleic acid addition in the range of 5–40 wt.% over glycerol conversion and selectivity to liquid products. Reaction conditions: 120 °C, AA/G = 6, 0.5 h, P = 2 MPa N2 initial pressure.
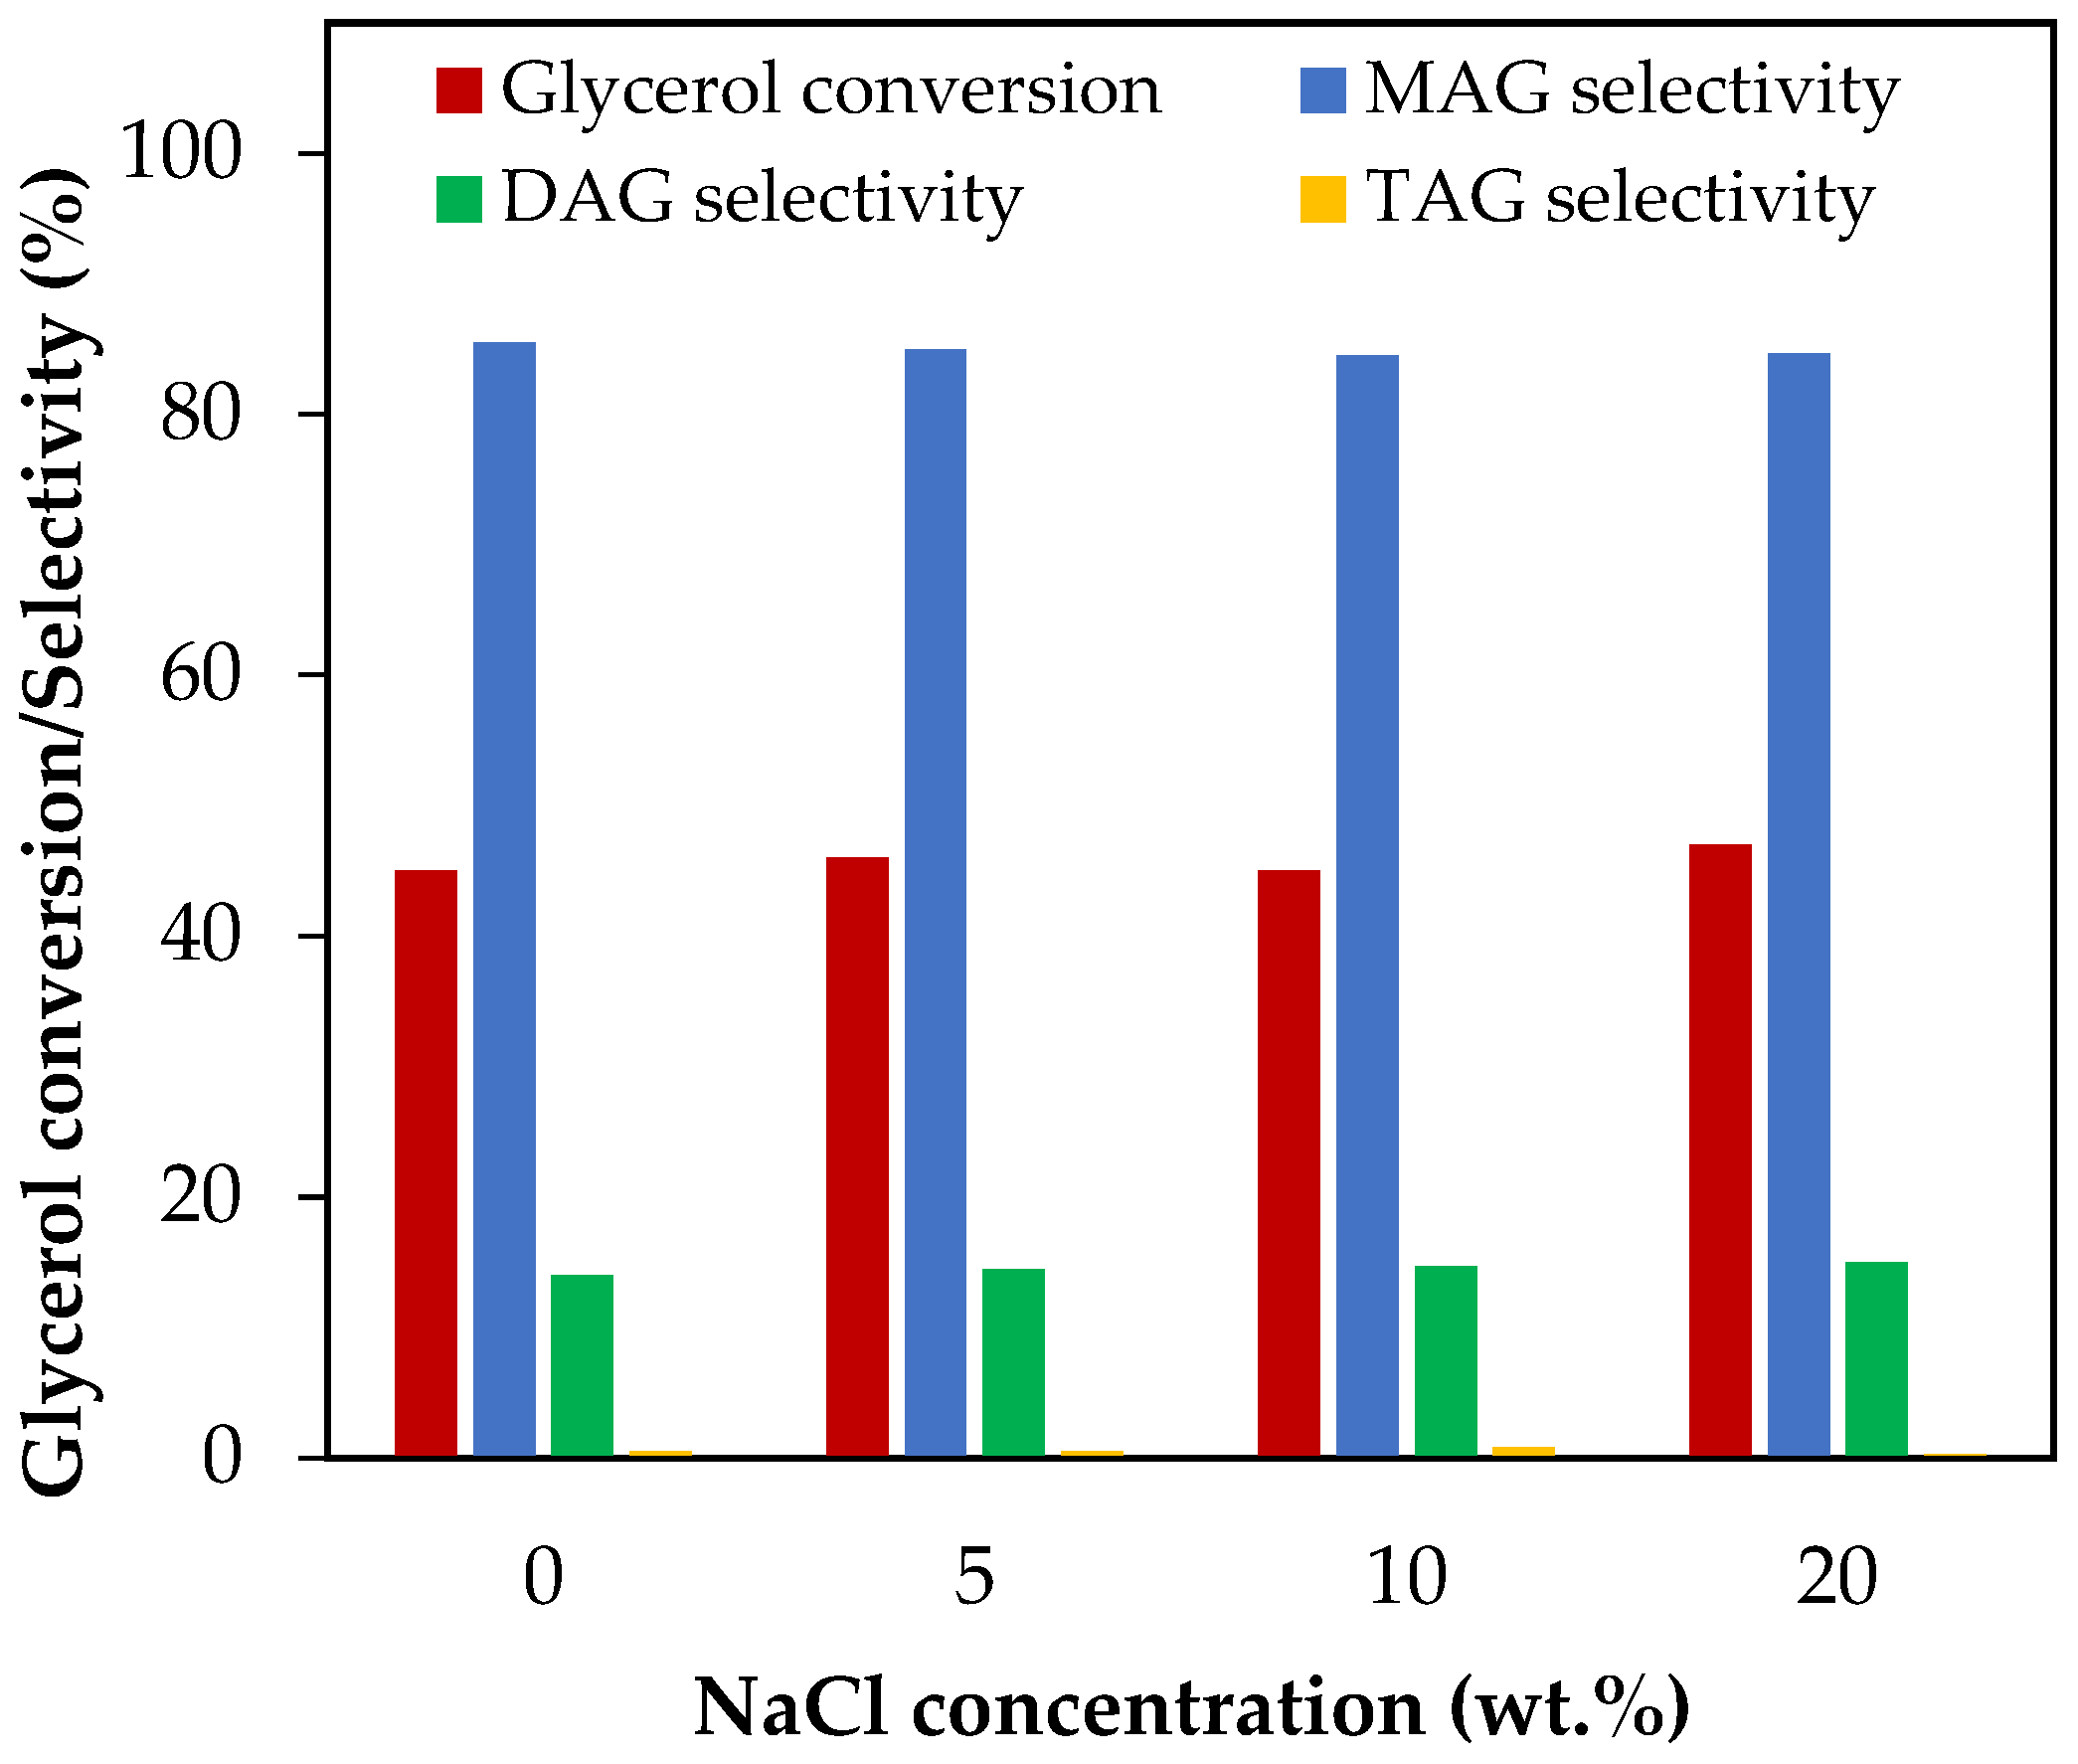
3.4.6. Effect of NaCl Concentration
Figure 10 shows the results of glycerol conversion and selectivity to liquid products for an addition of NaCl between 5 wt.% and 20 wt.%, which corresponds to NaCl/glycerol molar ratios between 0.07 and 0.31. As can be seen from the figure, both glycerol conversion and selectivity to MAG, DAG and TAG remained unchanged in all the concentration range studied. This indicates that neutralizing biodiesel with HCl would not affect the homogenous acetylation of glycerol with acetic acid.
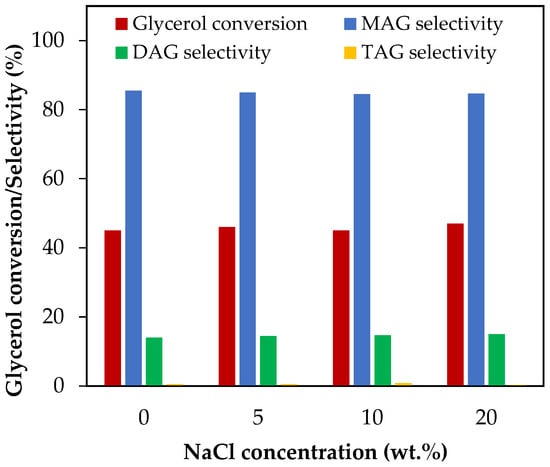
Figure 10.
Effect of NaCl addition in the range of 5–20 wt.% over glycerol conversion and selectivity to liquid products. Reaction conditions: 120 °C, AA/G = 6, 0.5 h, P = 2 MPa N2 initial pressure.
3.5. Activity Factor and Modified Kinetic Model
In order to predict the glycerol conversion when crude glycerol is used as a reagent, it is necessary to modify the reaction rate by a factor that takes into account the concentration of impurities that affect the activity. In this sense, the individual activity factors (ai) were calculated from the ratio between the glycerol consumption rate in the presence of an impurity (−rG′) and the glycerol consumption rate in the absence of an impurity (−rG), using Equation (25). The individual activity factors can be mathematically expressed as a function of the concentration of each impurity (Ci), using Equation (26).
The characteristic parameters of each activity factor (n, ki, Ki) were obtained by fitting the linearized Equation (26). The results of these parameters are shown in Table 5 and the fits are presented in the Supplementary Materials (Figure S2).
Table 5.
Characteristic parameters (n, ki, Ki) of the individual activity factors (ai).
From the individual activity factors and the molar composition of each crude glycerol sample (A–E), the activity factors depending on the total concentration of impurities (ac) can be calculated using Equation (27). Then, the expressions for the global activity factors (a) can be obtained using Equation (31). This information is presented in Table 6.
Table 6.
Values of the activity factors depending on the total concentration of impurities (ac) and mathematical expressions for the global activity factor.
Based on the global activity factor, the glycerol consumption rate was expressed according to Equation (32). Then, the Euler method was employed to obtain the conversion values.
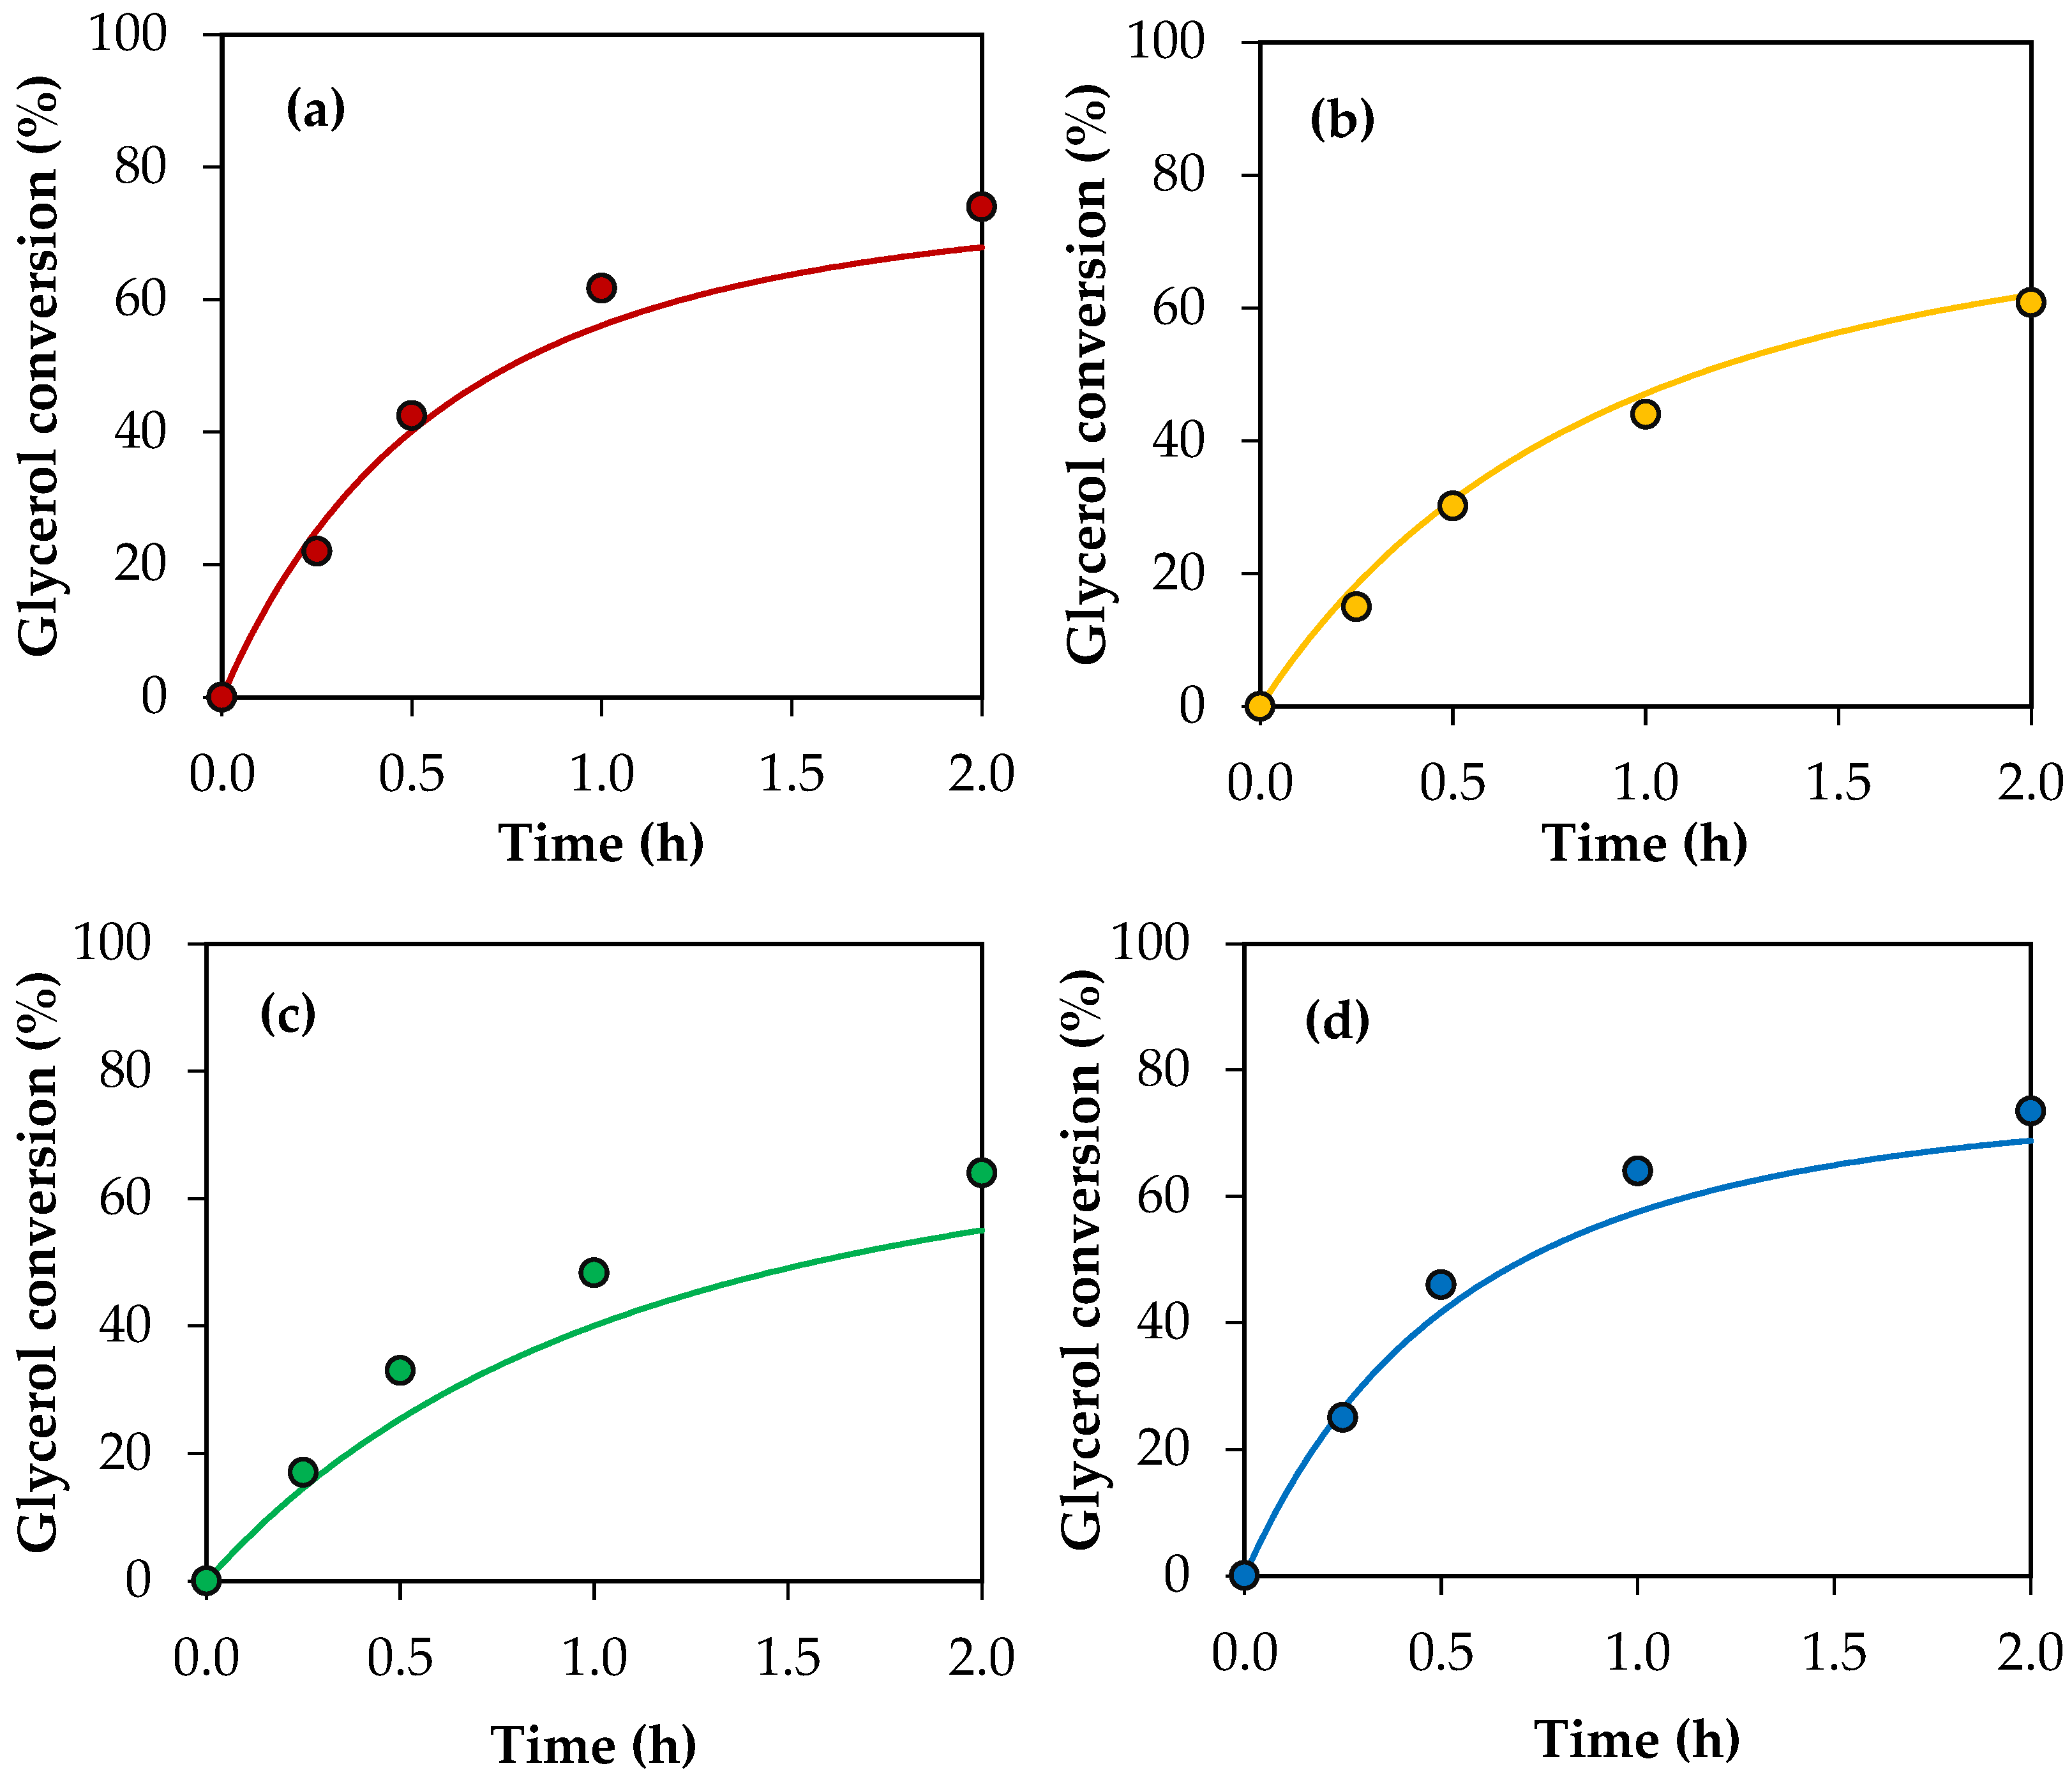
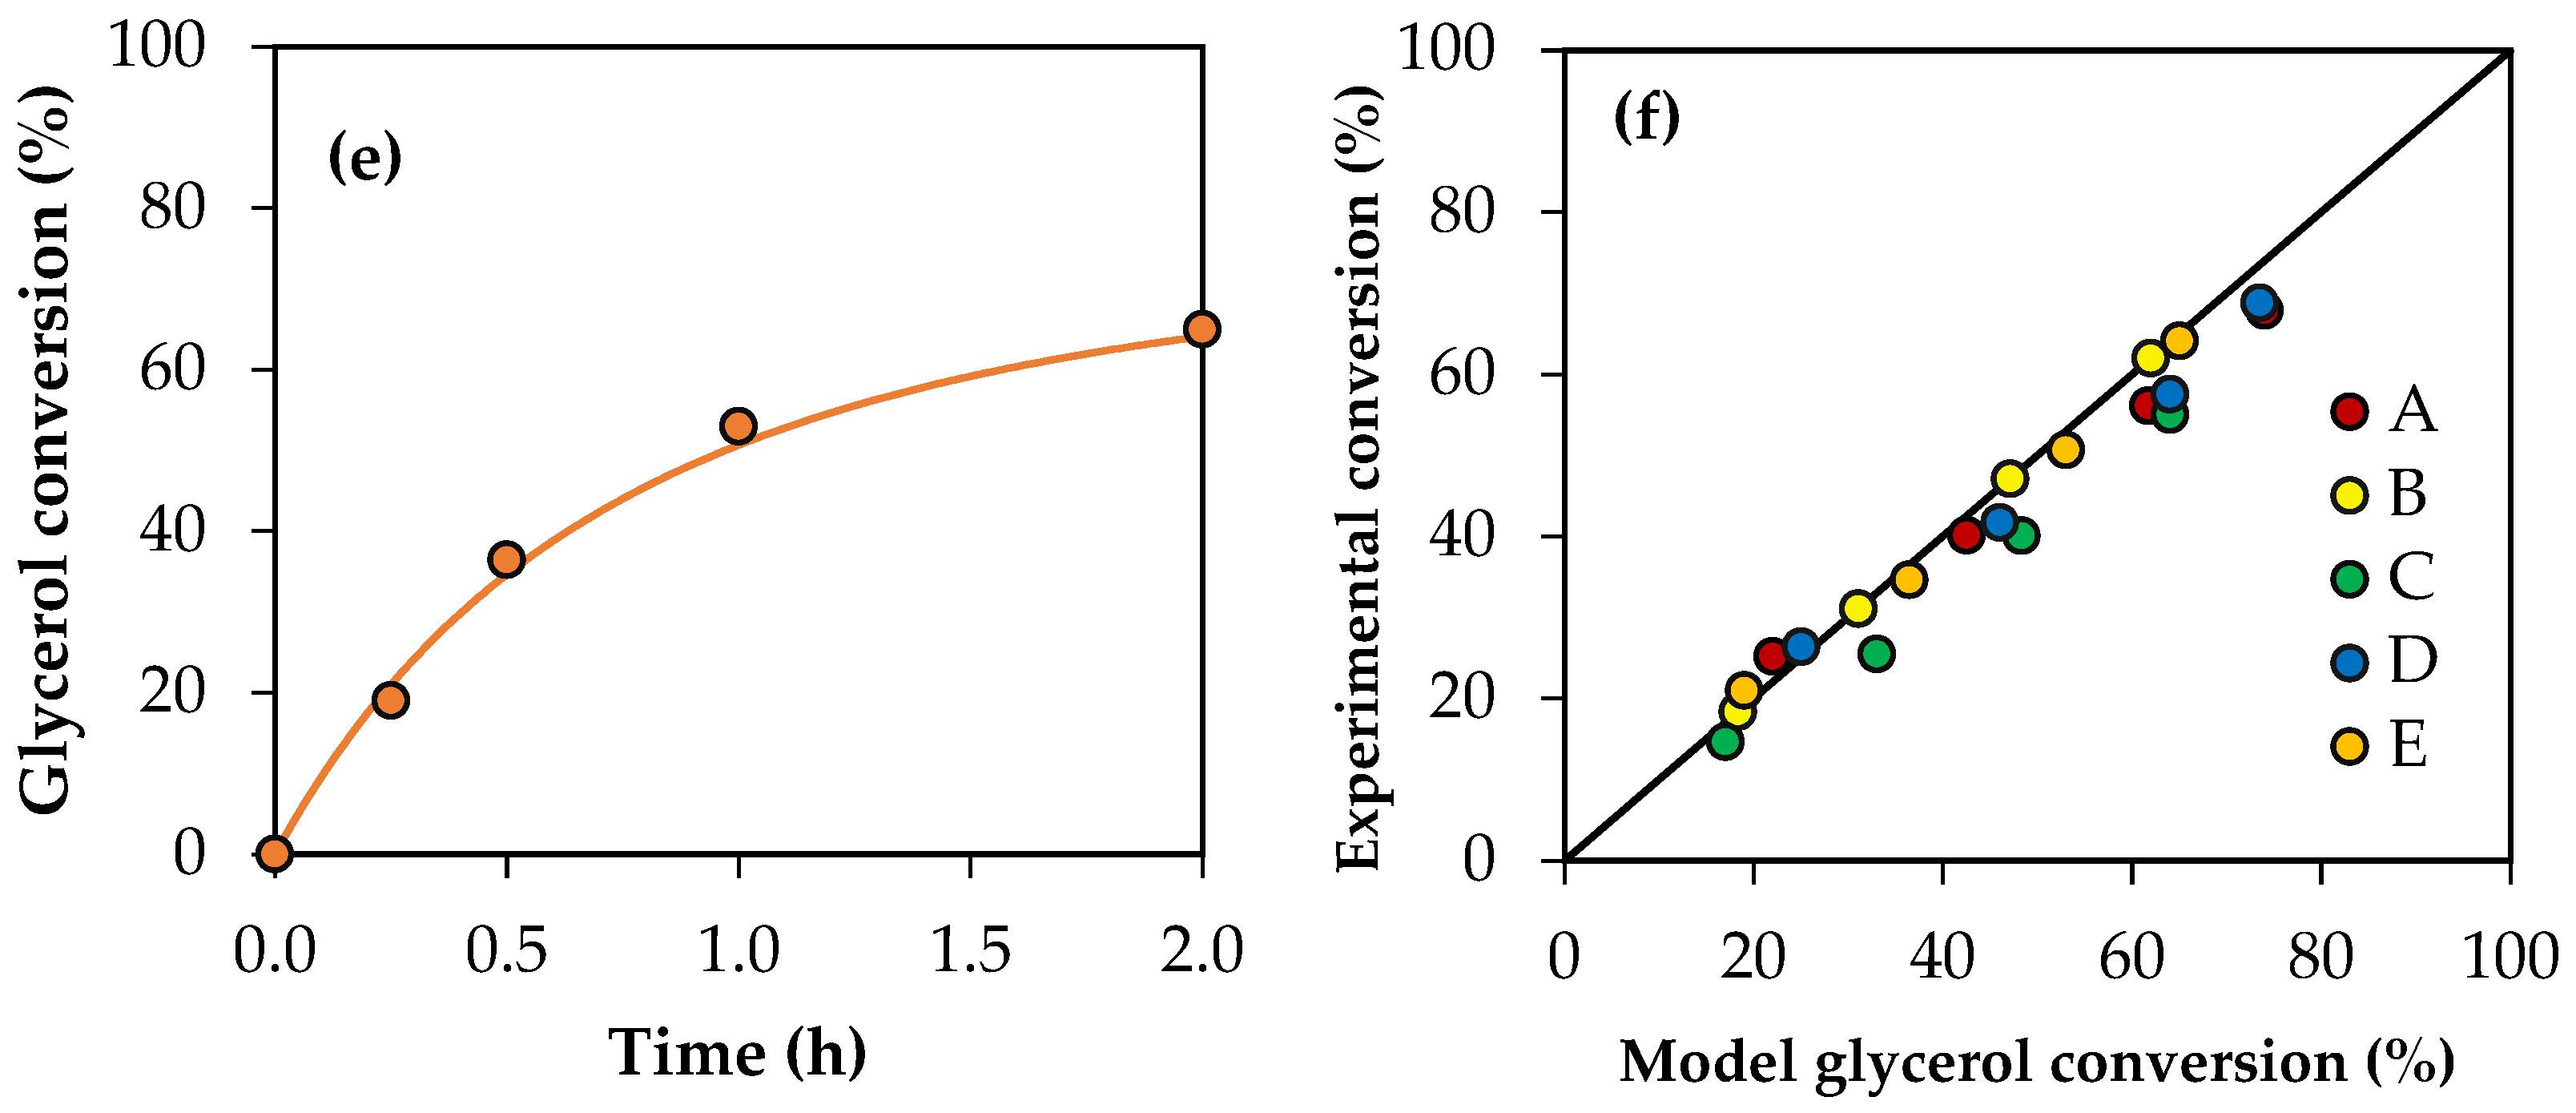
Figure 11 shows the conversion values for crude glycerol samples A–E obtained experimentally and the conversion profiles predicted using the modified kinetic model, considering the global activity factors. The parity plot is also presented for a better comparison between the experimental values and those predicted by the model. As can be seen, there is an acceptable adjustment, indicating that the model allows us to estimate the experimental conversions of the crude glycerol samples with an average error of 7%.


Figure 11.
(a–e) Glycerol conversion as a function of time for crude glycerol samples A, B, C, D and E. (f) Parity plot of experimental conversion versus model conversion. Reaction conditions: 120 °C, AA/G = 6, P = 2 MPa N2 initial pressure.
4. Conclusions
The aim of this work was to develop a kinetic model based on the power law to describe the evolution of glycerol conversion and product distribution in the glycerol acetylation reaction without employing a catalyst, considering analytical glycerol and crude glycerol samples.
The experimental results obtained using analytical glycerol showed that glycerol conversion increases with temperature (80–160 °C) and with the acetic acid to glycerol molar ratio (AA/G = 1–9). Selectivity to mono-acetylglycerol (MAG) also decreases, leading to the formation of di-acetyl glycerol (DAG) and tri-acetyl glycerol (TAG) following the acetylation mechanism reported in the literature. Based on these results, a power law kinetic model was proposed that satisfactorily fitted the experimental activity results, with an average relative error of 14.9%.
Reaction tests employing crude glycerol samples obtained from different biodiesel industries showed a decrease in glycerol conversion for all cases, but with no significant changes in selectivity to MAG, DAG and TAG.
In order to determine the differences among the crude glycerol samples, the effect of each impurity over glycerol conversion was investigated. In this sense, it was demonstrated that the addition of H2O negatively affects glycerol conversion, as it limits the extension of the reaction by shifting the chemical equilibrium. Then, the individual addition of NaOH and NaCOOH decreases glycerol conversion, as they consume part of the acetic acid employed in glycerol acetylation. The same effect was observed with the addition of CH3OH, which consumes part of the acetic acid to form methyl acetate. The presence of NaCl did not affect the acetylation activity, and MONG played a role in the activity just in cases of high concentration levels.
The calculation of individual activity factors for each impurity allowed us to modify the kinetic model to take into account the differences in compositions for the crude glycerol samples, estimating glycerol conversions with an average relative error of 7%.
Supplementary Materials
The following supporting information can be downloaded at https://www.mdpi.com/article/10.3390/reactions5030025/s1, Figure S1: Fitting of experimental data by linear regression to obtain ln (koj) y Eaj: (a) G, (b) MAG, (c) DAG and (d) TAG. Reaction conditions: AA/G = 6, 80–160 °C, P = 2 MPa N2 initial pressure; Figure S2: Fitting of experimental data by linear regression to obtain the individual activity factors (ai) for (a) NaOH, (b) CH3OH, (c) NaOH, (d) NaCOOH and (e) MONG. Reaction conditions: 120 °C, AA/G = 6, 0.5 h, P = 2 MPa N2 initial pressure.
Author Contributions
Conceptualization, M.N.G. and F.M.P.; methodology, F.M.P.; software, F.M.P.; validation, M.N.G., G.F.S. and F.P.; formal analysis, F.M.P. and M.N.G.; investigation, F.M.P.; resources, F.P. and G.F.S.; data curation, F.M.P. and M.N.G.; writing—original draft preparation, M.N.G.; writing—review and editing, F.M.P.; visualization, F.M.P.; supervision, F.P.; project administration, G.F.S. and F.P.; funding acquisition, F.P. and G.F.S. All authors have read and agreed to the published version of the manuscript.
Funding
This research was funded by the Consejo Nacional de Investigaciones Científicas y Técnicas (CONICET), grant number PIP 0386, and the University of La Plata (UNLP), grant number 11/I-279.
Data Availability Statement
The original contributions presented in the study are included in the article/Supplementary Materials, further inquiries can be directed to the corresponding author.
Acknowledgments
The postdoctoral fellowship granted by CONICET to F.M.P. is gratefully acknowledged.
Conflicts of Interest
The authors declare no conflicts of interest.
References
- Posada, J.A.; Rincón, L.E.; Cardona, C.A. Design and analysis of biorefineries based on raw glycerol: Addressing the glycerol problem. Bioresour. Technol. 2012, 111, 282–293. [Google Scholar] [CrossRef] [PubMed]
- Buffoni, I.N.; Gatti, M.N.; Santori, G.F.; Pompeo, F.; Nichio, N.N. Hydrogen from Glycerol Steam Reforming with a Platinum Catalyst Supported on a SiO2-C Composite. Int. J. Hydrogen Energy 2017, 42, 12967–12977. [Google Scholar] [CrossRef]
- Gatti, M.N.; Nichio, N.N.; Pompeo, F. Advances for Biorefineries: Glycerol Hydrogenolysis to 1,3-Propylene Glycol. Reactions 2022, 3, 451–498. [Google Scholar] [CrossRef]
- Gatti, M.N.; Perez, F.M.; Santori, G.F.; Nichio, N.N.; Pompeo, F. Heterogeneous Catalysts for Glycerol Biorefineries: Hydrogenolysis to 1,2-Propylene Glycol. Materials 2023, 16, 3551. [Google Scholar] [CrossRef] [PubMed]
- Perez, F.M.; Nichio, N.; Pompeo, F. Thermodynamic Assessment of Chemical Equilibrium for the Synthesis of Solketal in the Liquid Phase. Chem. Eng. Technol. 2021, 44, 1356–1363. [Google Scholar] [CrossRef]
- Perez, F.M.; Legarto, C.; Lombardi, M.B.; Santori, G.F.; Pompeo, F.; Nichio, N.N. Activated Bentonite Nanocomposite for the Synthesis of Solketal from Glycerol in the Liquid Phase. Catalysts 2022, 12, 673. [Google Scholar] [CrossRef]
- Perez, F.M.; Gatti, M.N.; Fermanelli, C.S.; Saux, C.; Renzini, M.S.; Pomepo, F. Crude glycerol esterification using biomass-derived carbon acid catalysts. Next Mater. 2024, 2, 100125. [Google Scholar] [CrossRef]
- Perez, F.M.; Gatti, M.N.; Santori, G.F.; Pompeo, F. Transformations of Glycerol into High-Value-Added Chemical Products: Ketalization and Esterification Reactions. Reactions 2023, 4, 569–634. [Google Scholar] [CrossRef]
- Liao, X.; Zhu, Y.; Wang, S.G.; Chen, H.; Li, Y. Theoretical Elucidation of Acetylating Glycerol with Acetic Acid and Acetic Anhydride. Appl. Catal. B Environ. 2010, 94, 64–70. [Google Scholar] [CrossRef]
- Fiume, M.Z. Final Report on the Safety Assessment of Triacetin. Int. J. Toxicol. 2003, 22, 1–10. [Google Scholar]
- Perez, F.M.; Gatti, M.N.; Nichio, N.N.; Pompeo, F. Bio-Additives from Glycerol Acetylation with Acetic Acid: Chemical Equilibrium Model. Res. Eng. 2022, 15, 100502. [Google Scholar] [CrossRef]
- Troncea, S.B.; Wuttke, S.; Kemnitz, E.; Coman, S.M.; Parvulescu, V.I. Hydroxylated Magnesium Fluorides as Environmentally Friendly Catalysts for Glycerol Acetylation. Appl. Catal. B Environ. 2011, 107, 260–267. [Google Scholar] [CrossRef]
- Bonet, J.; Costa, J.; Sire, R.; Reneaume, J.-M.; Plesu, A.E.; Plesu, V.; Bozga, G. Revalorization of glycerol: Comestible oil from biodiesel synthesis. Food Bioprod. Process. 2009, 87, 171–178. [Google Scholar] [CrossRef]
- Mufrodi, Z. Chemical Kinetics for Synthesis of Triacetin from Biodiesel Byproduct. Int. J. Chem. 2012, 4, 101–107. [Google Scholar] [CrossRef]
- Nda-Umar, U.; Ramli, I.; Muhamad, E.N.; Taufiq-Yap, Y.H.; Azri, N. Synthesis and characterization of sulfonated carbon catalysts derived from biomass waste and its evaluation in glycerol acetylation. Biomass Convers. Biorefinery 2020, 12, 2045–2060. [Google Scholar] [CrossRef]
- Raemas, A.F.A.; Cahyonugroho, J.; Wicaksono, A.D.; Dewi, R.L.; Hadiyanto. Ultrasound-assisted Esterification of Glycerol for Triacetin Production. Mater. Sci. Eng. 2021, 1053, 012062. [Google Scholar] [CrossRef]
- Kong, P.S.; Aroua, M.K.; Daud, W.M.A.W.; Lee, H.V.; Cognet, P.; Pérès, Y. Catalytic Role of Solid Acid Catalysts in Glycerol Acetylation for the Production of Bio-Additives: A Review. RSC Adv. 2016, 6, 68885–68905. [Google Scholar] [CrossRef]
- Patel, A.; Singh, S. A Green and Sustainable Approach for Esterification of Glycerol Using 12-Tungstophosphoric Acid Anchored to Different Supports: Kinetics and Effect of Support. Fuel 2014, 118, 358–364. [Google Scholar] [CrossRef]
- Rane, S.A.; Pudi, S.M.; Biswas, P. Esterification of Glycerol with Acetic Acid over Highly Active and Stable Alumina-Based Catalysts: A Reaction Kinetics Study. Chem. Biochem. Eng. Q. 2016, 30, 33–45. [Google Scholar] [CrossRef]
- Veluturla, S.; Shetty, S.; Rao, D.S.; Archna, A. Kinetic Study of Synthesis of Bio-Fuel Additives from Glycerol Using a Hetropolyacid. Resour. Technol. 2017, 3, 337–341. [Google Scholar] [CrossRef]
- Banu, I.; Bumbac, G.; Bombos, D.; Velea, S.; Gălan, A.M.; Bozga, G. Glycerol Acetylation with Acetic Acid over Purolite CT-275. Product Yields and Process Kinetics. Renew. Energy 2020, 148, 548–557. [Google Scholar] [CrossRef]
- Keogh, J.; Jeffrey, C.; Tiwari, M.S.; Manyar, H. Kinetic Analysis of Glycerol Esterification Using Tin Exchanged Tungstophosphoric Acid on K-10. Ind. Eng. Chem. Res. 2022, 62, 19095–19103. [Google Scholar] [CrossRef]
- Reinoso, D.M.; Boldrini, D.E. Kinetic Study of Fuel Bio-Additive Synthesis from Glycerol Esterification with Acetic Acid over Acid Polymeric Resin as Catalyst. Fuel 2020, 264, 116879. [Google Scholar] [CrossRef]
- Tonutti, L.G.; Dalla Costa, B.O.; Decolatti, H.P.; Mendow, G.; Querini, C.A. Determination of Kinetic Constants for Glycerol Acetylation by Particle Swarm Optimization Algorithm. Chem. Eng. J. 2021, 424, 130408. [Google Scholar] [CrossRef]
- Balaraju, M.; Rekha, V.; Prabhavathi Devi, B.L.A.; Prasad, R.B.N.; Sai Prasad, P.S.; Lingaiah, N. Surface and structural properties of titania-supported Ru catalysts for hydrogenolysis of glycerol. Appl. Catal. A Gen. 2010, 384, 107–114. [Google Scholar] [CrossRef]
- Zhu, S.; Zhu, Y.; Hao, S.; Zheng, H.; Mo, T.; Li, Y. One-step hydrogenolysis of glycerol to biopropanols over Pt–H4SiW12O40/ZrO2 catalysts. Green Chem. 2012, 14, 2607–2616. [Google Scholar] [CrossRef]
- Rajkhowa, T.; Marin, G.B.; Thybaut, J.W. Quantifying the dominant factors in Cu catalyst deactivation during glycerol hydrogenolysis. J. Ind. Eng. Chem. 2017, 54, 270–277. [Google Scholar] [CrossRef]
- Mota, C.J.A.; Pinto, B.P.; de Lima, A.L. Glycerol: A Versatile Renewable Feedstock for the Chemical Industry; Springer: Cham, Switzerland, 2017; ISBN 9783319593753. [Google Scholar]
- ASTM D 891-95; Standard Test Methods for Specific Gravity, Apparent, of Liquid Industrial Chemicals. ASTM: West Conshohocken, PA, USA, 2000.
- ISO 760-1978; Determination of Water—Karl Fischer Method (General Method). International Organization for Standarization: Geneva, Switterland, 1978.
- ISO 2098-1972; Glycerols for Industrial Use—Determination of Ash—Gravimetric Method. International Organization for Standarization: Geneva, Switterland, 1972.
- Bartholomew, C.H.; Farrauto, R.J. Fundamentals of Industrial Catalytic Processes; John Wiley & Sons, Inc.: Hoboken, NJ, USA, 2005; ISBN 9780471457138. [Google Scholar]
- Magar, S.; Mohanraj, G.T.; Jana, S.K.; Rode, C.V. Synthesis and characterization of supported heteropoly acid: Efficient solid acid catalyst for glycerol esterification to produce biofuel additives. Inorg. Nano-Met. Chem. 2020, 50, 1157–1165. [Google Scholar] [CrossRef]
- Altino, F.M.R.S.; da Silva, D.S.; Bortoluzzi, J.H.; Meneghetti, S.M.P. Investigation of glycerol acetylation in the presence of Sb catalysts. Biomass Convers. Biorefinery 2023, 13, 3237–3246. [Google Scholar] [CrossRef]
- Reddy, P.S.; Sudarsanam, P.; Raju, G.; Reddy, B.M. Selective acetylation of glycerol over CeO2-M and SO42-/CeO2-M (M = ZrO2 and Al2O3) catalysts for synthesis of bio additives. J. Ind. Eng. Chem. 2012, 18, 648–654. [Google Scholar] [CrossRef]


Disclaimer/Publisher’s Note: The statements, opinions and data contained in all publications are solely those of the individual author(s) and contributor(s) and not of MDPI and/or the editor(s). MDPI and/or the editor(s) disclaim responsibility for any injury to people or property resulting from any ideas, methods, instructions or products referred to in the content. |
© 2024 by the authors. Licensee MDPI, Basel, Switzerland. This article is an open access article distributed under the terms and conditions of the Creative Commons Attribution (CC BY) license (https://creativecommons.org/licenses/by/4.0/).