Article

Nanocomposite-Supported Polymeric Composites Prepared with Different Deposition Bases: Characterization and Application in X-ray Shielding

by
Shaymaa Mohammed Fayyadh
1,2,* and
Ali Ben Ahmed
1,*
1
Laboratory of Applied Physics, Faculty of Science of Sfax, University of Sfax, Sfax 3000, Tunisia
2
Department of Physics, College of Sciences, Tikrit University, Tikrit 34001, Iraq
*
Authors to whom correspondence should be addressed.
Physics 2024, 6(1), 334-355; https://doi.org/10.3390/physics6010022
Submission received: 19 September 2023 / Revised: 24 December 2023 / Accepted: 2 January 2024 / Published: 4 March 2024
(This article belongs to the Section Applied Physics)

Abstract

:
This study deals with the preparation of magnetite nanoparticles (NPs) via a coprecipitation method using several precipitation bases: binary precipitator (NH4OH), mono precipitator (NaOH), and weak precipitator (Ca(OH)2). The prepared magnetite NPs were identified using X-ray diffraction (XRD), transmission electron microscopy (TEM), scanning electron microscopy (SEM), energy-dispersive X-ray (EDX) analysis, surface area analysis, magnetic properties, Fourier-transformed infrared spectra (FT-IR), and ultra-violet UV–visible spectra. As a result, the phases of the produced magnetite NPs were unaffected by the use of various bases, but their crystallite sizes were affected. It was found that the binary base provided the smallest crystallite size, the mono base provided an average size, and the weak base provided the largest crystallite size. The UV–visible absorption spectroscopy investigation revealed that the absorption and the energy gap rose with a reduction in nanoparticle size. The prepared magnetite NPs were used to manufacture polymeric-based nanocomposites employed as protective shields from low-energy X-rays that are light in weight. These samples were identified using XRD, atomic force microscopy (AFM), and FT-IR spectroscopy. The crystallite size was slightly larger than it was in the case of magnetite NPs. This is consistent with the results of AFM. The interference between the two phases was observed in the results of the FT-IR spectra. The effects of the size of the magnetite NPs on the attenuation tests, linear attenuation coefficient, mass attenuation coefficient, half-value layer, and mean free path were investigated. The results showed that the efficiency of using manufactured shields increases with the decrease in the NPs size of the magnetite used as a reinforcement phase for a range of low operating voltages.

1. Introduction

The production of protective shields is necessary due to the usage of X-ray ionization in many disciplines, including the medical profession, nuclear and atomic laboratories, etc. It is necessary to comprehend how X-rays interact with objects in order to create suitable shields. In essence, X-rays are a class of electromagnetic radiation with short wavelengths and high energy [1,2,3,4,5,6,7]. When a medium is exposed to a beam of these rays, secondary electrons are created, which transfer the majority of the incident photon’s energy to the medium’s substance and ionize its atoms [8,9,10]. With increasing absorbent material thickness, the beam deteriorates dramatically, and the photon absorption or scattering process is dependent on both the photon’s energy and the medium’s type of matter [9,11,12,13]. Lead, tungsten, bismuth, and other elements with high atomic weights are some of the most significant materials utilized as shields to attenuate ionizing radiation. They have unwanted and impractical qualities such as being heavy and large. Moreover, they often fall short in shielding and pose toxicity hazards as well as environmental concerns during disposal. Heavy element-reinforced polymers are a good alternative to use when making radiation shields due to their lightweight nature and the ability to form in a way that makes them useful for a variety of radiation protection applications, such as the creation of radiation-resistant clothing [14,15,16,17,18,19,20,21,22,23,24,25,26,27,28,29,30].
It is worth noting that the use of magnetite nanoparticles (NPs) to reinforce polymeric materials to manufacture protective shields from ionizing radiation is due to the fact that the surface area per unit size is inversely proportional to the diameter of the granules. This means that with constant density, the attenuation coefficient is inversely proportional to the diameter. As for the half thickness, it is directly proportional to the diameter of the granules; therefore, there is an indirect relationship between the nanoparticle size and the process of attenuation of the photons falling on the material [31,32]. In addition, the use of nanomaterials to support polymeric materials works to increase the dispersion of the support phase within the polymer matrix, which is reflected in raising the bulk density of the composites, thus improving the attenuation of radiation [33].
Magnetite (Fe3O4) is classified as the best material used in the formation of natural rocks used in shielding from ionizing radiation due to its specific weight range of 5.2–4.6 and its natural abundance. It serves as a source for the reinforcement of polymeric-based composites used to create comparatively lightweight X-ray protective shields with advantageous mechanical and thermal characteristics. The importance of using magnetite in various fields increases when it is of nano size due to its vast surface area at the expense of size and the simplicity with which its surface can be coated with organic and inorganic compounds and polymers. Magnetite plays an increasingly important role in a variety of industries; using this preparation process, particle size and structural features can be controlled [34,35].
The sol–gel process, thermal decomposition, coprecipitation, and others are the most frequently used techniques for preparing nanomaterials. The technique used in this study to prepare magnetite nanoparticles is coprecipitation, which is regarded as one of the most common and reasonably cost-effective ways to prepare diverse nanomaterials in general and nanomagnetic materials in particular [36,37,38,39].
In the present paper, we study the manufacture of polymeric nanocomposite supported by magnetite NPs prepared for the manufacture of lightweight shields that protect against X-rays with relatively low energy. We reported all of the experimental findings on the coprecipitation method’s manufacture of magnetite NPs using different precipitation bases—Ca(OH)2, NaOH, and NH4OH. Moreover, the nanostructures were characterized using energy-dispersive X-ray (XRD), scanning electron microscopy (SEM), magnetic properties, surface area, energy-dispersive X-ray (EDX), Fourier-transformed infrared (FT-IR), and ultra-violet UV–visible spectroscopy. In addition, we diagnosed the efficiency of the developed nanocomposites using XRD, atomic force microscopy (AFM), FT-IR, and X-ray attenuation. To our best knowledge, no have covered and reported on the preparation of nanomagnetite powder via the coprecipitation method using different precipitation bases. In addition, we studied the effect of the different magnetite NPs on the attenuation, morphological, and magnetic properties of polymeric composites.

2. Materials and Methods

2.1. Synthesis of Magnetite NPs

In Table 1, all the utilized compounds are listed. The following actions were taken in order to prepare the magnetite NPs (Fe3O4) using the coprecipitation method: In the first step, we chose the ratio (2/1) of the salts Fe+3, Fe+2, where 6.4   m g and 5.56   m g of the salts (FeCl3 and FeSO4·7H2O) were mixed, respectively. In addition, 31   m L of HCl acid was added at a concentration of 1.5   M after diluting it with 250   m L of ionic water. Then, the solution was placed on a magnetic stirrer at a rotational speed of 3000 rpm/min at room temperature for 2   h and left without stirring for 24   h to ensure complete dissolution before filtering. The chemical reaction medium equation for magnetite can be written as follows [35]:
F e 2 + + 2 F e 3 + + 8 O H F e 3 O 4 + 4 H 2 O .
In the second step, the sedimentation bases are prepared separately. A concentration of 1.5   M of the bases NaOH, Ca(OH)2, and NH4OH is used. The bases’ dissociation equations formulas used are given, respectively, by [40]
N a O H N a + + O H ,
C a ( O H ) 2 C a 2 + + 2 O H ,
N H 4 O H N H 4 + + O H .
The prepared solutions were filtered using filter paper. The prepared base solutions were dripped separately at a rate of 5   m L / m i n into the prepared solution in the first step after placing it on the magnetic stirrer at a rotational speed of 3000   r p m / m i n at room temperature, and the distillation continued until the solution reached a value of p H = 14 . It is worth noting that the residue appeared between p H = 6 and p H = 8 according to the type of base used for sedimentation. The sediment was washed with water several times until p H = 7 was reached, then the powders were dried in a drying oven at a temperature of 60   ° C for 24   h , denoted as magnetite (NaOH), magnetite (Ca(OH)2), and magnetite (NH4OH).

2.2. Fabrication of Nanocomposites

Epoxy resin was used as the base phase in the creation of the nanocomposite. This resin is known for its mechanical and thermal properties, lack of interaction with most chemical solutions, good moisture resistance, and thermal hardening. When a hardener is added to it, it transforms into a solid with a high molecular weight. In order to weigh the necessary amount, a sensitive balance with four levels was used to weigh the epoxy with the hardener at a mixing ratio of 1/3. Then, a glass motor was used to mix the components for 30   s while adhering to the following volumetric fractions of the components of the nanocomposites: A (pure epoxy), B (epoxy + magnetite (Ca(OH)2)), C (epoxy + magnetite (NaOH)), and D (epoxy + magnetite (NH4OH)), shown in Table 2. The mixture was stirred with a glass motor for a period not exceeding 30   s to ensure that complete solidification did not occur and to disperse the nanomaterials and prevent agglomeration; the ultrasonic device was used for a period not exceeding 5   m i n . The mixture was poured into a circular mold with a diameter of 10   m m and a height of 4   m m , after which the models were left for a period of not less than 48 h to ensure complete solidification. They were extracted from the mold and placed inside the drying oven at a temperature of 60   ° C for a period of 10   m i n to complete the heat treatment and relaxation. The primary phase bonds with the reinforcement phase and then the models are ready for shielding tests [10,20,39]. Then, we calculated the volumetric fraction, the weight fraction, and the density of theoretical compounds, respectively, to determine the required amount of the two phases, respectively:
V f = 1 / 1 + 1 Ψ Ψ ρ f ρ m ,
Ψ % = W f W f + W m × 100 ,
W c = W f + W m ,
ρ c = V f ρ f + 1 V f ρ m ,
where V f is the fraction volume, Ψ represents the weight fraction of the reinforcing material, W c is the weight fraction for composite material, W f is the weight fraction of the reinforcing material, W m is the weight of the base material, ρ c is the density of the composite, ρ f is the density of the filler, ρ m is the density of the matrix material.

2.3. Characterization Techniques

The XRD patterns of all developed samples were recorded with a wavelength of λ = 1.5406   Å , the current I = 30   m A , and the voltage V = 40   k V using a Cu target. To measure the size of magnetite NPs from XRD data, the Debye–Scherrer equation is used [41]:
D = K λ β cos θ ,
where λ = 1.5406   Å is the Cu kα line, θ is the Braggs’ XRD diffraction angle, β is the full width at half maximum (FWHM) in radians, and K = 0.9 is a unitless constant that depends on the shape of the crystal.
The above equation is limited to the nanoscale, it is not applicable to particles larger than 0.1 0.2   μ m , and it measures the minimum particle size. The reason for this is that there are many effects on the width of the apex other than the effect of the device and because of the difference in the size of the crystals of the material to be studied. The surface area ( S ) is calculated by the following equation [19]:
D = 6 S · ρ ,
where D ( n m ) is the particle size, S ( m 2 / m g ) is the specific surface area, and ρ = 5.18   g / c m 3 represents the density of the material. Nitrogen gas was used at a temperature of 77   K measured using the Brunauer–Emmett–Teller (BET), Langmuir (Lan), t-plot (T), and Barrett-Joyner-Halenda (BHJ) methods.
Transmission electron microscopy (TEM) was used to study the average particle size of the prepared materials, through which we could identify the nature of the distribution in addition to studying the shape of the particles.
Scanning electron microscopy (SEM), was used to study the surface composition of samples, as it has a high analysis capacity that reaches the nanoscale. For the purpose of analyzing the elements and knowing their proportions, EDX was used, which involves a device attached to the scanning electron microscope.
Magnetic hysteresis is defined as the lag in the magnetization changes when the external magnetic field changes. If a ferromagnetic material is exposed to increasing and decreasing fields, and the changes between the magnetic field (H) and the magnetic induction (B) are plotted, the magnetic lag curve can be plotted, and through the magnetic hysteresis curve, magnetic saturation ( M s ) was measured [42,43]. Magnetization occurs and magnetism increases when the magnetic field increases beyond a specific limit, after which all moments are aligned towards the applied magnetic field. The material reaches the magnetic saturation limit, after which any increase in the magnetic field does not increase the magnetization. In the case of decreasing the magnetic field until it reaches H = 0 , the material that has magnetic moments will retain a part of the magnetization, called the residual magnetism ( M r ) , which results from the aligned moments [43].
AFM was used to identify fine details of topography and crystalline granular structures on the surface of the prepared samples in two (2D) and three (3D) dimensions. This microscope is characterized by a high-resolution capacity of 0.1–1.0 nm and a high magnification power estimated at 5 × 10²–108, with the possibility of operating it under normal atmospheric pressure and without the need for a high vacuum as is customary in electron microscopes. We can know the surface roughness rate and the root mean square (RMS), which represents the square of the sum of the heights and depressions of the grains over their sum under the square root. The lower the RMS value, the more uniform the surface. The grain distribution, the average grain size, and the grain height within the area were also studied.
The infrared spectra were recorded with FT-IR in a Shimadzu 8400 infrared spectrophotometer (Shimadzu Corp., Kyoto, Japan) in the range 4000 400   c m 1 .
The UV–visible spectra of prepared samples were recorded using a UV–visible–NIR (near-infrared) spectrophotometer with a wavelength range of 190 1100   n m . The optical properties under study are absorbance, permissible direct energy gap, and permissible indirect energy gap. The energy gap, Eg, can be calculated using the following equation [44,45,46]:
( α h ν ) r = b ( h ν E g ) ,
where r is an exponential coefficient, whose value depends on the type of transition as follows: r = 1 / 2 indirect transmission allowed, r = 2 direct transmission allowed, α is absorption coefficient, h is the Planck constant and b is the constant.
An X-ray attenuation test was performed to evaluate shields made of nanocomposites using an X-ray generation device. A current of 0.2   m A and operating voltages of 20   k e V , 25   k e V , 30   k e V , and 35   k e V are used to find out their effect on the attenuation properties of the nanocomposites. The X-ray-generating tube is made of molybdenum and the radiation detector is Geiger–Müller counter, with a filter of zirconium with its angle fixed at a certain value. After that, the readings of the original intensity ( I 0 ) are made without the presence of the sample at the beginning and end of each attempt, with the goniometer angle at a fixed value, and then the model is put in the place designated for examination inside the device. I is measured five times for each of the nanocomposites (A, B, C, D) to reduce the error rate. In addition, a thickness parameter was used for all models.
The shields manufactured to protect against X-rays must possess some criteria that make them a suitable material for protection against radiation and reduce damage. The key criteria are as follows.
The linear attenuation coefficient ( µ ) of X-rays in a medium by photon removal from the beam per unit path during its interaction with the atoms of the attenuated medium as a result of the occurrence of photon absorption or scattering. The attenuation coefficient is calculated using the following equation [9,46]:
µ = ln I 0 / I T / x
where I 0 and I T denote the incident and transmitted intensity of radiation, respectively. Here, x is the thickness of absorbing material (in this study, the value of the models was fixed).
The radiation attenuation in one of the three attenuation coefficients dependent on the energy of the incident photon which depends on the atomic number of the substance. µ m is the algebraic sum of the molecular absorption coefficients (photoelectric effect, Compton effect, pair production). This is calculated using the following equation [2,3,46]:
µ m = µ / ρ ,
where ρ is the density of the sample and is calculated from Equation (8).
The half thickness is the amount of material needed to reduce the intensity of incident rays to half of what it was initially, i.e., I T = I 0 / 2 . This parameter can be calculated by the following equation [10,46]:
H V L = l n 2 µ .
The mean free path ( λ ) represents the thickness of the material required to remove a photon from the beam of rays falling on the material. The free path rate is calculated by the following equation [10,13]:
λ = 1 / µ .

3. Results and Discussion

3.1. Effect of Sedimentation Rules on Structure Description

From Figure 1, one can see that the different sedimentation bases used do not affect the phase change of prepared magnetite. It should be noted that the phase is cubic for magnetite prepared with different bases and this agrees with the research in [19,47,48,49]. From Table 3, it can be seen that the value of the lattice constant (a) does not change dependent on the sedimentation base used. One can also see that the different sedimentation rules affected the crystallite size of the resulting magnetite NPs and that the order of the crystallite size from smallest to largest is D(magnetite (Ca(OH)2)) < D(magnetite (NaOH)) < D(magnetite (NH4OH)). This arrangement shows that using Ca(OH)2 gives smaller crystallite sizes than other bases. This is attributed to a rapid union with iron that occurs as a result of the abundance of oxygen and its high negativity, in addition to the relatively low electrical negative value of iron which is estimated at 1.83. This causes rapid precipitation, obtaining a nanosized crystallite to quickly reach the required value and thus reduce the development time of the crystallites [49].
When using the strong base NaOH, one notices that the Na+ ion has low electronegativity, so rapid dissociation occurs in the base ions, and the negative ions combine with the iron ions to form magnetite NPs. This process begins at a low p H , so there will be sufficient time until p H = 14 is reached and the granule growth process occurs. As a result of this process, an average size of nanograins is produced. Meanwhile, in the case of using the weak base NH4OH, the particle size is the largest, but it is also on the nanometric scale. This size is attributed to the chemical composition, so that each nitrogen atom is bonded to four hydrogen atoms. Due to the difference in electronegativity of the elements, this results in a decay of the base, resulting in an abundance of hydrogen at the expense of oxygen and, consequently, a slow precipitation process and difficulty in raising the acid function, which results in a relatively large granular size. That is, the strength of the precipitating base affects the nucleation process. For example, the weak base NH4OH produces a smaller number of nuclei, which favors crystal growth and size. However, when strong bases such as NaOH are used, a bigger number of nuclei will precipitate, which limits the nucleation rate and results in particles with a smaller grain size. These results are in agreement with the results of Ref. [50].

3.2. Effect of Different Sedimentation Rules on Surface Area

The specific surface area (S), the specific volume, and its relationship to the type of base used for the deposition of nanomagnetite were calculated using BET, Langmuir, T, and BJH methods. Table 4 shows that the quantities calculated from these methods are subject to the following order of qualitative size: V L a n > V B E T > V B J H > V T , and specific surface area: S L a n > S B J H > S B E T > S T . When comparing the obtained surface area by the different methods in Table 4 and the specific surface area extracted from the X-ray diffraction analysis data in Table 3, one notices that there are some differences. This difference means that the specific surface area extracted from the XRD result is more subject to the inverse relationship with the particle size. As a result, a decrease in the particle size improved the quality of the surface area, in the following order: S [ m a g n e t i t e C a O H 2 ] < S [ m a g n e t i t e N a O H ] < S [ m a g n e t i t e N H 4 O H ] .
In the case of comparing the grain size extracted from the BET and Langmuir plots and from the XRD data, there is a quite good match in terms of the order of the bases from smallest to largest: V [ m a g n e t i t e C a O H 2 ] > V [ m a g n e t i t e N a O H ] > V [ m a g n e t i t e N H 4 O H ] . Minor differences between the results of XRD are deduced from the relatively small size of magnetite NPs, which results in faster agglomeration of the granules and thus gives slightly higher values of particle size. Under these conditions, the surface will be affected by surface analysis by different adsorption methods.

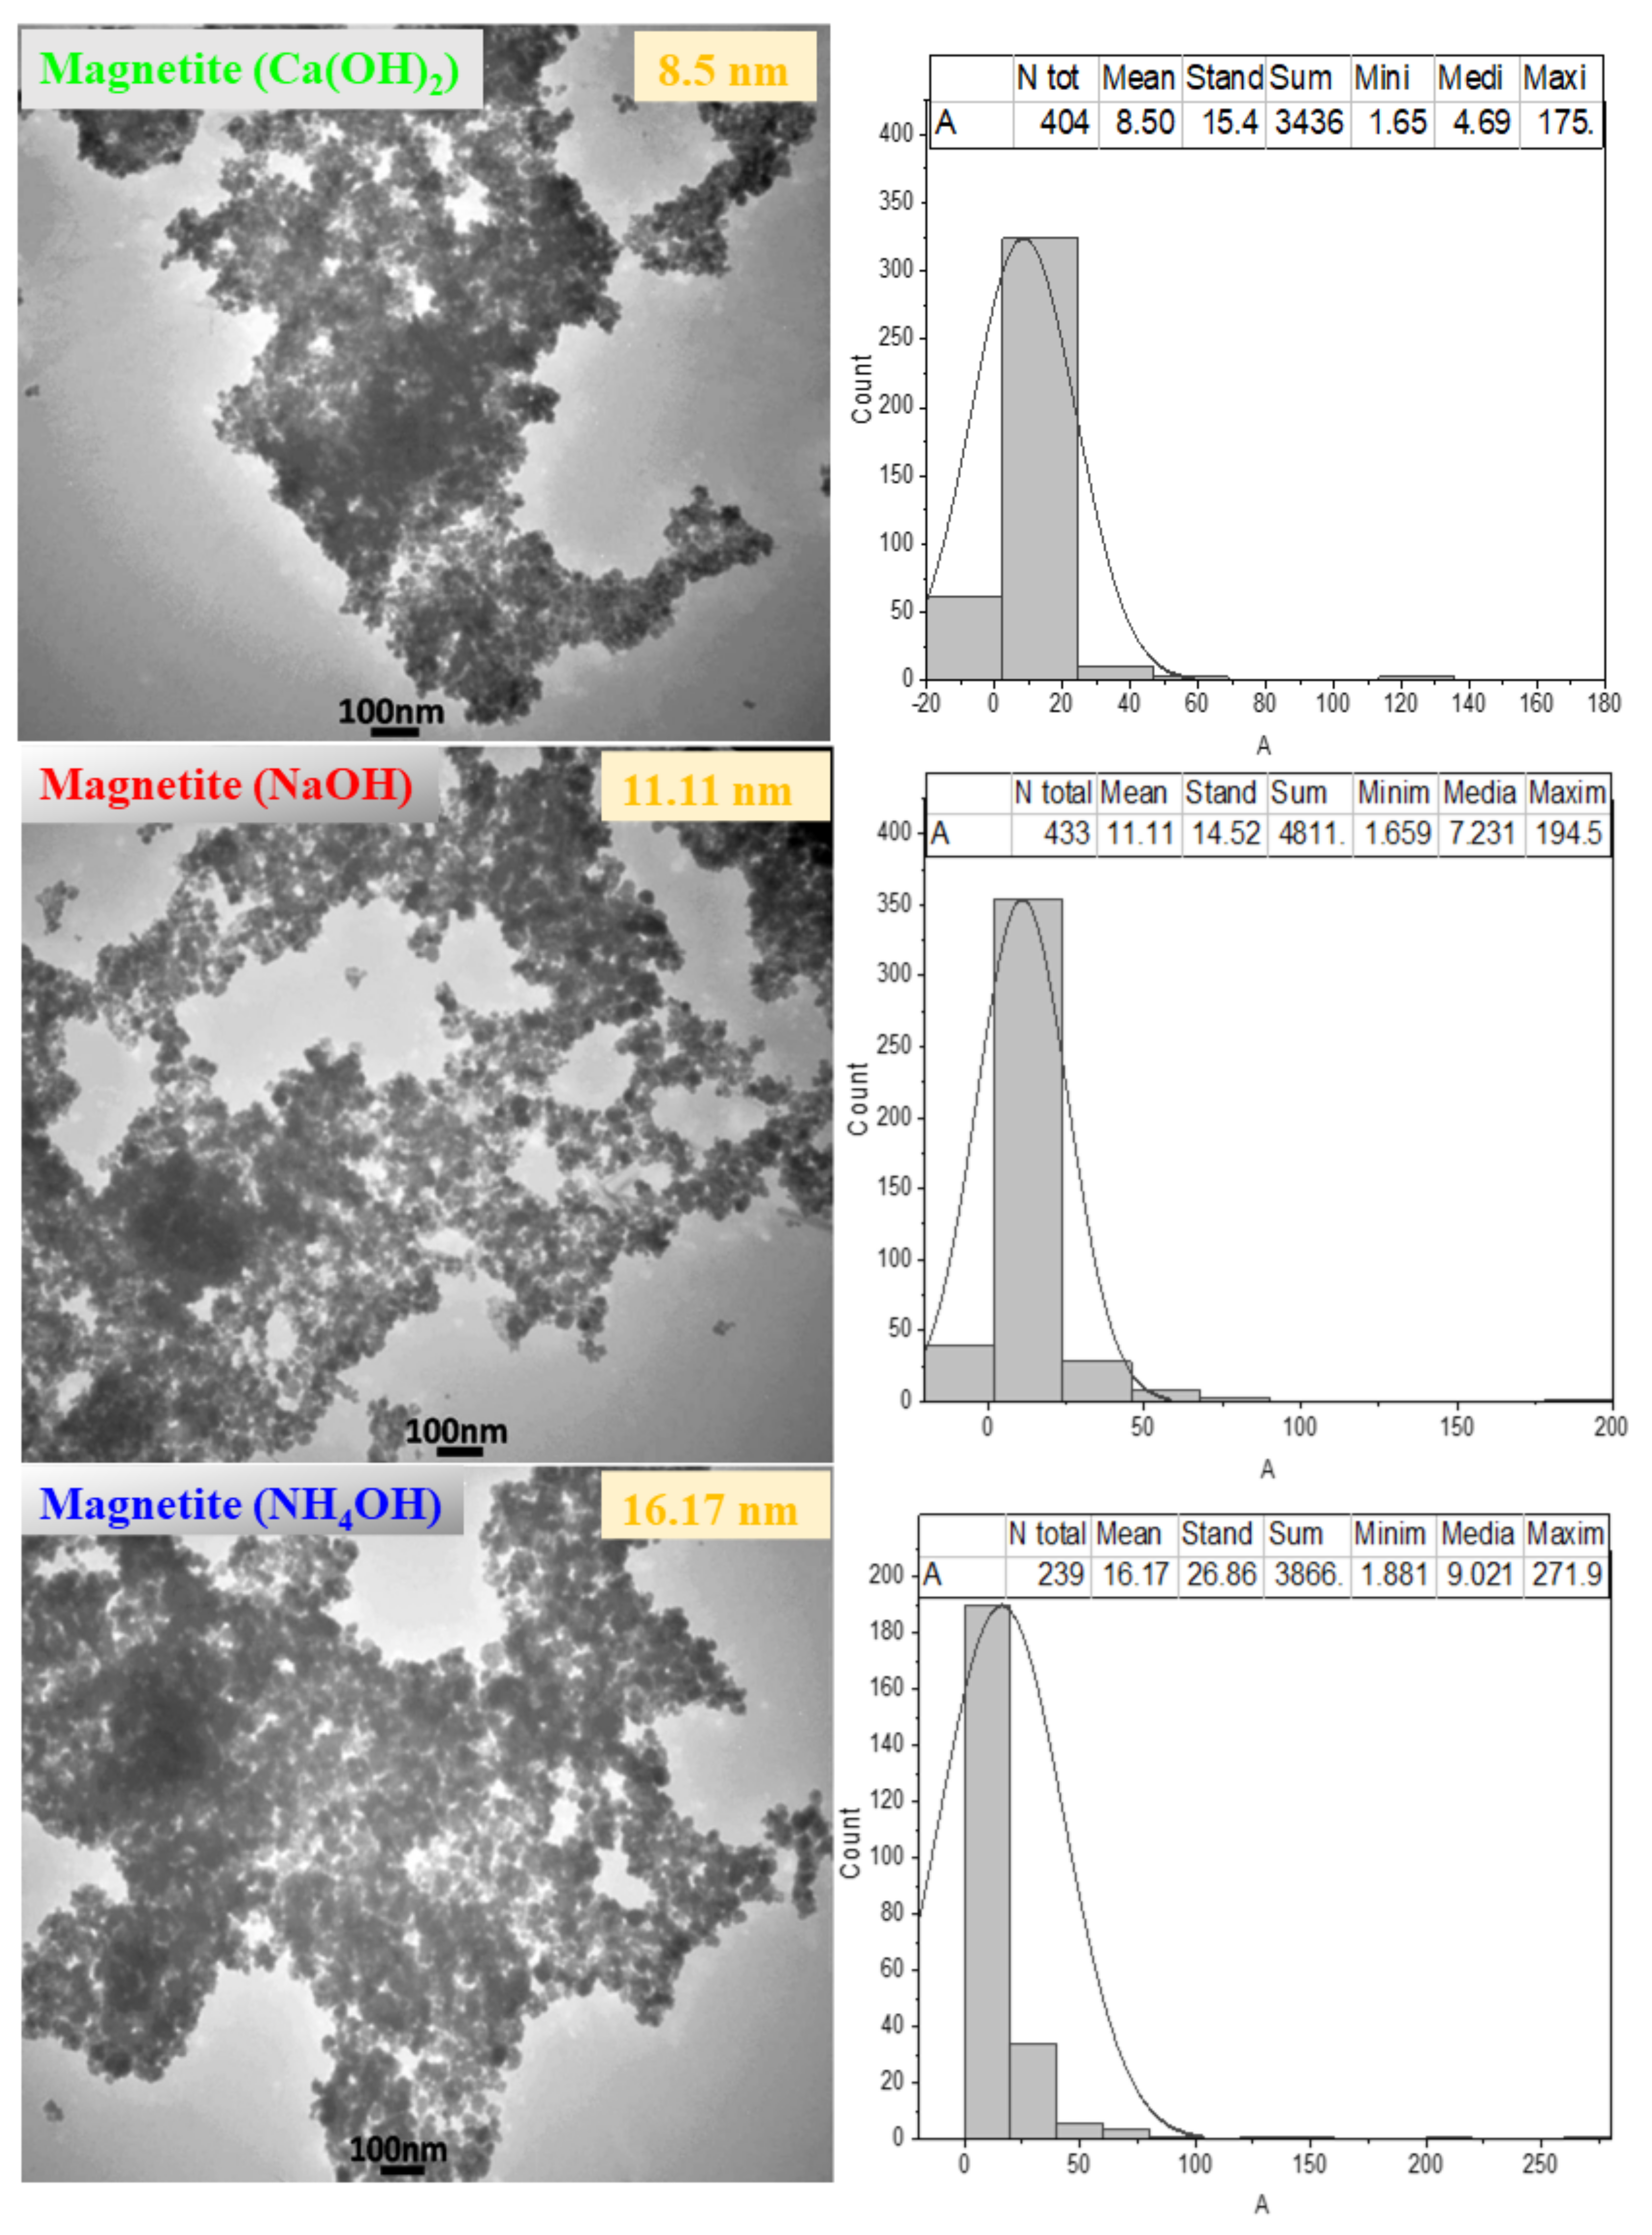
3.3. Effect of Sedimentation Rules on Powder Morphology

From Figure 2 and Figure 3, the particle sizes are 8.5 nm, 11.11 nm, 16.17 nm and 22.78   n m , 28.19   n m , and 33.51   n m , respectively, for magnetite prepared with Ca(OH)2, NaOH, and NH4OH bases, respectively. This agrees with what was obtained from the results of the XRD analysis (see Table 3). The small increase in particle size found by TEM and SEM examination compared to XRD is due to the nature of nanomaterials that can agglomerate. This property increases more in magnetic magnetite NPs. One also notices that the granular shape of the prepared samples did not change according to the type of base used to prepare them. A finer granular look indicates that this parameter does not affect the shape, but it does affect the particle size; see Figure 3, right.
The EDX spectrum, shown in Figure 4, was used to determine the purity of the prepared magnetite NPs. Note that the purity was very high. Still, there was a difference in the weight ratios of the constituent elements of the magnetite resulting from the different chemical bases [34,51]. The difference in the weight ratios of the elements is due to the variation in the electronegativity values of the different sedimentation bases, which leads to a difference in the precipitated weight ratio of iron and oxygen.

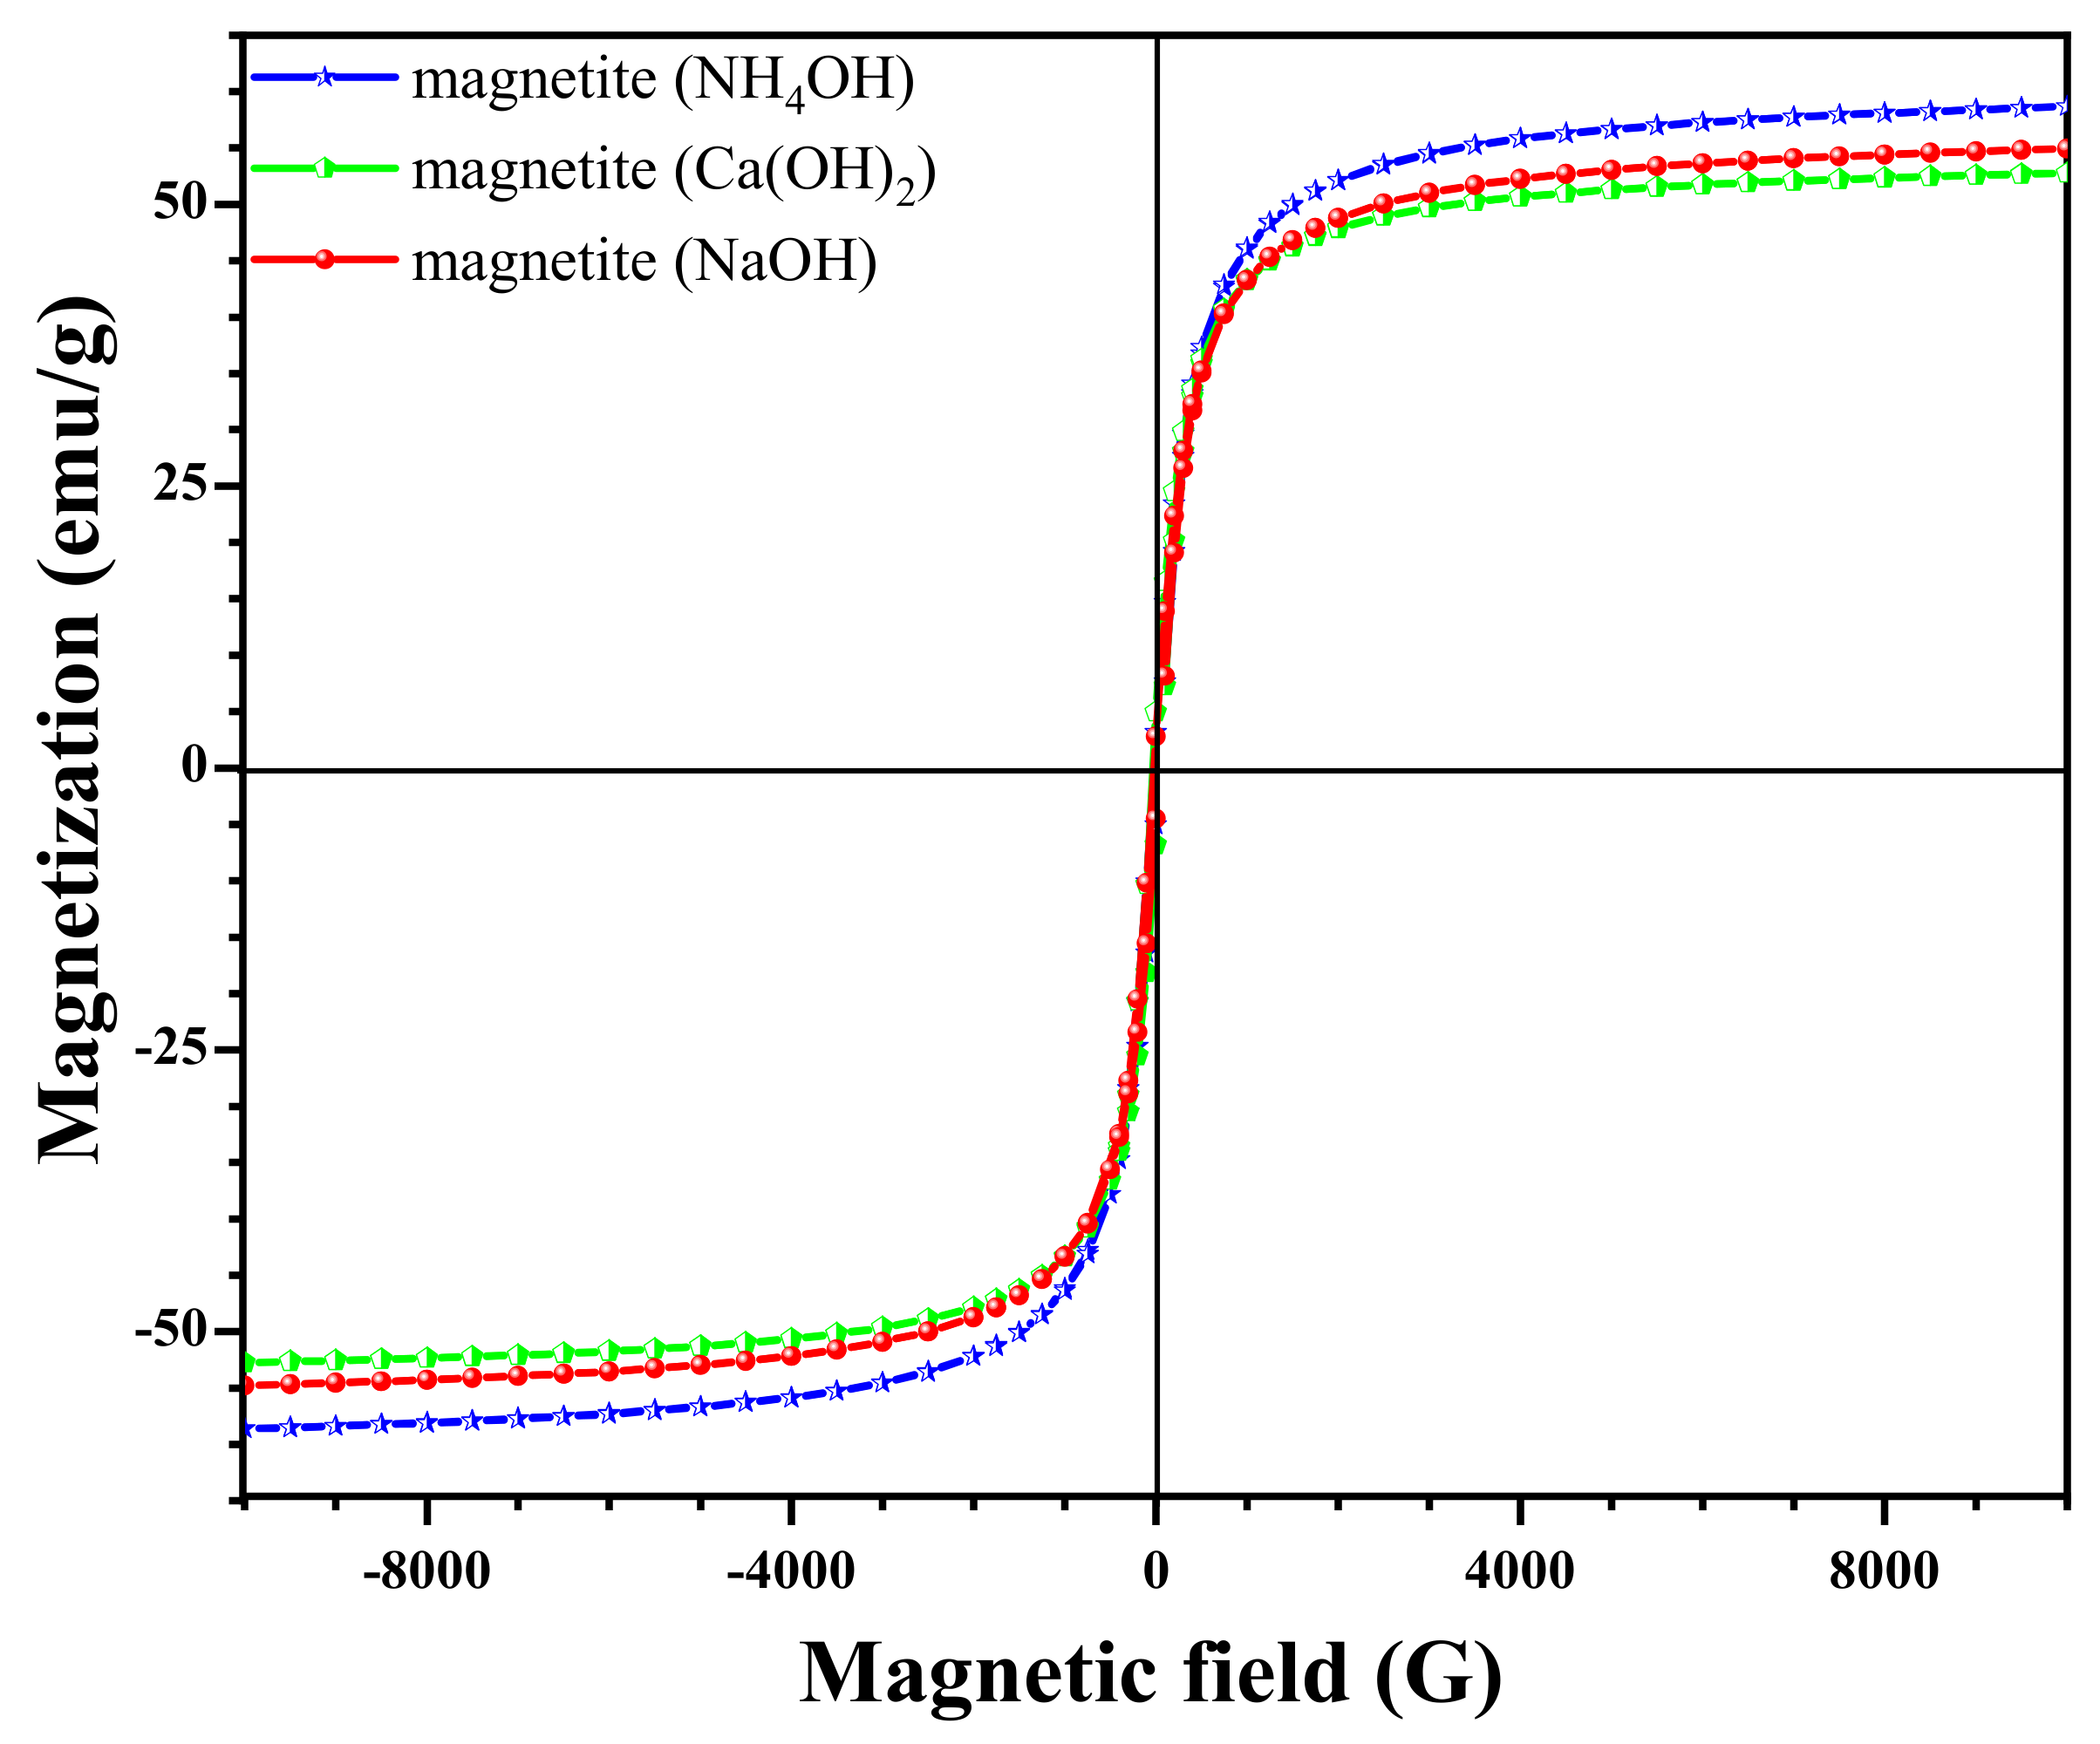
3.4. Effect of Different Sedimentation Rules on Magnetic Properties

The relationship of particle sizes to the prepared materials’ magnetic properties are shown in Figure 5. Referring to the NP size values investigated by XRD, TEM, and SEM, it is found that the lowest value is shown by magnetite (Ca(OH)2). The largest NP size was in the powder produced from the sediment magnetite (NH4OH), whereas magnetite (NaOH) had the average of the two values. Comparing these values with the M s values shown in Table 4, one finds that the width of the hysteresis ring depends on the magnetite NP size. Also, one notices that the width of the ring shrinks whenever there is a decrease in the crystallite size and an increase in the surface area. Thus, the borders between the rings decrease, which leads to a decrease in magnetic saturation, which agrees with the result from Ref. [19].

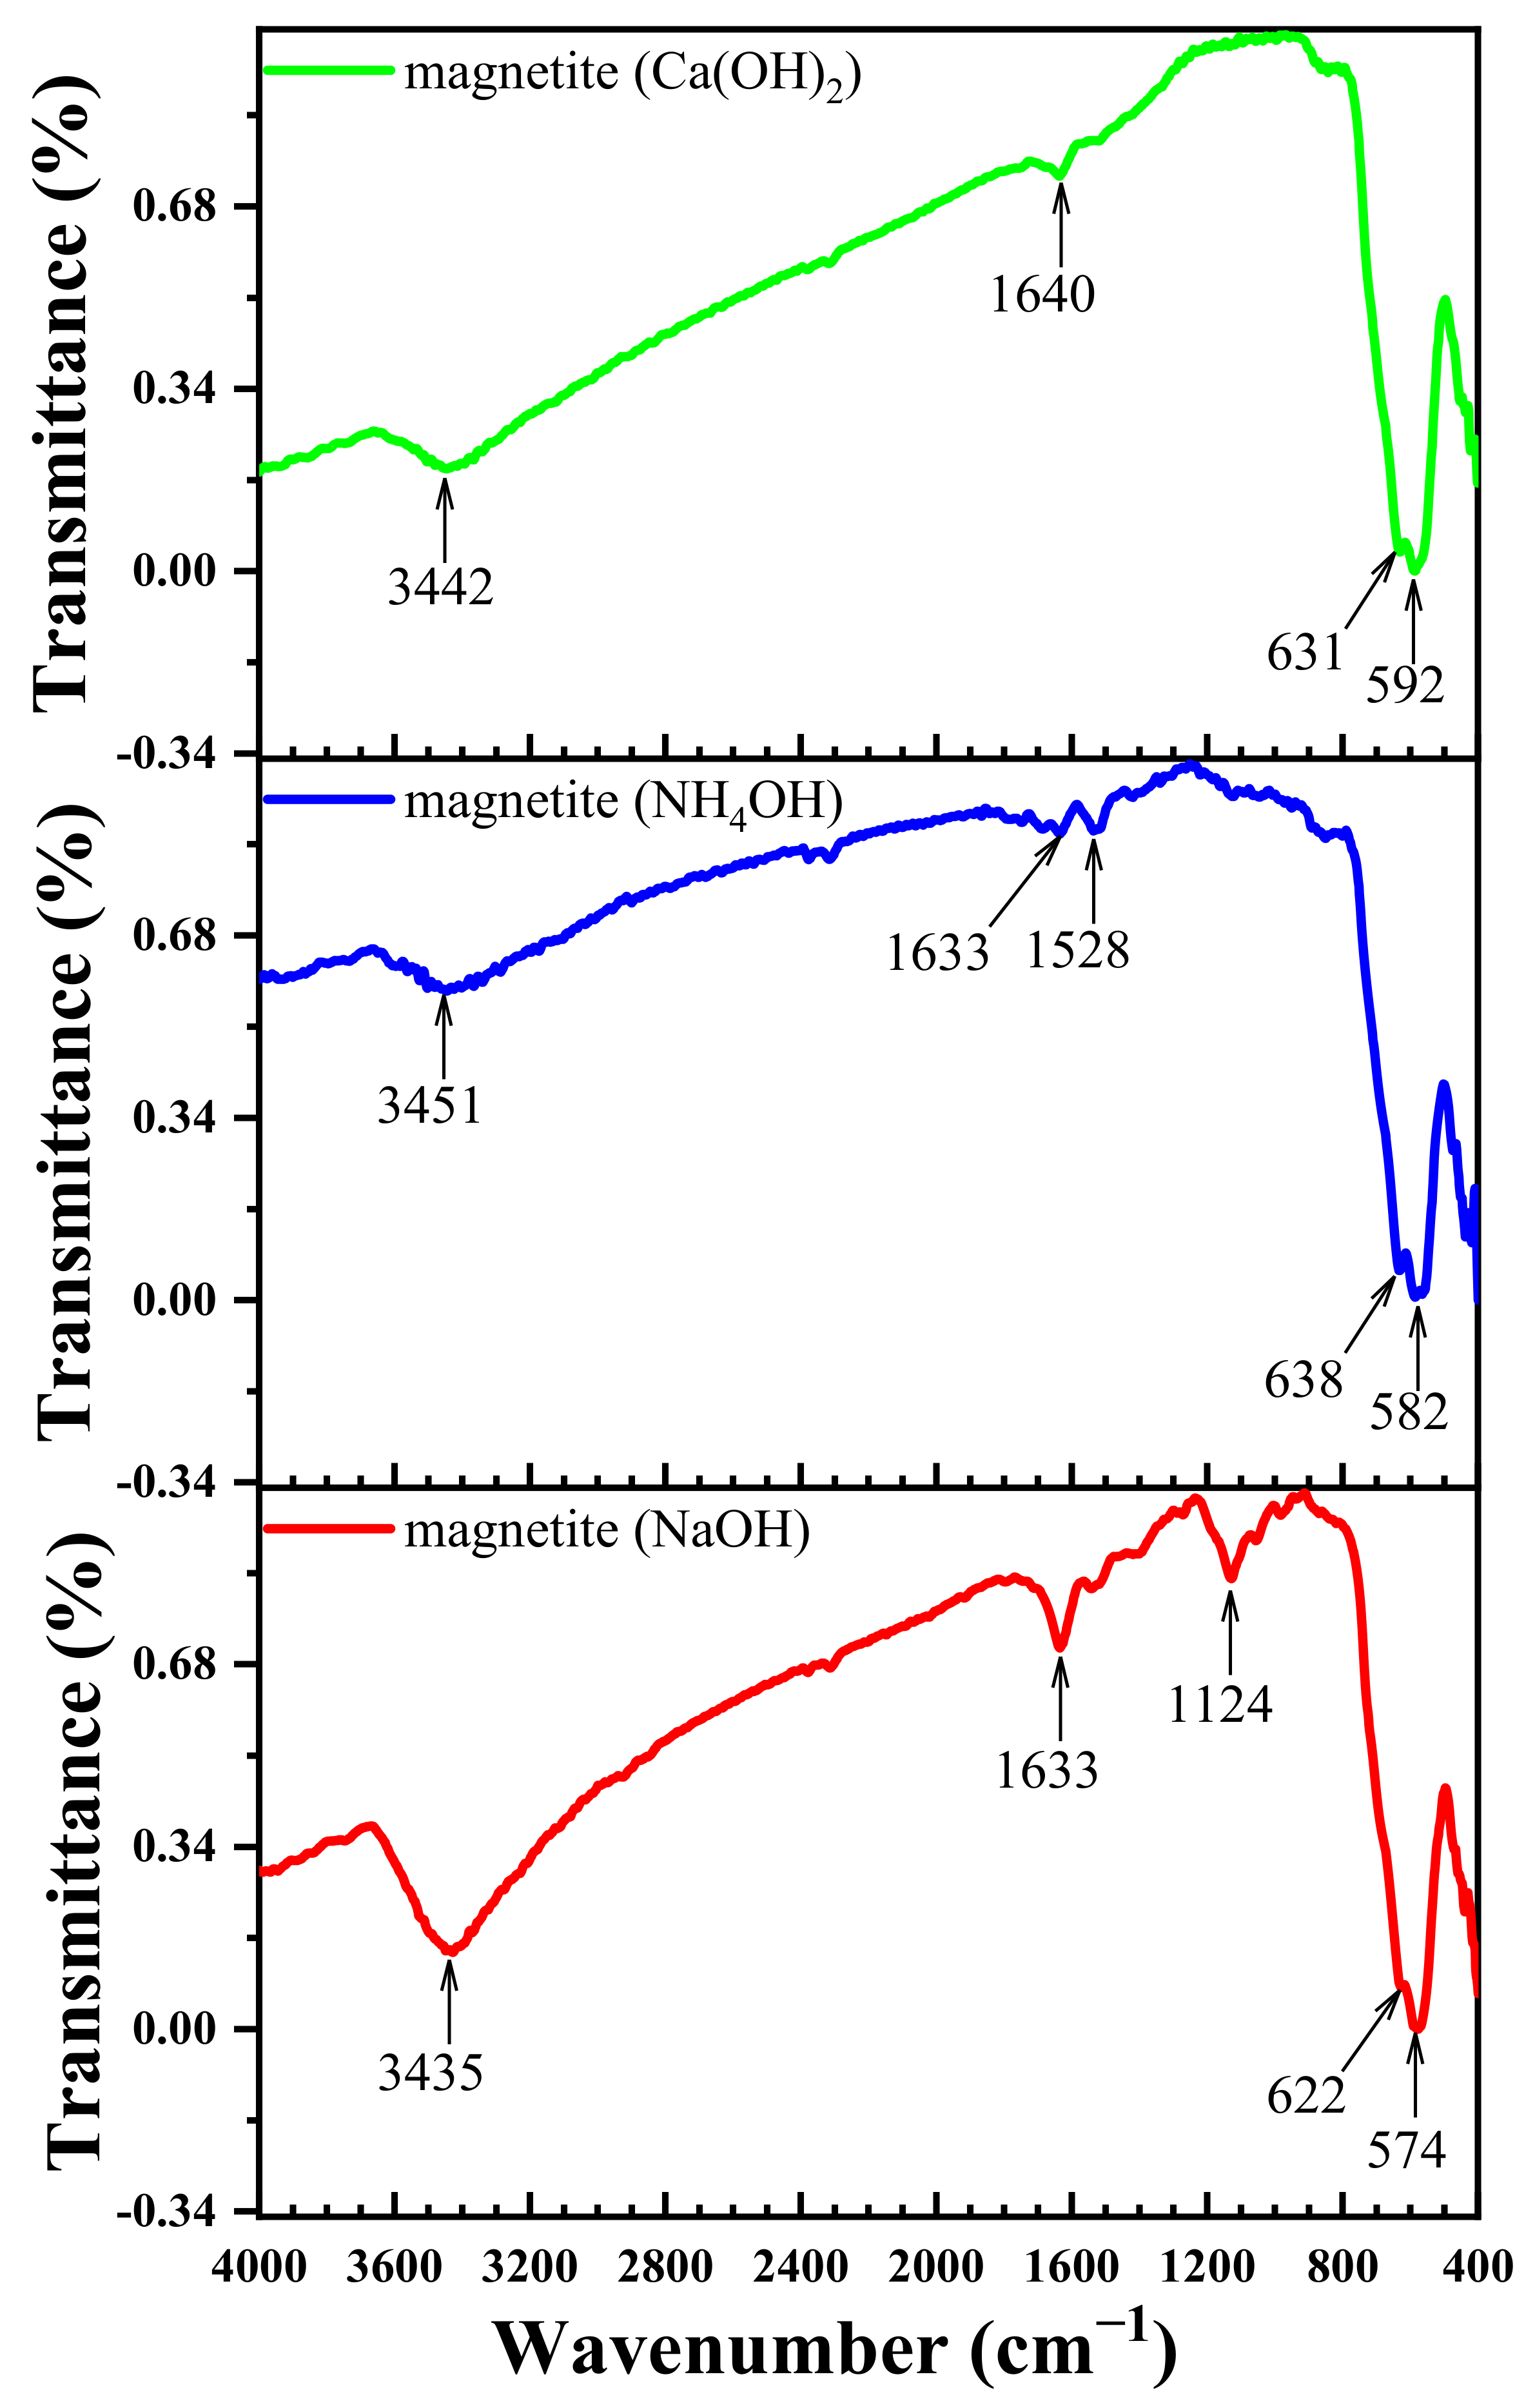
3.5. Effect of Different Deposition Rules on the FT-IR Spectra

Through the results of the IR spectra shown in Figure 6, one finds that whenever the crystallite size of magnetite NPs decreases, the appearance of the Fe-O bond is delayed. The appearance of stretch bands for the OH group and the vibrational curvature of the HOH group is due to the water absorbed by the model. Also, the appearance of these bands is delayed as the magnetite NP size increases. As for the length of the appearance of the Fe-O bonds and the OH and HOH bands, it increases with the decrease in the particle size of the prepared magnetite NPs. The locations of these bands agree with the findings from Refs. [52,53].

3.6. The Effect of the Size of Magnetite NPs on Optical Properties

From Figure 7, one finds that there is an increase in the absorbance of all magnetite NPs in the low-wavelength region. The values of the energy band gap and the size of the magnetite NPs are inversely correlated. The reduction of the band gap is directly related to the enlargement of the size. Disruption of electronic conduction bands occurs at higher energy levels, leading to the possibility of superposition when particles are small in size. In terms of distance at the Fermi level, the greater the distance from the center of the particle, the lower the electronic conduction nuclear potential. In addition, it should be noted that the unilateral spherical dispersion of the magnetite NPs causes the absorption peak of the magnetite NPs to occur in the 292–550 nm range what concurs with what is obtained in Ref. [43]. From Table 3 and Figure 8, one can see that the energy gap values increased as the magnetite NP size decreased. Consequently, magnetite (NH4OH), having the largest size of 8.5 nm, had the smallest energy gap (1.75 eV, 1.35 eV) for the two types of transitions, which is in agreement with the literature [44].

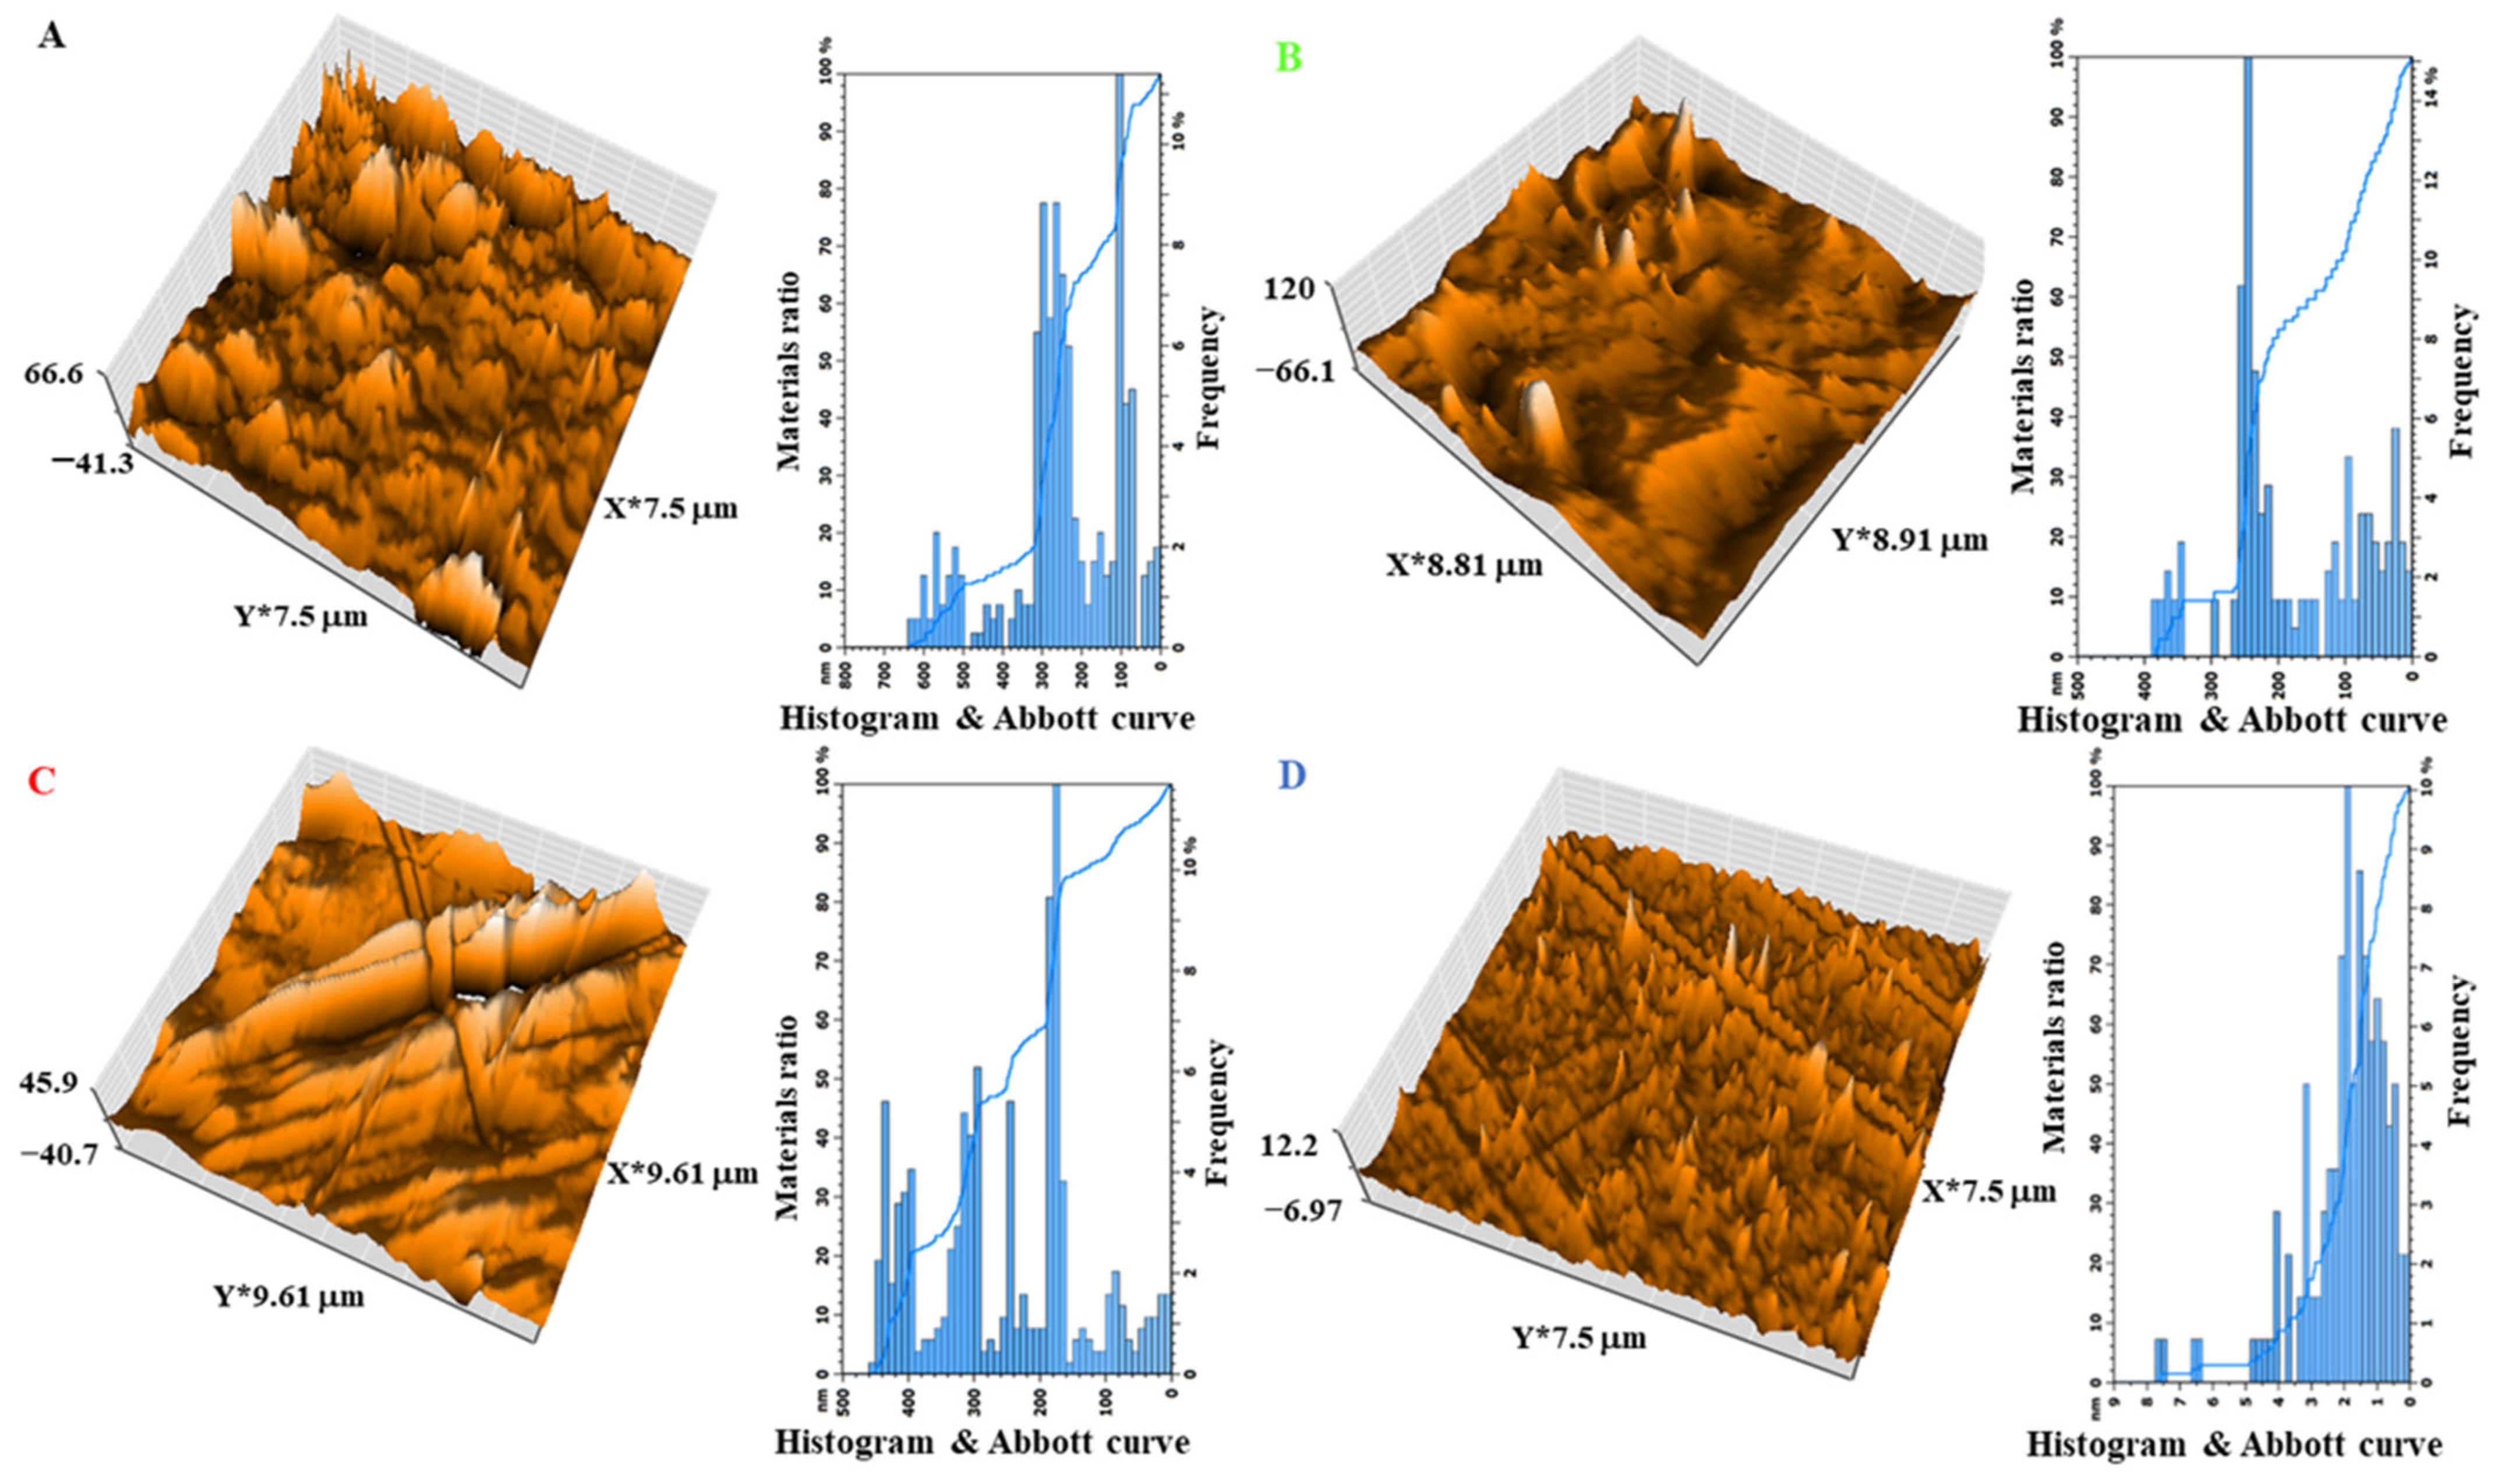
3.7. The Effect of the Size of Magnetite NPs on the XRD and AFM of the Shields

X-ray diffraction analysis of the overlays (A, B, C, D) (see Figure 9) compares the components of the overlay’s magnetite NPs and polymers, where the cubic phase of the magnetite NPs appears inside the overlays at the same angle at which the cubic phase of the magnetite appears for the magnetite NPs. However, one notices that the nanoparticle size of the nanocomposites gave the same arrangement for the magnetite NPs as shown in Table 3, but there are slightly larger magnetite NP sizes within the composites B, C, and D with values of 11   n m , 7.2   n m , and 5.2   n m , respectively. This is due to the agglomeration of the nanomaterials during the mixing process with the polymer. In addition, one notices that the decrease in the nanoparticle size improves the process of consolidation and penetration into the polymer matrix, so the phase intensity increases. The epoxy peak appears for all the overlays at approximately a 20° angle, which agrees with Ref. [15].
From the results of the AFM examination of the manufactured composites (see Figure 10 and Table 5), the surface roughness rate, RMS, surface thickness, and particle size values increase as the particle size decreases, as a result of the increase in agglomeration.

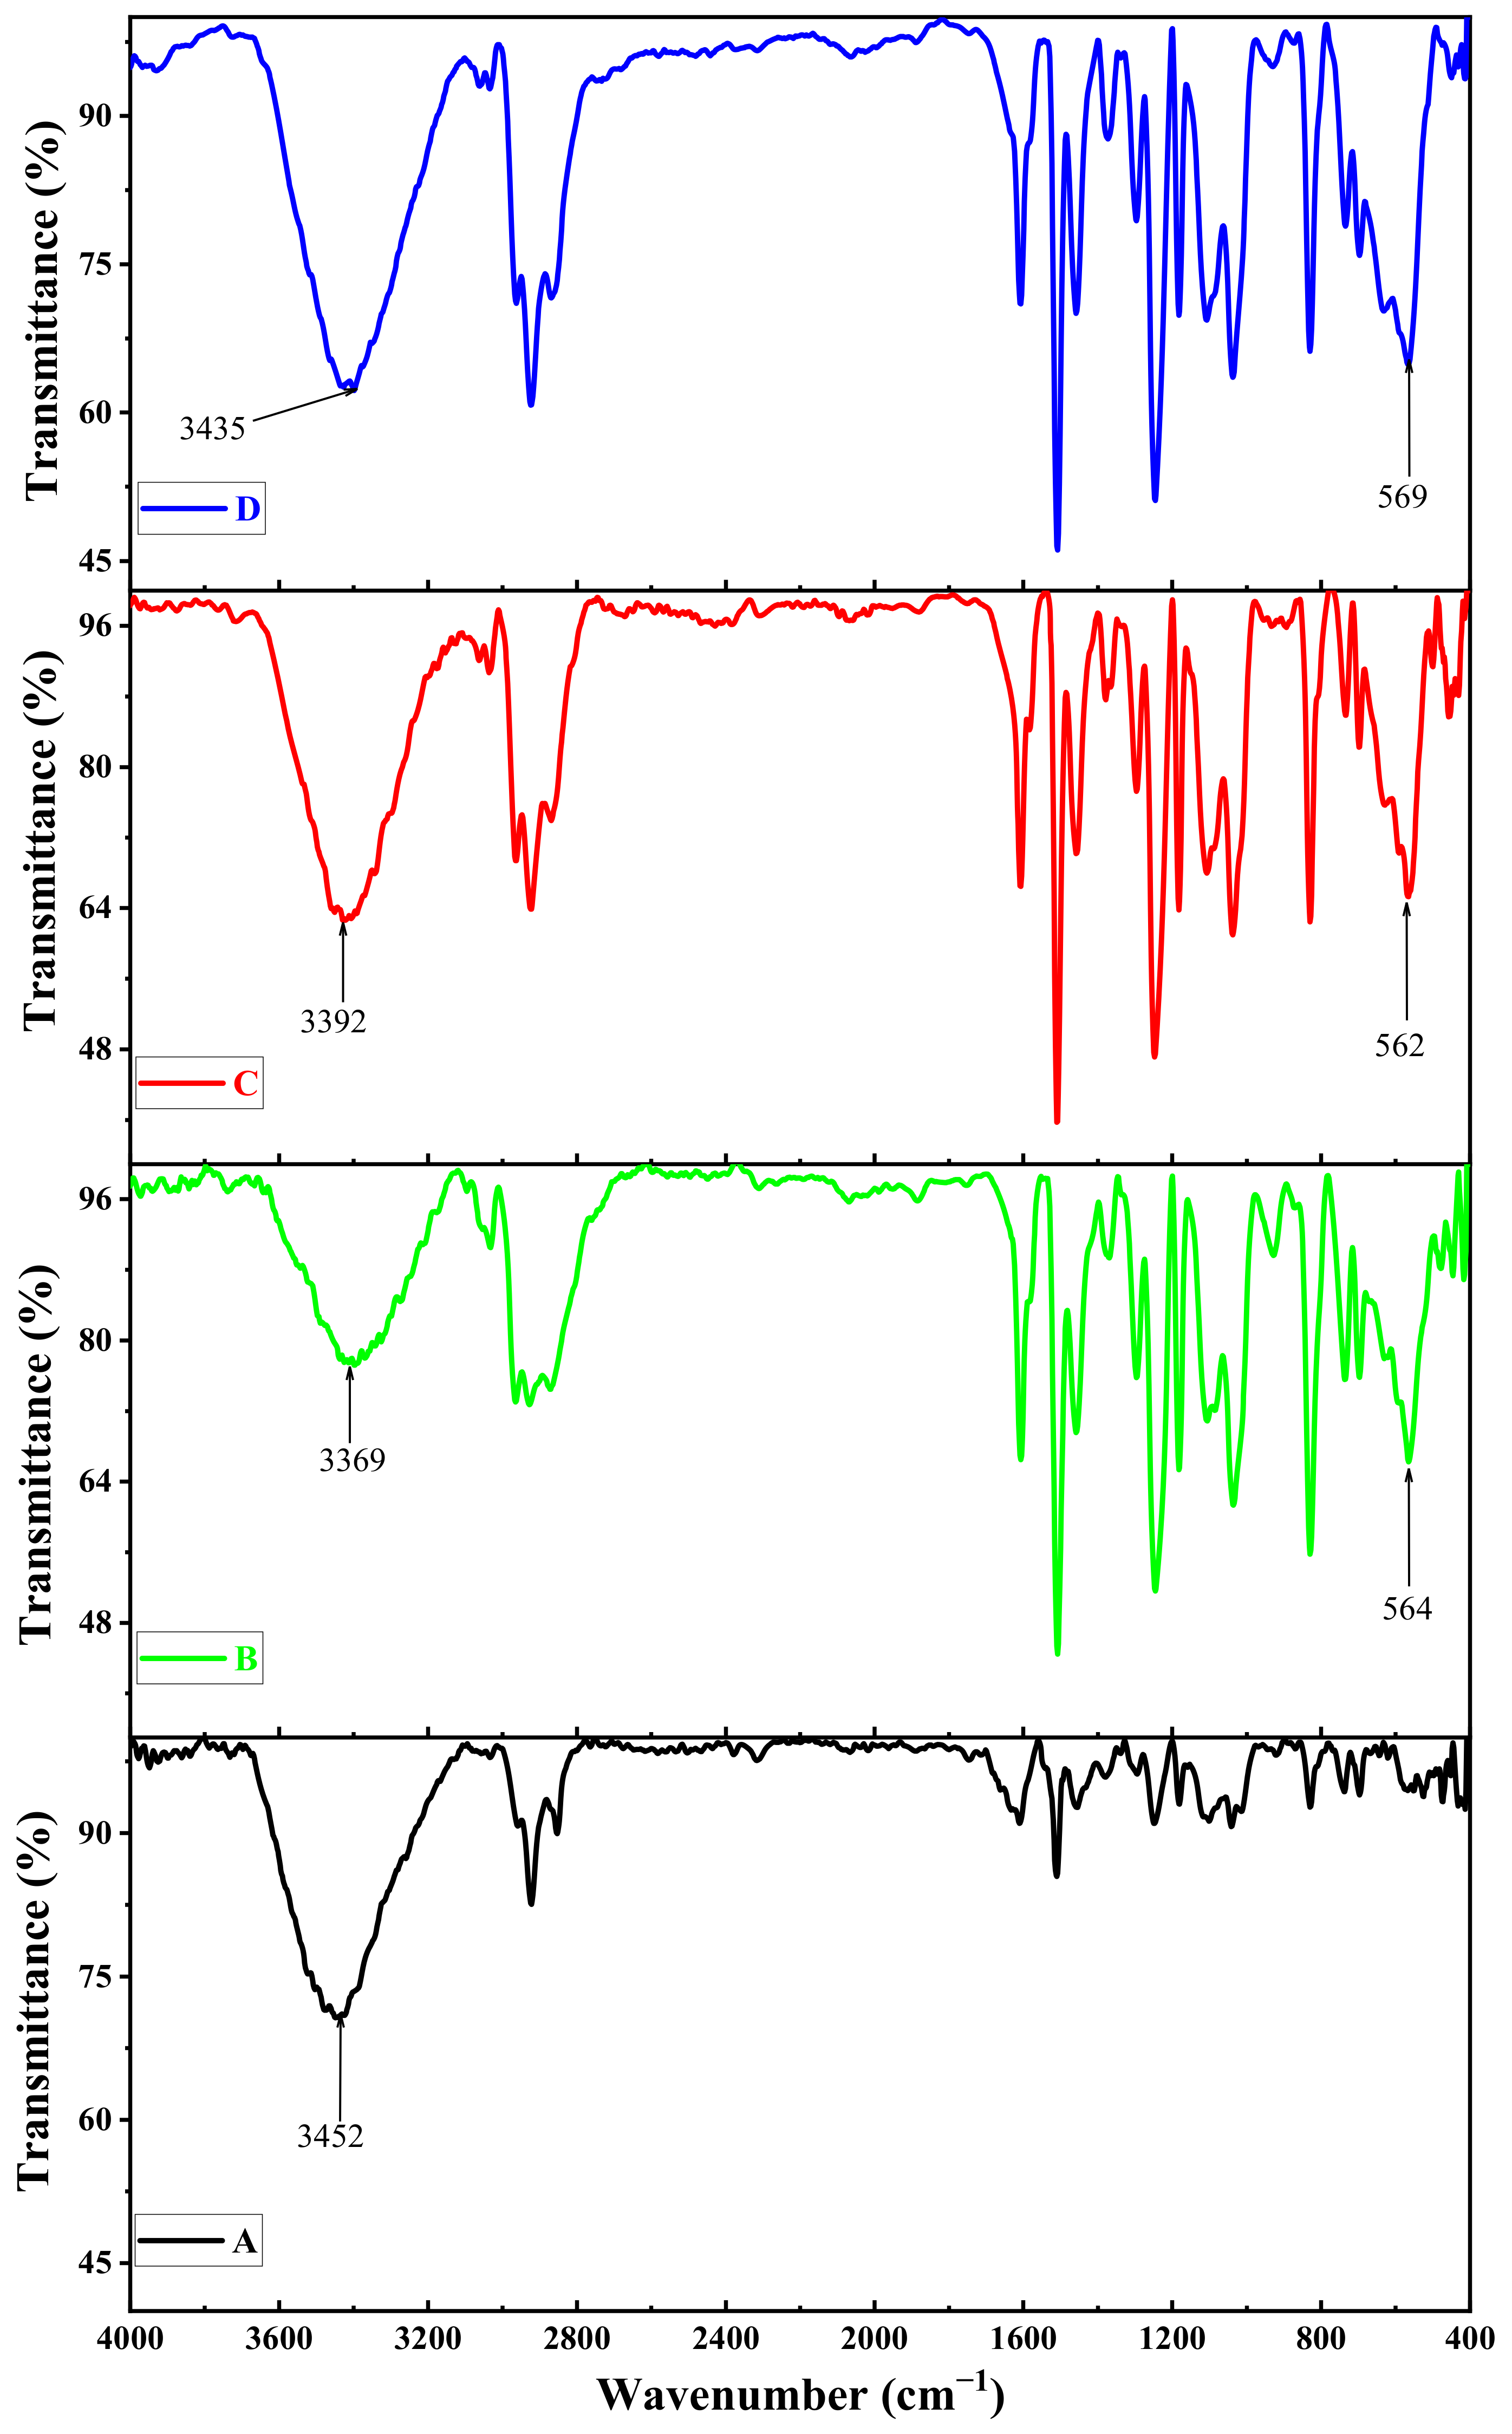
3.8. The Effect of the Size of Magnetite NPs on the FT-IR Spectra of the Shields

From Figure 11, there is an overlap between the support phase and the base phase and this increases as the particle size of the reinforcement magnetite NPs decreases, through the locations of the most important effective aggregates O-H and Fe-O shown in Figure 11. These aggregates are delayed in appearance with higher wavenumbers as the size of magnetite NPs increases. This is due to the decrease in the surface area, which requires the projection of the infrared photon with a higher energy for the appearance of the aggregates, in contrast to powders that have a relatively small magnetite NP size, which have quite a large surface area. Thus, a projection of a low-energy photon is required to reveal the effective aggregates.

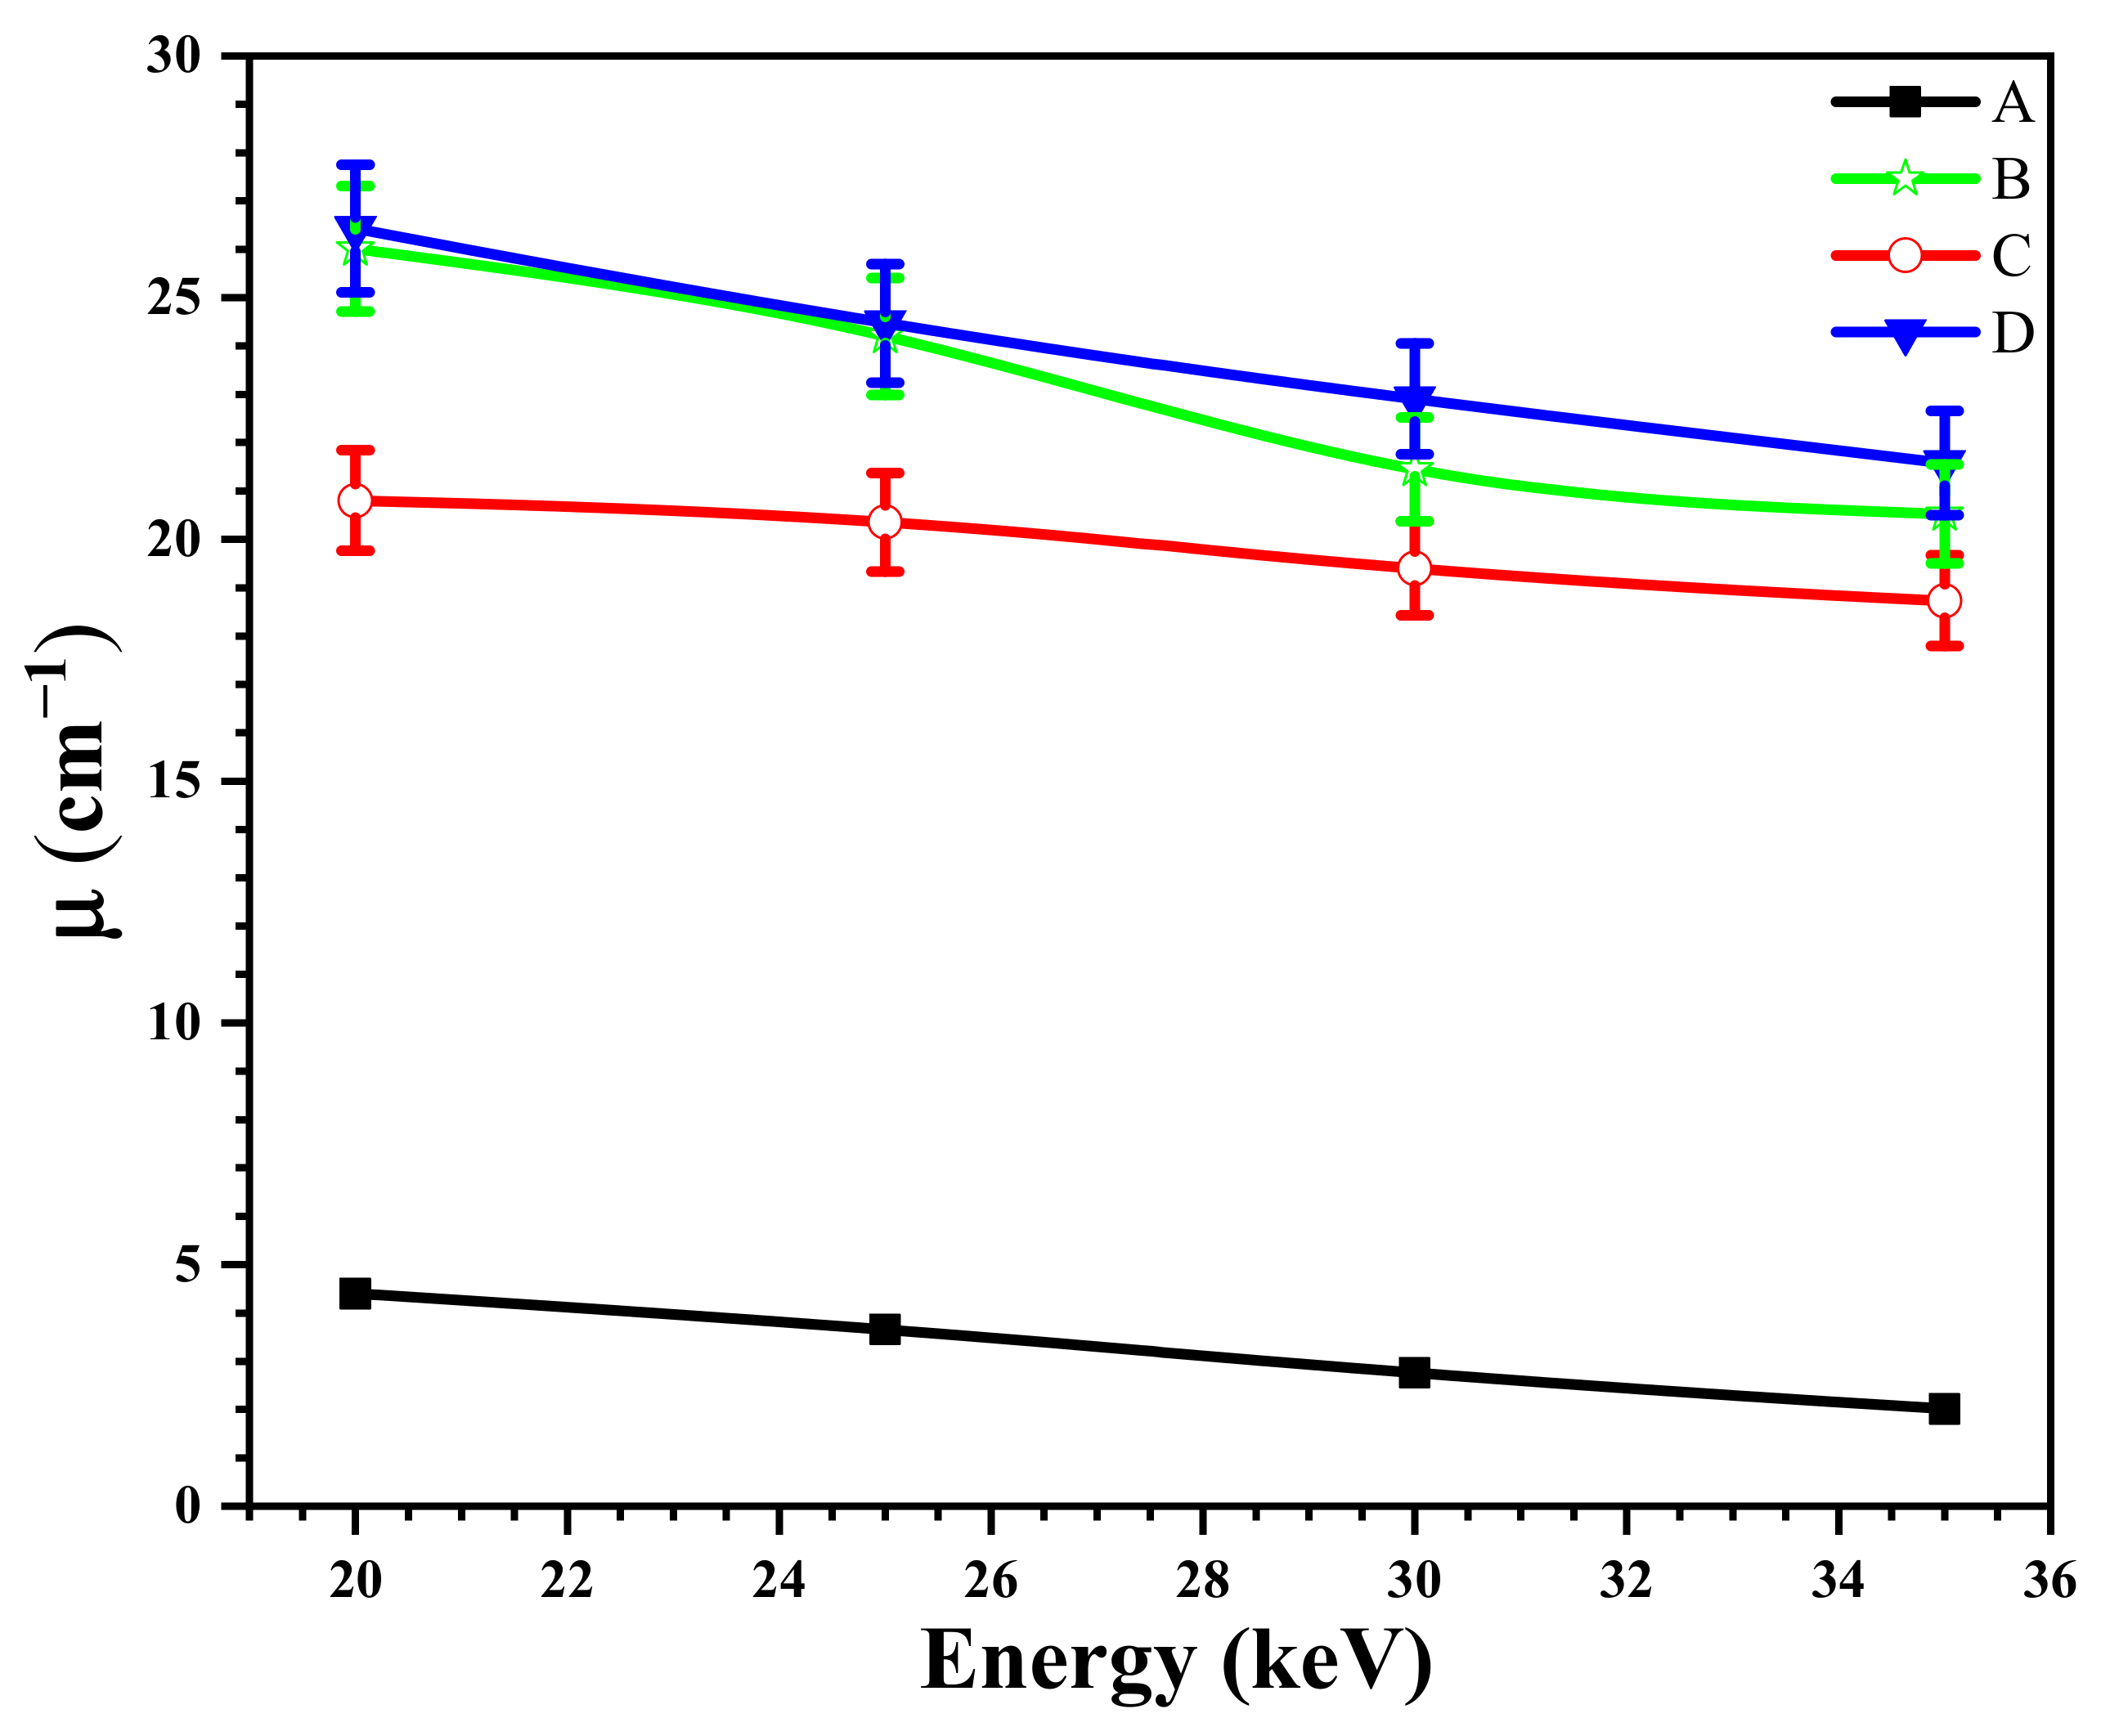
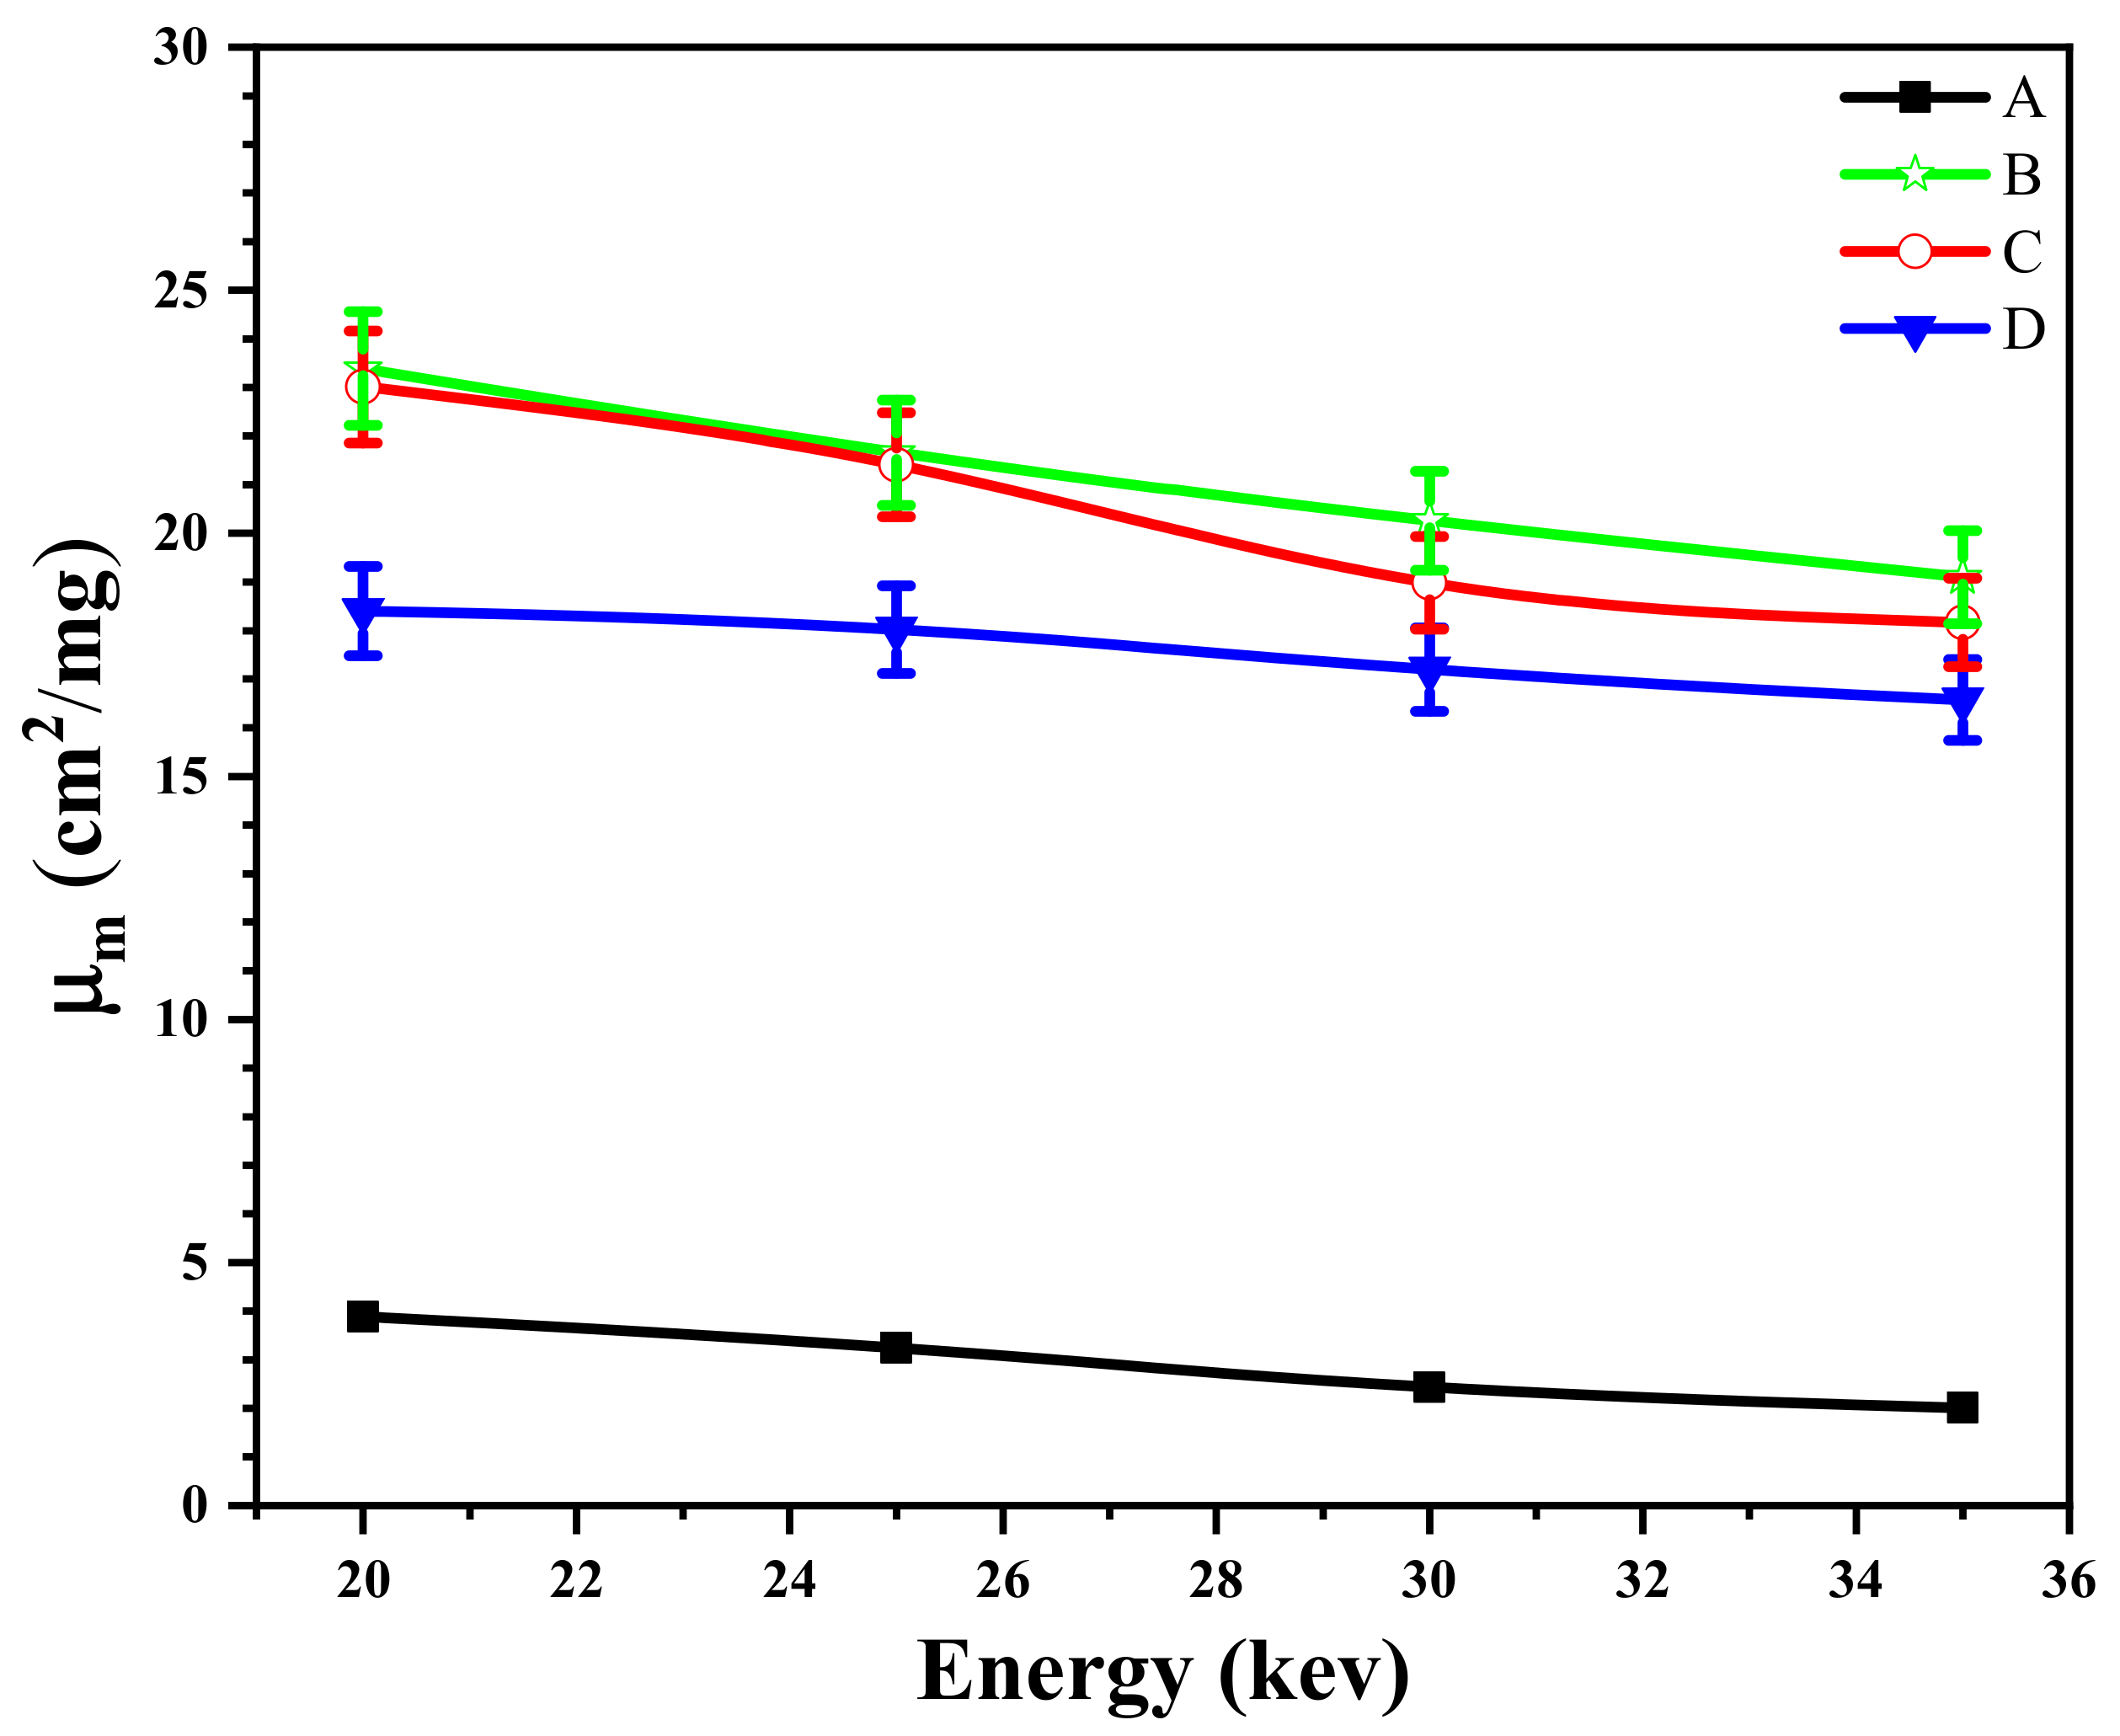
3.9. The Effect of the Size of Magnetite NPs on the X-ray Attenuation Properties of Shields

From Figure 12, Figure 13, Figure 14 and Figure 15, one notices that the significant effect of using magnetite NPs as a support phase for epoxy resin is caused by increasing the linear (12) and mass (13) attenuation coefficients and decreasing the values of the half thickness (14) and the free path rates (15), respectively, of the B, C, and D overlays compared to overlay A (pure epoxy). One finds that the possibility of protection from X-rays increases with a decrease in the size of magnetite NPs of the reinforcement phase. The values for the linear attenuation coefficient and the mass attenuation coefficient are 26.43   c m 1 and 23.39   c m 2 / m g , respectively. The lowest values for the half thickness and free path rate are 0.029   c m , and 0.042   c m 1 , respectively. This is due to the increase in the surface area and the scattering of magnetite NPs within the polymer matrix, thus increasing the possibility of radiation interaction with the material, absorbing the energy of the photon, and this agrees with findings in Refs. [54,55]. The effect of the operating voltage can be seen from the values of the attenuation properties in Figure 12, Figure 13, Figure 14 and Figure 15 and it is found that by increasing the voltage values, the ability of the nanocomposite to attenuate the rays decreases. This is consistent with the results from [46] for other materials.

4. Conclusions

From this study, we conclude that the use of the binary strong base Ca(OH)2 has a greater effect than the strong mono base NaOH in reducing the nanoscale particle size of magnetite. Meanwhile, the weak base NH4OH gives a large NP size. According to the results of the TEM, the NP size values were 8.5 nm, 11.11 nm, and 16.17 nm, respectively. The smaller the size of the magnetite NPs, the larger the specific surface area values. The values of the magnetic saturation of the prepared materials decrease with the decrease in the size of the magnetite NPs. The phase of the materials and their granular shapes were not affected by the change in the sedimentation base used in their preparation. The appearance sites of Fe-O and OH-HOH bands and the length of appearance are affected by the particle size of the magnetite NPs. As NP size decreases, absorbance values and direct and indirect allowable energy deviations increase.
For polymer-based nanocomposites, decreasing the size of magnetite NPs further improves their dispersion within the polymer matrix, which appears from the increase in the number of bonds of active OH groups for the composite that has the smallest NP size compared to the composite that has the largest NP size. The decrease in the size of magnetite NPs dispersed in the nanocomposite increases both the linear and mass attenuation coefficients and decreases the half-value layer and mean free path.

Author Contributions

Conceptualization, investigation, and writing—original draft, S.M.F.; writing—review, supervising, and editing, A.B.A. All authors have read and agreed to the published version of the manuscript.

Funding

This research received no external funding.

Data Availability Statement

The data can be obtained from the corresponding author upon reasonable request.

Conflicts of Interest

The authors declare no conflicts of interest.

References

  1. Pavlenko, V.I.; Cherkashina, N.I.; Yastrebinsky, R.N. Synthesis and radiation shielding properties of polyimide/Bi2O3 composites. Heliyon 2019, 5, e01703. [Google Scholar] [CrossRef]
  2. Aghaz, A.; Faghihi, R.; Mortazavi, S.M.J.; Haghparast, A.; Mehdizadeh, S.; Sina, S. Radiation attenuation properties of shields containing micro and Nano WO3 in diagnostic X-ray energy range. Int. J. Radiat. Res. 2016, 14, 127–131. [Google Scholar] [CrossRef]
  3. Afkham, Y.; Mesbahi, A.; Alemi, A.; Zolfagharpour, F.; Jabbari, N. Design and fabrication of a nano-based neutron shield for fast neutrons from medical linear accelerators in radiation therapy. Radiat. Oncol. 2020, 15, 1–13. [Google Scholar] [CrossRef] [PubMed]
  4. Jayakumar, S.; Saravanan, T.; Philip, J. Preparation, characterization and X-ray attenuation property of Gd2O3-based nanocomposites. Appl. Nanosci. 2017, 7, 919–931. [Google Scholar] [CrossRef]
  5. Wang, F.; Yu, X.; Ge, M.; Wu, S.; Guan, J.; Tang, J.; Wu, X.; Ritchie, R.O. Facile self-assembly synthesis of γ-Fe2O3/graphene oxide for enhanced photo-Fenton reaction. Eviron. Pollut. 2019, 248, 229–237. [Google Scholar] [CrossRef] [PubMed]
  6. Zhou, Y.; Yang, X.; Gong, G.; Zhu, F.; Wang, J.; Qi, Y.; Huang, K.; Wu, J.; Chen, R.; Liu, Y. Recent progress in γ-Fe2O3-based catalysts: An overview of the synthesis and applications in environmental remediation. Chem. Eng. J. 2023, 475, 146198. [Google Scholar] [CrossRef]
  7. Anik, M.I.; Khalid Hossain, M.; Hossain, I.; Mahfuz, A.M.U.B.; Tayebur Rahman, M.; Ahmed, I. Recent progress of magnetic nanoparticles in biomedical applications: A review. Nano Sel. 2021, 2, 1146–1186. [Google Scholar] [CrossRef]
  8. Kadhim, R.M.; Al-Abodi, E.E.; Al-Alawy, A.F. Citrate-coated magnetite nanoparticles as osmotic agent in a forward osmosis process. Desalin. Water Treat. 2018, 115, 45–52. [Google Scholar] [CrossRef]
  9. Noor Azman, N.Z.; Siddiqui, S.A.; Low, I.M. Characterisation of micro-sized and nano-sized tungsten oxide-epoxy composites for radiation shielding of diagnostic X-rays. Mater. Sci. Eng. C 2013, 33, 4952–4957. [Google Scholar] [CrossRef]
  10. Al-Saadi, S.N.; Al-Hussainy, R.M.; Al-Zubaydi, J.H.A. Rock Slope Stability Assessment for Rock Cliffs at Tar Al-Sayyed Area (Karbala Governorate Middle of Iraq). J. Kerbala Univ. 2014, 12, 35–52. Available online: https://www.iasj.net/iasj/article/87711 (accessed on 27 December 2023).
  11. Castellanos-Rubio, I.; Arriortua, O.; Iglesias-Rojas, D.; Barón, A.; Rodrigo, I.; Marcano, L.; Garitaonandia, J.S.; Orue, I.; Fdez-Gubieda, M.L.; Insausti, M. A Milestone in the chemical synthesis of Fe3O4 nanoparticles: Unreported bulklike properties lead to a remarkable magnetic hyperthermia. Chem. Mater. 2021, 33, 8693–8704. [Google Scholar] [CrossRef]
  12. Yusefi, M.; Shameli, K.; Yee, O.S.; Teow, S.Y.; Hedayatnasab, Z.; Jahangirian, H.; Webster, T.J.; Kuča, K. Green synthesis of Fe3O4 nanoparticles stabilized by a garcinia mangostana fruit peel extract for hyperthermia and anticancer activities. Int. J. Nanomed. 2021, 16, 2515–2532. [Google Scholar] [CrossRef]
  13. Daoush, W.M. Co-precipitation and magnetic properties of magnetite nanoparticles for potential biomedical applications. J. Nanomed. Res. 2017, 5, 00018. [Google Scholar] [CrossRef]
  14. Badawy, S.M.; Abd El-Latif, A.A. Synthesis and characterizations of magnetite nanocomposite films for radiation shielding. Polym. Compos. 2017, 38, 974–980. [Google Scholar] [CrossRef]
  15. Rashid, H.; Mansoor, M.A.; Haider, B.; Nasir, R.; Abd Hamid, S.B.; Abdulrahman, A. Synthesis and characterization of magnetite nano particles with high selectivity using in-situ precipitation method. Sep. Sci. Technol. 2020, 55, 1207–1215. [Google Scholar] [CrossRef]
  16. Jannah, N.R.; Onggo, D. Synthesis of Fe3O4 nanoparticles for colour removal of printing ink solution. J. Phys. Conf. Ser. 2019, 124, 012040. [Google Scholar] [CrossRef]
  17. Parvez, M.M.; Haque, M.E.; Akter, M.; Ferdous, H.A. Synthesis of bismuth ferrite nanoparticles by modified Pechini sol-gel method. Int. J. Sci. Eng. Investig. 2020, 9(101), 35–39. Available online: https://www.ijsei.com/archive-910120.htm (accessed on 27 December 2023).
  18. Sallam, O.I.; Madbouly, A.M.; Ezz-Eldin, F.M. Impact of Nd3+ additive on the radiation shielding competence of borosilicate glasses fabricated from agro-waste materials. J. Non-Cryst. Solids 2022, 590, 121691. [Google Scholar] [CrossRef]
  19. Mascolo, M.C.; Pei, Y.; Ring, T.A. Room temperature co-precipitation synthesis of magnetite nanoparticles in a large pH window with different bases. Materials 2013, 6, 5549–5567. [Google Scholar] [CrossRef] [PubMed]
  20. Alsayed, Z.; Badawi, M.S.; Awad, R.; Thabet, A.A.; El-Khatib, A.M. Study of some γ-ray attenuation parameters for new shielding materials composed of nano ZnO blended with high density polyethylene. Nucl. Technol. Radiat. Prot. 2019, 34, 342–352. [Google Scholar] [CrossRef]
  21. Alsayed, Z.; Awad, R.; Badawi, M.S. Thermo-mechanical properties of high density polyethylene with zinc oxide as a filler. Iran. Polym. J. 2020, 29, 309–320. [Google Scholar] [CrossRef]
  22. Alsayed, Z.; Badawi, M.S.; Awad, R. Characterization of zinc ferrite nanoparticles capped with different PVP concentrations. J. Electron. Mater. 2019, 48, 4925–4933. [Google Scholar] [CrossRef]
  23. El-Khatib, A.M.; Doma, A.S.; Badawi, M.S.; Abu-Rayan, A.E.; Aly, N.S.; Alzahrani, J.S.; Abbas, M.I. Conductive natural and waste rubbers composites-loaded with lead powder as environmental flexible gamma radiation shielding material. Mater. Res. Express 2020, 7, 105309. [Google Scholar] [CrossRef]
  24. More, C.; Pawar, P.P.; Badawi, M.S.; Thabet, A.A. Polymeric composite materials for radiation shielding: A review. Environ. Chem. Lett. 2020, 35, 138–149. [Google Scholar] [CrossRef] [PubMed]
  25. El-Khatib, A.M.; Yousef, N.S.; Ghatass, Z.F.; Badawi, M.S.; Mohamed, M.M.; Elkhatib, M. Synthesized silver carbon nanotubes and zinc oxide nanoparticles and their ability to remove methylene blue dye. J. Nano Res. 2019, 56, 1–16. [Google Scholar] [CrossRef]
  26. Osman, A.F.; El Balaa, H.; El Samad, O.; Awad, R.; Badawi, M.S. Assessment of X-ray shielding properties of polystyrene incorporated with different nano-sizes of PbO. Radiat. Environ. Biophys. 2023, 62, 235–251. [Google Scholar] [CrossRef] [PubMed]
  27. Obeid, A.; El Balaa, H.; El Samad, O.; Awad, R.; Badawi, M.S. Attenuation parameters of HDPE filled with different nano-size and bulk WO3 for X-ray shielding applications. Eur. Phys. J. Plus 2022, 137, 1229. [Google Scholar] [CrossRef]
  28. Osman, A.F.; El Balaa, H.; El Samad, O.; Alsayed, Z.; Awad, R.; Badawi, M.S. Effect of PbO incorporation with different particle size on X-ray attenuation of polystyrene. Nucl. Technol. Rad. Protect. 2022, 37, 18–30. [Google Scholar] [CrossRef]
  29. Obeid, A.; El Balaa, H.; El Samad, O.; Alsayed, Z.; Awad, R.; Badawi, M.S. Effects of different nano size and bulk WO3 enriched by HDPE composites on attenuation of the X-ray narrow spectrum. Nucl. Technol. Rad. Protect. 2021, 36, 315–328. Available online: https://www.ntrp.vinca.rs/2021_4/Contents2021_4.html (accessed on 27 December 2023).
  30. Chang, Q.; Guo, S.; Zhang, X. Sustainable natural biopolymers for biomedical applications. Mater. Des. 2023, 233, 112253. [Google Scholar] [CrossRef]
  31. National Council on Radiation Protection and Measurements. Structural Shielding Design and Evaluation for Megavoltage X- and Gamma-Ray Radiotherapy Facilities. NCRP Report No. 151; National Council on Radiation Protection and Measurements: Bethesda, MD, USA, 2005; Available online: https://www.severin.su/wp-content/uploads/2020/01/ncrp_151_structural_shielding.pdf (accessed on 27 December 2023).
  32. Stirling, D.A. The Nanotechnology Revolution: A Global Bibliographic Perspective; Jenny Stanford Publishing: New York, NY, USA, 2018. [Google Scholar] [CrossRef]
  33. Reda, S.M. Gamma ray shielding by a new combination of aluminum, iron, copper and lead using MCNP5. Arab. J. Nucl. Sci. Appl. 2016, 49(4), 211–217. [Google Scholar]
  34. Al-Alawy, A.F.; Al-Abodi, E.E.; Kadhim, R.M. Synthesis and characterization of magnetic iron oxide nanoparticles by co-precipitation method at different conditions. J. Eng. 2018, 24, 60–72. [Google Scholar] [CrossRef]
  35. Hariani, P.L.; Faizal, M.; Ridwan, R.; Marsi, M.; Setiabudidaya, D. Synthesis and properties of Fe3O4 nanoparticles by co-precipitation method to removal procion dye. Int. J. Environ. Sci. Dev. 2013, 4, 336–340. [Google Scholar] [CrossRef]
  36. Wang, L.; Zhao, Y.; Jiang, C.; Ji, V.; Chen, M.; Zhan, K.; Moreira, F. Investigation on microstructure and properties of electrodeposited Ni-Ti-CeO2 composite coating. J. Alloys Compd. 2018, 754, 93–104. [Google Scholar] [CrossRef]
  37. Ravidhas, C.; Josephine, A.J.; Sudhagar, P.; Devadoss, A.; Terashima, C.; Nakata, K.; Fujishima, A.; Raj, A.M.E.; Sanjeeviraja, C. Facile synthesis of nanostructured monoclinic bismuth vanadate by a co-precipitation method: Structural, optical and photocatalytic properties. Mater. Sci. Semicond. Process. 2015, 30, 343–351. [Google Scholar] [CrossRef]
  38. Roacho-Pérez, J.A.; Ruiz-Hernandez, F.G.; Chapa-Gonzalez, C.; Martínez-Rodríguez, H.G.; Flores-Urquizo, I.A.; Pedroza-Montoya, F.E.; Garza-Treviño, E.N.; Bautista-Villarea, M.; García-Casillas, P.E.; Sánchez-Domínguez, C.N. Magnetite nanoparticles coated with PEG 3350-Tween 80: In vitro characterization using primary cell cultures. Polymers 2020, 12, 300. [Google Scholar] [CrossRef]
  39. Dulińska-Litewka, J.; Łazarczyk, A.; Hałubiec, P.; Szafrański, O.; Karnas, K.; Karewicz, A. Superparamagnetic iron oxide nanoparticles—Current and prospective medical applications. Materials 2019, 12, 617. [Google Scholar] [CrossRef] [PubMed]
  40. Kiessling, T.; Harvey, M. Global marketing networks and the development of trust: A dynamic capabilities perspective. J. Market. Chann. 2004, 11, 21–41. [Google Scholar] [CrossRef]
  41. Larumbe, S.; Gómez-Polo, C.; Pérez-Landazábal, J.I.; García-Prieto, A.; Alonso, J.; Fdez-Gubieda, M.L.; Cordero, D.; Gómez, J. Ni doped Fe3O4 magnetic nanoparticles. J. Nanosci. Nanotechnol. 2012, 12, 2652–2660. [Google Scholar] [CrossRef]
  42. Zukova, A.; Teiserskis, A.; Rohava, Y.; Baranov, A.V.; van Dijken, S.; Gun’ko, Y.K. Deposition of magnetite nanofilms by pulsed injection MOCVD in a magnetic field. Nanomaterials 2018, 8, 1064. [Google Scholar] [CrossRef]
  43. Vanga, P.R.; Mangalaraja, R.V.; Ashok, M. Effect of co-doping on the optical, magnetic and photocatalytic properties of the Gd modified BiFeO3. J. Mater. Sci. Mater. Electron. 2016, 27, 5699–5706. [Google Scholar] [CrossRef]
  44. Bahadur, A.; Saeed, A.; Shoaib, M.; Iqbal, S.; Bashir, M.I.; Waqas, M.; Hussain, M.N.; Abbas, N. Eco-friendly synthesis of magnetite (Fe3O4) nanoparticles with tunable size: Dielectric, magnetic, thermal and optical studies. Mater. Chem. Phys. 2017, 198, 229–235. [Google Scholar] [CrossRef]
  45. Radoń, A.; Drygała, A.; Hawełek, Ł.; Łukowiec, D. Structure and optical properties of Fe3O4 nanoparticles synthesized by co-precipitation method with different organic modifiers. Mater. Charact. 2017, 131, 148–156. [Google Scholar] [CrossRef]
  46. Mansouri, E.; Mesbahi, A.; Malekzadeh, R.; Mansouri, A. Shielding characteristics of nanocomposites for protection against X- and gamma rays in medical applications: Effect of particle size, photon energy and nano-particle concentration. Radiat. Environ. Biophys. 2020, 59, 583–600. [Google Scholar] [CrossRef] [PubMed]
  47. Slimani, S.; Meneghini, C.; Abdolrahimi, M.; Talone, A.; Murillo, J.P.M.; Barucca, G.; Yaacoub, N.; Imperatori, P.; Illés, E.; Smari, M.; et al. Spinel iron oxide by the co-precipitation method: Effect of the reaction atmosphere. Appl. Sci. 2021, 11, 5433. [Google Scholar] [CrossRef]
  48. Yazid, N.A.; Joon, Y.C. Co-precipitation synthesis of magnetic nanoparticles for efficient removal of heavy metal from synthetic wastewater. AIP Conf. Proc. 2019, 2124, 020019. [Google Scholar]
  49. Cotton, F.A.; Wilkinson, G.; Murillo, C.A. Advanced Inorganic Chemistry; John Wiley & Sons, Inc.: New York, NY, USA, 1999; Available online: https://www.scribd.com/document/684184510/Cotton-F-Wilkinson-G-Murillo-C-Bochmann-M-Advanced-Inorganic-Chemistry-John-Wiley-Sons-1999 (accessed on 27 December 2023).
  50. Peternele, W.S.; Fuentes, V.M.; Fascineli, M.L.; Da Silva, J.R.; Silva, R.C.; Lucci, C.M.; De Azevedo, R.B. Experimental investigation of the coprecipitation method: An approach to obtain magnetite and maghemite nanoparticles with improved properties. J. Nanomater. 2014, 2014, 682985. [Google Scholar] [CrossRef]
  51. Mahdavi, M.; Ahmad, M.B.; Haron, M.J.; Namvar, F.; Nadi, B.; Rahman, M.Z.A.; Amin, J. Synthesis, surface modification and characterisation of biocompatible magnetic iron oxide nanoparticles for biomedical applications. Molecules 2013, 18, 7533–7548. [Google Scholar] [CrossRef] [PubMed]
  52. Kushwaha, P.; Chauhan, P. Influence of annealing temperature on microstructural and magnetic properties of Fe2O3 nanoparticles synthesized via sol-gel method. Inorg. Nano-Met. Chem. 2022, 52, 937–950. [Google Scholar] [CrossRef]
  53. Namikuchi, E.A.; Gaspar, R.D.L.; Da Silva, D.S.; Raimundo, I.M.; Mazali, I.O. PEG size effect and its interaction with Fe3O4 nanoparticles synthesized by solvothermal method: Morphology and effect of pH on the stability. Nano Express 2021, 2, 020022. [Google Scholar] [CrossRef]
  54. Abdallah, R.M.; Al-Haddad, R.M.S. Optical and morphology properties of the magnetite (Fe3O4) nanoparticles prepared by Green method. J. Phys. Conf. Ser. 2021, 1829, 012022. [Google Scholar] [CrossRef]
  55. Botelho, M.Z.; Künzel, R.; Okuno, E.; Levenhagen, R.S.; Basegio, T.; Bergmann, C.P. X-ray transmission through nanostructured and microstructured CuO materials. Appl. Radiat. Isot. 2011, 69, 527–530. [Google Scholar] [CrossRef] [PubMed]
Figure 1. Transmitted intensity of the X-ray diffraction (XRD) patterns as a function of Bragg’s diffraction angle of magnetite NPs with different sedimentation rules. The values in the parentheses represent (hkl) planes.
Physics 06 00022 g001
Figure 2. The transmission electron microscopy (TEM) images (left) with the measured nanoparticle size indicated and the nanoparticle size distribution histograms (right) of magnetite NPs with different sedimentation rules.
Physics 06 00022 g002
Figure 3. The scanning electron microscopy (SEM) images, with the nanoparticle size indicated, at 200 nm (left) and 10 μm (right) resolutions of magnetite NPs with different sedimentation rules.
Physics 06 00022 g003
Figure 4. The energy-dispersive X-ray (EDX) analysis spectra of magnetite NPs prepared using (a) Ca(OH)2, (b) NaOH, and (c) NH4OH.
Physics 06 00022 g004
Figure 5. The magnetic hysteresis ring of magnetite NPs with different sedimentation rules.
Physics 06 00022 g005
Figure 6. The Fourier-transformed infrared (FT-IR) spectra of magnetite NPs with different sedimentation rules.
Physics 06 00022 g006
Figure 7. Ultra-violet UV–visible absorption spectra of magnetite NPs with different sedimentation rules.
Physics 06 00022 g007
Figure 8. The allowed direct and indirect transitions (see Equation (11)) of magnetite NPs with different sedimentation rules. Here, Egd and Egind denotes the direct and indirect energy gap (Eg), respectively.
Physics 06 00022 g008
Figure 9. The XRD patterns of the intensity dependence on the Bragg’s angle of epoxy and nanocomposites. The values in the parentheses represent (hkl) planes.
Physics 06 00022 g009
Figure 10. Atomic force microscope images of epoxy and nanocomposites.
Physics 06 00022 g010
Figure 11. The FT-IR spectra of epoxy and nanocomposites.
Physics 06 00022 g011
Figure 12. The dependence of the linear attenuation coefficient (12) on the energy of epoxy and nanocomposites at a range of operating voltages.
Physics 06 00022 g012
Figure 13. The dependence of the mass attenuation coefficient (13) on the energy of epoxy and nanocomposites at a range of operating voltages.
Physics 06 00022 g013
Figure 14. The dependence of the half-value layer (14) on the energy of epoxy and nanocomposites at a range of operating voltages.
Physics 06 00022 g014
Figure 15. The dependence of the mean free path (15) on the energy of epoxy and nanocomposites at a range of operating voltages.
Physics 06 00022 g015
Table 1. The chemicals formula, and percentage of the materials used.
MaterialChemical FormulaPercentage (%)
Iron (II) sulfate heptahydrateFeSO4·7H2O98
Ferric chlorideFeCl397
Hydrochloric acidHCl37
Sodium hydroxideNaOH99
Ammonium hydroxideNH4OH25
Calcium hydroxideCa(OH)299
Table 2. Volumetric fraction of chemical components. See text for details.
NanocompositesMatrix Material (%)Reinforcement Materials (%)
EpoxyMagnetite (Ca(OH)2)Magnetite (NaOH)Magnetite (NH4OH)
A100000
B752500
C750250
D750025
Table 3. X-ray diffraction (XRD), transmission electron spectroscopy (TEM), scanning electron microscopy (SEM) assay parameters of magnetite nanoparticles (NPs) and nanocomposites in different models. See text for details.
SampleS (m2/mg)DXRD (nm)DTEM (nm)DSEM (nm)Standard
Deviation (nm)
a (Å)
Magnetite (Ca(OH)2)2414.828.5022.788.988.35
Magnetite (NaOH)2005.7111.1128.1911.248.35
Magnetite (NH4OH)1308.216.1733.5112.508.35
B2225.23---8.35
C1587.36---8.35
D10511.03---8.35
Table 4. Specific size, surface area, and magnetic saturation values of the prepared magnetite NPs calculated using the Brunauer–Emmett–Teller (BET), Langmuir (Lan), Barrett-Joyner-Halenda (BJH), and t-plot (T) methods.
Fe3O4 ModelsS (m2/mg)V (cm2/mg)Ms
TBJHLanBETTBJHLanBET
Magnetite (Ca(OH)2)40.348.953.940.800.25512.39.352.7
Magnetite (NaOH)36.060.760.845.700.20813.610.354.9
Magnetite (NH4OH)55.565.9975.257.200.28317.213.158.6
Table 5. Results of an atomic force microscopy (AFM) examination.
NanocompositesAverage Grain Size
(nm)
Roughness Average
(nm)
Root Mean Square
(nm)
Surface Thickness
(nm)
A100672.893.8166.6
B2501093104.2120
C180757.310145.9
D2102.410.2412.2
Disclaimer/Publisher’s Note: The statements, opinions and data contained in all publications are solely those of the individual author(s) and contributor(s) and not of MDPI and/or the editor(s). MDPI and/or the editor(s) disclaim responsibility for any injury to people or property resulting from any ideas, methods, instructions or products referred to in the content.

