Article

Relations between Shot Noise, Gain Bandwidth, and Saturation of Instabilities

1
Brookhaven National Laboratory, Upton, NY 11973, USA
2
Department of Physics and Astronomy, Stony Brook University, Stony Brook, NY 11794, USA
*
Author to whom correspondence should be addressed.
Physics 2024, 6(3), 921-944; https://doi.org/10.3390/physics6030057
Submission received: 27 September 2023 / Revised: 22 February 2024 / Accepted: 7 March 2024 / Published: 25 June 2024
(This article belongs to the Section Statistical Physics and Nonlinear Phenomena)

Abstract

:
There are numerous instabilities present in charged particle beams that undergo exponential growth and reach saturation. In various applications, such as free-electron lasers or micro-bunching light sources, achieving saturation is desirable. Conversely, there are applications where these instabilities are utilized as linear broad-band amplifiers for signals embedded in the charged beam. In the latter scenario, the saturation of an instability induces non-linear distortions in the imprinted signal, thereby limiting the useful range of such amplifiers. Accurate evaluation of these instabilities necessitates a complete and comprehensive modeling approach that includes shot noise within the beam. Unfortunately, such modeling is not always feasible or practical. In this paper, we introduce a methodology utilizing the frequency and bandwidth of the instability as key parameters. Through this, we derive an estimation for the range of linear instability growth. Our derivation is conducted in a model-independent manner, making it applicable to a broad spectrum of instabilities. To validate our approach, we employ established and thoroughly benchmarked simulations with a free electron laser (FEL) code as well as self-consistent 3-dimensional simulation of plasma-cascade instability using code SPACE.

1. Introduction

There are a wide range of instabilities in charged particle beams driven by interactions with the environment, the beam’s space charge, or electromagnetic radiation. This list includes, but is not limited to, broad-band microwave [1], micro-bunching [2,3], free electron laser (FEL) [4,5,6,7,8,9], and coherent synchrotron radiation [10,11,12,13,14] instabilities. Currently, there is increasing interest in using some of these instabilities as linear amplifiers for cooling high-energy hadron beams [15,16,17,18,19,20]. These systems are described by many parameters other than a basic set of beam parameters. When available, the evaluation of their performance requires complicated and time-consuming studies.
Meanwhile, for a number of theoretical and practical estimations of system capabilities, it is sufficient to know the central frequency, bandwidth, and achievable gain before the saturation of an instability. The central frequency and the bandwidth of the instability can be frequently estimated from the beam parameters. For example, the low and upper bands of the instability can be determined from basic beam and system parameters. For a broad-band space charge-driven longitudinal instability [21], the low band (fmin) is typically determined by the transverse beam size, σ , scaled by the beam’s relativistic factor ( β · γ , β = 1 γ 2 ):
f min σ β · γ · c ,
where γ is the Lorentz factor and c is the speed of light. Similarly, energy ( σ γ ) and angular ( σ θ ) spreads in the beam define the upper band of the instability,
f max min c · γ 2 π · R 56 · σ γ , c π · L · σ θ θ 2 ,
where L is the length and R56 is the longitudinal dispersion parameter of the system. The situation is even simpler with narrow bandwidth instabilities such as FEL. The FEL central frequency (f0) and the wavelength (λ0) are determined by the resonant FEL condition:
f 0 = c λ 0 ; λ 0 = λ w · 1 + a w 2 γ 2 · 1 + β · β λ w · 1 + a w 2 2 γ 2 for γ 1 ,
where λw and a w = e B 0 λ w 2 2 π m e c are the FEL wiggler’s period and dimensionless wiggler parameter, correspondingly, with B0 denoting the peak magnetic field in the wiggler, me the electron mass and e the electron charge. Similarly, the relative bandwidth of FEL instability is determined by a dimensionless parameter ρ (see, e.g., [22]):
σ f f 0 ρ .
At the same time, similar simple estimations for the maximum pre-saturation gain are not available for a generic instability. This is one of the reasons for our attempt to find an estimation for attainable linear gain using a minimum set of parameters, relying on rather generic assumptions about the onset of saturation.
It is known that any e-beam instabilities (further on, we use an electron beam as an example of any charged beam) can be described by a set of self-consistent Maxwell and Vlasov equations [23] (see English translation in Ref. [24]), [25]. In the classical limit, Maxwell’s equations are linear while the Vlasov equation is not, hence, the non-linear terms in the latter are fully responsible for the saturation of the instability. On the other hand, it is established that the Vlasov equation can be linearized when the density modulation is significantly smaller than the initial beam’s density [26,27,28]. In other words, the Vlasov equation becomes non-linear when the density modulation becomes comparable with the initial beam’s density ( | δ n | n 0 ).
Our hypothesis is that | δ n | n 0 corresponds to the onset of saturation of the instability and the saturation of its gain and the appearance of signal distortions in the case of an amplifier. In Section 2, for compactness, we consider a one-directional instability while dedicating Appendix A for a detailed derivation in the 3-dimensional (3D) case.
We represent the response of the Maxwell-Vlasov linearized equations in the form of the Green function [29,30]. Using properties of the Green function, we derive limitations to the Green function and spectral gain of the system by saturation arising from shot (Poisson) noise in the beam.
In Section 3, we compare our estimation with the results of numerical simulation of gain saturation for FEL and plasma-cascade instabilities. In Section 4, we discuss both the usefulness as well as the limitations of the proposed method.

2. Limitation for the Green Function

Let us assume that instability is growing from an initial infinitesimally small density perturbation:
n ˜ 0 ( t ) n ˜ ( s = 0 , t ) ; | n ˜ ( t ) | n 0 ,
where n0 is assumed to be uniform at the typical correlation time of the problem. In this case, the linear response to the initial perturbation can be described by a Green function, which naturally depends on the azimuth along the beam’s trajectory s [31,32]:
n ˜ ( s , t ) = G ( s , t ζ ) · n ˜ 0 ( ζ ) d ζ .
Mathematically, the Green function is a response to a Dirac δ-function perturbation in the beam’s density. In the case of the lossless propagation of the beam, the number of particles is preserved:
n ˜ ( s , t ) d t = G ( s , t ) d t · n ˜ 0 ( ζ ) d ζ = n ˜ 0 ( ζ ) d ζ ,
applying an important constraint on the integral of the Green function:
G ( s , t ) d t = 1 .
To estimate the maximum possible growth of the instability, we assume that the amplified signal is small when compared with the initial noise in the beam and can be neglected. Let us consider a portion of the beam contacting N particles, extending from −T to T, with a constant density:
n 0 = N 2 T I e ,
where I is the beam’s current and e is the charge of particles. Let us consider the minimal possible level of noise in the beam, which is presented by the Poisson shot noise:
n ˜ b 0 ( t ) = i = 1 N δ t t i n 0
with random times ti of the particles and a well-established statistical relation:
n 0 = i = 1 N δ t t i ,
where brackets indicate averaging on the microscopic scale Δt, which contains large number of particles: Δ N = Δ t · n 0 1 . It also indicates averaging over an ensemble of possible implementations of random distributions [33]. In other words, we are using a traditional method of three scales to connect microscopic and macroscopic phenomena [34,35]:
Δ t τ G T ,
where τ G is the duration of the Green function, which diminishes at the 2T boundaries, i.e.,
G ( s , t ) G max = max G 2 ( s , t ) , | t | T .
In other words, we are considering instabilities with bandwidths significantly broader than the macroscopic frequency content in the beam structure.
Since the beam noise in Equation (5) has zero value,
T T n ˜ b 0 ( t ) d t = T T i = 1 N δ t t i n 0 d t = N 2 T · n 0 = 0 ,
one can introduce a modified Green function with zero average value (using Equation (3)):
G ˜ ( s , t ζ ) = G ( s , t ζ ) G 0 ; G 0 = 1 2 T T T G ( s , t ζ ) d ζ = 1 2 T ,
with the following property:
n ˜ b ( s , t ) = T T G ( s , t ξ ) · i = 1 N δ ζ t i n 0 d ζ = i = 1 N T T G ˜ ( s , t ξ ) · δ ζ t i d ζ ,
which can be straightforwardly proved:
T T G ( s , t ζ ) i δ ( ζ t j ) n o d ζ = i T T G ( s , t ζ ) · δ ( ζ t j ) d ζ n o · 2 T · G o = i T T G ( s , t ζ ) . δ ( ζ t j ) d ζ G o · N ; T T G ˜ ( s , t ζ ) · i δ ( ζ t i ) d ζ = i T T G ( s , t ζ ) · δ ζ t i d ζ G 0 T T δ ζ t i = i T T G ( s , t ζ ) · δ ζ t i d ζ G 0 · N .
It is worth noticing that relations (7) indicate that G 0 τ G 2 T G ˜ max G ˜ max . In other words, there is little difference between the two Green functions G , G ˜ we introduced in this paper.
Let us introduce a properly defining duration time for the Green function:
τ G ( s ) = G 2 ( s , t ) · d t G max 2 .
Now one can calculate the root mean square (RMS) noise at the location s:
n ˜ b ( s , t ) 2 = G ˜ ( s , t ζ ) · t N δ ( ζ t i ) d ζ 2 = i N G ˜ s , t t i 2 i , j N G ˜ s , t t j G ˜ s , t t j ,
Since the positions of particles are uncorrelated and the modified Green function has a zero average value, one can prove that:
G ˜ s , t t i G ˜ ( s , t t j ) = G ˜ 2 ( s , t t i ) δ i j .
For ij, the ensemble average is equal to zero because one can expand the modified Green function into the Fourier series with all terms averaging zero:
G ˜ ( s , t ) = m 0 g m e i m Ω t ; Ω = π T ; G ˜ s , t t i G ˜ s , t t j = m , k 0 g m e i m t t i + k t t j Ω t = 0 .
Therefore, the statistically averaged density perturbation can be expressed as follows:
n ˜ b ( s , t ) 2 i N G ˜ 2 s , t t i = N 2 T T T G ˜ 2 ( s , t ) d t = n 0 · G ˜ max 2 · τ G .
It is our hypothesis that non-linear effects (saturation) will arise when RMS density perturbations become comparable with the average density of the beam:
n ˜ b ( s , t ) 2 = G ˜ max · n 0 · τ G n 0 .
This gives us an estimation for the maximum possible value of the Green function (which has the dimensionality of the particle’s density):
G ˜ max n 0 τ G .
Since the correlation time is connected to the bandwidths of the instability (this relation is exact for Gaussian pulses: 2 τ G · σ ω = 1 ):
σ ω 1 2 τ G ,
one has a connection between the beam density, the bandwidth of the instability, and the maximum values of the Green function:
G ˜ max 2 σ ω n 0 .
This estimation can be evaluated further for frequency dependent gain:
n ˜ ( ω ) = g ( ω ) · n ˜ 0 ( ω ) ; n ˜ ( ω ) = 1 2 π n ( s , t ) e i ω t d t , g ( ω ) = 1 2 π G ˜ ( s , t ) e i ω t d t ,
where g(ω) is dimensionless. In contrast with t-dependent the Green function, the g(ω) can be called a gain of the instability. Since the Green function does not extend beyond the {−T,T} interval, one can rewrite Equation (10) as
n ˜ b ( s , t ) 2 N 2 T · G ˜ 2 ( s , t ) d t = N 2 T · | g ( ω ) | 2 d ω = n 0 · g max 2 · Δ ω G ; Δ ω G = | g ( ω ) | 2 d ω g max 2 ; g max 2 = max ( | g ( ω ) | 2 ) | g ( ω c ) | 2 ,
where we define the central frequency of the instability ωc and its effective bandwidth ΔωG, with an expected value of
Δ ω G σ ω 2 ·
Hence, we are obtaining an estimation for the maximum attainable linear gain:
g max n 0 Δ ω G 2 · n 0 σ ω
or in practical units,
g max I e · Δ ω G = 997 · I [ A ] Δ f THz ; Δ f = Δ ω G 2 π .
There are two typical Green function shapes: one is nearly a “single wiggle,” and the other is a nearly periodic oscillation with a smooth envelope (as shown in Figure 1). A broad-band response with σ ω ω c is typical for microbunching [2,3] or plasma-cascade [20] instabilities, while high-frequency but narrower bandwidths with σ ω ω c are typical for FEL instability [4,5,6,7,8,9].
While the above estimations are valid for any generic Green functions, it is possible to develop them further for a narrow-band instability. In this case, the Green function can be presented by a smooth complex (dimensionless) gain envelope, gτ:
G ( s , t ) = 2 T 0 R e g τ ( s , t ) · e i ω c t ; T 0 = 2 π ω c ;
where
g τ ( s , t ) t T 0 2 t + T 0 2 G ( s , ζ ) e i ω c ζ d ζ
represents the local portion of the particles participating in the FEL process, known as a relative bunching factor in FEL theory [22].
Equation (17) allows us to estimate maximum values for gτ:
g τ max T 0 2 · G ˜ max π 2 σ ω n 0 ω c = π · 2 π · n 0 ω c · σ ω ω c ,
which, in addition to a numerical factor, has the product of two key dimensionless parameters. The first parameter is the number of particles in the wavelet:
N λ = T 0 · I e λ 0 · n 0 ν ; λ 0 = 2 π ν ω c ,
where ν is the beam’s velocity and λ0 is the central wavelength of the oscillations (radiation).
The second parameter is the relative bandwidth of the instability, σ ω / ω c :
| g τ | max π · N λ · σ ω ω c .
For a “single wiggle” type of Green function, | g τ | max represents the number of electrons collected at the central peak in response to the initial distortion by a single particle. In this case, the numerical factor π 1 in Equation (18) should be ignored. It can be used as an estimation for a broad range of instabilities, which in practical units states
| g τ | max 2.5 · 10 3 I [ A ] f c [ THz ] · σ ω ω c ,
and for relativistic beams moving close to the speed of light as a function of the radiation wavelength:
| g τ | max 144 · I [ A ] · λ [ μ m ] . σ ω ω c .
Hence, the maximum attainable linear gain is proportional to the square root of the beam current. The gain is also proportional to the square root of the radiation wavelength, i.e., is inversely proportional to the square root of the central frequency of the instability. In all cases, the gain is proportional to the square root of the relative bandwidth of the instability. In other words, a broad-band instability can have a higher linear gain when compared with a narrow-band instability with the same central frequency (wavelength).

3. Numerical Tests

3.1. FEL Simulations

For the first numerical test of our model-independent estimations, we selected a well-studied and well-understood FEL instability. We considered a statistically representative set of initial conditions at the FEL’s entrance using the 3D FEL code, Genesis [36], for a number of random-shot noise sets. We simulated the evolution of the bunch and the EM wave in the FEL both with and without a δ-function-like perturbation using identical input for the shot noise. The length of the FEL was intentionally chosen to be sufficiently long so that saturation is observed at its exit.
We performed Genesis simulation in time-resolved mode to simulate the FEL amplification and saturation process. Genesis has an excellent shot noise generator and allows adding a δ-function-like perturbation in the form of an additional bunching factor in a single wavelet. Specifically, in our simulations, we considered that the FEL response (i.e., its coherence length) is much shorter than the length of the electron bunch. Thus, we sliced the electron bunch into wavelets (with steps of wavelength, λo), with each slice represented by its local bunching factor.
Genesis is a perfect tool to simulate the evolution of the bunching factors in a 3D FEL. With two runs (one with and one without input signal) and using identical shot noise, the response to the perturbation at the exit of the FEL was calculated by subtracting the bunching factors caused by the shot noise from that in the presence of the input signal. This subtraction was conducted for each random shot-noise seed.
Specifically, to extract the response function, we generated two electron-bunch distributions for each shot-noise set. The first distribution has a random Poisson shot noise, generated by Genesis. This is a typical and well-tested setting for self-amplified spontaneous emission (SASE) FEL [37] simulations. The second distribution is identical to the first one with the exception of a single wavelet located at the middle of the bunch wherein we added a relatively small fixed bunching factor as an input signal. Technically, we use a quiet start to generate one set slice with an initial bunching factor at the level of interest, e.g., 10−4, and superimpose this slice on the middle of the first distribution. We therefore propagated these two bunches (one only with the shot noise and the other with the shot noise and the perturbation) through the FEL to record the evolution of the bunching factors in each wavelet as a function of its longitudinal position in the wiggler. Being the difference between two complex numbers, such an FEL response is a complex function and can be described by both the amplitude and the phase. Finally, we normalized the response to the amplitude of the perturbation.
One critical consideration is that the amplitude of the perturbation had to be chosen so that the response is well above the numerical noise of the code but below the level when non-linear effects from the input signal in the FEL’s dynamics start to appear. We verified the latter by the following steps: first, we increased the amplitude of the initial perturbation while observing the evolution in the FEL with a quiet start. When non-linearity (early saturation) was observed, we marked the amplitude as the threshold level. Then the amplitude of the initial perturbation was reduced from the threshold level by three orders-of-magnitude for the rest of the simulations.
To observe the evolution, the FEL response was calculated at various locations along the FEL. It is noteworthy that before reaching saturation, the FEL response is identical to the Green function as defined above. In other words, we also have the means to calculate its correlation length.
The bunching factor, at location s, defined as
b ( s ) = e i · k · s i i e i · k · s i i 1 | s i s λ o 2 , s + λ o 2 ,
without the initial perturbation (b1) and with the perturbation (b2), can be expressed as:
b 1 ( s ) = b 1 ( s ) e i θ 1 ( s ) ; b 2 ( s ) = b 2 ( s ) e i θ 2 ( s ) .
Thus, the bunching caused by the perturbation is the difference between these two results, which can be written as
b s ( s ) = b s ( s ) e i θ s ( s ) b 2 ( s ) b 1 ( s ) ,
or specifically:
b s ( s ) = b 1 ( s ) b 2 ( s ) ; θ s ( s ) = arctan 2 b 1 ( s ) cos θ 1 b 2 ( s ) cos θ 2 , b 1 ( s ) sin θ 1 b 2 ( s ) sin θ 2 .
The arctan2 function provides the correct values of the phase within the range of [−π, π]. However, it introduces an artificial “jump” from −π to π when the phase crosses the boundary. This jump could result in superficial discontinuities of the bunching phase (modulo 2π). We monitored this and applied the correction (modulo 2π) whenever such a jump occurred. The gain of the initial perturbation then is
g s ( s ) = b s ( s ) b 0 ,
where b 0 = b s ( 0 ) where is the initial bunching factor of the signal.
Simulating the FEL process in Genesis using the entire electron bunch would require large number of slices (e.g., a full bunch could contain 105 or more slices). Simulating the full-bunch FEL would be time-consuming and unnecessary.
In FEL, the information propagates (slips) for one wavelength per wiggler period. Hence, the number of slices needed for extracting the response of the initial perturbation (the FEL’s response and Green function) is equal to the number of wiggler periods, which is on the order of 100. Naturally, we added some margin to eliminate the influence of the boundaries. More specifically, 1000 slices with 16,384 macro particles per slice were used in the simulation. Additionally, 32 random shot-noise sets in Genesis were implemented for statistical purposes.
We studied four different FEL amplifiers with wavelengths spanning from infrared (IR) to X-rays: (1) an IR FEL amplifier, (2) a visible FEL amplifier, (3) a vacuum ultraviolet (VUV) FEL amplifier, and (4) a hard X-ray FEL amplifier. Table 1 lists the detailed parameters used in the simulations.
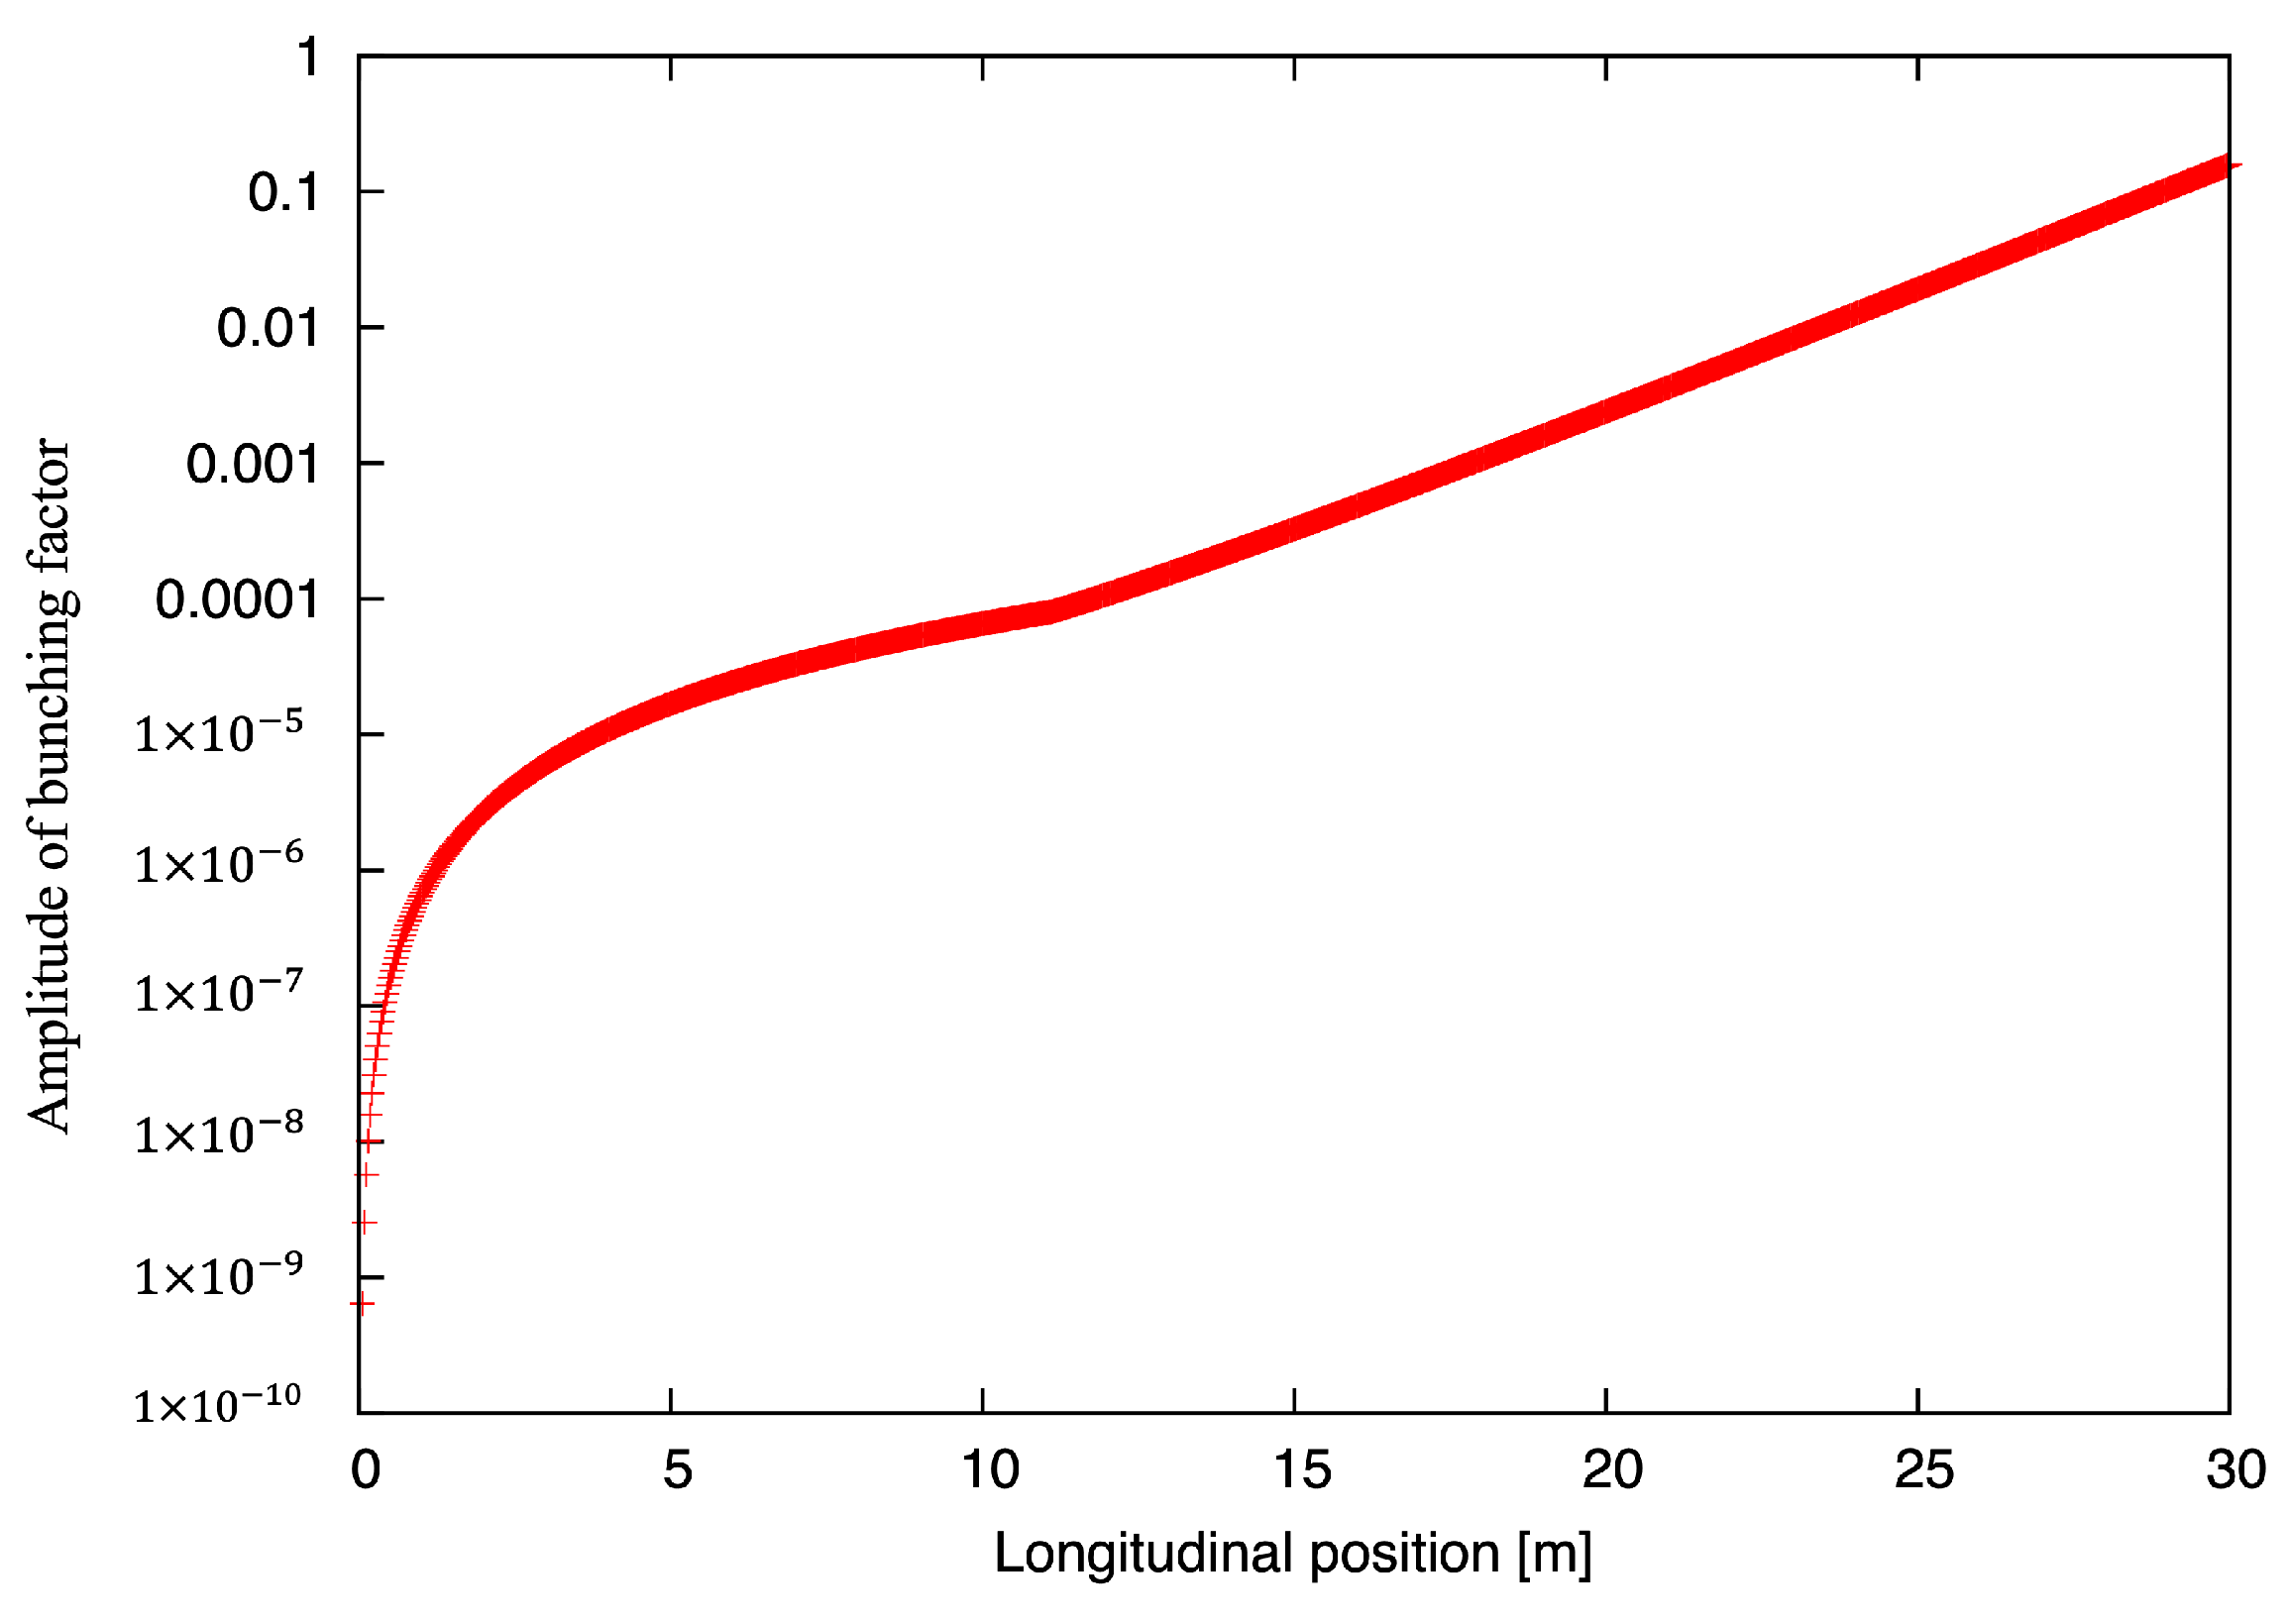
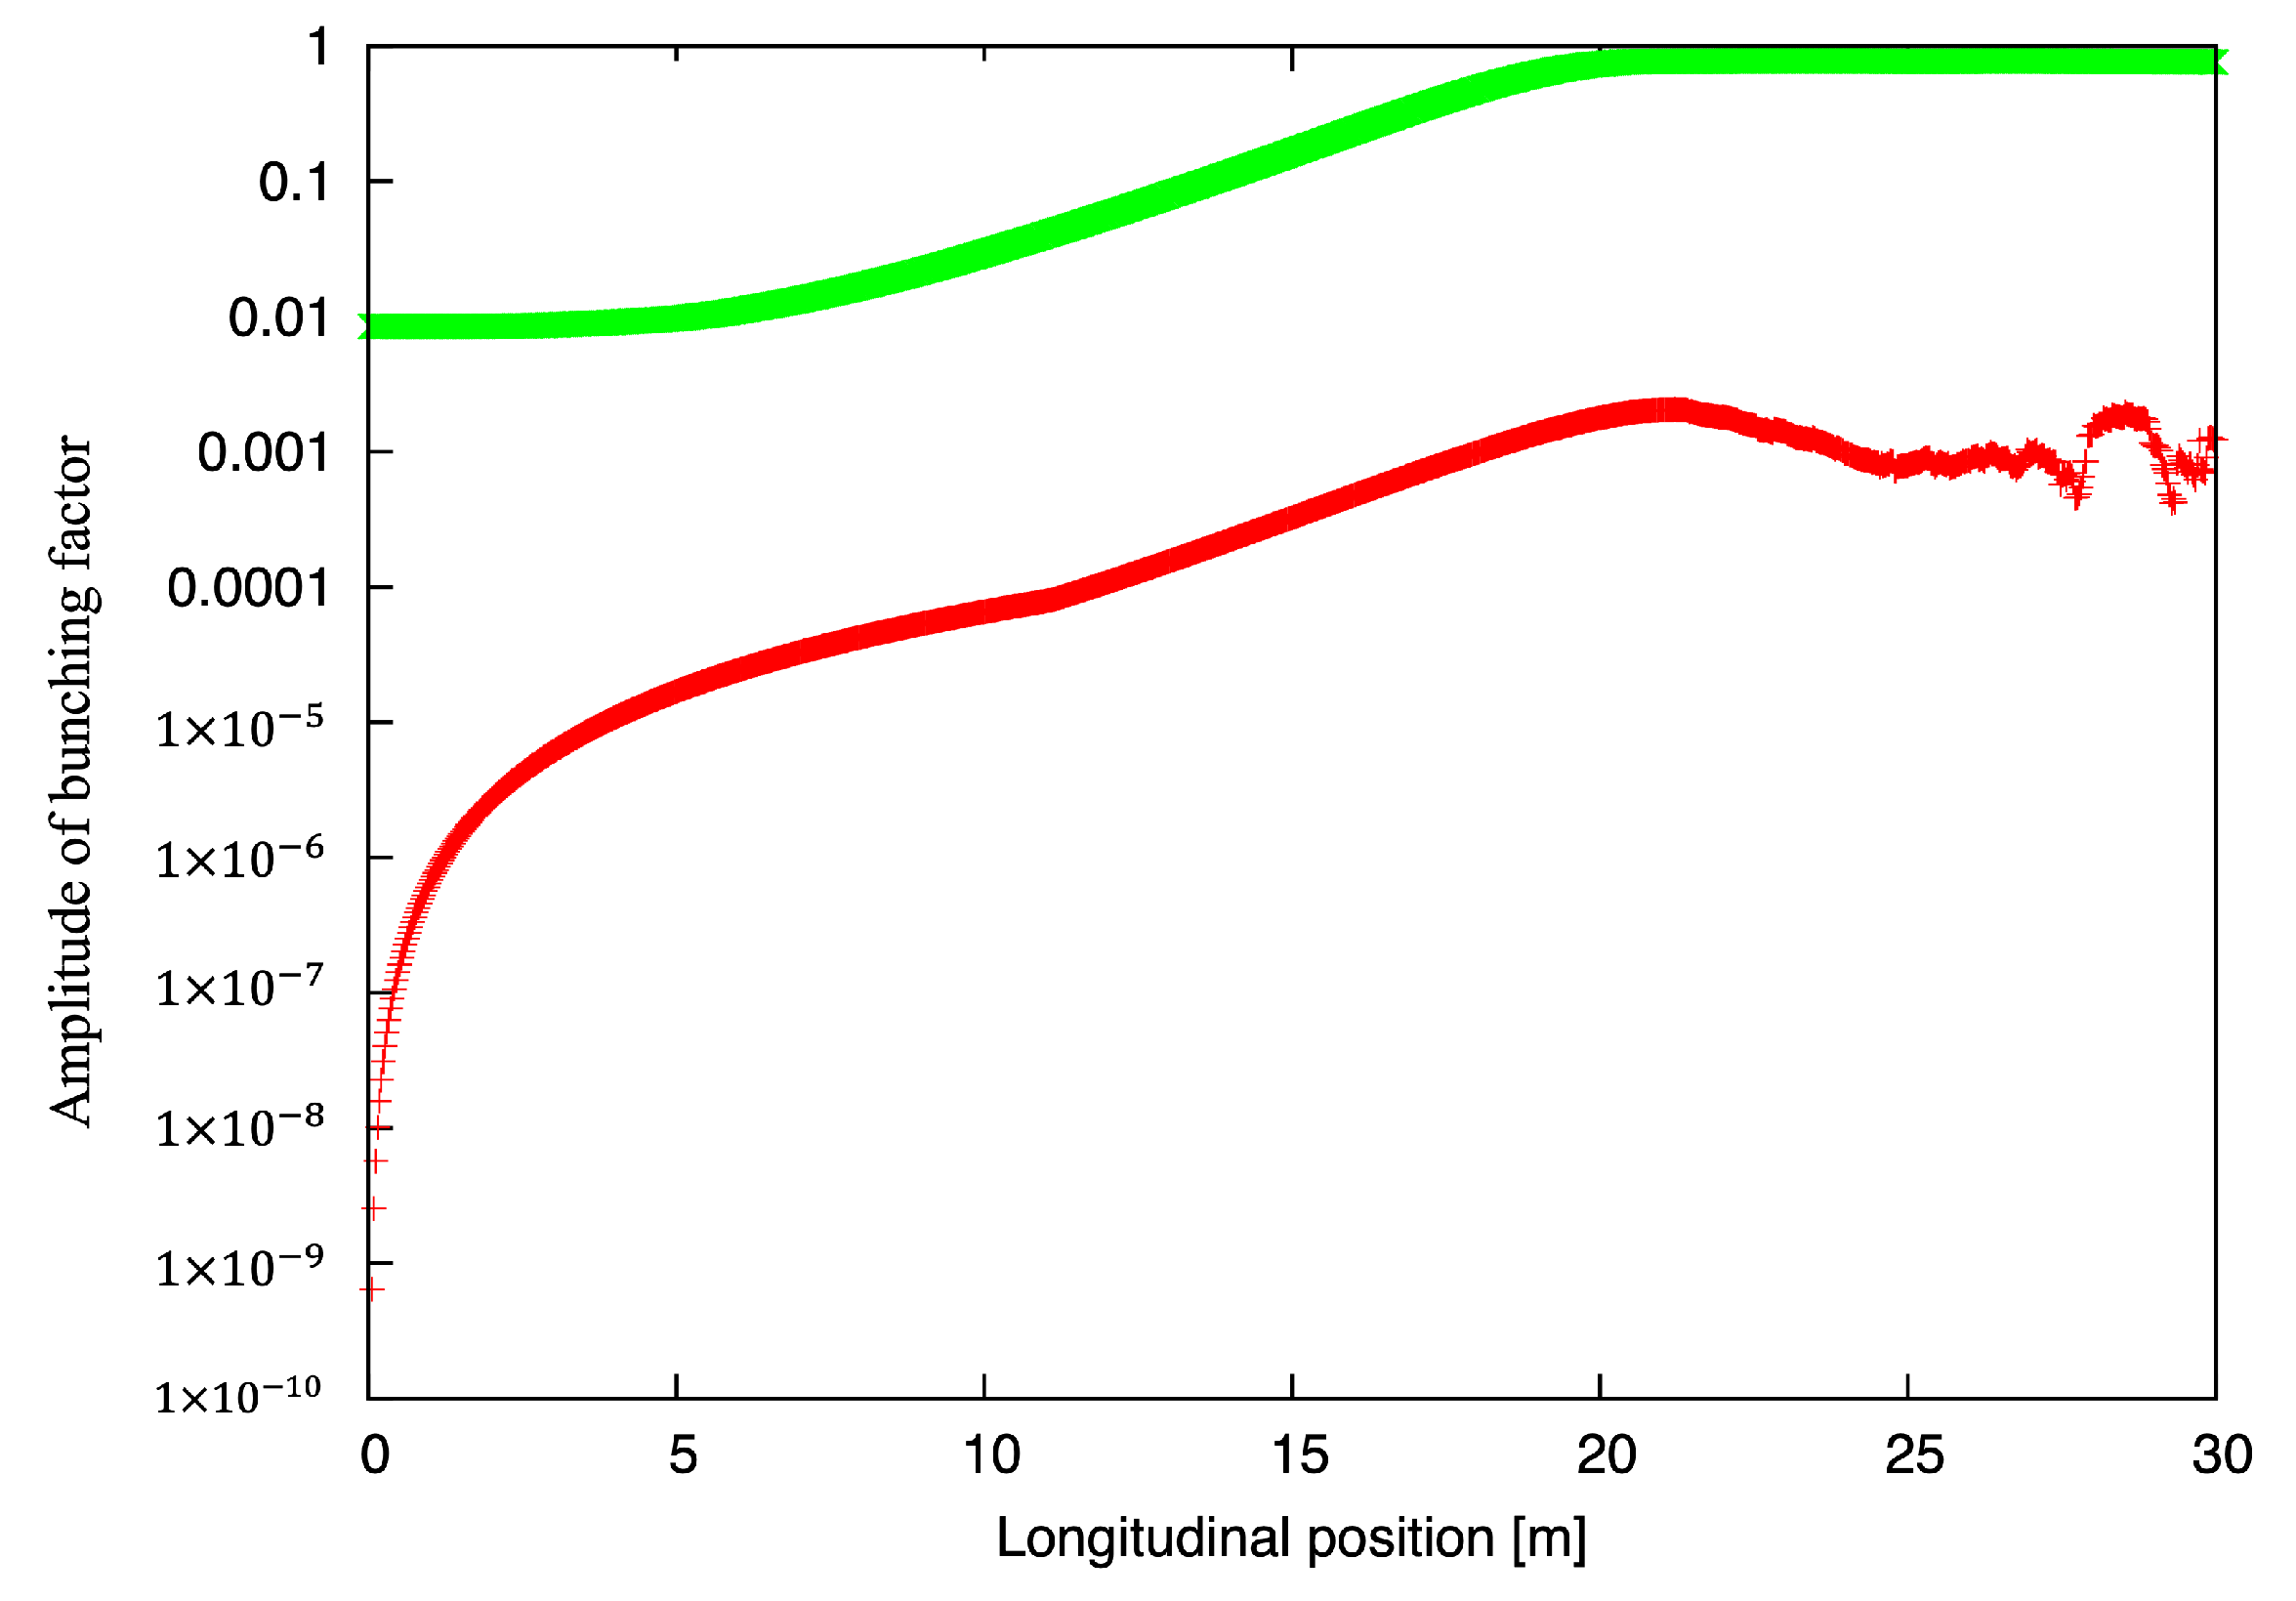
We studied each of the four cases shown in Table 1. For conciseness, we describe one case—the visible FEL-amplifier—in detail. Initially, we verified that a single-slice perturbation with bunching at 10−4 does not saturate in our FEL amplifier in the absence of shot noise (see Figure 2). Secondly, we confirmed that the addition of an initial perturbation does not affect the saturation of the SASE signal. Then, we performed simulations with thirty-two random initial shot-noise sets to extract the overall evolution of bunching in the FEL (in Figure 3).
For each location along the FEL’s length, we calculated the average values of the FEL response as well as the RMS values of its amplitude and phase variations. Since the Green function is unique in the linear regime, the fluctuations in it are minimal (as shown in Figure 4). Hence, we evaluated its saturation by observing the increase in the fluctuation’s phase and amplitude. Naturally, they coincided with FEL power and the transition of bunching from exponential growth into saturation at about 20 m (Figure 3).
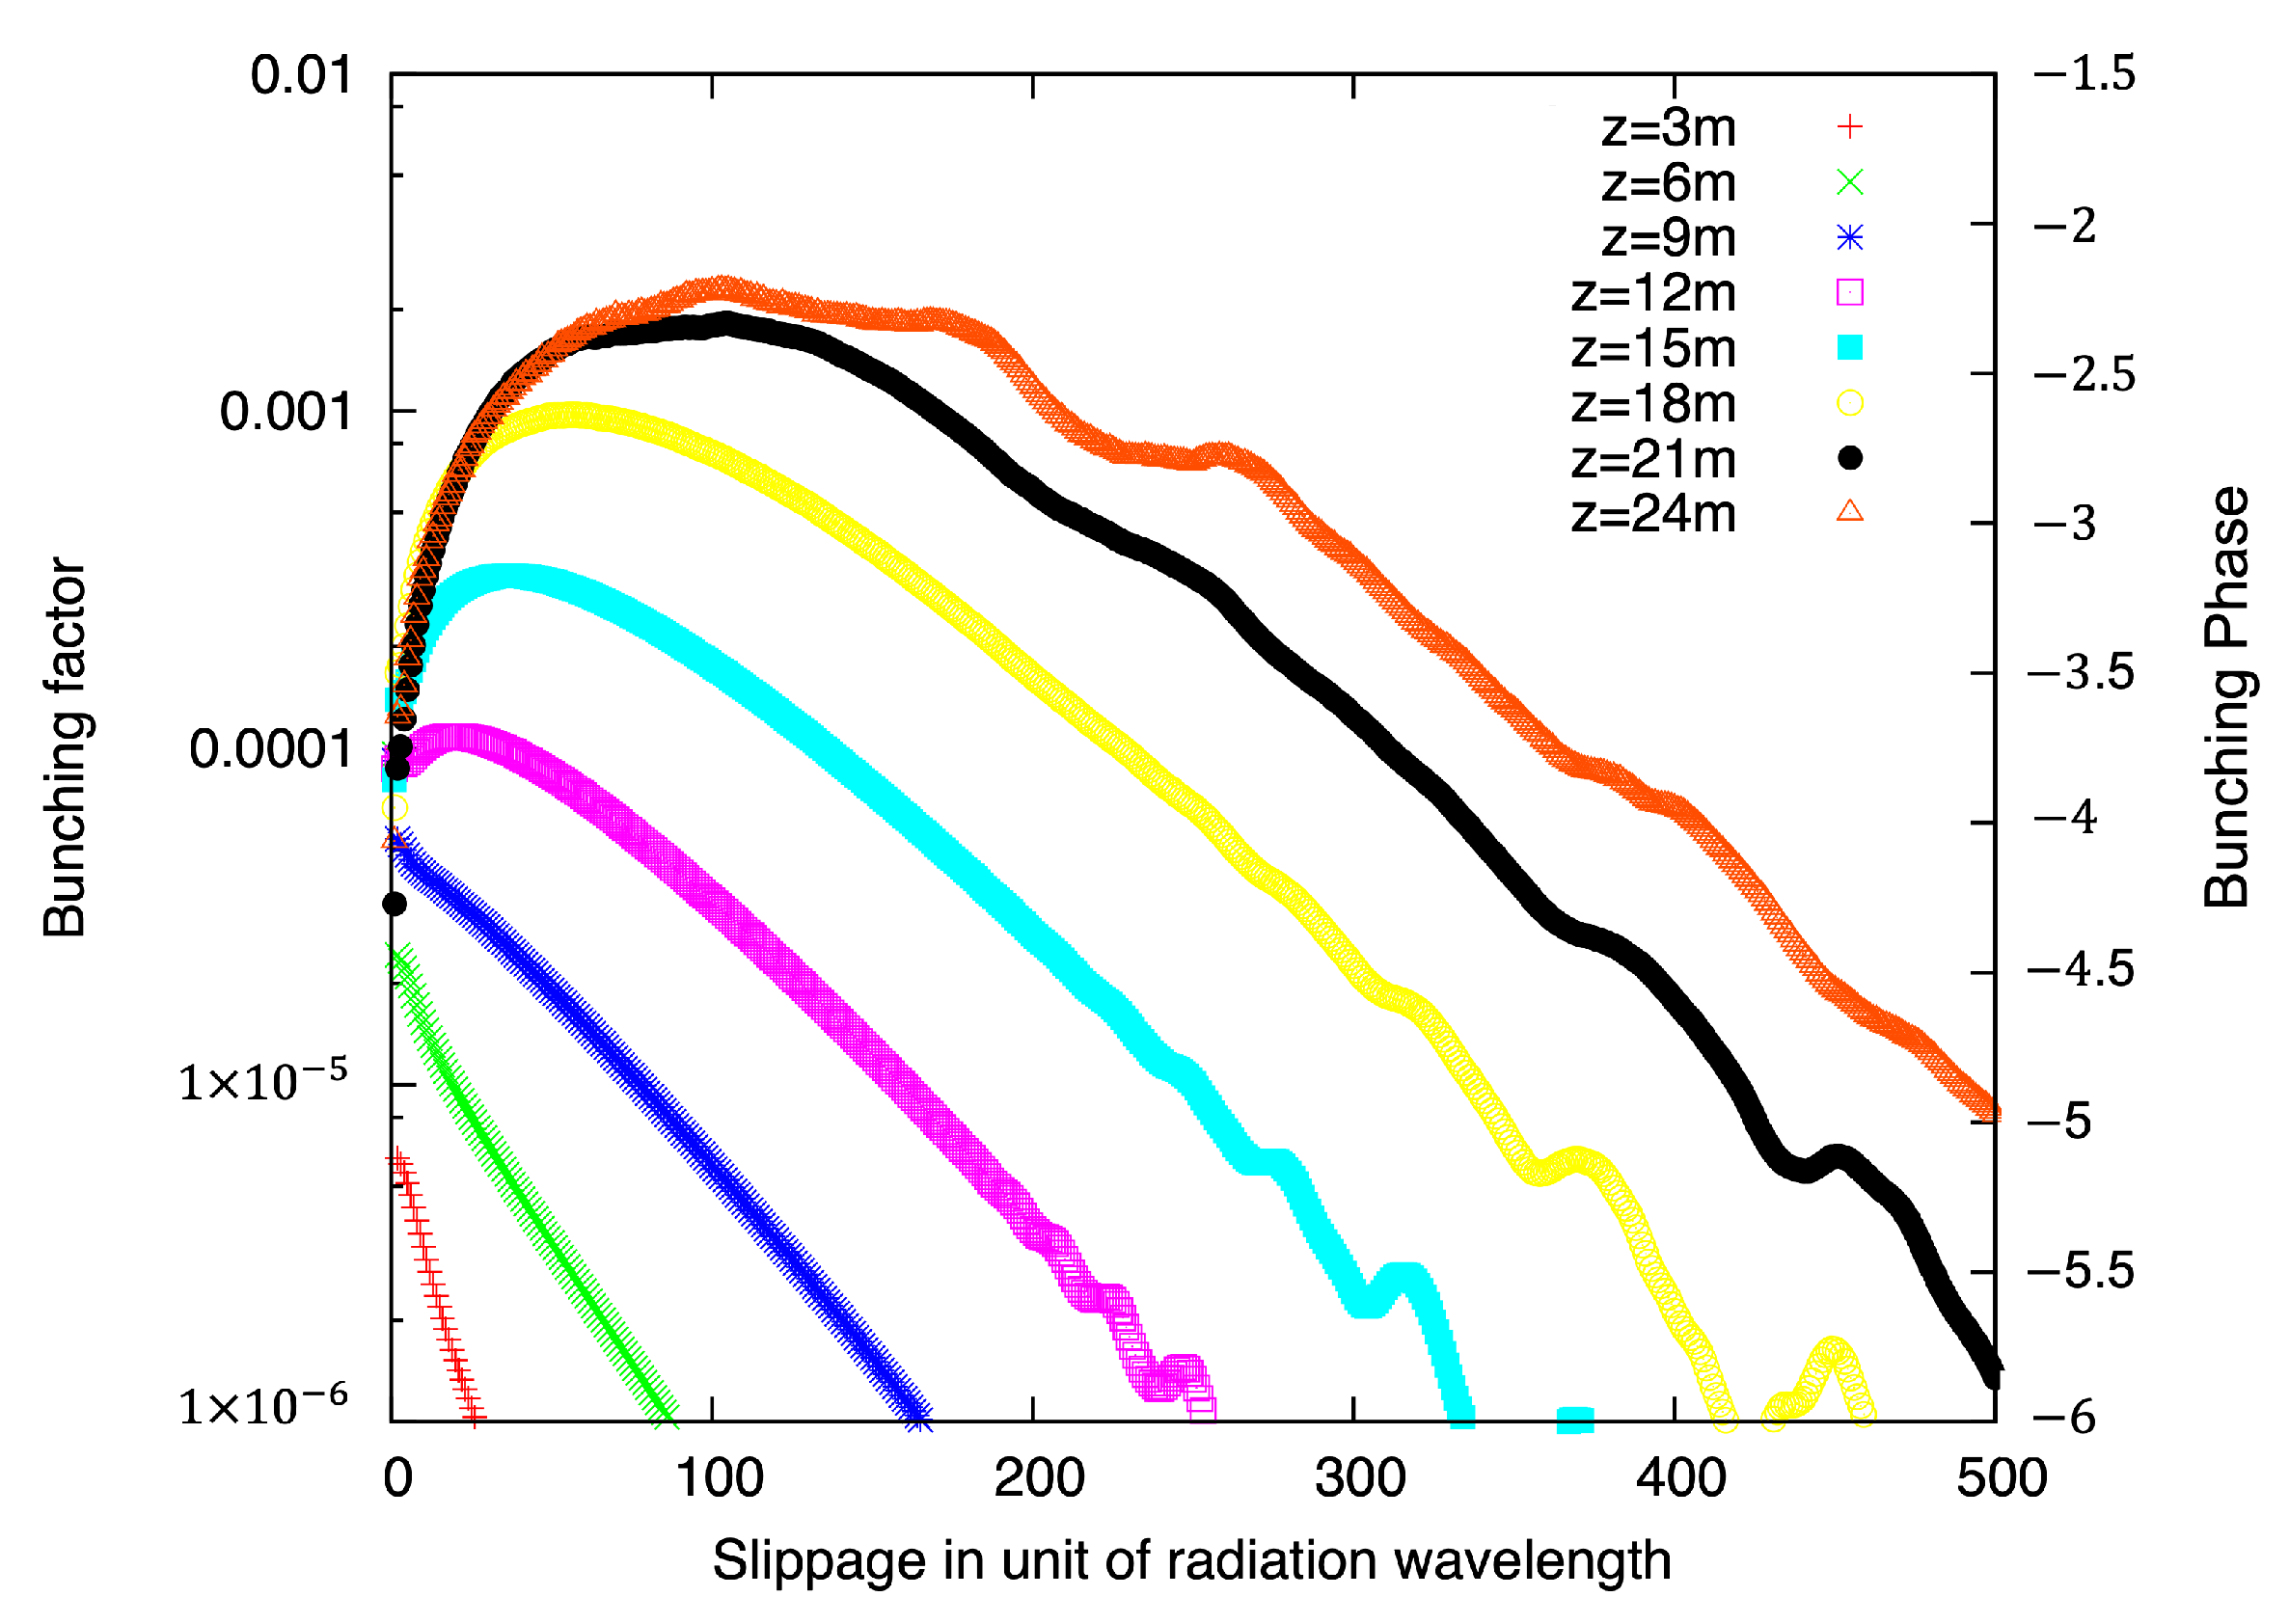
Either the FEL response or the Green function cannot be solely described by the amplitude of its peak value; there are also some other important features at that location, such as its peak and the phase of the bunching modulation. Figure 5 shows details of the FEL response to the perturbation as a function of location (path length) in the FEL. The entire process (slippage, amplification, and saturation of the FEL response) can be visualized by the evolution of the response’s profile in the FEL.
Figure 5 illustrates the evolution of the bunching amplitude induced by the initial perturbation as a function of the slippage (in units of radiation wavelength) at several locations in the FEL wiggler. The initial single-wavelet perturbation has a bunching amplitude of 10−4 and zero phase. It is placed at the middle of the bunch with natural and random shot-noise, whose contribution was subtracted. The only non-trivial part comes from the non-linear interaction between the shot noise and the coherent signal induced by the perturbation.
Starting from a blip in the middle, the information (and the bunching) expands forwards one wavelength per wiggler period. Naturally, the FEL electromagnetic field (radiation), propagating with the speed of light, carries the information forward. Meanwhile, the peak bunching remains at the origin of the perturbation (at an initial amplitude of about 10−4). Since we are interested in the evolution of the bunching beyond the initial perturbation, we plot all the data except that at the origin.
At around 12 m, the peak of the response extends above the level of the initial perturbation—this is the onset of the exponential growth of the response, as well as the crest of the bunching envelope propagating with the group velocity of the FEL, i.e., between the velocity of the electrons and the speed of light. Later, when the signal approaches saturation, the response also saturates and becomes less even.
While informative, Figure 5 does not provide a straightforward answer about what the maximum gain is. To study this, we plotted both the amplitude (from Figure 3) and the phase (from Figure 4) of the bunching factor with the maximum amplitudes as functions of the wiggler’s length. In other words, we calculated a peak value of the response (excluding the origin) and the phase for each location in the wiggler.
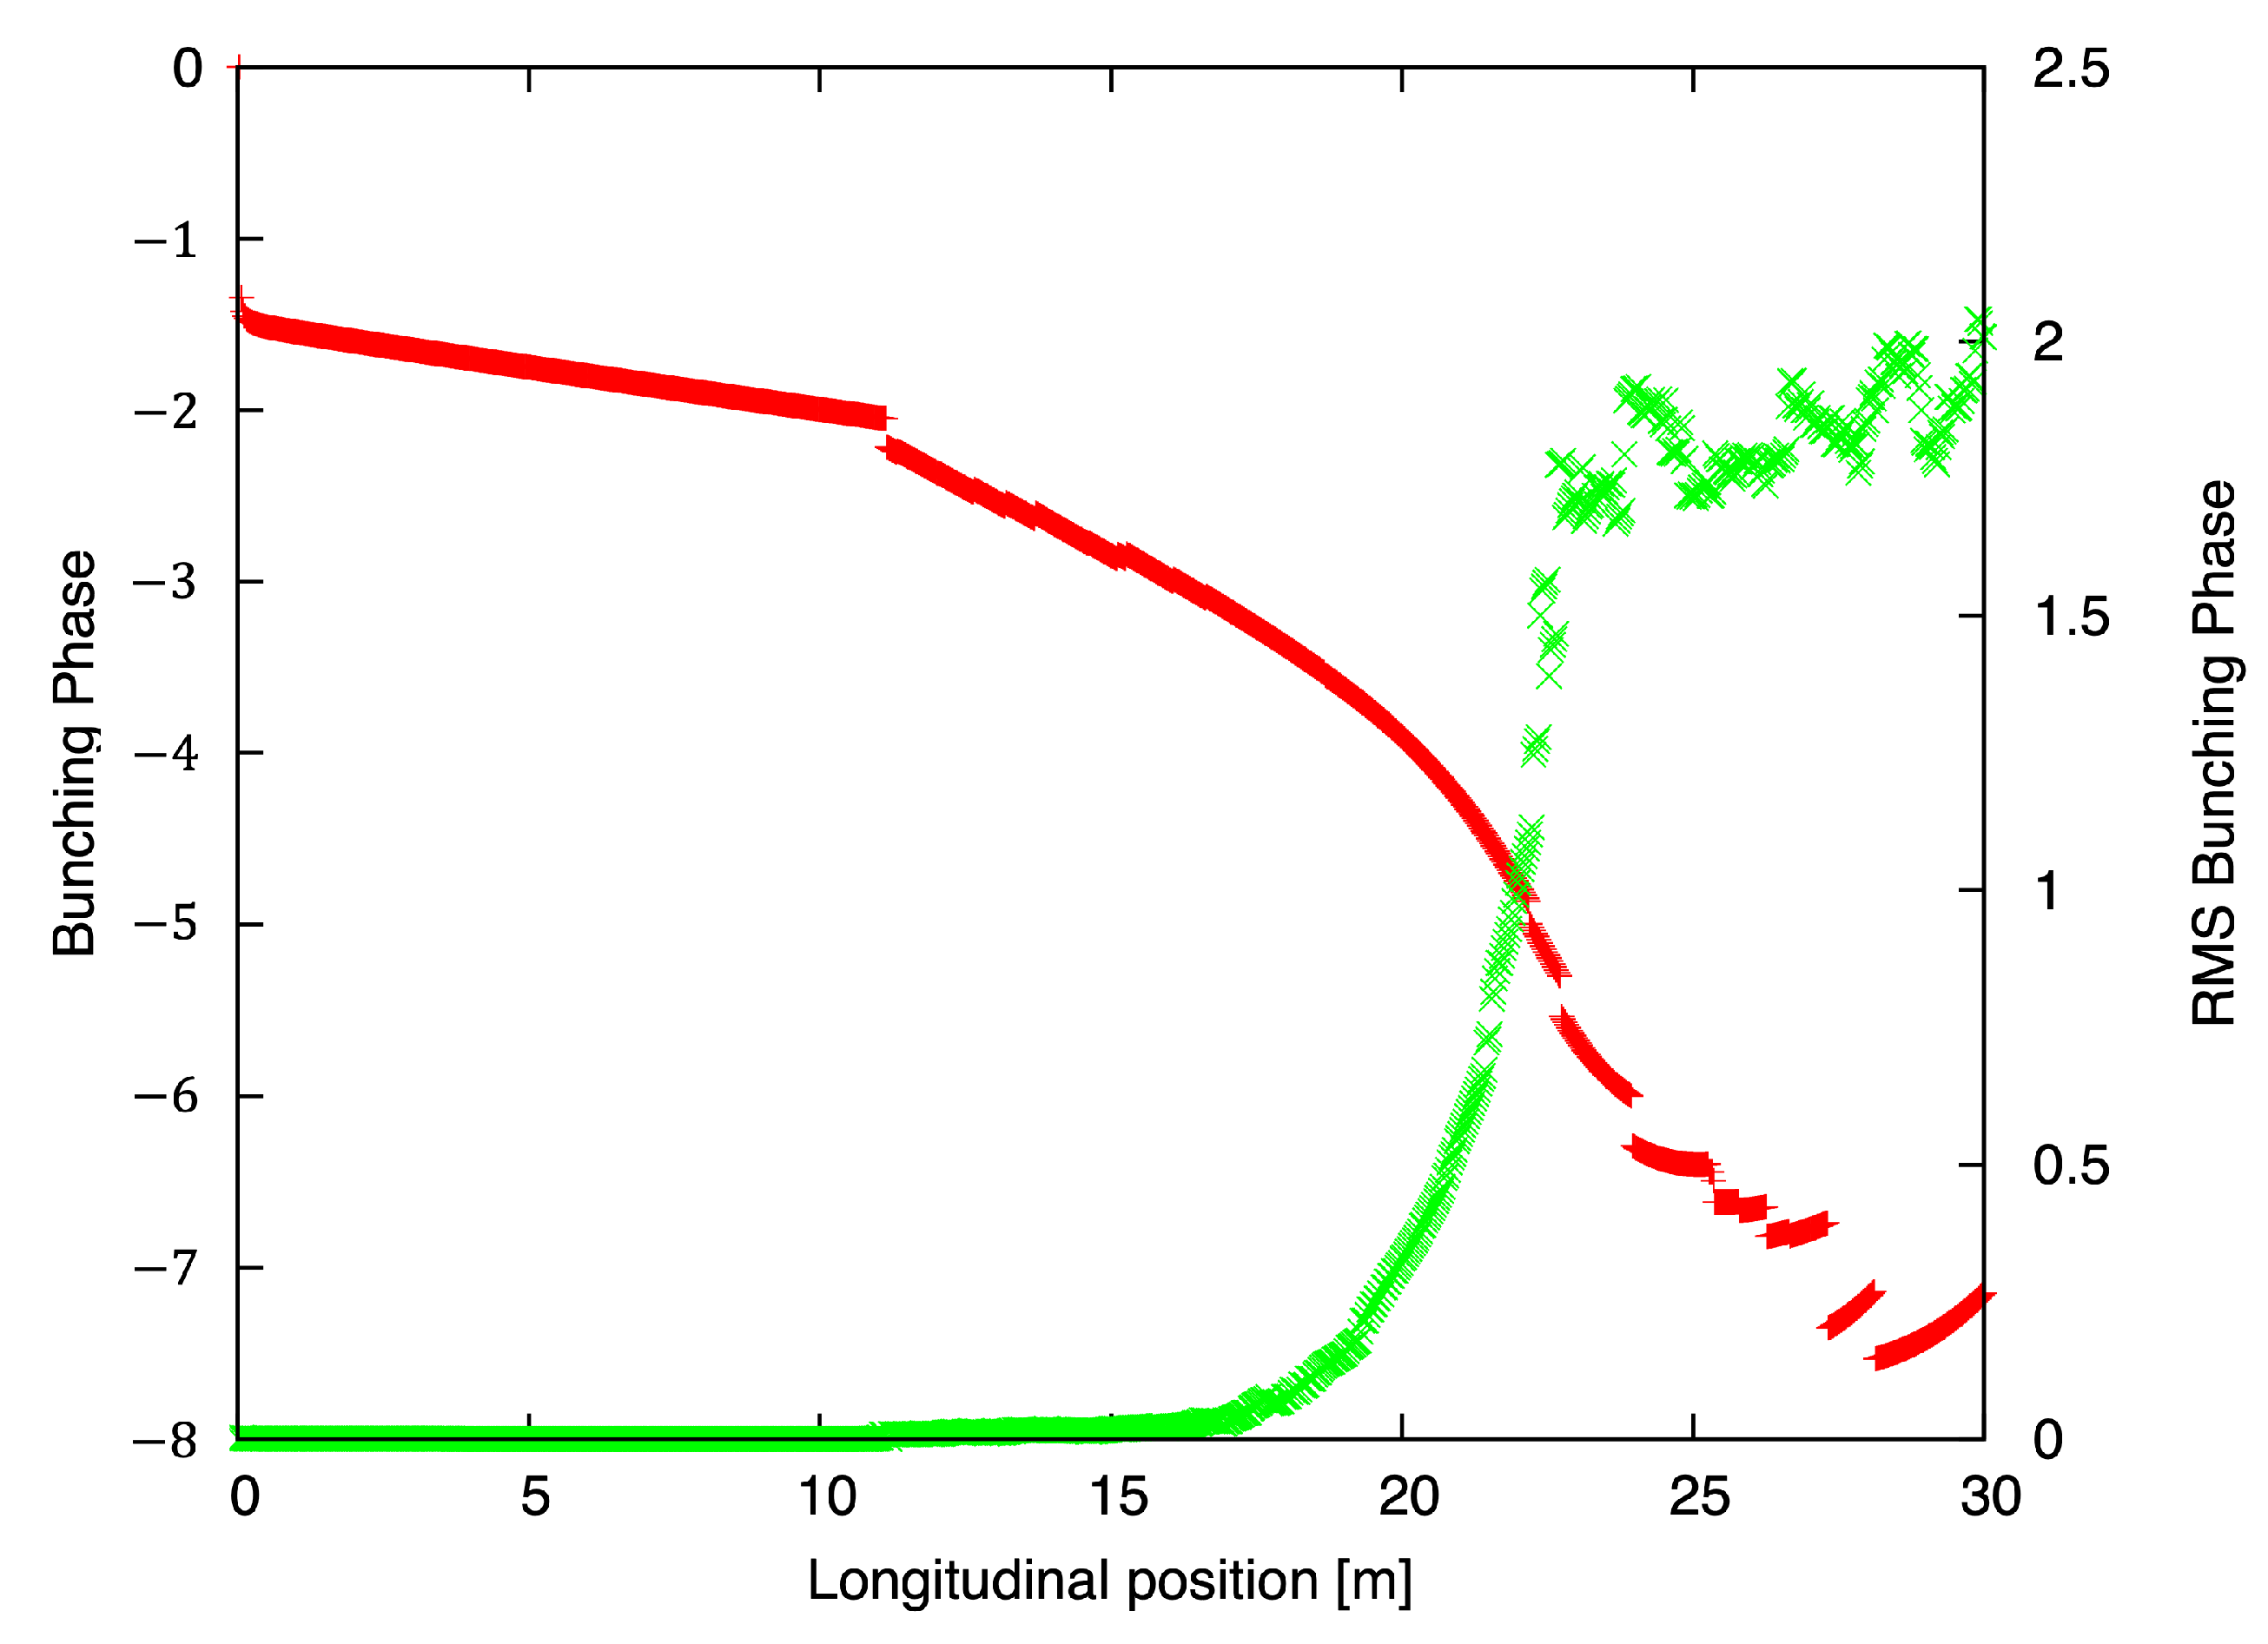
While detailing the evolution specifically, this choice has one defect—the maximum can jump from one location to another. Specifically, as shown in Figure 6, for a while (s < 12 m), the maximum of the response is located at the first wavelet, but at about s = 12 m, it jumps forward. This explains the change in the response’s functional behavior as depicted in Figure 4, as well as the phase jump in Figure 4. With this information, we can further explore the observed features of FEL evolution shown in Figure 3 and Figure 4.
In Figure 4, the evolution of the average bunching factor (green curve) is typical of SASE FELs, with an initial formation period, followed by exponential growth, and finally, saturation with |bSASE| ~ 1. The evolution of the FEL response to perturbation is different. It has a period of initial coherence build-up, followed by exponential growth, and then saturation. The maximum amplification of the initial perturbation is reached just before the FEL’s saturation (at approximately 20 m) and reaches 27.3.
Figure 4 shows that after the initial build-up, the phase of the evolution of the response function is smooth until about 20 m into the FEL, followed by jumpy behavior after that. The RMS spread of the phase rapidly increases in that region as well. Its origin is the non-linear response of the FEL that mixes the response to the perturbation with random shot noise. In other words, saturation removes the information about the input of the FEL amplifier making use of this amplified signal for feedbacks difficult, if not impossible, to implement.
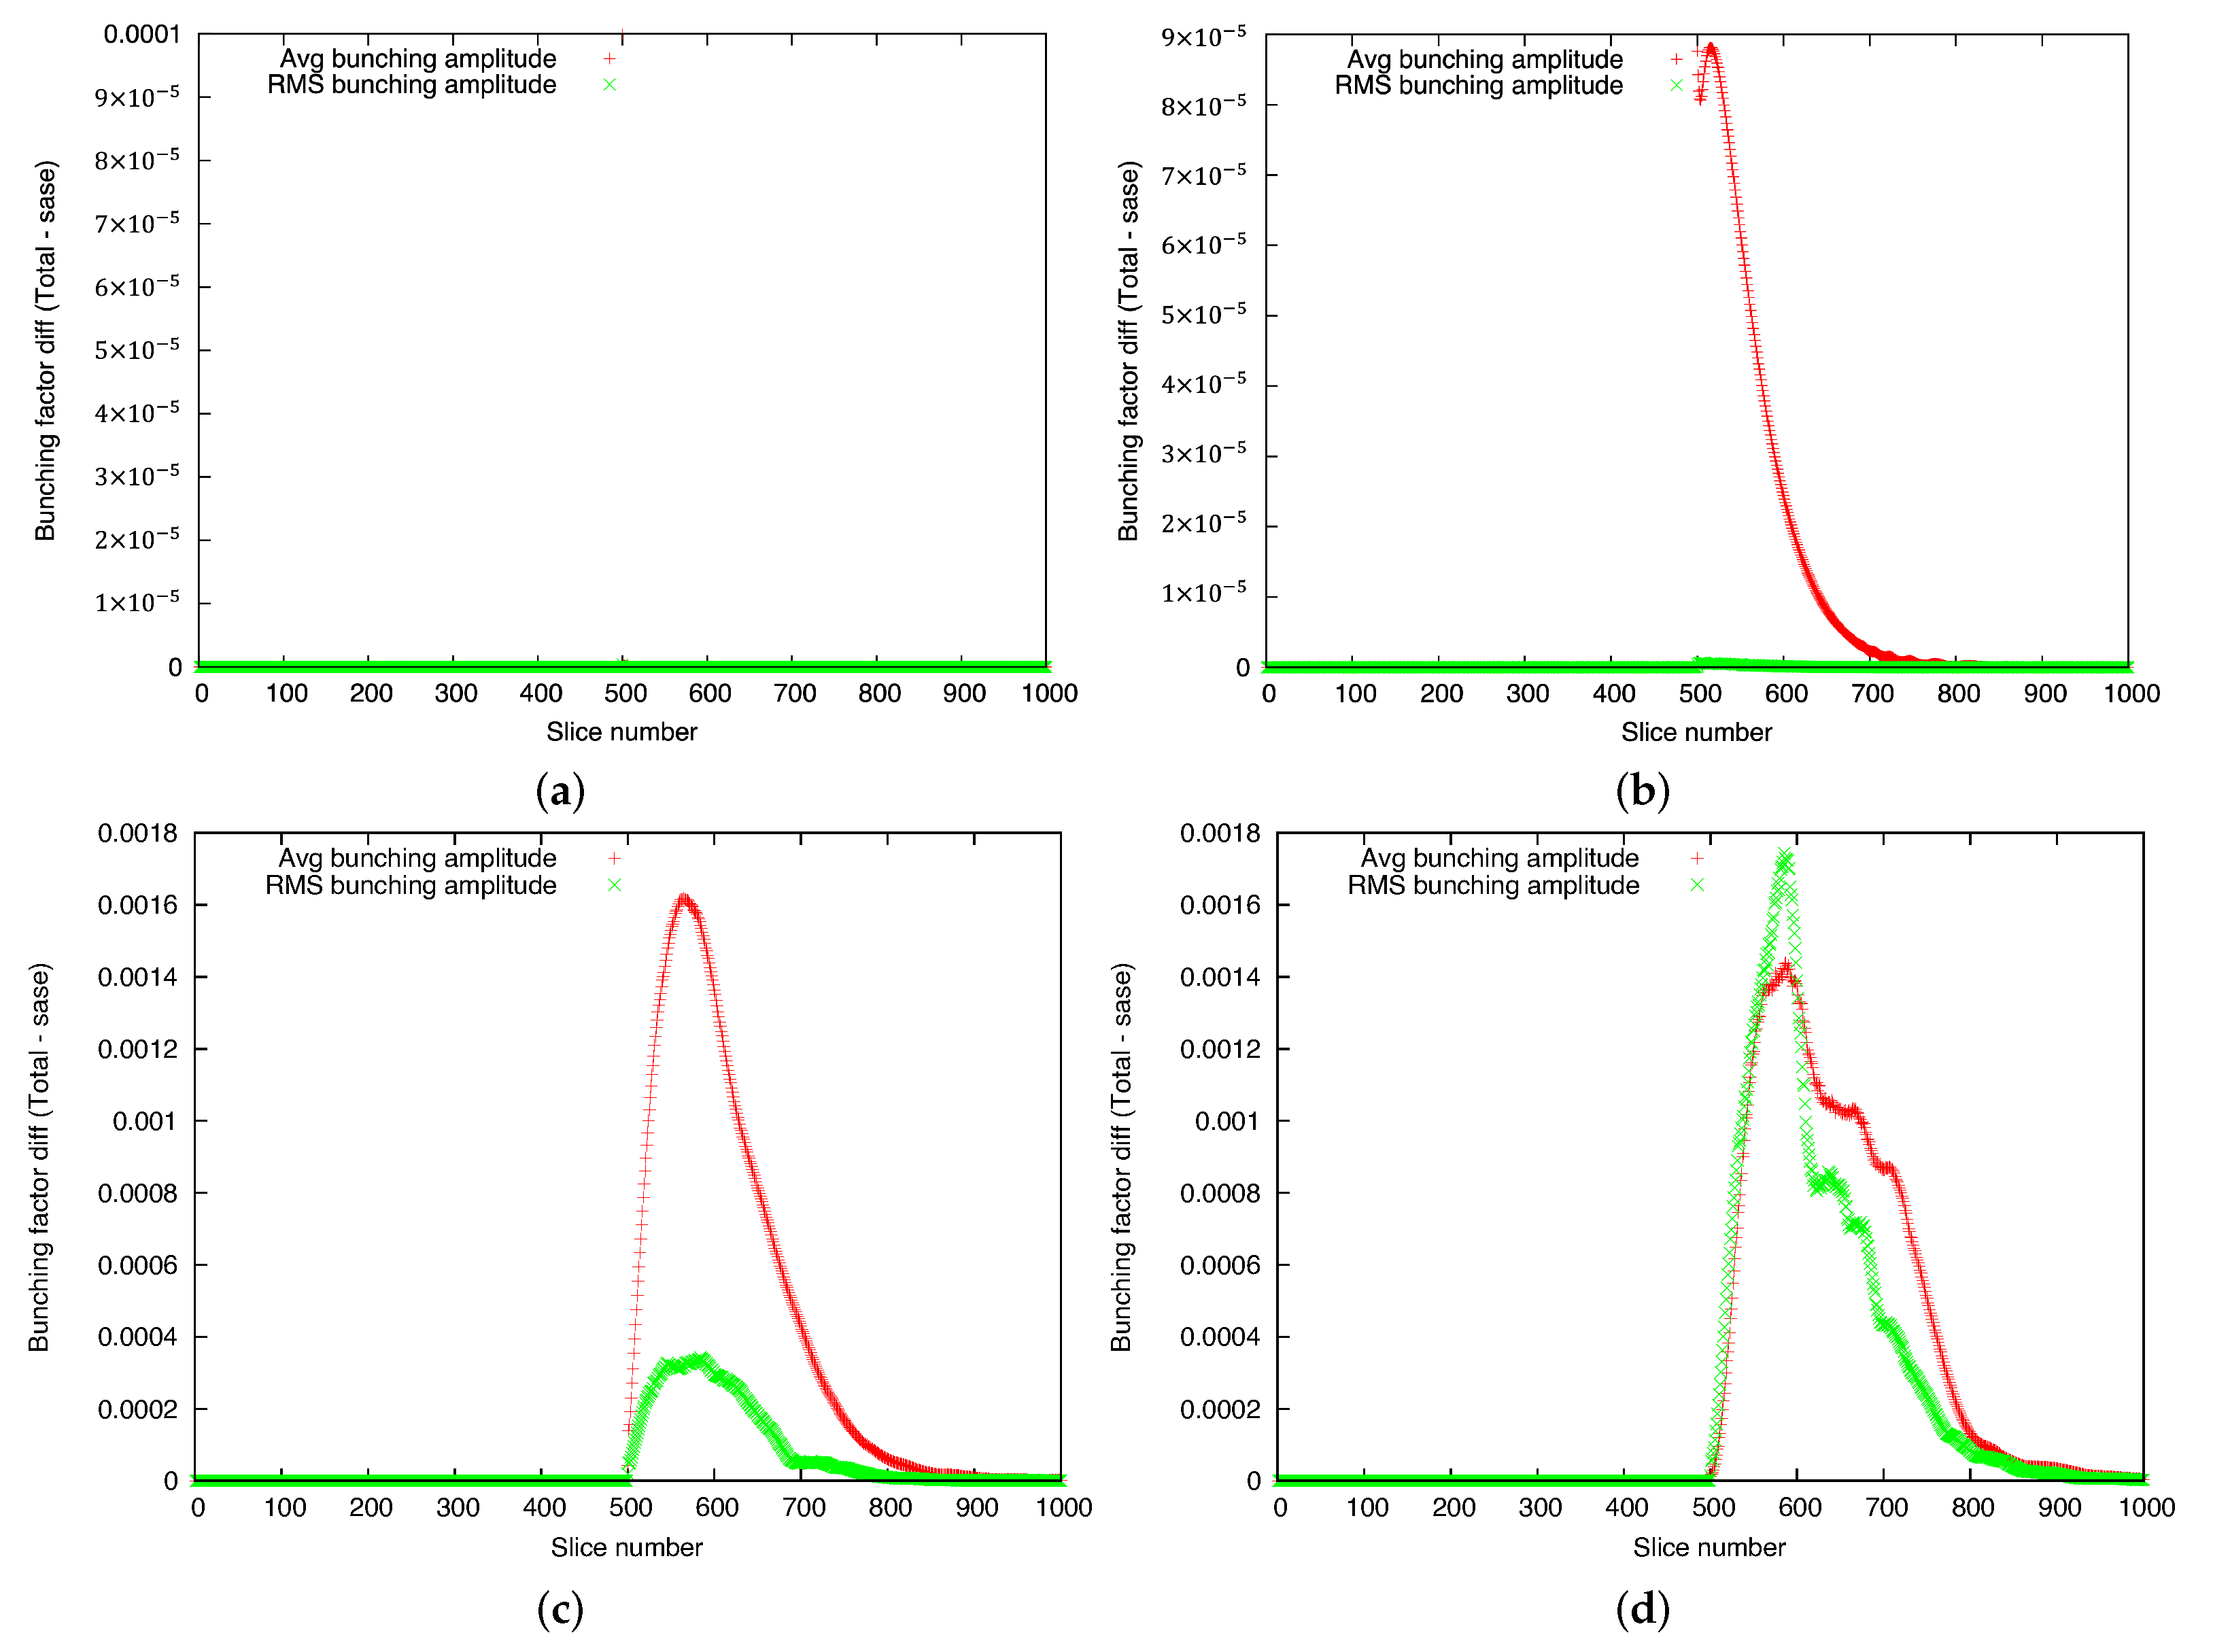
Figure 6 shows both the amplitude and the phase of the FEL’s response at a few selected characteristic locations in the wiggler.
Figure 6a shows the initial single-wavelet perturbation itself. It is worth noticing that the initial density perturbation travels at the speed of the electron beam, while the response moves with a slightly higher velocity, i.e., the group velocity of the FEL. When the electrons propagate in the FEL wiggler, three wave-packets develop from the initial perturbation: the density, the energy modulation, and the electromagnetic (EM) radiation. The radiation wave-packet slips in front of one FEL wavelength per FEL wiggler period. After the initial process of correlations build-up between the wave-packets, exponential growth starts. At some point, the response overtakes the initial perturbation (Figure 6b).
The maximum of the bunching amplitude is reached at the onset of saturation. Figure 6c shows the FEL response at this location, which has a fullwidth at half-maximum (FWHM) length of about 150 FEL wavelengths.
Finally, as shown in Figure 6d, the response saturates, in which both the amplitude and phase are randomized by the non-linear interaction with the shot noise of the beam. Naturally, this is a situation where amplifying a desirable signal while preserving its information is no longer achievable.

3.2. Simulations of Plasma-Cascade Instability (PCI)

To verify that our estimation (16) is applicable to broad-band instabilities, we explored the plasma-cascade instability [20] using a different simulation tool—SPACE [38,39,40]—a parallel, relativistic, 3D electromagnetic (EM), particle-in-cell (PIC) code capable of simulating interactions between relativistic particle beams. We simulated the PCI, a broad-band microbunching instability in the system shown in Figure 7. The exponential growth of the longitudinal density modulation in this system is caused by strong periodic (or semi-periodic) transverse focusing and the beam’s density modulation. The latter results in plasma frequency modulation and corresponding parametric resonance instability [20].
Specifically, the PCI system for this study is composed of eight strong-focusing solenoids, comprising seven cells, with a gain per cell of approximately 4.36 [20]. The solenoids focus the electron beam transversely, with a narrow waist located between them. The parameters of the beam and the solenoids are listed in Table 2.
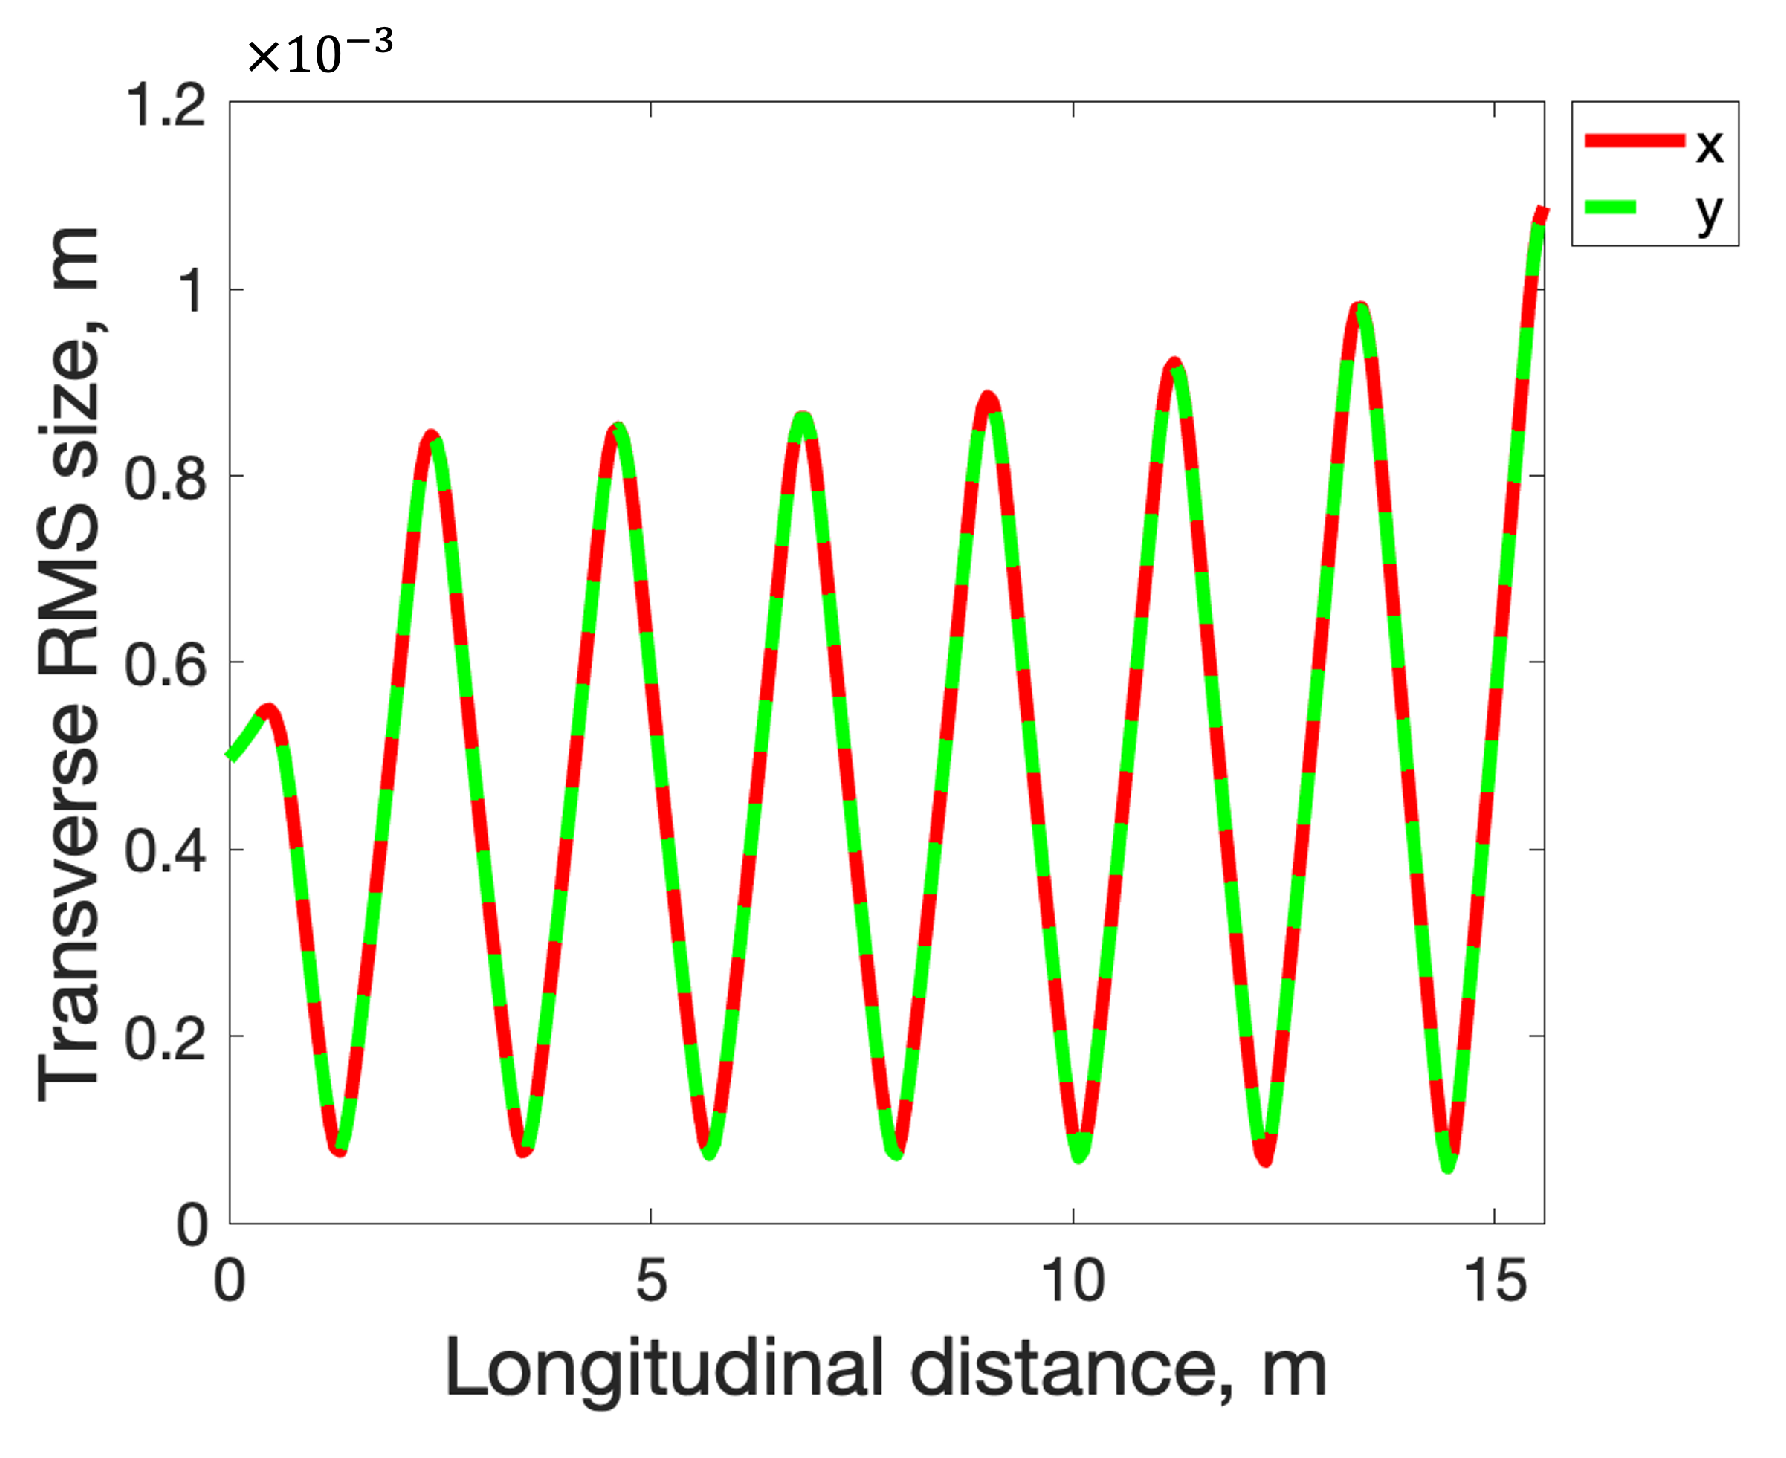
Figure 8 shows the RMS beam size evolution of the electron beam propagating through the PCI system.
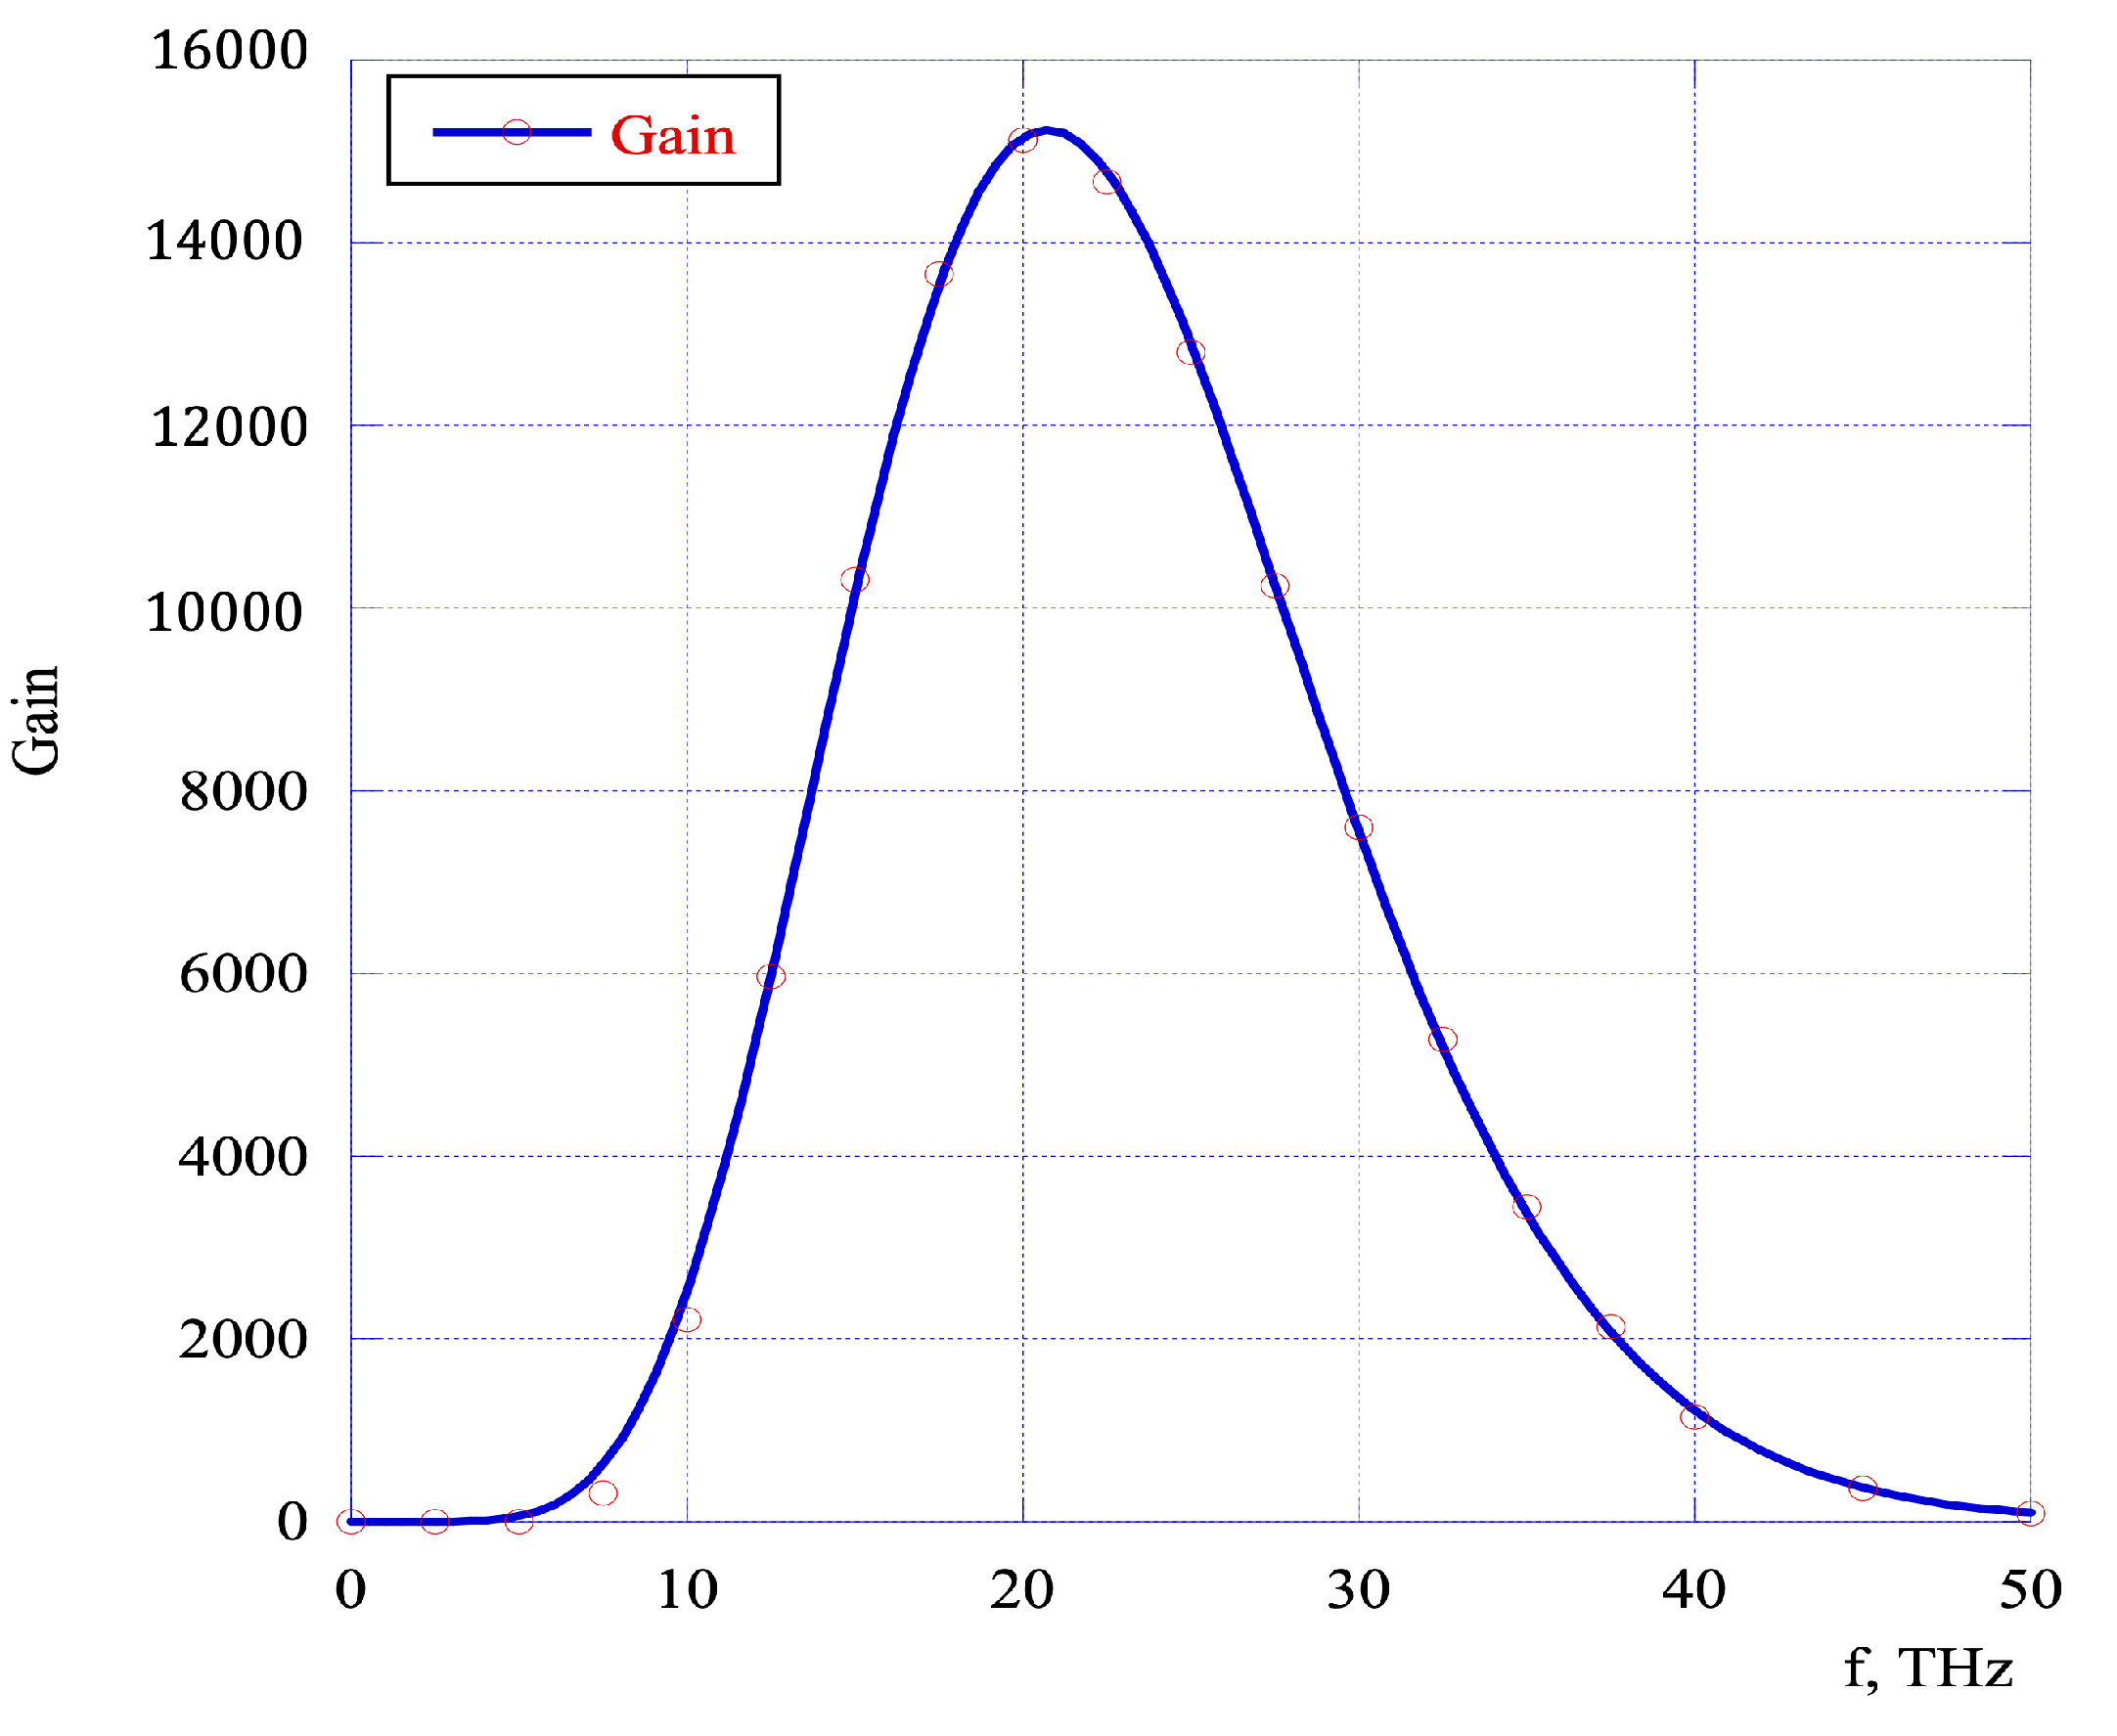
Figure 9 depicts the frequency dependence of the gain that the system would have for an infinitesimally small input signal in the absence of short noise. While this level of gain cannot be achieved in practice in this system, it represents the Fourier spectrum of the system’s Green function (14) and defines the central frequency and the bandwidth of the instability.
Hence, with a central frequency fc = 20.8 THz and a bandwidth ΔfG = 12.6 THz, according to Equation (16) one should expect that the maximum gain in this PCI system cannot exceed 1986 at a frequency of 20.8 THz and 993 at a frequency of 30 THz, as we numerically evaluated. According to this estimate, we expected to reach saturation in six–seven cells of the PCI system.
To explore saturation in the PCI system, we performed SPACE-code simulations for density modulation at a frequency of 30 THz. In these simulations, we used a representation number equal to one—where one computational particle represents one real electron—and random positions of the particles to obtain real Poisson noise in the beam sample. Similar to the FEL simulation, we performed two simulation runs to find the effect of shot noise on the seed signal. The first run was performed without an input signal, with the electron beam having random (Poisson) noise. In the second simulation run, we added a weak 30 THz density modulation to the shot noise distribution identical to the first run. The difference between density modulations in the two runs, recorded in various locations along the system, represents the evolution of the 30 THz seed system in the system. We used three different seeds of the shot noise in such simulations.
Figure 10 shows the gain evolution for a 30 THz initial signal along the PCI system. The observed maximum gain of the seed (towards the end of seven-cell PCI system) ranges from 558 to 1070 for different seeds. One thing worth noticing is that different random seeds have little influence on the gain of the signal before approaching saturation.
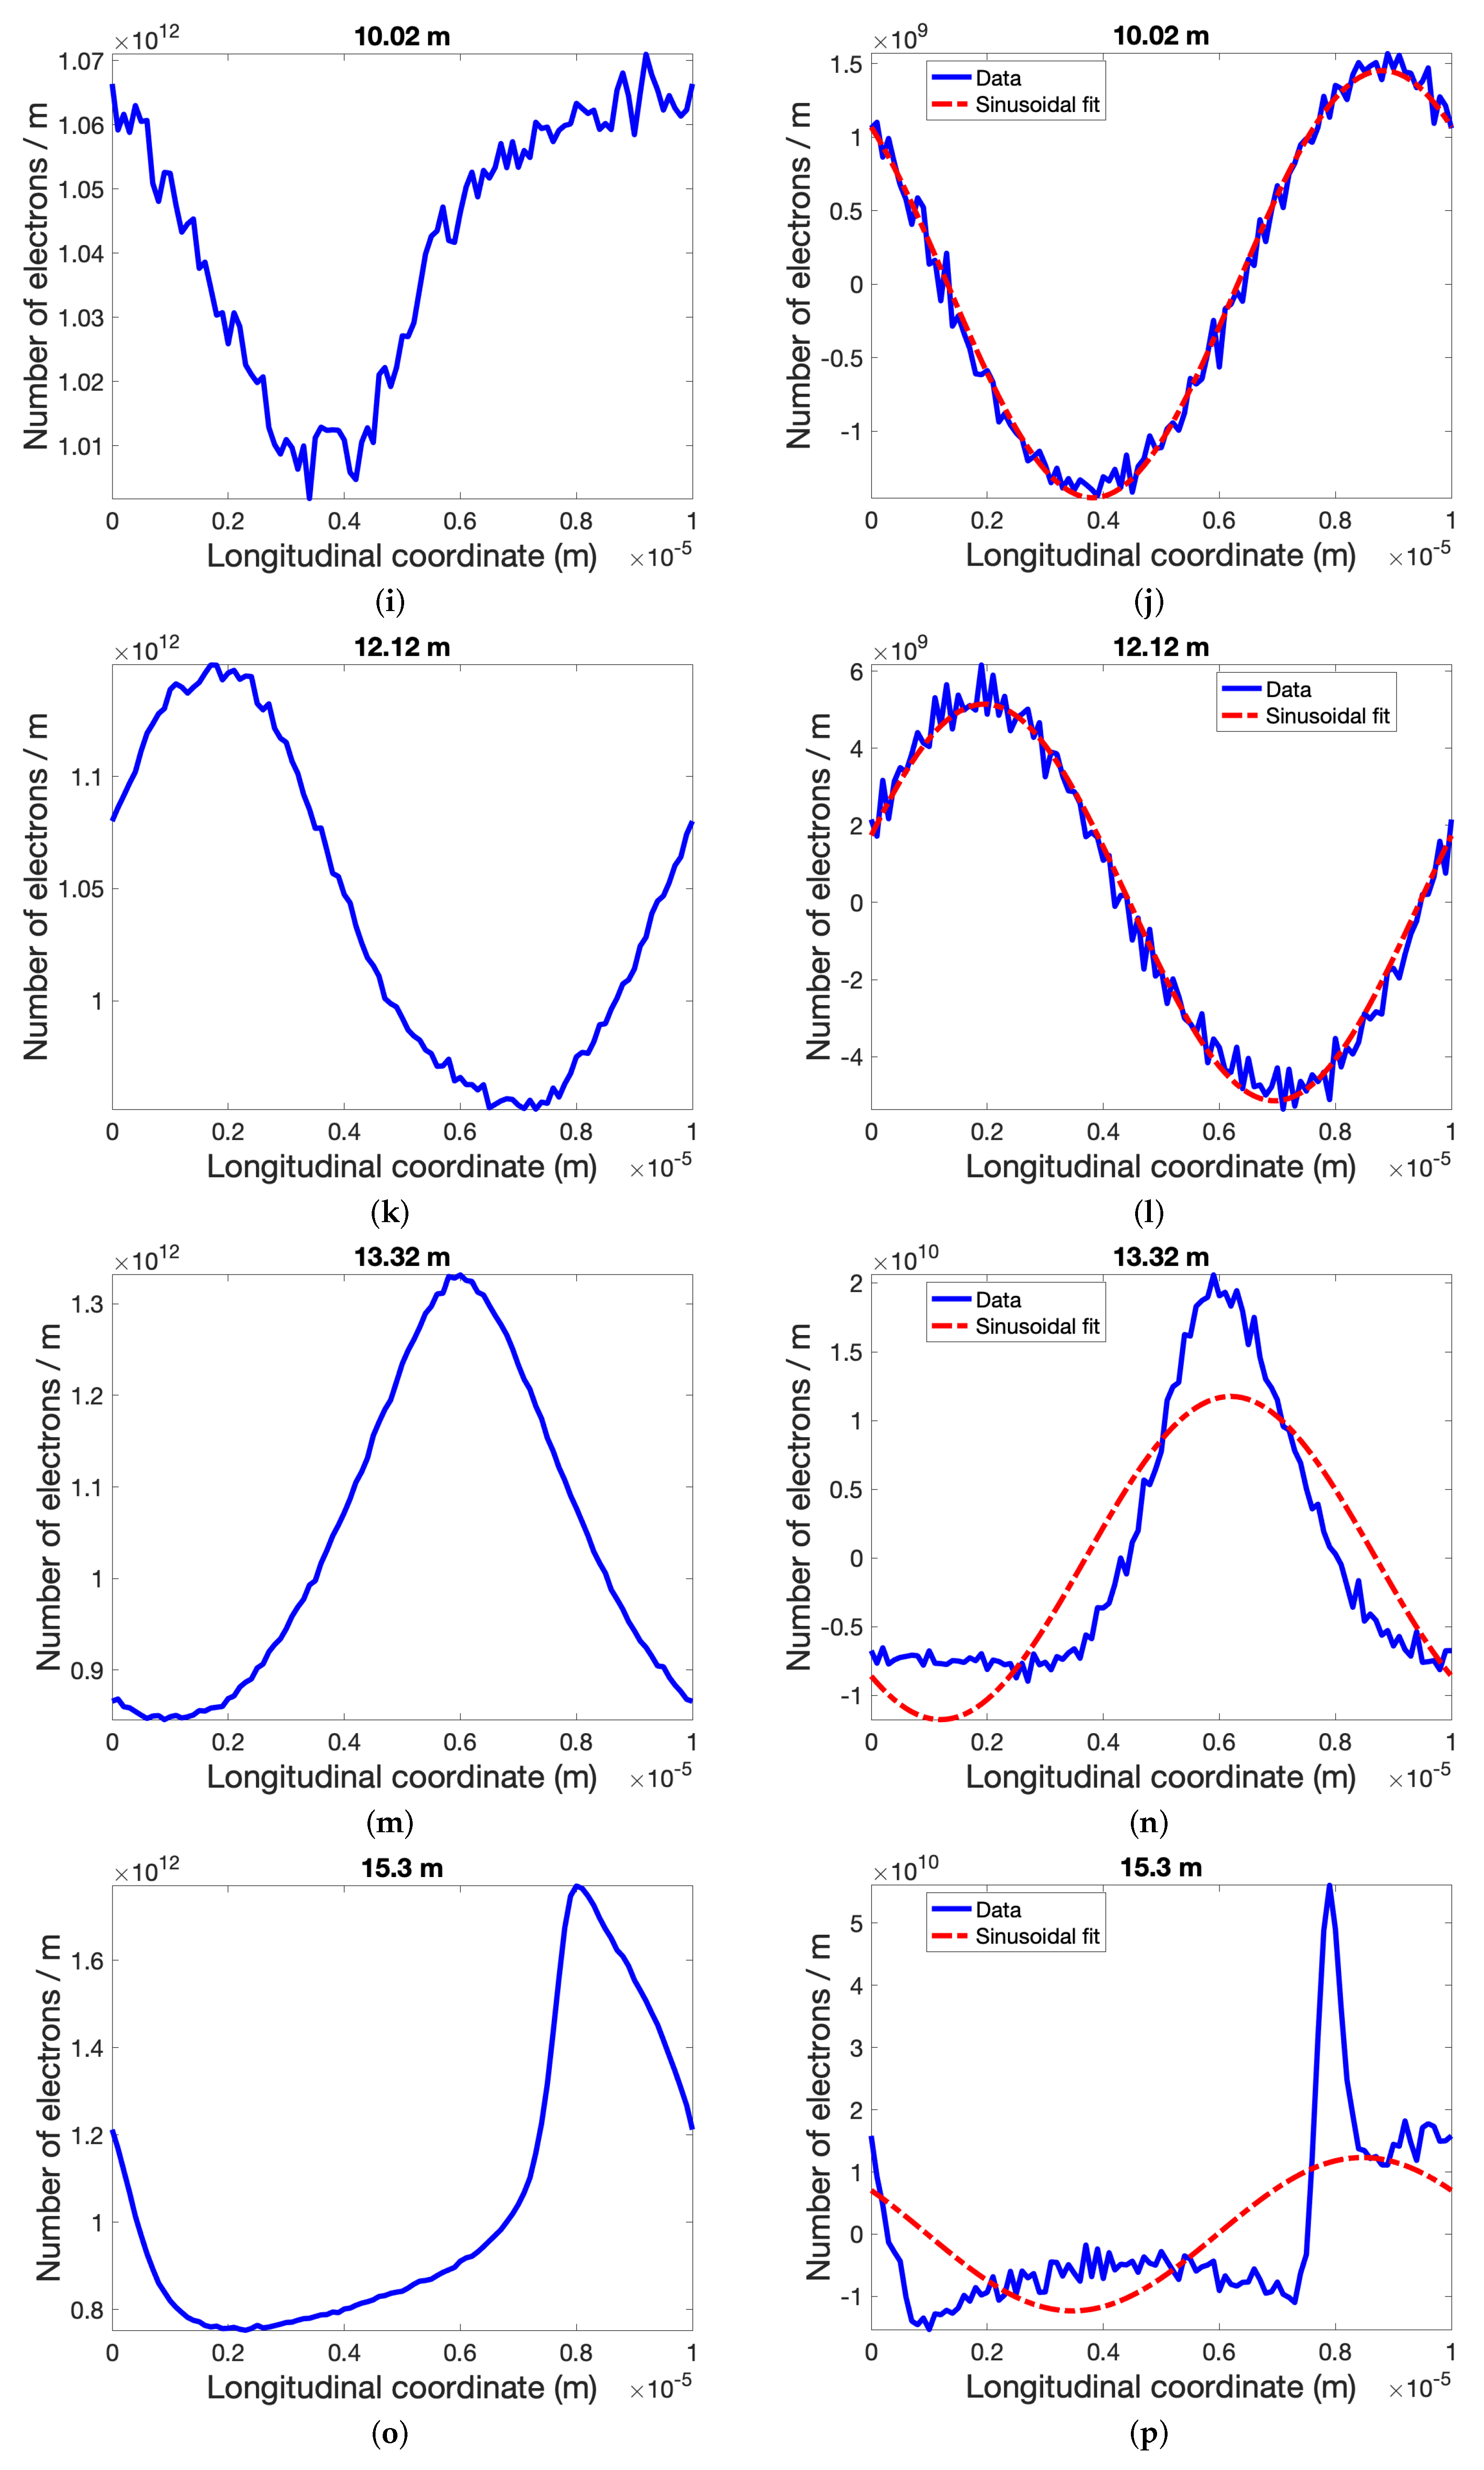
To detail how the density modulation evolves when saturation is close, we show the longitudinal density evolution resulting from the first sample of the shot noise (Figure 11, left) and that resulting from adding the 30 THz seed in (Figure 11, right). The sinusoidal seed shape of the signal is well maintained in the early stages, where the noise background is far from saturation. However, significant distortion of the input (seed) signal appears as early as the sixth cell of the PCI system. It becomes completely deformed after seven cells.
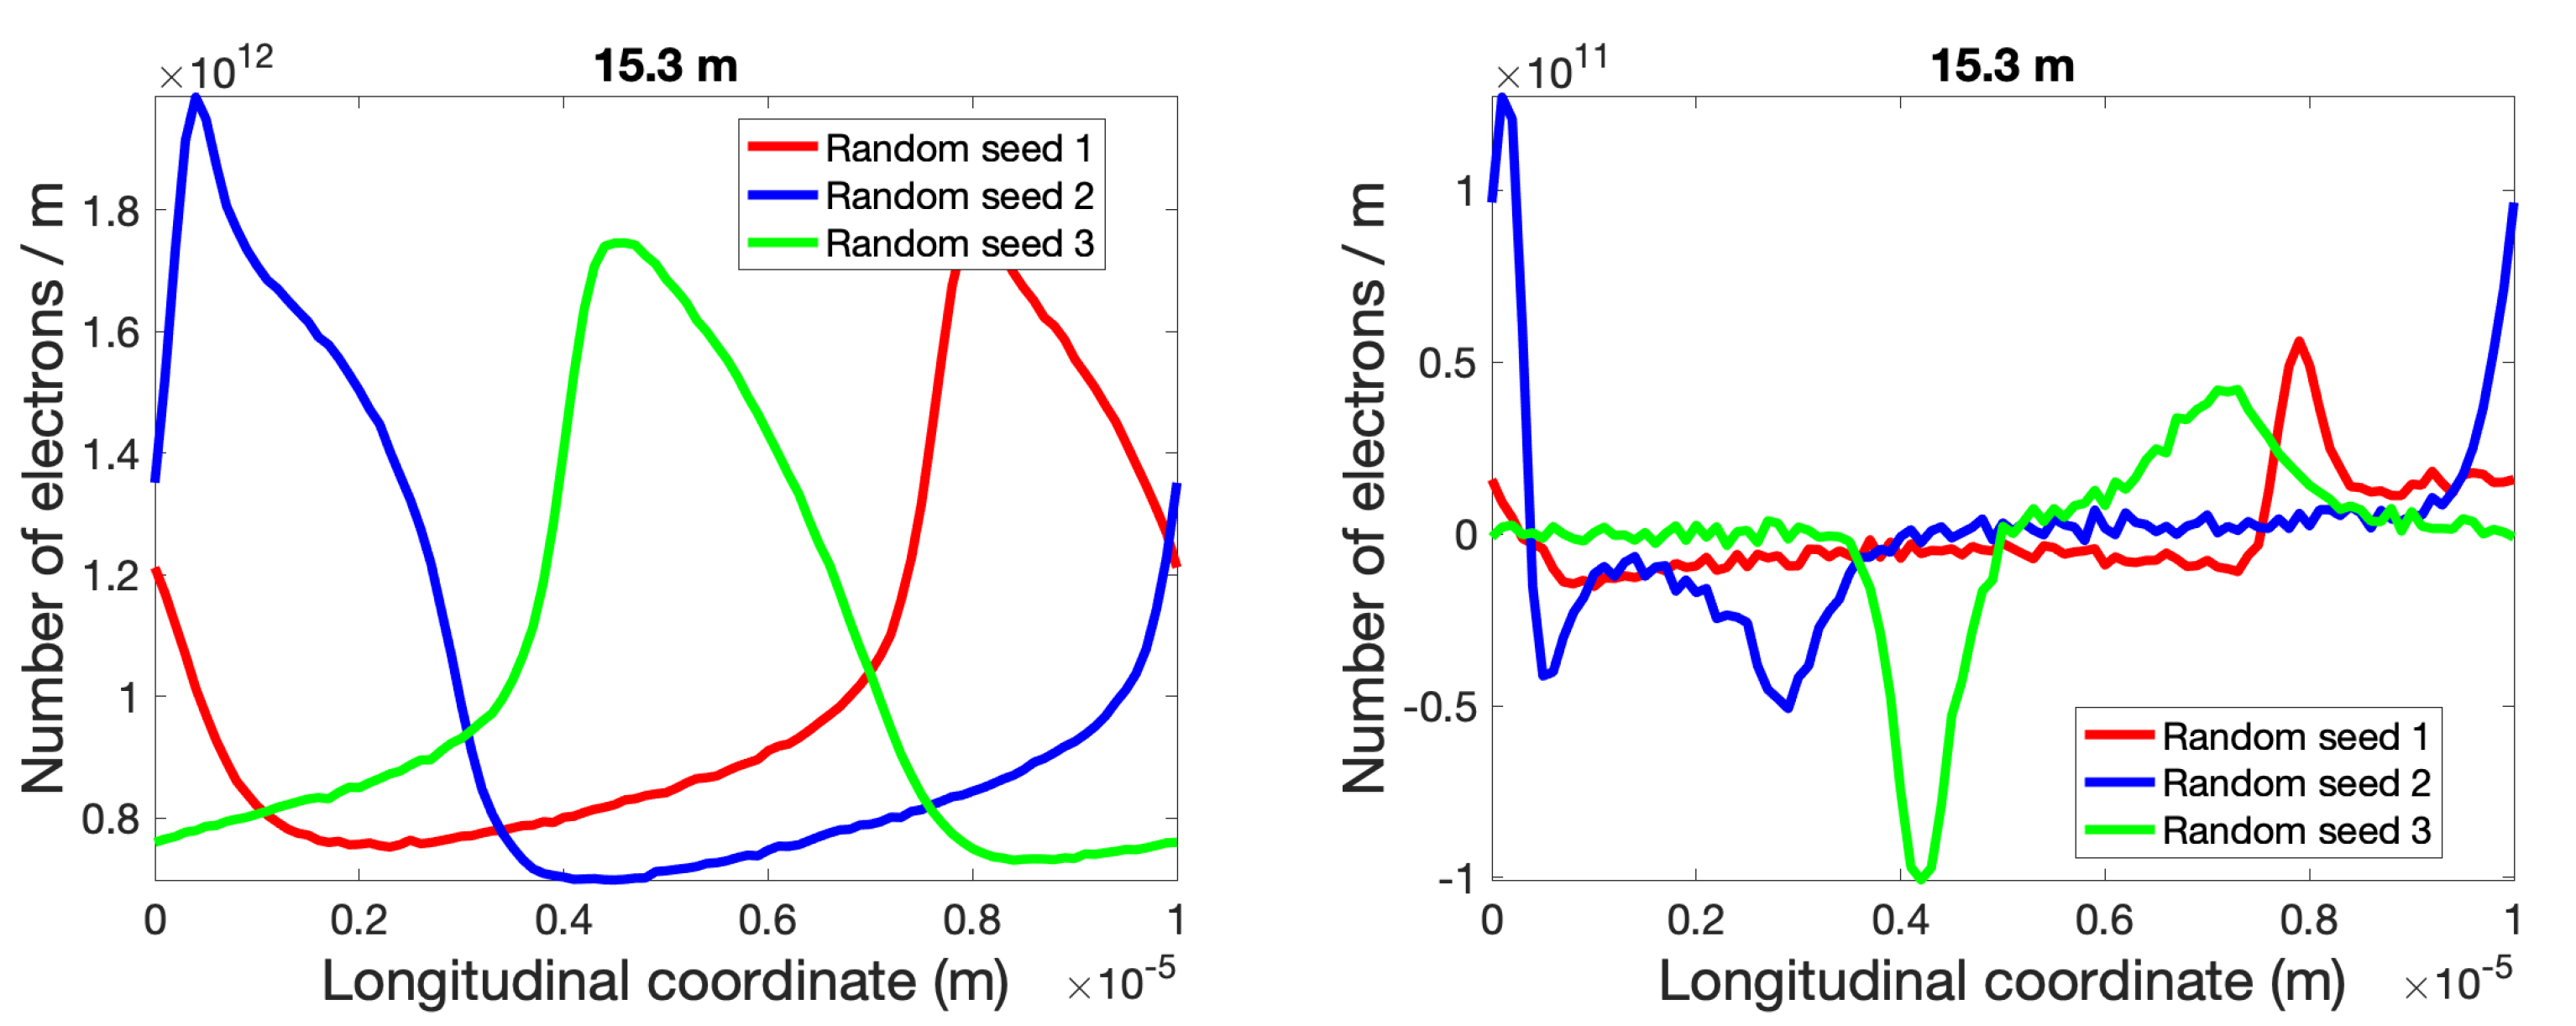
Similar to what has been discussed in the FEL case, it is important to note that we used a seed amplitude much smaller than that of the shot noise to avoid any non-linearity caused by the seed signal itself (Figure 11a,b). As depicted in Figure 11k, the seed signal is amplified without significant distortions until about s = 12 m in the PCI system. However, distortion of the amplified seed signal reaches approximately its amplitude at s = 13.3 m when the peak-to-peak density modulation caused by shot noise reaches or exceeds approximately 30% of the average density (see Figure 11m). The seed signal is completely distorted at s = 15.3 m, where the peak-to-peak density modulation reaches a value comparable to the average density (see Figure 11o).
To confirm that our observations are consistent, we observed the same behavior for all three random seeds of the shot noise. The amplified seed signal indeed preserves its shape at s = 12.12 m, where shot noise causes relative peak-to-peak density modulation from 18% to 25%. At the same time, the seed signal is completely distorted at s = 15.3 m, where noise-induced peak-to-peak density modulation is comparable to or even exceeds the average beam density. To be concise, we only include plots for distributions at s = 12.12 and s = 15.3 m for sets two and three in Figure 12 and Figure 13, respectively.
To summarize, we studied the evolution of a 30 THz sinusoidal signal in the PCI system with different random seeds for the background noise. The maximum gain we observed ranges from 558 to 1070 as compared to our theoretical prediction of 993. The background noise has little effect on the gain evolution until saturation is approached. While near saturation, significant distortions of the signal would occur when the relative peak-to-peak density modulation, caused by the beam noise, reaches approximately 30% of the average beam density.

4. Results and Discussion

We derived a set of equations for estimating the gain saturation of any 1D instability. It is quite remarkable that this simplified estimate compares favorably with the results of 3D simulations of FEL and PCIs.
Our numerical studies of the visible FEL amplifier as detailed above have shown that the maximum gain in bunching is limited to about twenty-seven (averaged over all thirty-two random seeds). We conducted a similar analysis for each of the other three FELs listed in Table 1 and found their maximum non-saturated gain as well as their correlation lengths. Table 3 compares these values with the estimates given by Equations (19)–(21).
In short, our FEL simulations are in agreement with our approximate Formula (21) for the maximum unsaturated gain. We repeated these simulations with thirty-two completely different sets of initial random noise to eliminate the possibility of the agreements being a result of a fortunate choice of random shot-noise sets. The average of all simulated gains with different random seeds was still consistent with our theoretical predictions.
For the case of a broad-band plasma-cascade instability at 30 THz, we developed dedicated 3D particle-in-cell simulation (using code SPACE) and found that the maximum gain ranges from 558 to 1070 for various random seeds. This result is in agreement with what our prediction of gain at 993 using Equation (16).
For a simplified 1D estimate, derived without accounting for many important 3D effects, the agreements are remarkably good.
Therefore, our derived estimations for the attainable linear gain using charged beam instabilities have quite good agreement with actual values for instabilities with both narrow and broad bandwidths. This is a reason why they can be used as a tool in investigating systems where linearity is essential, for example, coherent electron cooling or seeded FELs.
Nevertheless, it is also worth noticing that for high-fidelity amplification, the gain of such a system should be at least a factor 2 below the maximum values indicated by our estimation. In this case, the density modulation amplified noise is approximately 25% of the average density and the signal quality is preserved.
Since the noise in the beam plays a key role in the saturation and distortions of the input signal, Equations (19)–(21) can be extended to estimate the effect of increased noise in the beam:
| g τ | max 2.5 · 10 3 I [ A ] f c [ THz ] · σ ω ω c · P 0 ( ω c ) P b ( ω c ) ,
by adding the term for the noise power from the random (Poisson) distribution (P0) to that of the noise power in the real beam (Pb).

5. Conclusions

In this paper, we have derived simple formulas to estimate the maximum attainable gain in charged beam instabilities in the presence of shot noise. In addition to the peak current of the electron beam, a necessary parameter for this estimation is the correlation length of the amplifier response, the central frequency, and the bandwidth of the instability. We compared the estimation provided by the formula with direct 3D FEL and PCI simulations for various wavelengths using the Genesis code in the time-resolved mode. We observed quite good agreement between the simulations and our theoretical estimate.

Author Contributions

Conceptualization, V.N.L.; software, Y.J. (3D FEL simulations) and J.M. (simulations for plasma-cascade instability); methodology (extension of the theory of the concept to 3D case), G.W.; formal analysis, Y.J; writing---original draft preparation, validation, V.N.L. (Section 1 and Section 2), Y.J. (Section 3.1, Section 4 and Section 5), J.M. (Section 3.2), and G.W. (Appendix A); writing---review and editing, Y.J. All authors have read and agreed to the published version of the manuscript.

Funding

This work was supported by Brookhaven Science Associates, LLC under Contract No. DE-SC0012704 with the U.S. Department of Energy and by the NSF Grant No. PHY-1415252.

Data Availability Statement

The data presented in this study are available on request from the corresponding author due to local data sharing policy imposed by government run agency.

Conflicts of Interest

The authors declare no conflict of interest.

Appendix A. Extension for the 6D Phase Space

The phase space distribution of an electron beam can be expressed as a sum of its delta functions, i.e.,
f ˜ ( x , p , t ) = i = 1 N e δ x x i ( t ) δ p p i ( t ) .
Let the expectation value of the distribution function after ensemble average be f ¯ ( x , p , t ) , which usually is a smooth function. At the starting time, t = t 0 , each 6D delta function in the sum of Equation (A1) represents a perturbation to the ensemble of averaged initial distributions, f ¯ ( x , p , t 0 ) . We describe the perturbation of electron density induced by a point-like perturbation by the Green function, i.e.,
δ x x i ( t 0 ) δ p p i ( t 0 ) δ x X i ( t ) δ p P i ( t ) + G x , x i ( t 0 , p , p i ( t 0 ) , t t 0 ) ,
where X i ( t ) and P i ( t ) are the trajectories of the electron in the absence of the interaction that causes instability, and hence, the unperturbed distribution is given by
f ˜ 0 ( x , p , t ) = i = 1 N e δ x X i ( t ) δ p P i ( t ) .
Thus, the phase-space distribution at a later time, t > t 0 , is given by
f ˜ ( x , p , t ) = i = 1 N e δ x x i ( t ) δ p p i ( t ) = f ˜ 0 ( x , p , t ) + i = 1 N e G x , x i ( t 0 ) , p , p i ( t 0 ) , t t 0 .
Integrating Equation (A4) over the whole volume of phase space leads to
i = 1 N e G x , x i t 0 , p , p i t 0 , t t 0 d 3 x d 3 p = 0 .
Assuming there is no correlation between any two electrons, Equation (A5) is reduced to
G x , x i t 0 , p , p i t 0 , t t 0 d 3 x d 3 p = 0 ,
for any x i t 0 and p i t 0 . According to Equation (A4), the perturbation in the density of the electron phase-space due to the instability can be written as
δ f ˜ ( x , p , t ) f ˜ ( x , p , t ) f ˜ 0 ( x , p , t ) = i = 1 N e G x , x i t 0 , p , p i t 0 , t t 0 .
Requiring the amplitude of RMS perturbation amplitude to be smaller than the unperturbed phase-space density leads to
δ f ˜ x , p , t 2 = i = 1 N e G x , x i t 0 , p , p i t 0 , t t 0 2 = i , j = 1 N e G Γ , Γ i t 0 , t t 0 2 < f ˜ 0 x , p , t 2 ,
with Γ representing a 6D phase-space vector, and the angle brackets denote the ensemble’s average. The summation in Equation (A8) can be written as
i , j = 1 N e G Γ , Γ i t 0 , t t 0 2 = G Γ , ξ , t t 0 f ˜ ξ , t 0 d 6 ξ 2 = G Γ , ξ , t t 0 f ¯ ξ , t 0 d 6 ξ + G Γ , ξ , t t 0 δ f ˜ ξ , t 0 d 6 ξ 2 = G Γ , ξ , t t 0 f ¯ ξ , t 0 d 6 ξ 2 + G Γ , ξ , t t 0 δ f ˜ ξ , t 0 d 6 ξ 2 + 2 G Γ , ξ , t t 0 f ¯ ξ , t 0 d 6 ξ G Γ , ξ , t t 0 δ f ˜ ξ , t 0 d 6 ξ .
Taking the ensemble average of Equation (A6) yields
i , j = 1 N e G Γ , Γ i ( t 0 ) , t Γ 0 2 = G r , ξ , t t 0 f ¯ ξ , t 0 d 6 ξ 2 + G r , ξ , t t 0 δ f ˜ ξ , t 0 d 6 ξ 2 .
Writing the integral inside the second term on the right-hand side of Equation (A10) as a sum over the phase-space volume, i.e.,
G Γ , ξ , t t 0 δ f ˜ ξ , t 0 d 6 ξ = i = 1 G Γ , ξ i , t t 0 δ f ˜ ξ i , t 0 Δ ξ ,
with Δξ being an infinitesimal phase-space volume, then the second term in the right-hand side of Equation (A10) can be written as
G Γ , ξ , t t 0 δ f ˜ ξ , t 0 d 6 ξ 2 = i , j = 1 G Γ , ξ i , t t 0 G Γ , ξ j , t t 0 δ f ˜ ξ j , t 0 δ f ˜ ξ i , t 0 Δ ξ Δ ξ = i , j = 1 G Γ , ξ i , t t 0 G Γ , ξ j , t t 0 δ n ˜ ξ j , t 0 δ n ˜ ξ i , t 0 .
Since there is no correlation between two-phase space volume at different locations, the following relationship holds:
δ n ˜ ( ξ j , t 0 ) δ n ˜ ( ξ i , t 0 ) = δ n ˜ ( ξ i , t 0 ) 2 δ i , j = n ˜ ( ξ i , t 0 ) δ i , j ,
and hence, Equation (A12) becomes
G Γ , ξ , t t 0 δ f ˜ ξ , t 0 d 6 ξ 2 = i = 1 G Γ , ξ i , t t 0 2 n ˜ ξ i , t 0 = i = 1 G Γ , ξ i , t t 0 2 f ¯ ξ i , t 0 Δ ξ = G ( Γ , ξ , t t 0 ) 2 f ¯ ( ξ , t 0 ) d 6 ξ ,
where we used the law of random events (Poisson distribution) in obtaining the second line of Equation (A13). Making use of Equations (A10) and (A14), the ensemble average of Equation (A8) leads to
G x , x 0 , p , p 0 , t t 0 f ¯ x 0 , p 0 , t 0 d 3 x 0 d 3 p 0 2 + [ G ( x , x 0 , p , p 0 , t t 0 ) ] 2 f ¯ ( x 0 , p 0 , t 0 ) d 3 x 0 d 3 p 0 < f ¯ 0 ( x , p , t ) 2 .
For a uniform electron-distribution, the first term on the right-hand side of Equation (A15) vanishes due to Equation (A6), and we arrive at
[ G x , x 0 , p , p 0 , t t 0 ] 2 d 3 x 0 d 3 p 0 < f ¯ 0 ( x , p , t ) .
Defining a characteristic phase-space volume as
Γ c G x , x 0 , p , p 0 , t t 0 2 d 3 x 0 d 3 p 0 | G t t 0 | max 2 ,
Equation (A16) can be re-written as
G t t 0 max < f ¯ 0 ( x , p , t ) Γ c .
Equation (A18) suggests that the maximal amplitude of the Green function is proportional to the square root of the electron density of the phase space, and inversely proportional to the square root of the coherence volume.
Assuming G x , x 0 , p , p 0 , t t 0 is much wider than the beam in all five dimensions except for the longitudinal one, one can approximate it by a constant over the area occupied by the beam, i.e.,
G ( x , x 0 , p , p 0 , t t 0 ) G ( x b , x 0 , z , z 0 , p b , p 0 , t t 0 ) G b ( z , z 0 , t t 0 ) ,
where x b and p b are the average coordinates of electrons at location z. Using Equation (A19), Equation (A15) reduces to
G b z , z 0 , t t 0 ρ ¯ z 0 , t 0 d z 0 2 + G b z , z 0 , t t 0 2 ρ ¯ ( z 0 , t 0 ) d z 0 < f ¯ 0 x , p , t 2 .
Assuming ρ ¯ ( z 0 , t 0 ) is uniform, and using Equations (A6) and (A19), the first term in Equation (A20) is
ρ ¯ t 0 2 G b z , z 0 , t t 0 d z 0 2 0 ,
and one arrives at the criteria for a directional instability:
[ G b ( z , z 0 , t t 0 ) ] 2 ρ ¯ ( z 0 , t 0 ) d z 0 f ¯ 0 ( x , p , t ) 2 .
Taking the square-root of both sides of Equation (A22) and integrating over all the dimensions except for the longitudinal one yields
Γ 5 G b z , z 0 , t t 0 2 ρ ¯ z 0 , t 0 d z 0 < ρ ¯ 0 ( x , p , t ) .
Taking the square of both sides of Equation (A23) gives:
G 1 d z , z 0 , t t 0 2 ρ ¯ z 0 , t 0 d z 0 < ρ ¯ 0 ( x , p , t ) 2 ,
where we have defined the 1D Green function as
G 1 d z , z 0 , t t 0 G b ( z , z 0 , t t 0 ) Γ 5 = G b ( x b , x 0 , p , p 0 , z , z 0 , t t 0 ) Γ 5 .

References

  1. Dattoli, G.; Renieri, A.; Voykov, G. Storage-ring free-electron-laser amplifiers and the microwave instability. Phys. Rev. E 1997, 55, 2056–2058. [Google Scholar] [CrossRef]
  2. Saldin, E.L.; Schneidmiller, E.A.; Yurkov, M.V. An analytical description of longitudinal phase space distortions in magnetic bunch compressors. Nucl. Istrum. Meth. Phys. Res. A Accel. Spectrom. Detect. Assoc. Equip. 2002, 483, 516–520. [Google Scholar] [CrossRef]
  3. Huang, Z.; Borland, M.; Emma, P.; Wu, J.; Limborg, C.; Stupakov, G.; Welch, J. Suppression of microbunching instability in the linac coherent light source. Phys. Rev. Spec. Top. Accel. Beams 2004, 7, 074401. [Google Scholar] [CrossRef]
  4. Madey, J.M.J. Stimulated emission of bremsstrahlung in a periodic magnetic field. J. Appl. Phys. 1971, 42, 1906–1913. [Google Scholar] [CrossRef]
  5. Saldin, E.L.; Schneidmiller, E.A.; Yurkov, M.V. The physics of free electron lasers. An introduction. Phys. Rep. 1995, 260, 187–327. [Google Scholar] [CrossRef]
  6. Yu, L.-H.; Babzien, M.; Ben-Zvi, I.; Dimauro, L.F.; Doyuran, A.; Graves, W.; Johnson, E.; Krinsky, S.; Malone, R.; Pogorelsky, I.; et al. High-gain harmonic-generation free-electron laser. Science 2000, 289, 932–934. [Google Scholar] [CrossRef] [PubMed]
  7. Krinsky, S. The physics and properties of free-electron lasers. AIP Conf. Proc. 2002, 648, 23–43. [Google Scholar] [CrossRef]
  8. Huang, Z.; Kim, K.-J. Review of x-ray free-electron laser theory. Phys. Rev. Spec. Top. Accel. Beams 2007, 10, 034801. [Google Scholar] [CrossRef]
  9. Amann, J.; Berg, W.; Blank, V.; Decker, F.-J.; Ding, Y.; Emma, P.; Feng, Y.; Frisch, J.; Fritz, D.; Hastings, J.; et al. Demonstration of self-seeding in a hard-X-ray free-electron laser. Nat. Photon. 2012, 6, 693–698. [Google Scholar] [CrossRef]
  10. Derbenev, Y.S.; Rossbach, J.; Saldin, E.L.; Shiltsev, V.D. Microbunch Radiative Tail-Head Interaction; Report TESLA-FEL-95-05; DESY: Hamburg, Germany, 1995; Available online: http://cds.cern.ch/record/291102 (accessed on 2 March 2024).
  11. Saldin, E.L.; Schneidmiller, E.A.; Yurkov, M.V. On the coherent radiation of an electron bunch moving in an arc of a circle. Nucl. Istrum. Meth. Phys. Res. A Accel. Spectrom. Detect. Assoc. 1997, 398, 373–394. [Google Scholar] [CrossRef]
  12. Heifets, S.; Stupakov, G.V.; Krinsky, S. Coherent synchrotron radiation instability in a bunch compressor. Phys. Rev. Spec. Top. Accel. Beams 2002, 5, 064401. [Google Scholar] [CrossRef]
  13. Saldin, E.L.; Schneidmiller, E.A.; Yurkov, M.V. Klystron instability of a relativistic electron beam in a bunch compressor. Nucl. Istrum. Meth. Phys. Res. A Accel. Spectrom. Detect. Assoc. Equip. 2002, 490, 1–8. [Google Scholar] [CrossRef]
  14. Huang, Z.; Kim, K.-J. Formulas for coherent synchrotron radiation microbunching in a bunch compressor chicane. Phys. Rev. Spec. Top. Accel. Beams 2002, 5, 074401. [Google Scholar] [CrossRef]
  15. Litvinenko, V.N.; Derbenev, Y.S. Coherent electron cooling. Phys. Rev. Lett. 2009, 102, 114801. [Google Scholar] [CrossRef] [PubMed]
  16. Ratner, D. Microbunched electron cooling for high-energy hadron beams. Phys. Rev. Lett. 2013, 111, 084802. [Google Scholar] [CrossRef] [PubMed]
  17. Litvinenko, V.N.; Wang, G.; Kayran, D.; Jing, Y.; Ma, J.; Pinayev, I. Plasma-cascade micro-bunching amplifier and coherent electron cooling of a hadron beams. arXiv 2018, arXiv:1802.08677. [Google Scholar] [CrossRef]
  18. Stupakov, G. Cooling rate for microbunched electron cooling without amplification. Phys. Rev. Accel. Beams 2018, 21, 114402. [Google Scholar] [CrossRef]
  19. Stupakov, G.; Baxevanis, P. Microbunched electron cooling with amplification cascades. Phys. Rev. Accel. Beams 2019, 22, 034401. [Google Scholar] [CrossRef]
  20. Litvinenko, V.N.; Jing, Y.; Kayran, D.; Inacker, P.; Ma, J.; Miller, T.; Petrushina, I.; Pinayev, I.; Shih, K.; Wang, G.; et al. Plasma-cascade instability. Phys. Rev. Accel. Beams 2021, 24, 014402. [Google Scholar] [CrossRef]
  21. Litvinenko, V.N.; Jing, Y.; Ma, J.; Petrushina, I.; Shih, K.; Wang, G. 3D theory of microscopic instabilities driven by space-charge forces. Phys. Rev. Accel. Beams 2023, 26, 054402. [Google Scholar] [CrossRef]
  22. Saldin, E.L.; Schneidermiller, E.A.; Yurkov, M.V. The Physics of FELs; Springer: Berlin/Heidelberg, Germany, 2000. [Google Scholar] [CrossRef]
  23. Vlasov, A.A. On vibration properties of electron gas. Zh. Experim. Teor. Fiz. [J. Exp. Theor. Phys.] 1938, 8, 291–318. (In Russian) [Google Scholar]
  24. Vlasov, A.A. The vibrational properties of an electron gas. Sov. Phys. Usp. 1968, 10, 721–733. [Google Scholar] [CrossRef]
  25. Lee, H.J. Fundamentals of Theoretical Plasma Physics. Mathematical Description of Plasma Waves; World Scientific: Singapore, 2019. [Google Scholar] [CrossRef]
  26. Landau, L. On the vibrations of the electronic plasma. J. Phys. (USSR) 1946, 10, 25–34, Reprinted in Collected Papers of L.D. Landau; Ter Haar, D., Ed.; Pergamon Press Ltd.: London, UK and Gordon and Breach, Science Publishers, Inc.: New York, NY, USA; pp. 445–460. [Google Scholar] [CrossRef]
  27. Van Kampen, N.G. On the theory of stationary waves in plasma. Physica 1955, 21, 949–963. [Google Scholar] [CrossRef]
  28. Larsson, J. Hermitian structure for the linearized Vlasov–Poisson and Vlasov–Maxwell equations. Phys. Rev. Lett. 1991, 66, 1466–1468. [Google Scholar] [CrossRef] [PubMed]
  29. Van Kampen, N.G.; Felderhof, B.U. Theoretical Methods in Plasma Physics; North-Holland Publishing, Co.: Amsterdam, The Netherlands; John Wiley & Sons, Inc.: New York, NY, USA, 1967; Available online: https://archive.org/details/theoreticalmetho0000kamp/ (accessed on 2 March 2024).
  30. Abraham-Shrauner, B. Lie transformation group solutions nonlinear one-dimensional Vlasov equation. J. Math. Phys. 1985, 26, 1428–1435. [Google Scholar] [CrossRef]
  31. Kheifets, S. Application of the Green’s function method to some nonlinear problems of an electron storage ring. Part IV. Study of a weak beam interaction with a flat strong beam. Part. Accel. 1984, 15, 153–175. Available online: https://inspirehep.net/literature/191782 (accessed on 2 March 2024).
  32. Duffy, D.G. Green’s Functions with Applications; Chapman & Hall/CRC//Taylor & Francis Group: Boca Raton, FL, USA, 2018. [Google Scholar] [CrossRef]
  33. Kac, M. Statistical Independence on Probability, Number Theory and Analysis; The Mathematical Association of America: Washington, DC, USA, 1959; Available online: https://www.jstor.org/stable/10.4169/j.ctt5hh8tq (accessed on 2 March 2024).
  34. Klimontovich, Y.L. Kinetic Theory of Nonideal Gases and Nonideal Plasmas; Pergamon Press Ltd.: Oxford, UK, 1982. [Google Scholar] [CrossRef]
  35. Klimontovich, Y.L. The Kinetic Theory of Electromagnetic Processes; Springer: Berlin/Heidelberg, Germany, 2011. [Google Scholar]
  36. Reiche, S. Genesis 1.3. Available online: http://genesis.web.psi.ch/ (accessed on 2 March 2024).
  37. Milton, S.V.; Gluskin, E.; Arnold, N.D.; Benson, C.; Berg, W.; Biedron, S.G.; Borland, M.; Chae, Y.-C.; Dejus, R.J.; Den Hartog, P.K.; et al. Exponential gain and saturation of a self-amplified spontaneous emission free-electron laser. Science 2001, 292, 2037–2041. [Google Scholar] [CrossRef]
  38. Yu, K.; Kumar, P.; Yuan, S.; Cheng, A.; Samulyak, R. SPACE: 3D parallel solvers for Vlasov–Maxwell and Vlasov–Poisson equations for relativistic plasmas with atomic transformations. Comput. Phys. Commun. 2022, 277, 108396. [Google Scholar] [CrossRef]
  39. Ma, J.; Wang, X.; Wang, G.; Yu, K.; Samulyak, R.; Litvinenko, V. Simulation studies of modulator for coherent electron cooling. Phys. Rev. Accel. Beams 2018, 21, 111001. [Google Scholar] [CrossRef]
  40. Ma, J.; Wang, G.; Litvinenko, V. Simulations of coherent electron cooling with two types of amplifiers. Int. J. Mod. Phys. A 2019, 34, 1942029. [Google Scholar] [CrossRef]
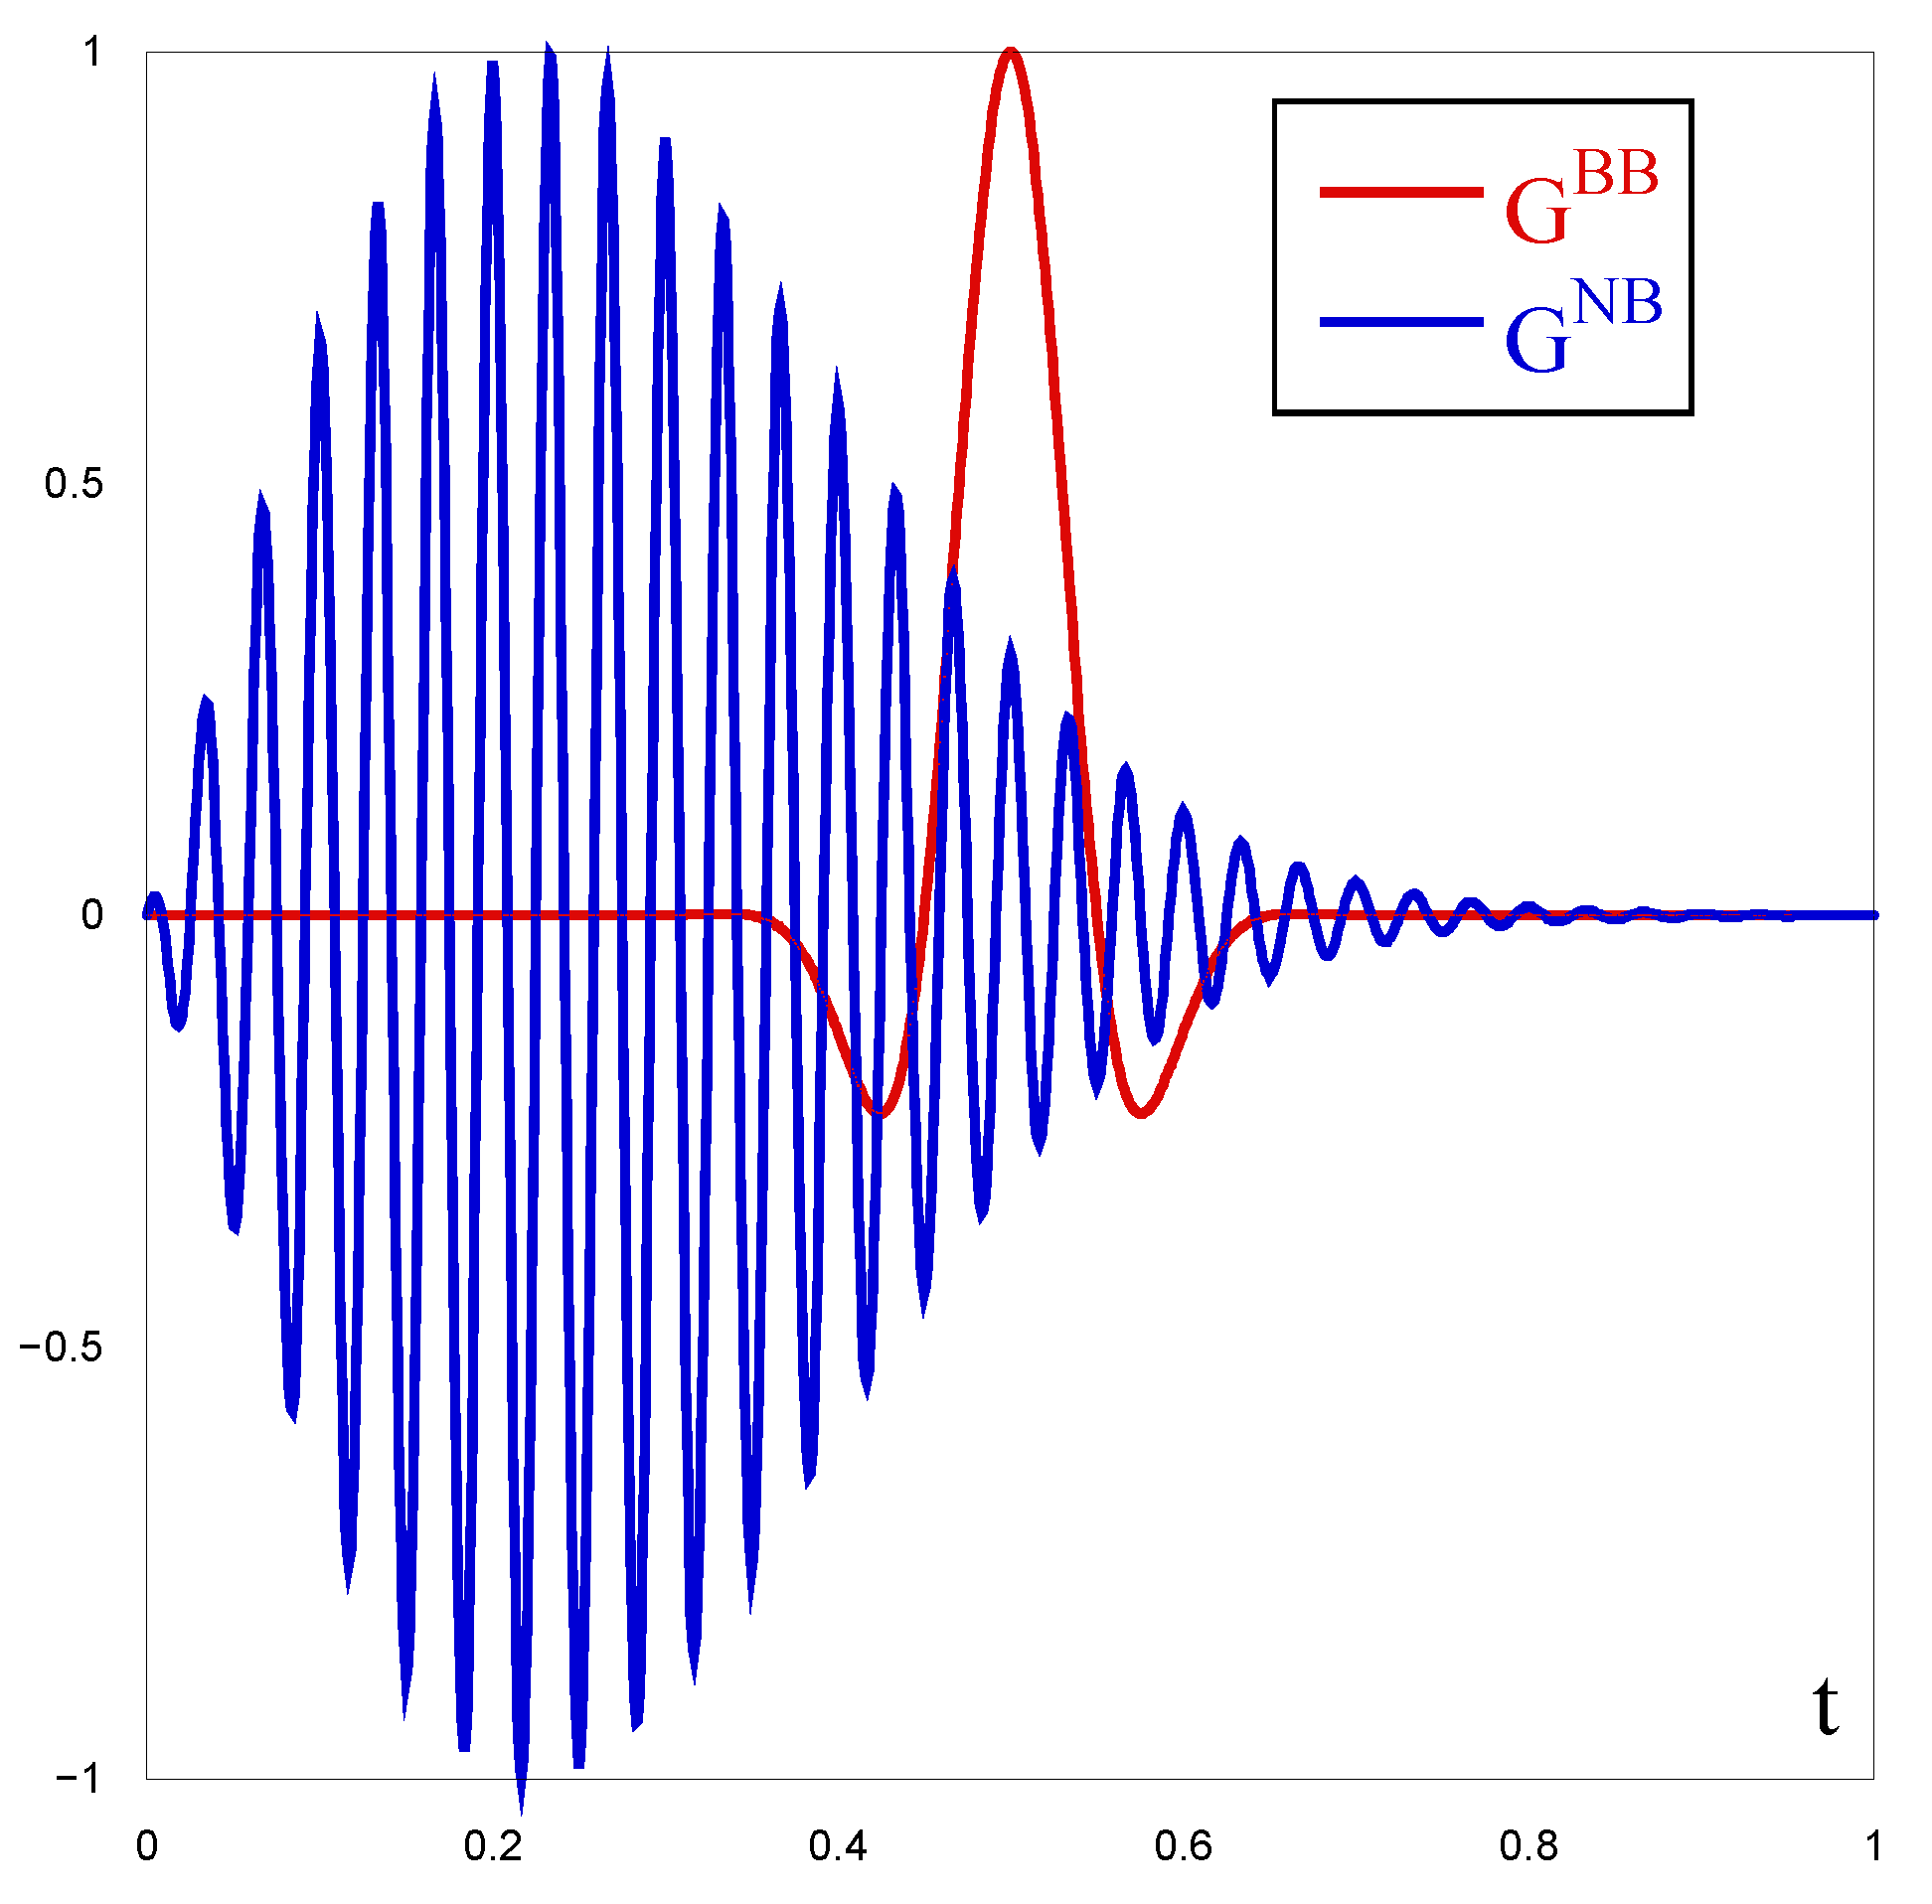
Figure 1. Schemtic picture of the time dependence of the Green functions for broad-band ( σ ω ω c , red line) and narrow-band ( σ ω ω c , blue line) instabilities. ωc is the central frequency of the instability. Horizontal and vertical scales chosen for illustrative purposes.
Physics 06 00057 g001
Figure 2. Evolution of FEL response to a δ-function-like perturbation without shot noise. FEL response grows exponentially after initial stage where slippage occurs to transfer bunching information from initial seed (located in middle of bunch) forward.
Physics 06 00057 g002
Figure 3. Evolution of amplitudes of bunching factor in visible FEL amplifier (averaged over bunch for thirty-two random shot-noise seeds): evolution of total bunching factor’s amplitude, originating from shot noise (in green) and evolution of FEL response to a δ-function-like perturbation (in red). Peak value of FEL response (18) is plotted as a function of its longitudinal position in FEL.
Physics 06 00057 g003
Figure 4. Phase of peak of FEL response (23)—average phase (red) and RMS phase variation (green)—as a function of position in FEL wiggler. Thirty-two random sets of shot noise were used to generate data.
Physics 06 00057 g004
Figure 5. Amplitudes of FEL response as a function of s (see Equation (24)), expressed in units of FEL wavelength (wavelets). Responses are calculated for different locations in the FEL as indicated.
Physics 06 00057 g005
Figure 6. Bunching as a function of wavelet (slice) number at four locations in FEL wiggler: (a) near entrance (s = 0.6 m) (where initial δ-function-like perturbation is placed at middle of bunch), (b) at s = 11.4 m (where amplitude of response is about to overtake initial perturbation), (c) at onset of saturation, at s = 19.8 m, and (d) at s = 22.0 m, well into saturation phase. We used thirty-two random shot noise seeds to derive average and RMS values. Red color indicates average value of the amplitude. Green color shows RMS spread of bunching amplitudes.
Physics 06 00057 g006
Figure 7. Schematic of plasma-cascade instability (PCI) system beamline, where electron beam (in red) traverses through eight strong solenoids (in blue).
Physics 06 00057 g007
Figure 8. RMS beam size evolution in PCI system. Typical ratio between beam sizes in focusing solenoids and in waists is approximately 10. This results in an approximately 10-fold modulation of plasma frequency [20].
Physics 06 00057 g008
Figure 9. Unsaturated gain curve for seven-cell PCI system. Peak gain is 15,190 at frequency fc = 20.8 THz and bandwidth ΔfG = 12.6 THz.
Physics 06 00057 g009
Figure 10. Evolution of 30 THz signal density modulation amplitude in seven-cell PCI system for three random noise seeds.
Physics 06 00057 g010
Figure 11. Evolution of longitudinal density distribution with average electron density of n0 = 1.04 × 10¹² m−1 and sample of shot noise (left), and result from initial 30 THz density modulation (right, in presence of noise) for different locations as indicated. Top: initial density distributions. Considering the oscillating nature of density modulation amplitude in PCI [20], we selected locations where seed signal has maximum amplitudes. Red dashed-dotted curves in signal evolution are sinusoidal fits which indicate shape of initial signal. Distortion is identified when signal shape strongly deviates from sinusoidal fit (when s > 12.12 m).
Physics 06 00057 g011aPhysics 06 00057 g011b
Figure 12. Longitudinal density distributions at s = 12.12 m for three random samples of shot noise of amplified shot noise (left) and from initial 30 THz density modulation (right). Signal shape is preserved, although shot noise’s density modulation fluctuates due to different random seeds.
Physics 06 00057 g012
Figure 13. Longitudinal density distributions at s = 15.3 m for three random samples of shot noise. of amplified shot noise (left) and from initial 30 THz density modulation (right). Signal’s shape fluctuates significantly when shot noise is approaching saturation, i.e., peak-to-peak density modulation is close to average beam density. It is also worth noticing that one can find correlation between locations of peaks in amplified shot noise and distortions of the signal.
Physics 06 00057 g013
Table 1. Parameters for FEL simulation. See text for details.
ParametersFEL Type
InfraredVisibleVUVHard X-rays
Beam energy (MeV)21.81363812.313,643.7
Beam current (peak, A)10010303400
Normalized emittance (μm rad)5111.2
Momentum spread (σp/p)1 × 10−31.5 × 10−52.5 × 10−51.05 × 10−4
Undulator period (cm)43103
Undulator strength, aw0.41102.4756
Radiation wavelength12.7 μm423.5 nm90.7 nm0.15 nm
Nc = ω c / σ ω 35.810270.614.5
Table 2. Beam and system parameters for PCI simulation.
ParameterValue
Beam energy14.56 MeV
Beam current (peak)50 A
Normalized emittance (RMS)1.5 μm rad
Momentum spread (RMS, σp/p)2 × 10−4
Peak solenoid field0.2503 T
Solenoid length0.42672 m
Focal length of solenoids0.49 m
Distance between solenoids2.2 m
Table 3. Comparison of estimated values for maximum bunching factor gain (21) and Genesis simulations.
FEL Type gmax, Equation (21)gmax, Genesis Simulations
Infrared FEL858777
Visible FEL2927
VUV FEL2818.7
Hard X-ray FEL2721.1
Disclaimer/Publisher’s Note: The statements, opinions and data contained in all publications are solely those of the individual author(s) and contributor(s) and not of MDPI and/or the editor(s). MDPI and/or the editor(s) disclaim responsibility for any injury to people or property resulting from any ideas, methods, instructions or products referred to in the content.