1. Introduction
The population of elderly people is on the rise and the number is expected to reach 20% of the total world population by 2050 [
1]. They tend to suffer from poor sleep quality which leads to myriad problems and affects their physical health, cognitive function, and overall quality of life [
2,
3,
4,
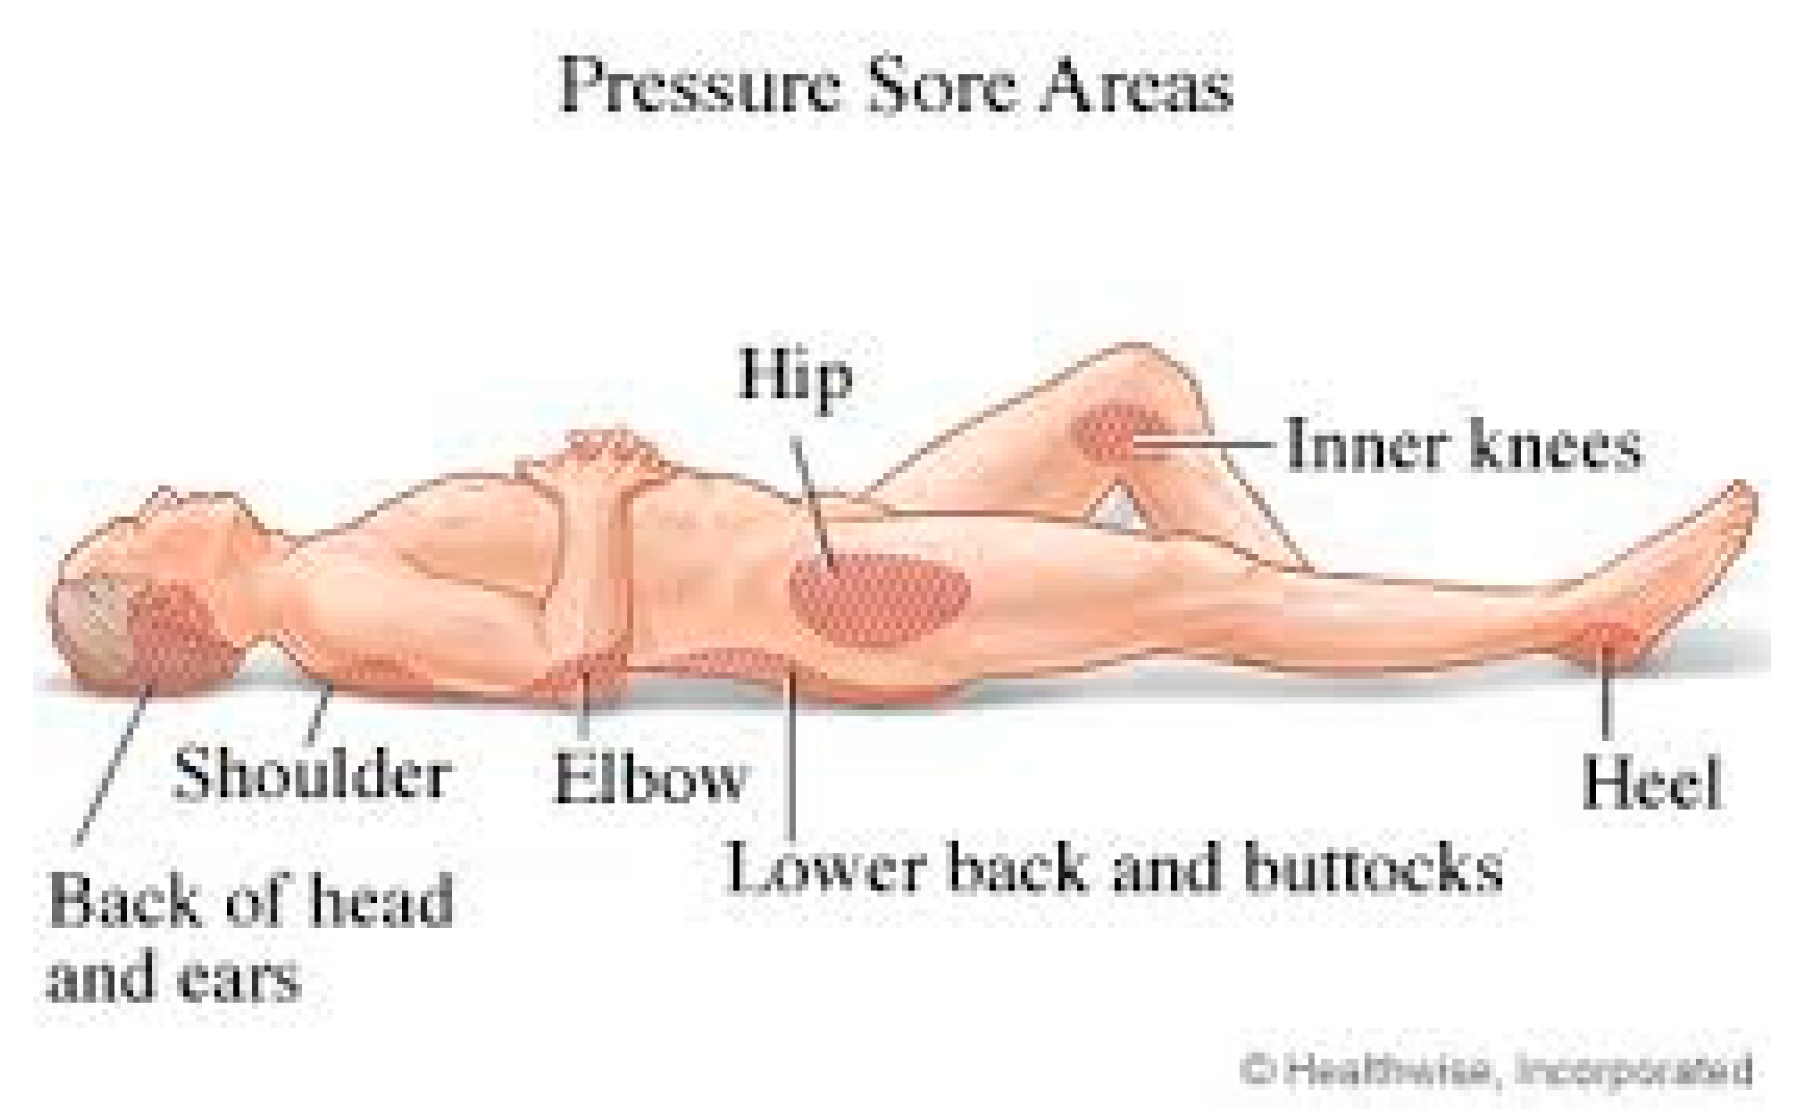
5]. Therefore adequate and restful sleep is important as it allows the body and brain to undergo necessary restorative activities. The quality of sleep seems to be a common problem among the elderly and needs attention. Sleep analysis is vital for the detection and diagnosis of sleep related complications. In addition to sleep quality, sleep posture is another prevalent issue among elderly and may cause pressure injuries (PI) if they have prolonged sleep in a single posture without moving, as shown in
Figure 1. PI may result in constant pain, loss of mobility, depression, and even death. Studies have found that sleep issues are more prevalent within the residential care population [
6,
7]. Furthermore, certain sleep positions and postures are considered to be the major causes of certain diseases [
8]. Elderly sleeping in the decubitus position have a higher risk of developing sub-acromial impingement syndrome [
9] and those sleeping in a supine position are more likely to develop the symptoms of sleep paralysis [
10]. Similarly, sleeping on the right-side poses a greater risk of development of transient lower esophageal sphincter relaxation, which is the main reason of nocturnal gastroesophageal reflux [
11]. Finally, falling out of bed during sleep is another major risk to the elderly, resulting in injuries and even death in extreme cases.
The aforementioned risks can be mitigated if staff actively and regularly monitors the patient at the elderly care facilities. Clinical shreds of evidence suggest that posture sleep can be used as a diagnostic indicator for a range of chronic diseases and as an aid in medical therapies. Detecting and monitoring these symptoms can be challenging and may also require the use of extra staff resources leading to increased healthcare expenditures and stress for the patients. The healthcare community has also emphasized the need and significance of a perennial sleep tracking system to identify trends and assist people in creating individualized sleep goals.
The challenges, rising costs of care and effects of sleep-related issues on the elderly motivate the need for a system that could assist medical practitioners and caregivers in residential-care in monitoring patients more efficiently. The Internet of Things (IoT) is the network of smart electronics device that are connected through internet equipping them with the capability of data exchange [
13,
14,
15]. This capability of remote connectivity offered by IoT technology can be used remote monitoring of patients lacking access to effective health care. This will not only result in reduction in health cost but also enhance the availability and quality of care. The recognition of sleep posture requires the data related to positioning of the subject and some algorithm to classify this information. The data can be acquired remotely using IoT enabled sensors and several methods are in place for sleep posture classification, including means clustering [
16], artificial neural network [
17], dual-tree [
18], and support vector machine (SVM) [
19]. However, these traditional approaches require considerable features extraction from the preprocessed signals and are susceptible to local optimization. Recently, researchers proposed a deep learning model named convolutional neural network (CNN), reduces the complexity of the network and number of weights because of its shared-weight network structure. It is being extensively deployed in the domain of object recognition [
20] as well as image segmentation [
21,
22].
The objective of this study is to devise and implement a system for monitoring the sleep health of the elderly people living in hospice. We propose a smart autonomous system that is capable of monitoring sleep pattern, sleep posture, and producing alerts about potential falls during sleep. This IoT based solution records patient’s posture related data using the sensor and transmits it to the cloud over the internet for further processing. The computations are performed in the cloud and deep learning algorithms are used to identify the posture and stored on the cloud with time stamp. The medical specialists can access this data over the internet and use for making suitable health recommendations. The subject can also use this information to learn about their sleep habits and find ways to improve sleep health by obtaining feedback on their sleep postures and activities. This may prevent them from possible injuries when sleeping in wrong posture for prolonged period of time thus reducing burden on the health system. Caregivers and healthcare professionals can also access this data and use it to implement preventative measures to reduce and manage the risks of poor sleep as necessary. The smartphone application generates many useful which can be helpful in assessing sleep efficiency (the ratio of total sleep time to time spent in bed) and sleep latency (the duration from bedtime to the onset of sleep). These measures can help physicians detect and diagnose sleep-related disorders such as insomnia and sleep apnea [
23].
There is a plethora of work dedicated to the aspects related to sleep health and researchers have explored diverse techniques for identifying the sleep posture. In many early studies on sleep postures, an empirical approach was favored and data was collected by interviewing subjects. In recent years, advancements in the IoT and sensing modalities have enabled researchers to more accurately determine the posture and patterns during sleep. Several studies have been performed that in one way or another try to quantify the quality of sleep or sleep posture [
24,
25]. In a clinical sleep assessment setting, the current ‘gold standard’ for diagnosing sleep disorders and issues is the use of polysomnography (PSG) [
24]. This method involves the measurement of multiple physiological parameters, such as brain activity, blood oxygen level, heart rate, breathing, and leg and eye movements. It also requires a number of sensors and equipment to be physically attached to the patient’s body. Although this method provides accurate results and insight into one’s sleep, it is obtrusive, disruptive, expensive, and requires monitoring in a exceedingly controlled and unusual environment. Therefore, it is only suitable for medical-supervised evaluations and not feasible for daily use. Conceptually similar device called
WatchPAT [
25] is worn on the wrist by the subject and comes with a finger clip but intrusive nature may cause discomfort. Several smartphone applications are also developed that use built-in sensors to monitor sleep patterns including:
Toss ’N’ Turn sense [
26],
My Sleep APP [
27], ‘
Sleep as Android’ [
28] and
Runtastic Sleep Better [
29], and
iSleep [
30]. Smartwatches, wristbands, and headbands are powerful devices in terms of the sensors that are embedded in it. The
Fitbit Charge2 [
31],
Jawbone UP3 [
32],
Zeo,
SleepImage,
Lark,
WakeMate,
Hexoskin,
OURA are popular commercially available wrist-worn sleep trackers used for collecting data about sleep [
14,
31,
32,
33]. They are expensive and also intrusive in nature.
Alternatively, there are other nonintrusive technologies for recognizing the sleep posture of the subject. They are based on pressure sensing or camera based visual data. The latter used common digital visible light (2D or 3D) cameras, Infrared cameras, Kinect cameras acquire visual data and then applied image processing and machine learning techniques to recognize different postures [
34,
35,
36]. The versatility of the data captured is also augmented by using different sensors in conjunction with the sensors [
37,
38,
39,
40,
41]. These approaches are expensive, sensitive to light, require installation, and breach of personal privacy is a concerning issue. Another approach excluded the use of cameras and instead used smart bed-type devices in the form of sensors installed on or near the mattress for sleep posture monitoring. These devices comprised inertial measurement unit (IMU) sensor and wireless technology (Wi-Fi and RFID) to identify sleep quality and sleep postures. Wireless identification and sensing platform (WISP) [
42] and MediSense [
43] used the
y-axis accelerometer and
z-axis gyroscope readings to infer body postures and movement of the patients, respectively. Wi-Sleep [
44] leverages Wi-Fi signal, TagSheet [
45] used passive RFID tags taped under a bed-sheet, SMARS [
46] exploited ambient radio signals, and SleepSense [
47] made use of Doppler radar-based system to detect the activities but all these systems do not possess the capability to recognize postures.
Within the recent past, pressure sensing techniques is getting attention as it leveraged to not only identify sleep patterns, but recognized postures as well. These techniques made use of different types of pressure sensors that are non-intrusive and did not discomfort the users. A wide variety of pressure sensors were used ranging from simple fluid cells to sophisticated pressure sensing mats. The fluid-filled cells [
48] and low-ended load cells [
49] detect motion via pressure fluctuations. A more popular approach is to place a small sensing mat between the mattress and bed-sheet. The bedsheet deployed pressure sensors captured pressure mapping images and different postures could be recognized using classifiers. Alternatively, distributed pressure sensors entrenched in the mattress could record any changes in body posture [
50,
51,
52,
53]. The pressure-sensitive mats manufactured by S4 sensors recorded the patient’s movement between different postures [
54]. These mats used photodiodes connected to optical fiber for providing light. The light intensity of photodiodes would vary as pressure applied is translated to a voltage signal indicating the pressure exerted on the mat. Data were transferred to a computer for processing via Bluetooth, and linear and SVM classifiers were used for categorizing data. Apart from being expensive, this system was not able to detect multiple postures and relay the recorded information to the user in real-time. A force sensing application pressure mattress [
55], a high-resolution mattress that contained 2048 sensors, was used. This system could identify only three different postures, namely “supine”, “right side” and “left side”. Similarly, [
56] used a sensor mat comprising 1728 resistive sensors for identifying 13 different sleep postures using a Gaussian mixture model. The image collected from the mat was processed by various filters for highlighting the pressure areas using a low pass Gaussian filter. For identifying the positions of a user’s limbs, pressure sensor data from specific regions on the mat were clustered together. This information was combined with the previously collected information from pressure sensors to obtain the posture classification. KNN linear classifier was used for supervised training using the collected datasets. There are few other recent solutions which make use of the pressure sensors and machine learning for identifying different postures [
57,
58,
59,
60,
61,
62].
The problem of sleep recognition involves both feature extraction and then classification of the image. The application of the feature extraction techniques to the images obtained from the pressure sensor mattresses is not effective due to ambiguous nature of the data as well as due to the lack of description of features. It becomes even harder to extract features when number of pixels increase as there exist a correlation between each pixel point’s pressures. The solution to aforementioned problem is offered by CNN as it offers the capability of automatically detecting the important features without any human supervision through integration a feature extractor and a classifier into a network for training through data. In contrast to traditional networks, CNN scale well and offer optimal performance and efficiency.
There are many studies on posture estimation based on deep learning [
63,
64,
65,
66,
67]. The technique proposed by Georges Matar et al. for monitoring patient posture uses the binary images produced by the pressure sensing mattress with an aim to reduce the storage requirement and computational cost [
63]. Though proposed method is able to detect the posture with high accuracy as indicated by the Cohen’s Kappa coefficient value (κ = 0.866) but this system was not been realized in hardware at that time. Later, the extension of the research involved the hardware implementation using piezo-resistive pressure sensors array of 27 × 6 nodes and used artificial neural network for the classification. The system was capable of classifying six with a very high accuracy of 97.6% [
64]. The most recent work by [
65] deployed 1024 sensor nodes (23 rows × 32 columns) bedsheet and deploys shallow CNN to determine the six health-related sleep postures of a person. This approach uses too many sensors nodes and also requires a standalone PC for processing the data thus adding considerably to the cost of the system. Also, data is available locally and does not offer the remote monitoring.
There exists other works dedicated to develop a sleep quality monitoring and sleep posture recognition system with a high level of accuracy by using CNN but they lack the capabilities of delivering processed data to the end-user and a health professional in real-time and flexible manner. Furthermore, these systems use a pressure sensor array with a large number of nodes which not only requires high computation but also result in increased cost and power consumption. The proposed system overcomes above drawbacks by accompanying a smartphone application where the user or medical staff can visualize the data in real-time. Also, it uses a fewer sensor nodes, making it cheaper and more affordable for the consumer in terms of cost and consumes less energy, thus resulting in longer battery life.
We are specifically interested in a system which is low cost, low powered, user-friendly, and easily accessible. The main contribution of the proposed system includes (1) low cost and low powered pressure sensing mat with no computation performed at the point of contact, (2) fully automated cloud-based solution for sleep posture recognition that permits the end users to access data anywhere and anytime, (3) a mechanism that sends a message to the caregiver if the subject is on edge and may fall, and (4) a smartphone application that can also access the previously collected and generate reports for analysis and diagnosing different medical conditions.
2. Methods and Material
This section describes the methods and materials used in the study. The method attempts to solve the problem following a three step process: (1) mat construction using pressure sensor, (2) data acquisition, (3) data storage and computations in the cloud, and (4) information exchange between cloud and end-user.
2.1. System Architecture
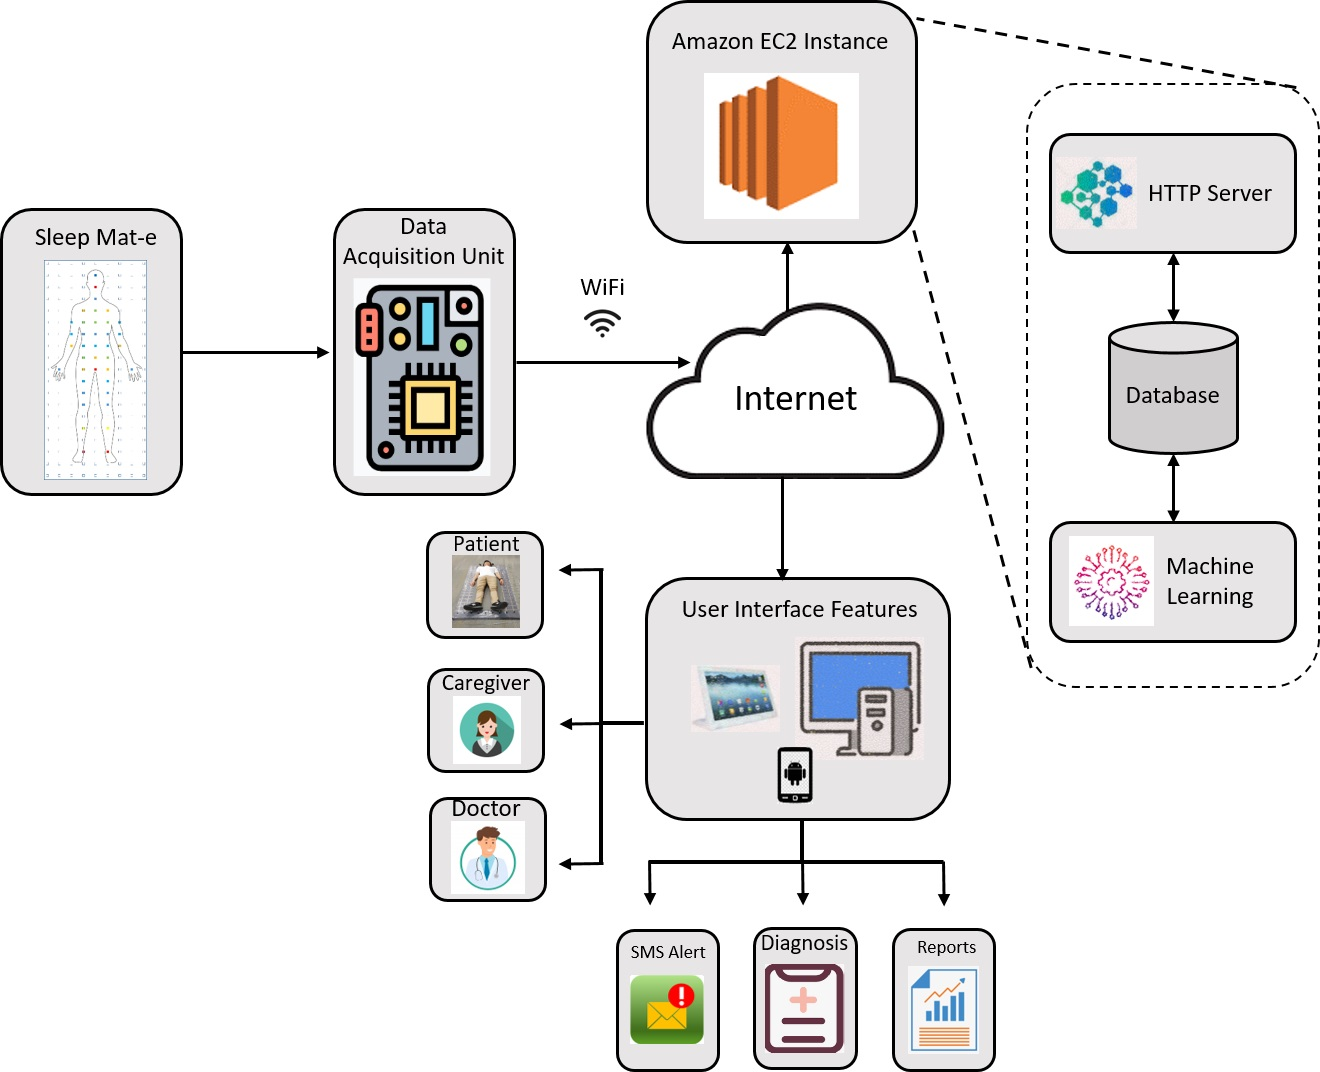
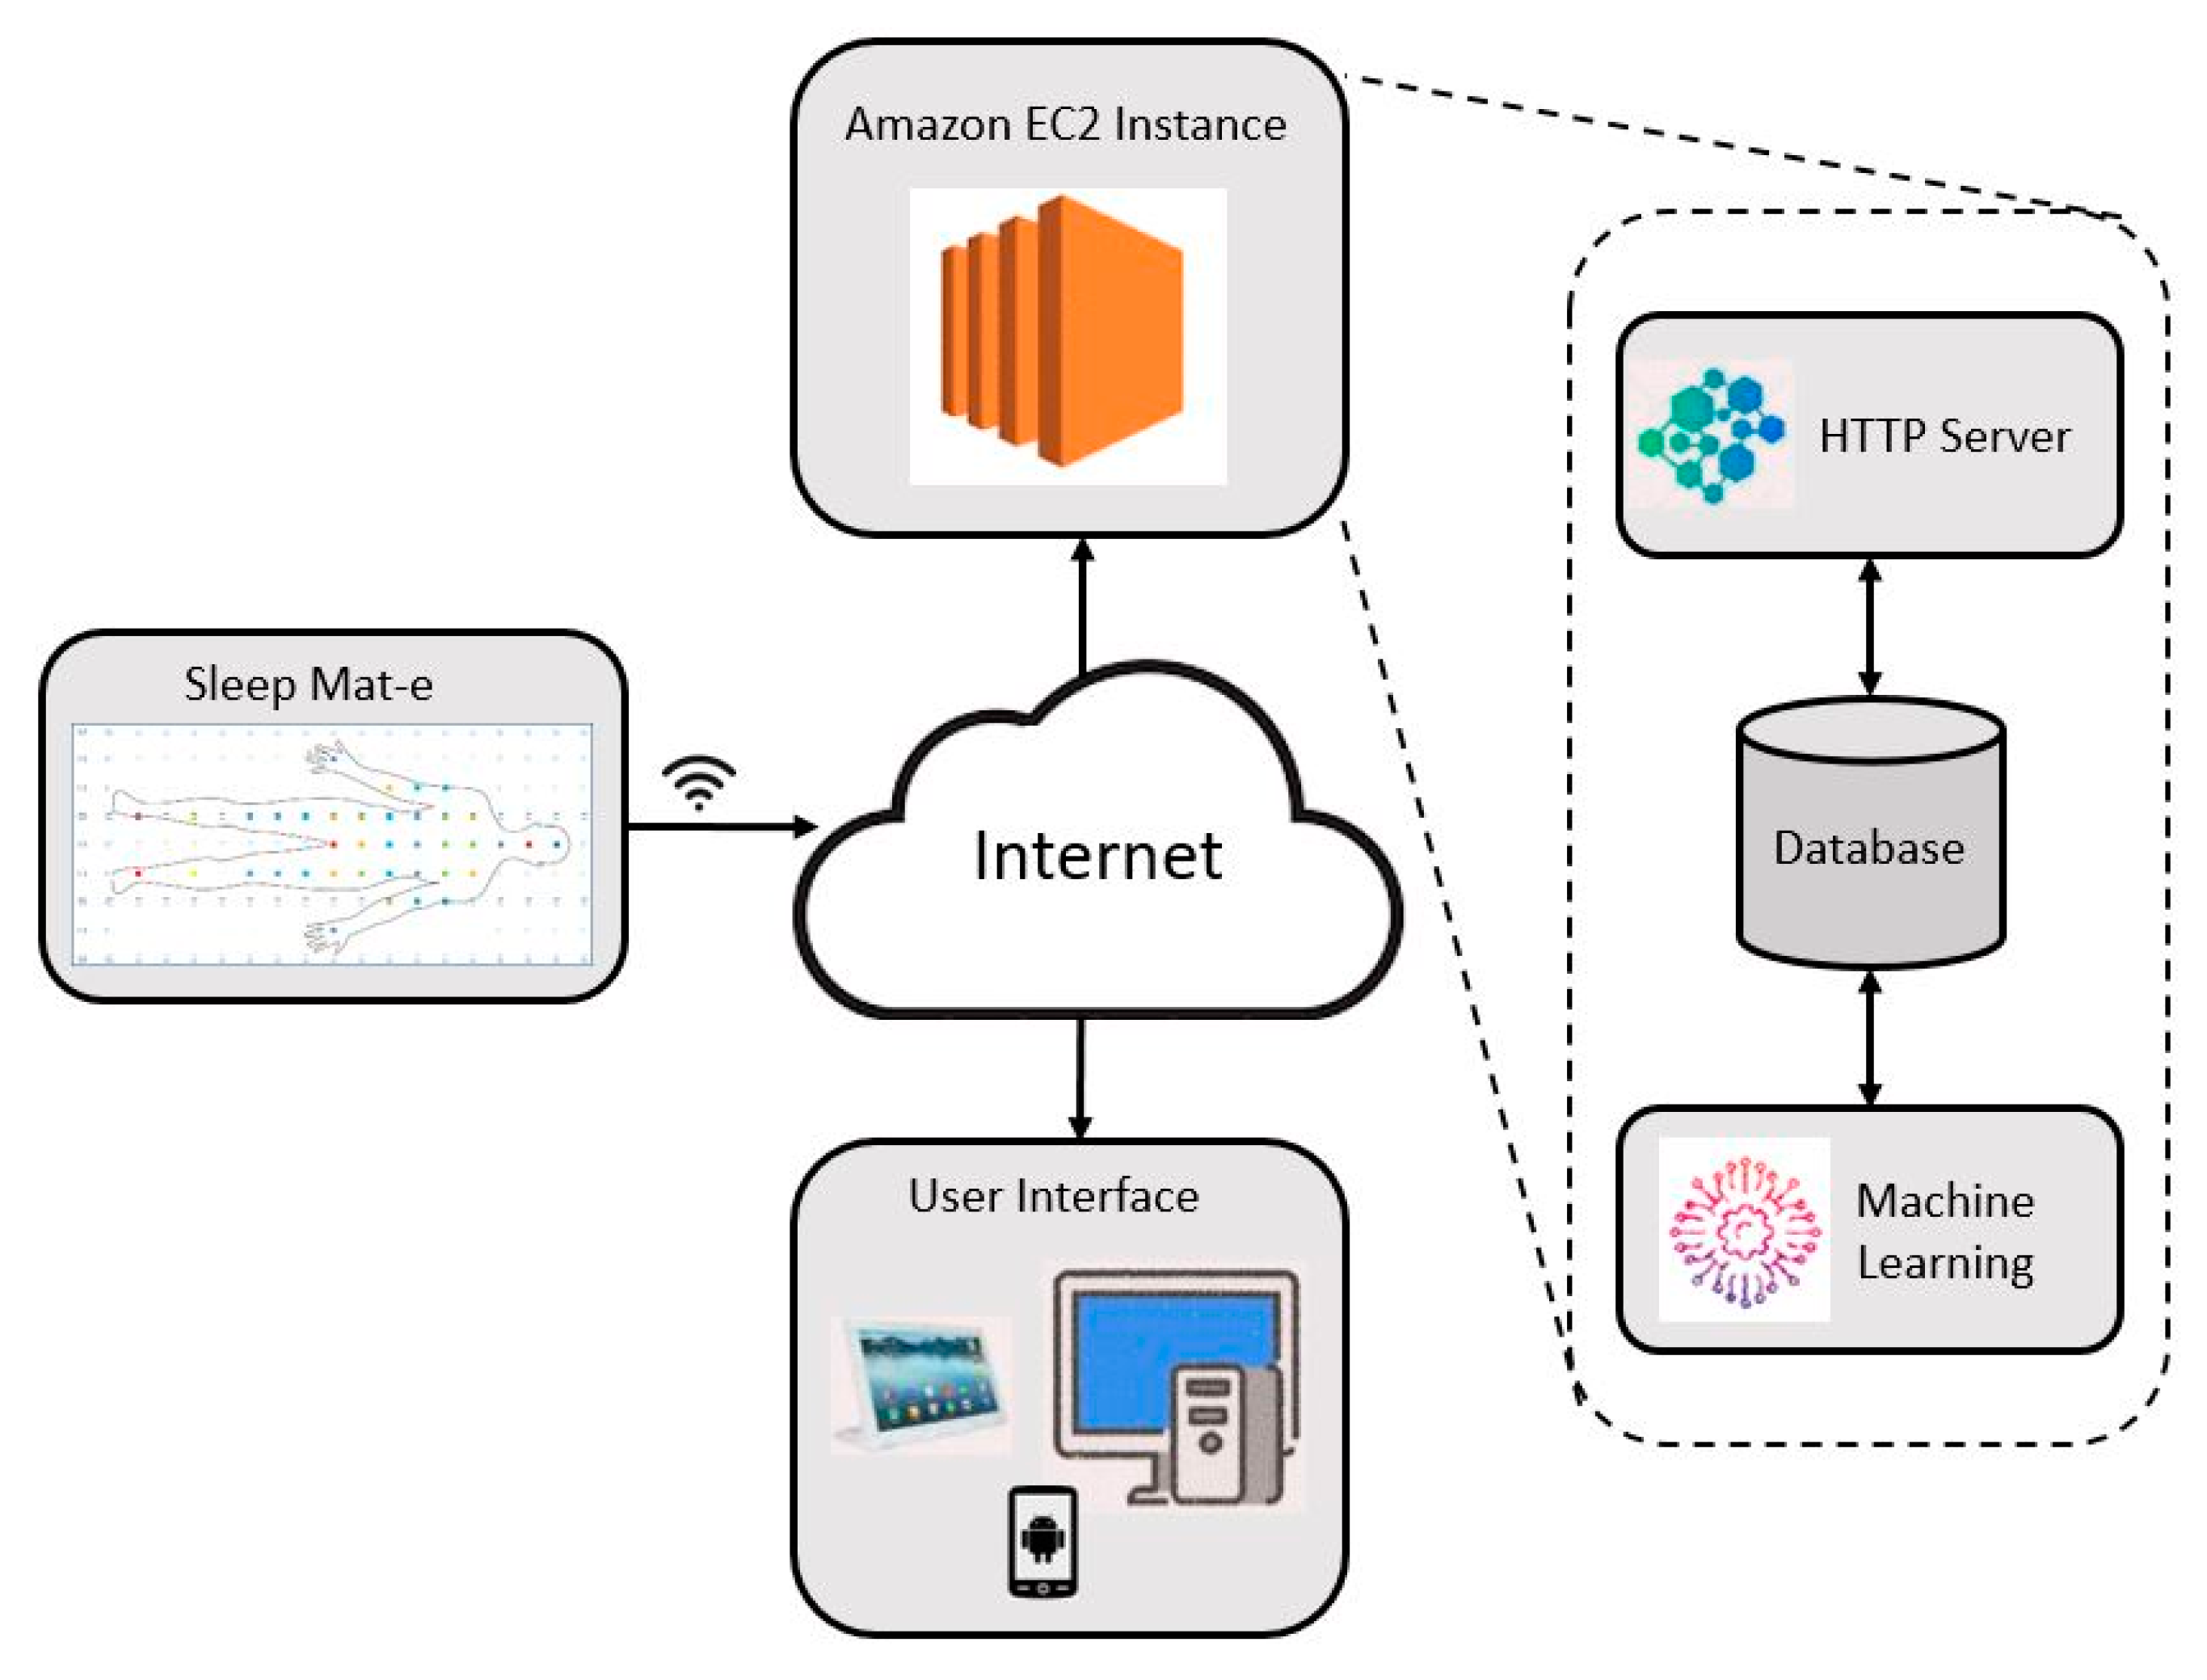
The system architecture shown in
Figure 2 provides the conceptual model defining the structure of the system. It comprises a sensing mat made up of pressure sensors used to capture data related to the sleep position of the subject. The data acquisition module integrated into the mat collects the data from the pressure sensors providing the snapshot of the current posture, and transmits it to the cloud server using the Wi-Fi. The data acquisition unit is implemented using the ATmega32u4 micro-controller. The firmware performs initialization, collects data from sensors, arranges data, and transmits the data to the cloud server using Wi-Fi module. Data received by the cloud server is then stored in the server database. We use a central server design, which performs the data storage, data processing and user authentication.
The server can read the recently added data to the table in the server database for classification. Machine learning is used to perform a statistical analysis of the data obtained from the data acquisition unit and classify different postures. The data is continuously received by the server and classified. Google’s deep learning library, TensorFlow, is used for classification that incorporates different APIs to build at scale deep learning architectures like CNN. The data is first loaded into memory, a model is built, a machine learning algorithm is trained, and then posture is estimated.
An Android application is provided to the end-user (subject or health professional) to interact with the system and retrieve information from the cloud. The information provided is the current sleep posture and statistical data for a specified period of time. The statistical data contains the overall time in bed and the posture distribution over time. The application also generates fall warning alerts when the user is sleeping closer to the edge of the mat. The fall warning may help in preventing any potential fall injuries. If a user sleeps in one posture for a prolonged period, a bedsore alert generation option is also provided for the caregivers so that they can attend the patient and help change their posture. Bed unoccupied alert is generated when the user leaves the bed which is also helpful for caregivers.
2.2. Sensor Design
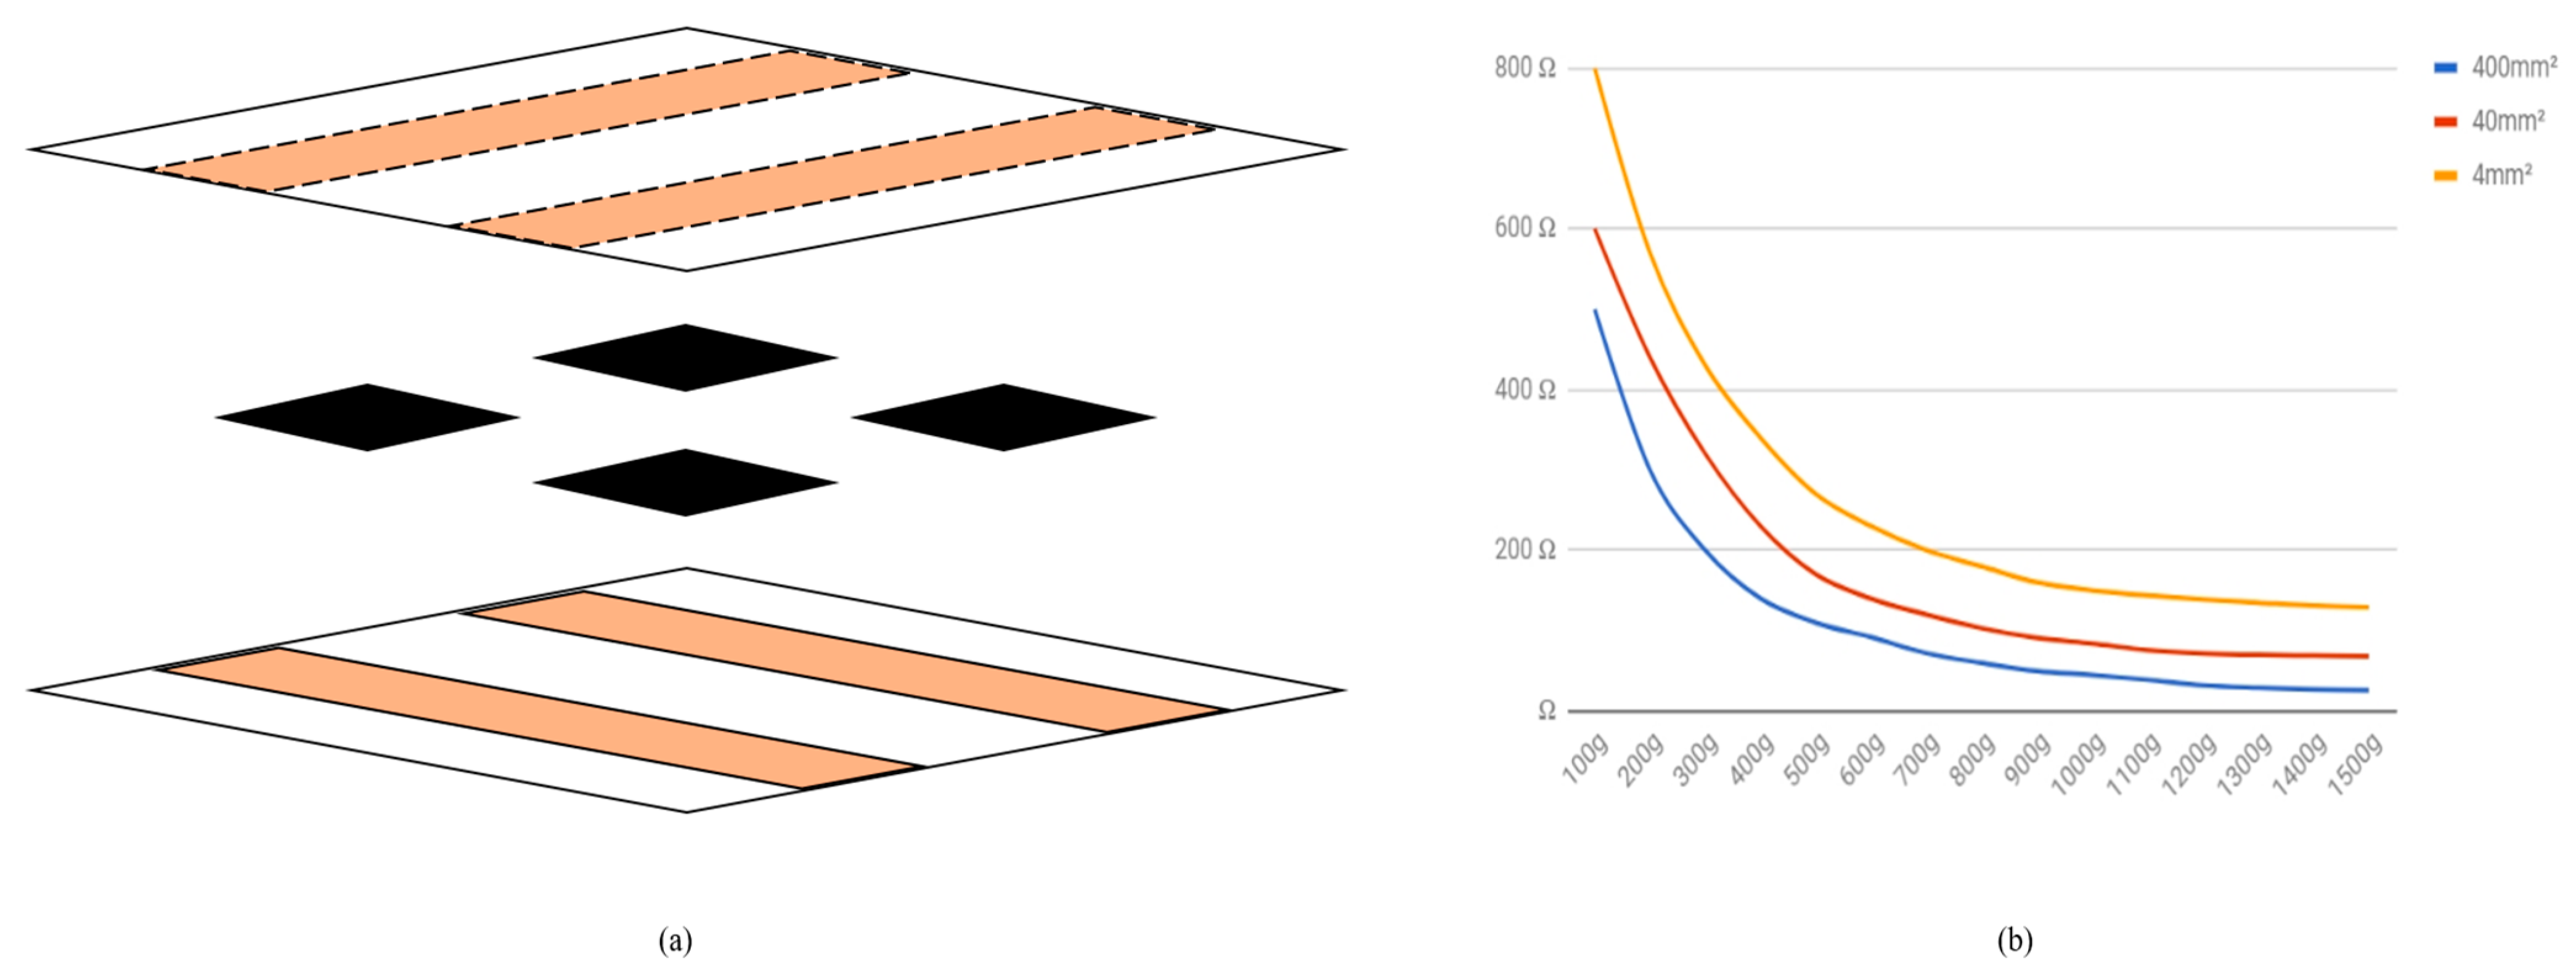
Selection of sensors capable of capturing the pressure distribution and contact area between the body and the mattress was an important decision to make. We considered a number of options considered for evaluation including: premade mattress sensor arrays, limit switches, FSRs, and piezo-resistive materials. They were judged according to their physical and technical specifications, in addition to costs. The options were analyzed against the ideal sensor criteria: (1) flat sensor shape, (2) ability to detect a large pressure range, (3) lower cost. Force-sensing resistors (FSR) are simple tactile sensors [
51,
68] that are used in applications where changes and differences in pressure need to be detected. These are constructed using conductive polymers, elastomers or semiconducting polymers, piezo-resistive material, conductive wires, fiber-optical, or fiber-grating material.
Table 1 summarizes the sensor options with key metrics displayed. We implemented an array of FSR’s using Velostat pressure-sensitive material was used because it is inexpensive. Furthermore, they are cheap as they involve low-cost electronic components and for these reasons, they are widely used in such applications. Velostat-based FSRs have an exponential decay resistance to pressure curve having a significant drop in the resistance of the material within a small region of the pressure range allowing to distinguish between high and low-pressure regions. An FSR sensor with a larger surface area has higher resistance, but it still has the same level of sensitivity. This is an important property as this allowed the designing of the sensors for different pressure ranges having similar sensitivity. The square-shaped sensor has dimensions of 2 × 2 cm and contains three main layers which are a top electrode, Velostat, and the bottom electrode, respectively as shown in
Figure 3a,b.
2.3. Mat Design
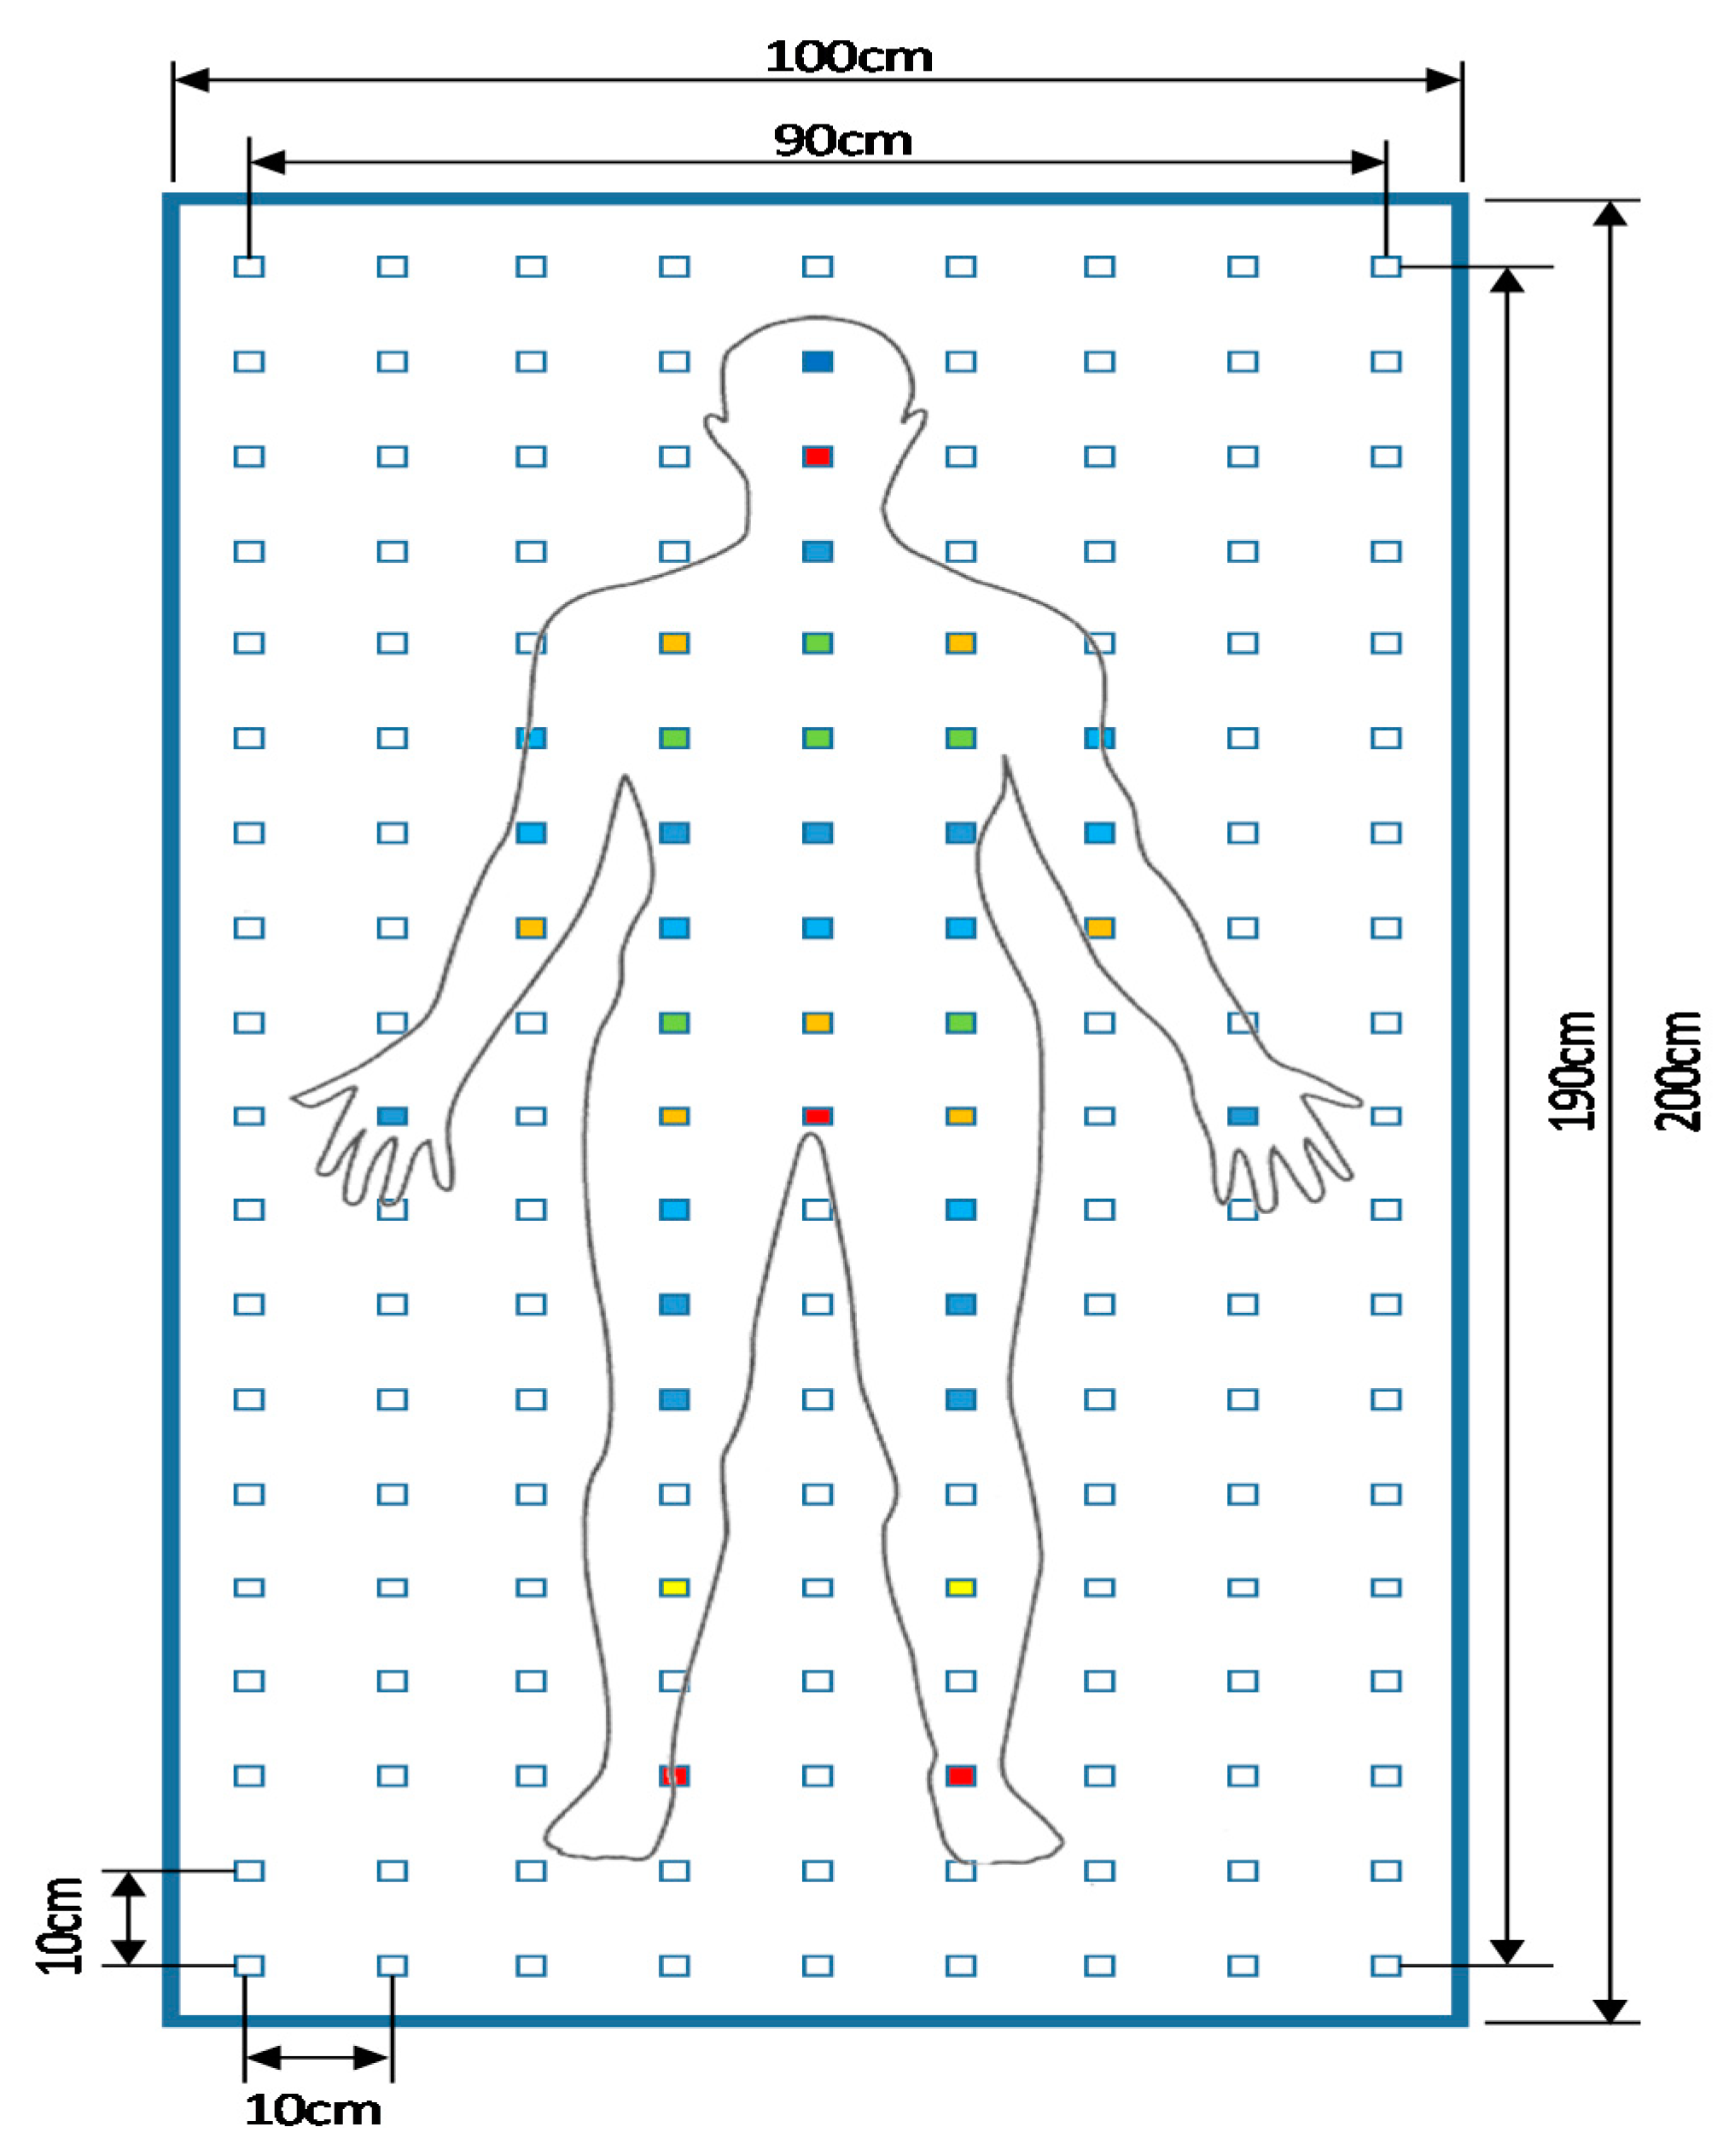
Our sensing mat is designed using an array of sensors attached to a thin plastic film under the sheet, making it easy to deploy on the mattress and unobtrusive to users. As shown in
Figure 4, a total of
171 sensors are placed in a 19 × 9 grid structure. The sensors are organized in rows and columns, forming an I-by-J rectangular matrix
where
denotes the pressure sensor at the
row and
column of the matrix,
. The total number of sensors is
. The dimensions of the mat is the same as that of a single mattress, i.e., 100 × 200 cm. The end-to-end clearance between two sensors is around 8 cm. We use the equally spaced sensor topology as opposed to a few other sensor topologies such as the placement of sensors depending on the regions on the mat expected to have certain pressure values. We preferred this topology as it was more generic and would fit all the different types of major applications without imposing any restrictions on the user for the usability of the map. Two different plastic layers can be seen in
Figure 5 with copper tapes applied on the bottom black plastic layer of the mat run perpendicular to the copper tapes applied on the top transparent plastic layer. The Velostat sensor cutouts were placed on the copper tapes on the bottom plastic sheet that can be seen in as black dots along the entire stretch of each copper strip.
2.4. Data Acquisition
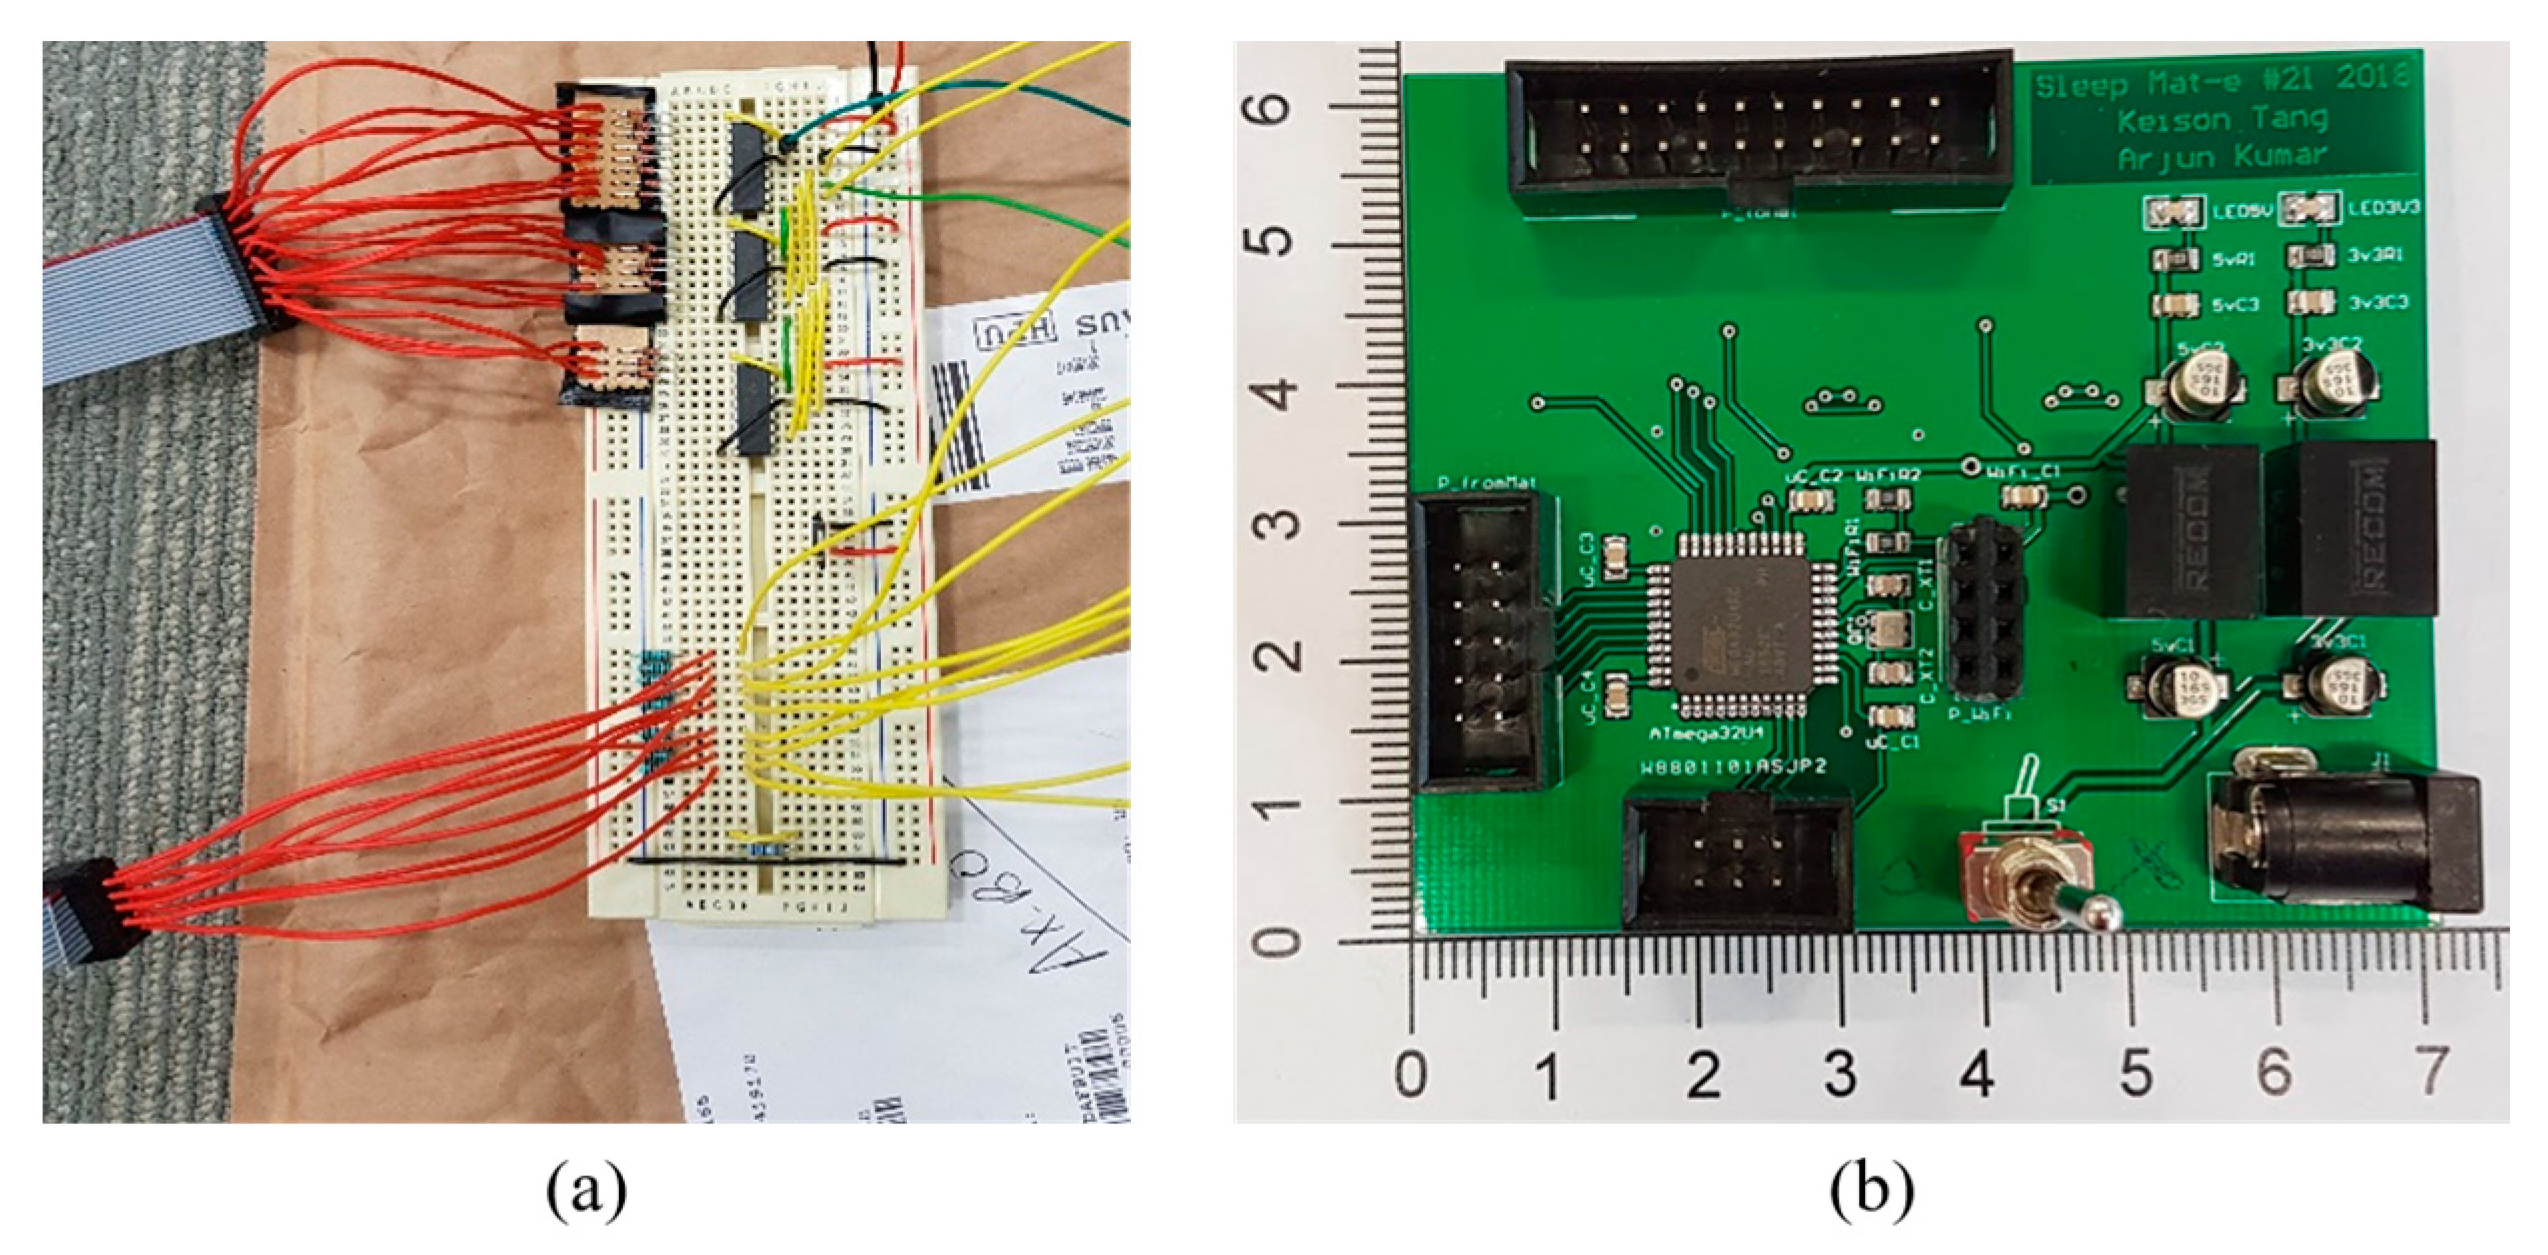
The data capture unit comprises a microcontroller and an electronic circuit connected used to reduce the required pin count as shown in
Figure 6a. Powering all rows required 19 digital outputs which were too many to handle for a low-end microcontroller. The important aspect to note is that only one digital output needed to be active at any given time during scanning process. We exploited this fact and reduced the pin count by deploying shift registers in a daisy-chain configuration essentially creating a single large shift register while using the same common control signals for each chip and this solution was even cheaper than using multiplexers. This circuit is connected to a microcontroller kit during initial phases of development. The electronic circuit was put together with the microcontroller on a single printed circuit board (PCB) in the final phase to reduce the size as well as power consumption. The final completed PCB is shown in
Figure 6b and has the dimensions of 7 × 6.4 cm. At the heart of data acquisition unit is an AVR ATmega32U4 microcontroller which has 12 ADC channels, 26 I/O pins, 32KB program flash, 2.5KB SRA, serial programming capability. The system required nine ADC channels, four I/O pins for shift register control, a UART interface for the Wi-Fi module, and an SPI interface for serial programming.
The data acquisition unit captures a snapshot of sensor mesh (the values of all the FSR’s on the mat at an instance) and sends it wirelessly to the cloud database. We use sensor matrix scanning strategy and this is done by pulling up one row,
the analog values outputted by all the columns,
, fed to an analog to digital converter (ADC) are captured by the controller. The same procedure is repeated for all the rows,
, and the pressure values of all nodes are captured as illustrated by the pseudo code given in Algorithm 1. This is used to construct the snapshot of the pressure profile of the person at a given instance.
| Algorithm 1:Sensor Scanning |
| 1: | procedure |
| 2: | | clear shift register |
| 3: | | shift 1 into shift register |
| 4: | | | for row i = 0 to I-1 |
| 5: | | | | for column j = 0 to J-1 |
| 6: | | | | | array[i][j] = ADCj value |
| 7: | | | | end for; |
| 8: | | | shift 0 into shift register |
| 9: | | end for; |
| 10: | end procedure; |
The ADC is operated at a frequency of 250 KHz, each ADC conversion takes 13 cycles and time to taken to scan all the 171 sensor nodes was around ~9 ms. The data was sent to WiFi module connected to microcontroller via a UART using a baud rate of 19,600 for transmission to the cloud. Each sensor node value comprises of 2 bytes which allows to transmit over five frames per second but frame could easily be improved by increasing the data rate.
2.5. Power Consumption Analysis
The Mat-e data acquisition and image transmission to the cloud is battery operated, therefore, energy consumption is very important for the battery life. The power consumption values of the main components which consume significant power are provided in the
Table 2 below. The power consumption of other auxiliaries components such oscillator, shift register, UART, ADC, diodes, and regulators is not significant and not considered in calculation.
During data acquisition phase, which lasts for 9 ms, only sensor array and micro-controller are active and energy consumed is given as
It takes around ~175 ms to transmit one snapshot of the pressure values of the map and during this time micro-controller and ESP8266 module are active and energy consumed is given by
The total energy for acquiring and transmitting a single frame is
A typical AAA 9V battery have capacity of around 750 mAh (miliampere hour), the battery would last for around ~8 h only if we acquire and transmit data continuously. However, by reducing the frequency of the images frames obtained, the battery life will considerably improve. For example, an image after 2 s will increase the battery life 10 fold to ~80 h approximately. Due to low battery life, a DC jack is provided to power it directly using a 9V adapter. Also, ignoring the last two bit of the ADC will not affect accuracy by great deal but it will considerably reduce the power consumption (almost by half) as the resultant 8-bit value will be transmitted using a single byte only instead of two bytes.
2.6. Posture Recognition
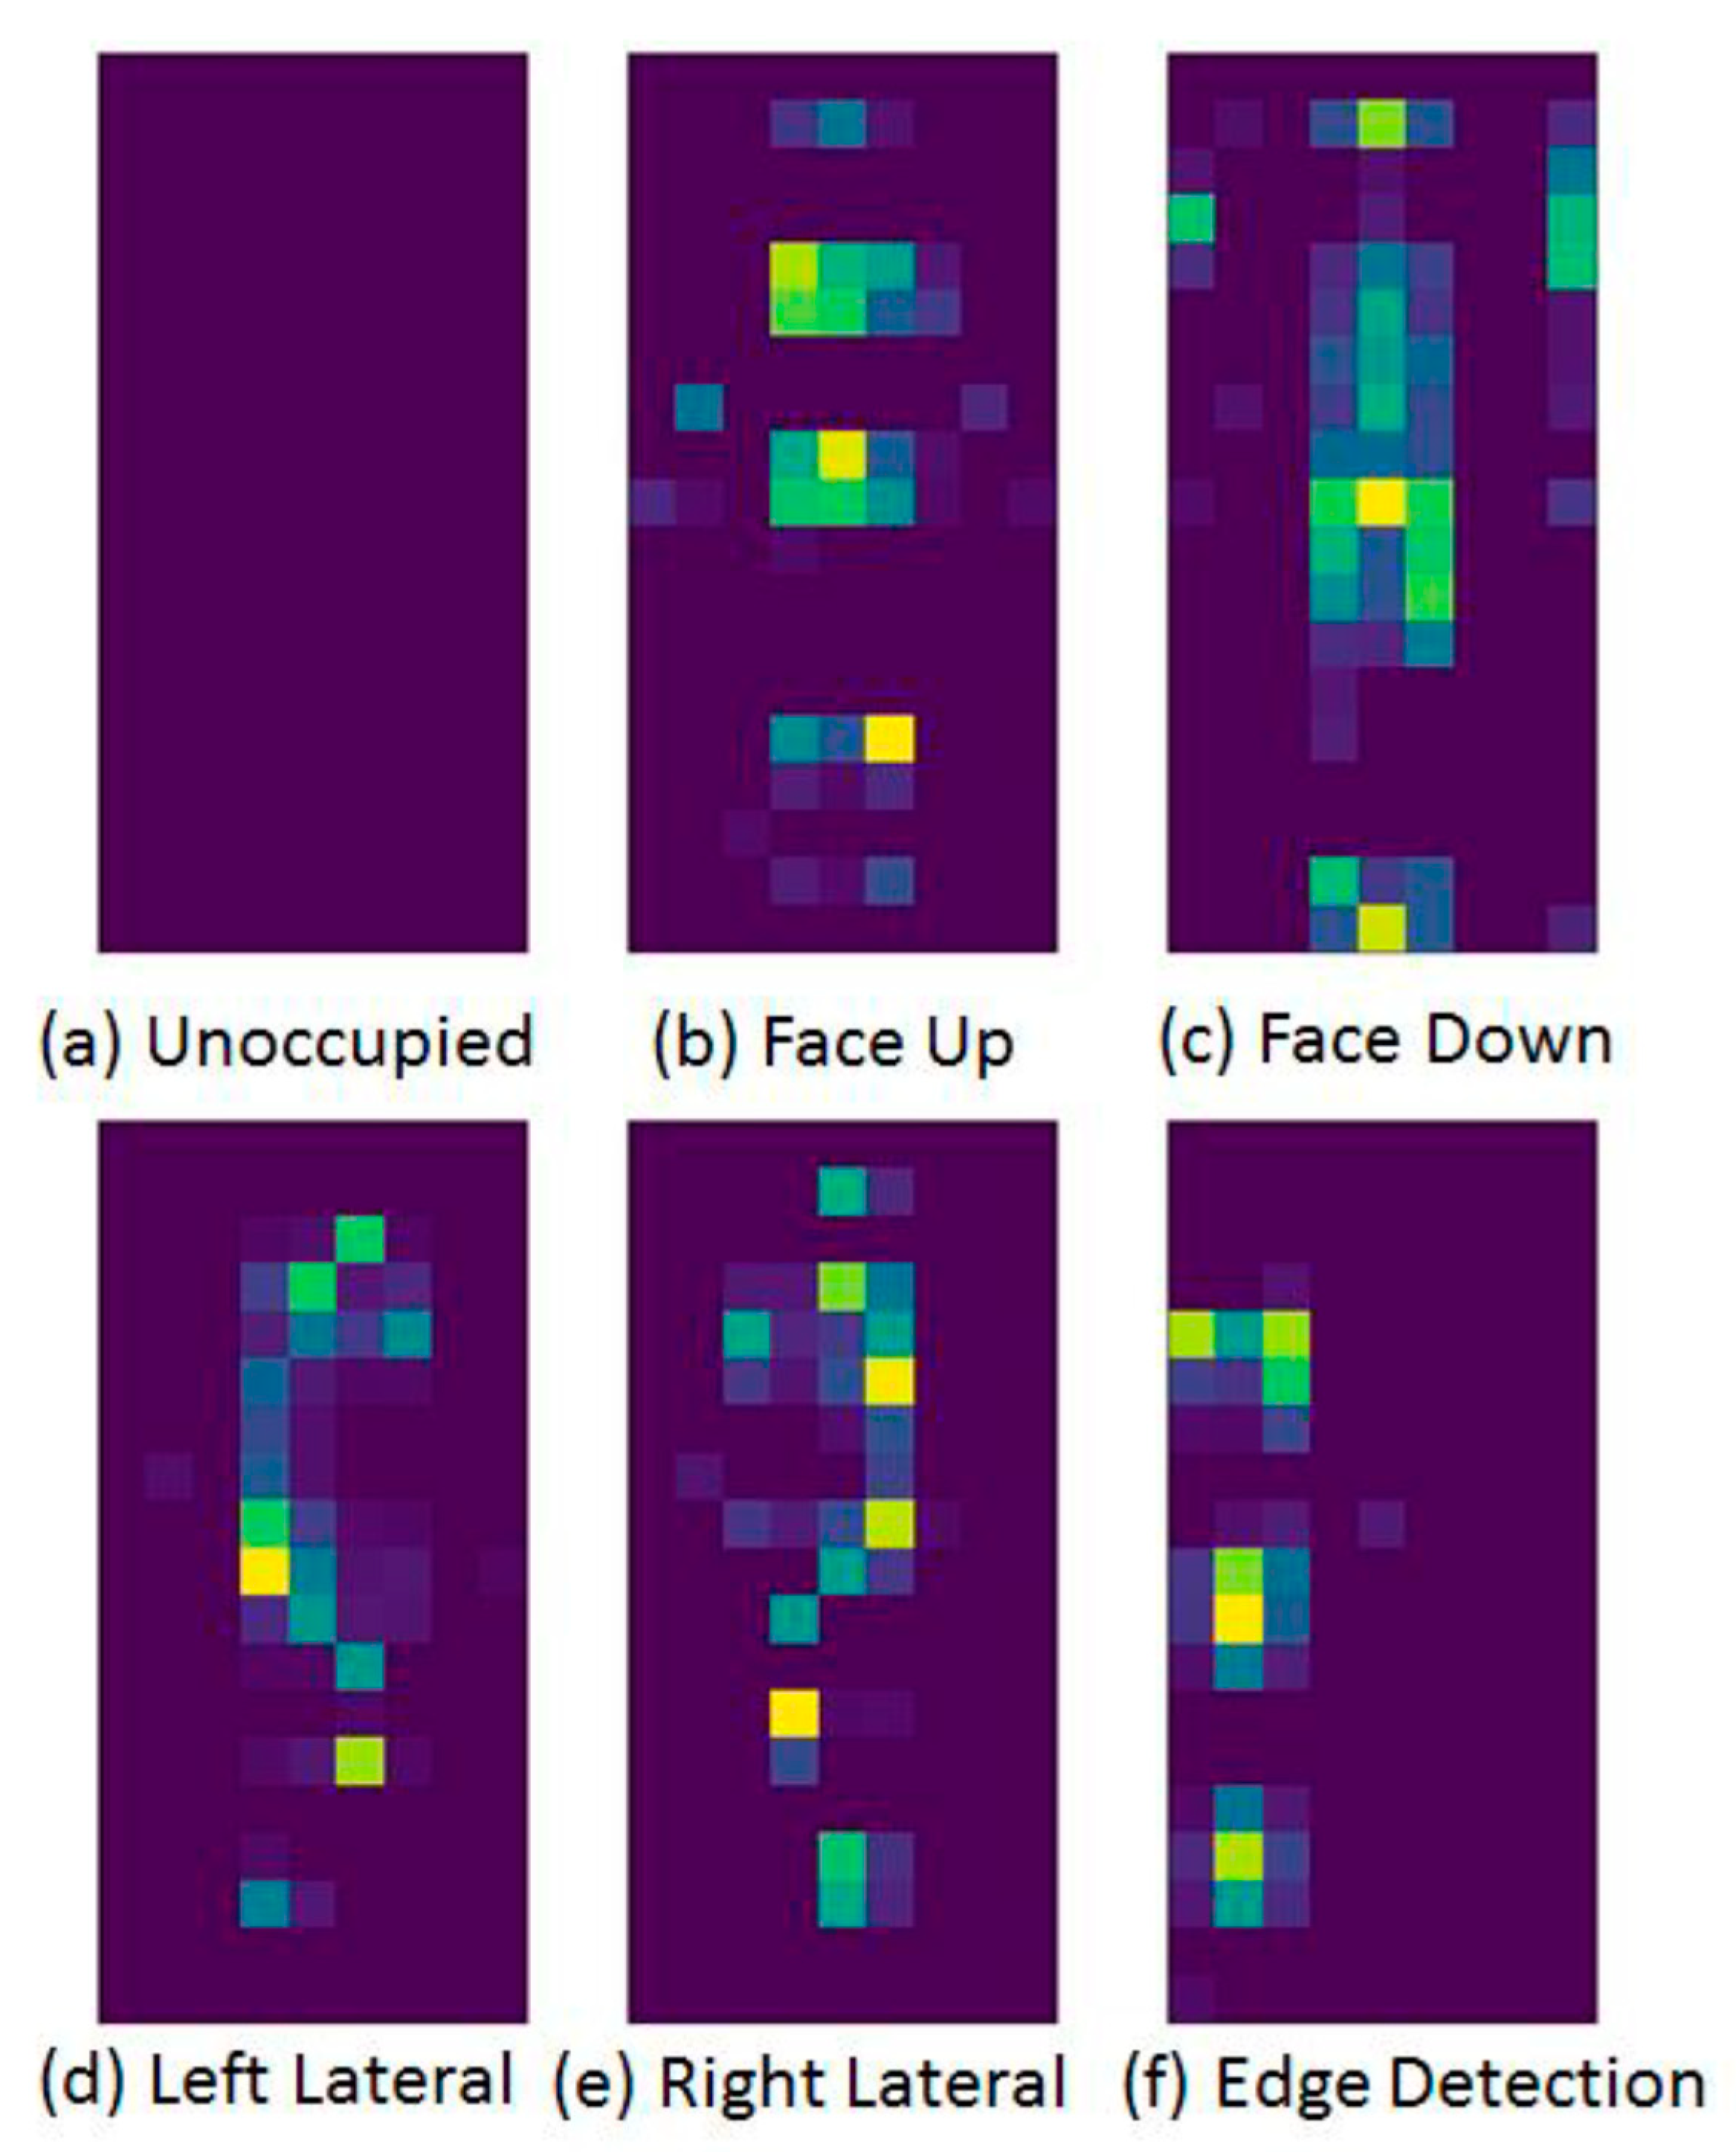
We identify six different cases based on positions a user could be in when on the mat. These positions are identified as ‘Face Up’, ‘Facedown’, ‘Right Lateral’, ‘Left Lateral’, ‘Unoccupied’, and ‘Closer to the Edge’ as shown in
Figure 7. The closer to the edge case will alert the caregiver through the Android application, called SleepMat-e, that someone may fall off the bed. The categorical heat map images generated from the pressure readings is shown in
Figure 8. Each colored square represents a pressure sensor and it has a color which is based on the magnitude of the pressure applied to the FSRs. The brighter color (yellow) indicates the highest pressure. The data stored in the database is classified and sleep posture is predicted. The database is polled periodically to check for new data, and when a new piece of data is received, the system performs the computations to classify new posture. This not only reduces the workload but also lowers the power consumed by the system. Posture recognition is an image recognition problem and deep learning, specifically CNN, is an effective tool to solve this problem [
69]. It is a class of deep neural networks widely used to analyze visual images. CNNs are regularized versions of multilayer perceptron which are fully connected networks where each and every neuron in the current layer is linked to all neurons in the subsequent layer. These networks are vulnerable to overfitting data due to the ‘fully-connectedness’ nature. ConvNets were motivated by biological procedures in that the connectivity pattern between neurons bear a resemblance to the organization of the animal visual cortex [
70]. CNNs use relatively little pre-processing compared to other image classification algorithms.
We make use of an artificial intelligence library, TensorFlow, which builds models using data flow graphs. More precisely, it is an image classifier, type of image recognition algorithm that analyzes an input image outputs what the image contains. The output is a class label, which is one of the postures here. The dataset comprises 200 images for each of the six possible cases, i.e., classes. Each image has three channels and all images have same aspect ratio. From the 200 collected images for each case, this does not include images that were either similar to other cases or were difficult to classify as some of them were not valid images due to glitches, for example, image taken during the posture change period. This was due to the resolution of the mat. Instead of creating the whole model again, we retrained the existing model with our own data. In order to collect a maximum number of posture variants and ensure inter-frame variance, the subject were provided specific instructions during the experimental set up. Also, the complete pressure frames or binary image received at the cloud are subject to scrutiny and a procedure was adopted to select the frame to avoid the duplication of same posture of a particular subject.
Based on the TensorFlow Hub module that calculates image feature vectors, we adapt a pre-trained network for other classification. Inception-v3 [
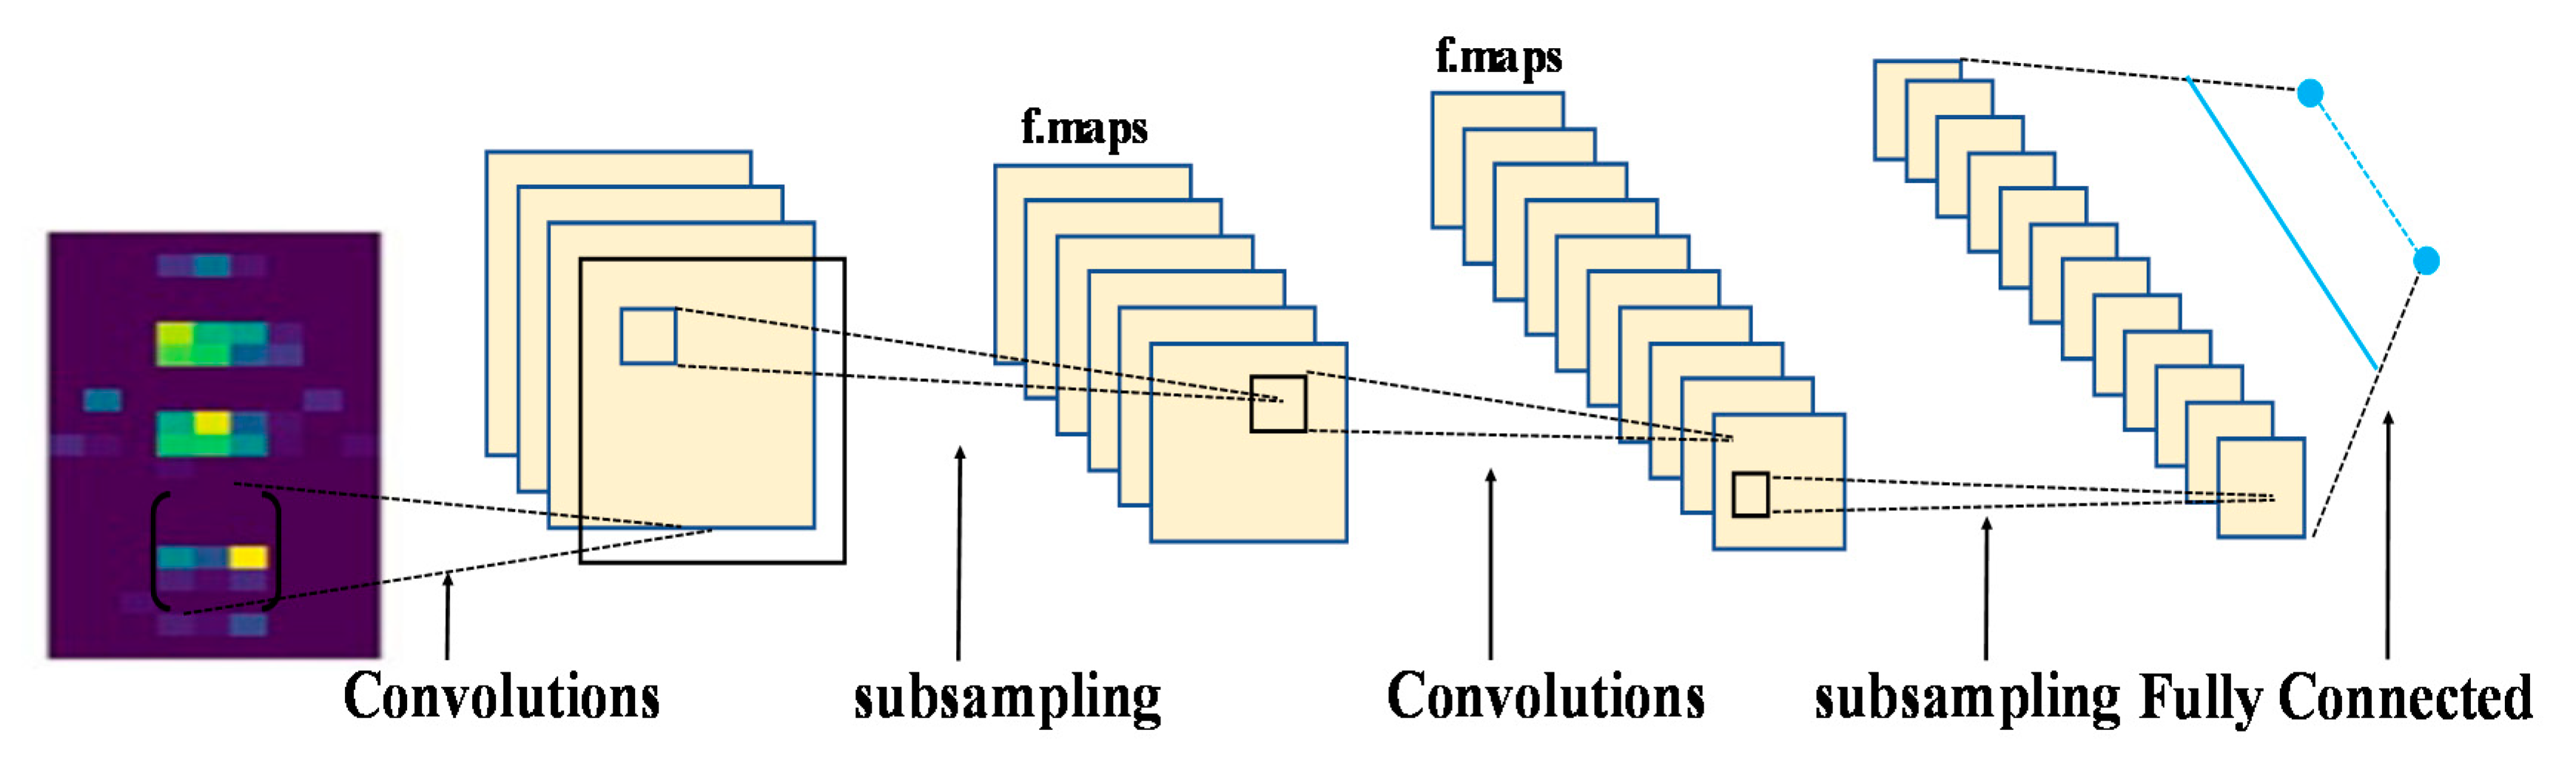
71] is a pre-trained convolutional neural network model that is 48 layers deep and has an image input size of 299 × 299. This pre-trained network is capable of classifying images into one thousand object categories resulting in network learning rich feature representations for a many different types of imageries. The model uses CNN to extract general features from input images first, and then classifies them based on the features with fully-connected and softmax layers as shown in
Figure 9. This model has been trained over millions of images, but the last layer of the network has been left untrained. We could supply our own dataset to complete the last layer of training. After training, a graph file is created, which contains information regarding nodes and weighting. This is the advantage of TensorFlow, as the training dataset is not needed after the graph file is produced. By default, it uses the feature vectors computed by Inception V3 (CNN) trained on ImageNet, thus taking advantage of the existence of this model for a custom image classification task. This is referred to as transfer learning (TL) as knowledge gained when solving a problem is used to solve a different but related problem [
72]. This is a super-effective technique for classification a relatively small dataset is available. As mentioned earlier, neurons are organized in layers in a CNN. Each of these layers may perform different kinds of transformations on the inputs and, in this way, input travels from the first layer to the last one after traversing the layers many times. The last layer has accumulated enough summarized information to provide the next layer which does the actual classification task as illustrated in
Figure 10. Transfer learning may have a very limited effect when you switch the dataset from one modality to another one.
Transfer learning enables the building of a new model to classify original dataset by reusing the feature extraction part and re-train the classification part with original dataset. Training feature extraction part is the most complex part of the model, skipping it allows to train the model with less computational resources and training time. The training usually took around 10 to 15 minutes depending on the size of the data. The graph file generated from the training session was then transferred to the server and used in a TensorFlow session for classifying postures.
The process image classification using TensorFlow is shown in
Figure 9. First, we pre-process data to generate the input of the neural network. Then, we reshape input and create a convolutional layer, followed by the creation of a pooling layer. The above steps in the process are repeated multiple times to create the multiple convolutions and pooling layers. The output of convolution and pooling layers is flattened before feeding it to the fully connected layer as shown in
Figure 10. A fully connected layer is created and an activation is also added. Lastly, a final layer for class prediction is created and weights and biases are stored using TensorFlow variables.
2.7. Mobile Application
Mobile applications have been used in assistive healthcare and other medical related cases [
73,
74,
75]. The final stage of our solution displays the information to the end-user after processing data through an Android application installed on a smartphone. The information provided is the current sleep posture and the statistical data for a specified date. The statistical data contains the overall time in bed and the posture distribution. The application also generates a fall warning alert when the user is sleeping closer to the edge of the mat. The fall warning will help in preventing any potential fall injuries. If a user sleeps in one posture for a significant amount of time, a bedsore alert is generated for the caregiver so that they can attend the patient and help change their posture. Bed unoccupied alert is generated when the user leaves the bed which is also helpful for caregivers.
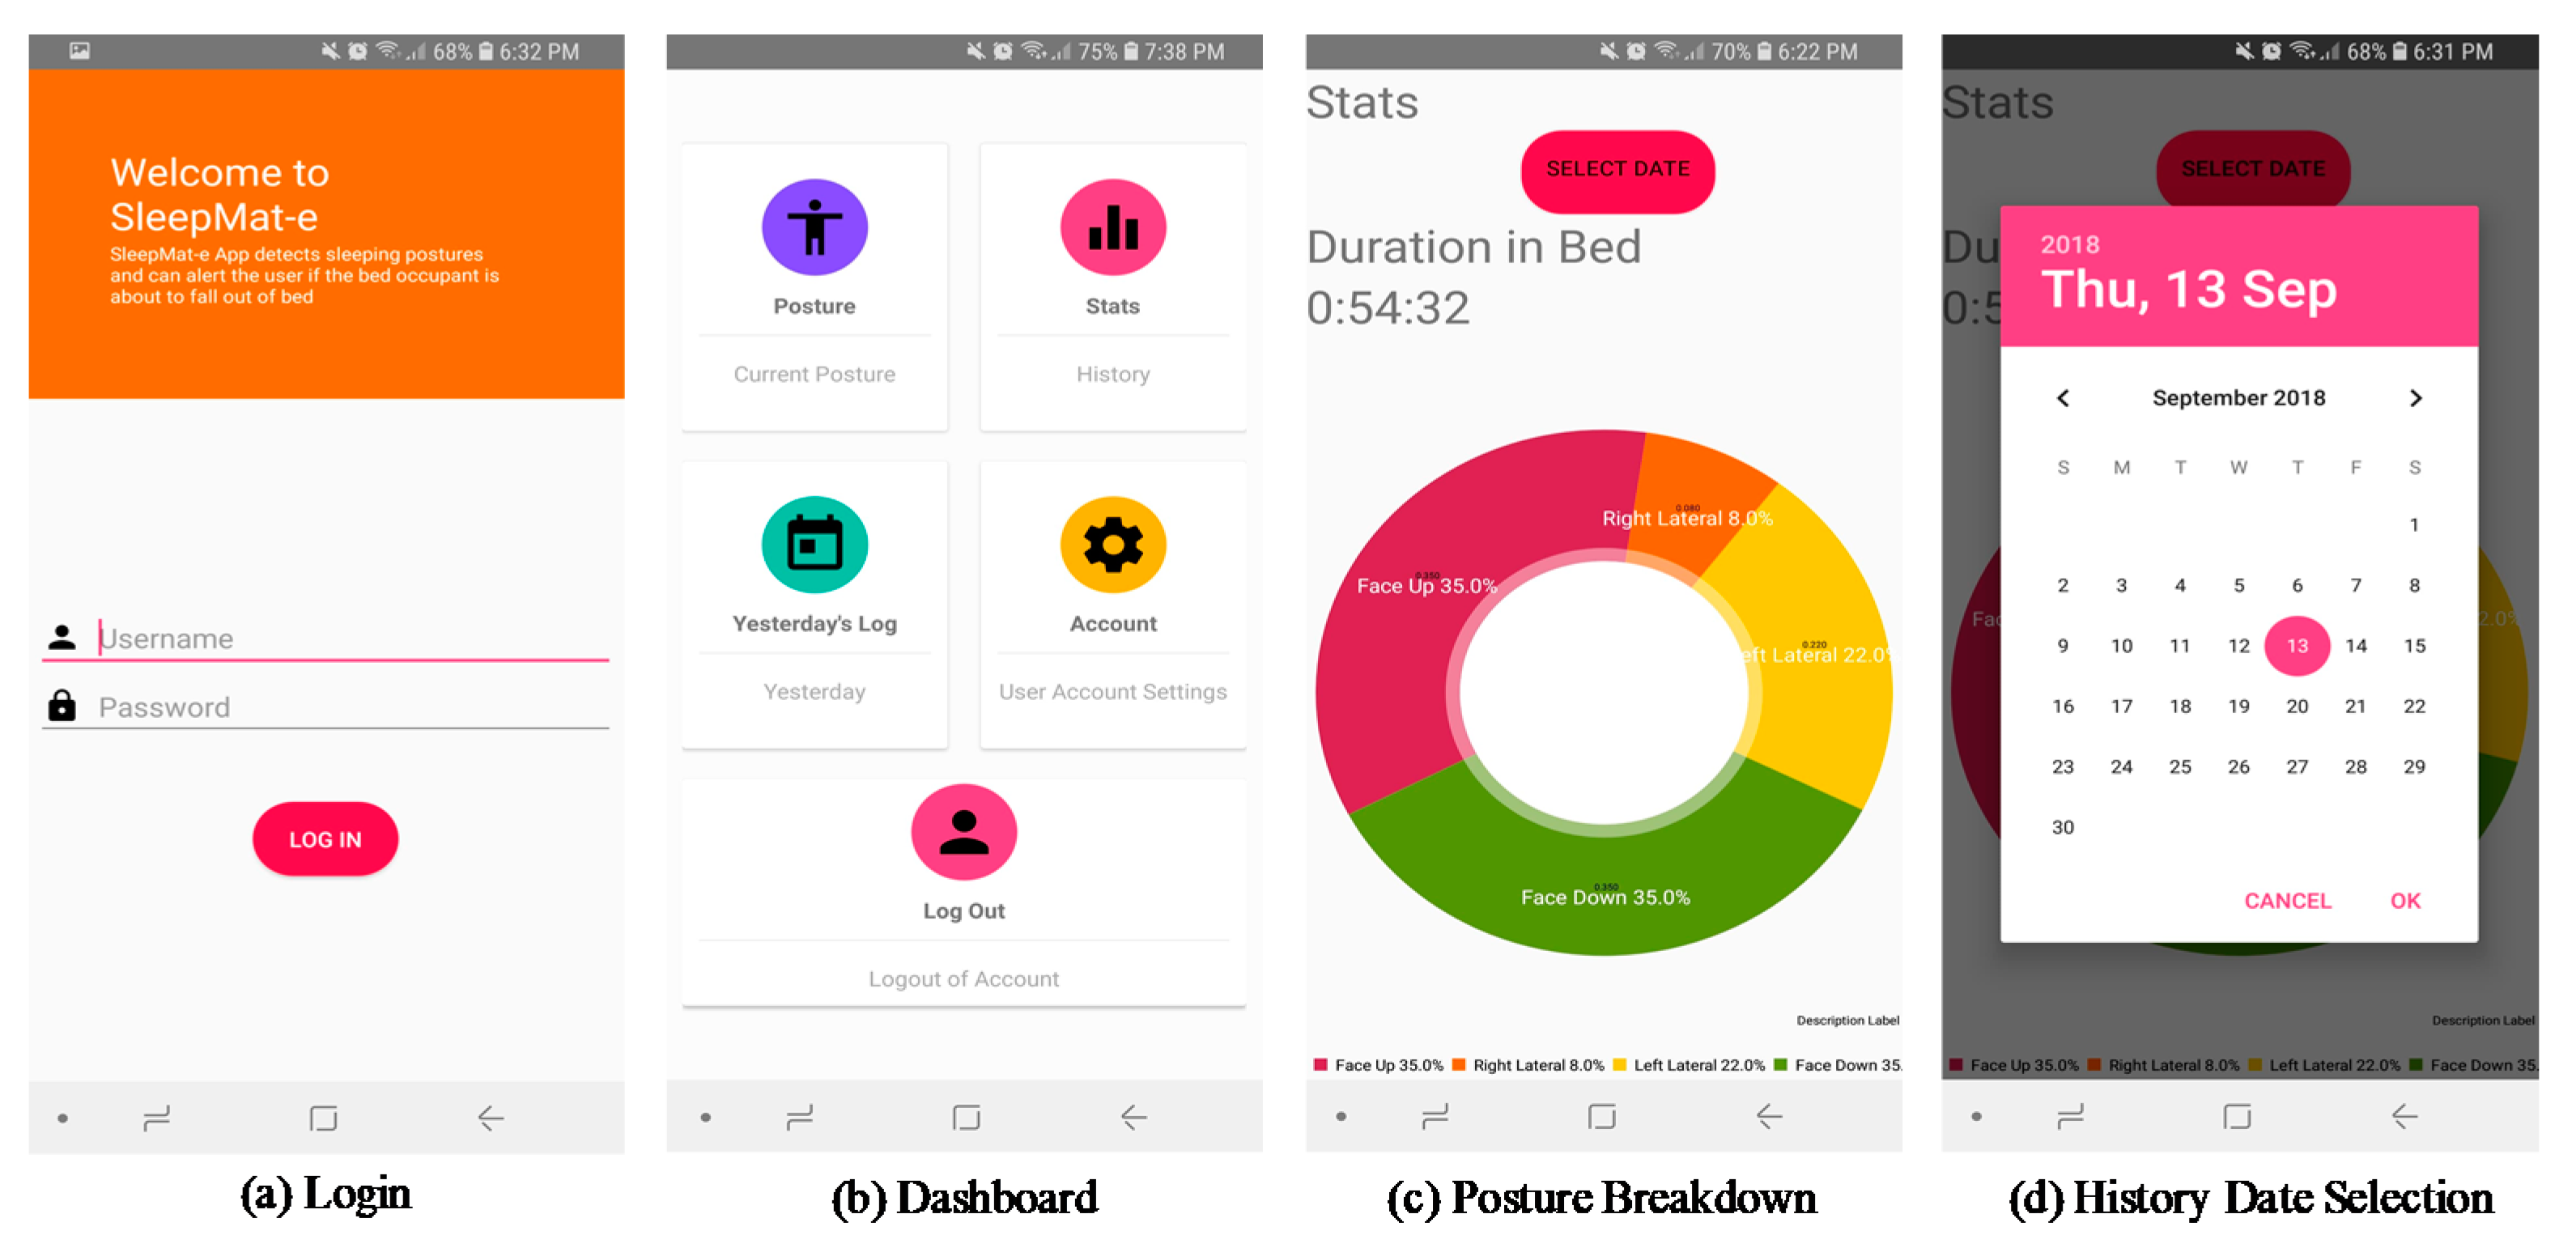
Figure 11 shows the screenshots of our Android app. The first screenshot is of the user login as shown in
Figure 11a. The user login screen also provides a general description of the application. In order to protect the unauthorized access of the data on the cloud, end-user is required to create a new account by entering personal details such as name, surname and email address. This information is used to create a new profile for the user. After the registration process is complete, the user may log in. In this way, only authorized end-users (health professionals or subject) can access the subject specific sleep related data. In order to provide enhanced security and privacy, we rely on the features provided by the AWS as well. Once a user has successfully logged in, the user can then access the dashboard as given in
Figure 11b from where the user can check the current occupancy status of the mat of whether someone is on the mat or not. ‘Posture’ option when clicked uses cartoon images as an indication of the current posture of the occupant. To get more details regarding the sleep posture for a given night, the user can select the ‘Stats’ option and then select a date through the calendar menu as shown in
Figure 11d. The ‘Stats’ option also provides information regarding the overall time in bed as demonstrated in
Figure 11c. This time is measured from midday of the selected date to the midday of the next day; a complete day.
3. Experimental Results
In order to confirm the validity of the proposed system, we conducted the accuracy-test for the recognition of the postures. The mat was placed over the bed and unobtrusive to users. The controller responsible for measurement and collection of data was ATMega32u4. Experiments were conducted by extracting the pressure data generated by the subject lying down on the mat and forming a data set. The subject simulated his sleeping postures by lying on mat for a period. In order to confirm the recognition accuracy, we constructed 200 data sets for each posture, and the following results given in
Table 3 were obtained. The ground truth was recorded by a camera and checked manually. The output of the original Inception-v3 network contains 1000 classes, but we had only 6 classes; therefore, we changed the number of output channels of the last layer from 1000 to 6. We divided the dataset randomly into training data and test data for each posture type according to a ratio of approximately 10:1. Also, we ensured that there was no overlapping of the original images between the two datasets. In order to reduce the storage capacity on cloud, we ensured that not duplicated data is sent to the cloud. For this reason, we take the accumulated value of all sensors outputs in a snapshot and subtract it from the preceding frame. The snapshot is transmitted with time stamp if differential exceeds a certain threshold. This technique reduced the amount of data transmitted, computation and storage required on cloud, and the power consumption at both ends.
The developed prototype could identify four different postures namely ‘Face up’, ‘Face Down’, ‘Right Lateral’, and ‘Left Lateral’ alongside generating fall warning, bedsore alerts, and bed occupancy status. Our system comes with an Android application, which allows a user to get statistical data regarding their sleep. TensorFlow machine learning library was used for the classification of the pressure images that are generated from the pressure sensors information sent by the microcontroller. The system exhibited a high accuracy of more than 90% when trained with the TensorFlow model as shown in
Table 4. The system performed well for all the different cases with the highest for unoccupied and edge, as these cases were the easiest to classify. Those Image-Net pre-trained networks are mainly trained from natural images which are different from the original images used. Although, model is fine-tuned through TL, the accuracy of the model can be further improved by fine tuning of the final layer with larger dataset.
The confusion matrix shows detailed analysis of classification outcomes from single annotated test data of a particular subject for six postures (including ‘unoccupied’). By analyzing the confusion matrices from different classifiers, the weights specified in voting fusion matrix are shown in
Table 5. There are two cases where confusion mainly occurs, that is, FU vs. FD and LL vs. RL and this may be due to variations of spatiality among subjects. The LL image is incorrectly identified as RL and vice versa. This typical kind of error can be explained from the pressure map that is extended behind the subject’s back, thus misclassifications can occur since the pressure image looks like a RL image. Similarly, FD and FU have 7% to 10% chance to be erroneously classified into the other. That is because these two postures have extremely similar snapshots due to the bilateral symmetry. Edge is also erroneously taken as unoccupied as in both cases majority of the sensors are not active.
The current posture is displayed on the app screen as shown in
Figure 12a. Fall Alert is triggered when the system detects that the user is close to either the left or the right edge of the mat, which can be seen in
Figure 12b. When the user leaves the bed, the ‘Bed Alert’ is triggered for the caregiver. This notifies the caregiver that the bed occupant has left the bed. Both alerts are intended to inform the android application user about the possibility that the user may fall or has fallen out of bed.
4. Discussion
In this section, we compare the obtained results to the state-of-the-art works similar to ours.
Table 6 summarizes the comparison of our approach with other unobtrusive methods based on the pressure sensor mattress and machine learning. The majority of the earlier work produced high accuracy but at the cost of higher number of sensors and computational cost. We have achieved competitive results with a low resolution mat. This is largely due to transfer learning which can build a relatively small training data set as the model is already pre-trained. The CNNs are trained with a relatively large date sets which take long time to train and data set might not be available at times. The transfer learning also reduces the training time as the knowledge learnt by a model when training with large data is reused in the new task which has a small data only.
Existing systems used specialized pressure mapping sensors integrating large arrays of FSR’s into thin profile mats. These could provide extremely accurate and high-resolution images as they had very high sensor densities, with many available solutions containing thousands of pressure sensors. Although they were very suitable for the task at hand but the costs of these systems is very high, upwards of thousands of US dollars, which makes it unaffordable for the average user. The total cost of the sensor mattress was less than $51 (tape, adhesive, conductive shielding, copper foil—price for 2 rolls $ 43; conductive sheet—price for 2 sheets is $8.7) i.e., less than $0.0025/cm2. As our target demographics were elderly patients in residential care facilities, the sensor technology needed to be comfortable and non-invasive as the mat was to be placed on the mattress of the patient’s bed. It needs to be very thin and comfortable. The material used to build the include copper foil with conductive adhesive having total thickness (backing plus adhesive) of 0.066 mm and conductive sheet of thickness 0.1 mm; hence, this accumulates to a total thickness of ~0.23 mm which is comparable to the commercial FSR sensor. The thickness calculations are based on the values obtained from the datasheet.
In order to reduce the pin count, shift registers, analog multiplexers (muxes) and direct I/O connections were considered for the supply of voltage to the 19 columns. A microcontroller would control the sequential activation of each line. Direct I/O connections were considered as no additional hardware was required. However, microcontrollers with lots of I/O pins were generally expensive to source and had large amounts of resources, such as memory and processing power, which would be unused in our application. Multiplexers can activate specific lines and could cater for all columns with just a single chip. However, multiplexers with 16 or more outputs per IC are expensive. The more economically feasible options were found to be the two-, four-, or eight-output ICs which would require at least nine control pins from a microcontroller. We also reduced the cost of the system and energy by building a customized hardware that included needed auxiliaries only thus avoiding the unnecessary power consumption in undesired components present in available commercial kits.
This system offered the flexibility and mobility by storing the data on cloud and made it possible to access data from anywhere and anytime with single click which is an invaluable feature in the healthcare. The reports and statistics about the sleep posture could help the health professionals diagnosing and making decisions based on the comprehensive and up to date data. This not only reduced the cost of diagnosis but also saves the time of the doctors spent otherwise in organizing the data for providing meaningful and useful information. The availability of the information could also be beneficial for the well-being of the elderly as they can keep track of their sleep posture and feedback on sleep posture might provide the much needed motivation to the subject struggling with the sleep posture related issues. Another unique feature of the proposed solution being pre-fall alerts as this real-time information could be vital for the safety of the elderly people. The care giver can intervene before an accident happens and the patient can sustain injuries incurring extra financial burden and stress.


