
Advanced Characterization and Sample Preparation Strategies for Nanoformulations

 , , ,
, , ,  and
and 
Abstract
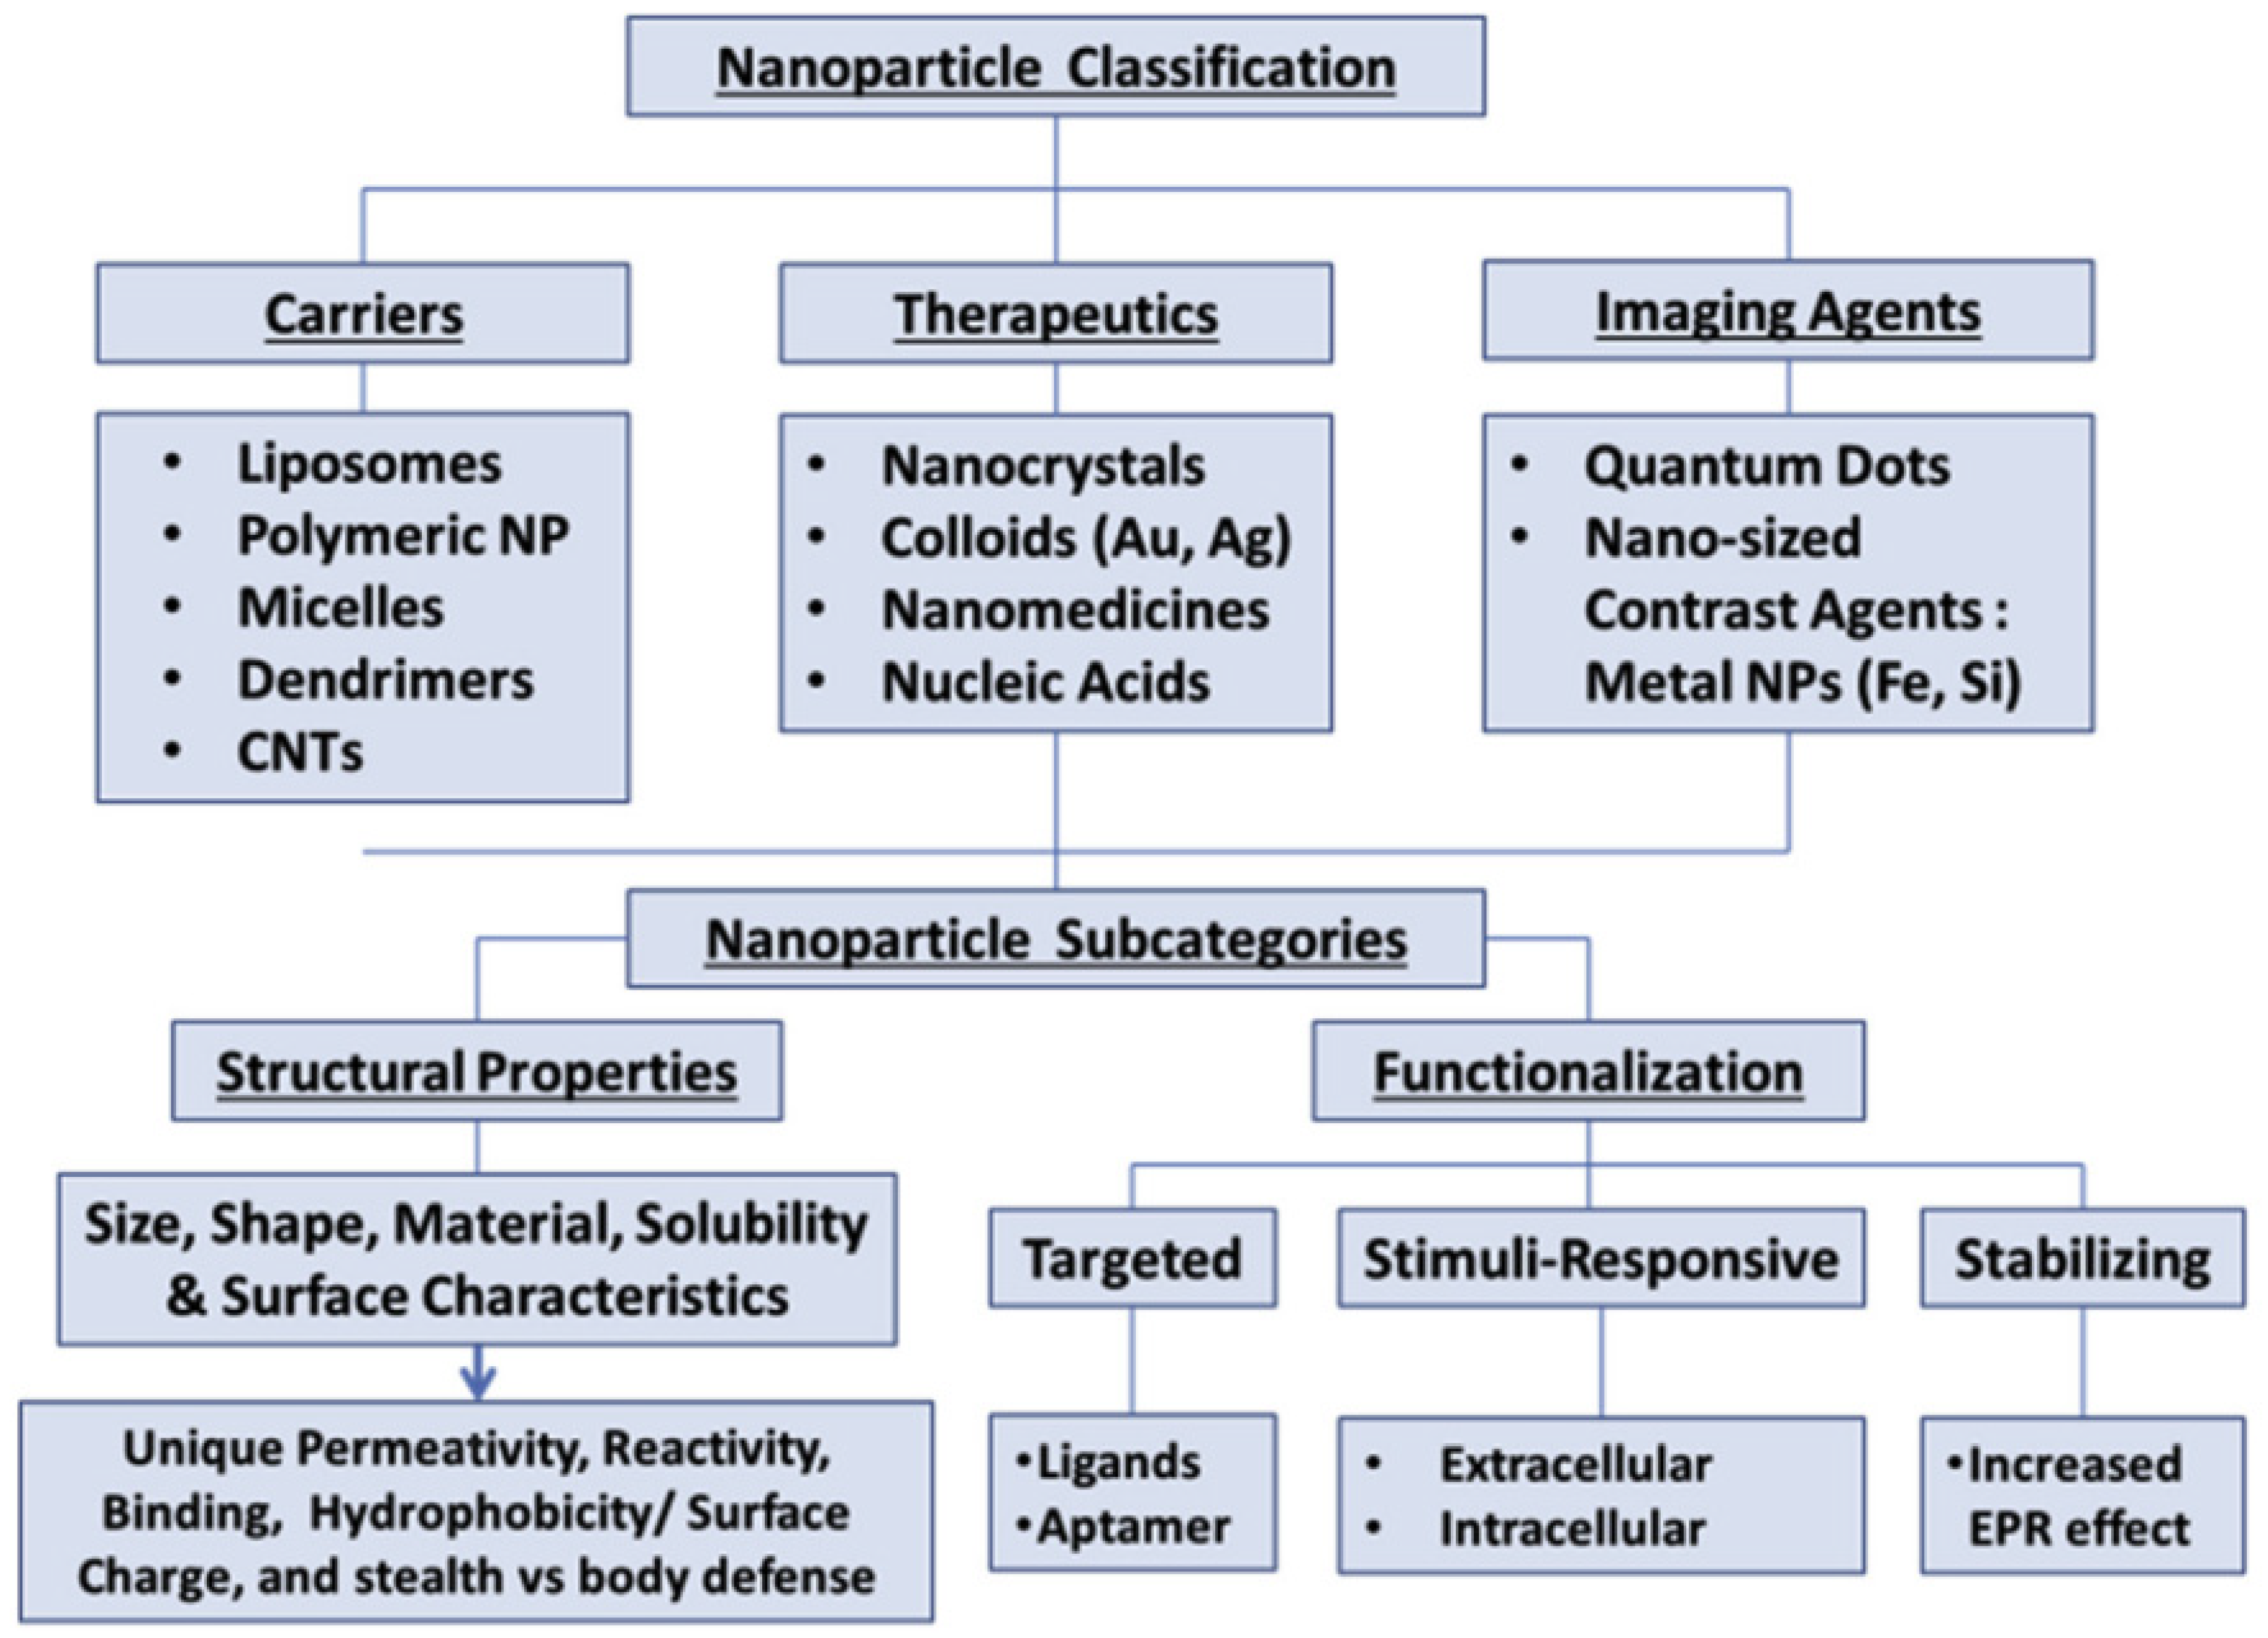
:1. Introduction
2. Analytical Techniques for Nano Formulation Characterization
2.1. Particle Size Analysis by DLS
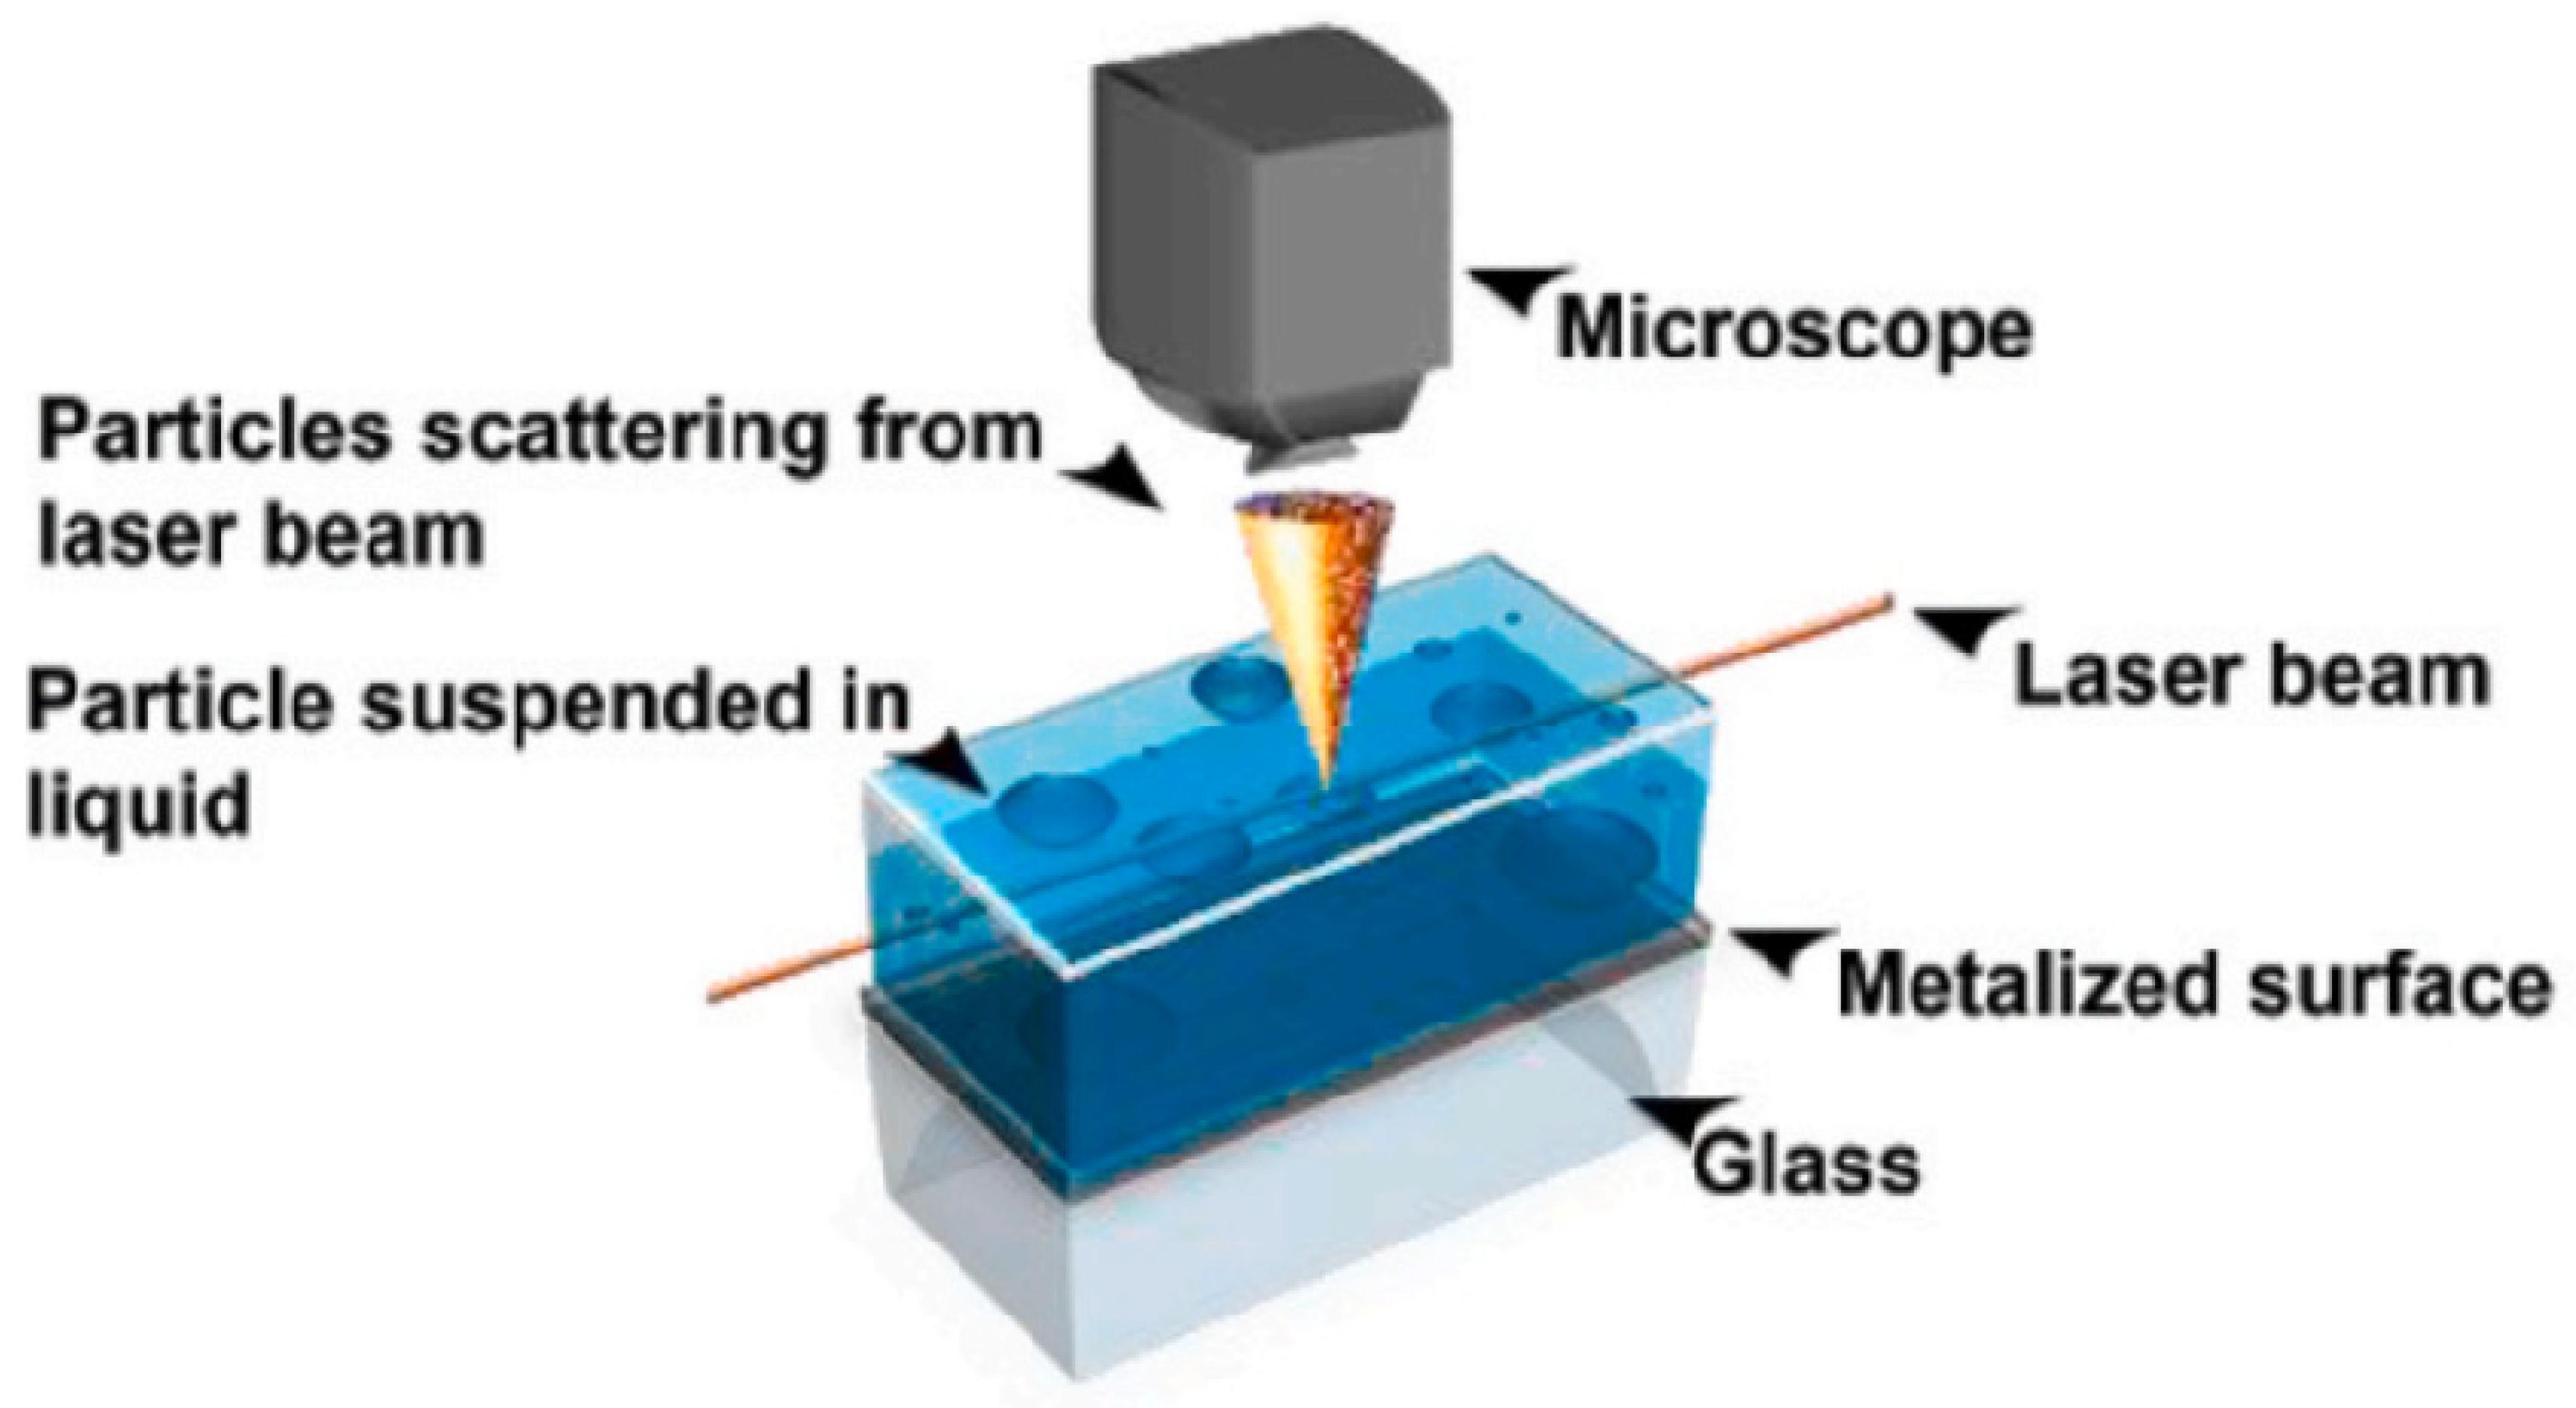
2.1.1. Working Principle
2.1.2. Sample Preparation
- A.
- Dry sample dissolution
- B.
- Liquid sample preparation
2.2. Scanning Electron Microscopy (SEM)
2.2.1. Working Principle of SEM
2.2.2. Sample Preparation for SEM
- A.
- Fixation
- B.
- Dehydration
- C.
- Drying
- D.
- Mounting
- E.
- Sputter coating
2.2.3. Newer Advancements in SEM
2.3. Cryogenic Scanning Electron Microscopy (Cryo-SEM)
2.3.1. Sample Preparation
2.3.2. New Technologies in Cryo-SEM
2.4. Transmission Electron Microscopy (TEM)
Sample Preparation
- A.
- Primary fixation
- B.
- Secondary fixation
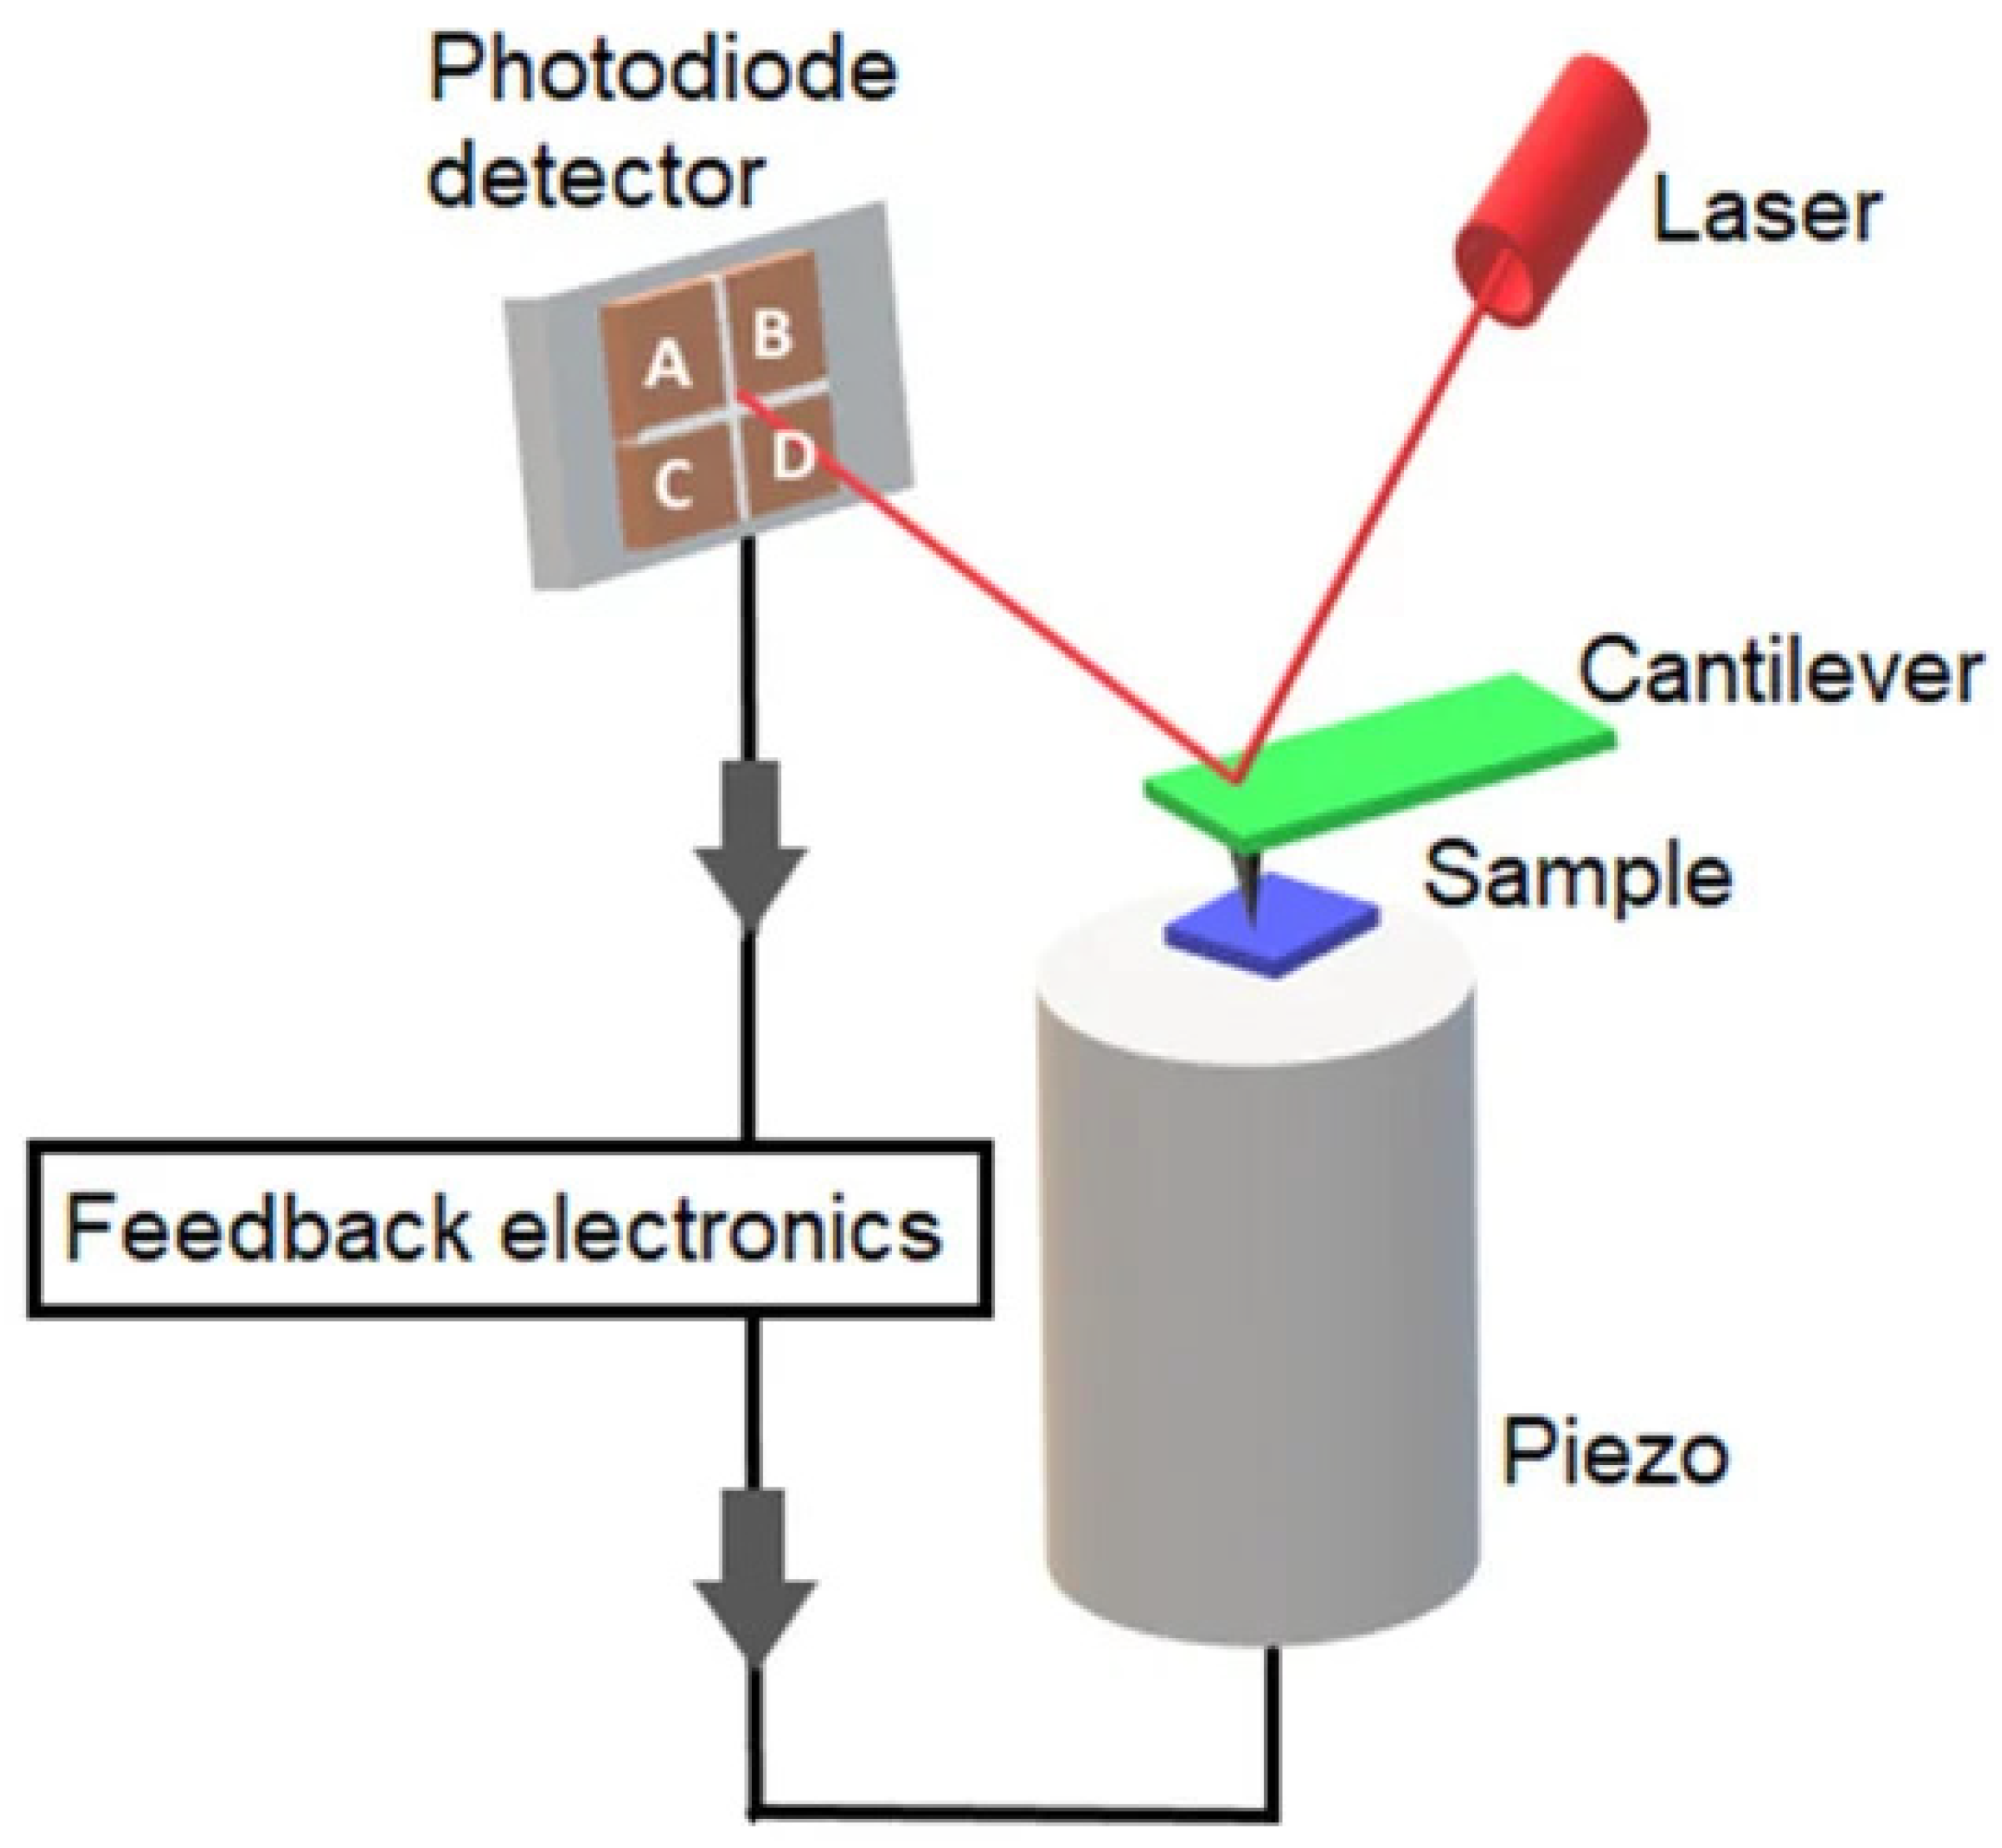
2.5. Atomic Force Microscopy (AFM)
Critical Components in AFM Sample Preparation
- A.
- Adhesives
- B.
- Substrate
2.6. Scanning Tunneling Microscopy (STM)
2.6.1. Working Principle
2.6.2. Sample Preparation/Sample Installation
2.7. X-ray Diffraction (XRD)
Sample Preparation Methodology for XRD
- A.
- Grinding
- The standard sample holder is selected to perform the RTS method and a glass piece with dimensions greater than an empty window in the Al-holder is selected. It is covered with a double-sided sticky tape.
- Transfer the powder onto the holder, which is premixed to avoid pre-existing orientations; the powder should be 3–5 mm deep into the cavity.
- A sharp razor edge is used to gently chop the powder in random directions which causes the initial compaction and uniform packing in the cavity. The movement of the blade is kept vertical to avoid a shearing motion on the surface of the holder.
- The powder is tamped in a horizontal motion path from the center to either direction by pushing the blade up and down at a 30–45 angle to vertical. This helps to remove any excess powder from the cavity.
- Air is blown across the surface of the holder to remove a loose surplus. The loose surplus should not be removed with a razor blade.
- The steps must be repeated multiple times until a flat and smooth powder mount is obtained [89].
2.8. Inductively Coupled Mass Spectroscopy (ICP-MS)
2.8.1. Sample Preparation for Liquids
2.8.2. Sample Preparation for Solids
2.8.3. Sample Introduction
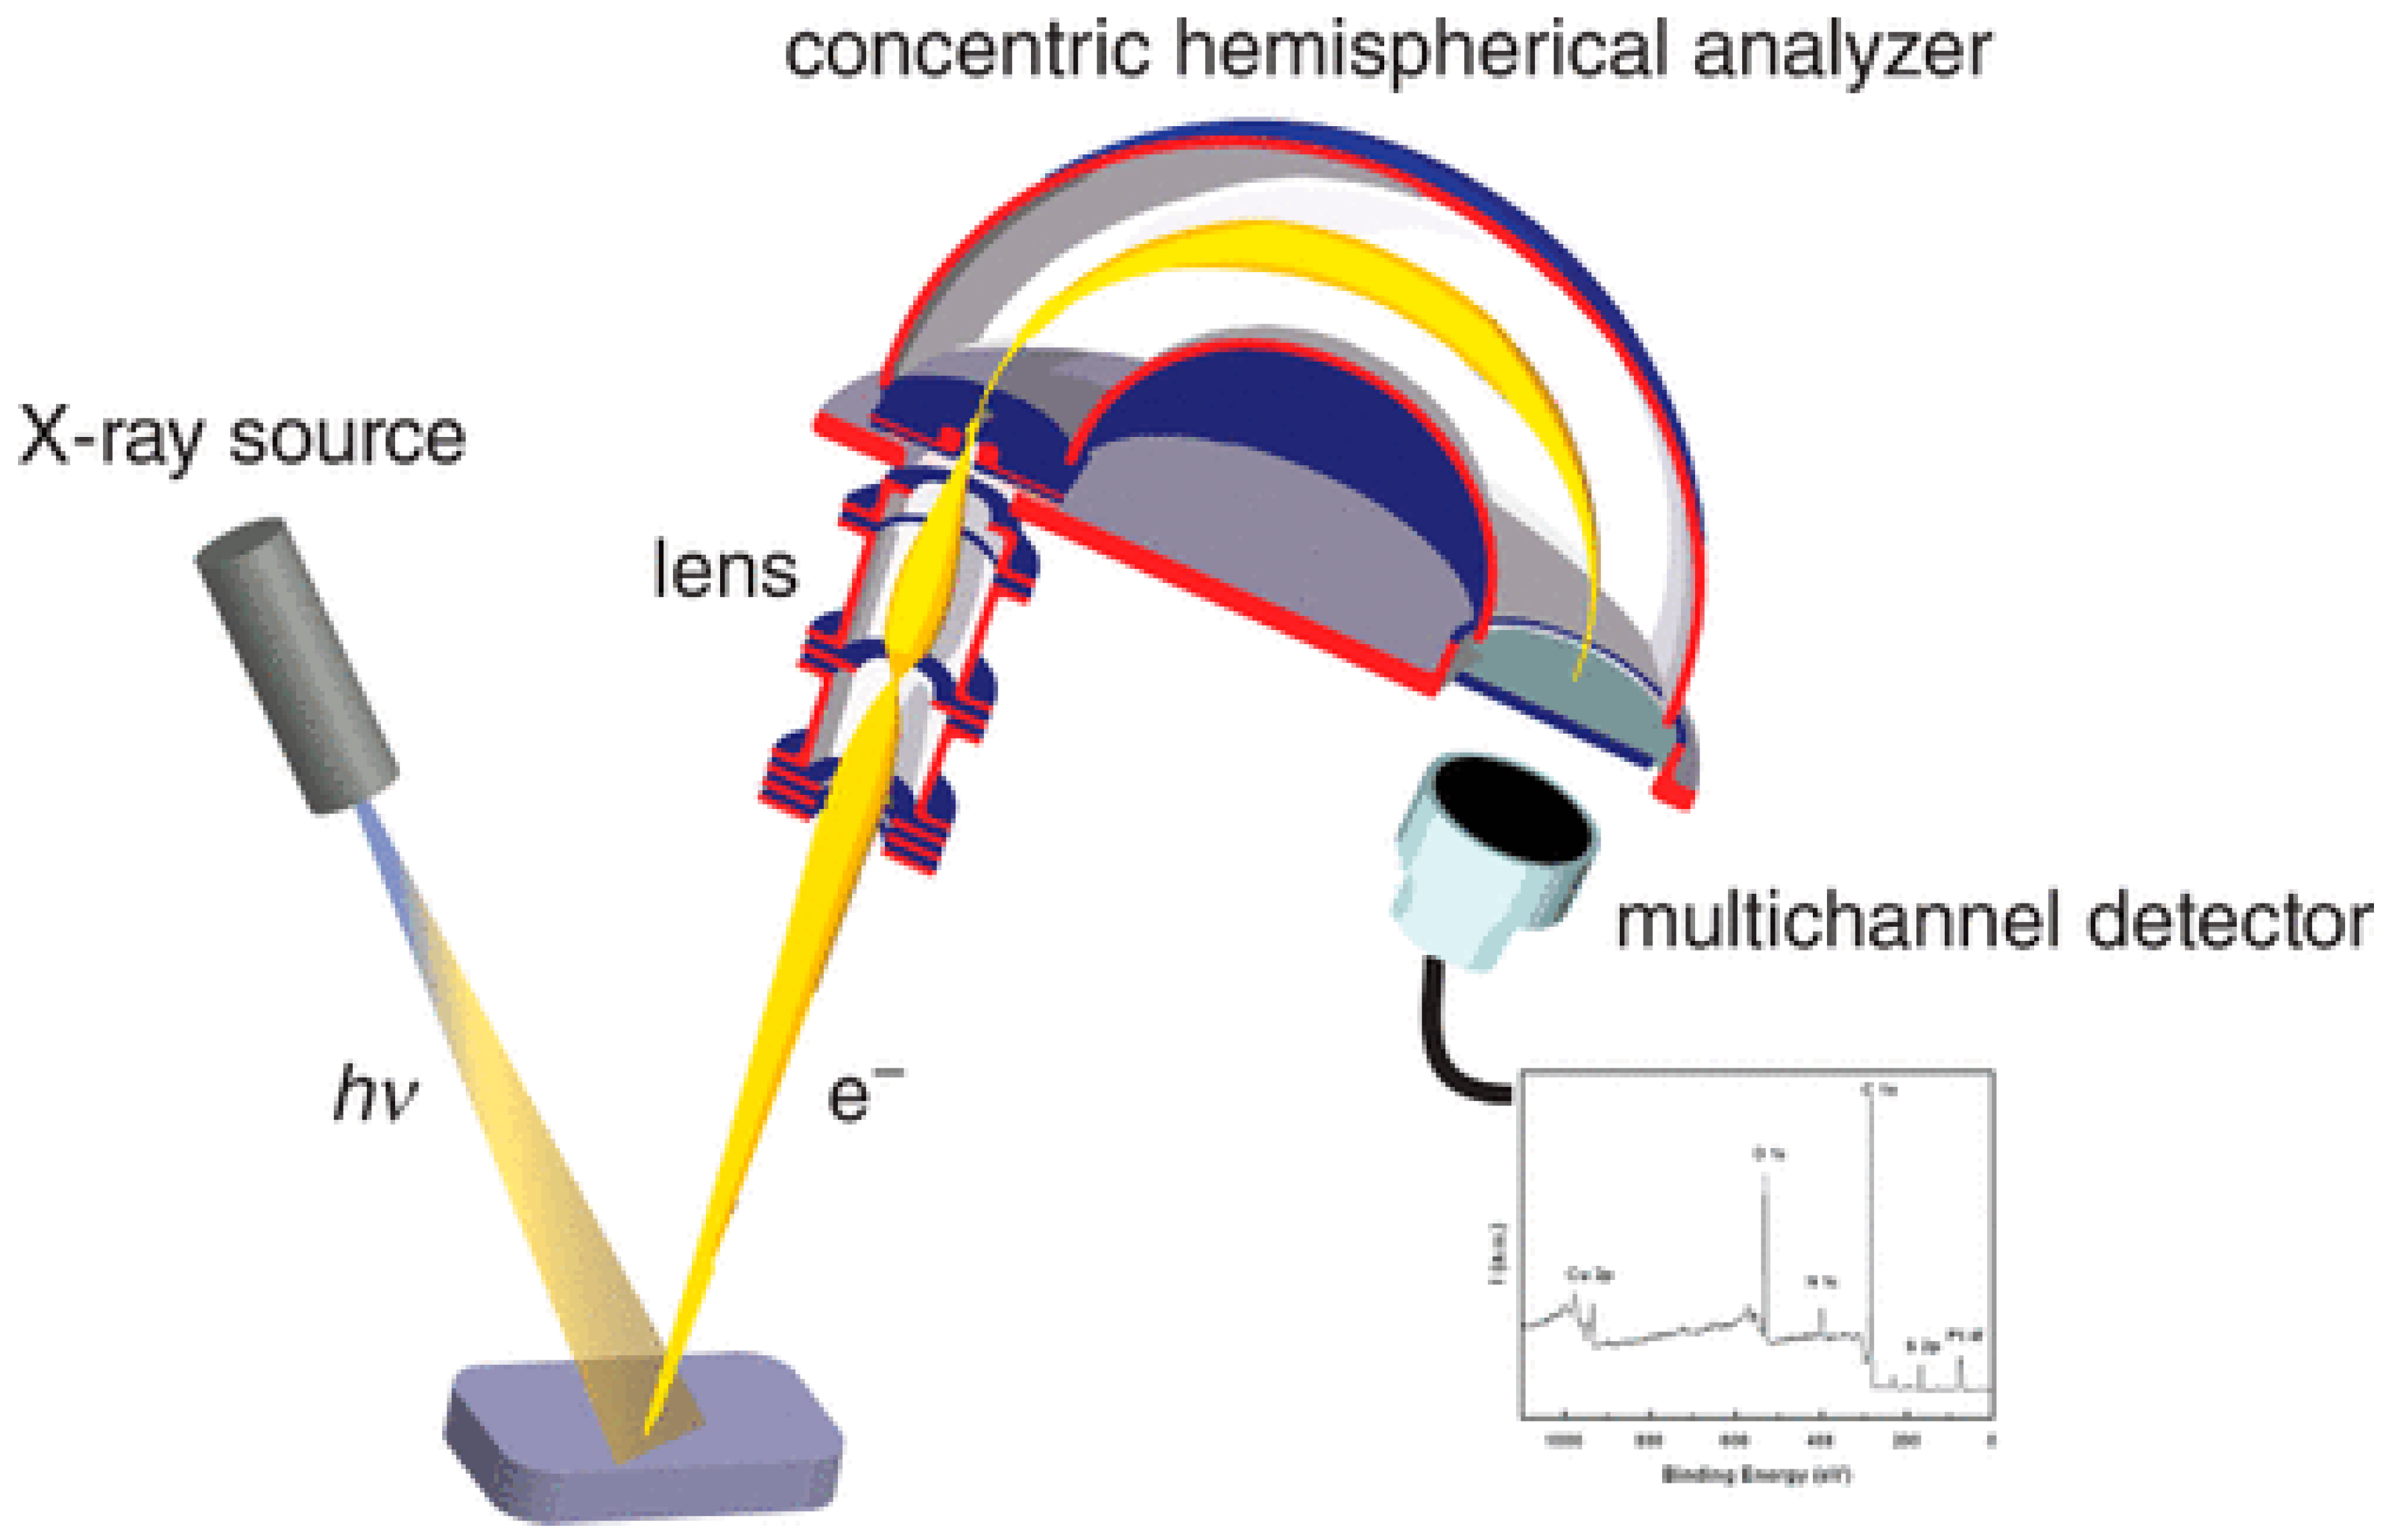
2.9. X-ray Photon Electron Spectroscopy (XPS) or Electron Spectroscopy for Chemical Analysis (ESCA)
2.9.1. Working Principle
2.9.2. Sample Preparation for XPS
3. Conclusions
Author Contributions
Funding
Acknowledgments
Conflicts of Interest
References
- Rana, D.; Salave, S.; Longare, S.; Agarwal, R.; Kalia, K.; Benival, D. Nanotherapeutics in Tumour Microenvironment for Cancer Therapy. Nanosci. Nanotechnol. Asia 2021, 12, 32–47. [Google Scholar] [CrossRef]
- Karunakaran, B.; Vitore, J.; Sharma, A.; Rana, D.; Benival, D. Nanocarriers for Delivery of Peptide Antibiotics; AAPS Advances in the Pharmaceutical Sciences Series; Springer: Cham, Switzerland, 2023; Volume 56, pp. 1–34. [Google Scholar] [CrossRef]
- Jadhav, A.; Salave, S.; Rana, D.; Benival, D. Development and In-Vitro Evaluation of Dexamethasone Enriched Nanoemulsion for Ophthalmic Indication. Drug Deliv. Lett. 2023, 13, 196–212. [Google Scholar] [CrossRef]
- Salave, S.; Rana, D.; Pardhe, R.; Bule, P.; Benival, D. Unravelling Micro and Nano Vesicular System in Intranasal Drug Delivery for Epilepsy. Pharm. Nanotechnol. 2022, 10, 182–193. [Google Scholar] [CrossRef] [PubMed]
- Rana, D.; Salave, S.; Jain, S.; Shah, R.; Benival, D. Systematic Development and Optimization of Teriparatide-Loaded Nanoliposomes Employing Quality by Design Approach for Osteoporosis. J. Pharm. Innov. 2022, 18, 548–562. [Google Scholar] [CrossRef]
- Salave, S.; Rana, D.; Vitore, J.; Jain, A. Functionalized Carbon Nanotubes for Cell Tracking. In Functionalized Carbon Nanotubes for Biomedical Applications; Aslam, J., Hussain, C.M., Aslam, R., Eds.; Wiley & Sons: New York, NY, USA, 2023; pp. 319–338. [Google Scholar]
- Salave, S.; Rana, D.; Benival, D. Peptide Functionalised Nanocarriers for Bone Specific Delivery of PTH (1-34) in Osteoporosis. Curr. Nanomed. 2021, 11, 142–148. [Google Scholar] [CrossRef]
- Desai, N.; Rana, D.; Pande, S.; Salave, S.; Giri, J.; Benival, D.; Kommineni, N. “Bioinspired” Membrane-Coated Nanosystems in Cancer Theranostics: A Comprehensive Review. Pharmaceutics 2023, 15, 1677. [Google Scholar] [CrossRef] [PubMed]
- Salave, S.; Rana, D.; Benival, D. Encapsulation of Anabolic Peptide in Lipid Nano Vesicles for Osteoporosis. Curr. Protein Pept. Sci. 2022, 23, 495–503. [Google Scholar] [CrossRef] [PubMed]
- Salave, S.; Rana, D.; Kumar, H.; Kommineni, N.; Benival, D. Anabolic Peptide-Enriched Stealth Nanoliposomes for Effective Anti-Osteoporotic Therapy. Pharmaceutics 2022, 14, 2417. [Google Scholar] [CrossRef] [PubMed]
- Salave, S.; Shinde, S.D.; Rana, D.; Sahu, B.; Kumar, H.; Patel, R.; Benival, D.; Kommineni, N. Peptide Engraftment on PEGylated Nanoliposomes for Bone Specific Delivery of PTH (1-34) in Osteoporosis. Pharmaceutics 2023, 15, 608. [Google Scholar] [CrossRef] [PubMed]
- Lucena, R.; Simonet, B.M.; Cárdenas, S.; Valcárcel, M. Potential of Nanoparticles in Sample Preparation. J. Chromatogr. A 2011, 1218, 620–637. [Google Scholar] [CrossRef]
- Gartner Hype Cycle Research Methodology|Gartner. Available online: https://www.gartner.com/en/research/methodologies/gartner-hype-cycle (accessed on 2 July 2024).
- Sample Preparation Fundamentals for chromatography. Available online: https://www.agilent.com/cs/library/primers/Public/5991-3326EN_SPHB.pdf?srsltid=AfmBOoqOLEAMEW9dEDV8htyqwPNb62EY5YWdO-n-g2VBdvCwwtjXXrjD (accessed on 11 August 2024).
- Singer, A.; Barakat, Z.; Mohapatra, S.; Mohapatra, S.S. Nanoscale Drug-Delivery Systems: In Vitro and In Vivo Characterization. In Nanocarriers for Drug Delivery; Elsevier: Amsterdam, The Netherlands, 2018; pp. 395–419. [Google Scholar] [CrossRef]
- Hassan, P.A.; Rana, S.; Verma, G. Making Sense of Brownian Motion: Colloid Characterization by Dynamic Light Scattering. Langmuir 2015, 31, 3–12. [Google Scholar] [CrossRef]
- Dynamic Light Scattering DLS|Malvern Panalytical. Available online: https://www.malvernpanalytical.com/en/products/technology/light-scattering/dynamic-light-scattering (accessed on 25 July 2024).
- Vladár, A.E.; Postek, M.T.; Ming, B. On the Sub-Nanometer Resolution of Scanning Electron and Helium Ion Microscopes. Microc. Today 2009, 17, 6–13. [Google Scholar] [CrossRef]
- Stachowiak, G.W.; Batchelor, A.W.; Stachowiak, G.B. Surface Micrography and Analysis. Tribol. Ser. 2004, 44, 165–220. [Google Scholar] [CrossRef]
- Wightman, R. An Overview of Cryo-Scanning Electron Microscopy Techniques for Plant Imaging. Plants 2022, 11, 1113. [Google Scholar] [CrossRef] [PubMed]
- Ali, A.; Chiang, Y.W.; Santos, R.M. X-ray Diffraction Techniques for Mineral Characterization: A Review for Engineers of the Fundamentals, Applications, and Research Directions. Minerals 2022, 12, 205. [Google Scholar] [CrossRef]
- Mei, L.; Guan, G. Profilometry and Atomic Force Microscopy for Surface Characterization. Nano TransMed 2023, 2, e9130017. [Google Scholar] [CrossRef]
- Simpliciano, C.; Clark, L.; Asi, B.; Chu, N.; Mercado, M.; Diaz, S.; Goedert, M.; Mobed-Miremadi, M.; Simpliciano, C.; Clark, L.; et al. Cross-Linked Alginate Film Pore Size Determination Using Atomic Force Microscopy and Validation Using Diffusivity Determinations. J. Surf. Eng. Mater. Adv. Technol. 2013, 3, 1–12. [Google Scholar] [CrossRef]
- Wilschefski, S.C.; Baxter, M.R. Inductively Coupled Plasma Mass Spectrometry: Introduction to Analytical Aspects. Clin. Biochem. Rev. 2019, 40, 115–133. [Google Scholar] [CrossRef] [PubMed]
- Pintori, G.; Cattaruzza, E. XPS/ESCA on Glass Surfaces: A Useful Tool for Ancient and Modern Materials. Opt. Mater. X 2022, 13, 100108. [Google Scholar] [CrossRef]
- Iego, S.A.N.D. NANO COMPOSIX’S GUIDE TO DYNAMIC LIGHT SCATTERING MEASUREMENT AND ANALYSIS; NanoComposix: San Diego, CA, USA, 2015; pp. 1–8. [Google Scholar]
- Mohammadi, M.; Zargartalebi, H.; Salahandish, R.; Aburashed, R.; Wey Yong, K.; Sanati-Nezhad, A. Emerging Technologies and Commercial Products in Exosome-Based Cancer Diagnosis and Prognosis. Biosens. Bioelectron. 2021, 183, 113176. [Google Scholar] [CrossRef]
- Farrell, E.; Brousseau, J.L. Guide for DLS Sample Preparation. Brookhaven Instrum. 2014, 1, 1–3. [Google Scholar]
- Hellmanex® III. Available online: https://www.hellma.com/en/laboratory-supplies/cuvettes/hellmanex-cleaning-concentrate (accessed on 11 August 2024).
- NanoLab 3D™. Available online: https://lsinstruments.ch/en/applications-library/application-notes/dls-microviscosimetry-with-the-nanolab-3d-a-novel-approach-to-measure-viscosity#:~:text=The%20NanoLab%203D%E2%84%A2%20is,longer%20required%20for%20most%20samples (accessed on 11 August 2024).
- Search, H.; Journals, C.; Contact, A.; Iopscience, M.; Address, I.P. Monomode Fibre Components for Dynamic Light Scattering. J. Phys. E Sci. Instrum. 1987, 20, 1503. [Google Scholar]
- Dhadwal, H.S.; Chu, B.; Chu, B. A Fiberoptic Lightscattering Spectrometer. Rev. Sci. Instrum. 1989, 60, 845–853. [Google Scholar] [CrossRef]
- Chastek, T.Q.; Beers, K.L.; Amis, E.J.; Chastek, T.Q.; Beers, K.L.; Amis, E.J. Miniaturized Dynamic Light Scattering Instrumentation for Use in Microfluidic Applications Miniaturized Dynamic Light Scattering Instrumentation for Use in Microfluidic Applications. Rev. Sci. Instrum. 2012, 78, 072201. [Google Scholar] [CrossRef] [PubMed]
- Hinterwirth, H.; Wiedmer, S.K.; Moilanen, M.; Lehner, A.; Allmaier, G.; Waitz, T.; Lindner, W.; Lämmerhofer, M. Comparative Method Evaluation for Size and Size-Distribution Analysis of Gold Nanoparticles. J. Sep. Sci. 2013, 36, 2952–2961. [Google Scholar] [CrossRef] [PubMed]
- Mohammed, A.; Abdullah, A. Scanning Electron Microscopy (SEM): A Review. In Proceedings of the 2018 International Conference on Hydraulics and Pneumatics—HERVEX, Băile Govora, Romania, 7–9 November 2019. [Google Scholar]
- Ali, A.; Zhang, N.; Santos, R.M. Mineral Characterization Using Scanning Electron Microscopy (SEM): A Review of the Fundamentals, Advancements, and Research Directions. Appl.Sci. 2023, 13, 12600. [Google Scholar] [CrossRef]
- Williams, D.B.; Carter, C.B. The Transmission Electron Microscopy; Springer: Boston, MA, USA, 1996; ISBN 978-1-4757-2519-3. [Google Scholar]
- Scanning Electron Microscopy. Available online: https://www.nanoscience.com/techniques/scanning-electron-microscopy/ (accessed on 11 August 2024).
- SEM Sample Preparation. Available online: https://www.thermofisher.com/us/en/home/materials-science/learning-center/applications/sample-preparation-techniques-sem.html (accessed on 11 August 2024).
- Kashi, A.M.; Tahermanesh, K.; Chaichian, S.; Joghataei, M.T. How to Prepare Biological Samples and Live Tissues for Scanning Electron Microscopy (SEM). Galen Med. J. 2014, 3. [Google Scholar] [CrossRef]
- Kumar, S.P.; Balaji, D.; Mandlimath, T.R. Characterization of Flexible Ceramics. In Advanced Flexible Ceramics; Gupta, R.K., Behera, A., Farhad, S., Nguyen, T.A., Eds.; Elsevier Inc.: Amsterdam, The Netherlands, 2023; pp. 25–43. [Google Scholar] [CrossRef]
- Wisse, E.; Braet, F.; Duimel, H.; Vreuls, C.; Koek, G.; Wm, S.; Damink, O.; Van Den Broek, M.A.J.; De Geest, B.; Dejong, C.H.C.; et al. Fixation Methods for Electron Microscopy of Human and Other Liver. World J. Gastroenterol. WJG 2010, 16, 2851–2866. [Google Scholar] [CrossRef]
- Bell, P.B.; Safiejko-mroczka, B. Preparing Whole Mounts of Biological Specimens for Imaging Macromolecular Structures by Light and Electron Microscopy. Int. J. Imaging Syst. Technol. 1997, 8, 225–239. [Google Scholar] [CrossRef]
- Review, I. Sample Preparation Procedures for Biological Atomic Force Microscopy. J. Microsc. 2005, 218, 199–207. [Google Scholar]
- Hazrin Chong, N.H.; Manefield, M. An alternative SEM drying method using hexamethyldisilazane (HMDS) for microbial cell attachment studies on sub-bituminous coal. J. Microbiol. Methods. 2012, 90, 96–99. [Google Scholar] [CrossRef] [PubMed]
- Hochberg, R.; Litvaitis, M.K. Hexamethyldisilazane for Scanning Electron Microscopy of Gastrotricha. Biotech. Histochem. 2000, 75, 41–44. [Google Scholar] [CrossRef] [PubMed]
- Critical Point Drying—What Is It? Available online: https://www.emsdiasum.com/docs/technical/datasheet/critical_drying (accessed on 11 August 2024).
- Ting-beall, H.P.; Zhelev, D.V.; Hochmuth, R.M. Comparison of Different Drying Procedures for Scanning Electron Microscopy Using Human Leukocytes. Microsc. Res. Tech. 1995, 361, 357–361. [Google Scholar] [CrossRef] [PubMed]
- Michael, J.; Dykstra, L.E.R. Specimen Prepartion for Electron Microscopy. In Biological Electron Microscopy; Springer: New York, NY, USA, 2023; pp. 1–73. [Google Scholar]
- Scanning Electron Microscope. Available online: https://www.leica-microsystems.com/c/am/lsr-n/sputter-coater-ppc/?nlc=20231229-SFDC-019285&utm_source=google&utm_medium=cpc&utm_campaign=23-AM-LSR-L3-NAPF-GOOG-PP-Sputter-Coater-Search&utm_content=text_ad&utm_term=sputter%20coating&gad_source=1&gclid=Cj0KCQjwwuG1BhCnARIsAFWBUC2jtfvNHZQcmBccyWu2AwWCECFZSEyTmlGO2nY9Yq2wU4BrTfFXmNYaAm20EALw_wcB#gad_source=1 (accessed on 11 August 2024).
- Thermo Fischer Scientific Sputter Coating for SEM: How This Sample Preparation Technique Assists Your Imaging. Available online: https://www.thermofisher.cn/cn/zh/home/global/forms/industrial/sputter-coating-sem.html (accessed on 11 August 2024).
- Athene, M.D. The use of environmental scanning electron microscopy for imaging wet and insulating materials. Nat. Mater. 2003, 2, 511–516. [Google Scholar] [CrossRef]
- Bell, B. Cryosputtering—A Combined Freeze-Drying and Sputtering Method for High-Resolution Electron Microscopy. J. Microsc. 1991, 161, 229–239. [Google Scholar]
- Kawasaki, H.; Itoh, T.; Takaku, Y.; Suzuki, H.; Kosugi, I.; Meguro, S. The NanoSuit Method: A Novel Histological Approach for Examining Paraf Fi n Sections in a Nondestructive Manner by Correlative Light and Electron Microscopy. Lab. Investig. 2019, 100, 161–173. [Google Scholar] [CrossRef] [PubMed]
- Diego, S.; Jolla, L.; Jolla, L.; Diego, S.; Jolla, L. High-Performance Serial Block-Face SEM of Nonconductive Biological Samples Enabled by Focal Gas Injection-Based. J. Microsc. 2017, 270, 142–149. [Google Scholar] [CrossRef]
- One Tool, Many Opportunities: Modern Focused Ion Beam Scanning Electron Microscopy. Available online: https://www.zeiss.com/microscopy/us/service-support/upgrades/fe-sem.html (accessed on 11 August 2024).
- Retamal, R.R. Effects of Sample Preparation on Particle Size Distributions of Different Types of Silica in Suspensions. Nanomaterials 2018, 8, 454. [Google Scholar] [CrossRef] [PubMed]
- Mandzy, N.; Grulke, E.; Druffel, T. Breakage of TiO2 Agglomerates in Electrostatically Stabilized Aqueous Dispersions. Powder Technol. 2005, 160, 121–126. [Google Scholar] [CrossRef]
- Ghomrasni, N.B.; Chivas-joly, C.; Devoille, L.; Feltin, N. Challenges in Sample Preparation for Measuring Nanoparticles Size by Scanning Electron Microscopy from Suspensions, Powder Form and Complex Media. Powder Technol. 2019, 359, 226–237. [Google Scholar] [CrossRef]
- Greiser, J. Advances in Cryo-SEM: From Micrometers to Nanometers. Am. Lab. 2009, 41, 11–13. [Google Scholar]
- Cheng, D.; Mitchell, D.R.G.; Shieh, D.; Braet, F. Practical Considerations in the Successful Preparation of Specimens for Thin-Film Cryo-Transmission Electron Microscopy. In Current Microscopy Contributions to Advances in Science and Technology; Mendez-Vilas, A., Ed.; FORMATEX: Badajoz, Spain, 2006. [Google Scholar]
- Thompson, R.F.; Walker, M.; Siebert, C.A.; Muench, S.P.; Ranson, N.A. An Introduction to Sample Preparation and Imaging by Cryo-Electron Microscopy for Structural Biology. Methods 2023, 100, 3–15. [Google Scholar] [CrossRef] [PubMed]
- Rubino, S.; Melin, P.; Spellward, P.; Leifer, K. Cryo-Electron Microscopy Specimen Preparation by Means of a Focused Ion Beam. J. Vis. Exp. 2014, 89, e51463. [Google Scholar] [CrossRef]
- Dubochet, J.; Adrian, M.; Chang, J.; Homo, J.; Lepault, J.; Mcdowall, A.W.; Schultz, P. Cryo-Electron Microscopy of Vitrified Specimens. Q. Rev. Biophys. 1988, 2, 129–228. [Google Scholar] [CrossRef]
- Talmon, Y. The study of nanostructured liquids by cryogenic-temperature electron microscopy—A status report. J. Mol. Liq. 2015, 210, 2–8. [Google Scholar] [CrossRef]
- Talmon, Y.; Davis, H.T.; Scriven, L.E.; Thomas, E.L.; Talman, Y.; Davis, H.T.; Scriven, L.E.; Thomasa, E.L. Coldstage Microscopy System for Fastfrozen Liquids Cold-Stage Microscopy System for Fast-Frozen Liquids. Rev. Sci. Instrum. 2014, 50, 698–704. [Google Scholar] [CrossRef] [PubMed]
- Issman, L. Cryo-SEM Specimen Preparation Under Controlled Temperature and Cryo-SEM Specimen Preparation under Controlled Temperature. J. Microsc. 2017, 246, 60–69. [Google Scholar] [CrossRef] [PubMed]
- Bellare, J.R.; Davis, H.T.; Scriven, L.E.; Talmon, Y. Controlled Environment Vitrification System: An Improved Sample Preparation Technique. J. Electron Microsc. Tech. 1988, 111, 87–111. [Google Scholar] [CrossRef] [PubMed]
- Miller, D.D.; Bellare, J.R.; Evans, D.F.; Talmon, Y.; Ninham, B.W. Meaning and Structure of Amphiphilic Phases: Inferences from Video-Enhanced Microscopy and Cryotransmission Electron Microscopy. J. Phys. Chem. 1987, 91, 674–685. [Google Scholar] [CrossRef]
- Walker, J.F.; Moore, D.F.; Whitney, J.T. Focused Ion Beam Processing for Microscale Fabrication. Microelectron. Eng. 1996, 30, 517–522. [Google Scholar] [CrossRef]
- Available online: https://analyticalscience.wiley.com/content/article-do/one-tool-many-opportunities-modern-focused-ion-beam-scanning-electron-microscopy (accessed on 13 August 2024).
- Reyes, R.; Shaapur, F.; Griffiths, D.; Diebold, A.C.; Foran, B. Automated SEM and TEM Sample Preparation Applied to Copper/Low k Materials Automated SEM and TEM Sample Preparation Applied to CopperLow k Materials. AIP Conf. Proc. 2001, 550, 580–585. [Google Scholar]
- Hauser, J.; Kylberg, G.; Colomb-delsuc, M.; Stemme, G.; Sintorn, I.; Roxhed, N. A microfluidic device for TEM sample preparation. Lab Chip 2020, 20, 4186–4193. [Google Scholar] [CrossRef] [PubMed]
- Wen, H.; Lin, Y.; Seidman, D.N.; Schoenung, J.M.; Van Rooyen, I.J.; Lavernia, E.J. An Efficient and Cost-Effective Method for Preparing Transmission Electron Microscopy Samples from Powders. Microsc. Microanal. 2015, 21, 1184–1194. [Google Scholar] [CrossRef] [PubMed]
- Kim, T.; Kang, M.; Jung, G.; Kim, D.S.; Yang, C. Novel Method for Preparing Transmission Electron Microscopy Samples of MICROGRAPHIA Novel Method for Preparing Transmission Electron Microscopy Samples of Micrometer-Sized Powder Particles by Using Focused Ion Beam. Microsc. Microanal. 2017, 23, 1055–1060. [Google Scholar] [CrossRef] [PubMed]
- Liu, S.; Wang, Y. A Review of the Application of Atomic Force Microscopy (AFM) in Food Science and Technology Provided for Non-Commercial Research and Educational Use Only. Not for Reproduction, Distribution or Commercial Use, 1st ed.; Elsevier Inc.: Amsterdam, The Netherlands, 2016; Volume 62, ISBN 9780123859891. [Google Scholar]
- Mišić Radić, T.; Vukosav, P.; Čačković, A.; Dulebo, A. Insights into the Morphology and Surface Properties of Microalgae at the Nanoscale by Atomic Force Microscopy (AFM): A Review. Water 2023, 15, 1983. [Google Scholar] [CrossRef]
- Shlyakhtenko, L.S.; Gall, A.A.; Weimer, J.J.; Hawn, D.D.; Lyubchenko, Y.L. Atomic Force Microscopy Imaging of DNA Covalently Immobilized on a Functionalized Mica Substrate. Biophys. J. 1999, 77, 568–576. [Google Scholar] [CrossRef]
- Mosley, D.W.; Chow, B.Y.; Jacobson, J.M. Solid-State Bonding Technique for Template-Stripped Ultraflat Gold Substrates. Langmuir 2006, 22, 2437–2440. [Google Scholar] [CrossRef]
- Starostin, N.; West, P.E.; Mecartney, M.L. Optimal Sample Preparation for Nanoparticle Metrology (Statistical Size Measurements) Using Atomic Force Microscopy. J. Nanoparticle Res. 2010, 12, 939–949. [Google Scholar] [CrossRef]
- Fritzen-Garcia, M.B.; Zanetti-Ramos, B.G.; de Oliveira, C.S.; Soldi, V.; Pasa, A.A.; Creczynski-Pasa, T.B. Atomic Force Microscopy Imaging of Polyurethane Nanoparticles onto Different Solid Substrates. Mater. Sci. Eng. C 2009, 29, 405–409. [Google Scholar] [CrossRef]
- Scanning Tunneling Microscopy and Spectroscopy. Available online: https://www.nanoscience.com/techniques/scanning-tunneling-microscopy/ (accessed on 11 August 2024).
- Colton, R.J.; Baker, S.M.; Driscoll, R.J.; Youngquist, M.G.; Baldeschwieler, J.D. Imaging Graphite in Air by Scanning Tunneling Microscopy: Role of the Tip. J. Vac. Sci. Technol. A Vac. Surf. Film. 1988, 6, 349–353. [Google Scholar] [CrossRef]
- Bian, K.; Gerber, C.; Heinrich, A.J.; Müller, D.J.; Scheuring, S.; Jiang, Y. Scanning Probe Microscopy. Nat. Rev. Methods Primers 2021, 1, 36. [Google Scholar] [CrossRef]
- Wang, S.; Zhu, J.; Blackwell, R.; Fischer, F.R. Automated Tip Conditioning for Scanning Tunneling Spectroscopy. J. Phys. Chem. A 2021, 125, 1384–1390. [Google Scholar] [CrossRef] [PubMed]
- Kim, Y.; Nowakowski, M.J.; Seidman, D.N. Novel in Situ Cleavage Technique for Cross—Sectional Scanning Tunneling Microscopy Sample Preparation Novel in Situ Cleavage Technique for Cross-Sectional Scanning Tunneling Microscopy Sample Preparation. Rev. Sci. Instrum. 1996, 67, 1922–1924. [Google Scholar] [CrossRef]
- Bunaciu, A.A.; Aboul-enein, H.Y. X-ray Diffraction: Instrumentation and Applications Critical Reviews in Analytical Chemistry X-ray Diffraction: Instrumentation and Applications. Crit. Rev. Anal. Chem. 2015, 45, 289–299. [Google Scholar] [CrossRef] [PubMed]
- Sarrazin, P.C.; Chipera, S.J.; Corporation, C.E.; Bish, D.L. Novel Sample-Handling Approach for XRD Analysis with Minimal Sample Preparation. In Proceedings of the 35th Lunar and Planetary Science Conference, League City, TX, USA, 15–19 March 2004; pp. 9–11. [Google Scholar]
- Zhang, G.; Germaine, J.T.; Martin, R.T.; Whittle, A.J. A simple sample-mounting method for random powder X-ray diffraction. Clays Clay Miner. 2003, 51, 218–225. [Google Scholar] [CrossRef]
- ICP-MS Instruments. Available online: https://www.agilent.com/en/product/atomic-spectroscopy/inductively-coupled-plasma-mass-spectrometry-icp-ms/icp-ms-instruments/7850-icp-ms?gad_source=1&gclid=Cj0KCQjwiOy1BhDCARIsADGvQnCScBolJISQkXujhVd7lkBH0B3VZVq2UAWyhOalnIoLQUN7tepL_8aAvfEEALw_wcB&gclsrc=aw.ds#gad_source=1 (accessed on 13 August 2024).
- Weissenberger, G.; Henderikx, R.J.M.; Peters, P.J. Preparation for Cryo-EM. Nat. Methods 2021, 18, 463–471. [Google Scholar] [CrossRef] [PubMed]
- Jantzi, S.C.; Dutton, C.L.; Saha, A.; Masikini, R.; Almirall, J.R. Novel B “Filter Pellet” Sample Preparation Strategy for Quantitative LA-ICP-MS Analysis of Filter-Bound Sediments: A B “Green Chemistry” Alternative to Sediment Fingerprinting in Tanzania’s Ruvu River Basin. J. Soils Sediments 2019, 19, 478–490. [Google Scholar] [CrossRef]
- Gupta, V.; Ganegoda, H.; Engelhard, M.H.; Terry, J.; Linford, M.R. Assigning Oxidation States to Organic Compounds via Predictions from X-ray Photoelectron Spectroscopy: A Discussion of Approaches and Recommended Improvements. J. Chem. Educ. 2014, 91, 232–238. [Google Scholar] [CrossRef]
- Sci, J.V.; Stevie, F.A.; Donley, C.L. Introduction to X-ray Photoelectron Spectroscopy Introduction to x-Ray Photoelectron Spectroscopy. J. Vac. Sci. Technol. A 2020, 38, 063204. [Google Scholar] [CrossRef]
- Sci, J.V. Guide to Making XPS Measurements on Nanoparticles Guide to Making XPS Measurements on Nanoparticles. J. Vac. Sci. Technol. A 2020, 38, 031201. [Google Scholar] [CrossRef]


| Technique | Advantages | Disadvantages | Resolution | Information Provided | References |
|---|---|---|---|---|---|
| Dynamic Light Scattering (DLS) | - Measures size, hydrodynamic diameter, and state of aggregation of nanoparticles - Suitable for colloidal dispersions, nanoparticles, polymers, and proteins | - Highly concentrated samples require dilution - Cannot measure dry powders directly - Electrostatic interactions can affect results in deionized water | Sub-micron scale | - Size and size distribution - Aggregation state - Hydrodynamic diameter | [16,17] |
| Scanning Electron Microscopy (SEM) | - High-resolution imaging - New developments like ESEM allow imaging without drying | - Requires conductive coating for non-conductive samples - Liquids or wetted objects cannot be observed as high vacuum is used | Sub-nanometer scale | - Surface morphology - Structural details | [18,19] |
| Cryo-SEM | - High-resolution imaging of hydrated samples without distortion - Preserves natural state of samples | - Requires advanced equipment - Sample preparation can be complex | Sub-nanometer scale | - Hydrated state imaging - Structural details | [20] |
| X-ray Diffraction (XRD) | - Identification of phases - Detection of elements | - Sample preparation can be time-consuming - Requires precise control of sample conditions | Angstrom scale | - Crystal structure - Phase identification | [21] |
| Transmission Electron Microscopy (TEM) | - High-resolution images of thin materials - Can utilize automated sample preparation | - Sample preparation is time-consuming - Dependent on operator skill | Sub-nanometer scale | - Internal structure - Micrography of biological cells and viruses | [19] |
| Atomic Force Microscopy (AFM) | - High-resolution surface topography - Non-destructive to the sample | - Limited to surface analysis - Sample preparation may require spin coating | Sub-nanometer scale | - Surface topography - Nanostructure details | [22,23] |
| Scanning Tunneling Microscopy (STM) | - Atomic-level imaging - High resolution | - Requires conductive samples - Sample preparation can be complex | Angstrom scale | - Atomic surface structure - Electronic properties | [23] |
| Inductively Coupled Plasma Mass Spectrometry (ICP-MS) | - Highly effective for detecting trace elements - High sensitivity | - Sample preparation can be complex - Requires aerosol dilution for high-matrix samples | Atomic scale | - Elemental composition - Trace element analysis | [24] |
| X-ray Photoelectron Spectroscopy (XPS/ESCA) | - Detailed elemental composition - Sensitive surface analysis | - Sample must be protected from contamination - Sample storage is crucial | Nanometer scale | - Surface elemental composition - Chemical states | [25] |
Disclaimer/Publisher’s Note: The statements, opinions and data contained in all publications are solely those of the individual author(s) and contributor(s) and not of MDPI and/or the editor(s). MDPI and/or the editor(s) disclaim responsibility for any injury to people or property resulting from any ideas, methods, instructions or products referred to in the content. |
© 2024 by the authors. Licensee MDPI, Basel, Switzerland. This article is an open access article distributed under the terms and conditions of the Creative Commons Attribution (CC BY) license (https://creativecommons.org/licenses/by/4.0/).
Share and Cite
Nadkarni, A.; Rana, D.; Desai, N.; Benival, D.; Joshi, V.; Salave, S.; Khunt, D. Advanced Characterization and Sample Preparation Strategies for Nanoformulations. J. Nanotheranostics 2024, 5, 104-127. https://doi.org/10.3390/jnt5030008
Nadkarni A, Rana D, Desai N, Benival D, Joshi V, Salave S, Khunt D. Advanced Characterization and Sample Preparation Strategies for Nanoformulations. Journal of Nanotheranostics. 2024; 5(3):104-127. https://doi.org/10.3390/jnt5030008
Chicago/Turabian StyleNadkarni, Akanksha, Dhwani Rana, Nimeet Desai, Derajram Benival, Vishvesh Joshi, Sagar Salave, and Dignesh Khunt. 2024. "Advanced Characterization and Sample Preparation Strategies for Nanoformulations" Journal of Nanotheranostics 5, no. 3: 104-127. https://doi.org/10.3390/jnt5030008
APA StyleNadkarni, A., Rana, D., Desai, N., Benival, D., Joshi, V., Salave, S., & Khunt, D. (2024). Advanced Characterization and Sample Preparation Strategies for Nanoformulations. Journal of Nanotheranostics, 5(3), 104-127. https://doi.org/10.3390/jnt5030008