Article

Photoelectron Circular Dichroism as a Probe of Chiral Hydrocarbons

Istituto Officina dei Materiali IOM-CNR and Dipartimento di Scienze Chimiche e Farmaceutiche, Università di Trieste, Via Giorgieri 1, I-34127 Trieste, Italy
Chemistry 2022, 4(1), 31-41; https://doi.org/10.3390/chemistry4010003
Submission received: 21 December 2021 / Revised: 10 January 2022 / Accepted: 11 January 2022 / Published: 13 January 2022

Abstract

:
The sensitivity of Photoelectron Circular Dichroism (PECD) in the angular distribution of photoelectrons, a recent chiral technique, to detect chirality in pure hydrocarbons is investigated in a number of benchmark molecules. It is found that a very large chiral signal is expected, surpassing most current examples, giving a sure fingerprint of absolute configuration. On the other hand, the sensitivity to specific isomers or closely related molecules is relatively modest.

1. Introduction

Molecular chirality is an important topic in chemistry and is also fundamental for applications in the life sciences and the pharmaceutical industry. However, not very many physical techniques are available for the detection and characterization of molecular chirality, the oldest and most consolidated are circular dichroism (CD) in absorption, both electronic and more recently vibrational, and optical rotation (ORD) [1,2]. Clearly the former requires the presence of an absorption band and the availability of a suitable circularly polarized light source, while ORD, showing a dispersive signal, dies off very slowly from absorption bands, and may give a detectable signal far from those [1,2]. In fact, it was recently pointed out that while optical CD may often be unusable in the case of absorption bands in the VUV, e.g., in saturated hydrocarbon molecules, ORD is still usable [3,4].
An important point is that optical techniques require the chirality of the light, which translates into necessitating both the electric and magnetic vectors of the field. The optical signal depends on the magnitude of a mixed electric dipole-magnetic dipole transition matrix element between the states involved in the excitation [1,2]. This makes the signal very weak in comparison to pure electric dipole transitions, and makes experimental detection very difficult for diluted samples, as in the gas phase, requiring very specialized instruments available in few laboratories [5]. This limitation is obviated in solution because of the much larger concentration of the sample. Still, solution experiments, although the most common practice, may have some drawbacks. The solvent itself may have a limited wavelength window of transparency. Furthermore, from a fundamental point of view, it may significantly alter the chiral response of the isolated sample, both changing the electronic and vibrational properties, and the molecular conformation.
A last important remark is the role of the theory and the availability of accurate models for the simulation of the experimental results. It is fair to say that up to the development of dependable Quantum Chemistry approaches to the calculation of optical chirality the crucial assignment of the absolute configuration was very difficult, as few empirical rules, as well as the chemical similarity of two related molecules, had very limited predictive power, and led to wrong assignments in the past [3,4].
A relatively recent technique, that works very well in the gas phase, is the detection of circular dichroism in the emission of electrons from molecules ionized by high energy radiation, called PECD (PhotoElectron Circular Dichroism) [6,7,8]. The basic experiment measures the angular distribution of photoelectrons. VUV radiation ionizes a molecule, and the detector reveals photoelectron at an angle θ with respect to the light propagation vector The intensity of emission (cross-section) for left circularly polarized light is given by the simple formula:
I = const   [ 1 + β 1 cos θ 1 2   β 2 P 2 ( cos θ )   ]
which defines the two parameters β1 and β2. (P2 is the second-order Legendre polynomial). β1 reverses with reversing light polarization from left (+1) to right (−1) as well as interchanging the enantiomers. For non-chiral molecules β1 = 0 and emission at θ (forward) and (π − θ) (backward) have equal intensities, but for chiral molecules, this is not true, and the normalized difference in the intensity
( θ ) = I ( θ ) I ( π θ ) I ( θ ) + I ( π θ ) = I L ( θ ) I R ( θ ) I L ( θ ) + I R ( θ )
allows the retrieval of the dichroic parameter β1 (actually β1 = Δ(θM), θM = 54.4° is the so-called magic angle, such that P2(cos θM) = 0).
The information content of β1 is rich, as it depends on the specific final ionic state I probed, that is on its ionization potential (IP), and also on the photon energy ℏω of the ionizing radiation, a typical profile for methyloxirane being shown in Figure 1. The effect is large at low kinetic energies (KE), close to the threshold, and then fades away after a few tens of electronvolts (eV), but is orders of magnitude larger than in optical absorption, as it is due to a pure electric dipole matrix element between initial and final states. Here chirality of the probe is provided by the additional vector given by the electron momentum. The value of β1 is typically in the range of a few percent, occasionally surpassing 0.1 units, and can be rather easily measured with current facilities [8]. Like for optical absorption also for PECD simulations are very useful to extract the most information from the spectra, and unavoidable for the absolute configuration assignment. Actually, this requires a rather accurate description of the electronic continuum wavefunction which describes the photoelectron. This is a more difficult problem than the calculation of bound states and requires special computational techniques [9,10,11]. Given the complexity of chiral systems, it is difficult to go beyond an effective single-particle description of the continuum electron, employing either a density functional (DFT) potential or a static Hartree-Fock one [12,13,14]. Generally, the results are more erratic very close to the threshold, at low electron kinetic energies, but are sufficiently accurate to be predictive from about 5 eV KE, which is amply sufficient to obtain a sure fingerprint.
Speaking of saturated hydrocarbons, there is no reason why these systems would be dark for PECD, as photoionization is always an open channel for photon energies above the IP. On the other hand, it might be feared that the signal would be very small, given the very simple electronic structure, comprising only C–C and C–H single bonds. Moreover, the capability of distinguishing isomers, or in any case molecules closely similar is a further important point. Prompted by the recent investigation underlying the limitations of CD for saturated hydrocarbons and the need for different techniques, we have considered it interesting to test a number of benchmark cases from a previous publication [3] to assess the capability of PECD in this class of compounds. Given the current level of accuracy in theoretical simulations, we are pretty confident that the qualitative features and the level of the expected signal are correctly predicted.

2. The Theoretical Approach

The cross-section in the molecular frame (a molecule fixed in space) is given (in atomic units (au)) by [15]:
d σ I dk = 4 π 2 α ω   >|   < Ψ Ik ( )   |   E   · D   |   Ψ 0 >   | 2
where α is the fine structure constant, ω the photon energy, Ψ(−)Ik represents asymptotically an ion with wavefunction ΨI and an electron with momentum k, and appropriate boundary conditions. E is the electric field vector and D the dipole operator. If both initial and final states are represented as single Slater determinants with a common set of orbitals, the dipole matrix element reduces to a single particle one:
E <φ(−)k | r | φi>
where φi is the initial orbital ionized. It is convenient to employ for the continuum a basis of angular momentum states, which leads to matrix elements of the form:
E <φεlm | rY1m | φi>
which are those effectively computed. For a sample of randomly oriented molecules, an average of the cross-section over all molecular orientations leads to the expression (1) for the angular distribution in the laboratory frame, with explicit expressions for β1 which are involved but easily calculated [15].
In the present work, we employ orbitals, both bound and continuum, that are eigenvectors of a fixed DFT (or Kohn-Sham) Hamiltonian (static-DFT approach) [16]:
hKS = −½ Δ + VN + VC + VXC
where VN, VC, VXC are the nuclear attraction, the classical coulomb and the DFT exchange-correlation potentials, the latter being defined by the molecular ground state density ρ(r).
Then we compute
hKS φi = εi φi and hKS φεlm = ε φεlm
both for the bound and continuum eigenvectors. To this end, a special basis is employed, made of products of B-spline radial functions and real spherical harmonics.
χnlm = Bn (r) Ylm(θ,φ)
B-splines [17] are piecewise polynomial functions defined over a grid of points that span a fixed interval, [0, Rmax] in the present case. The full basis comprises a large one-center expansion (OCE) about a common origin plus short expansions around all nuclei, in the spirit of the LCAO approach [16]. In the present calculation, the OCE expansion employed Rmax = 25 au (30 for chiralane) with a linear grid with stepsize = 0.50 au, and angular expansion up to Lmax = 15 (13 for dimethylcyclopropane, 19 for chiralane). Expansions around the nuclei used Rmax = 1.0 au with step size 0.2 au for all atoms, and Lmax = 2 for carbon, Lmax = 1 for hydrogen. The initial density was obtained from a preliminary SCF calculation with the ADF program [18,19], and the DZP basis from the ADF library. The LB94 exchange-correlation potential [20] was employed. All geometries were taken from [3] except for chiralane from [21].

3. Results and Discussion

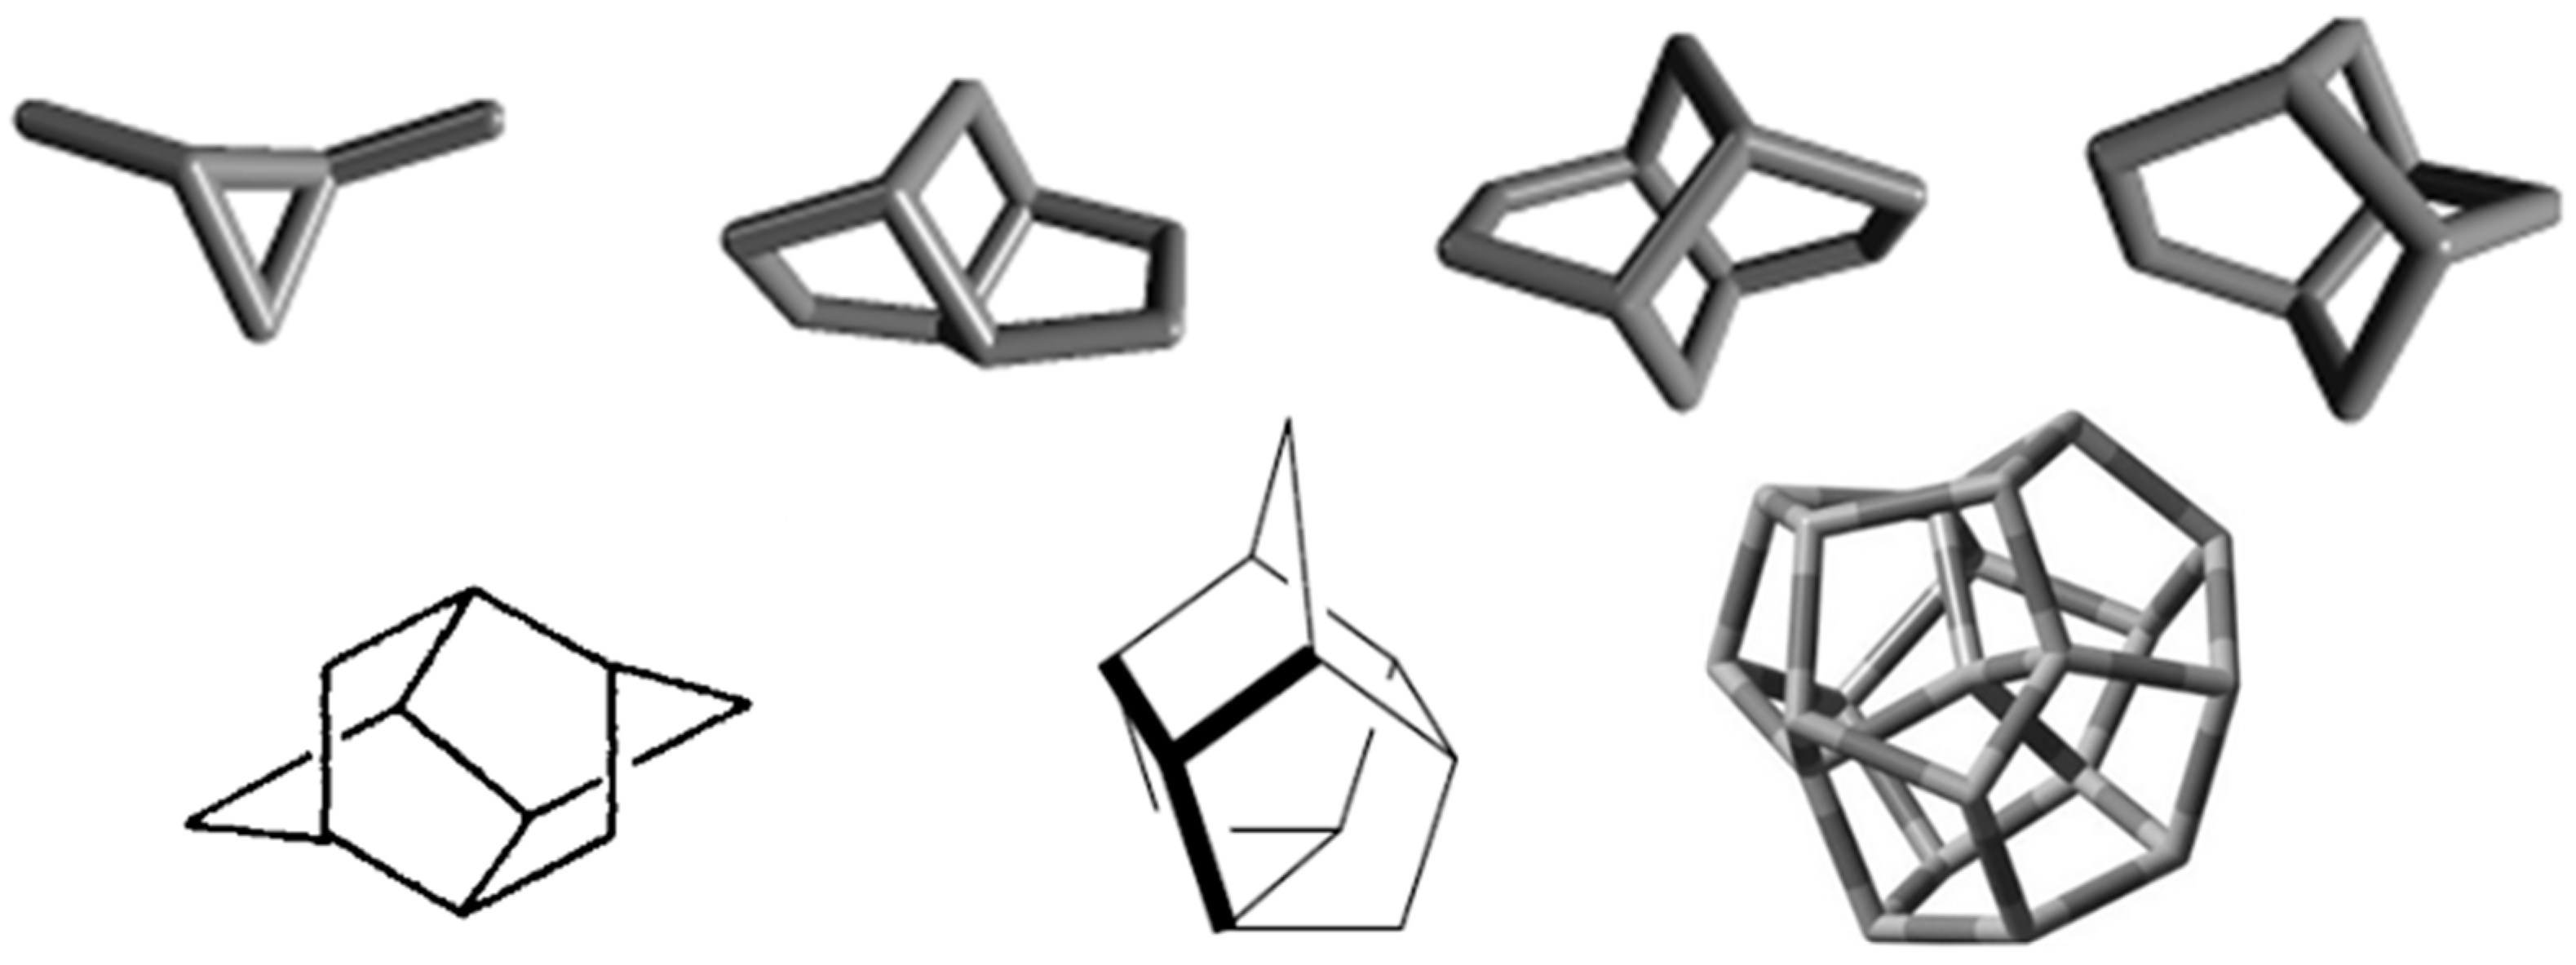
The molecules that have been considered are dimethylcyclopropane, brexane, twistane, twistbrendane, ditwistbrendane, trishomocubane, taken from ref [3].
In addition, we chose to study chiralane, a hydrocarbon with the rare T symmetry, purely rotational and so chiral, which is deemed to represent maximal chirality [21]. Their carbon skeleton is depicted in Figure 2. Only the outermost ionizations, which will give well-resolved photoelectron peaks, are reported. They are listed, together with the IP estimates from LB94 eigenvalues, in Table 1. When more than one ionization lie very close, an average value of β1 weighted by the corresponding cross-section, is also reported.
We shall briefly point out salient features of the β1 profile for each molecule and then summarize the important general points.

3.1. Dimethylcyclopropane

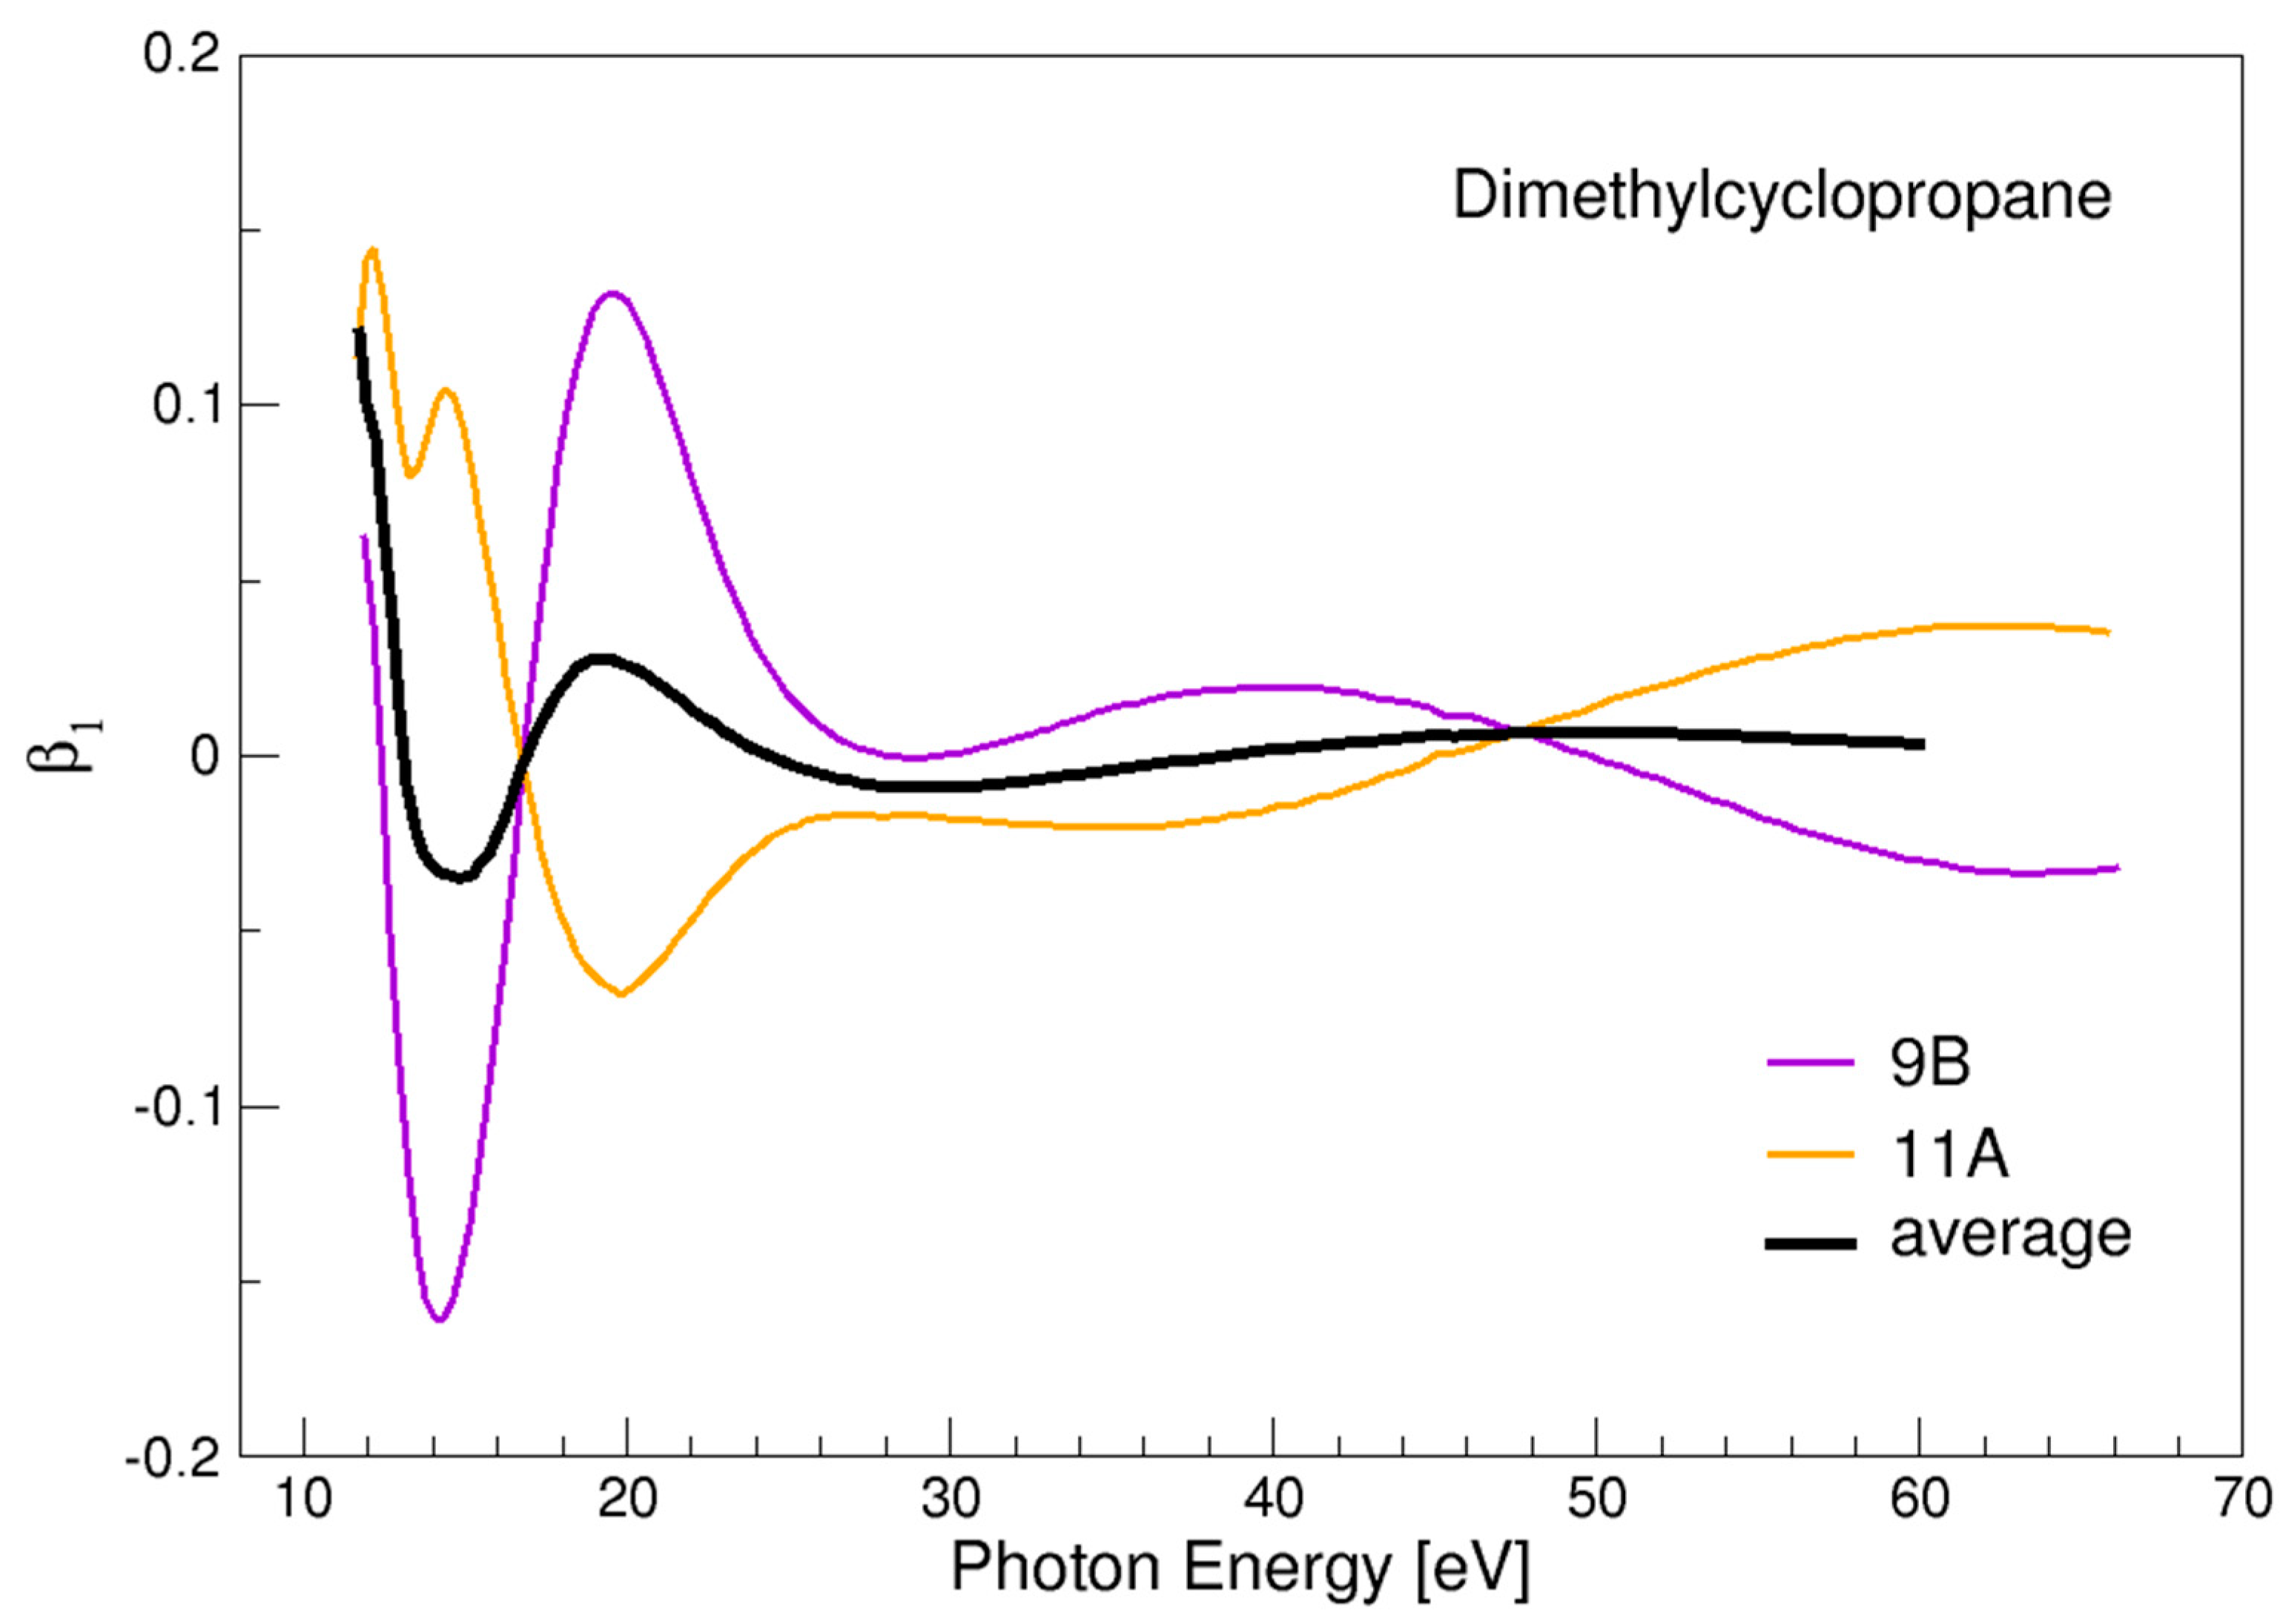
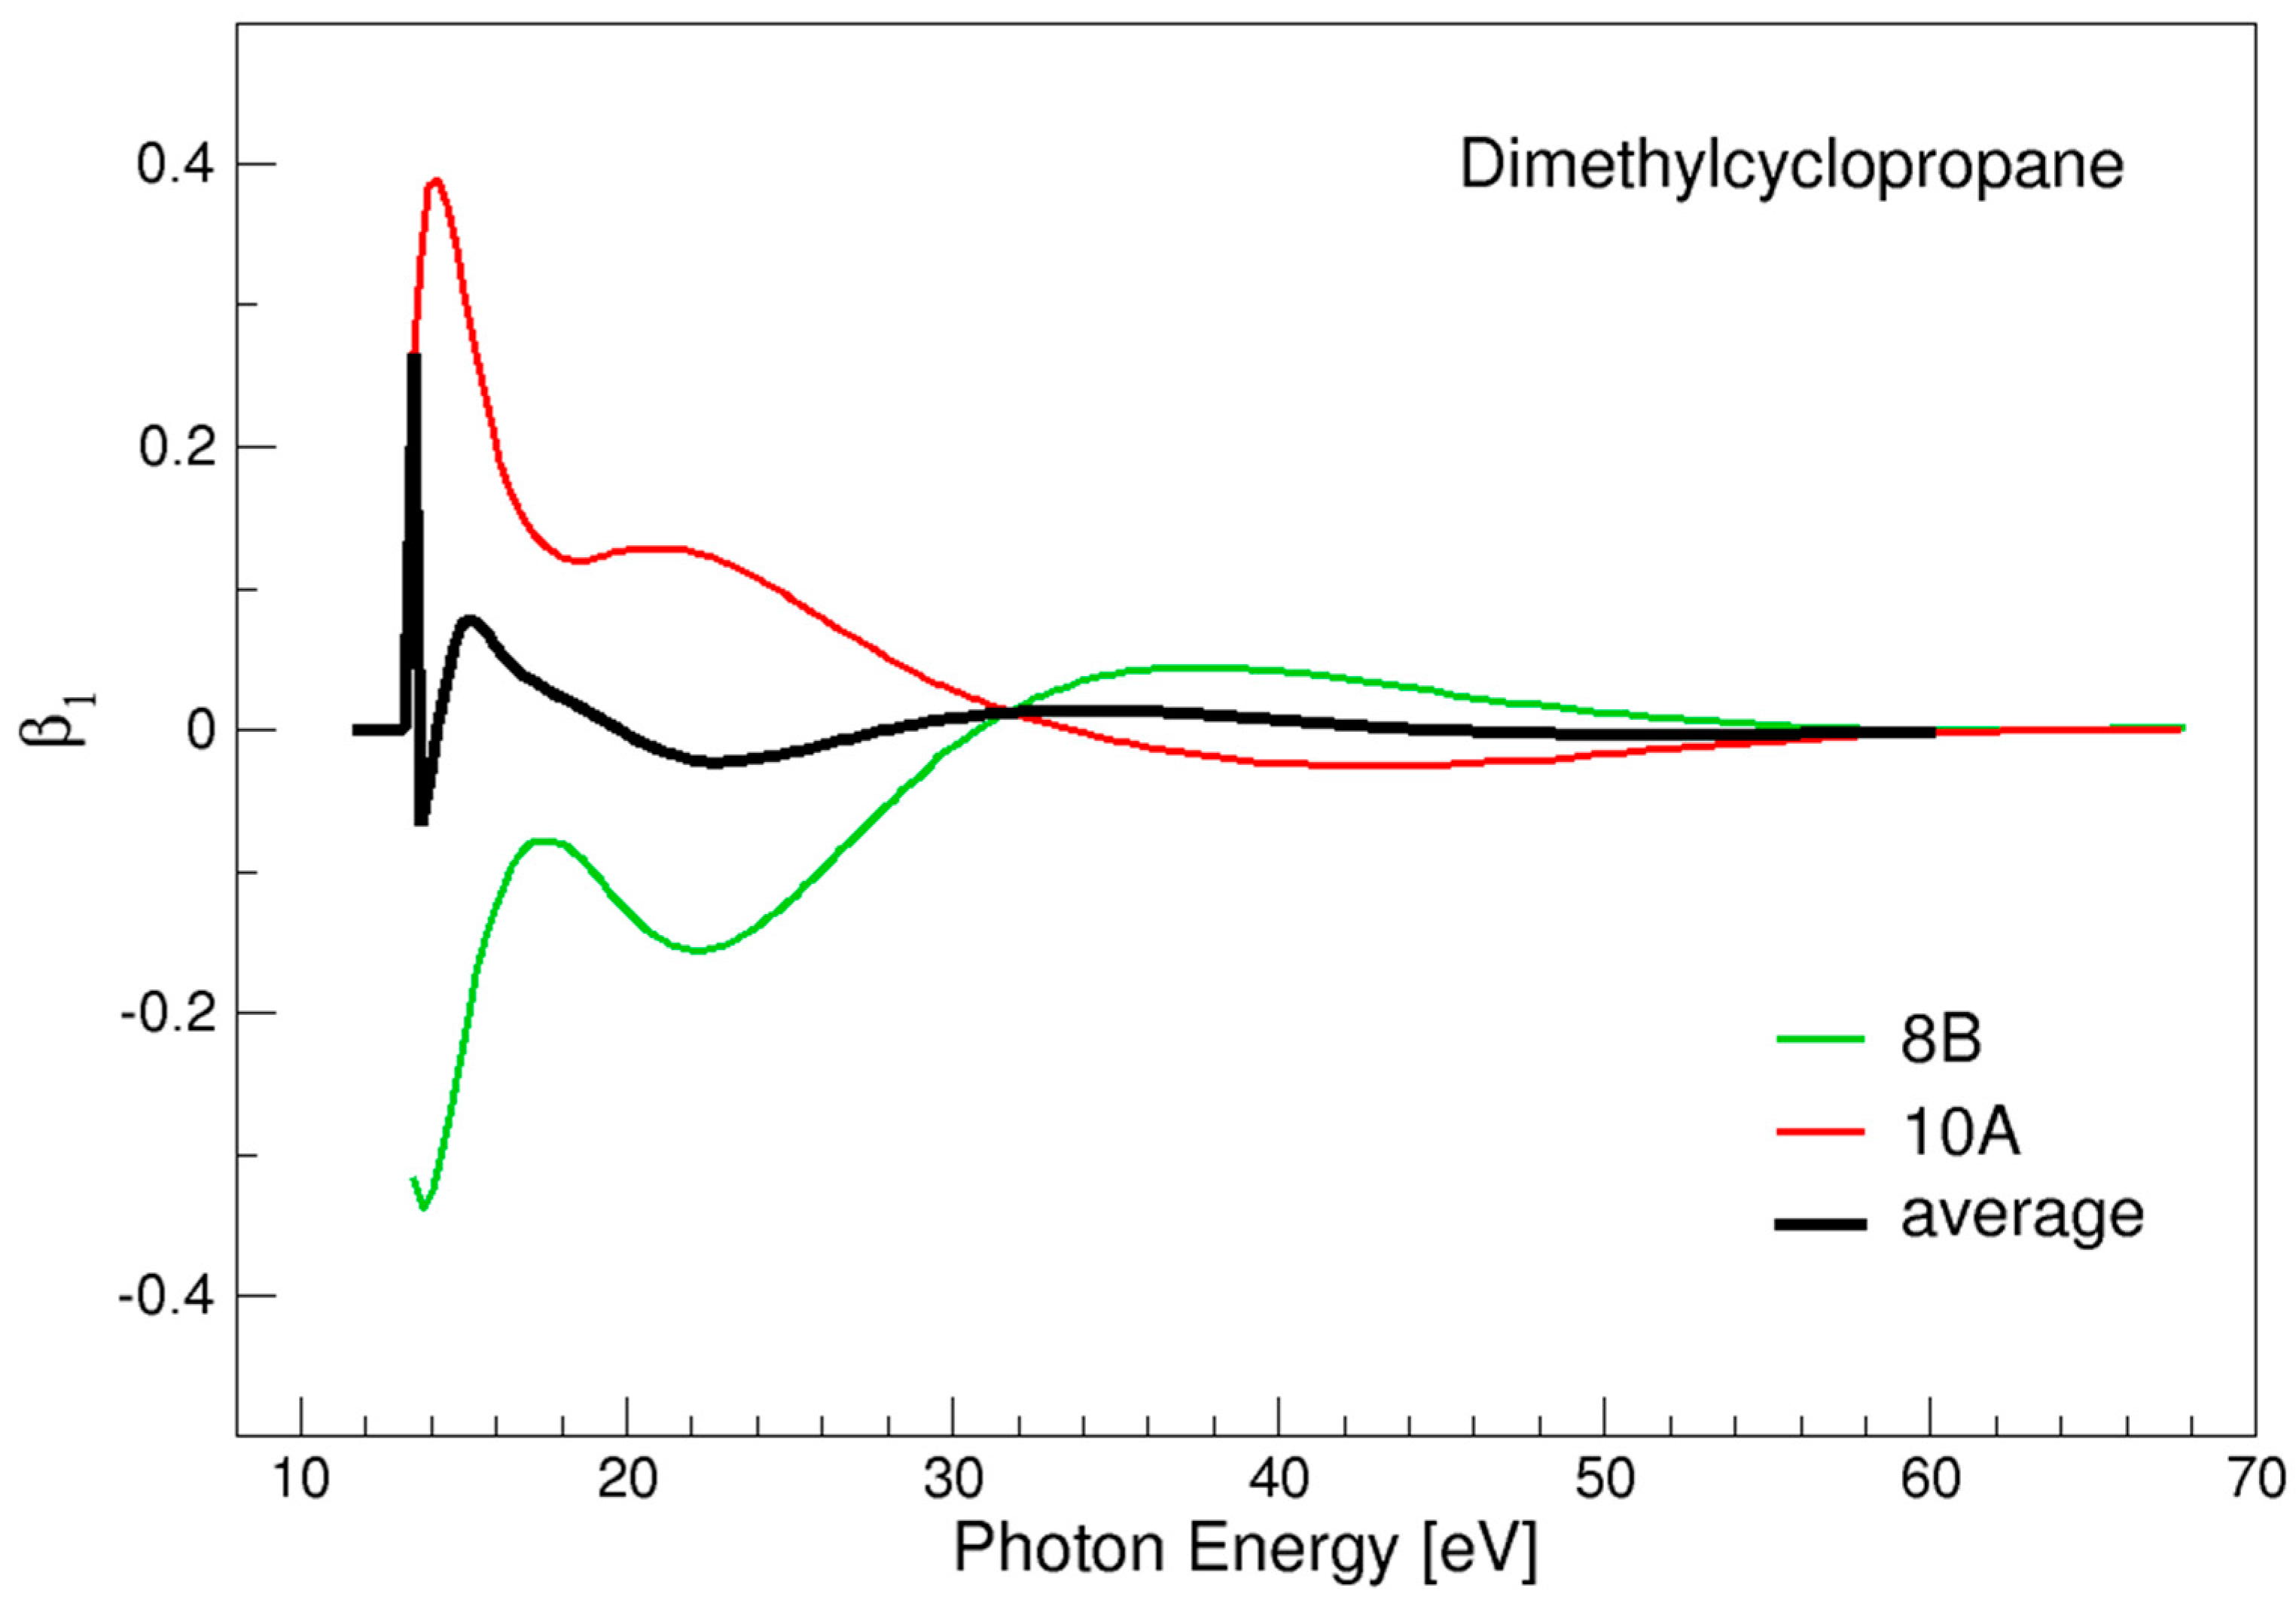
In this case (Table 1) there are two well-separated couples of close outermost ionizations so that two well-resolved bands will show in the photoelectron spectrum, and the average β1 is reported, together with the separate components, in Figure 3 and Figure 4. In both cases, it can be seen that the separate components mostly show opposite β1 behavior, so that the average is much less intense and structured and dies relatively fast. This is probably due to the fact that each couple of orbitals amount to a symmetric or antisymmetric combination of faraway methyl orbitals so that the energy splitting is very small. Nonetheless, both average profiles show a distinct smooth β1 oscillation, sharper in the higher energy 10A, 8B couple, in the typical range of a few percent, which will give a characteristic well-identified signal.

3.2. Brexane

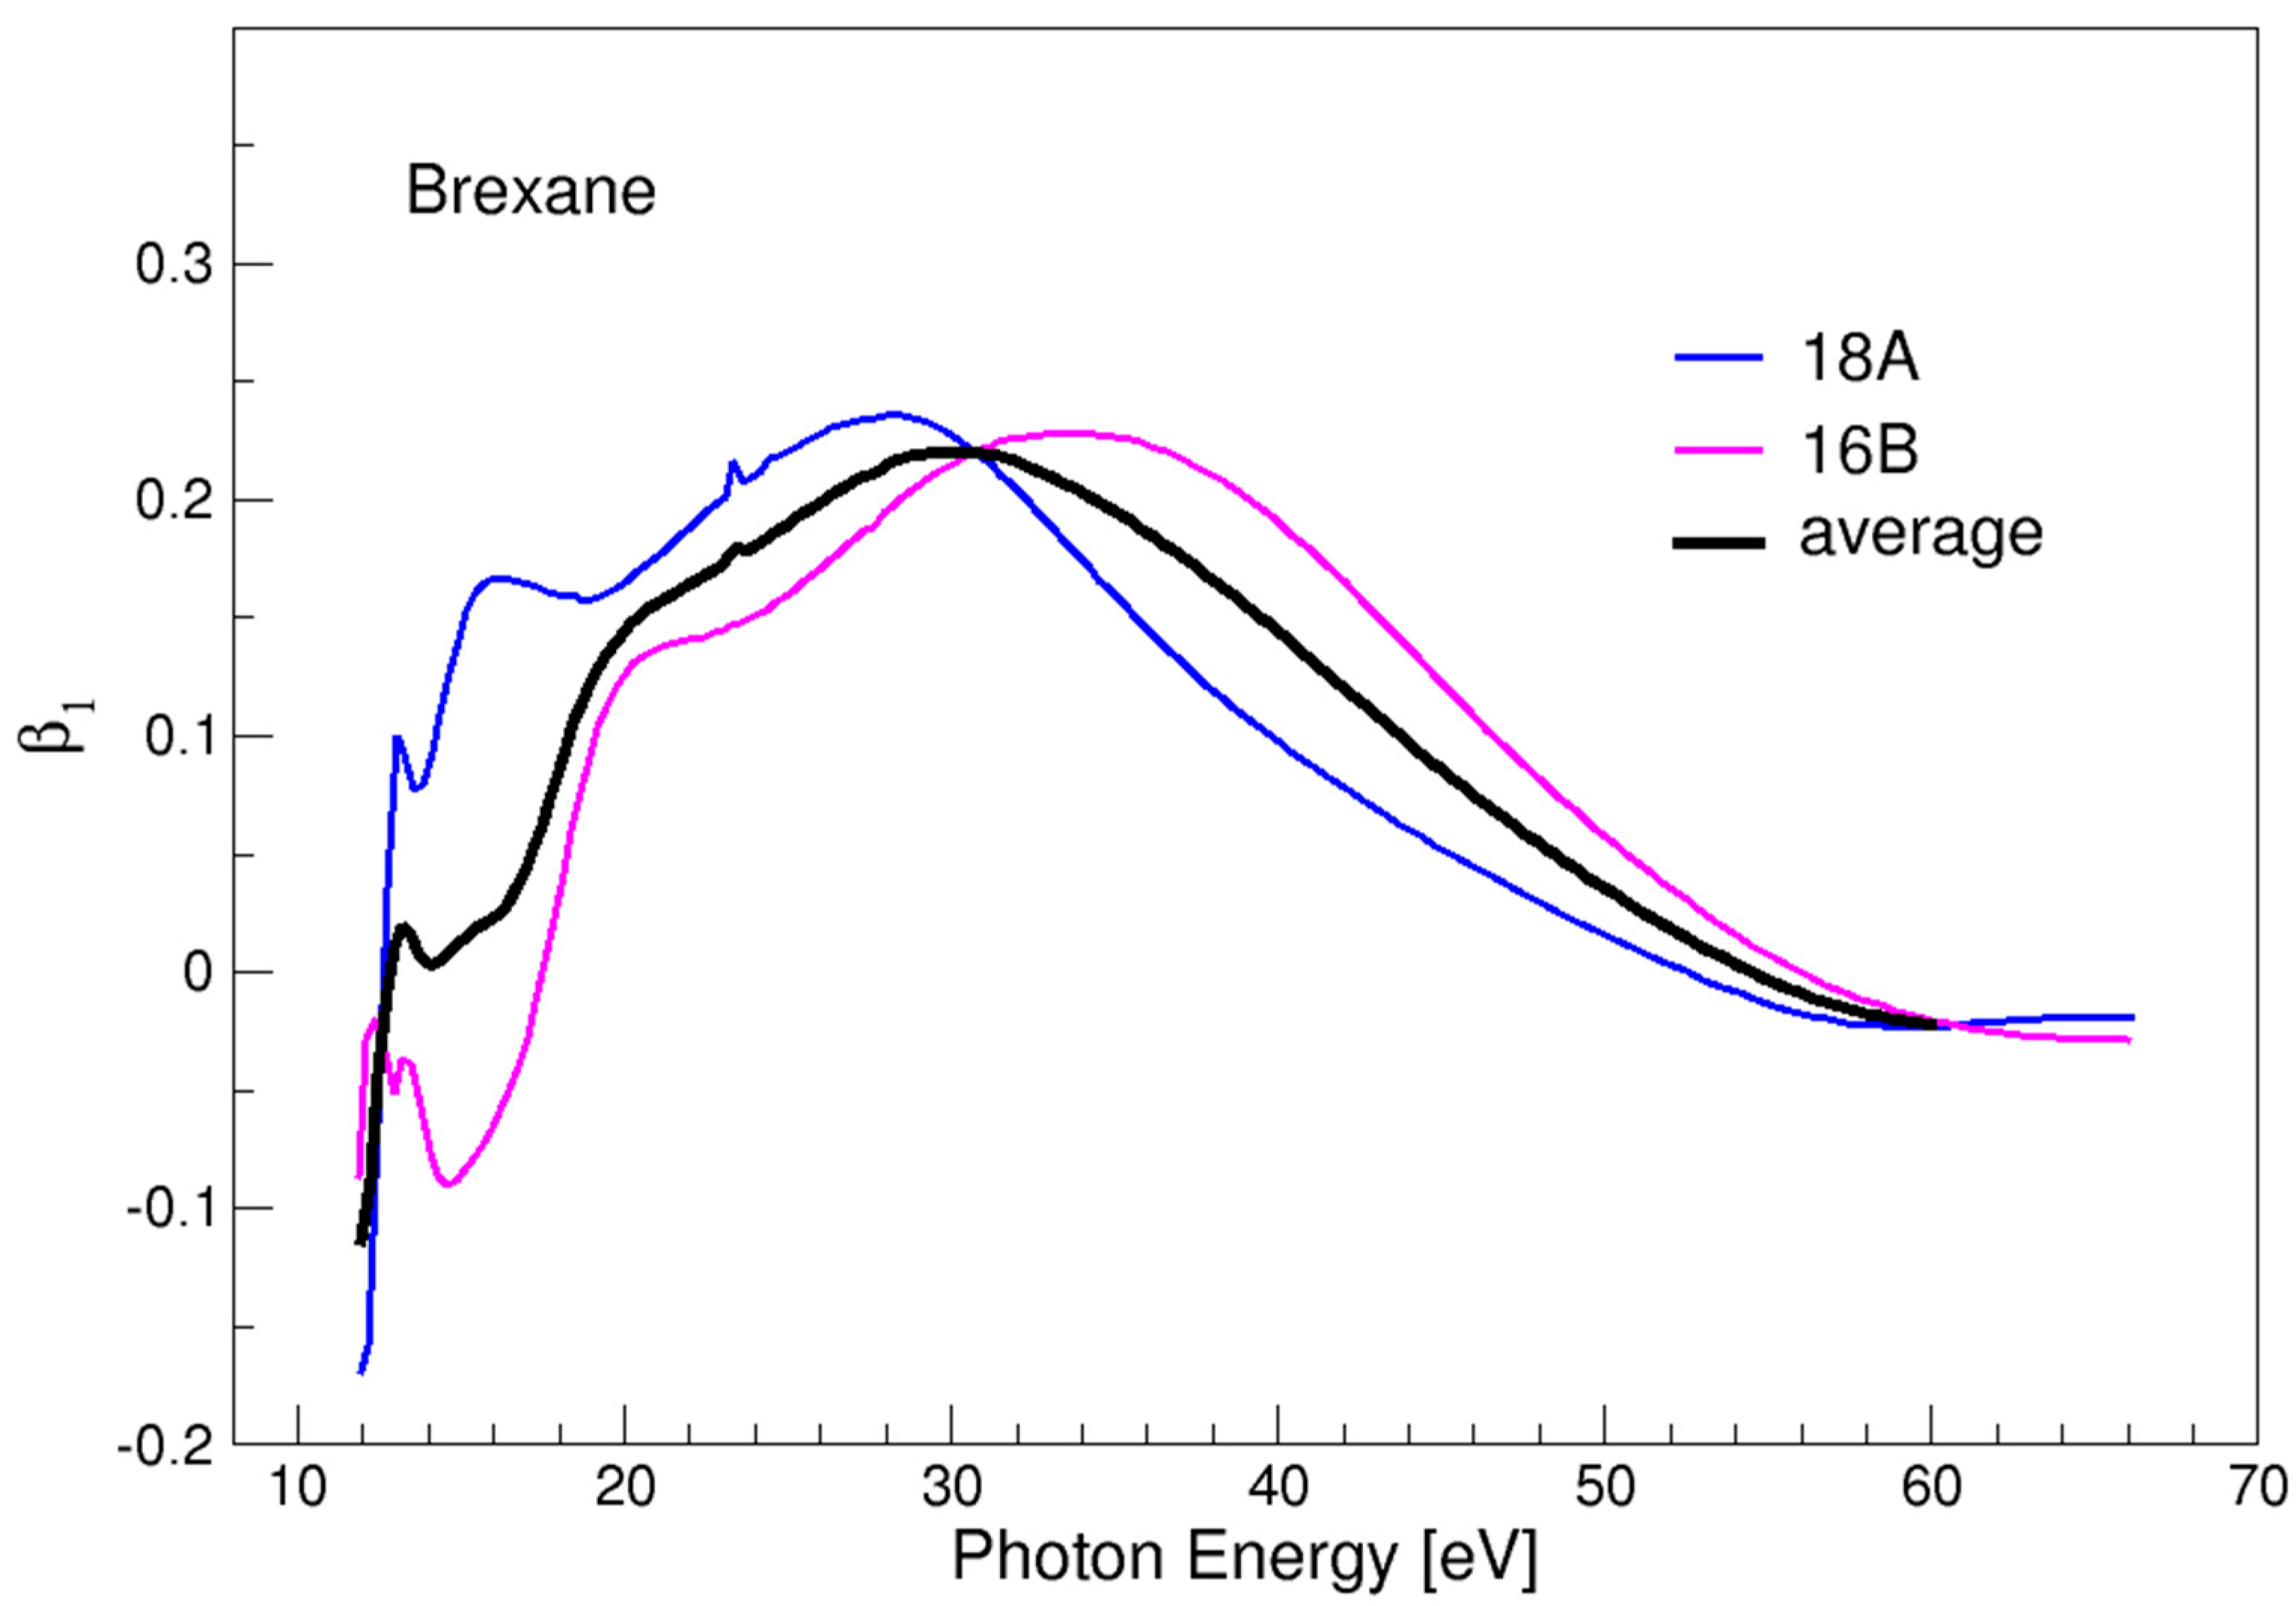
A very different pattern is displayed by brexane. Here again, two close-lying ionizations give rise to an average β1 profile (Figure 5). In this case, however, except at the lowest energies, the individual profiles are very close and give rise to a very wide almost unstructured profile, that will produce a strong signal, up to 20 percent, spanning almost 30 eV, an unmistakable signature of the molecule.

3.3. Twistane

The situation is similar in twistane. Here three almost degenerate ionizations are present, all with rather close profiles past 20 eV photon energy (Figure 6). The result is again a very wide, rather flat β1 profile, reaching up to 30 percent before declining smoothly after 40 eV, and reaching important negative values, up to 10 percent above 50 eV, where generally the β1 signals become very weak.

3.4. Twistbrendane and Ditwistbrendane

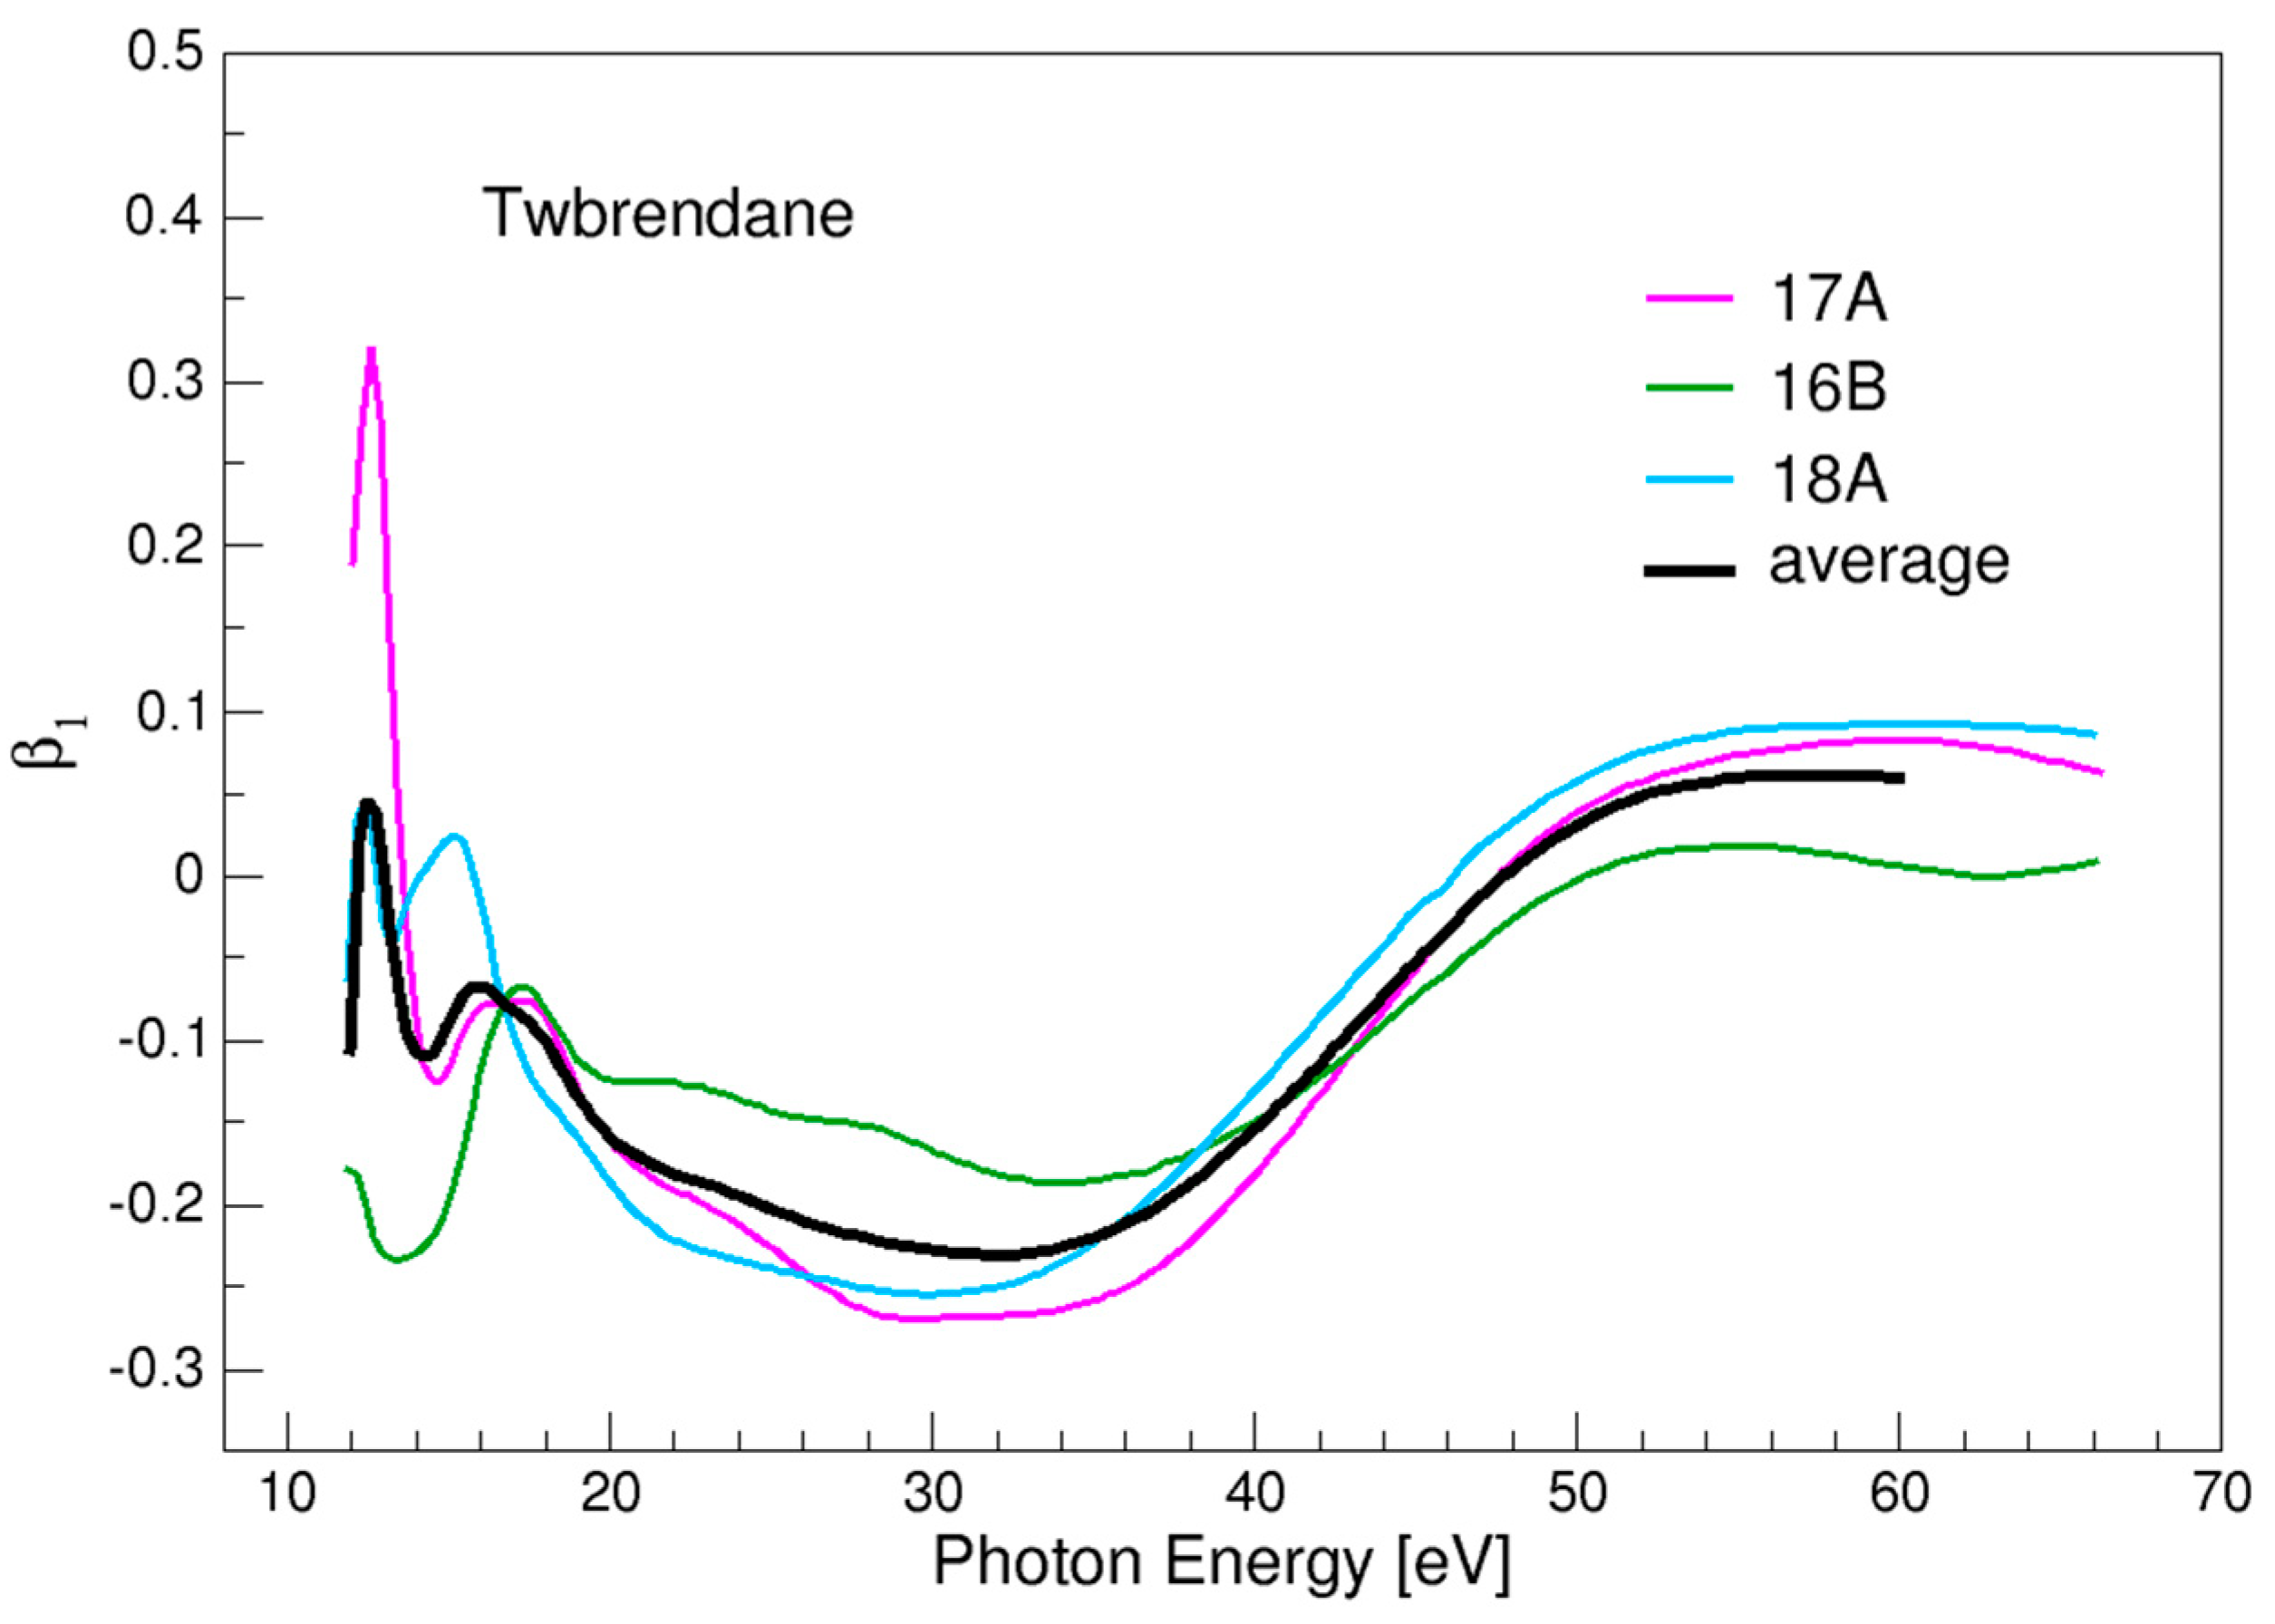
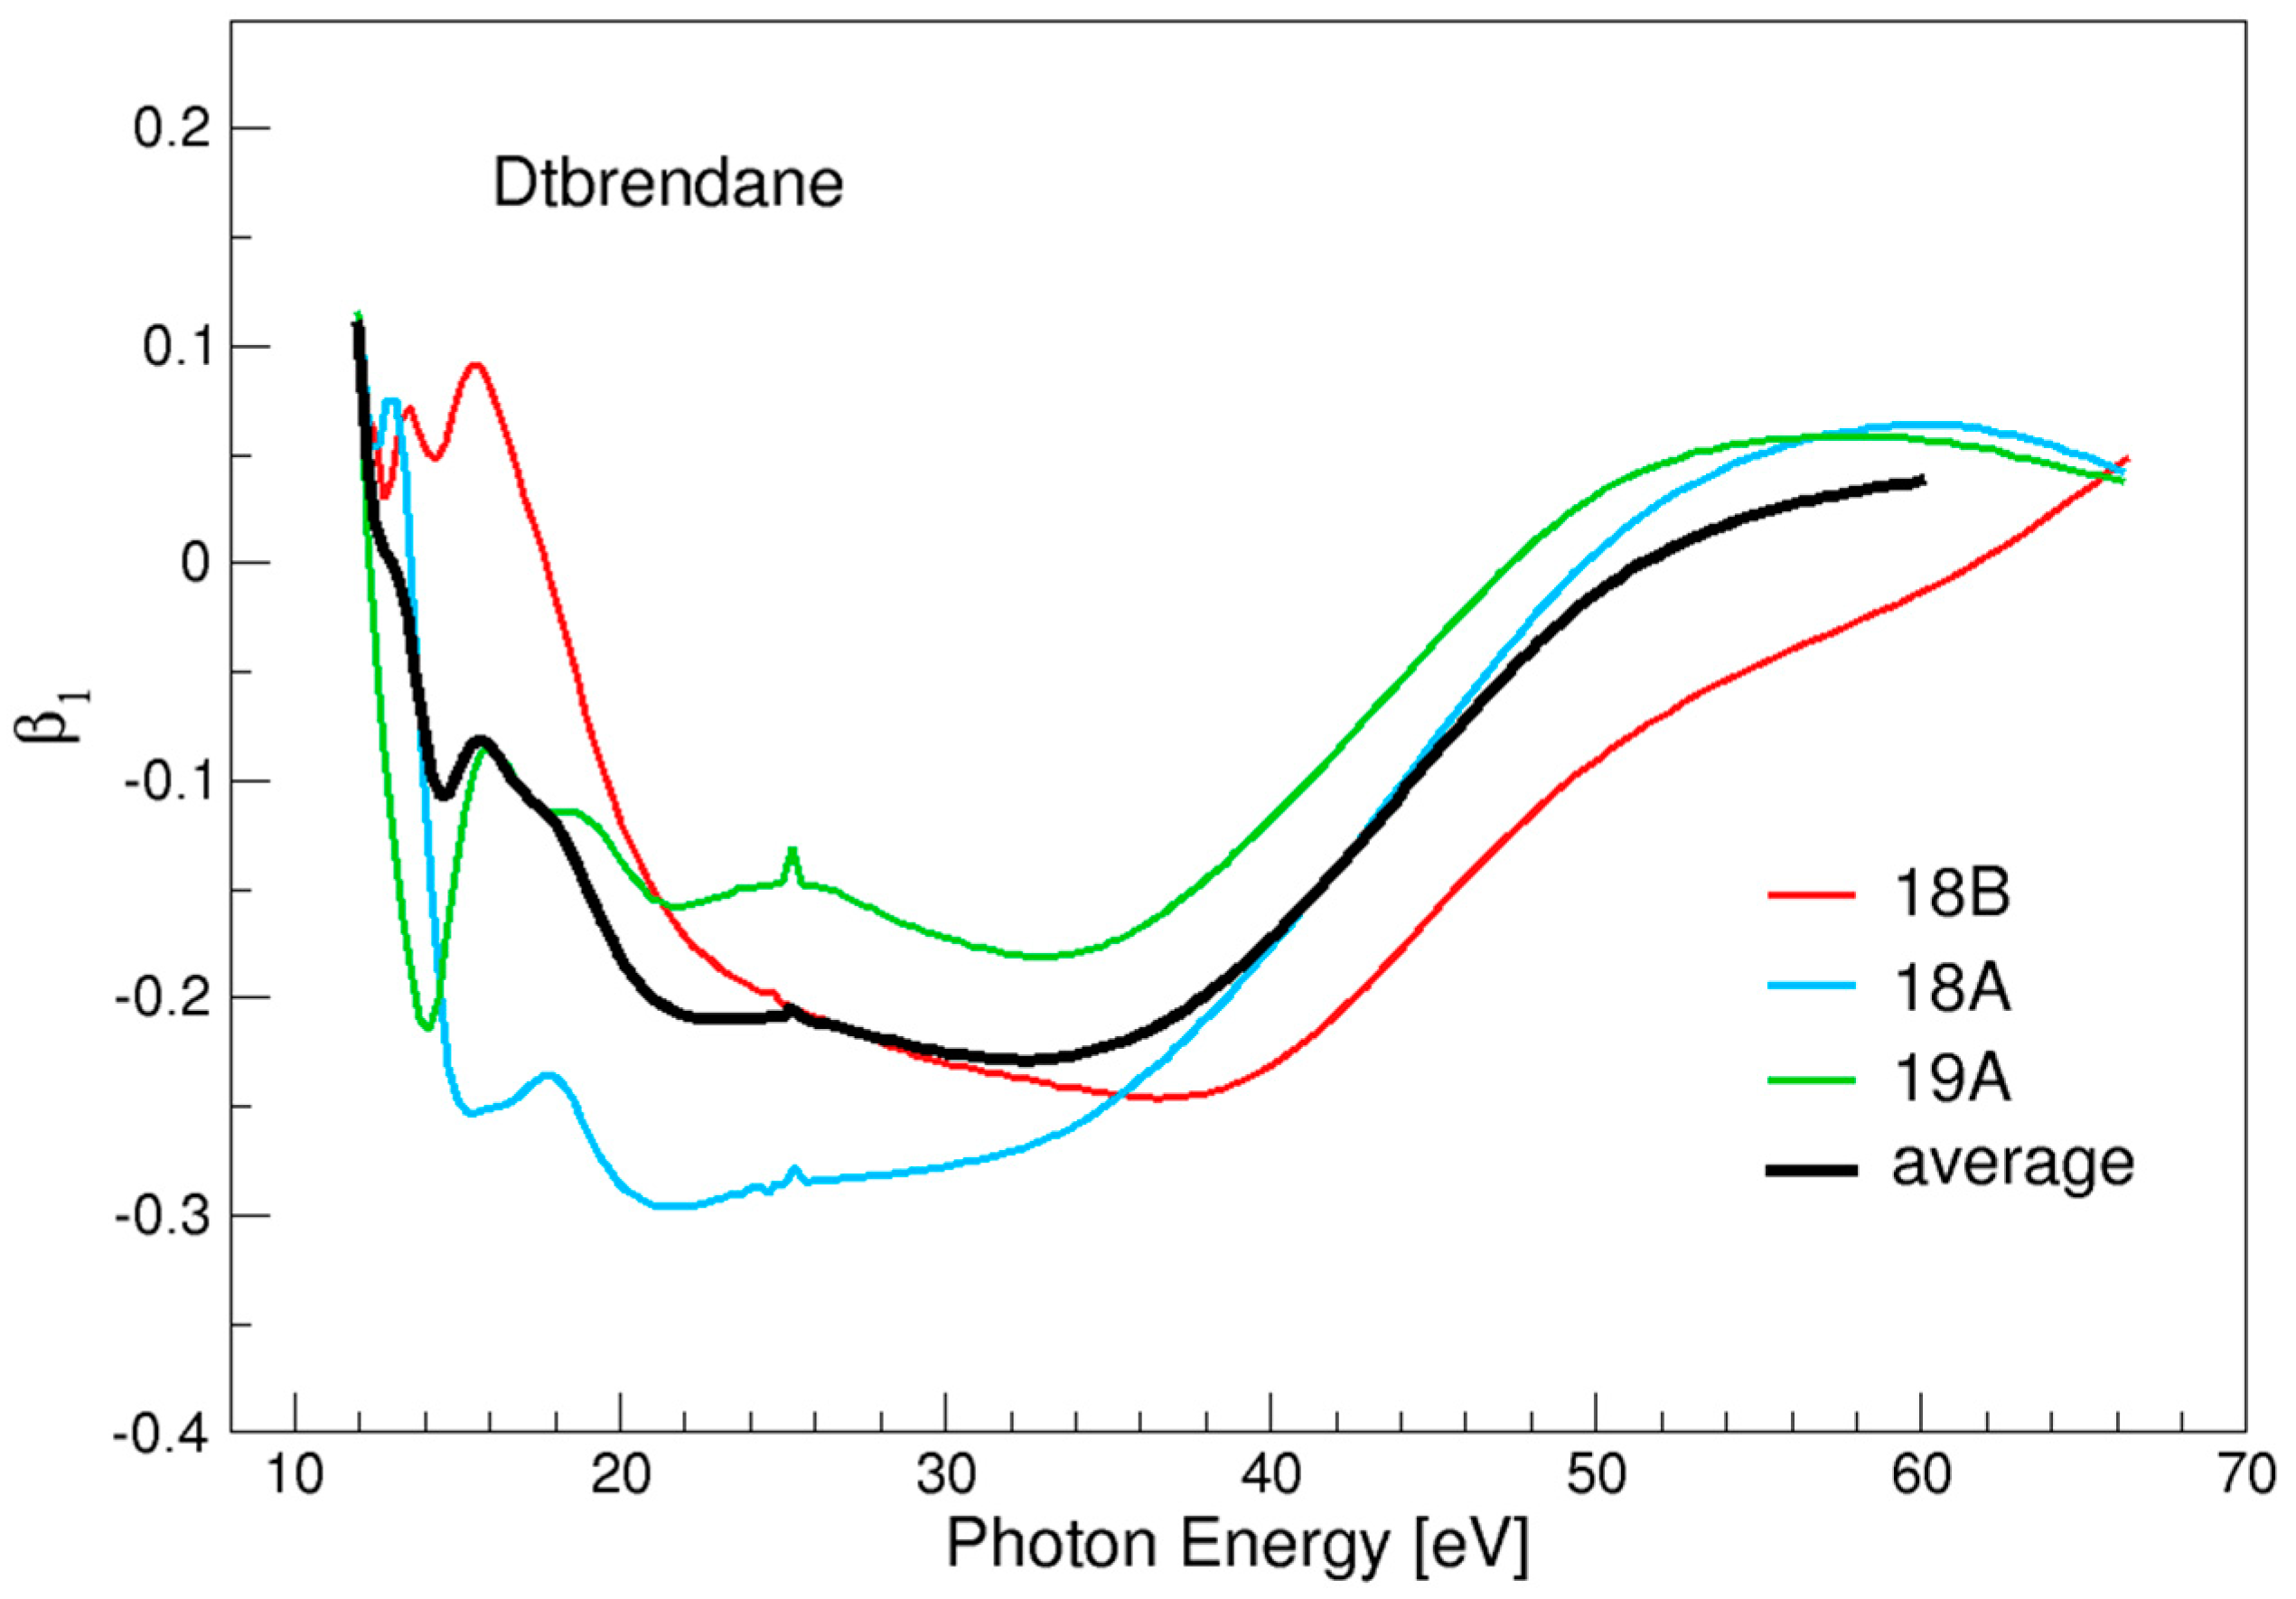
The average profiles for both molecules, shown in Figure 7 and Figure 8, are quite similar, although the individual components show significant differences in the latter. Apart from the opposite sign, which amounts to reverse the enantiomer, the average profile also bears some similarity to that of twistane, which has a significantly different shape. So, in this case, the outermost β1 profile is probably not sufficient to differentiate between the two molecules. The signal is however quite strong over a large energy interval and gives a solid characterization of the absolute configuration.

3.5. Trishomocubane

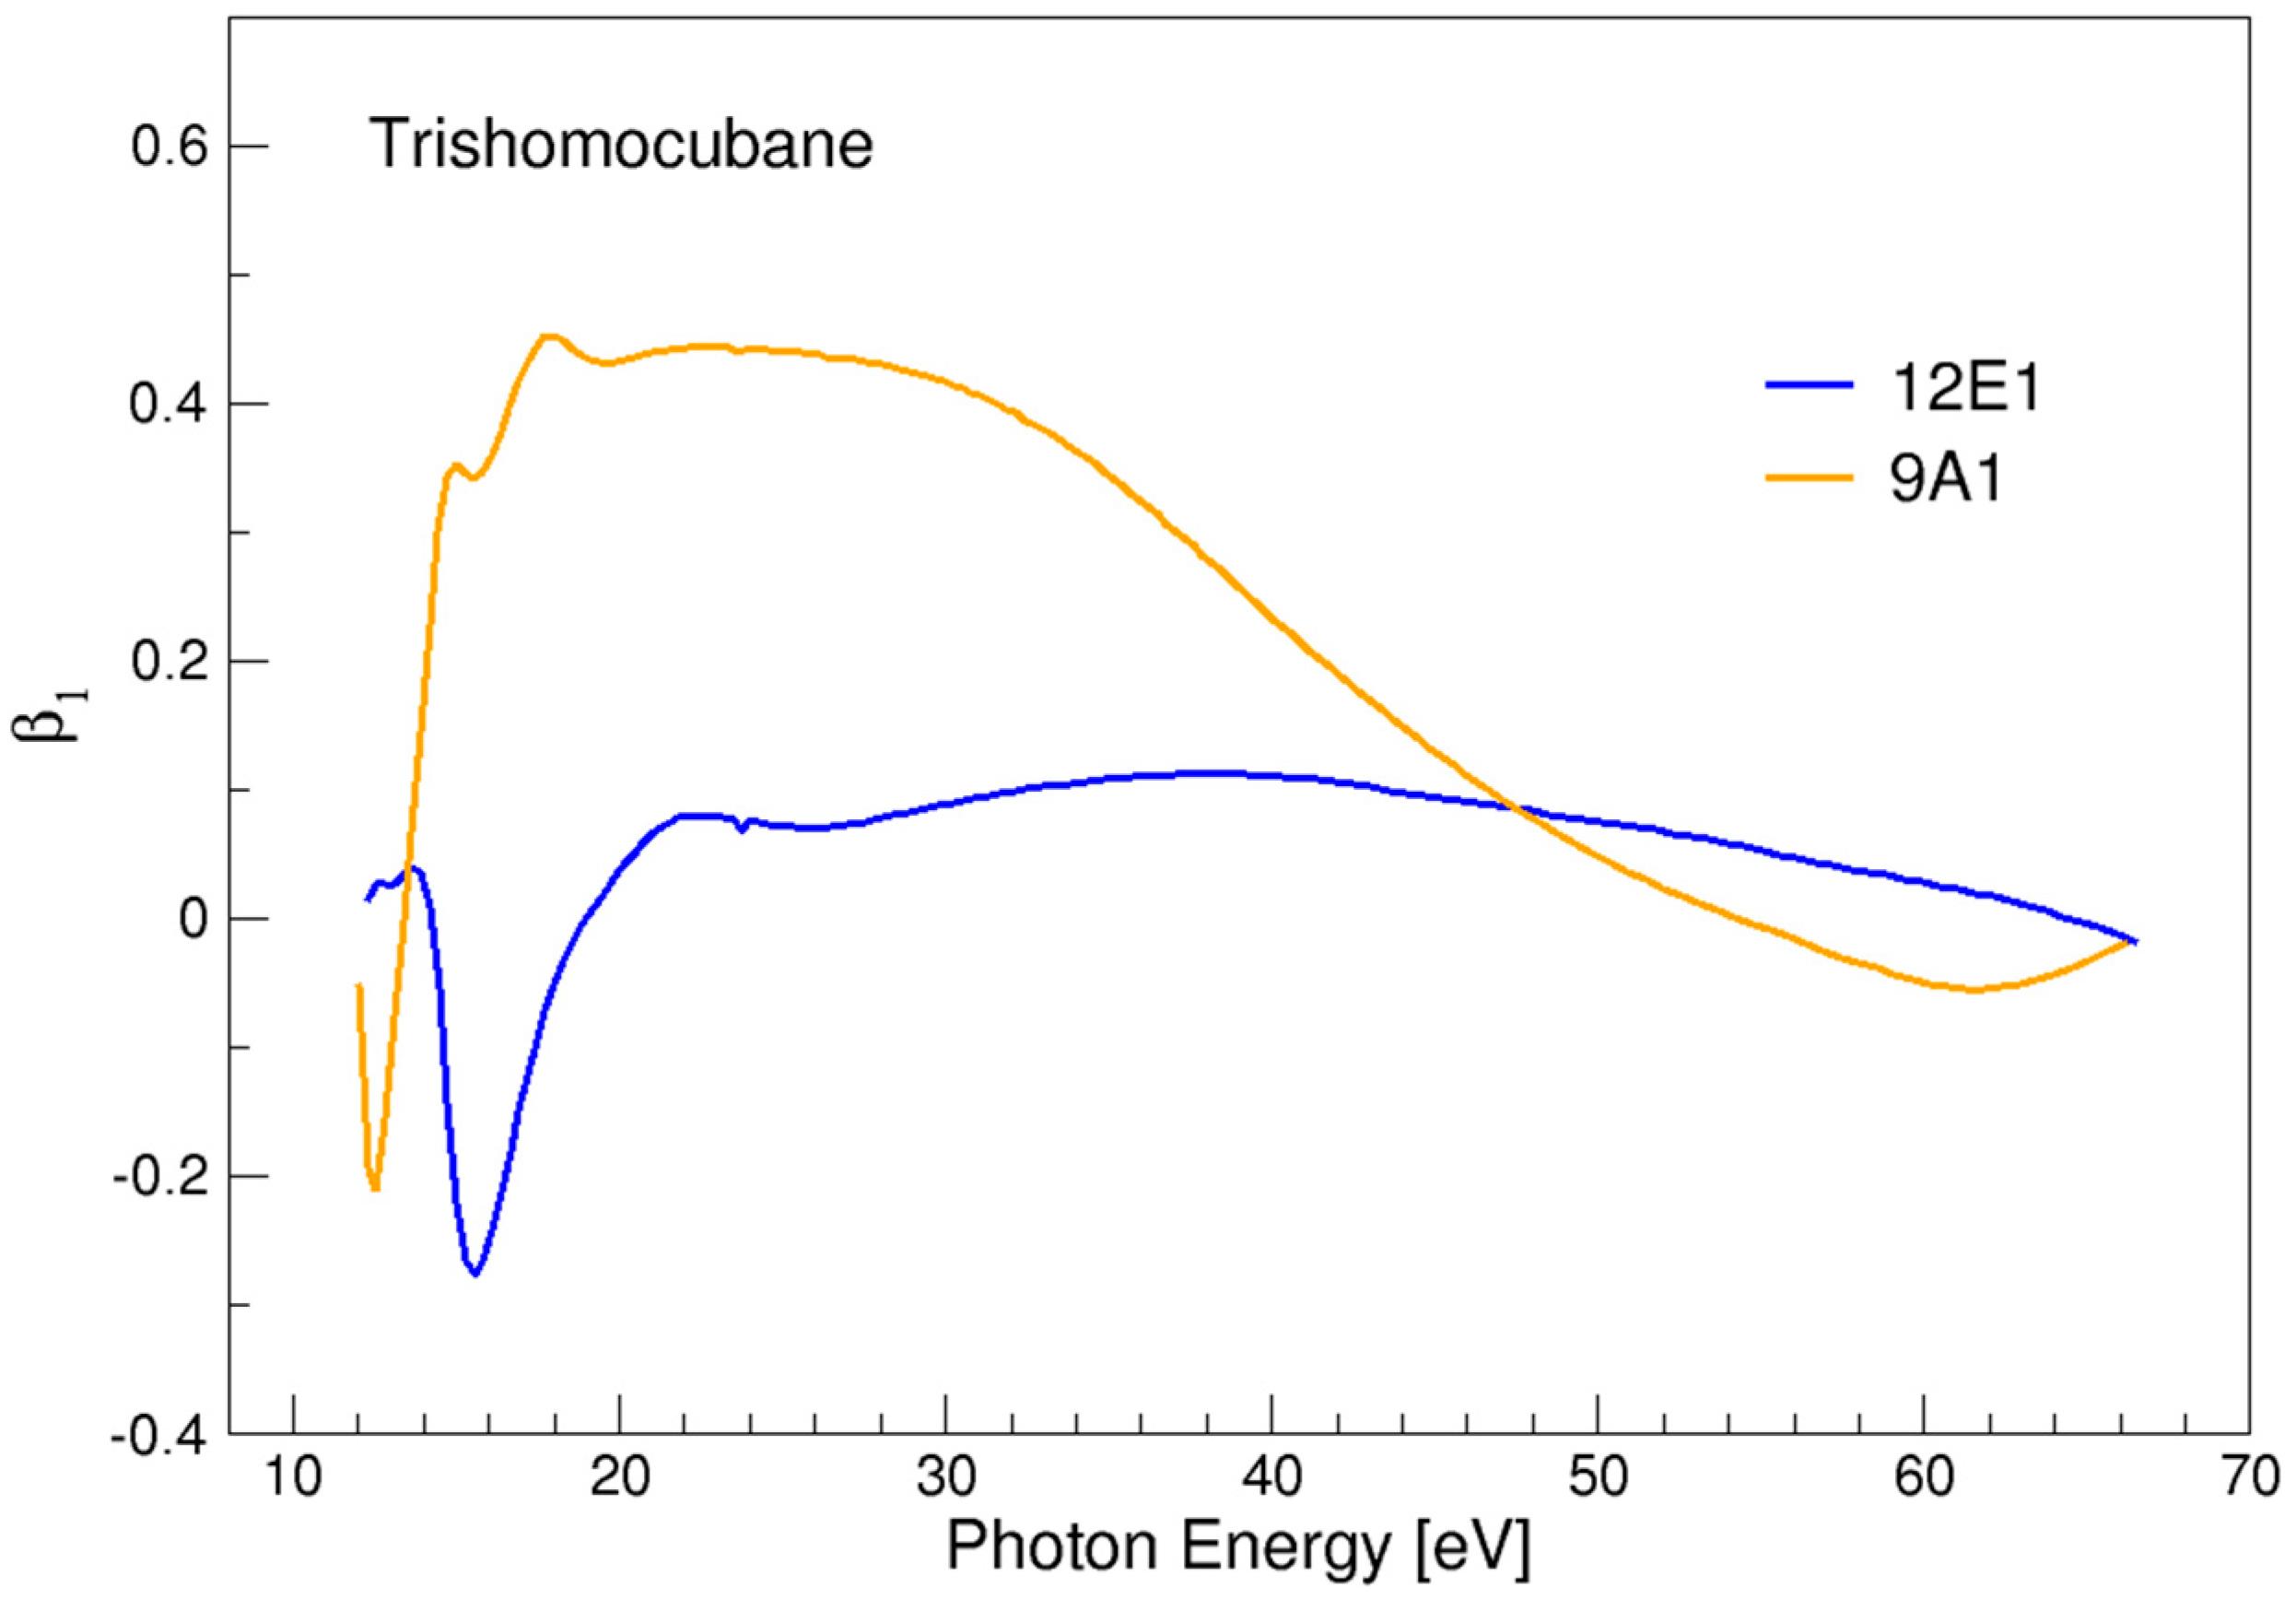
In this case, the separation between consecutive ionizations is estimated to be only 0.3 eV (Table 1) and some band overlap may be expected. We have considered the two ionizations as isolated. The difference in the profiles (Figure 9), as well as the maximum rise of β1, almost −0.3 for the HOMO 9A1, and over 0.4 for the next 12E1, is remarkable. HOMO shows a narrow negative peak, confined in a few eV, and then becomes positive and quite flat. 12E1, apart from a narrower negative minimum, close to the threshold, presents a wide energy region of very positive values, before declining slowly towards zero.

3.6. Chiralane

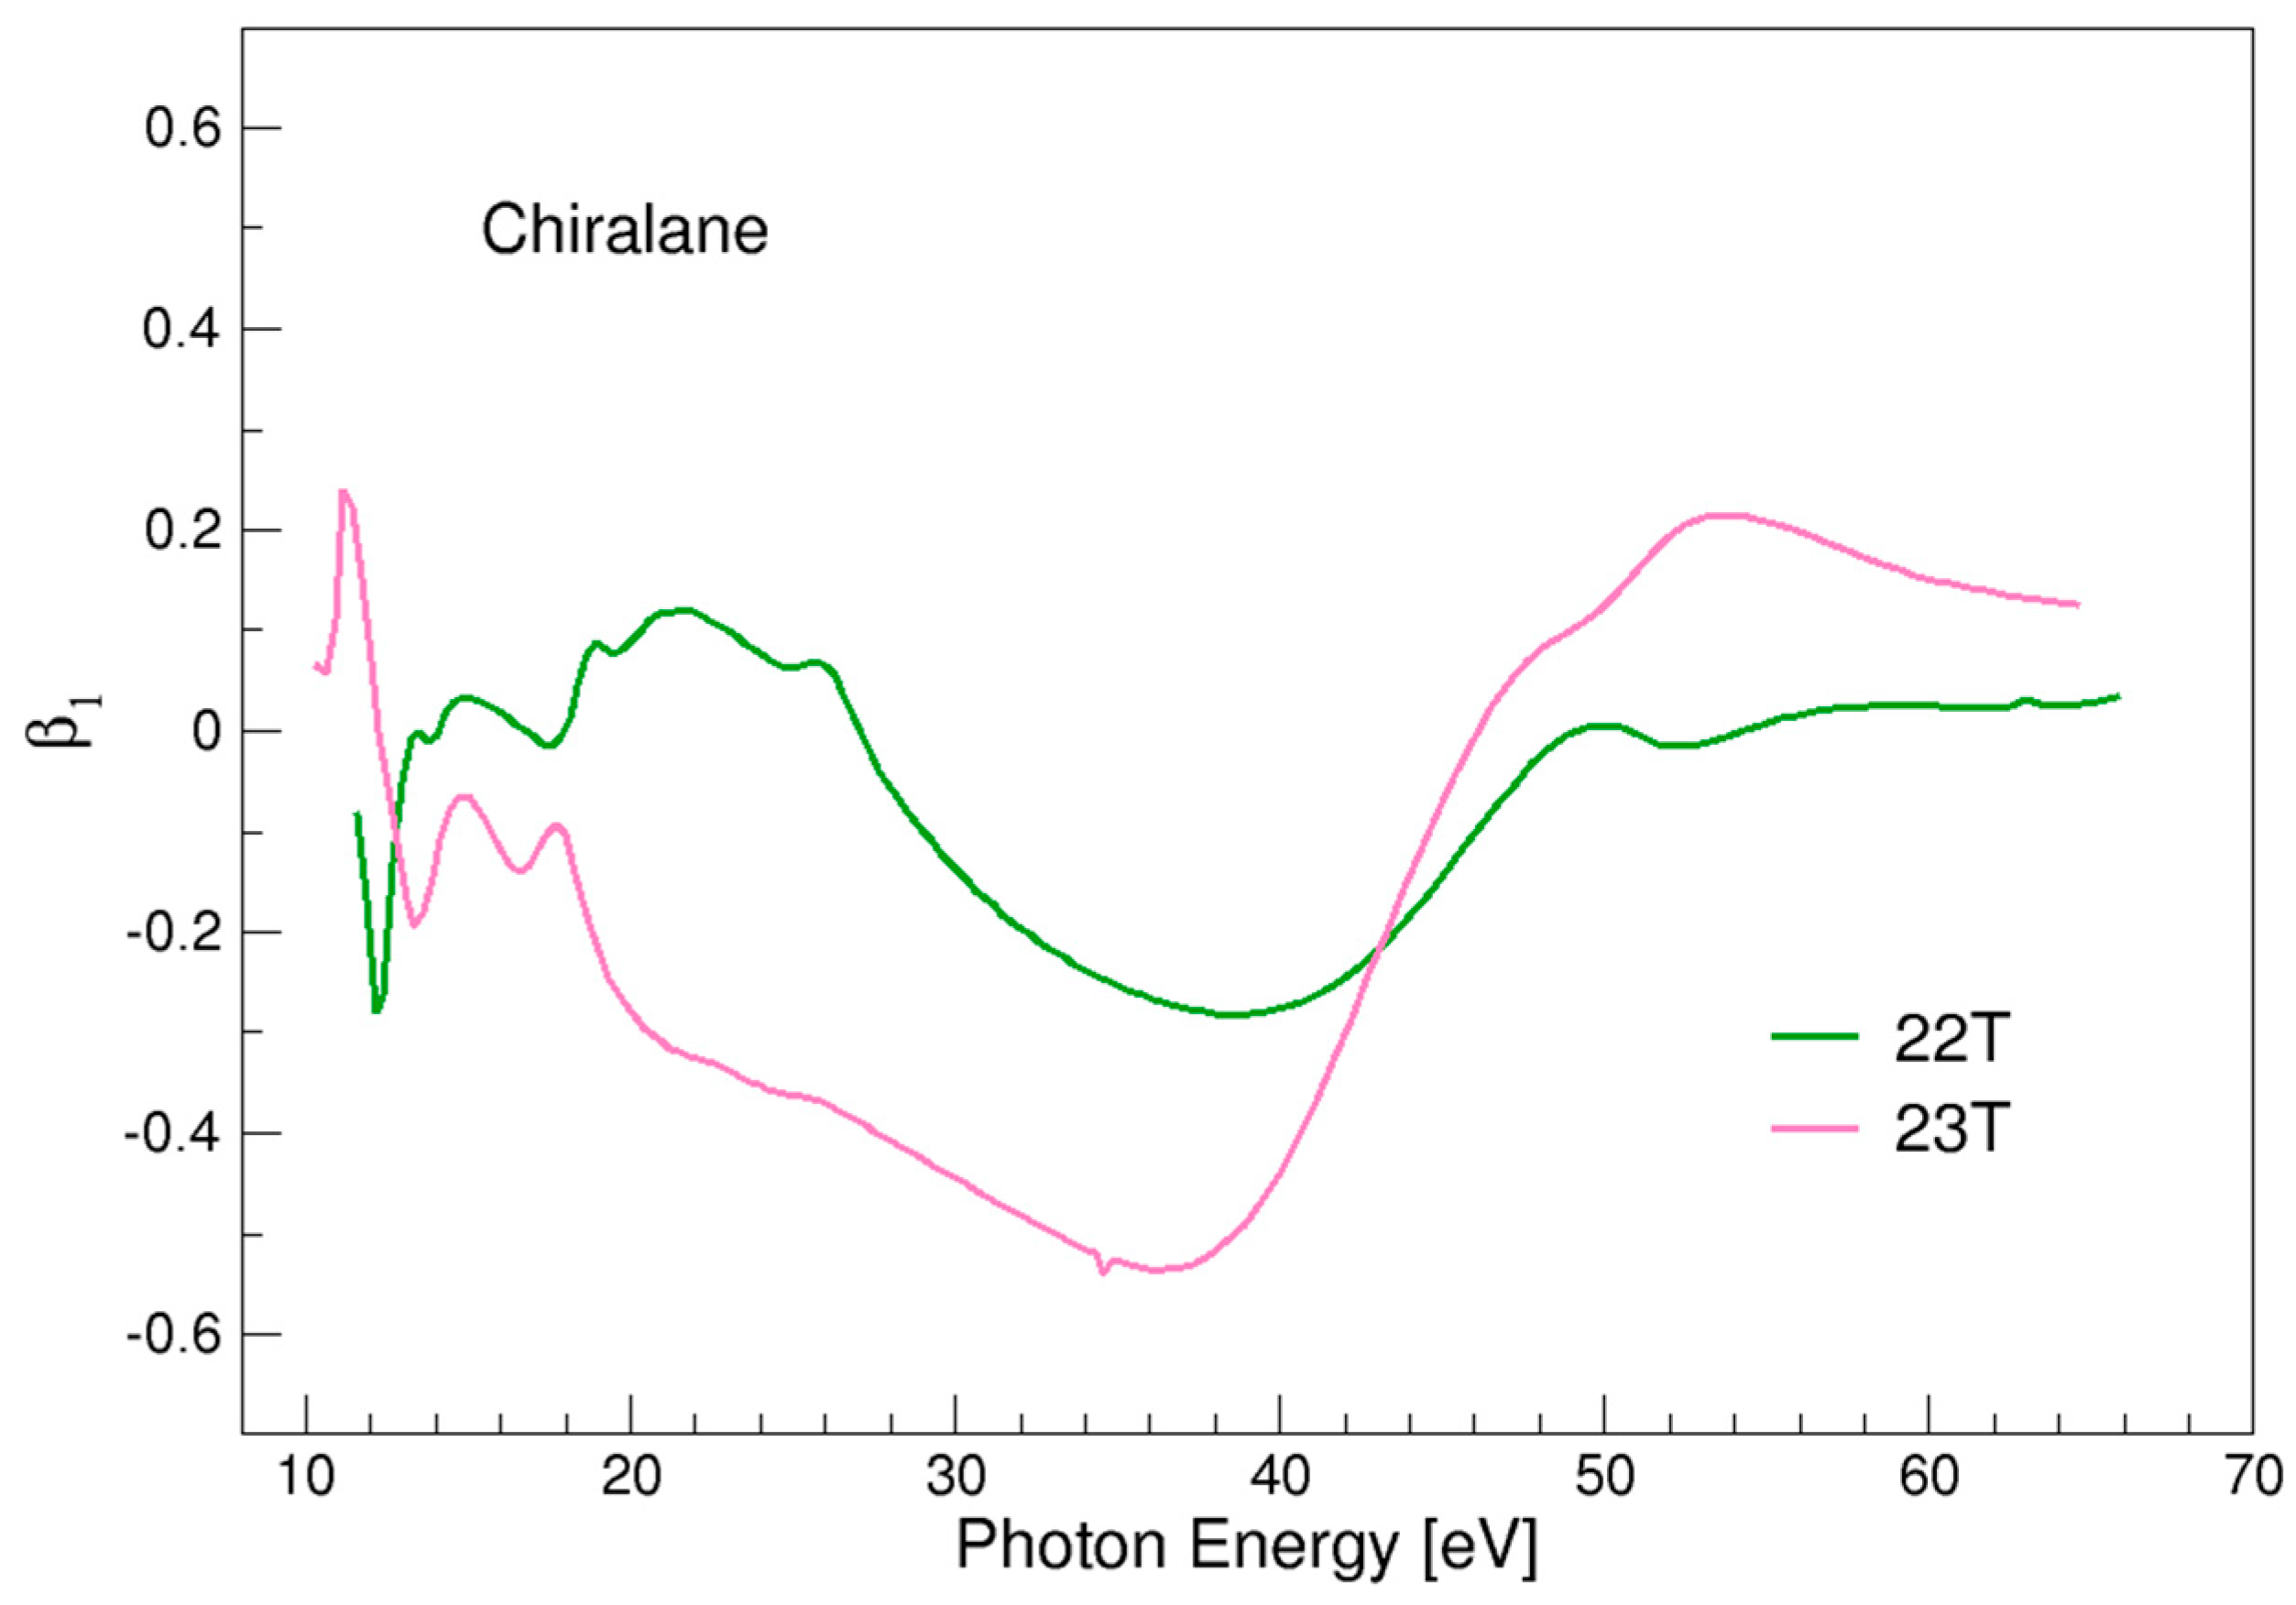
This hypothetical molecule is significantly larger, and due to the high T symmetry is expected to have well separated outer ionizations. We have considered HOMO 23T and HOMO-1 22T. The β1 profiles are presented in Figure 10. Apart from the low energy region, the two profiles show some similarity, with a wide negative region, followed by a decline. However, the amplitude covered by HOMO is significantly larger, so the two curves cross and while HOMO-1 goes close to zero at high energy, HOMO after a negative peak of more than −0.5 β1 units, reaches a positive value of 0.2 at high energy, above 50 eV, a truly remarkable excursion, confirming the “maximum chirality” claim.
We may summarize the important points in this study:
-
PECD is sensitive to chirality in saturated hydrocarbons, and gives generally a rather large signal, apart from the special case of dimethylcyclopropane, probably associated with a peculiar interference-effect.
-
The signature of absolute configuration is therefore very strong and unmistakable in the cases considered.
-
For most of the systems considered the magnitude of β1 values is among the strongest recorded, and in trishomocubane and chiralane vastly exceeds the values previously known. For comparison, a record value of β1~0.18 was reported for α-pinene [22] (note that in the literature often chiral asymmetry is reported as 2 β1). The results seem to suggest that the chiral response increases with molecular size in this class of compounds.
-
Furthermore, the energy range covered by β1 profiles is remarkably large, extending from threshold to several tens of eV, again significantly exceeding current known cases.
-
In the case of relatively similar molecules, with the same type of atoms and bonds, the β1 profiles are not very specific. This similarity has been appreciated only recently [23], also because of the limited number, and quite different nature, of the systems hitherto analyzed, often by the trivial requirement of being readily available.

4. Conclusions

PECD is found to be a very sensitive probe of molecular chirality, also in the nondescriptive class of pure saturated hydrocarbons. The predicted signal is generally very strong and the imprint of absolute configuration unmistakable. Because of this, the current level of theoretical simulations is amply sufficient to give an unequivocal assignment of the absolute configuration in the compounds studied. The discrimination of different structures among similar molecules is instead not very strong. In this respect, it is probably the very low kinetic energy region, close to the threshold, that can prove most sensitive, a region however more difficult to simulate accurately. One may add however that only the outermost ionizations have been considered here, and most systems will still present some additional well-defined bands that could provide further discrimination.
It must be reminded that several refinements are already possible with respect to the pure DFT approach presented in this exploratory study [24,25,26], although the features examined are so clear and strong that we believe are realistically described. More work in the development of theoretical approaches is needed, as already mentioned, to capture finer details, and especially to describe the first few eV after threshold. Due to the complexity of chiral molecules, it will be difficult to employ approaches beyond a single channel description. However, improvements of the single-particle effective potential used, and inclusion of polarization effects by inclusion of a limited set of virtual excited states may significantly improve the near-threshold accuracy.
Finally, the technique is presently applied to gas-phase systems, which may be an advantage and is anyway not a significant limitation for most samples. Recent advancements in liquid jet photoelectron spectroscopy may further lift this limitation. A second limitation is the availability of suitable laboratory sources, as most experiments have been performed at synchrotrons. However, the fast developments in laser sources will again remove this limitation, and in fact, a first study employing high harmonic generation sources has been already performed [27]. Furthermore, the possibility of multiphoton PECD with a laboratory setting has been demonstrated, with good performance [28,29]. This still requires the development of predictive theoretical tools.

Funding

This research received no external funding.

Institutional Review Board Statement

Not applicable.

Informed Consent Statement

Not applicable.

Data Availability Statement

Not applicable.

Acknowledgments

This work was supported by the ISCRA C project CHIRPES from CINECA.

Conflicts of Interest

The authors declare no conflict of interest.

References

  1. Berova, N.; Polavarapu, P.L. Comprehensive Chiroptical Spectroscopy: Applications in Stereochemical Analysis of Synthetic Compounds, Natural Products, and Biomolecules; Nakanishi, K., Woody, R.W., Eds.; Wiley: Hoboken, NJ, USA, 2012. [Google Scholar]
  2. Polavarapu, P.L. Chiroptical Spectroscopy: Fundamentals and Applications; CRC Press: Boca Raton, FL, USA, 2016. [Google Scholar]
  3. McCann, D.M.; Stephens, P.J.; Cheeseman, J.R. Determination of absolute configuration using density functional theory calculation of optical rotation: Chiral alkanes. Org. Chem. 2004, 69, 8709–8717. [Google Scholar] [CrossRef]
  4. Saito, F.; Schreiner, P.R. Determination of the Absolute Configurations of Chiral Alkanes–An Analysis of the Available Tools. Eur. J. Org. Chem. 2020, 40, 6328–6339. [Google Scholar] [CrossRef]
  5. Müller, T.; Wiberg, K.B.; Vaccaro, P.H. Cavity ring-down polarimetry (CRDP): A new scheme for probing circular birefringence and circular dichroism in the gas phase. J. Phys. Chem. A 2002, 104, 5959–5968. [Google Scholar] [CrossRef]
  6. Powis, I. Photoelectron circular dichroism in chiral molecules. Adv. Chem. Phys. 2008, 138, 267–330. [Google Scholar]
  7. Janssen, M.H.; Powis, I. Detecting chirality in molecules by imaging photoelectron circular dichroism. Phys. Chem. Chem. Phys. 2014, 16, 856–871. [Google Scholar] [CrossRef]
  8. Nahon, L.; Garcia, G.A.; Powis, I. Valence shell one-photon photoelectron circular dichroism in chiral systems. J. Electron. Spectr. Rel. Phen. 2015, 204, 322. [Google Scholar] [CrossRef]
  9. Rescigno, T.; McKoy, V.; Schneider, B. Electron-Molecule and Photon-Molecule Collisions; Plenum Press: New York, NY, USA, 1979. [Google Scholar]
  10. Huo, W.; Gianturco, F. (Eds.) Computational Methods for Electron–Molecule Collisions; Springer: New York, NY, USA, 1995. [Google Scholar]
  11. Burke, P.G. R-Matrix Theory of Atomic Collisions: Application to Atomic, Molecular and Optical Processes; Springer: Berlin/Heidelberg, Germany, 2011. [Google Scholar]
  12. Stranges, S.; Turchini, S.; Alagia, M.; Alberti, G.; Contini, G.; Decleva, P.; Fronzoni, G.; Stener, M.; Zema, N.; Prosperi, T. Valence photoionization dynamics in circular dichroism of chiral free molecules: The methyl-oxirane. J. Chem. Phys. 2015, 122, 244303. [Google Scholar] [CrossRef] [PubMed]
  13. Powis, I. Photoelectron circular dichroism of the randomly oriented chiral molecules glyceraldehyde and lactic acid. J. Chem. Phys. 2000, 112, 301–310. [Google Scholar] [CrossRef]
  14. Ilchen, M.; Hartmann, G.; Rupprecht, P.; Artemyev, A.N.; Coffee, R.N.; Li, Z.; Ogasawara, H.; Osipov, T.; Ray, D.; Schmidt, P. Emitter-site-selective photoelectron circular dichroism of trifluoromethyloxirane. Phys. Rev. A 2017, 95, 053423. [Google Scholar] [CrossRef] [Green Version]
  15. Chandra, N. Photoelectron spectroscopic studies of polyatomic molecules. I. Theory. J. Phys. B At. Mol. Phys. 1987, 20, 3405. [Google Scholar] [CrossRef]
  16. Toffoli, D.; Stener, M.; Fronzoni, G.; Decleva, P. Convergence of the multicenter B-spline DFT approach for the continuum. Chem. Phys. 2002, 276, 25. [Google Scholar] [CrossRef]
  17. Bachau, H.; Cormier, E.; Decleva, P.; Hansen, J.E.; Martín, F. Applications of B-splines in atomic and molecular physics. Rep. Prog. Phys. 2001, 64, 1815. [Google Scholar] [CrossRef]
  18. Te Velde, G.T.; Bickelhaupt, F.M.; Baerends, E.J.; Fonseca Guerra, C.; van Gisbergen, S.J.; Snijders, J.G.; Ziegler, T. Chemistry with ADF. J. Comput. Chem. 2001, 22, 931–967. [Google Scholar] [CrossRef]
  19. ADF 2021.1, SCM, Theoretical Chemistry, Vrije Universiteit, Amsterdam, The Netherlands. Available online: http://www.scm.com (accessed on 1 December 2021).
  20. Van Leeuwen, R.; Baerends, E.J. Exchange-correlation potential with correct asymptotic behavior. Phys. Rev. A 1994, 49, 2421. [Google Scholar] [CrossRef] [PubMed] [Green Version]
  21. Schwartz, A.; Petitjean, M. [6.6]Chiralane: A Remarkably Symmetric Chiral Molecule. Symmetry Cult. Sci. 2008, 19, 307–316. [Google Scholar]
  22. Ganjitabar, H.; Hadidi, R.; Garcia, G.A.; Nahon, L.; Powis, I. Vibrationally-resolved photoelectron spectroscopy and photoelectron circular dichroism of bicyclic monoterpene enantiomers. J. Mol. Spectrosc. 2018, 353, 11–19. [Google Scholar] [CrossRef]
  23. Catone, D.; Zema, N.; Prosperi, T.; Stener, M.; Decleva, P.; Nitti, P.; Turchini, S. PECD study of a single conformer molecule: A critical comparison of experiment and theory Phys. Chem. Chem. Phys. 2022; submitted. [Google Scholar]
  24. Ponzi, A.; Angeli, C.; Cimiraglia, R.; Coriani, S.; Decleva, P. Dynamical photoionization observables of the CS molecule: The role of electron correlation. J. Chem. Phys. 2014, 140, 204304. [Google Scholar] [CrossRef] [PubMed]
  25. Moitra, T.; Ponzi, A.; Koch, H.; Coriani, S.; Decleva, P. Accurate description of photoionization dynamical parameters. J. Phys. Chem. Lett. 2020, 11, 5330–5337. [Google Scholar] [CrossRef]
  26. Moitra, T.; Coriani, S.; Decleva, P. Capturing correlation effects on photoionization dynamics. J. Chem. Theory Comput. 2021, 17, 5064–5079. [Google Scholar] [CrossRef]
  27. Ferré, A.; Handschin, C.; Dumergue, M.; Burgy, F.; Comby, A.; Descamps, D.; Fabre, B.; Garcia, G.A.; Géneaux, R.; Merceron, L.; et al. A table-top ultrashort light source in the extreme ultraviolet for circular dichroism experiments. Nat. Photonics 2015, 9, 93–98. [Google Scholar] [CrossRef]
  28. Lux, C.; Wollenhaupt, M.; Bolze, T.; Liang, Q.; Köhler, J.; Sarpe, C.; Baumert, T. Circular dichroism in the photoelectron angular distributions of camphor and fenchone from multiphoton ionization with femtosecond laser pulses. Angew. Chem. Int. Ed. 2012, 51, 5001–5005. [Google Scholar] [CrossRef] [PubMed]
  29. Lehmann, C.S.; Ram, N.B.; Powis, I.; Janssen, M.H. Imaging photoelectron circular dichroism of chiral molecules by femtosecond multiphoton coincidence detection. J. Chem. Phys. 2013, 139, 234307. [Google Scholar] [CrossRef] [PubMed]
Figure 1. Dichroic PECD parameter β1 (here D) relative to the three outermost bands of methyloxirane. Experimental points and DFT theoretical simulation. Reproduced from ref [12] with the permission of AIP Publishing.
Chemistry 04 00003 g001
Figure 2. The seven molecules considered: dimethylcyclopropane, brexane, twistane, twistbrendane, ditwistbrendane, trishomocubane and chiralane.
Chemistry 04 00003 g002
Figure 3. β1 parameter for the two outermost ionizations, 11A and 9B, and the average value, in dimethylcyclopropane.
Chemistry 04 00003 g003
Figure 4. β1 parameter for the next two outermost ionizations, 10A and 8B, and the average value, in dimethylcyclopropane.
Chemistry 04 00003 g004
Figure 5. β1 parameter for the two outermost ionizations, 16B and 18A, and the average value, in brexane.
Chemistry 04 00003 g005
Figure 6. β1 parameter for the three outermost ionizations, 19A, 20A and 18B, and the average value, in twistane.
Chemistry 04 00003 g006
Figure 7. β1 parameter for the three outermost ionizations, 17A, 16B and 18A, and the average value, in twistbrendane.
Chemistry 04 00003 g007
Figure 8. β1 parameter for the three outermost ionizations, 18B, 18A and 19A, and the average value, in ditwistbrendane.
Chemistry 04 00003 g008
Figure 9. β1 parameter for the two outermost ionizations, 12E1 and 9A1, and the average value, in trishomocubane.
Chemistry 04 00003 g009
Figure 10. β1 parameter for the two outermost ionizations, 23T and 22T, and the average value, in chiralane.
Chemistry 04 00003 g010
Table 1. Orbital ionizations and ionization energies from LB94 DFT eigenvalues.
Dimethylcyclopropane
8B13.34
10A13.22
9B11.64
11A11.41
Brexane
18A11.74
16B11.63
Twistane
19A11.45
20A11.42
18B11.31
Twistbrendane
17A11.85
16B11.67
18A11.65
Ditwistbrendane
18B11.94
18A11.84
19A11.74
Trishomocubane
11E112.31
12E112.04
9A111.76
Chiralane
22T11.46
23T10.18
Publisher’s Note: MDPI stays neutral with regard to jurisdictional claims in published maps and institutional affiliations.