
Computational Models for Analyzing the Thermodynamic Properties of Linear Triatomic Molecules

 ,
,  , ,
, ,
Abstract
1. Introduction
2. Computational Method
2.1. Formulating the Vibrational Partition Function
2.2. Formulating the Rotational and Translational Partition Functions
2.3. Formulating the Thermodynamic Functions
3. Results and Discussion
3.1. Significance of the Optimization Parameter
3.2. Validating the Thermodynamic Models
4. Conclusions
Author Contributions
Funding
Data Availability Statement
Conflicts of Interest
Glossary
| NIST | National Institute of Standards and Technology |
| N | Atomicity or number of atoms in a molecule |
| IMTZ | Improved Tietz |
| MRM | Modified Rosen–Morse |
| Q | Canonical partition function |
| Vibrational partition function | |
| Rotational partition function | |
| Translational partition function | |
| Partition function for symmetric vibration | |
| Partition function for asymmetric vibration | |
| Partition function for bending vibration | |
| XZY | Linear triatomic molecule with atoms X, Y, and Z |
| Equilibrium dissociation energy | |
| Equilibrium force constant for the symmetric vibration | |
| Reduced mass of atoms X and Y | |
| c | Speed of light |
| Symmetric harmonic vibrational frequency | |
| Asymmetric harmonic vibrational frequency | |
| Bending vibration harmonic frequency | |
| Equilibrium bond length between atoms Z and X | |
| Equilibrium bond length between atoms Z and Y | |
| W | Lambert W function |
| r | Internuclear separation between atoms X and Y |
| T | Temperature and kB the Boltzmann constant |
| Boltzmann constant | |
| Erfi(z) | Imaginary error function evaluated at z |
| Number of excited bonded molecular states | |
| ν | Vibrational quantum number |
| Vibrational energy eigenvalues | |
| ℏ | Reduced Planck constant |
| λ | Optimization parameter |
| m | Molar mass of molecule |
| p | Pressure exerted by gaseous molecules |
| V | Volume of gaseous molecules |
| Avogadro number | |
| R | Universal gas constant |
| S | Molar entropy |
| H | Molar enthalpy |
| Calibrated molar enthalpy | |
| G | Molar Gibbs free energy |
| Calibrated molar Gibbs free energy | |
| Constant-pressure (or isobaric) molar heat capacity | |
| PAD | Percentage absolute deviation |
| MPAD | Mean percentage absolute deviation |
References
- Bera, M.N.; Riera, A.; Lewenstein, M.; Winter, A. Generalized laws of thermodynamics in the presence of correlations. Nat. Commun. 2017, 8, 2180. [Google Scholar] [CrossRef]
- Xie, C.Y.; Tao, H.Z.; Li, W.; Wang, H.J. Numerical simulation and experimental investigation of heat pipe heat exchanger applied in residual heat removal system. Ann. Nucl. Energy 2019, 144, 568. [Google Scholar] [CrossRef]
- Ma, H.; Du, N.; Zhang, Z.; Lyu, F.; Deng, N.; Li, C.; Yu, S. Assessment of the optimum operation conditions on a heat pipe heat exchanger for waste heat recovery in steel industry. Renew. Sustain. Energy Rev. 2017, 79, 50. [Google Scholar] [CrossRef]
- Ma, H.; Yin, L.; Shen, X.; Lu, W.; Sun, Y.; Zhang, Y.; Deng, N. Experimental study on heat pipe assisted heat exchanger used for industrial waste heat recovery. Appl. Energy 2016, 169, 177. [Google Scholar] [CrossRef]
- Ding, Y.; Guo, Q.; Guo, W.; Chu, W.; Wang, Q. Review of Recent Applications of Heat Pipe Heat Exchanger Use for Waste Heat Recovery. Energies 2024, 17, 2504. [Google Scholar] [CrossRef]
- Wang, C.W.; Peng, X.L.; Liu, J.Y.; Jiang, R.; Li, X.P.; Liu, Y.S.; Liu, S.Y.; Wei, L.S.; Zhang, L.H.; Jia, C.S. A novel formulation representation of the equilibrium constant for water gas shift reaction. Int. J. Hydrogen Energy 2022, 47, 27821. [Google Scholar] [CrossRef]
- Wang, C.W.; Li, J.; Zhang, L.H.; Ding, Q.C.; Liu, G.H.; Li, G.; Jiang, R.; Peng, X.L.; Wei, L.S.; Tang, H.M.; et al. Non-fitting functional representation for the equilibrium constant subject to reaction between H2S and CO2. Fuel 2024, 362, 130916. [Google Scholar] [CrossRef]
- Wang, J.F.; Zhang, H.; Liang, L.X.; Peng, X.L.; Wang, C.W.; Deng, P.; Ding, Q.C.; Jia, C.S. A novel formulation representation regarding the equilibrium constant subject to reactions between N2 and O2. Comput. Theor. Chem. 2024, 1239, 114758. [Google Scholar] [CrossRef]
- Eyube, E.S.; Makasson, C.R.; Omugbe, E.; Onate, C.A.; Inyang, E.P.; Tahir, A.M.; Ojar, J.U.; Najoji, S.D. Improved energy equations and thermal functions for diatomic molecules: A generalized fractional derivative approach. J. Mol. Model. 2024, 30, 419. [Google Scholar] [CrossRef]
- Jia, C.S.; Diao, Y.F.; Liu, X.J.; Wang, P.Q.; Liu, J.Y.; Zhang, G.D. Equivalence of the Wei potential model and Tietz potential model for diatomic molecules. J. Chem. Phys. 2012, 137, 014101. [Google Scholar] [CrossRef]
- Zhang, G.D.; Liu, J.Y.; Zhang, L.H.; Zhou, W.; Jia, C.S. Modified Rosen-Morse potential-energy model for diatomic molecules. Phys. Rev. A 2012, 86, 062510. [Google Scholar] [CrossRef]
- Yanar, H.; Taş, A.; Salti, M.; Aydoğdu, O. Ro-vibrational energies of CO molecule via improved generalized Pöschl–Teller potential and Pekeris-type approximation. Eur. Phys. J. Plus 2020, 135, 292. [Google Scholar] [CrossRef]
- Eyube, E.S.; Notani, P.P.; Izam, M.M. Potential parameters and eigen spectra of improved Scarf II potential energy function for diatomic molecules. Mol. Phys. 2022, 120, e1979265. [Google Scholar] [CrossRef]
- Eyube, E.S.; Nyam, G.G.; Notani, P.P. Improved q-deformed Scarf II oscillator. Phys. Scr. 2021, 96, 125017. [Google Scholar] [CrossRef]
- Eyube, E.S.; Notani, P.P.; Dikko, A.B. Modeling of diatomic molecules with modified hyperbolical-type potential. Eur. Phys. J. Plus 2022, 137, 329. [Google Scholar] [CrossRef]
- Roshanzamir, M. Thermal responses and the energy spectral of diatomic molecules using Nikiforov-Uvarov methodology. Mathematics 2023, 11, 3338. [Google Scholar] [CrossRef]
- Khordad, R. Rashba effect in Frost-Musulin quantum dots: Analytical study. Opt. Quantum Electron. 2024, 56, 963. [Google Scholar] [CrossRef]
- Ghanbari, A.; Khordad, R. Thermodynamic properties of several substances using Tietz-Hua potential. Indian J. Phys. 2022, 96, 1413. [Google Scholar] [CrossRef]
- Onate, C.A.; Okon, I.B.; Eyube, E.S.; Omugbe, E.; Emeje, K.O.; Onyeaju, M.C.; Ajani, O.O.; Akinpelu, J.A. Fisher Information for a System Composed of a Combination of Similar Potential Models. Quantum Rep. 2024, 6, 184. [Google Scholar] [CrossRef]
- Khordad, R.; Avazpour, A.; Ghanbari, A. Exact analytical calculations of thermodynamic functions of gaseous substances. Chem. Phys. 2019, 517, 30. [Google Scholar] [CrossRef]
- Peng, X.L.; Jiang, R.; Jia, C.S.; Zhang, L.H.; Zhao, Y.L. Gibbs free energy of gaseous phosphorus dimer. Chem. Eng. Sci. 2018, 190, 122. [Google Scholar] [CrossRef]
- Eyube, E.S. Entropy and Gibbs free energy equations for the specialized Pöschl-Teller potential. Eur. Phys. J. Plus 2022, 137, 760. [Google Scholar] [CrossRef]
- Edet, C.O.; Osang, J.E.; Ali, N.; Agbo, E.P.; Aljunid, S.A.; Endut, R.; Ettah, E.B.; Khordad, R.; Ikot, A.N.; Asjad, M. Non-relativistic energy spectra of the modified Hylleraas potential and its thermodynamic properties in arbitrary dimensions. Quantum Rep. 2022, 4, 239. [Google Scholar] [CrossRef]
- Habibinejad, M.; Khordad, R.; Ghanbari, A. Specific heat at constant pressure, enthalpy and Gibbs free energy of boron nitride (BN) using q-deformed exponential-type potential. Phys. B 2021, 613, 412940. [Google Scholar] [CrossRef]
- Eyube, E.S.; Notani, P.P.; Nyam, G.G.; Jabil, Y.Y.; Izam, M.M. Pure vibrational state energies and statistical-mechanical models for the reparameterized Scarf oscillator. Front. Phys. 2023, 11, 978347. [Google Scholar] [CrossRef]
- Jia, C.S.; Zhang, L.H.; Peng, X.L.; Luo, J.X.; Zhao, Y.L.; Liu, J.Y.; Guo, J.J.; Tang, L.D. Prediction of entropy and Gibbs free energy for nitrogen. Chem. Eng. Sci. 2019, 202, 70. [Google Scholar] [CrossRef]
- Onyenegecha, C.P.; Njokua, I.J.; Opara, A.I.; Echendua, O.K.; Omoko, E.N.; Eze, F.C.; Okereke, C.J.; Onyeocha, E.; Nwaneho, F.U. Nonrelativistic solutions of Schrödinger equation and thermodynamic properties with the proposed modified Mobius square plus Eckart potential. Heliyon 2022, 8, e08952. [Google Scholar] [CrossRef]
- Eyube, E.S. Prediction of thermal properties of phosphorus dimer—The analytical approach Chem. Phys. Lett. 2022, 801, 139702. [Google Scholar] [CrossRef]
- Jia, C.S.; Wang, C.W.; Zhang, L.H.; Peng, X.L.; Tang, H.M. Enthalpy of gaseous phosphorus dimer. Chem. Eng. Sci. 2018, 183, 26. [Google Scholar] [CrossRef]
- Eyube, E.S.; Bitrus, B.M.; Samaila, H.; Notani, P.P. Model Entropy Equation for Gaseous Substances. Int. J. Thermophys. 2022, 43, 55. [Google Scholar] [CrossRef]
- Eyube, E.S.; Notani, P.P.; Samaila, H. Analytical prediction of enthalpy and Gibbs free energy of gaseous molecules. Chem. Thermodyn. Therm. Anal. 2022, 6, 100060. [Google Scholar] [CrossRef]
- Ding, Q.C.; Chen, J.Q.; Peng, X.L.; Wang, C.W.; Liu, G.H.; Jiang, R.; Yuan, H.; Jia, C.S. A general formulation of the Gibbs free energy regarding six symmetric triatomic molecules. Eur. Phys. J. Plus 2024, 139, 660. [Google Scholar] [CrossRef]
- Liu, G.H.; Ding, Q.C.; Wang, C.W.; Jia, C.S. Unified explicit formulations of thermodynamic properties for the gas NO2 and gaseous BF2 and AlCl2 radicals. Chem. Phys. Lett. 2023, 830, 140788. [Google Scholar] [CrossRef]
- Liu, G.H.; Ding, Q.C.; Wang, C.W.; Jia, C.S. Unified non-fitting explicit formulation of thermodynamic properties for five compounds. J. Mol. Struct. 2023, 1294, 136543. [Google Scholar] [CrossRef]
- Liang, D.C.; Zeng, R.; Wang, C.W.; Ding, Q.C.; Wei, L.S.; Peng, X.L.; Liu, J.Y.; Yu, J.; Jia, C.S. Prediction of thermodynamic properties for sulfur dioxide. J. Mol. Liq. 2022, 352, 118722. [Google Scholar] [CrossRef]
- Wang, C.W.; Wang, J.; Liu, Y.S.; Li, J.; Peng, X.L.; Jia, C.S.; Zhang, L.H.; Yi, L.Z.; Liu, J.Y.; Li, C.J.; et al. Prediction of ideal-gas thermodynamic properties for water. J. Mol. Liq. 2021, 321, 114912. [Google Scholar] [CrossRef]
- Jia, C.S.; Li, J.; Liu, Y.S.; Peng, X.L.; Jia, X.; Zhang, L.H.; Jiang, R.; Li, X.P.; Liu, J.Y.; Zhao, Y.L. Predictions of thermodynamic properties for hydrogen sulfide. J. Mol. Liq. 2020, 315, 113751. [Google Scholar] [CrossRef]
- Jia, C.S.; Wang, Y.T.; Wei, L.S.; Wang, C.W.; Peng, X.L. Predictions of entropy and Gibbs energy for carbonyl sulfide. ACS Omega 2019, 4, 20000–20004. [Google Scholar] [CrossRef]
- Wang, J.; Jia, C.S.; Li, C.J.; Peng, X.L.; Zhang, L.H.; Liu, J.Y. Thermodynamic properties of carbon dioxide. ACS Omega 2019, 4, 19193. [Google Scholar] [CrossRef]
- Chen, X.Y.; Li, J.; Jia, C.S. Thermodynamic properties of gaseous carbon disulfide. ACS Omega 2019, 4, 16121. [Google Scholar] [CrossRef]
- Deng, M.; Jia, C.S. Prediction of enthalpy of nitrogen gas. Eur. Phys. J. Plus 2018, 133, 258. [Google Scholar] [CrossRef]
- Eyube, E.S.; Notani, P.P.; Dlama, Y.; Omugbe, E.; Onate, C.A.; Okon, I.B.; Nyam, G.G.; Jabil, Y.Y.; Izam, M.M. Isobaric molar heat capacity model for the improved Tietz potential. Int. J. Quantum Chem. 2023, 123, e27040. [Google Scholar] [CrossRef]
- Schwabl, F. Statistical Mechanics, 2nd ed.; Springer: Berlin/Heidelberg, Germany, 2006. [Google Scholar]
- Johns, J.W.C. The absorption spectrum of BO2. Can. J. Phys. 1961, 39, 1738. [Google Scholar] [CrossRef]
- Nobes, R.H.; Pople, J.A.; Radom, L.; Handy, N.C.; Knowles, P.J. Slow convergence of the møller-plesset perturbation series: The dissociation energy of hydrogen cyanide and the electron affinity of the cyano radical. Chem. Phys. Lett. 1987, 138, 481. [Google Scholar] [CrossRef]
- Martin, J.M.L.; François, J.P.; Gijbels, R. The dissociation energy of N3. J. Chem. Phys. 1990, 93, 4485. [Google Scholar] [CrossRef]
- Ornellas, F.R.; Iwata, S. Ab Initio studies of silicon and nitrogen clusters: Cyclic or linear Si2N. J. Phys. Chem. 1996, 100, 10919. [Google Scholar] [CrossRef]
- National Institute of Standards and Technology (NIST). NIST Chemistry JANAF; NIST Standard Reference Database Number 69; National Institute of Standards and Technology: Gaithersburg, MD, USA, 2017. [Google Scholar] [CrossRef]


| Molecule | Atoms in Molecule | Molecular Parameter [32,34,44,45,46,47] | α (Å−1) | λ | |||||||
|---|---|---|---|---|---|---|---|---|---|---|---|
| X | Z | Y | De (kcalmol−1) | reZX (Å) | reZY (Å) | ωes (cm−1) | ωea (cm−1) | ωeb (cm−1) | |||
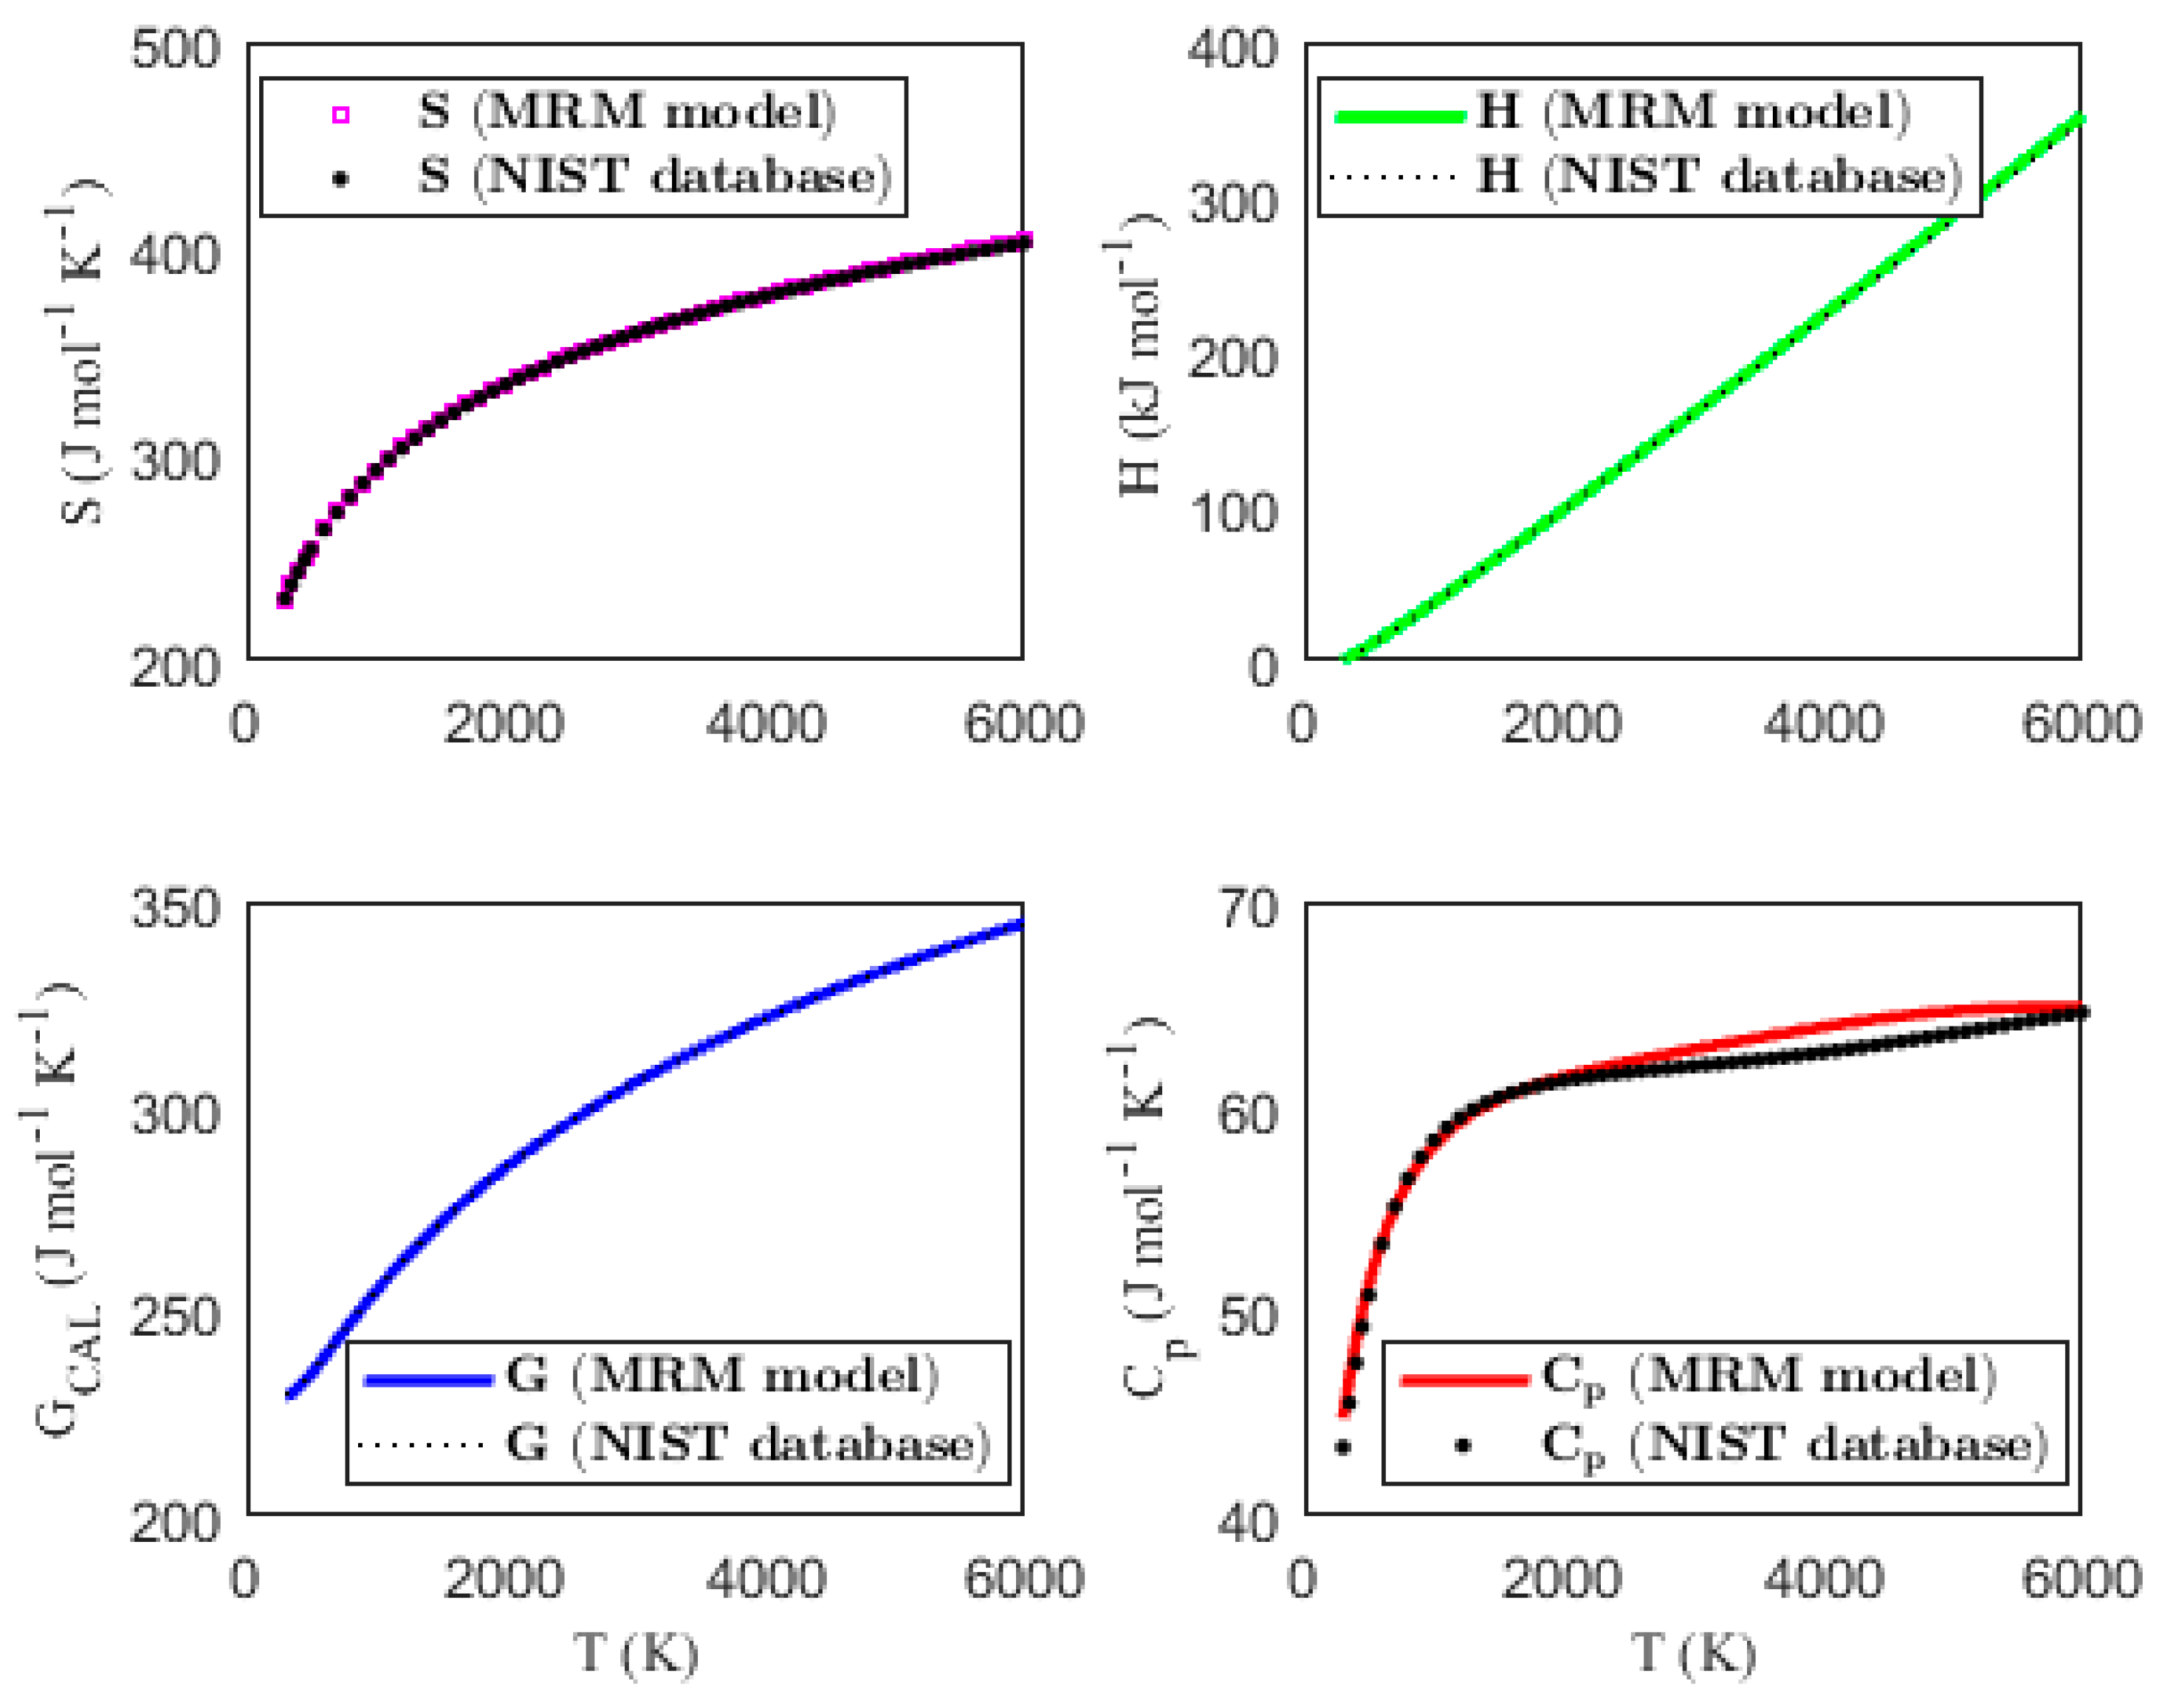
| BO2 | O | B | O | 68.33 | 1.263 | 1.263 | 1056 | 1321.7 | 454 | 2.7917 | 0.913 |
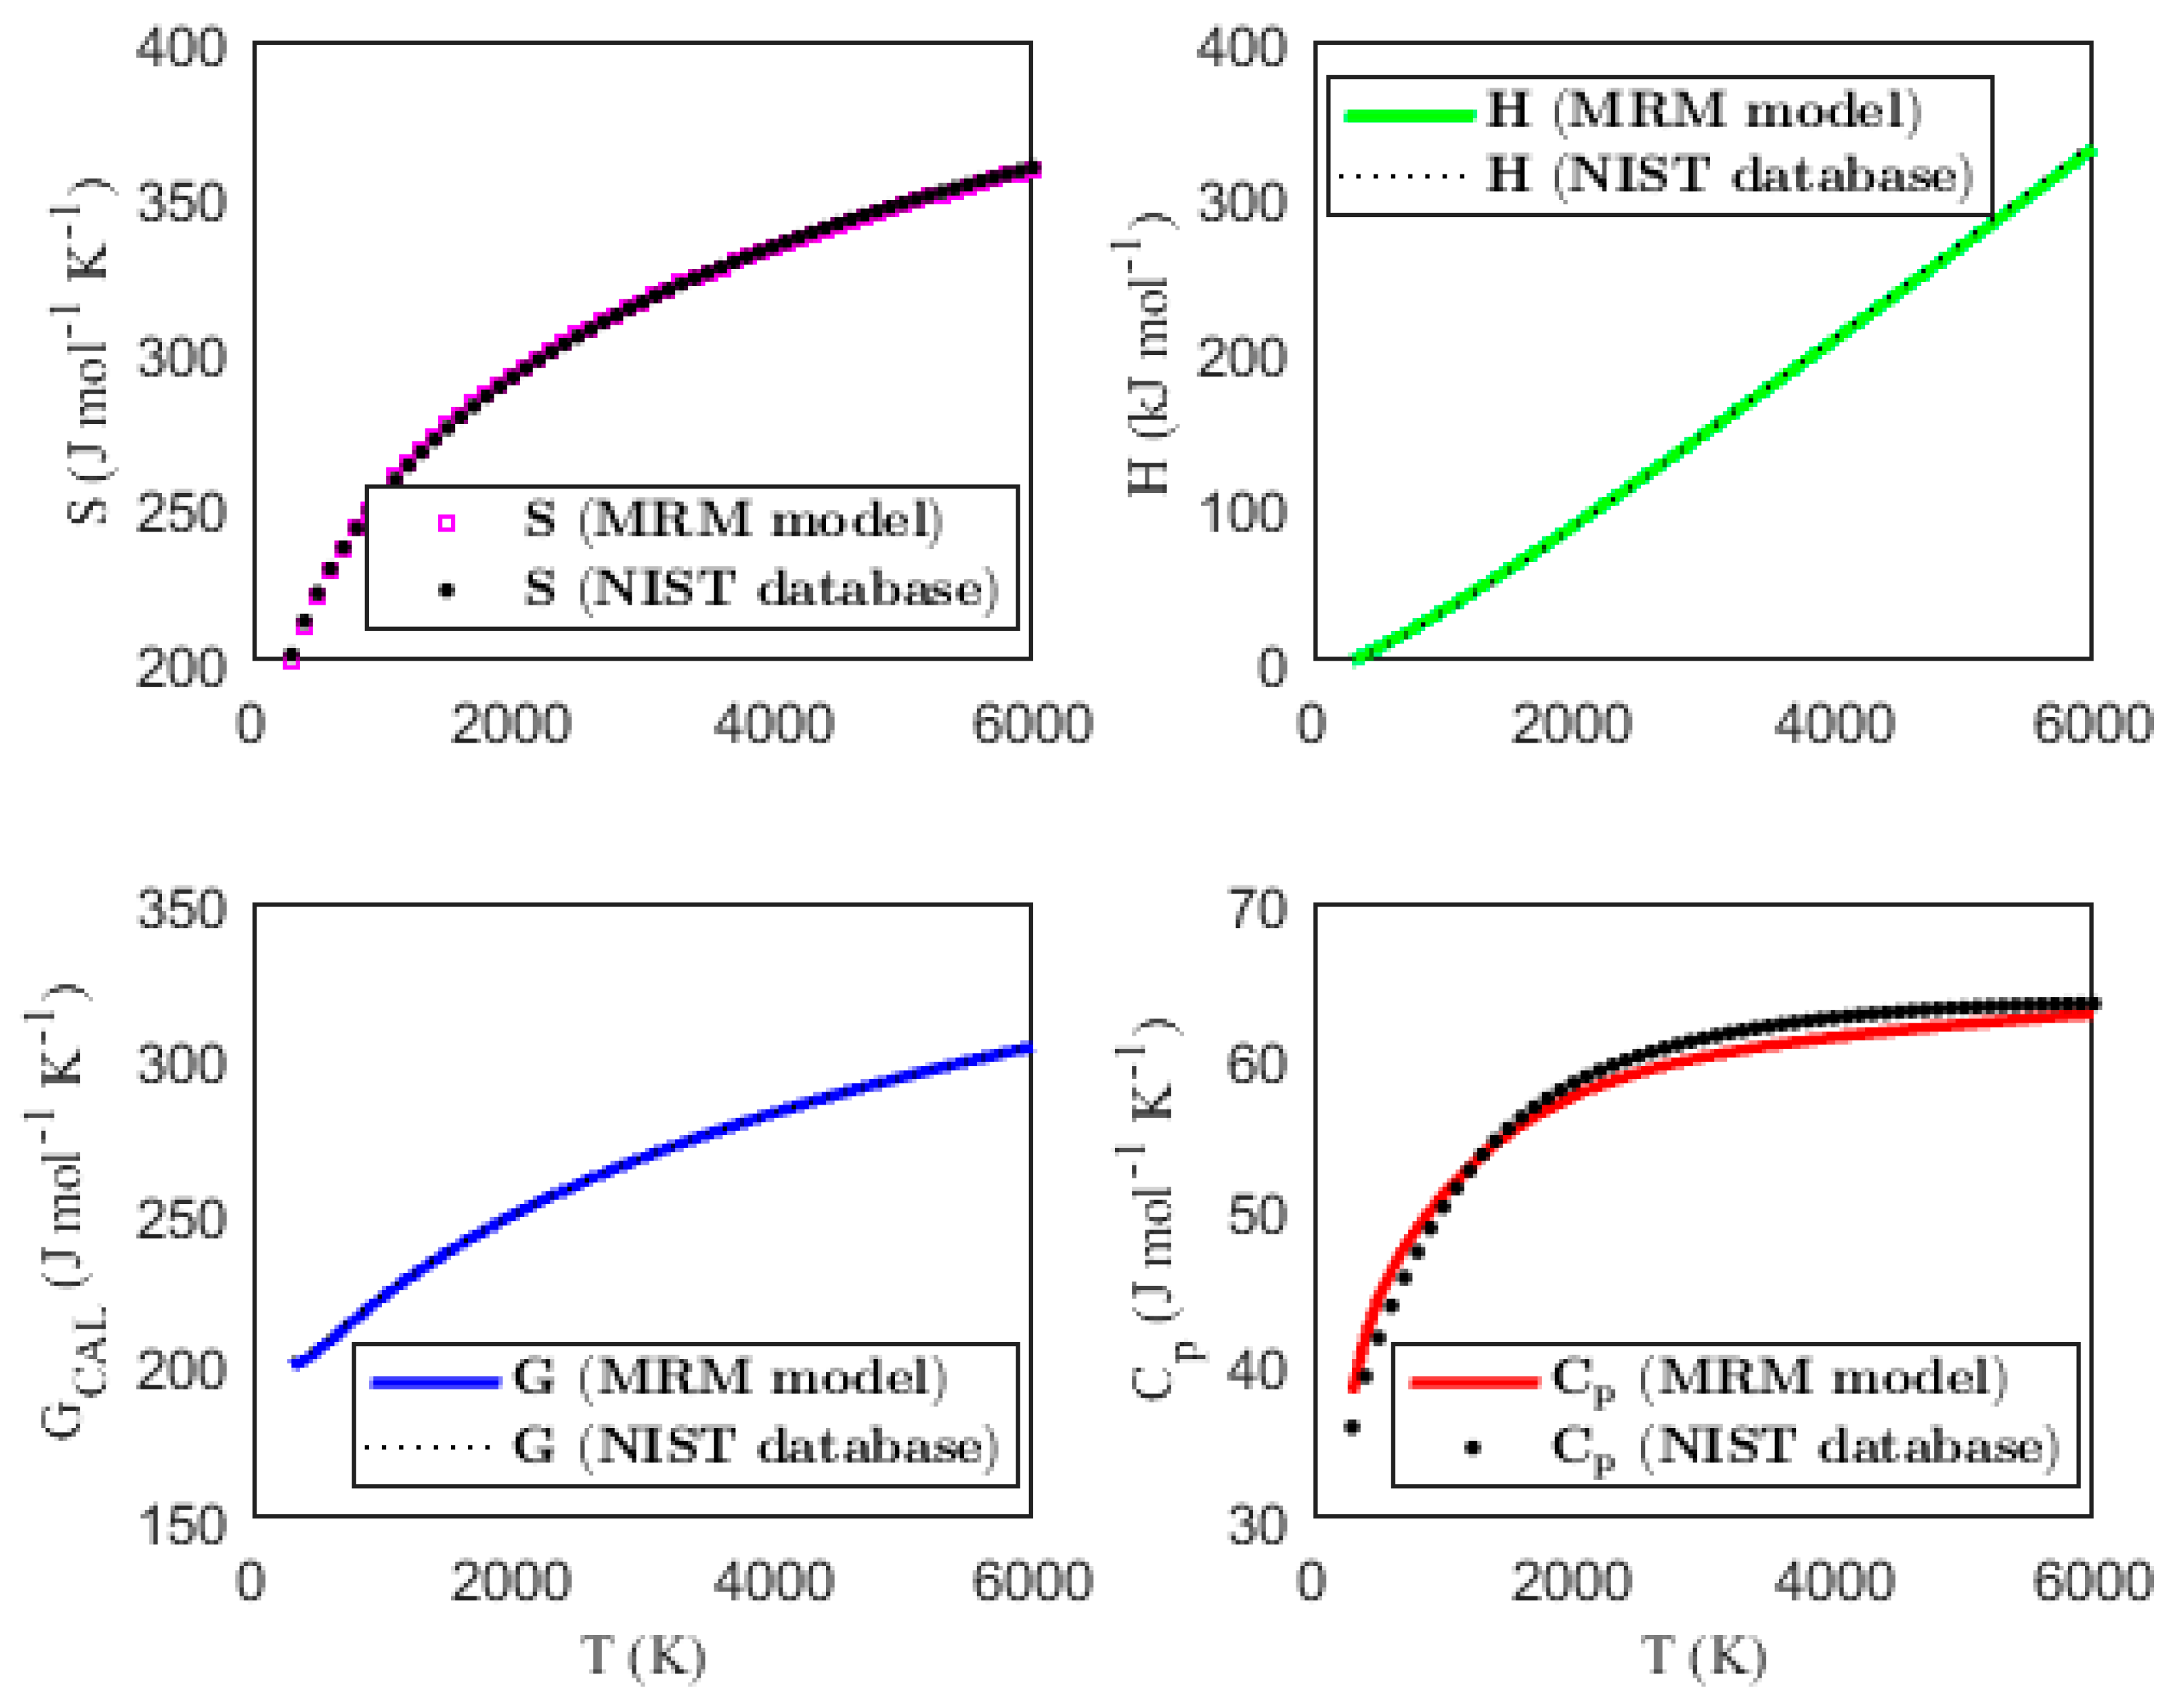
| HCN | H | C | N | 130.0184 # | 1.066 | 1.153 | 2096.3 | 3311.5 | 713.5 | 1.3775 | 2.300 |
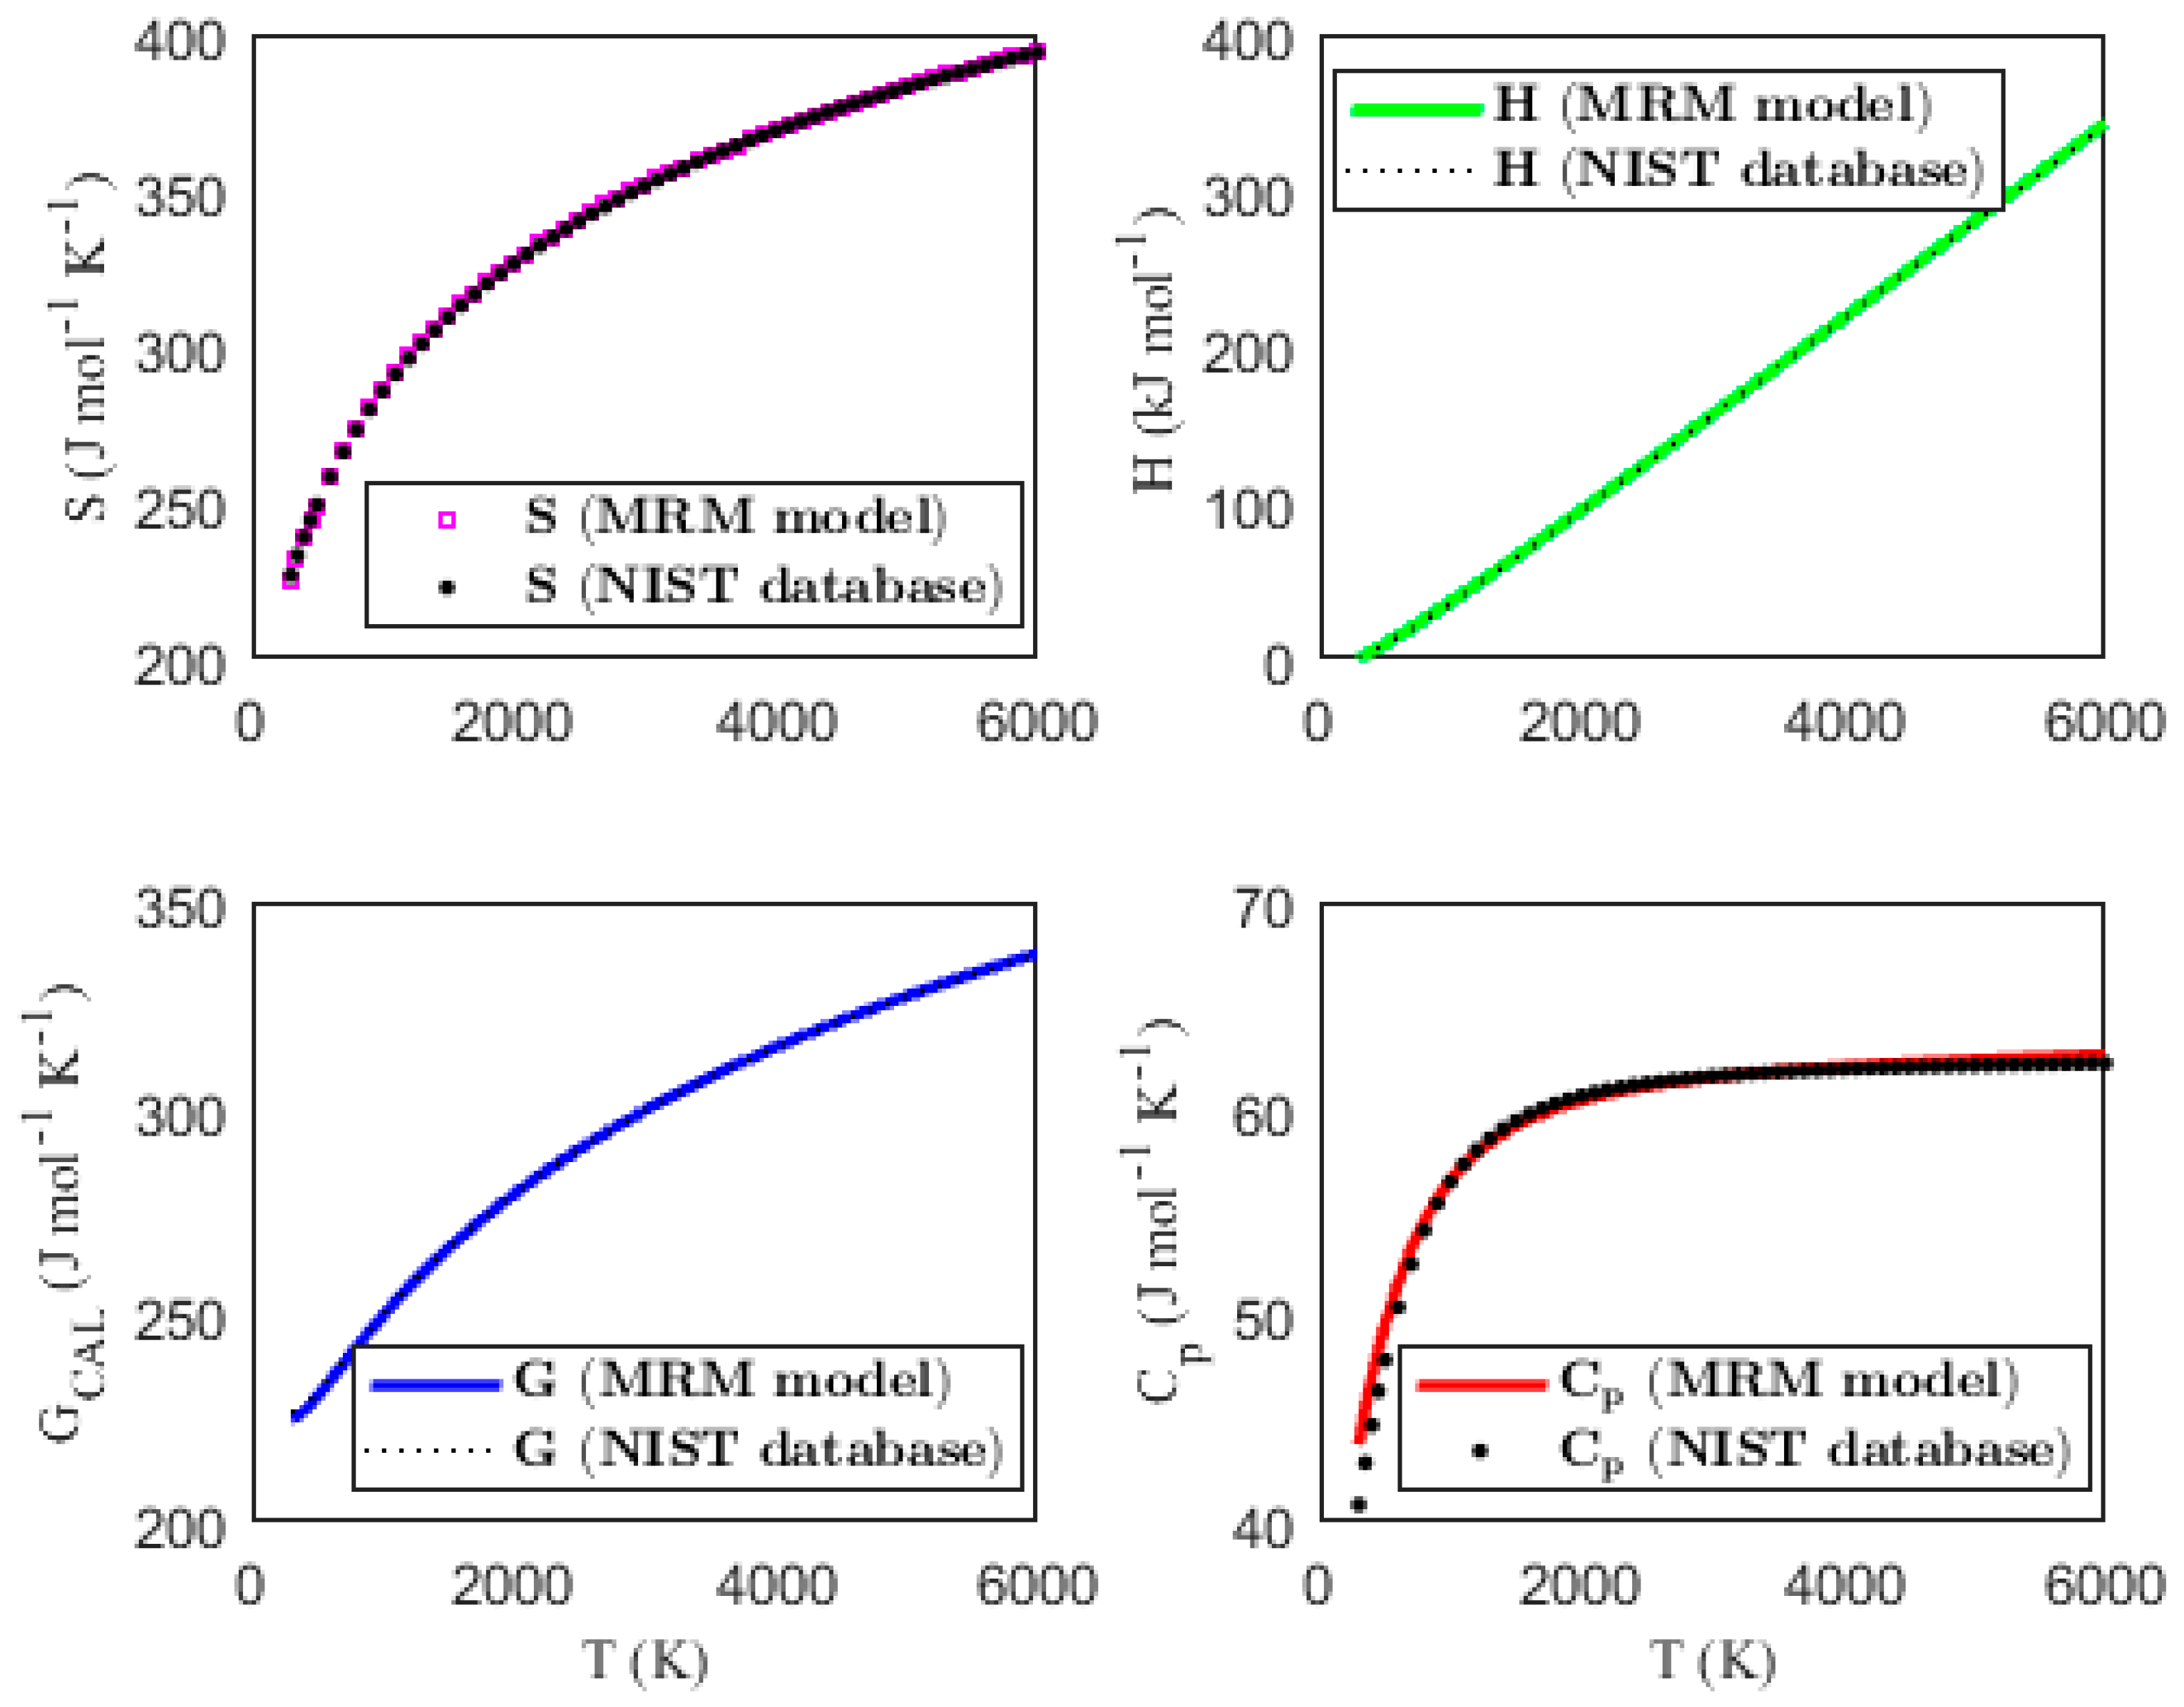
| N3 | N | N | N | 219.6 | 1.18115 | 1.18115 | 1320 | 1645 | 457 | 1.8216 | 1.130 |
| Si2N | Si | N | Si | 123 | 1.70 | 1.70 | 600 | 1000 | 240 | 1.5666 | 0.812 |
| T [48] | S (J mol−1K−1) | H (kJ mol−1) | G (J mol−1K−1) | Cp (J mol−1K−1) | ||||
|---|---|---|---|---|---|---|---|---|
| Equation (8) | NIST [48] | Equation (16) | NIST [48] | Equation (17) | NIST [48] | Equation (11) | NIST [48] | |
| 300 | 229.618 | 230.082 | 0.083 | 0.080 | 229.342 | 229.815 | 44.763 | 43.359 |
| 350 | 236.676 | 236.931 | 2.373 | 2.303 | 229.895 | 230.351 | 46.805 | 45.527 |
| 400 | 243.042 | 243.141 | 4.758 | 4.630 | 231.147 | 231.567 | 48.548 | 47.495 |
| 450 | 248.849 | 248.838 | 7.224 | 7.049 | 232.796 | 233.174 | 50.052 | 49.246 |
| 500 | 254.192 | 254.108 | 9.760 | 9.550 | 234.672 | 235.007 | 51.356 | 50.780 |
| … | … | … | … | … | … | … | … | … |
| 2900 | 356.949 | 356.752 | 153.495 | 152.949 | 304.020 | 304.011 | 62.664 | 61.904 |
| 3000 | 359.076 | 358.852 | 159.768 | 159.142 | 305.820 | 305.804 | 62.781 | 61.961 |
| 3100 | 361.136 | 360.884 | 166.052 | 165.341 | 307.571 | 307.548 | 62.897 | 62.019 |
| 3200 | 363.135 | 362.854 | 172.347 | 171.546 | 309.276 | 309.246 | 63.012 | 62.078 |
| 3300 | 365.076 | 364.765 | 178.654 | 177.757 | 310.938 | 310.900 | 63.126 | 62.138 |
| … | … | … | … | … | … | … | … | … |
| 5600 | 398.976 | 398.069 | 326.275 | 322.804 | 340.713 | 340.425 | 64.836 | 64.169 |
| 5700 | 400.124 | 399.206 | 332.759 | 329.226 | 341.745 | 341.447 | 64.845 | 64.273 |
| 5800 | 401.252 | 400.324 | 339.244 | 335.658 | 342.762 | 342.452 | 64.848 | 64.377 |
| 5900 | 402.360 | 401.426 | 345.729 | 342.101 | 343.762 | 343.443 | 64.845 | 64.480 |
| 6000 | 403.450 | 402.510 | 352.213 | 348.554 | 344.748 | 344.418 | 64.836 | 64.582 |
| MPAD (%) | 0.103 | 0.822 | 0.050 | 1.190 | ||||
| T [48] | S (J mol−1K−1) | H (kJ mol−1) | G (J mol−1K−1) | Cp (J mol−1K−1) | ||||
|---|---|---|---|---|---|---|---|---|
| Equation (8) | NIST [48] | Equation (16) | NIST [48] | Equation (17) | NIST [48] | Equation (11) | NIST [48] | |
| 300 | 200.095 | 202.050 | 0.070 | 0.066 | 199.860 | 201.829 | 38.146 | 35.928 |
| 400 | 211.600 | 212.863 | 4.079 | 3.833 | 201.403 | 203.281 | 41.788 | 39.229 |
| 500 | 221.210 | 221.894 | 8.390 | 7.885 | 204.430 | 206.125 | 44.291 | 41.731 |
| 600 | 229.454 | 229.690 | 12.914 | 12.164 | 207.930 | 209.417 | 46.116 | 43.806 |
| 700 | 236.676 | 236.583 | 17.601 | 16.638 | 211.531 | 212.815 | 47.577 | 45.643 |
| … | … | … | … | … | … | … | … | … |
| 3100 | 317.712 | 317.718 | 151.976 | 152.072 | 268.687 | 268.663 | 60.116 | 61.347 |
| 3200 | 319.623 | 319.669 | 157.995 | 158.215 | 270.249 | 270.226 | 60.270 | 61.513 |
| 3300 | 321.479 | 321.564 | 164.030 | 164.374 | 271.774 | 271.754 | 60.415 | 61.669 |
| 3400 | 323.285 | 323.407 | 170.078 | 170.548 | 273.262 | 273.246 | 60.551 | 61.814 |
| 3500 | 325.042 | 325.201 | 176.140 | 176.736 | 274.717 | 274.705 | 60.680 | 61.948 |
| … | … | … | … | … | … | … | … | … |
| 5600 | 354.002 | 354.707 | 305.679 | 308.689 | 299.416 | 299.584 | 62.505 | 63.358 |
| 5700 | 355.108 | 355.829 | 311.933 | 315.026 | 300.383 | 300.561 | 62.573 | 63.378 |
| 5800 | 356.197 | 356.931 | 318.194 | 321.364 | 301.336 | 301.524 | 62.640 | 63.395 |
| 5900 | 357.269 | 358.015 | 324.461 | 327.705 | 302.275 | 302.472 | 62.707 | 63.407 |
| 6000 | 358.323 | 359.081 | 330.735 | 334.046 | 303.201 | 303.407 | 62.773 | 63.417 |
| MPAD (%) | 0.162 | 1.666 | 0.131 | 1.980 | ||||
| T [48] | S (J mol−1K−1) | H (kJ mol−1) | G (J mol−1K−1) | Cp (J mol−1K−1) | ||||
|---|---|---|---|---|---|---|---|---|
| Equation (8) | NIST [48] | Equation (16) | NIST [48] | Equation (17) | NIST [48] | Equation (11) | NIST [48] | |
| 300 | 225.361 | 226.721 | 0.081 | 0.075 | 225.092 | 226.470 | 43.755 | 40.842 |
| 350 | 232.244 | 233.172 | 2.314 | 2.169 | 225.631 | 226.974 | 45.534 | 42.864 |
| 400 | 238.425 | 239.016 | 4.630 | 4.359 | 226.851 | 228.120 | 47.044 | 44.686 |
| 450 | 244.044 | 244.377 | 7.016 | 6.635 | 228.454 | 229.633 | 48.371 | 46.339 |
| 500 | 249.203 | 249.338 | 9.465 | 8.990 | 230.274 | 231.358 | 49.556 | 47.838 |
| … | … | … | … | … | … | … | … | … |
| 2900 | 349.441 | 349.221 | 150.092 | 149.614 | 297.686 | 297.630 | 61.432 | 61.503 |
| 3000 | 351.525 | 351.307 | 156.239 | 155.767 | 299.446 | 299.385 | 61.505 | 61.558 |
| 3100 | 353.543 | 353.327 | 162.393 | 161.926 | 301.159 | 301.093 | 61.574 | 61.607 |
| 3200 | 355.499 | 355.283 | 168.553 | 168.089 | 302.826 | 302.756 | 61.638 | 61.652 |
| 3300 | 357.397 | 357.181 | 174.720 | 174.256 | 304.451 | 304.376 | 61.697 | 61.693 |
| … | … | … | … | … | … | … | … | … |
| 5600 | 390.254 | 389.944 | 317.700 | 316.788 | 333.522 | 333.374 | 62.513 | 62.153 |
| 5700 | 391.360 | 391.044 | 323.952 | 323.004 | 334.527 | 334.377 | 62.537 | 62.165 |
| 5800 | 392.448 | 392.125 | 330.207 | 329.222 | 335.516 | 335.363 | 62.561 | 62.177 |
| 5900 | 393.518 | 393.188 | 336.464 | 335.440 | 336.490 | 336.334 | 62.584 | 62.189 |
| 6000 | 394.570 | 394.234 | 342.724 | 341.659 | 337.449 | 337.290 | 62.607 | 62.202 |
| MPAD (%) | 0.098 | 1.199 | 0.097 | 0.793 | ||||
| T [48] | S (J mol−1K−1) | H (kJ mol−1) | G (J mol−1K−1) | Cp (J mol−1K−1) | ||||
|---|---|---|---|---|---|---|---|---|
| Equation (8) | NIST [48] | Equation (16) | NIST [48] | Equation (17) | NIST [48] | Equation (11) | NIST [48] | |
| 300 | 256.930 | 256.795 | 0.094 | 0.092 | 256.618 | 256.488 | 50.663 | 49.965 |
| 350 | 264.863 | 264.652 | 2.668 | 2.642 | 257.241 | 257.104 | 52.251 | 51.951 |
| 400 | 271.930 | 271.699 | 5.315 | 5.281 | 258.643 | 258.495 | 53.598 | 53.570 |
| 450 | 278.311 | 278.087 | 8.024 | 7.994 | 260.480 | 260.323 | 54.732 | 54.886 |
| 500 | 284.128 | 283.927 | 10.785 | 10.766 | 262.558 | 262.395 | 55.687 | 55.958 |
| … | … | … | … | … | … | … | … | … |
| 2800 | 387.749 | 387.821 | 150.997 | 151.094 | 333.822 | 333.859 | 62.417 | 62.097 |
| 2900 | 389.940 | 390.000 | 157.241 | 157.305 | 335.719 | 335.757 | 62.463 | 62.118 |
| 3000 | 392.058 | 392.106 | 163.489 | 163.517 | 337.562 | 337.601 | 62.507 | 62.137 |
| 3100 | 394.109 | 394.144 | 169.742 | 169.732 | 339.353 | 339.392 | 62.549 | 62.156 |
| 3200 | 396.095 | 396.118 | 175.999 | 175.949 | 341.096 | 341.134 | 62.590 | 62.175 |
| … | … | … | … | … | … | … | … | … |
| 5600 | 431.355 | 431.093 | 327.320 | 326.046 | 372.905 | 372.871 | 63.538 | 63.112 |
| 5700 | 432.480 | 432.211 | 333.676 | 332.361 | 373.940 | 373.902 | 63.583 | 63.179 |
| 5800 | 433.586 | 433.310 | 340.037 | 338.682 | 374.959 | 374.917 | 63.629 | 63.248 |
| 5900 | 434.674 | 434.392 | 346.402 | 345.010 | 375.962 | 375.916 | 63.675 | 63.318 |
| 6000 | 435.745 | 435.457 | 352.771 | 351.346 | 376.950 | 376.899 | 63.721 | 63.391 |
| MPAD (%) | 0.036 | 0.299 | 0.016 | 0.583 | ||||
| Model | BO2 | HCN | N3 | Si2N | ||||
|---|---|---|---|---|---|---|---|---|
| MRM | IMTZ [32] | MRM | IMTZ [34] | MRM | IMTZ [32] | MRM | IMTZ [32] | |
| Entropy | 0.103 | 0.132 | 0.162 | 0.176 | 0.098 | 0.106 | 0.036 | 0.044 |
| Enthalpy | 0.822 | 1.118 | 1.666 | 1.705 | 1.199 | 1.378 | 0.299 | 0.323 |
| Gibbs free energy | 0.050 | 0.053 | 0.131 | 0.098 | 0.097 | 0.047 | 0.016 | 0.014 |
| Heat capacity | 1.190 | 1.334 | 1.980 | 1.899 | 0.793 | 0.881 | 0.583 | 0.640 |
Disclaimer/Publisher’s Note: The statements, opinions and data contained in all publications are solely those of the individual author(s) and contributor(s) and not of MDPI and/or the editor(s). MDPI and/or the editor(s) disclaim responsibility for any injury to people or property resulting from any ideas, methods, instructions or products referred to in the content. |
© 2025 by the authors. Licensee MDPI, Basel, Switzerland. This article is an open access article distributed under the terms and conditions of the Creative Commons Attribution (CC BY) license (https://creativecommons.org/licenses/by/4.0/).
Share and Cite
Eyube, E.S.; Ahmed, A.D.; Onate, C.A.; Omugbe, E.; Inyang, E.P.; Amasuwa, S.; Makama, E.K. Computational Models for Analyzing the Thermodynamic Properties of Linear Triatomic Molecules. Chemistry 2025, 7, 35. https://doi.org/10.3390/chemistry7020035
Eyube ES, Ahmed AD, Onate CA, Omugbe E, Inyang EP, Amasuwa S, Makama EK. Computational Models for Analyzing the Thermodynamic Properties of Linear Triatomic Molecules. Chemistry. 2025; 7(2):35. https://doi.org/10.3390/chemistry7020035
Chicago/Turabian StyleEyube, Edwin S., Abubakar D. Ahmed, Clement A. Onate, Ekwevugbe Omugbe, Etido P. Inyang, Sanda Amasuwa, and Ezekiel K. Makama. 2025. "Computational Models for Analyzing the Thermodynamic Properties of Linear Triatomic Molecules" Chemistry 7, no. 2: 35. https://doi.org/10.3390/chemistry7020035
APA StyleEyube, E. S., Ahmed, A. D., Onate, C. A., Omugbe, E., Inyang, E. P., Amasuwa, S., & Makama, E. K. (2025). Computational Models for Analyzing the Thermodynamic Properties of Linear Triatomic Molecules. Chemistry, 7(2), 35. https://doi.org/10.3390/chemistry7020035