Abstract
The complexation behavior of lanthanide(III) ions with terephthalic acid (1,4-benzene-dicarboxylic acid) in 0.01 M KNO3 aqueous solutions was studied across a broad pH range and at two metal-to-ligand ratios using potentiometric titration combined with photoluminescence spectroscopy. Chemometric analysis of titration curves enabled the determination of relative molar fractions, stability constants, and probable stoichiometry of the formed complexes. In solutions with a 1:2 metal-to-ligand ratio, bis-complexes (two terephthalate ligands per lanthanide ion) predominated, while ligand-rich conditions favored the formation of tetra-complexes (four ligands per metal ion). In alkaline media, bis-complexes transform into mixed hydroxy-terephthalate species. Meanwhile, for the tetra-complexes, the addition of NaOH results in the formation of lanthanide ion hydroxo complexes without organic ligands. The structural diversity of these complexes, driven by the terephthalate ligand’s tendency to maximize denticity, suggested dimeric or oligomeric configurations. The stability constants and structural features of complexes in solution were found to align with those of known solid-state lanthanide–terephthalate polymers, highlighting their potential as models for polymeric structures.
1. Introduction
Luminescent materials based on triply charged lanthanide ions have broad applications, ranging from LEDs and various sensors to materials for bioimaging and medicine [1,2,3,4]. The abundances of complexes of rare-earth elements existing in aqueous solutions are being investigated in terms of their application as nonradioactive analogs of transuranic elements [5,6], as buffered solutions in medicine [7], as spectral label probes, in bioinorganic chemistry of metals [8,9], and for other purposes [10]. Inorganic and some organic compounds of lanthanides usually demonstrate relatively weak photoluminescence intensity because they possess extremely low extinction coefficients due to the forbidden nature of f–f transitions, which makes the direct excitation of ions inefficient. A promising method to solve this problem is the design of metal–organic frameworks (MOFs) possessing the so-called “antenna effect”—the ability to transfer energy from an excited ligand to a lanthanide ion. This mechanism results in an increase in the emission intensity of f-f transitions by orders of magnitude [11]. Among others, the “antenna effect” is manifested by complexes of lanthanide ions with a 1,4-benzene-dicarboxylic acid anion (1,4-bdc2−, terephthalic acid anion). Due to the para-position of the carboxyl groups, the terephthalate ligand tends to exhibit bridging modes, which leads to a variety of structures of its complexes with lanthanide ions. Several polymer structures, including Ln2(1,4-bdc)3(H2O)8·2H2O [12,13,14] (Ln = Er, Yb, Lu), Ln2(1,4-bdc)3(H2O)6 [12,13,15] (Ln = Er, Yb), Er2(1,4-bdc)3(H2O)6·2H2O [4], Er2(1,4-bdc)3(H2O)6·H2O [12], Ln2(1,4-bdc)3(H2O)4 [13,16,17,18] (Ln = La − Lu), Yb2(1,4-bdc)3(H2O)2 [13], and Ln2(1,4-bdc)3 [16,17,18] (Ln = Er, Tb, Lu), have been synthesized in recent years. Terephthalic acid is chemically and thermally reasonably stable. It is produced in large quantities by industry; therefore, it is available as an initial component for the synthesis of luminescent complexes. Its sodium salts have a fairly high solubility in water (0.2–0.3 M). All aforementioned facts make it relevant to study terephthalic acid as a linker of lanthanide ions in polymeric structures. The synthesis of heterometallic complexes with a certain ratio of non-luminescent (e.g., La3+, Gd3+, and Lu3+) and luminescent (e.g., Eu3+, Tb3+, Sm3+, and Dy3+) REE ions makes it possible to achieve a high quantum yield of luminescence [14,18].
Lanthanide coordination polymers involving the terephthalate linker are often synthesized from an aqueous solution. The complexes of REE ions with 1,4-bdc2− are precursors of the polymer structures. To understand the mechanism of polymer structure formation, it is necessary to study the patterns of complex formation between REE ions and terephthalic acid anions in aqueous solutions to reveal the composition of principal complex species and their stability constants.
Since complexes existing in aqueous solutions can be considered as precursors of one or another solid structure, the structural motifs of certain solid structures are expected to be similar to complexes in the corresponding solution. As noted above, the composition and the structure of several solid-state coordination compounds of terephthalic acid with lanthanides with the general formula Ln2(1,4-bdc)3(H2O)n·mH2O were reported in numerous works [14,15,16,17,18]. The lanthanide ion in the majority of terephthalates is eight-coordinated, but there are examples of smaller coordination numbers. The terephthalate ligand, due to its planar structure, is inflexible and cannot bend like polydentate chelating linkers coordinating to a single metal center by both carboxylate groups. Therefore, the terephthalate ligand can saturate its denticity only if each of its carboxylate groups coordinates with different metal centers. There are four types of coordination modes of the carboxylate groups in the known terephthalate structures—see Figure 1. In review [19], the lengths of Ln-O distances were analyzed among a large number of solid-state carboxylates, and it was found that the energy gain decreases in a number of coordination types III ≈ I < II ≈ IV. However, there are some singularities in a solution that can disrupt this order. So, the species in a diluted solution cannot contain too many lanthanide ions and ligands. In order to saturate the denticity of the terephthalate ligand by coordination types III and IV, four metal centers are required, whereas coordination types I and II form the coordination bond to two metal centers. In addition, the preference for coordination mode would depend on the metal-to-ligand ratio in the solution. All these aspects should be taken into account when the complexation processes in a solution are studied.
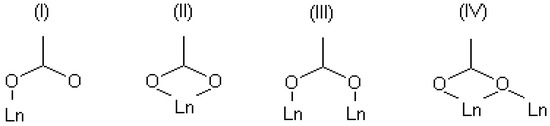
Figure 1.
Some available coordination modes in solid-state terephthalates of lanthanides.
Quantitative characteristics of complex formation between lanthanide ions with aromatic carboxylic ligands in aqueous solutions were studied in a number of works [20,21,22,23,24,25,26]. To better understand the complex formation between lanthanide ions with terephthalic acid, the complexation in such systems should be considered. In work [20], equilibrium in aqueous solutions containing lanthanide ion and a homolog of terephthalic acid—1,2-benzene-dicarboxylic (phthalic) acid—in an equimolar metal-to-ligand ratio were studied. It was found that such species as LnH(1,2-bdc)2+ with corresponding stability constants of 0.8–1.4 log. units (depending on type of lanthanide ion) and Ln(1,2-bdc)+ with corresponding stability constants of 3.4–3.9 log. units (depending on the type of lanthanide ion) are formed. A similar value of 3.70 log. units for europium (III) complex with phthalic acid was reported in [21]. The authors of these works do not discuss the question of whether both COO−-groups coordinate to the REE ion or only one. The issue of coordination modes in solid-state REE phthalates is not sufficiently studied. In [22], the structure of a La2(1,2-bdc)3·7H2O polymer including only bidentate-coordinated carboxylate groups (coordination mode II in Figure 1) and no bridge or monodentate ones (coordination modes III and I in Figure 1) was proposed. Thus, the values of stability constants of Ln(1,2-bdc)+ may correspond to only one bidentate-coordinated carboxylate group. On the other hand, the coordination of two groups to the metal atom leads to the formation of a chelate cycle that stabilizes the complex—see Figure 2. Five-membered complexes are the most stable; with an increase in the number of atoms in the cycle, stabilization decreases [23]. In the case of lanthanide phthalates, seven-membered cycles may form. From this point of view, the values of stability constants of Ln(1,2-bdc)+ should be attributed to two coordinated COO–-groups, and so the values per one dissociated acidic group will be 1.7–1.95 log. units.
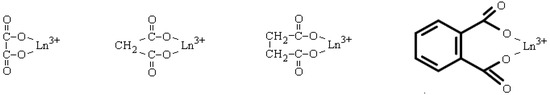
Figure 2.
Chelate coordination of carboxylate groups of several ligands to lanthanide ion with formation of five-, six-, and seven-membered cycle.
In the case of rod-like terephthalic ligands, it is more accurate to specify the approximate values of stability constants of complexes with isolated carboxylate groups. Therefore, it is more correct to refer to the characteristics of complex formation between REE ions and the simplest arene-carboxylic ligand—benzene-carboxylic acid. According to [24,25], stability constants of lanthanide’s benzene-carbonates vary in the range of REE ions from 2.5 to 3.0 log. units. Slightly lower value for europium(III) benzoate, 1.84 log. units are given in [26]. The stability constants of the complexes of the europium(III) ion with the simplest benzoic acid derivatives fluctuate near 2 log. units: 4-nitrobenzoate—1.78 [27], 4-aminobenzoate—2.12 [27], 4-hydroxybenzoate—1.89 [27] and 2.18 [28], and 3,4-dihydroxybenzoate—2.72 [28]. Thus, the expected values of stability constants of lanthanide aromatic carboxylates vary in a quite broad range—from 1.8 to 3.0 log. units per one carboxylate group. There are many factors that can increase the effect of complex formation (for example, π-staking between parallel-directed bridging ligands [29,30]) or decrease it (for example, inter-ligand repulsion, manifested in a decrease in the stepwise stability constants of complexes, as log K1 = 1.84, log K2 = 1.08 for europium(III) benzoate [26], log K1 = 3.70, and log K2 = 1.93 for europium(III) phthalate [21]). All these factors expand the range of expected values of stability constants.
Since the carboxylate groups in the terephthalic acid molecule are spatially separated, the total charge of the dissociated 1,4-bdc2− anion is localized on each of the groups. This increases the possible number of coordination bonds between the ligands and lanthanide ions. Considering the ionic character of the bonding in the REE complexes, the electrostatic attraction between the triply charged lanthanide ion and terephthalate ligands will take place when the number of coordinated ligands is three or less because coordination of each ligand is carried out through one of two para-carboxylate groups possessing a charge of −1. The electrostatic attraction will be absent when the number of coordinated ligands is more than three. It follows that when the metal–ligand ratio is 1:1, 1:2, and 1:3, complexes of the corresponding stoichiometry are formed. Coordination binding can be partially carried out due to covalent interactions; therefore, the coordination sphere of lanthanide ions may include four or even more carboxylate groups. Indeed, there are examples of the formation of such complexes as acetates Ln(CH3COO)4− (Ln = La − Nd, Sm, Tb − Er, Yb) [31], salicylates Nd(C6H5(OH)COO)4− [32], and oxalates Eu(C2O4)n3−2n (n = 1–5) [33] in excess of a ligand. So, when the metal-to-ligand ratio is more than 1:3, the formation of tris-complexes and complexes with a greater number of ligands (primarily tetra-complexes) is most likely. The determination of the stoichiometry of complexes is finally solved by mathematical modeling of complex formation equilibrium in the systems.
Terephthalic acid has similar values of dissociation constants—pK1 = 3.51 and pK2 = 4.82 [34]—and both of its acid groups dissociate in one step. Already at pH~5, completely deprotonated ligands are accumulated in the solution, tending to saturate their denticity. Since the carboxylate groups are spatially separated, saturation due to coordination with a single metal ion is impossible. Ligands should be coordinated in bridging mode to different lanthanide ions, contributing to the formation of a polymer structure. Therefore, it is logical to assume the formation of complex oligomers (in the simplest case, dimers) in the system.
Previously, we studied the complexation of europium(III) and terbium(III) with the terephthalate ion in a metal-to-ligand ratio of 1:8 [35], named the 1:8 system. In the current work, the number of lanthanides was significantly expanded, and the complexation model was improved by using various ligand-to-metal ratios (named the 1:2 system and 1:8 system) for selected lanthanides. Thus, in order to completely describe equilibrium models in REE-1,4-benzene-dicarboxylic aqueous solutions, the exact composition, and the stability of complexes, in this work, we carried our measurements at different metal-to-ligand ratios and in a wide range of pH values. The complexation was studied by the method of potentiometry titration. The resulting titration curves were fitted by using a calculation computer program in order to calculate fractional distributions of the complexes and their stability constants. Additionally, the emission and excitation spectra of the numerous solutions containing Eu3+ and Tb3+ ions along the titration curve were carefully analyzed in order to clarify the complex formation model.
2. Materials and Methods
The complexation was studied by method of potentiometry titration using calibrated glass electrode with amplifier (LPP014, LPPCOLTD, Beijing, China), connected to an iCP12 USB oscilloscope (PICcircuit, Seri Kembangan, Malaysia), at a temperature that was kept constant at 25 °C with a BHS-1 liquid thermostat (JoanLab, Huzhou, Zhejiang, China). The electrode was calibrated using sets of buffer solutions. The 50 mL of sample solution contained 1,4-benzenedicarboxylic acid (0.15–0.155 mM), potassium nitrate (0.01 M, to maintain the ionic strength), and lanthanide(III) nitrate (0.075 mM when 1:2 system was studied or 0.0194 mM when 1:8 system was studied). Since preliminary point-by-point titration did not reveal pH instability areas, it was assumed that equilibrium in the system was established quickly. Therefore, titration was carried out with a freshly prepared solution containing 0.01M NaOH and 0.01M KNO3 as background electrolytes at a feed rate of the titrant of 1.5 mL/min for 1:2 system and 3 mL/min for 1:8 system using a QHZS-001B syringe pump (LERORA, Beijing, China).
Solutions were prepared using lanthanides nitrates pentahydrates (99.9%) (Khimkraft, Kaliningrad, Russia), sodium hydroxide, aqueous ammonia, nickel chloride hexahydrate, potassium nitrate, murexide, Trilon B, hydrochloric acid (Nevareaktiv, St. Petersburg, Russia), and terephthalic acid (>98%) (Sigma-Aldrich, St. Louis, MO, USA). All chemicals were used without further purification. Standardization of the solutions of the lanthanide salts was carried out by complexometric titration. Specifically, to 0.5 mL of a 0.2–0.3 M solution of the metal analyte, 10 mL of 0.1 N Trilon B, 10–15 mL of ammonia buffer (pH = 10), 30 mL of distilled water, and 0.2 g of murexide were added, whereupon excess Trilon B was titrated with a 0.05 M NiCl2 solution until the color of the indicator changed from purple to yellow. Standardization of the solutions of terephthalic acid and sodium hydroxide was carried out using pH titration. Specifically, the solution containing 10 mL of ~0.01 M NaOH solution and 40 mL of distilled water was titrated with a 0.1 M HCl solution. The position of equivalence point (the amount of 0.1 M HCl reacted with 10 mL of ~0.01 M NaOH) was found from the analysis of titration curve resulting in the exact concentration of NaOH solution. To prepare a saturated solution of terephthalic acid, 1 g of H2(1,4-bdc) was dissolved in 1 L of 0.1 M KNO3, which was followed by cooling to room temperature and filtration. Then, the exact concentration of terephthalic acid was found from the analysis of titration curve obtained by potentiometric titration of 50 mL of terephthalic acid solution by 0.01 M NaOH.
The resulting titration curves were fitted by using CLINP 2.1 software package [36] in order to calculate fractional distribution of the complexes and their stability constants. The stoichiometry matrix was formed based on the set of three particles H+, Ln3+, and H2(1,4-bdc). The following particles were chosen as the mandatory set of forms: H2(1,4-bdc), H(1,4-bdc)−, 1,4-bdc2−, Ln3+, LnOH2+, Ln(OH)2+, Ln(OH)3, H+, and OH−. The following reference values [28] of acidity constants of terephthalic acid were used fitting model: pK1 = 3.51 and pK2 = 4.82. Complexation of lanthanides ions with nitrate ion was ignored due to the insignificant and low values of its stability constants compared with stability constants of lanthanide-H2(1,4-bdc) complexes [37,38]. Stability constants of terephthalate complexes formed in 1:8 and 1:2 systems were calculated using Formulas (1) and (2) (the charges of ions are omitted):
β(Ln2Hy(1,4-bdc)8) = [Ln2Hy(1,4-bdc)8]/([Ln]2·[H(1,4-bdc)]y·[1,4-bdc]8−y)
β(Ln2Hy(1,4-bdc)4) = [Ln2Hy(1,4-bdc)4]/([Ln]2·[H(1,4-bdc)]y·[1,4-bdc]4−y)
Stability constants of hetero-ligand complexes formed in 1:2 system were calculated using Formula (3) (the charges of ions are omitted):
β(Ln2Hy(1,4-bdc)4) = [Ln2Hy(1,4-bdc)4]/([Ln]2·[H(1,4-bdc)]y·[1,4-bdc]4−y)
The residual relative standard deviation was taken as the criterion of reliability of the model:
where Ye and Yc are, accordingly, the experimental and calculated values of the pH at each point, and n is the number of points on the titration curve.
S0 = 100% · {Σ[(Yc2 − Ye2)/ Ye2]/(n − 1)}1/2,
Absorption spectra were measured using an SF-2000 spectrophotometer (OKB Spektr, St Petersburg, Russia). Luminescence spectra were recorded on a Fluoromax-4 spectrofluorometer (Horiba Jobin Yvon, Kyoto, Japan) under identical conditions. Absorption and luminescence spectra were measured in a 1 × 1 cm quartz cuvette at a temperature of 25 °C.
3. Results and Discussion
3.1. Initial Modeling
We studied the complexation between lanthanide ions and 1,4-benzene-dicarboxylic acid in aqueous solutions with 1:2 and 1:8 metal-to-ligand ratios, named the 1:2 systems and 1:8 systems. All solutions contained 0.01 M potassium nitrate as the background electrolyte, 0.15–0.155 mM 1,4-benzene-dicarboxylic acid as the ligand, and corresponding amounts of one or another lanthanide ion. Considering, on the one hand, the tendency of the terephthalate ligands to saturate their denticity, on the other hand, the fact that the degree of polymerization in a dilute solution cannot be too high, we assumed that dimers predominate in the system. As mentioned above, in the case of the 1:2 metal-to-ligand ratio, complexes of similar stoichiometry are most probably expected. Therefore, the particles with the formula Ln2Hy(1,4-bdc)4y−2 (y = 0–4) were chosen as the most likely existing in the solution. These species as well as mandatory species: H2(1,4-bdc), H(1,4-bdc)–, (1,4-bdc)2–, Ln3+, H+, OH–, LnOH2+, Ln(OH)2+, and Ln(OH)3 were added to the stoichiometric matrix and further tested for accumulation in solution. If the assumption of the existence of a certain complex improved fitting, we further used it in the model and clarified its stability constant. If the decline of the fitting curve was observed, we excluded this complex from the stoichiometric matrix. In the case of the 1:8 metal–ligand ratio, the excess of ligand was used. At the initial stage of modeling, we assumed that the complexes with three or four ligands per lanthanide ion (named tris- or tetra-complexes) were first formed in this system. As a result, we found that the best correlation between the calculated and experimental data is achieved under the assumption of the dominance of tetra- rather than tris-complexes in the solution. The stoichiometric matrix included species with the general formula Ln2Hy(1,4-bdc)8y−10 (y = 0–8) in addition to the mandatory forms. Each tetra-complex was also tested by calculations for accumulation in the 1:8 system. Similar to the 1:2 system, we kept species that lead to better fitting and excluded others.
The initial data were experimentally obtained as dependencies of the pH of the solutions on the degree of titration f, i.e., on the number of added equivalents of the alkali per proton of terephthalic acid (Figure 3a,b). The titration curves of the mixtures of terephthalic acid with lanthanide’s nitrate are similar to titration curves of terephthalic acid solutions in the range of f < 1. In the range of 1 < f < 2, slight differences due to complexation process are observed. The curves of Ln3+-H2(1,4-bdc) mixtures differ from curves of H2(1,4-bdc) most significantly when terephthalic acid is quite neutralized, which corresponds to f > 2. While the titration curves of the terephthalic acid have only one equivalence point corresponding to its complete neutralization, titration curves of the mixtures of terephthalic acid with lanthanide ions exhibit an additional equivalence point at a titration degree of ~2.2–2.5 for 1:8 systems and ~2.5–3.5 for 1:2 systems. The second equivalence point refers to the formation of hydroxo complexes of lanthanide ions with general formula Ln(OH)y3−y or hetero-ligand complexes with the general formula Lnx(OH)y(1,4-bdc)z. For solutions containing La3+, Eu3+, and Lu3+ cations, an increasing shift in the second equivalence point to the alkaline region is observed. This indicates that the number of coordinated OH−-groups and the stability of complexes containing OH–-groups are increasing. For further analysis of the complex formation characteristics, a computation with special software is required. In order to determine the nature of the second equivalence point in the titration curves, we studied the luminescent properties of solutions.
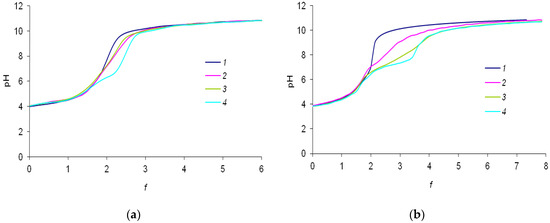
Figure 3.
(a) Experimental curves of titration for the solutions containing (1)—0.150 mM H2(1,4-bdc), (2)—0.150 mM H2(1,4-bdc) and La(NO3)3, (3)—0.150 mM H2(1,4-bdc) and Eu(NO3)3, and (4)—0.150 mM H2(1,4-bdc) and Lu(NO3)3 with 10 mM NaOH solution with (a) 1:8 metal-to-ligand ratios and (b) 1:2 metal-to-ligand ratios. All solutions contained 0.01 M KNO3 background electrolyte.
3.2. Photoluminescent Spectroscopy
Compounds of europium(III) and terbium(III) with terephthalic acid demonstrate pronounced luminescent properties due to the so-called “antenna effect” [14,16,17,18,39]. The mechanism of the luminescent process in this case is the absorption of light by the terephthalate ion using its conjugated π-system and consequent energy transfer from the excited ligand to the lanthanide ion. The Eu(III) or Tb(III) f-f emission intensity upon excitation into ligand-based electronic states (“antenna effect”) is significantly greater than the luminescence intensity of the europium(III) or terbium(III) ion excited directly into f-f electronic states. Two main factors determine the intensity of the luminescence of europium(III) and terbium(III) complexes with “antenna”-ligands. First, it is affected by the efficiency of the energy transfer between the organic ligand sensitizer and the europium(III) or terbium(III) ion. In turn, it depends on the degree of metal ion binding to complexes. Second, the quantum efficiency of europium(III) and terbium(III) “antenna” complexes is decreased because of nonradiative processes. Particularly, the OH−-groups, coordinated to an europium(III) or terbium(III) ion, are well known as effective quenchers because they possess high-frequency O-H stretching vibrational modes, which results in efficient non-radiative relaxations of europium(III) or terbium(III) ions. So, the luminescence intensity of the terephthalate complexes of Eu3+ and Tb3+ should be significantly higher than that of the aqua and hydroxo complexes in the emission spectra measured under the same conditions. If the rise in pH terephthalate complexes results in its destruction with the formation of Ln(OH)2+, Ln(OH)2+, and Ln(OH)3 species, it must lead to luminescence quenching. If the substitution of terephthalate ligands by OH−-groups takes place, the Lnx(OH)y(H2O)m(1,4-bdc)z−y species are formed from the initial complexes Lnx(H2O)m(1,4-bdc)z, and gradual decrease of the luminescence intensity is observed. If coordinated water molecules dissociate in terephthalate complexes with increasing pH, then initial complexes Lnx(H2O)m(1,4-bdc)z convert into Lnx(OH)y(H2O)m−y(1,4-bdc)z, and the previous quantity of coordinated OH−-groups remains; therefore, luminescence intensity remains high. Consequently, analysis of the emission spectra can be useful for analyzing the range of existing “antenna” complexes and the composition of complexes at titration degree > 2 (after neutralization of H2(1,4-bdc) acid). Moreover, the fine structure of emission and excitation spectra is very sensitive to the local symmetry of the europium(III) or terbium(III) ion [40]. This circumstance makes it possible to distinguish complexes of different symmetries. Based on a luminescent study of the complexation of europium(III) and terbium(III) ions with terephthalic acid, we determined the general behavior of lanthanide’s ions with a terephthalate ligand at a high pH of solution when the degree of titration was more than 2.
In our previous work, we found that the absorption spectra of the solutions containing a europium(III) or terbium(III) ion and terephthalic acid in a 1:8 metal-to-ligand ratio are similar in shape; each of them contains an absorption band with a maximum at 250 nm and a shoulder at 290 nm [35]. These bands correspond to π–π * electronic transitions of the terephthalate ion [41]. Therefore, the emission spectra of the studied solutions were measured upon 270–280 nm excitation into the ππ * state of the terephthalate ion monitoring the f-f bands of the Eu(III) and Tb(III) bands (Figure 4, Figure 5, Figure 6 and Figure 7a). The excitation spectra (Figure 4b and Figure 5b) of the same solutions were measured as well at the emission wavelengths of 615 or 543 nm for europium(III) or terbium(III) complexes, correspondingly. The emission and excitation spectra were measured for solutions containing europium(III) or terbium(III) ion and terephthalic acid in a 1:2 and 1:8 metal-to-ligand ratio, with titration degrees from 0 to 4 with increments of 0.5 or more frequently in the region of the greatest changes in the luminescence intensity of the spectra. The range of titration degrees was chosen in such a way as to better monitor the change in the luminescence intensity of the solutions and clarify the complex formation model.
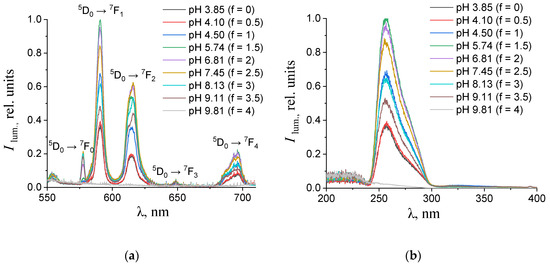
Figure 4.
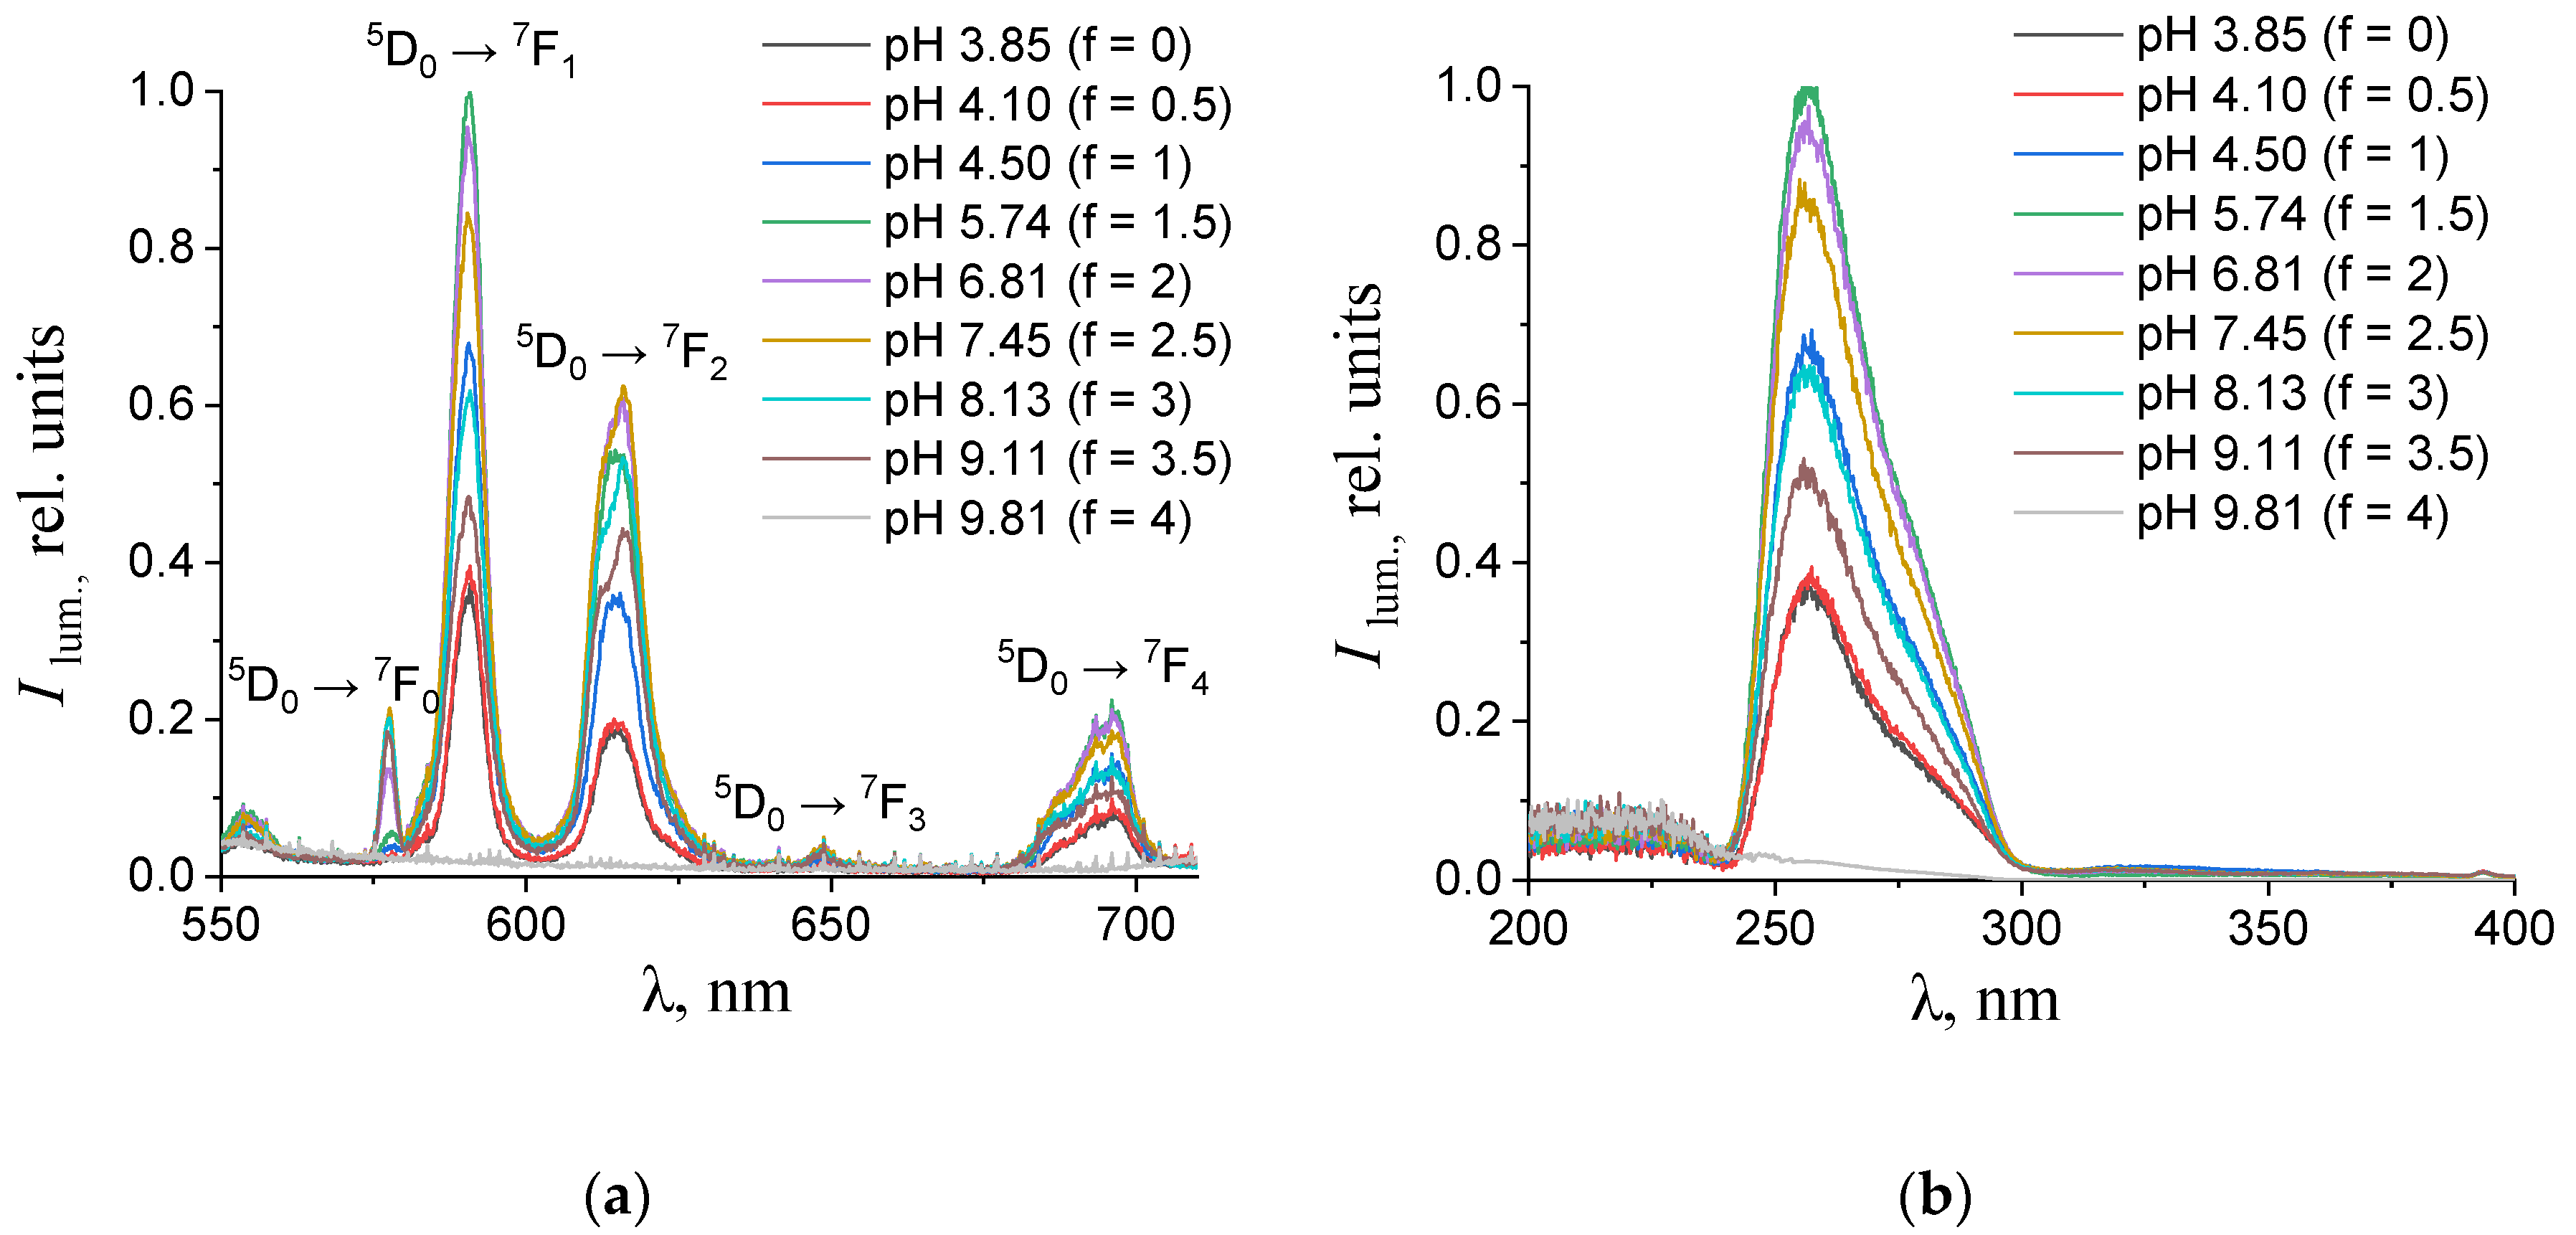
(a) Emission and (b) excitation spectra of the aqueous solutions containing 0.150 mM terephthalic acid, 0.075 mM europium(III) nitrate, and 0.01 M potassium nitrate with different values of pH. The excitation wavelength in the emission spectra was 270 nm. The luminescence wavelength in the excitation spectra was 615 nm.
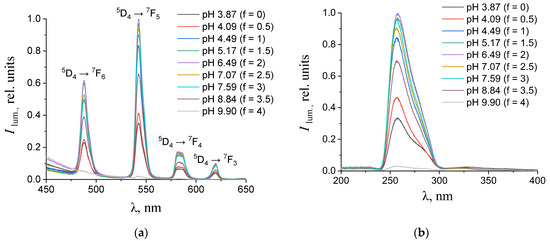
Figure 5.
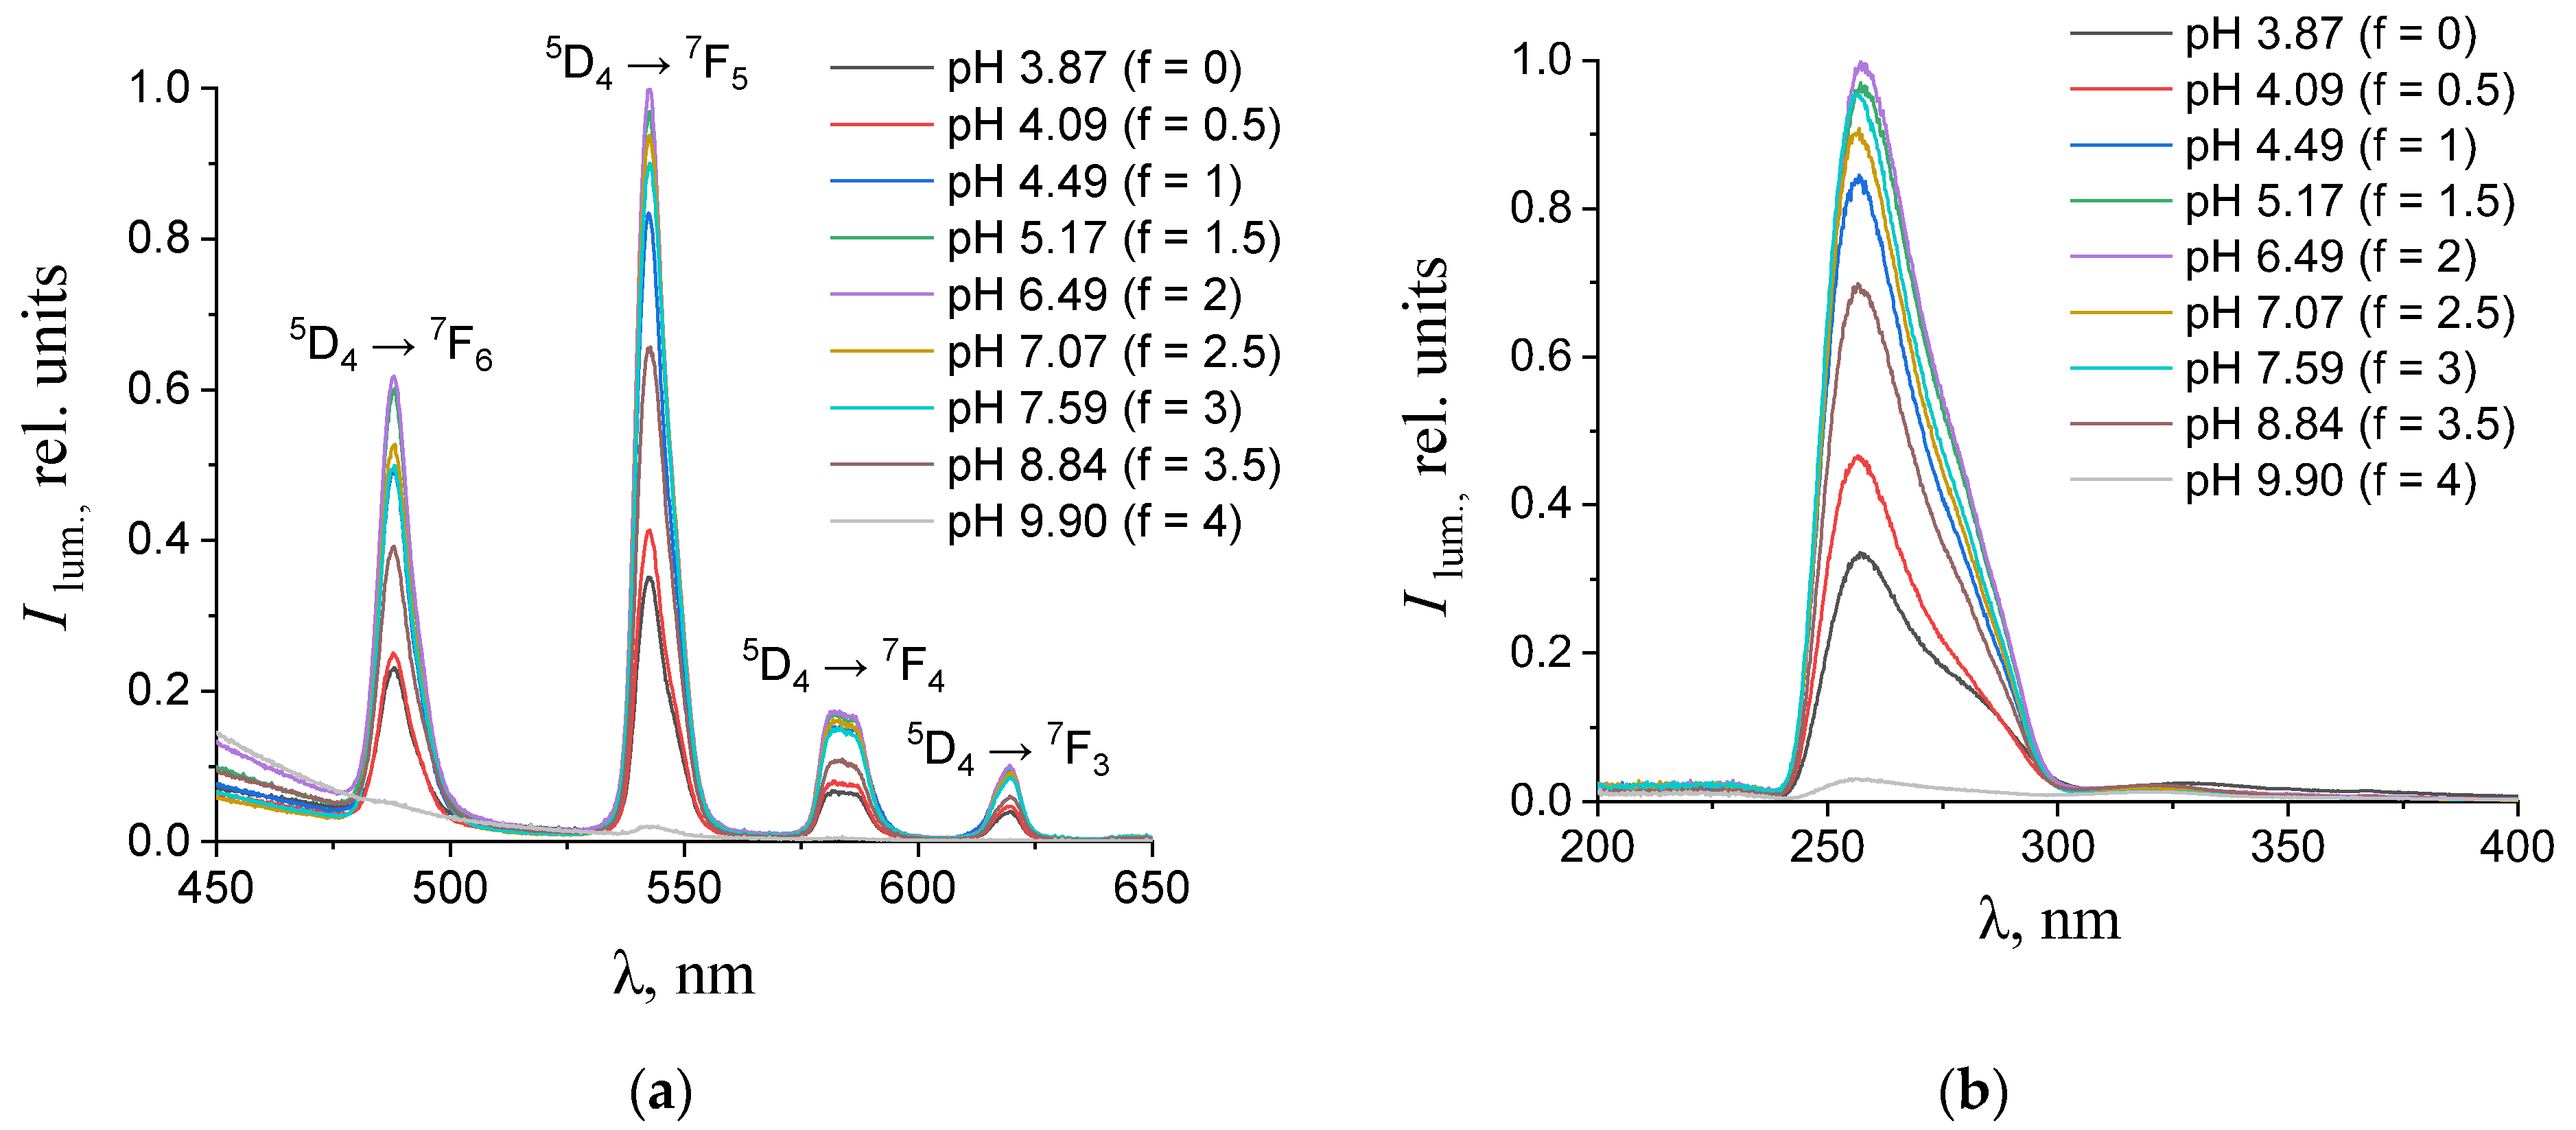
(a) Emission and (b) excitation spectra of the aqueous solutions containing 0.150 mM terephthalic acid, 0.075 mM terbium(III) nitrate, and 0.01 M potassium nitrate with different values of pH. The excitation wavelength in the emission spectra was 270 nm. The luminescence wavelength in the excitation spectra was 543 nm.

Figure 6.
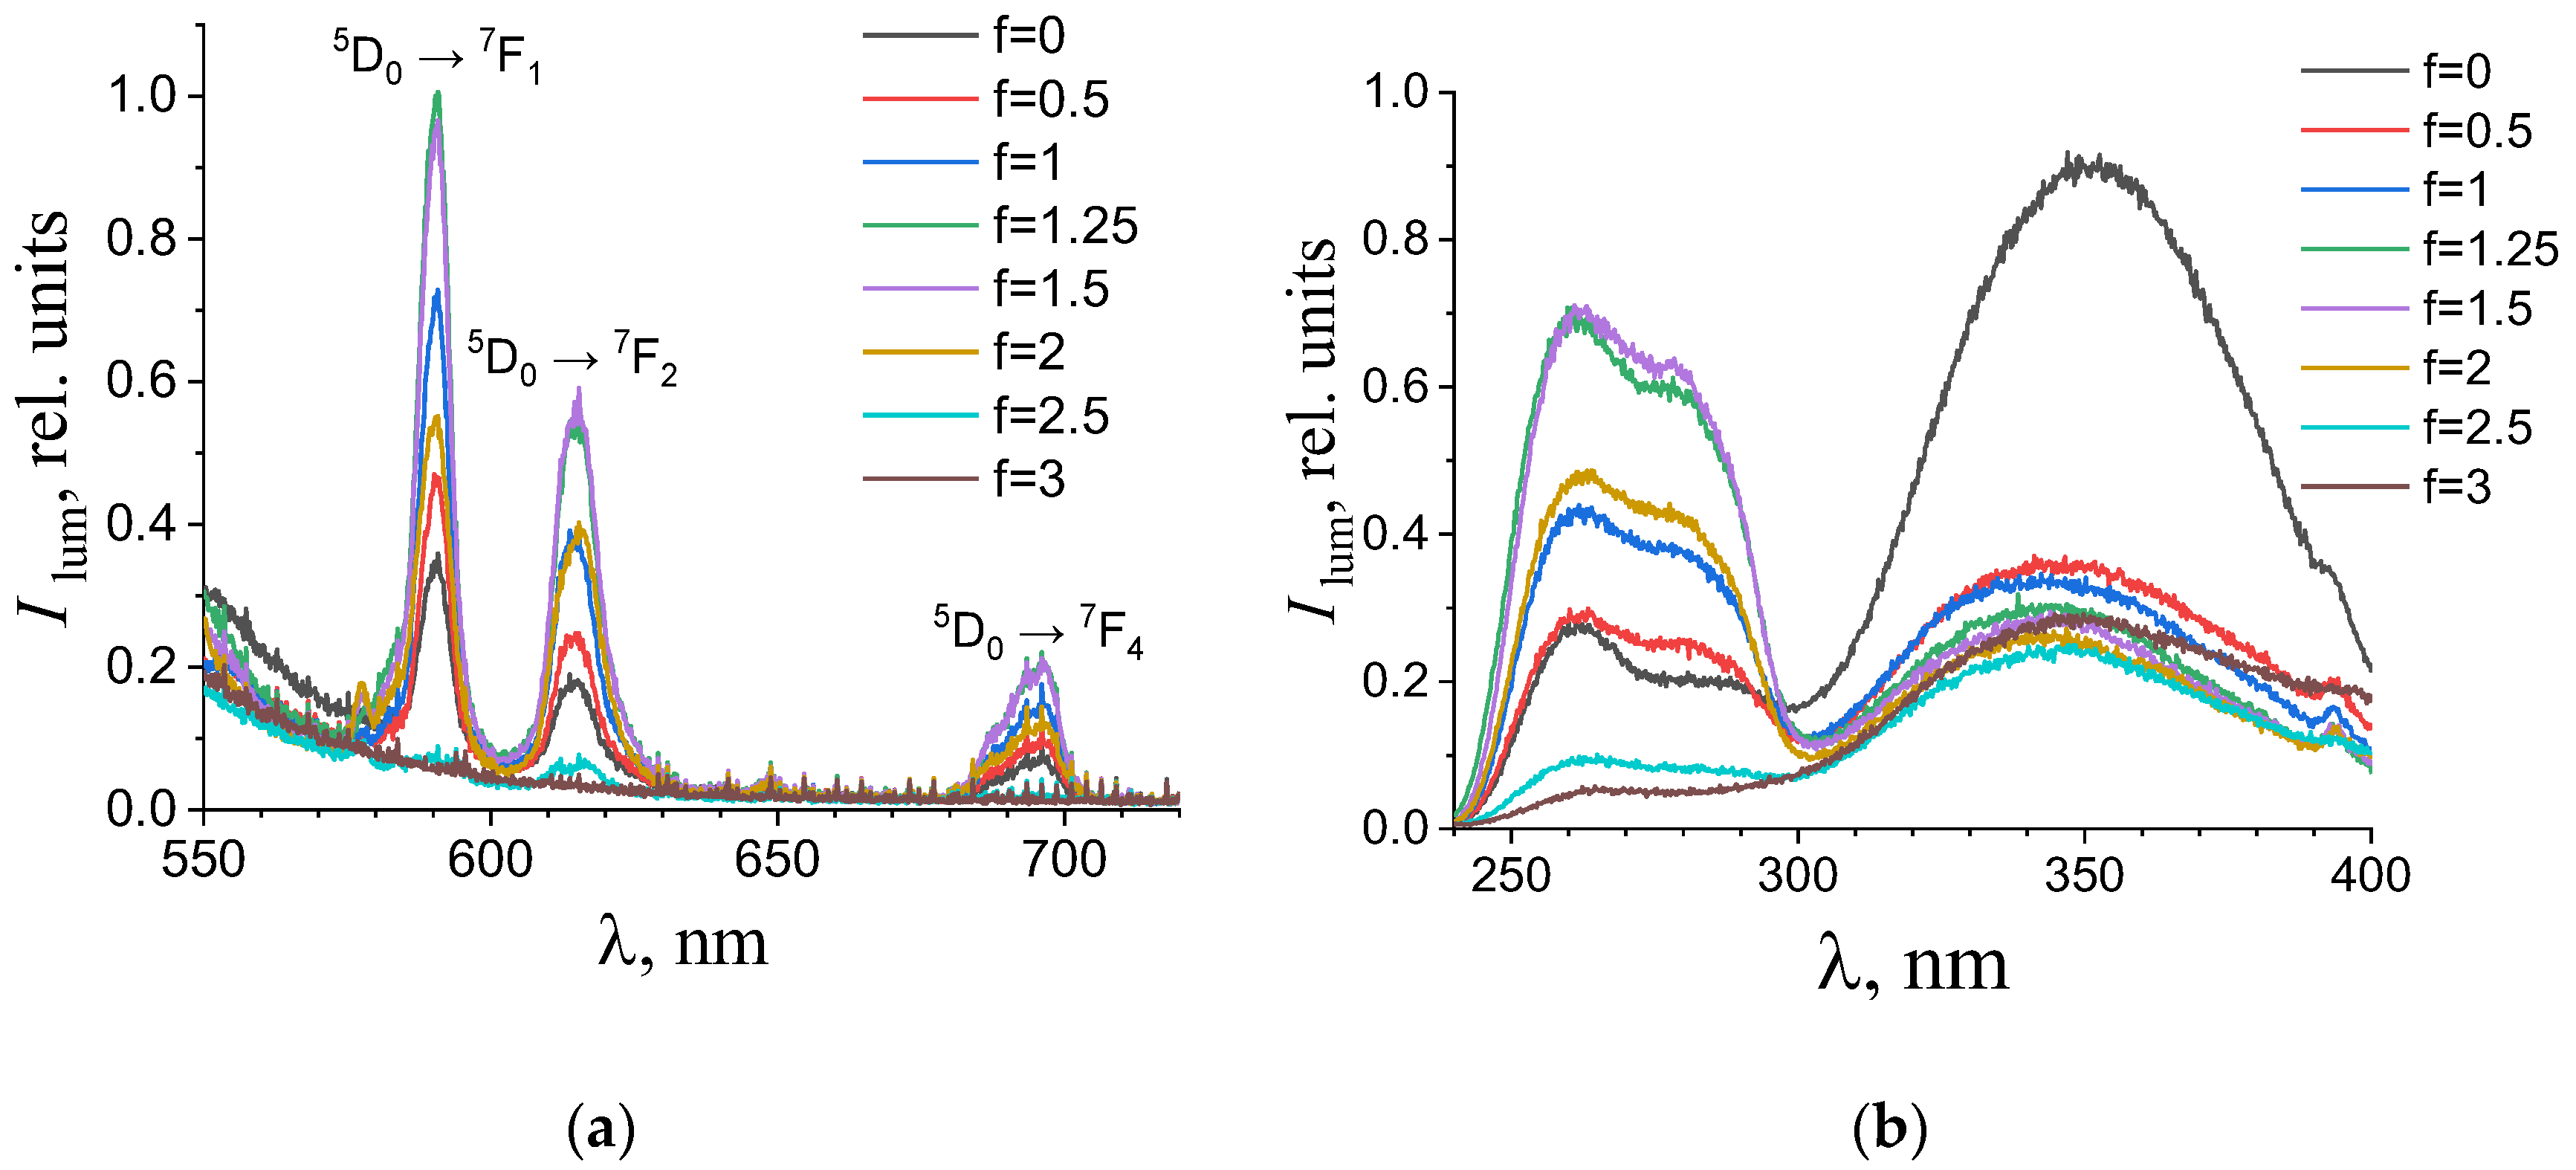
(a) Emission and (b) excitation spectra of the aqueous solutions containing 0.194 mM terephthalic acid, 0.024 mM europium(III) nitrate, and 0.01 M potassium nitrate with different titration degrees. The excitation wavelength in the emission spectra was 280 nm. The luminescence wavelength in the excitation spectra was 615 nm.
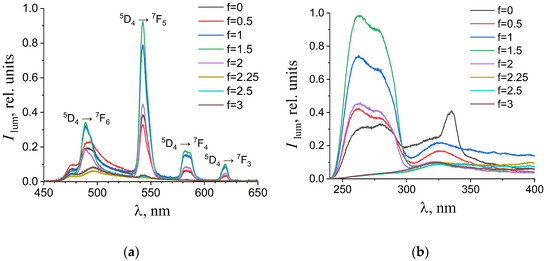
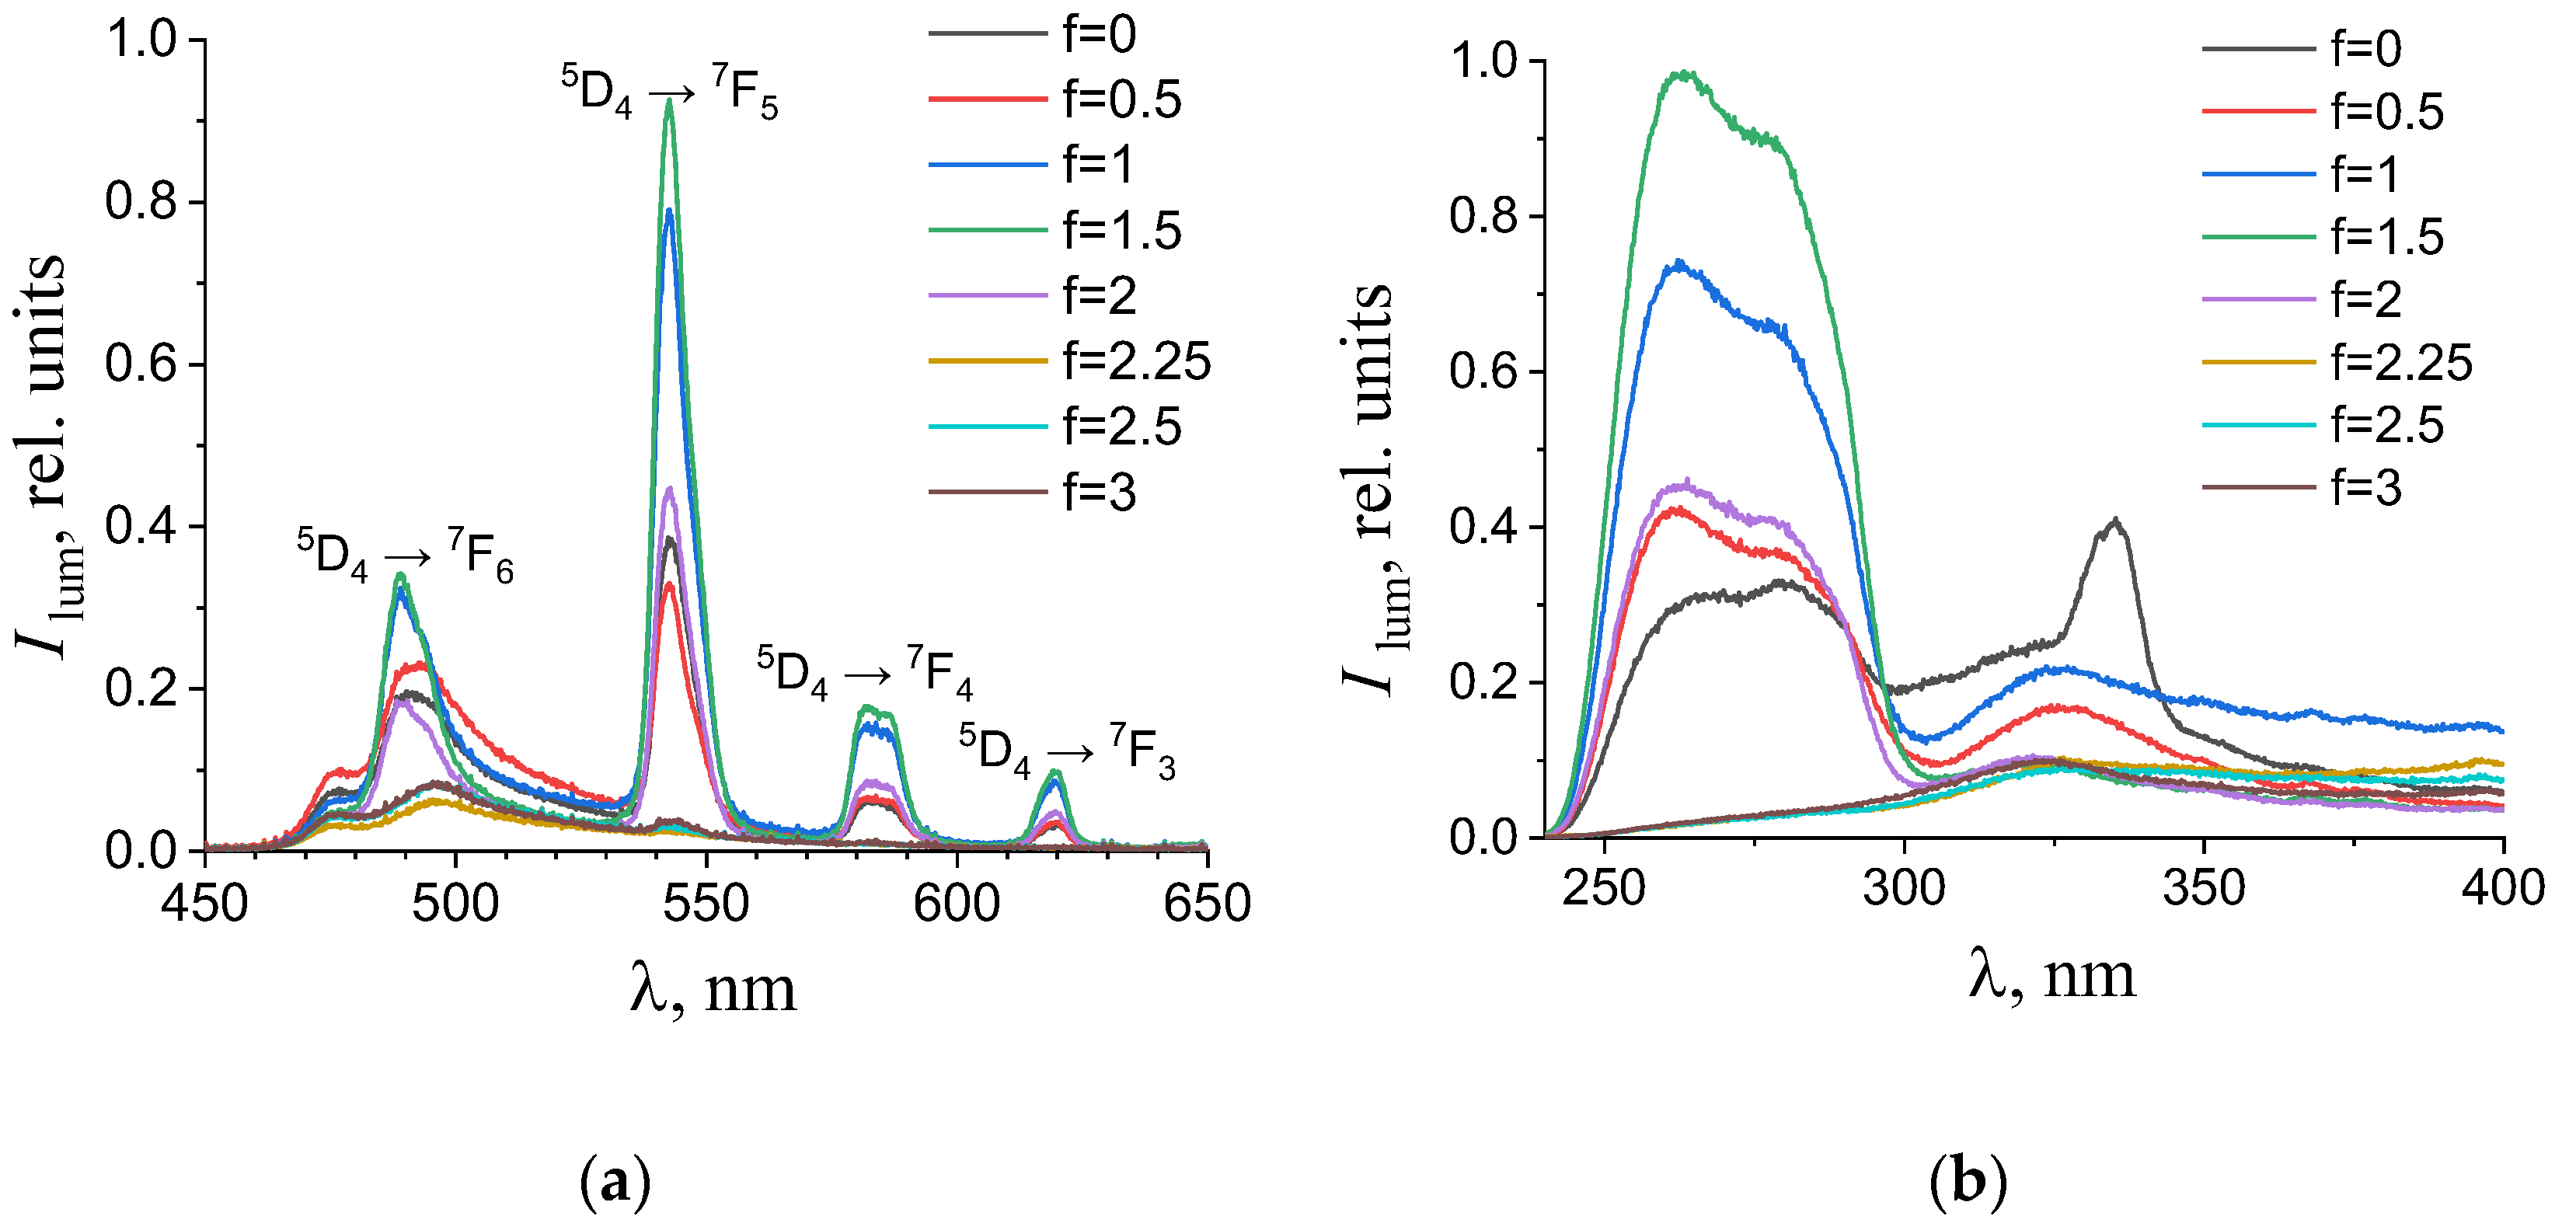
Figure 7.
(a) Emission and (b) excitation spectra of the aqueous solutions containing 0.194 mM terephthalic acid, 0.024 mM terbium(III) nitrate, and 0.01 M potassium nitrate with different titration degrees. The excitation wavelength in the emission spectra was 280 nm. The luminescence wavelength in the excitation spectra was 615 nm.
As one can see from Figure 4, Figure 5, Figure 6 and Figure 7b, the most intense luminescence of europium(III) and terbium(III) ions corresponds to the excitation wavelength of 260–280 nm. The emission spectra—Figure 5, Figure 6, Figure 7 and Figure 8a—contain the bands corresponding to the 5D0 → 7FJ (J = 0–4) f-f transitions of Eu3+ ion: 5D0 → 7F0 (578 nm), 5D0 → 7F1 (590 nm), 5D0 → 7F2 (610–615 nm), 5D0 → 7F3 (650 nm) and 5D0 → 7F4 (685–705 nm) [40] and the bands corresponding to the 5D4 → 7FJ (J = 6–3) f-f transitions of Tb3+ ion: 5D4 → 7F6 (489 nm), 5D4 → 7F5 (543 nm), 5D4 → 7F4 (584 nm), and 5D4 → 7F3 (619 nm) [42]. The “antenna” sensitizing mechanism of europium(III) and terbium(III) luminescence is observed for solutions with the 1:2 metal-to-ligand ratio in the range of 0 < f < 3.5 and for solutions with the 1:8 metal-to-ligand ratio in the range of 0 < f < 2. This is evidenced, firstly, by the fact that the characteristic appearance of the luminescence spectrum of europium(III) and terbium(III) ions is observed when solutions are excited into the ππ * state of the terephthalate ligand. Secondly, the excitation spectra contain wide bands that correspond to the absorption of terephthalate ions. In the case of photoluminescence as a result of direct f-f excitation of lanthanide ions, the excitation spectra would contain much more narrow bands, which corresponds to the f-f absorption of europium(III) or terbium(III) ions.
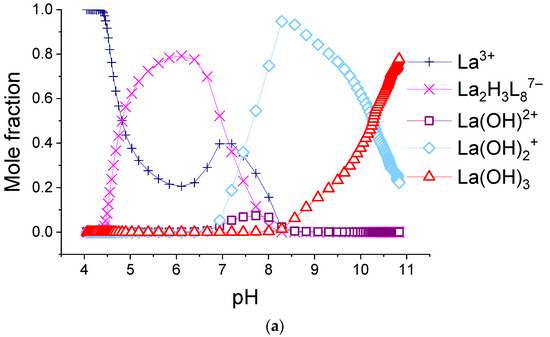
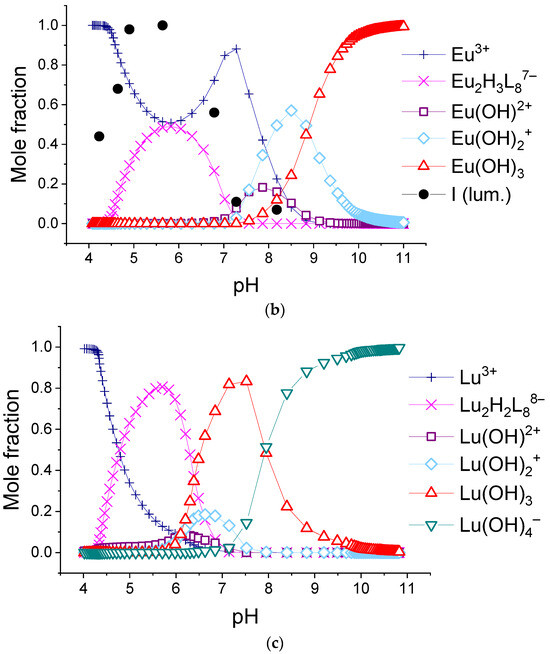
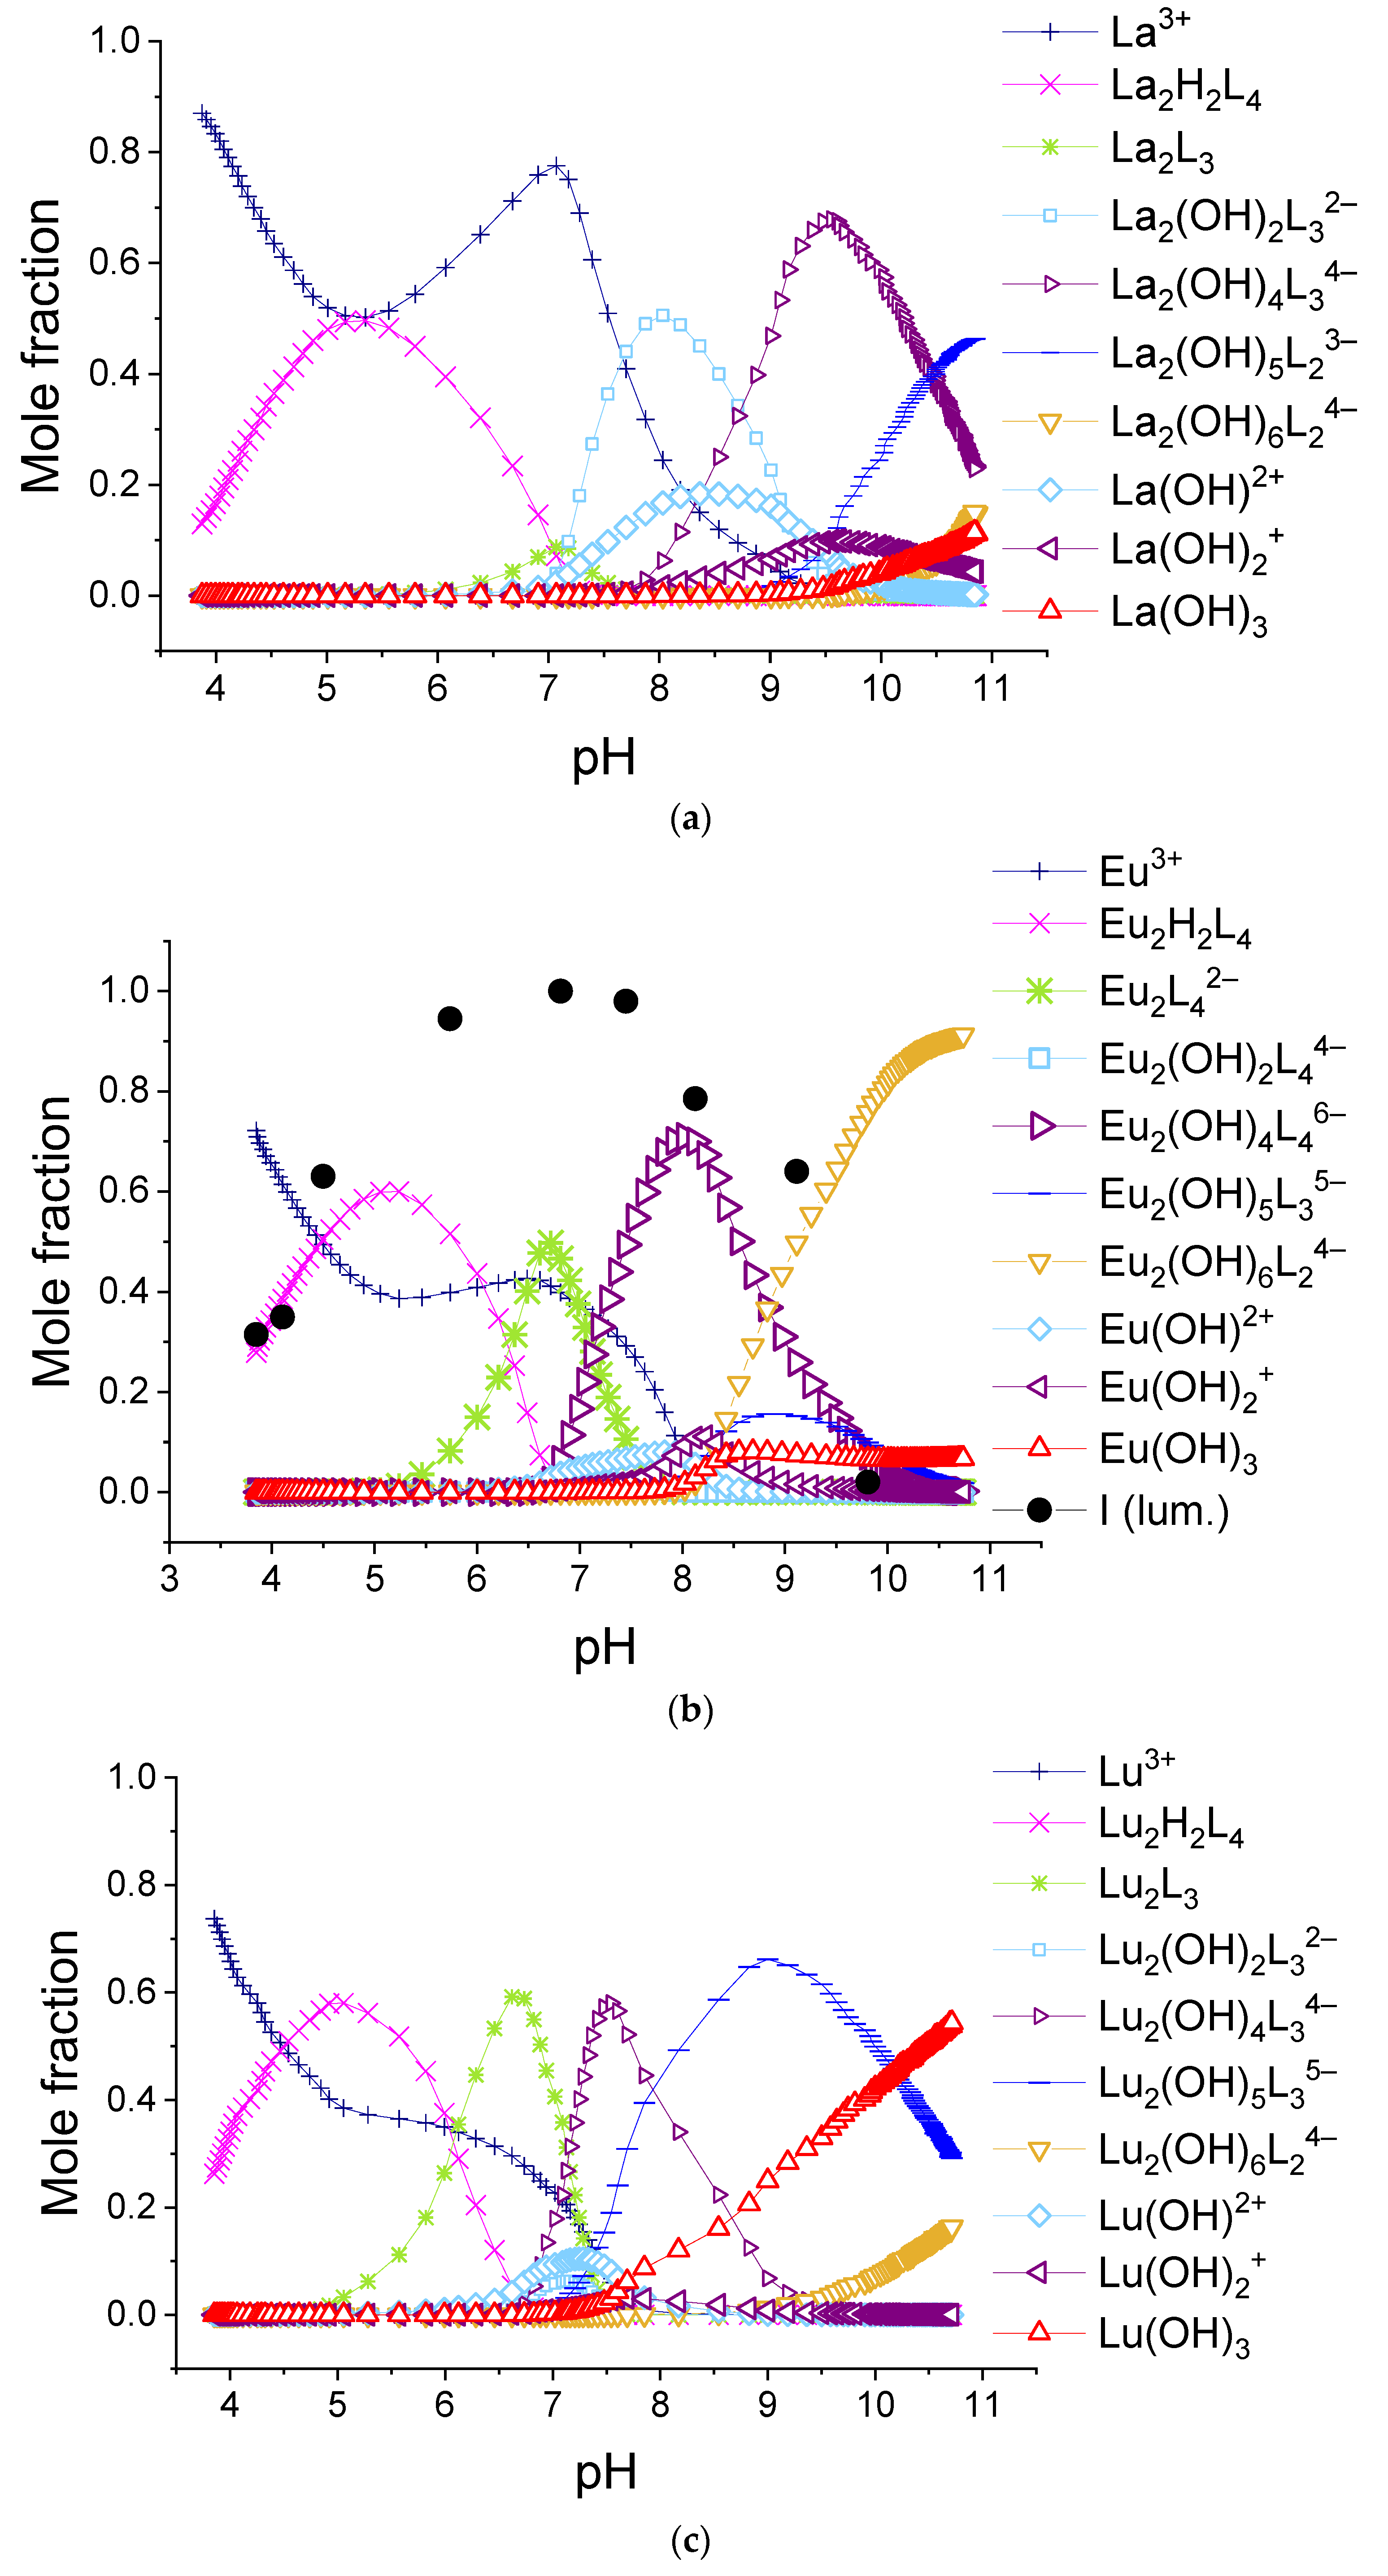
Figure 8.
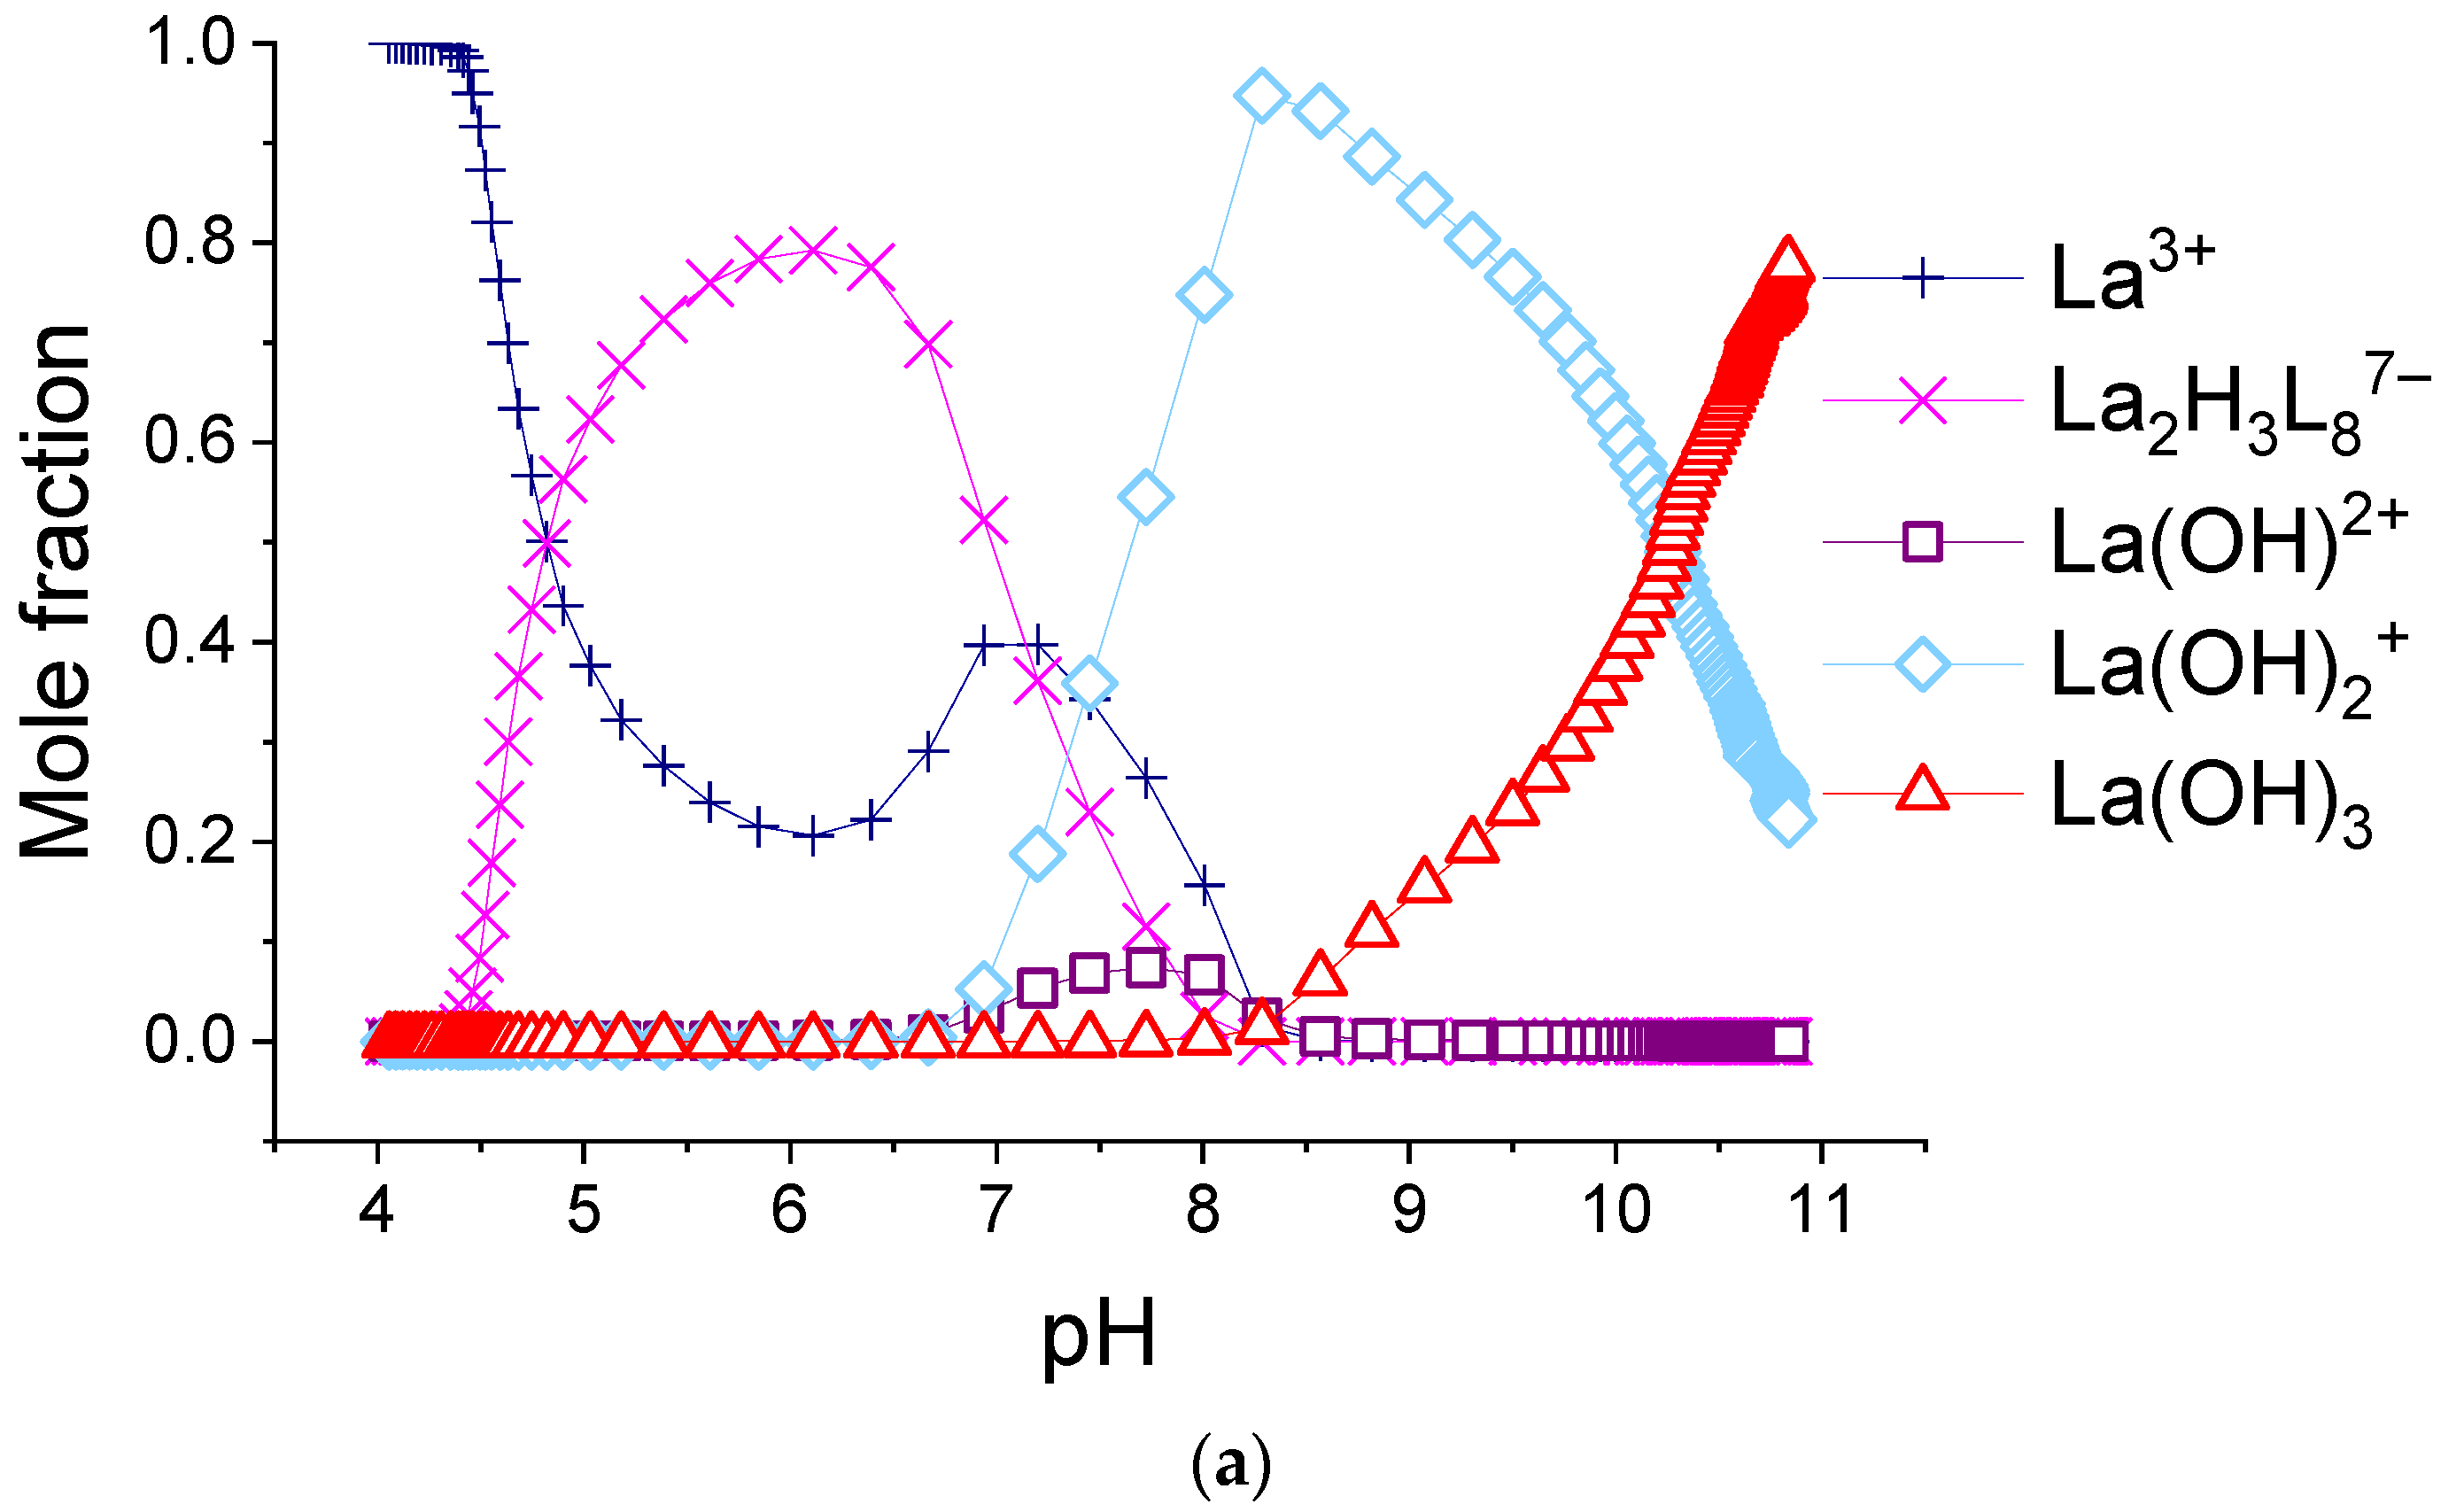
The calculated molar fractions of components for system consisting of 0.155 mM H2(1,4-bdc) and 0.0194 mM: (a)—La3+, (b)—Eu3+, and (c)—Lu3+. L = 1,4-bdc2−.
In the 1:2 system, the maximum luminescence intensity is observed at f = 1.5–2 (which corresponds to solutions of europium(III) with a pH of 5.7–6.8 and solutions of terbium(III) with a pH of 5.1–7). The luminescence intensity decreases sharply only at f = 4, which corresponds to solutions with pH > 9.8. This indicates the stability of the coordination bonds of terephthalate ligands with europium(III) and terbium(III) ions over a wide pH range. For solutions containing europium(III), a change in the fine structure of the luminescence spectrum is observed after f > 2 (pH > 6.8). The band 5D0 → 7F2 contains only one maximum in the spectra of all solutions, but it is symmetrical with a maximum at 615.6 nm when the titration degree of terephthalic acid is less than 2, and it becomes asymmetrical with a maximum at 616.8 nm when the titration degree of terephthalic acid is more than 2. Moreover, the 5D0 → 7F0 band appears in the spectra after f > 2. Based on these results, it can be assumed that the symmetry of complexes with the general formula Eux(OH)y(H2O)m(1,4-bdc)z is distorted with increasing pH, despite maintaining the same number of metal–ligand bonds. For solutions containing terbium(III), there are no changes in the fine structure of the luminescence spectra, evidencing that the symmetry of complexes with the general formula Tbx(OH)y(H2O)m(1,4-bdc)z is the same throughout their range of existence.
In the 1:8 system, the zone of existence of intensely luminescent “antenna” complexes is sharply reduced compared to the 1:2 system. The maximum is observed in the more acidic region—f = 1.25–1.5 (which corresponds to solutions of europium(III) with pH 4.9–5.6 and solutions of terbium(III) with a pH of 4.7–6). When f = 2.25–2.5 (which corresponds to solutions with a pH > 7.3), the luminescence intensity is practically zero. Based on these results we have concluded that the destruction of coordination bonds between the metal center and ligands during the neutralization of terephthalic acid proceeds and the hydroxo complexes are formed.
The narrow range of existence of intensely luminescent terephthalate complexes in the 1:8 system is explained by the strong shielding of the positive charge of the lanthanide ion by the total negative charge of the coordinated carboxylate groups. When the titration degree is less than 2 (before neutralization of terephthalic acid), tetra-complexes are the dominating form. These complexes dimerize or oligomerize, leading to additional coordination of ligands to each metal center. Thus, the dimers or oligomers include significantly shielded lanthanide cations. Dissociation of coordinated water molecules with the formation of negatively charged hydroxyl groups with increasing pH of solution further destabilizes the complexes. As a result of shielding and inter-ligand repulsion, weaker bonds dissociate, terephthalate complexes are destructed, and hydroxo complexes are formed. In a 1:2 system when the titration degree is less than 2, mainly bis-complexes exist in the solution. The shielding of the positively charged lanthanide ion and inter-ligand repulsion in these species are less than in tetra-complexes. Thus, with an increasing pH, the competition between terephthalate ligands and hydroxo ligands formed due to the dissociation of coordinated water molecules will be not so significant. This means that hetero-ligand complexes with the formula Lnx(OH)y(H2O)m(1,4-bdc)z can be quite stable when the metal-to–ligand ratio is 1:2. In other words, the range of existence of terephthalate complexes in the 1:2 system is wider than in the 1:8 system. Based on obtained trends, we followed to specifying of models.
3.3. Equilibria Models in 1:8 Systems
The obtained values of stability constants of complexes and known values of stability constants of hydroxo complexes that were used in calculations are given in Table 1. If the data for any lanthanide ion were absent, we used the data for its neighbors. All lanthanide ions except Yb3+ and Lu3+ were considered to be hydrolyzed in three steps with the formation of LnOH2+, Ln(OH)2+, and Ln(OH)3 species. Ytterbium(III) and lutetium(III) ions seem to be hydrolyzed in four steps forming additionally Ln(OH)4−. We accepted the second and the logarithms of third stability constants of hydroxo complexes of Yb(III) and Lu(III) to be twice and three times more than that of the first stability constant of the hydroxo complex. Their fourth stability constants were determined by calculations from experimental data of potentiometric titration. As a result, we obtained that logarithms of stability constants of Yb(OH)4− and Lu(OH)4− are correspondingly 28.5 and 29.5. It was also found that cerium(III) ion is hydrolyzed on the third step with a higher stability constant (logβ3 = 19.4) than the reported ones 15.75 [43] and 13.78 [44]. We assume that the reason for the increased hydrolysis lies in particular oxidation of Ce3+ to Ce4+ during titration, while Ce(IV) hydroxo complexes are much more stable than Ce(III) hydroxo complexes [45].

Table 1.
The best-fitted stability constants of complexes of lanthanides(III) ions with H2(1,4-bdc) formed in aqueous solution with 1:8 metal-to-ligand ratio and referent values of stability constants of hydroxo complexes. The values of stability constants are given in log. units (decimal logarithms of stability constants).
As can be seen from the data provided herein, in all 1:8 systems, only one type of terephthalate complex is formed. For most REE ions, the stoichiometry of the complex corresponds to Ln2H3(1,4-bdc)87−, for Lu3+-Lu2H2(1,4-bdc)88−, and for Yb3+-Yb2H(1,4-bdc)89−. The overall stability constants are very close to each other and vary from 38 to 40 log units without any mathematical trend. As a result of the fitting, the relative abundances of the complexes were obtained for each system. Distributional diagrams for solutions including potassium nitrate as the background electrolyte, terephthalic acid, and lanthanum(III), europium(III), or lutetium(III) ions in a 1:8 metal-to-ligand ratio are given in Figure 8. The diagrams for systems with all REE cations as well as the calculated and experimental titration curves are available in Supporting Materials, Figures S1–S14. For the system with the europium(III) ion, we showed the relative integral luminescence intensity on the diagram.
One can note that the luminescence intensity of the solution increases with the accumulation of terephthalate complex Eu2H3(1,4-bdc)87− and decreases with its decomposition. The concentration of unbound lanthanide ion in most systems somewhat increases in the range of pH~6–7 corresponding to f~2. That can be explained by the destruction of terephthalate complexes by Reaction (5) while the hydrolysis process does not yet begin:
Ln2H3(1,4-bdc)87− + 3OH− ↔ 2Ln3+ + 3H2O + 8(1,4-bdc2−) → logK = 3pKw − logβ ≈ 3
The reasons for destruction are significant shielding of the positive charge of lanthanide centers by a great number of coordinated ligands from each other and significant inter-ligand repulsion. Terephthalates of ytterbium(III) and lutetium(III) are less protonated than other terephthalates and dominate in more alkaline environments than others. The character of the decrease in the concentration of unbounded ytterbium(III) and lutetium(III) ions is purely monotonous, without a local maximum—see Figure 8c and Figure S13. Therefore, Yb2H(1,4-bdc)89− and Lu2H2(1,4-bdc)88− compared with other terephthalates, do not particularly dissociate when the titration degree is 2. They seem to convert directly into hydroxo complexes with the following equilibrium constants:
Yb2H(1,4-bdc)89− + 5OH− ↔ 2Yb(OH)2+ + H2O+8(1,4-bdc2−) logK = 5pKw − 4pKh2 − logβ = 4.98.
Lu2H2(1,4-bdc)88− + 4OH− ↔ 2LuOH2+ + 2H2O+8(1,4-bdc2−) logK = 4pKw − 2pKh1 − logβ = 3.38.
The reason for the stability of ytterbium(III) and lutetium(III) terephthalate complexes in neutral media may be the high effective charges of ytterbium(III) and lutetium(III) ions, which are able to keep a large number of negatively charged ligands in the field of metal centers. Another reason may be related to the increased contribution of vacant 5d-orbitals of ytterbium(III) and lutetium(III) ions to the binding between the metal and the ligands since 5d-orbitals of “heavy” REEs are more energetically available [49].
Thus, we suggest following a general complex formation scheme in solutions containing sodium nitrate as the background electrolyte, terephthalic acid, and lanthanide(III) ions in a 1:8 metal-to-ligand ratio with increasing pH:
Ln2Hy(1,4-bdc)8y−10 ↔ 2LnOH2+ ↔ 2Ln(OH)2+ ↔ 2Ln(OH)3 ↔ Ln’(OH)4−, y = 1–3, Ln’ = Yb, Lu.
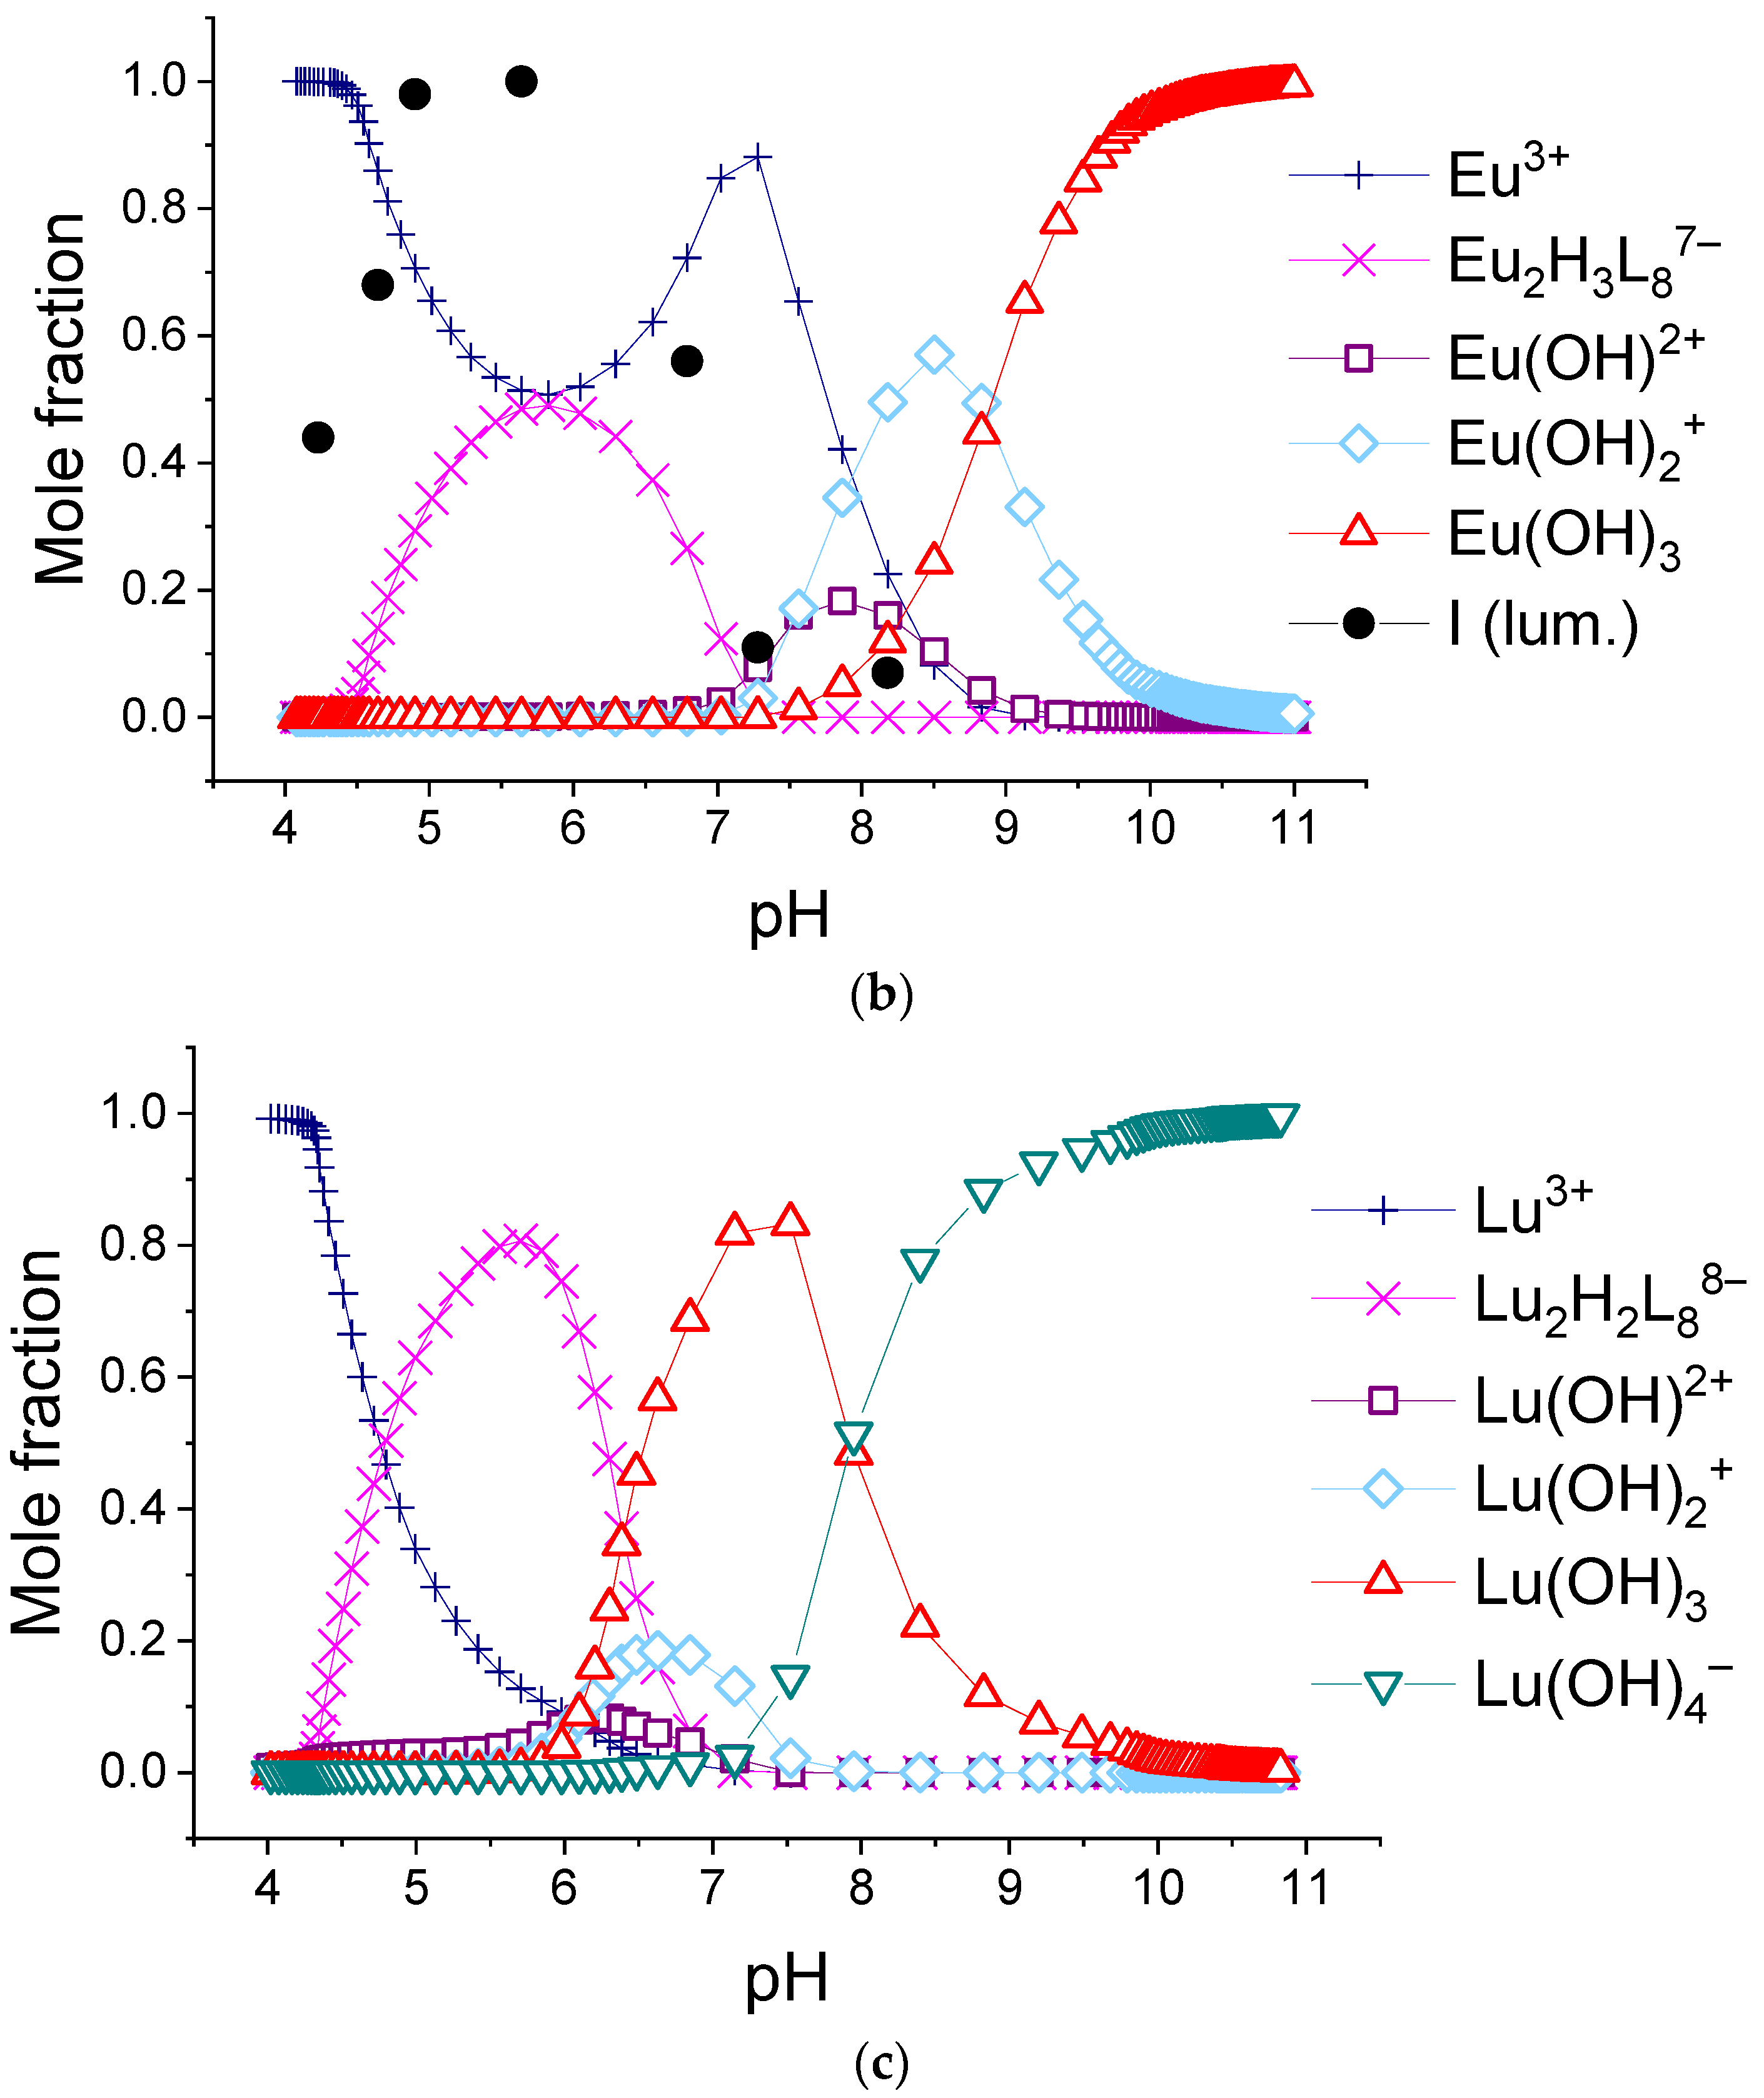
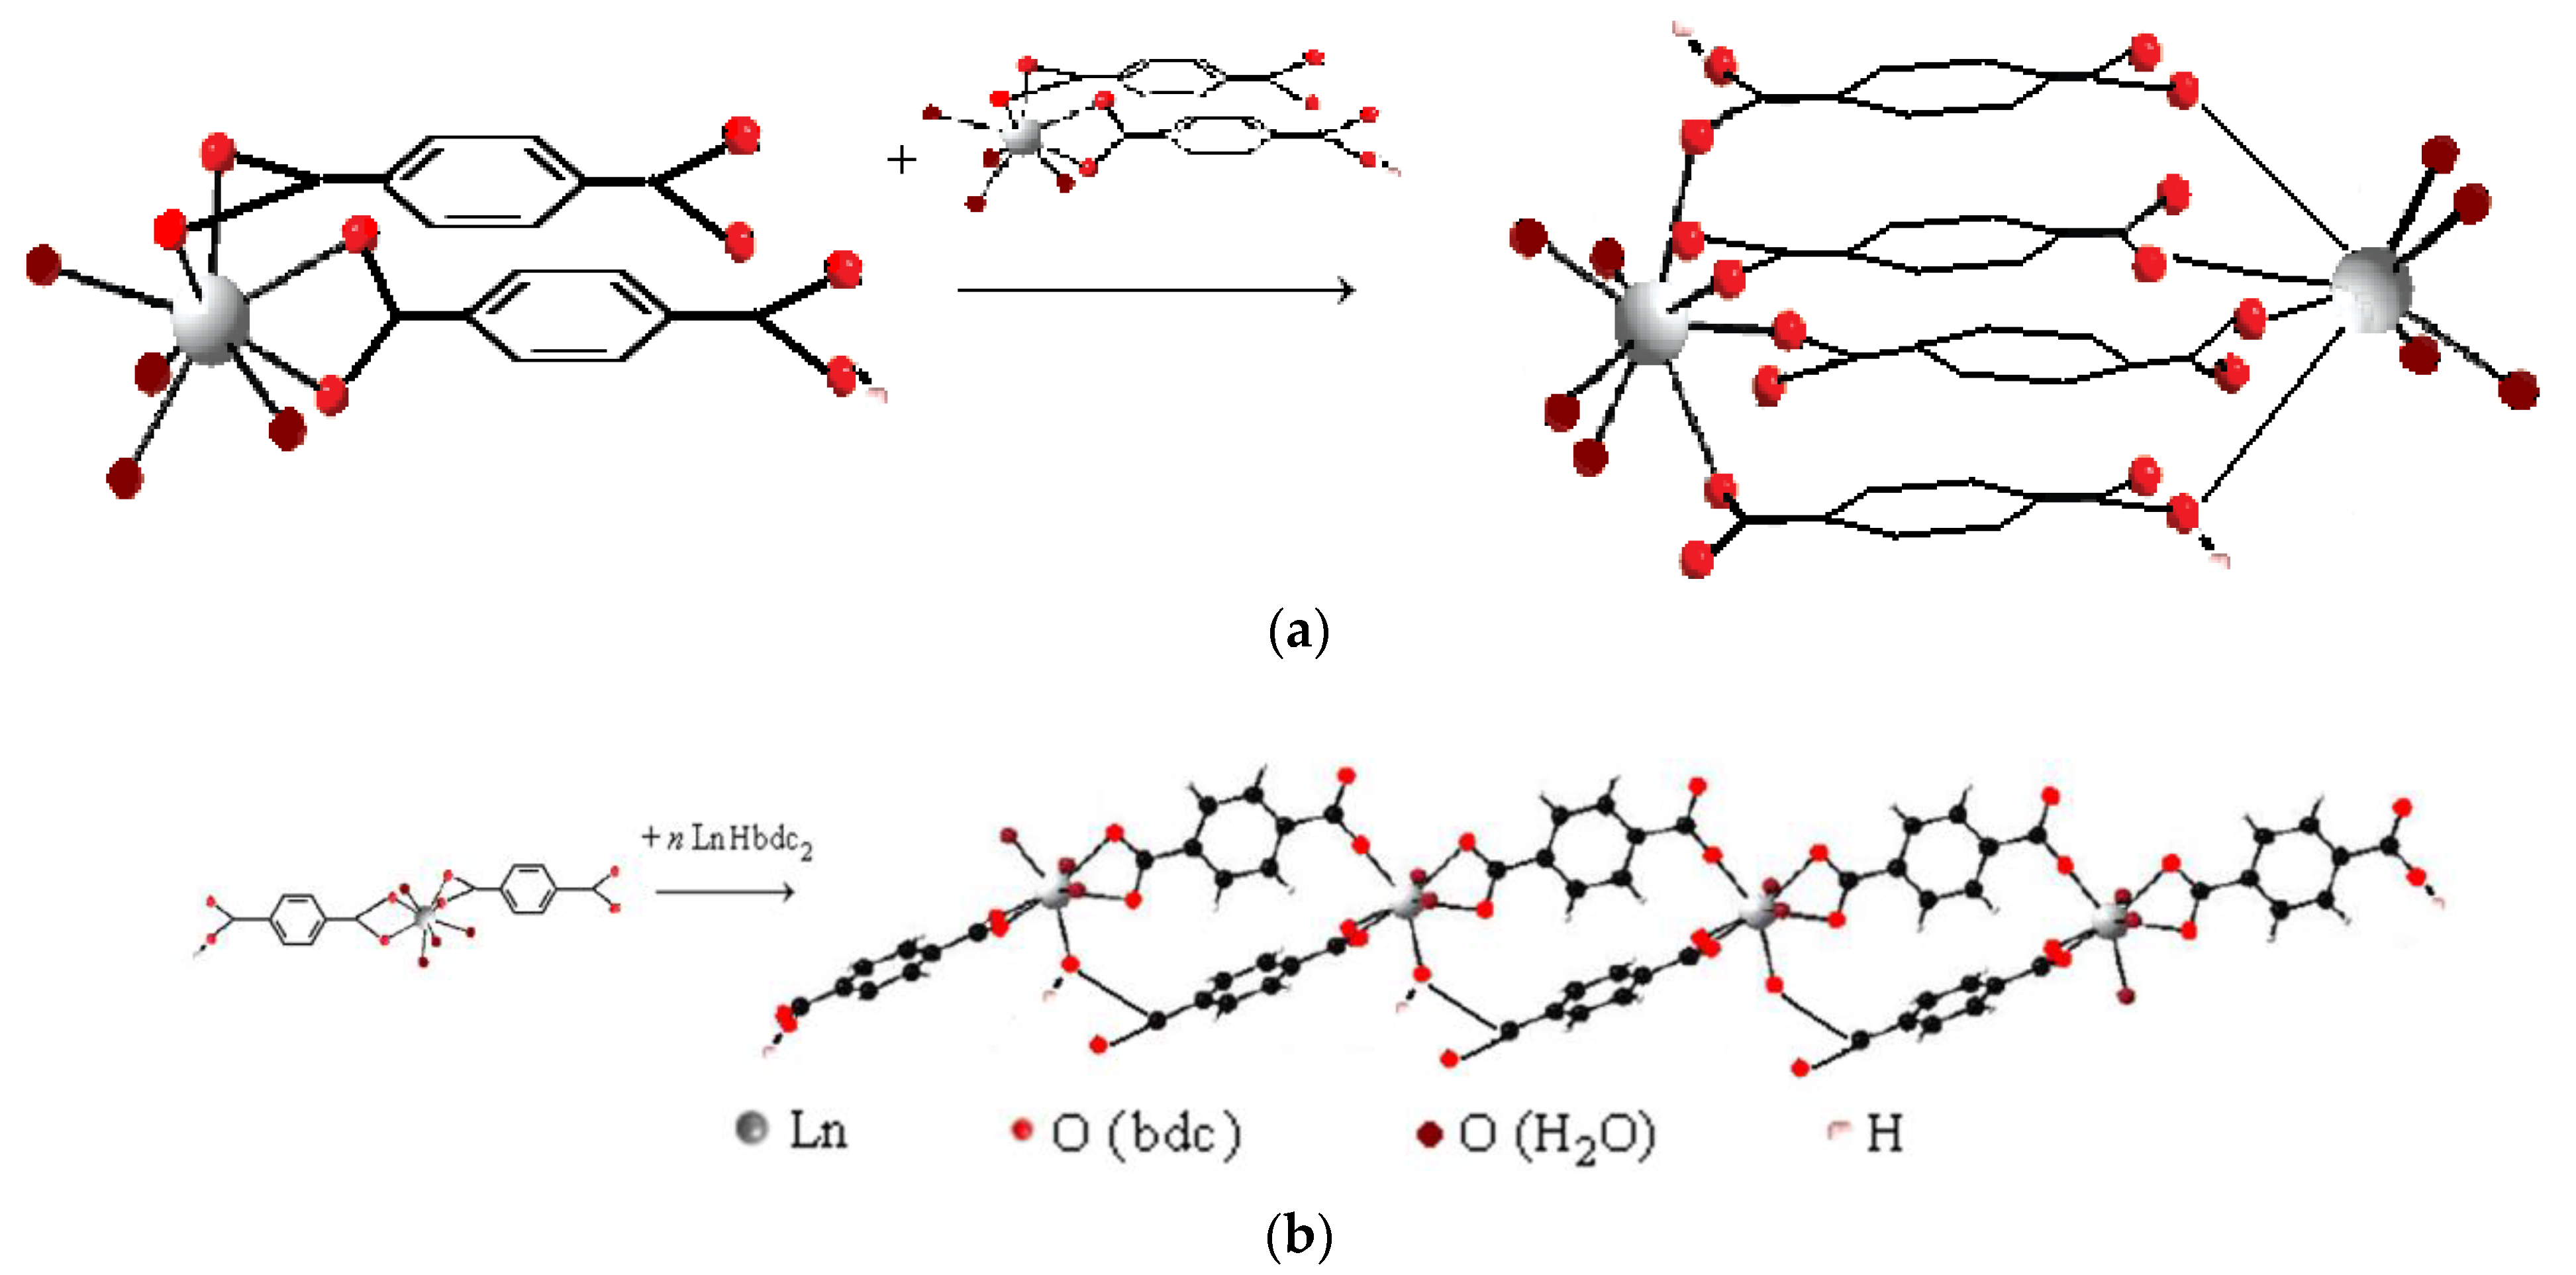
Based on the typical values of the stability constant per one functional group, one can conclude that the Ln2Hy(1,4-bdc)8y−10 complex should contain a fairly large number of coordinated functional groups, namely 12–13. The stability constant per one functional group of the complex is typical in this case and amounts to 3.0–3.4 log units. This condition greatly limits the number of possible structures of dimers and oligomers with the established stoichiometry. It is realized, for example, in the structure of a dimer with four bridging and four terminal ligands. An example of four parallel directed bonds exists in the solid polymer with the formula Ln2(1,4-bdc)3(H2O)4 [13,16,17,18]. The dissociation degree of even the most protonated Ln2H3(1,4-bdc)87− complex is sufficient to form four bridging bonds, provided that the dissociated carboxylate groups of each monomer are directed to the metal ion of the other monomer and not in the opposite direction—see Figure 9a. In some complexes, some protonated ligands may also turn inward. In principle, they can also form bonds with a neighboring lanthanide ion but by a donor–acceptor mechanism rather than by electrostatic attraction—Figure 9b. Such bonds should be somewhat weaker than the bonds between an REE ion and deprotonated ligand. But this will have little effect on the stability constant of the complex due to the large total number of coordination bonds in the complex. The coordination mode of terminal ligands can be either bi- or monodentate: In Figure 9a,b, both variants are shown. In the dimers, the total negative charge of the inner environment of the metal centers becomes too large; therefore, the substitution of one of the oxygen atoms of the bidentate-coordinated carboxylate group, which carries a charge of −½, with a water molecule and its corresponding distance from the lanthanide ion is a way to remove the excess negative charge. It is likely that the destruction of the dimers in a neutral and alkaline environment occurs through its gradual hydration.
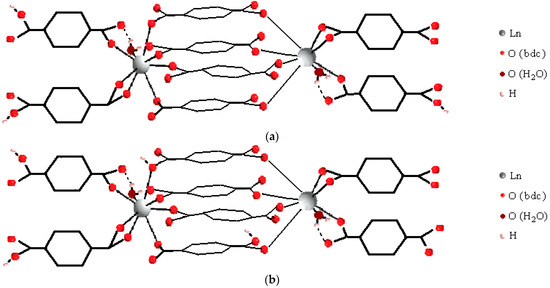
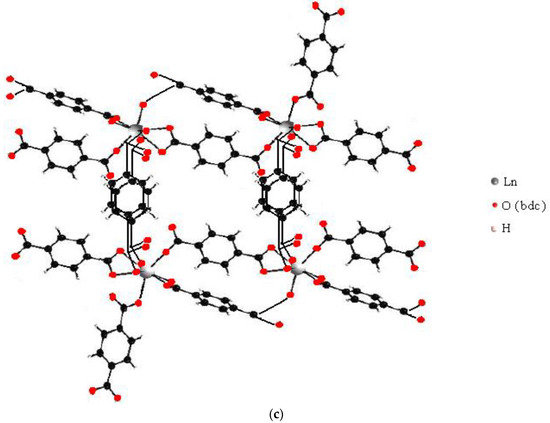
Figure 9.
Available structures of the terephtalate complexes of lanthanide ions formed in solution with 1:8 metal-to-ligand ratio (a), (b)—the dimers with some features of Ln2(1,4-bdc)3(H2O)4 solid-state structure, and (c)—the tetramer with some features of Ln2(1,4-bdc)3(H2O)8·2H2O solid-state structure.
In order to perform the established condition, 2–2.5 ligands per one REE ion should be bridge-coordinated, and 1.5–2 ligands per one REE ion should be terminal, the metal centers in the complexes must be quite strongly cross-linked. It cannot be argued that structural motifs of only Ln2(1,4-bdc)3(H2O)4 alone and no other structure may correspond to the above condition. For example, it may be suggested the tetramer with some features of the Ln2(1,4-bdc)3(H2O)8·2H2O solid polymer structure as an available precursor—Figure 9c. We should reasonably note that before solid structure crystallization, some bonds between lanthanide ions and ligands in the complexes must dissociate because 1:4 metal-to-ligand stoichiometry of precursors differ from the 1:1.5 metal-to-ligand stoichiometry of the solid structure. Therefore, the similarity between the structure of the dissolved complexes and the structure of the crystallizing polymer will be quite remote. More similarity should be expected between solid polymer structures and complexes with 1:2 metal-to-ligand stoichiometry (bis-complexes) because the latter dissociate to a much lesser extent before solid phase crystallization than tetra-complexes. In the next subsection, we present the results of the study of complex formation between 1,4-benzene-dicarboxylic acid and lanthanide ions in a 1:2 metal-to-ligand ratio.
3.4. Equilibria Models in 1:2 Systems
We found that the best-fitted equilibria models for 1:2 systems are different for different lanthanide ions. The obtained values of stability constants of complexes are given in Table 2, and the relative abundances of the complexes using the example of solutions containing lanthanum(III), europium(III), and lutetium(III) ions are shown in Figure 10. The diagrams for systems with all REE cations are available in Supporting Materials, Figures S15–S28.
Table 2.
The best-fitted stability constants of complexes of lanthanides(III) ions with H2(1,4-bdc), formed in aqueous solution with 1:2 metal-to-ligand ratio. L = 1,4-bdc2−; the charges of the complexes are omitted.
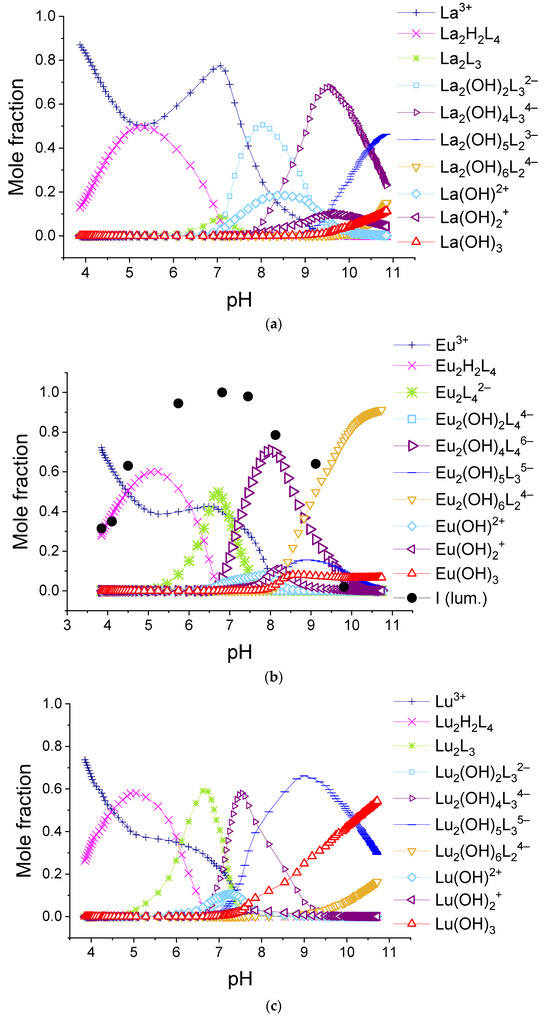
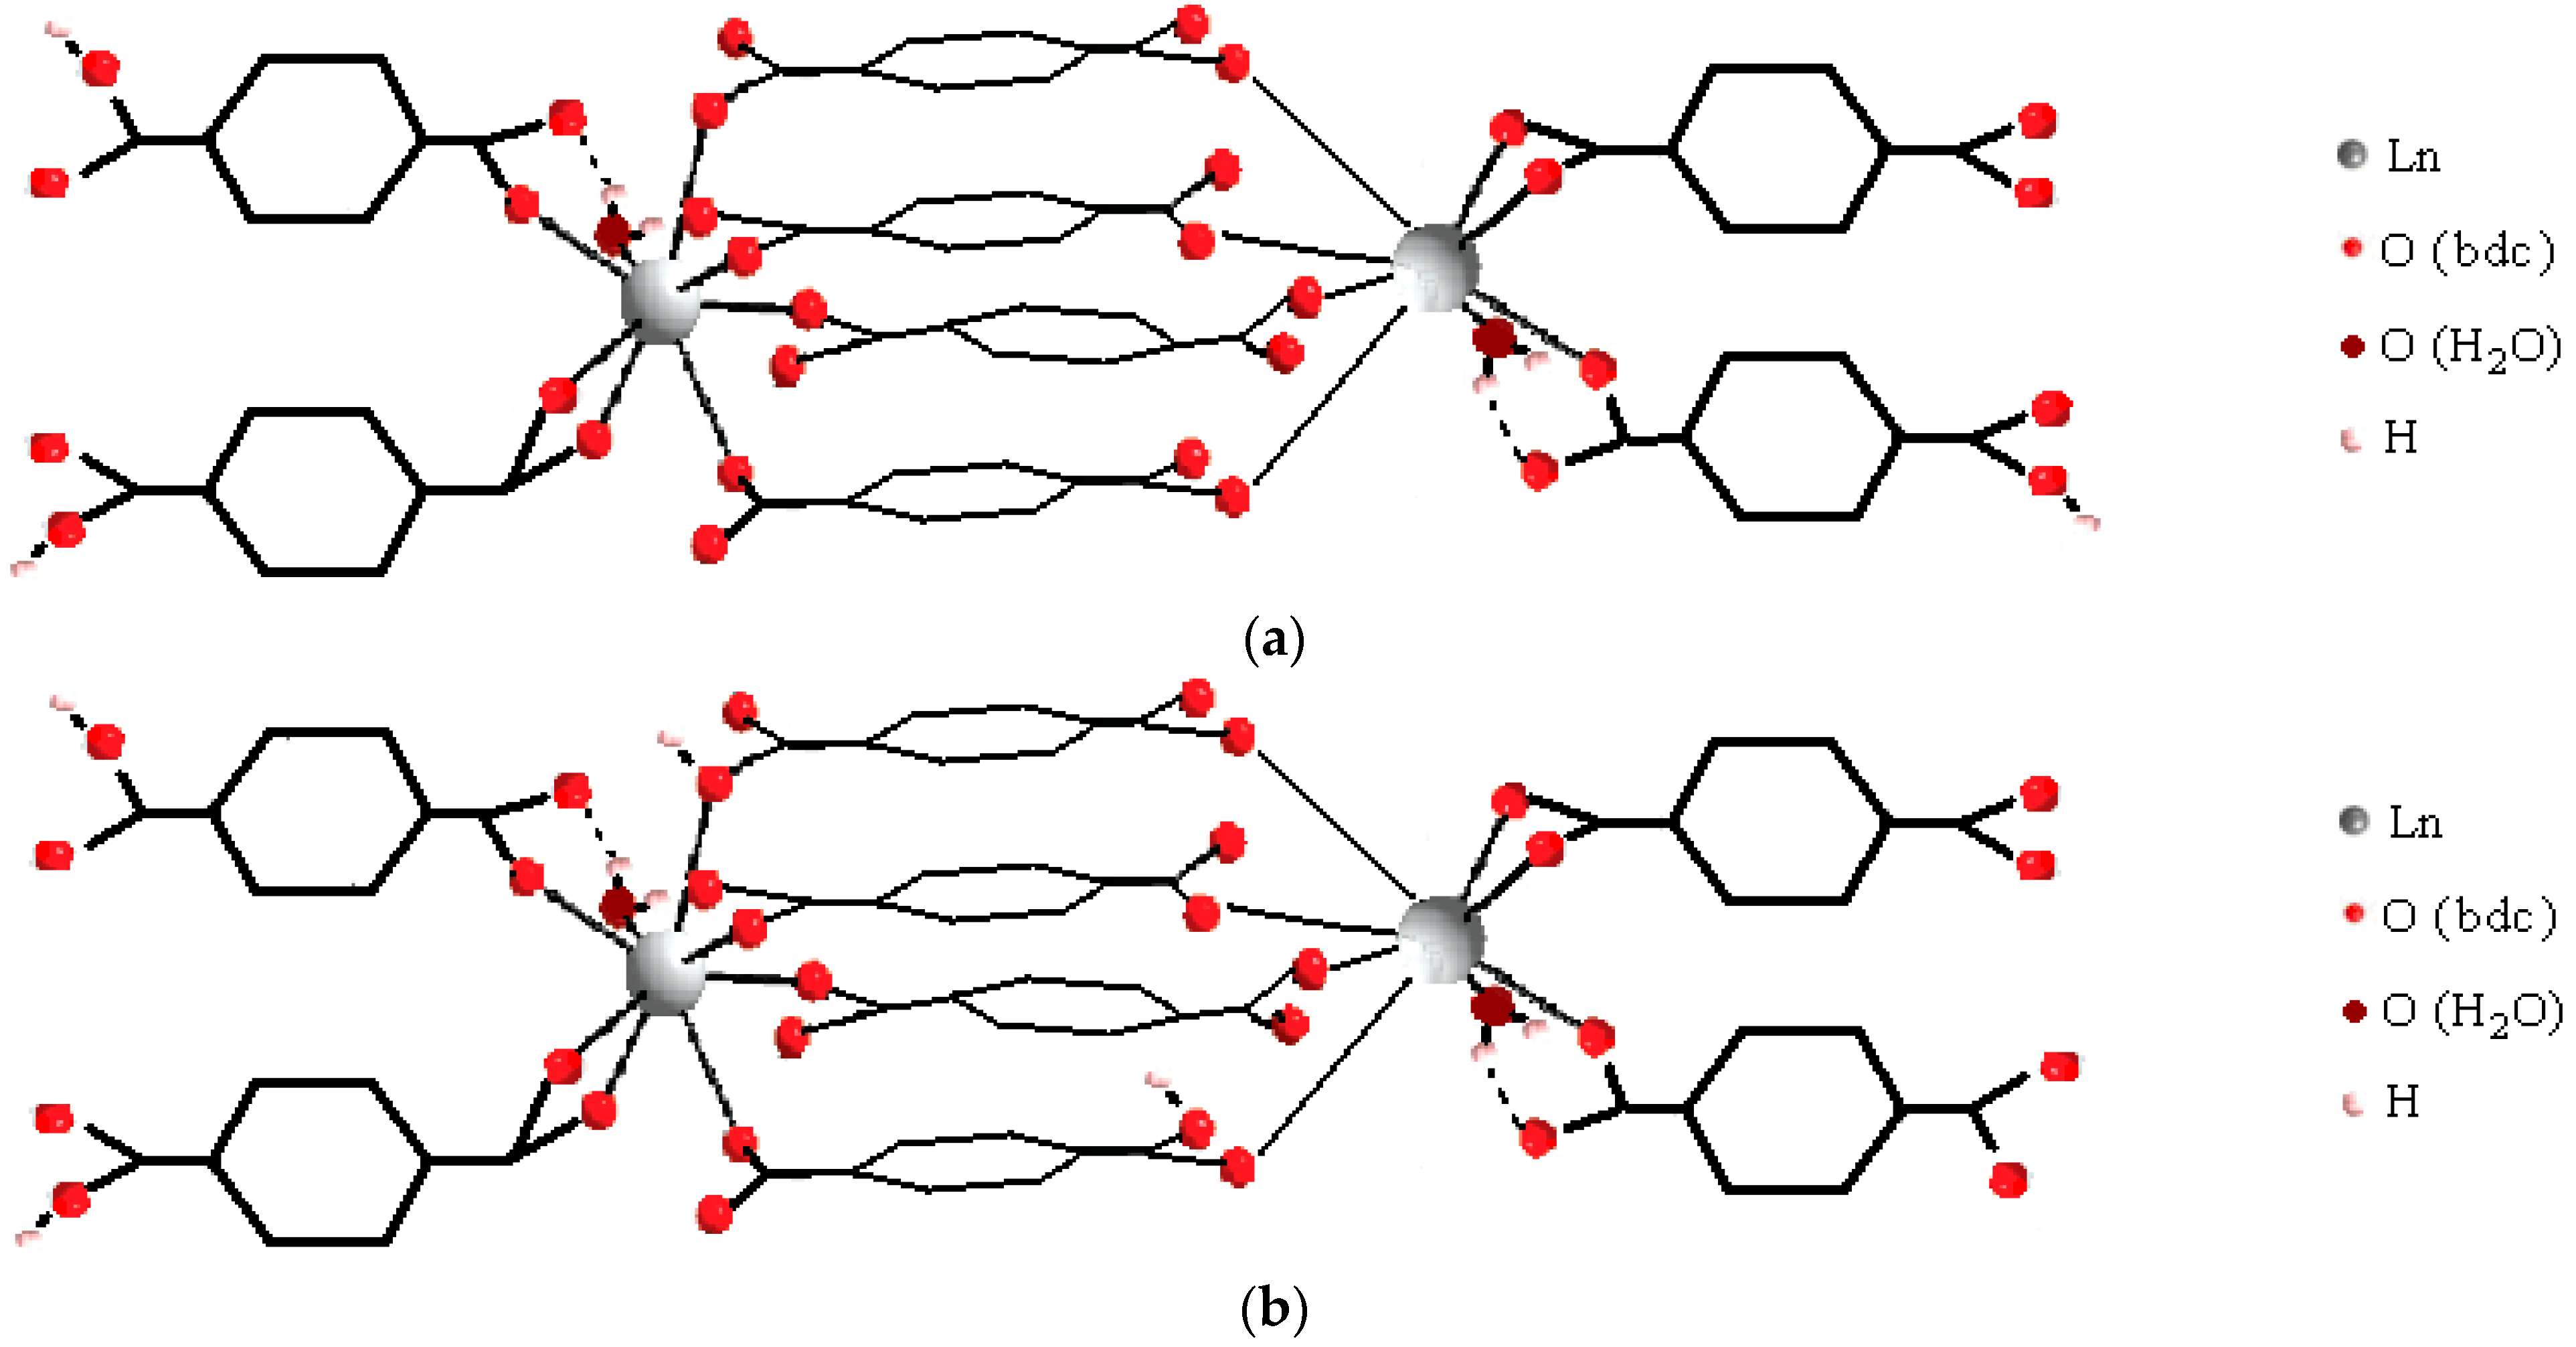
Figure 10.
The calculated molar fractions of components for system consisting of 0.150 mM H2(1,4-bdc) and 0.075 mM: (a)—La3+, (b)—Eu3+, and (c)—Lu3+.
As can be seen from the listed data, in all 1:2 systems in the range of titration degree between 1.5 and 2, all ions form Ln2H2(1,4-bdc)4 or Ln2H(1,4-bdc)4− complexes. With increasing pH, the complexes of La3+-Pr3+, Gd3+, and Tm3+-Lu3+ destruct with the formation of Ln2(1,4-bdc)3 species. Most likely, the ligand dissociates due to the tendency of the complex to compensate for the positive charge of the metal centers. At the same time, in some systems, the concentration of unbounded lanthanide ion increases, which is reflected by a local maximum at f = 2 on the curves of the fraction of unbounded lanthanide ion (see Figure 10a, Figures S16 and S21). The stability constants of Ln2(1,4-bdc)3 per one functional group are slightly less than that of the Ln2H2(1,4-bdc)4 complexes. With a further increase in pH, lanthanide ions, both unbounded and bounded with terephthalate ligands, undergo hydrolysis. Due to the dissociation of coordinated water molecules and consequently formation of coordinated hydroxyl groups, the negative charge of the inner sphere of the metal center increases, and the complexes gradually lose terephthalate ligands. The equilibrium model is adequate, and all probable processes are thermodynamically favorable under the assumption of the following chain of transformations:
Ln2H2(1,4-bdc)4 ↔ Ln2(1,4-bdc)3 ↔ Ln2(OH)2(1,4-bdc)32− ↔ 2LnOH2+ ↔ Ln2(OH)4(1,4-bdc)34− ↔ 2Ln(OH)2+ ↔ Ln2(OH)5(1,4-bdc)z1−2z ↔ Ln2(OH)6(1,4-bdc)24− ↔ 2Ln(OH)3, z = 2, 3; Ln = La, Ce, Pr, Gd, Tm, Yb, Lu.
On the opposite, the terephthalates of Nd3+-Eu3+ and Tb3+-Er3+ accept protons forming Ln2(1,4-bdc)42− species when the titration degree is 2. No bonds between lanthanide ions and ligands dissociate, but the average binding energy per one functional group slightly decreases. There is no significant increase in the concentration of the unbounded lanthanide ion in the solution; one cannot observe the local maximum on the curves of the fraction of the unbounded lanthanide ion (Figure 10b, Figures S19, S20 and S22–S25). Thus, the dimer with the initial number of bonds between the metal ion and ligands is preserved and undergoes further hydrolysis. Using the example of systems containing europium(III) and terbium(III) cations (Figure 10b and Figure S22), it can be seen that the high luminescence intensity of solutions remains up to the degree of titration of 3.5. It indicates that the “antenna” mechanism maintains energy transfer from terephthalate to lanthanide ion in the complex due to keeping the number of metal–ligand bonds the same. The equilibrium model adequately assumes that the first terephthalate ligand removes from the Ln2(OH)4(1,4-bdc)46− forming Ln2(OH)5(1,4-bdc)35− complex, and the second terephthalate ligand removes from the latter one forming Ln2(OH)6(1,4-bdc)24− complex. The luminescence intensity begins to decrease in the zone of existence of the complex Ln2(OH)5(1,4-bdc)35− with three terephthalate ligands, and in the zone of transformation of this complex into a dissociate with two terephthalate ligands, where, in addition, the luminescence is quenched by formation of lanthanide hydroxo complexes, it abruptly decreases. The assumption of different stoichiometry of complexes either does not agree with the results of luminescence spectroscopy of solutions or leads to one or more thermodynamically unfavorable transformations of complexes. Thus, the equilibrium model in the solutions contained 1,4-benzene-dicarboxylic acid and the following ions Nd3+-Eu3+ and Tb3+-Ho3+ in a 1:2 metal-to-ligand ratio and can be described by the following chain of transformations:
Ln2Hy(1,4-bdc)4y−2 ↔ Ln2(1,4-bdc)42− ↔ Ln2(OH)2(1,4-bdc)44−↔ 2LnOH2+ ↔ Ln2(OH)4(1,4-bdc)46−↔ 2Ln(OH)2+ ↔ Ln2(OH)5(1,4-bdc)35− ↔ Ln2(OH)6(1,4-bdc)24−↔ 2Ln(OH)3, y = 2, 1.
3.5. The Summary of the Stability Constants
The values of the obtained stability constants are graphically shown in Figure 11. Discussing the stability constants of the complexes inherent in all REE ions—Ln2H2(1,4-bdc)4 and Ln2(OH)6(1,4-bdc)24−—one can observe their non-monotonous variation. The minimum value of the logarithm of the stability constants corresponds to gadolinium-containing complexes. Such dependence of some properties of REE compounds on a nuclear charge of REE is quite specific for these compounds so-called the “gadolinium break” [50,51]. Yatsimirsky and coworkers [23] explained this effect in terms of crystal field theory and ligand field theory. According to these theories, stabilization of complexes by ligand field is maximal in the case of filling of the bonding molecular orbitals and is minimal in the case of filling of the antibonding molecular orbitals. The most complete filling of bonding molecular orbitals is realized for elements with f3–f4 and f10–f11 electronic configurations, i.e., for Nd3+, Pm3+, Ho3+, and Er3+ ions. The most complete filling of antibonding molecular orbitals is realized for elements with f7 and f14 electronic configurations, i.e., for Gd3+ and Lu3+, and the filling does not take place for elements with f0 electronic configurations, i.e., for La3+. Due to this circumstance, the dependences of some properties of REE compounds appear as a two-humped curve with a local minimum on gadolinium. Following such an explanation, it is possible to conclude that the participation of f-electrons in binding between lanthanide ion and terephthalate ligands affects the stability of the complex. This can be seen not only in the example of Ln2H2(1,4-bdc)4 and Ln2(OH)6(1,4-bdc)24− complexes. One can note that among the pairs of complexes with the same deprotonation degree, i.e., Ln2(1,4-bdc)42− and Ln2(1,4-bdc)3, Ln2(OH)2(1,4-bdc)44− and Ln2(OH)2(1,4-bdc)32−, Ln2(OH)4(1,4-bdc)46− and Ln2(OH)4(1,4-bdc)34−, and Ln2(OH)5(1,4-bdc)35− and Ln2(OH)5(1,4-bdc)23−, the complexes with fewer number of ligands are formed in general by REE ions with f0–f2, f7, and f12–f14 electronic configurations, i.e., La3+-Pr3+, Gd3+, and Tm3+-Lu3+. The complexes with a greater number of ligands are formed mainly by REE ions with f3–f6 and f8–f11 electronic configurations, i.e., Nd3+-Eu3+, and Tb3+-Er3+. So, the REE ions possessing the ability for f-electrons to participate in binding between metal ions and terephthalate ligands can hold a larger number of negatively charged ligands in the electric field of lanthanide cation than complexes without such ability or destabilizing this binding. The countering of ligands to shielding is greater when the metal–ligand bond is additionally stabilized by the contribution of f electrons to it.
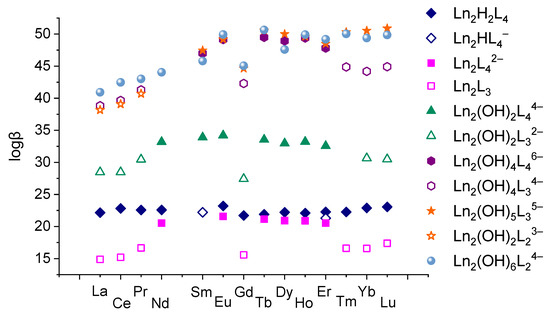
Figure 11.
The values of stability constants of complexes formed by 1,4-benzene-dicarboxylic acid and different lanthanides ions in aqueous solution with 1:2 metal-to-ligand ratio.
Based on the obtained values of the stability constant of complexes, we estimated the denticity of terephthalate ligands in complexes and their consequent structure. In an acidic environment at 1.5 < f < 2, all lanthanide ions except samarium(III) form Ln2H2(1,4-bdc)4 complexes, samarium(III) forms Sm2H(1,4-bdc)4−, and erbium(III) forms both Er2H2(1,4-bdc)4 and Er2H(1,4-bdc)4− complexes. If we assume that only dissociated carboxylate groups are involved in coordination, the stability constant of these complexes per one carboxylate group will have an increased value of 3.6–3.8 log units. Most likely, the dimer contains seven or even eight coordination bonds, some of which are formed by undissociated acidic groups. Then, the value of the stability constant of the complex per one acidic group is more typical and amounts to 2.7–3.4 log units. Describing the equilibrium in terms of oligomers, the same condition will be fulfilled if the oligomer contains an average of three and a half to four coordination bonds per one metal center. The formation of a dimer with four bridging bonds is possible only on the basis of monomers with closely coordinated ligands, provided that the monomers are oriented appropriately toward each other—Figure 12a. The inter-ligand repulsion in such monomers is greater than in monomers with oppositely directed ligands—Figure 12b. The formation of the latter is more energetically favorable, and their accumulation should be more intense. Dimerization of monomers with oppositely directed ligands can lead to the formation of a maximum of two bridging bonds, but the terminal position of the ligands will promote the growth of an oligomeric chain. With an increasing number of chain links, the average number of coordinated functional groups per lanthanide ion will tend to be four. For example, in the tetramer shown in Figure 12b, the average number of coordinated acidic groups is three and a half. Thus, for 1:2 stoichiometry complexes, there are several ways to saturate the denticity of terephthalate ligands in both oligomers and dimers.
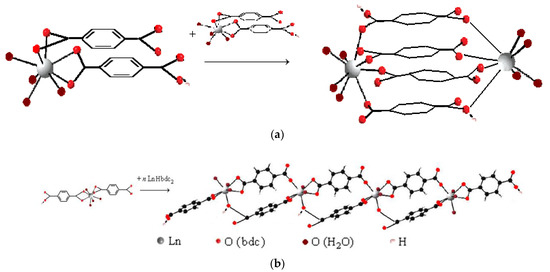
Figure 12.
Available structures of the terephthalate complexes of lanthanide ions formed in solution with 1:2 metal-to-ligand ratio: (a)—the dimer with some features of Ln2(1,4-bdc)3(H2O)4 solid-state structure and (b)—the tetramer with some features of Ln2(1,4-bdc)3(H2O)8·2H2O solid-state structure.
In Figure 12a the structure of the dimer repeats the fragment of the structure of the solid polymer with the formula Ln2(1,4-bdc)3(H2O)4, and the structure of the oligomer in Figure 12b is a fragment of the structure of the solid polymer with the formula Ln2(1,4-bdc)3(H2O)8·2H2O. Since the stoichiometry of bis-complexes is close to the stoichiometry of solid polymer structures, on the basis of such complexes as those shown in Figure 12, solid-state seeds can be directly formed. Mathematical modeling does not allow for predicting the dominant structure of complexes in the solution. However, it is reasonable to note that the number of formula units in complexes formed in dilute solutions cannot be too large. The complex with the smallest number of formula units, including terephthalate ligands with completely saturated denticity, is a dimer with four parallel bridging ligands (Figure 12a). Therefore, crystallization of the polymer with the formula Ln2(1,4-bdc)3(H2O)4 is most available from a dilute solution.
4. Conclusions
In summary, this study provides a comprehensive investigation into the complex formation between lanthanide(III) ions and 1,4-benzene-dicarboxylic acid in aqueous solutions across a wide pH range and two metal-to-ligand ratios. The novelty lies in the detailed determination of relative abundances, stability constants, denticities, and structural features of the complexes, offering new insights into their formation and behavior. Complexation initiates in slightly acidic conditions (pH~4–4.5), with bis-complexes dominating in systems with a 1:2 metal-to-ligand ratio and tetra-complexes forming in systems with a 1:8 ratio due to ligand excess. The dimeric or oligomeric nature of these complexes, caused by the terephthalate ligand’s tendency to maximize denticity, highlights their structural diversity. Notably, ytterbium(III) and lutetium(III) complexes exhibit exceptional stability in ligand-rich environments, attributed to the involvement of their 5d vacant orbitals in strengthening coordination bonds. Conversely, in 1:2 systems, weaker metal center shielding leads to the dissociation of water molecules and the formation of hetero-ligand hydroxo complexes. The study also reveals that the structural motifs of these solution-phase complexes resemble those of solid-state polymers, with dimeric forms resembling Ln2(1,4-bdc)3(H2O)4 being the most likely products of crystallization from dilute solutions. These findings underscore the importance of ligand denticity and metal–ligand interactions in stabilizing lanthanide complexes, providing a foundation for advanced materials design possessing tailored luminescent or catalytic properties.
Supplementary Materials
The following supporting information can be downloaded at: https://www.mdpi.com/article/10.3390/chemistry7020057/s1, Figure S1: The calculated molar fractions of components (a) and corresponding calculated and experimental curves of titration (pH depended on f, degree of titration) (b) for system consisting of 0.155 mM H2(1,4-bdc) and 0.0194 mM La3+; Figure S2: The calculated molar fractions of components (a) and corresponding calculated and experimental curves of titration (pH depended on f, degree of titration) (b) for system consisting of 0.155 mM H2(1,4-bdc) and 0.0194 mM Ce3+; Figure S3: The calculated molar fractions of components (a) and corresponding calculated and experimental curves of titration (pH depended on f, degree of titration) (b) for system consisting of 0.155 mM H2(1,4-bdc) and 0.0194 mM Pr3+; Figure S4: The calculated molar fractions of components (a) and corresponding calculated and experimental curves of titration (pH depended on f, degree of titration) (b) for system consisting of 0.155 mM H2(1,4-bdc) and 0.0194 mM Nd3+; Figure S5: The calculated molar fractions of components (a) and corresponding calculated and experimental curves of titration (pH depended on f, degree of titration) (b) for system consisting of 0.155 mM H2(1,4-bdc) and 0.0194 mM Sm3+; Figure S6: The calculated molar fractions of components (a) and corresponding calculated and experimental curves of titration (pH depended on f, degree of titration) (b) for system consisting of 0.155 mM H2(1,4-bdc) and 0.0194 mM Eu3+; Figure S7: The calculated molar fractions of components (a) and corresponding calculated and experimental curves of titration (pH depended on f, degree of titration) (b) for system consisting of 0.155 mM H2(1,4-bdc) and 0.0194 mM Gd3+; Figure S8: The calculated molar fractions of components (a) and corresponding calculated and experimental curves of titration (pH depended on f, degree of titration) (b) for system consisting of 0.155 mM H2(1,4-bdc) and 0.0194 mM Tb3+; Figure S9: The calculated molar fractions of components (a) and corresponding calculated and experimental curves of titration (pH depended on f, degree of titration) (b) for system consisting of 0.155 mM H2(1,4-bdc) and 0.0194 mM Dy3+; Figure S10: The calculated molar fractions of components (a) and corresponding calculated and experimental curves of titration (pH depended on f, degree of titration) (b) for system consisting of 0.155 mM H2(1,4-bdc) and 0.0194 mM Ho3+; Figure S11: The calculated molar fractions of components (a) and corresponding calculated and experimental curves of titration (pH depended on f, degree of titration) (b) for system consisting of 0.155 mM H2(1,4-bdc) and 0.0194 mM Er3+; Figure S12: The calculated molar fractions of components (a) and corresponding calculated and experimental curves of titration (pH depended on f, degree of titration) (b) for system consisting of 0.155 mM H2(1,4-bdc) and 0.0194 mM Tm3+; Figure S13: The calculated molar fractions of components (a) and corresponding calculated and experimental curves of titration (pH depended on f, degree of titration) (b) for system consisting of 0.155 mM H2(1,4-bdc) and 0.0194 mM Yb3+; Figure S14: The calculated molar fractions of components (a) and corresponding calculated and experimental curves of titration (pH depended on f, degree of titration) (b) for system consisting of 0.155 mM H2(1,4-bdc) and 0.0194 mM Lu3+; Figure S15: The calculated molar fractions of components (a) and corresponding calculated and experimental curves of titration (pH depended on f, degree of titration) (b) for system consisting of 0.150 mM H2(1,4-bdc) and 0.075 mM La3+; Figure S16: The calculated molar fractions of components (a) and corresponding calculated and experimental curves of titration (pH depended on f, degree of titration) (b) for system consisting of 0.150 mM H2(1,4-bdc) and 0.075 mM Ce3+; Figure S17: The calculated molar fractions of components (a) and corresponding calculated and experimental curves of titration (pH depended on f, degree of titration) (b) for system consisting of 0.150 mM H2(1,4-bdc) and 0.075 mM Pr3+; Figure S18: The calculated molar fractions of components (a) and corresponding calculated and experimental curves of titration (pH depended on f, degree of titration) (b) for system consisting of 0.150 mM H2(1,4-bdc) and 0.075 mM Nd3+; Figure S19: The calculated molar fractions of components (a) and corresponding calculated and experimental curves of titration (pH depended on f, degree of titration) (b) for system consisting of 0.150 mM H2(1,4-bdc) and 0.075 mM Sm3+; Figure S20: The calculated molar fractions of components (a) and corresponding calculated and experimental curves of titration (pH depended on f, degree of titration) (b) for system consisting of 0.150 mM H2(1,4-bdc) and 0.075 mM Eu3+; Figure S21: The calculated molar fractions of components (a) and corresponding calculated and experimental curves of titration (pH depended on f, degree of titration) (b) for system consisting of 0.150 mM H2(1,4-bdc) and 0.075 mM Gd3+; Figure S22: The calculated molar fractions of components (a) and corresponding calculated and experimental curves of titration (pH depended on f, degree of titration) (b) for system consisting of 0.150 mM H2(1,4-bdc) and 0.075 mM Tb3+; Figure S23: The calculated molar fractions of components (a) and corresponding calculated and experimental curves of titration (pH depended on f, degree of titration) (b) for system consisting of 0.150 mM H2(1,4-bdc) and 0.075 mM Dy3+; Figure S24: The calculated molar fractions of components (a) and corresponding calculated and experimental curves of titration (pH depended on f, degree of titration) (b) for system consisting of 0.150 mM H2(1,4-bdc) and 0.075 mM Ho3+; Figure S25: The calculated molar fractions of components (a) and corresponding calculated and experimental curves of titration (pH depended on f, degree of titration) (b) for system consisting of 0.150 mM H2(1,4-bdc) and 0.075 mM Er3+; Figure S26: The calculated molar fractions of components (a) and corresponding calculated and experimental curves of titration (pH depended on f, degree of titration) (b) for system consisting of 0.150 mM H2(1,4-bdc) and 0.075 mM Tm3+; Figure S27: The calculated molar fractions of components (a) and corresponding calculated and experimental curves of titration (pH depended on f, degree of titration) (b) for system consisting of 0.150 mM H2(1,4-bdc) and 0.075 mM Yb3+; Figure S28: The calculated molar fractions of components (a) and corresponding calculated and experimental curves of titration (pH depended on f, degree of titration) (b) for system consisting of 0.150 mM H2(1,4-bdc) and 0.075 mM Lu3+.
Author Contributions
Conceptualization, A.S.M., P.B.G. and A.R.B.; methodology, A.S.M., P.B.G. and A.R.B.; validation, O.S.B., S.N.O. and M.N.R.; formal analysis, A.S.M., P.B.G. and O.S.B.; investigation, A.S.M., P.B.G., A.R.B., O.S.B. and Y.N.T.; resources, A.S.M., M.Y.S. and N.A.B.; data curation, A.S.M., P.B.G., A.R.B. and O.S.B.; writing—original draft preparation, A.S.M. and P.B.G.; writing—review and editing, M.Y.S., N.A.B., P.B.G. and A.S.M.; visualization, A.S.M. and P.B.G.; supervision, A.S.M.; project administration, A.S.M.; funding acquisition, A.S.M. All authors have read and agreed to the published version of the manuscript.
Funding
This research was funded by the Russian Science Foundation under grant no. 22-73-10040 (https://rscf.ru/en/project/22-73-10040/, accessed on 10 February 2025).
Data Availability Statement
The original contributions presented in this study are included in the article (and Supplementary Materials); further inquiries can be directed to the corresponding authors.
Acknowledgments
The measurements were performed in the Research Park of Saint-Petersburg State University (Magnetic Resonance Research Center, Chemical Analysis and Materials Research Center, Cryogenic Department, Interdisciplinary Resource Center for Nanotechnology, Center for X-ray Diffraction Studies, Center for Optical and Laser Materials Research, Thermogravimetric and Calorimetric Research Center, and Center for Innovative Technologies of Composite Nanomaterials).
Conflicts of Interest
The authors declare no conflicts of interest.
Abbreviations
The following abbreviations are used in this manuscript:
| MOF | Metal–organic framework |
| LED | Light emitting diod |
| REE | Rare-earth elements |
| 1,4-bdc | 1,4-benzene-dicarboxylic acid |
References
- Ning, X.; Chang, Y.; Zhou, Q.; Ding, S.; Gao, F. An Overview of the Design of Metal-Organic Frameworks-Based Fluorescent Chemosensors and Biosensors. Biosensors 2022, 12, 928. [Google Scholar] [CrossRef] [PubMed]
- Khairy, G.M.; Goda, R.M.; Anwar, Z.M.; Aboelngab, M.M.; Duerkop, A. Luminescent and time-resolved determination of gemifloxacin mesylate in pharmaceutical formulations and spiked blood plasma samples using a lanthanide complex as a probe. Anal. Methods 2024, 16, 2556–2568. [Google Scholar] [CrossRef] [PubMed]
- Barkanov, A.; Zakharova, A.; Vlasova, T.; Barkanova, E.; Khomyakov, A.; Avetissov, I.; Taydakov, I.; Datskevich, N.; Goncharenko, V.; Avetisov, R. NIR-OLED structures based on lanthanide coordination compounds: Synthesis and luminescent properties. J. Mater. Sci. 2022, 57, 8393–8405. [Google Scholar] [CrossRef]
- Zhang, Q.; O’Brien, S.; Grimm, J. Biomedical Applications of Lanthanide Nanomaterials, for Imaging, Sensing and Therapy. Nanotheranostics 2022, 6, 184–194. [Google Scholar] [CrossRef]
- Friedrich, S.; Sieber, C.; Drobot, B.; Tsushima, S.; Schmeide, K.; Stumpf, T.; Kretzschmar, J. Eu(III) and Cm(III) Complexation by the Aminocarboxylates NTA, EDTA, and EGTA Studied with NMR, TRLFS, and ITC—An Improved Approach to MoreRobust Thermodynamics. Molecules 2023, 28, 4881. [Google Scholar] [CrossRef]
- Heller, A.; Senwitz, C.; Foerstendorf, H.; Drobot, B.; Kretzschmar, J. Europium(III) Meets Etidronic Acid (HEDP): A Coordination Study Combining Spectroscopic, Spectrometric, and Quantum Chemical Methods. Molecules 2023, 28, 4469. [Google Scholar] [CrossRef]
- Gamov, G.A.; Zavalishin, M.N.; Pimenov, O.A.; Klochkov, V.V.; Khodov, I.A. La(III), Ce(III), Gd(III), and Eu(III) Complexation with Tris(hydroxymethyl)aminomethane in Aqueous Solution. Inorg. Chem. 2020, 59, 17783–17793. [Google Scholar] [CrossRef]
- Lytkin, A.I.; Chernikov, V.V.; Krutova, O.N.; Krutov, P.D. Thermodynamics of Complexation Reactions of Nd3+ and Eu3+ Ions with Glycyl-DL-Alanine, Glycyl-DL-Leucine, and Glycyl-DL Tyrosine in Aqueous Solution in the pH Range pH 1.6–7.5. Russ. J. Inorg. Chem. 2019, 64, 1451–1455. [Google Scholar] [CrossRef]
- Lytkin, A.I.; Krutova, O.N.; Chernikov, V.V.; Krutov, P.D.; Mokhova, Y.V. Thermodynamics of the Complexation of Nd3+, Eu3+, Gd3+, and Yb3+ Ions with Glycyl-Glycyl-Glycine in Aqueous Solutions in the pH Range 1.8–7.6. Russ. J. Phys. Chem. 2022, 96, 738–742. [Google Scholar] [CrossRef]
- Sheta, S.M.; Hamouda, M.A.; Ali, O.I.; Kandil, A.T.; Sheha, R.R.; El-Sheikh, S.M. Recent progress in high-performance environmental impacts of the removal of radionuclides from wastewater based on metal– organic frameworks: A review. R. Soc. Chem. Adv. 2023, 13, 25182–25208. [Google Scholar] [CrossRef]
- Weissman, S. Intramolecular energy transfer: The fluorescence of complexes of europium. J. Chem. Phys. 1942, 10, 214–217. [Google Scholar] [CrossRef]
- Daiguebonne, C.; Kerbellec, N.; Bernot, K.; Gérault, Y.; Deluzet, A.; Guillou, O. Synthesis, crystal structure, and porosity estimation of hydrated erbium terephthalate coordination polymers. Inorg. Chem. 2006, 45, 5399–5406. [Google Scholar] [CrossRef] [PubMed]
- Zehnder, R.; Renn, R.; Pippin, E.; Zeller, M.; Wheeler, K.; Carr, J.; Fontaine, N.; McMullen, N. Network dimensionality and ligand flexibility in lanthanide terephthalate hydrates. J. Mol. Struct. 2011, 985, 109–119. [Google Scholar] [CrossRef]
- Toikka, Y.; Badikov, A.; Bogachev, N.; Kolesnikov, I.; Skripkin, M.; Orlov, S.; Mereshchenko, A. Luminescent properties and thermal stability of (Lu0.98Eu0.02)2bdc3·10H2O metal–organic frameworks. Mend. Comm. 2024, 34, 634–636. [Google Scholar] [CrossRef]
- Feng, S. Poly[hexaaquabis(μ3-terephthalato)(μ2-terephthalato)diytterbium(III)]. Acta Cryst. 2010, 66, m33. [Google Scholar] [CrossRef]
- Daiguebonne, C.; Kerbellec, N.; Guillou, O.; Bünzli, J.-C.; Gumy, F.; Catala, L.; Mallah, T.; Audebrand, N.; Gérault, Y.; Bernot, K.; et al. Structural and luminescent properties of micro- and nanosized particles of lanthanide terephthalate coordination polymers. Inorg. Chem. 2008, 47, 3700–3708. [Google Scholar] [CrossRef]
- Reineke, T.; Eddaoudi, M.; Fehr, M.; Kelley, D.; Yaghi, O. From condensed lanthanide coordination solids to microporous frameworks having accessible metal sites. J. Am. Chem. Soc. 1999, 121, 1651–1657. [Google Scholar] [CrossRef]
- Nosov, V.; Toikka, Y.; Petrova, A.; Butorlin, O.; Kolesnikov, I.; Orlov, S.; Ryazantsev, M.; Kolesnik, S.; Bogachev, N.; Skripkin, M.; et al. Brightly luminescent (TbxLu1−x)2bdc3·nH2O MOFs: Effect of synthesis conditions on structure and luminescent properties. Molecules 2023, 28, 2378. [Google Scholar] [CrossRef]
- Janicki, R.; Mondry, A.; Starynowicz, P. Carboxylates of rare earth elements. Coord. Chem. Rev. 2017, 340, 98–133. [Google Scholar] [CrossRef]
- Makushova, G.N.; Voronshchikova, E.E. Complexation of Rare-earth elements with o-phthalic acid in aqueous solutions. Izv. Saratov Univ. Chem. Biol. Ecol. 2008, 8, 16–19. [Google Scholar]
- Stagg, W.R.; Andrews, B.L. Lanthanide Complexes with Phthalate Ligand. In Proceedings of the Tenth Rare Earth Research Conference, Carefree, AZ, USA, 30 April–3 May 1973; Volume 1, p. 342. [Google Scholar]
- Munshiyeva, M.K.; Usubaliyev, B.T.; Aliyeva, F.B.; Mamedova, S.R.; Jalaladdinov, F.F. Complexes of rare earth metals with 1,2-benzenedicarboxylic (o-phthalic) acid. Azerbaijan Chem. J. 2016, 3, 130–139. [Google Scholar]
- Yatsimirsky, K.B.; Kostromina, N.A.; Sheka, Z.A.; Davidenko, N.K.; Kriss, E.E.; Ermolenko, E.I. Chemistry of Complex Compounds of Rare-Earth Elements; Naukova dumka: Kyev, Ukraine, 1966; pp. 1–494. [Google Scholar]
- Mishustin, A.I. Estimate of the stability constants of trivalent actinide and lanthanide complexes with O-donor ligands in aqueous solutions. Russ. J. Inorg. Chem. 2010, 55, 800–807. [Google Scholar] [CrossRef]
- Wood, S.A. The aqueous geochemistry of the rare-earth elements: Critical stability constants for complexes with simple carboxylic acids at 25 °C and 1 bar and their application to nuclear waste management. Eng. Geol. 1993, 34, 229–259. [Google Scholar] [CrossRef]
- Kumar, S. Luminescence Studies of Eu3+ and UO22+ Complexes with Aromatic Carboxylic Acids in Acetonitrile Medium. Ph.D. Thesis, Indira Gandhi Centre for Atomic Research, Kalpakkam, India, 2016. [Google Scholar]
- Yun, S.; Kang, S.; Yun, S. Thermodynamics of complexation of lanthanides by some benzoic acid derivatives in aqueous solution. Thermochim. Acta 1999, 331, 13–19. [Google Scholar] [CrossRef]
- Moreau, P.; Colette-Maatouk, S.; Vitorge, P.; Gareil, P.; Reiller, P.E. Complexation of europium(III) by hydroxybenzoic acids: A time-resolved luminescence spectroscopy study. Inorganica Chim. Acta 2015, 432, 81–88. [Google Scholar] [CrossRef]
- Zheng, Y.-Z.; Speldrich, M.; Kogerler, P.; Chen, X.-M. The role of p–p stacking in stabilizing a,a-trans-cyclohexane-1,4 dicarboxylate in a 2D Co(II) network. CrystEngComm 2010, 12, 1057–1059. [Google Scholar] [CrossRef]
- Hudson, K.L.; Bartlett, G.J.; Diehl, R.C.; Agirre, J.; Gallagher, T.; Kiessling, L.L.; Woolfson, D.N. Carbohydrate−Aromatic Interactions in Proteins. J. Am. Chem. Soc. 2015, 137, 15152–15160. [Google Scholar] [CrossRef]
- Sonesson, A. On the Complex Chemistry of the Tervalent Rare Earth Ions. I. The Acetate Systems of Lanthanum, Cerium, Neodymium, and Gadolinium. Acta Chem. Scand. 1958, 12, 165–181. [Google Scholar] [CrossRef]
- Ermolenko, V.I. The oxibenzoates of neodymium. Russ. J. Inorg. Chem. 1964, 9, 48–55. [Google Scholar]
- Kereichuk, A.S.; Paramonova, V.I. The investigation of the complexation of europium(III) with oxalate ion by ion exchange method. Sov. Radiochem. 1963, 5, 464–473. [Google Scholar]
- Rudat, J. Enzymatische Decarboxylierung von Benzenpolycarbonsauren. Ph.D. Thesis, Rheinischen Friedrich-Wilhelms-Universitat Bonn, Bonn, Germany, 2006. [Google Scholar]
- Saitov, Y.E.; Guseva, P.B.; Toikka, Y.N.; Bogachev, N.A.; Skripkin, M.Y.; Mereshchenko, A.S. Complexation of Europium(III) and Terbium(III) Ions with Terephthalic Acid in Aqueous Solutions. Russ. J. Gen. Chem. 2024, 94, 591–599. [Google Scholar] [CrossRef]
- Merny, S.A.; Konyaev, D.S.; Kholin, Y.V. CLINP 2.1, Program for Robast Parametric Identification of Complexation Models, Chemical Faculty; V. N. Karazin Kharkov National University: Kharkov, Ukraine, 1999. [Google Scholar]
- Peppard, D.F.; Mason, G.V.; Hucher, T. Stability constants of certain lanthanide(III) and actinide(III) chloride and nitrate complexes. J. Inorg. Nucl. Chem. 1962, 24, 881–888. [Google Scholar] [CrossRef]
- Jordan, N.; Thoenen, T.; Starke, S.; Spahiu, K.; Brendler, V. A critical review of the solution chemistry, solubility, and thermodynamics of europium: Recent advances on the Eu3+ aqua ion and the Eu(III) aqueous complexes and solid phases with the sulphate, chloride, and phosphate inorganic ligands. Coord. Chem. Rev. 2023, 473, 214608. [Google Scholar] [CrossRef]
- Utochnikova, V.V.; Grishko, A.Y.; Koshelev, D.S.; Averin, A.A.; Lepnev, L.S.; Kuzmina, N.P. Lanthanide heterometallic terephthalates: Concentration quenching and the principles of the “multiphotonic emission”. Opt. Mater. 2017, 74, 201. [Google Scholar] [CrossRef]
- Binnemans, K. Interpretation of europium(III) spectra. Coord. Chem. Rev. 2015, 295, 1–45. [Google Scholar] [CrossRef]
- Utochnikova, V.V.; Kuzmina, N.P. Photoluminescence of lanthanide aromatic carboxylates. Russ. J. Coord. Chem. 2016, 42, 679–694. [Google Scholar] [CrossRef]
- Kalusniak, S.; Castellano-Hernández, E.; Yalçinŏglu, H.; Tanaka, H.; Kränkel, C. Spectroscopic properties of Tb3+ as an ion for visible lasers. Appl. Phys. B 2022, 128, 33. [Google Scholar] [CrossRef]
- Yakubovich, Y.Y.; Alekseev, V.G. Hydrolysis Constants of Tervalent Lanthanum and Lanthanides Ions in 0.1M KNO3 Solution. Russ. J. Inorg. Chem. 2012, 57, 984–988. [Google Scholar] [CrossRef]
- Stepanchikova, S.A.; Biteikina, R.P.; Shironosova, G.P.; Kolonin, G.P. An Experimental Study of Hydroxo Complex Formation in Basic and Near-Neutral Solutions of Rare-Earth Elements and Yttrium at 25 °C. Russ. Geol. Geophys. 2014, 55, 1188–1193. [Google Scholar] [CrossRef]
- Nazarenko, V.A.; Antonovich, V.P.; Nevskaya, E.M. Metal Ions Hydrolysis in Diluted Solutions; Atomizdat: Moscow, Russia, 1979; pp. 1–192. [Google Scholar]
- Nayan, R.; Dey, A.K. Protonated, hydroxo, and mixed protonated-hydroxo species in metal-ligand equilibria: Complexes of thorium(IV) with xylenol orange in aqueous solution solution. Transit. Metal. Chem. 1977, 2, 110–116. [Google Scholar] [CrossRef]
- Brown, C. Ekberg. Hydrolysis of Metal Ions; Wiley-VCH: Weinheim, Germany, 2016; pp. 1–917. [Google Scholar]
- Baes, C.F.; Mesmer, R.E. The Hydrolysis of Cations; Wiley: New York, NY, USA, 1976. [Google Scholar]
- Bandurkin, G.A.; Dzhurinsky, B.F.; Tananaev, I.V. About f-degeneracy in a series of rare-earth elements. Dokl. Chem. 1969, 189, 94–95. [Google Scholar]
- Demakov, P.A.; Sapchenko, S.A.; Samsonenko, D.G.; Dybtsev, D.N.; Fedin, V.P. Gadolinium break in a series of three-dimentional trans-1,4-cyclohexane dicarboxilates of rare earth elements. Rus. J. Struct. Chem. 2019, 60, 815–822. [Google Scholar] [CrossRef]
- Persson, I.; Angelo, P.D.; De Panfilis, S.; Sandstrçm, M.; Eriksson, L. Hydration of Lanthanoid(III) Ions in Aqueous Solution and Crystalline Hydrates Studied by EXAFS Spectroscopy and Crystallography: The Myth of the “Gadolinium Break”. Chem. Eur. J. 2008, 14, 3056–3066. [Google Scholar] [CrossRef] [PubMed]


Disclaimer/Publisher’s Note: The statements, opinions and data contained in all publications are solely those of the individual author(s) and contributor(s) and not of MDPI and/or the editor(s). MDPI and/or the editor(s) disclaim responsibility for any injury to people or property resulting from any ideas, methods, instructions or products referred to in the content. |
© 2025 by the authors. Licensee MDPI, Basel, Switzerland. This article is an open access article distributed under the terms and conditions of the Creative Commons Attribution (CC BY) license (https://creativecommons.org/licenses/by/4.0/).