Abstract
This study aims to evaluate the therapeutic potential of phloretin–chitosan nanoparticles (Ph-ChNPs), alone and in combination with the anticancer drug tamoxifen, in modulating breast cancer markers and improving in vivo treatment outcomes. Ph-ChNPs were prepared by ionic gelation in the presence of Tripolyphosphate (TPP) solution as a crosslinker agent. The nanoparticles were characterized using DLS, TEM, UV-VIS and FT-IR spectroscopy. In vitro cytotoxic assay of Ph-ChNPs on MCF-7 breast cancer cell lines revealed anticancer activity with an IC50 value of 32.12 ± 1.63 µg/mL. In vivo studies were carried out on mice, treated with DMBA to induce breast cancer and followed the effect of the prepared nanoparticle, either alone or with combination with tamoxifen, on mice health. The biochemical parameters measured after treatment with Ph-ChNPs alone showed an improvement in lipid profile with decreased total cholesterol (TC) and Triglyceride (TG) levels and increased HDL-c levels. Ph-ChNPs significantly reduced IL-6 and cyclin D1 levels, with a slight increase in cyclin E2 levels. Antioxidant enzyme levels were improved, and oxidative stress markers were reduced. The combination treatment showed a synergistic effect in reducing inflammation and cell proliferation. DMBA-injected mice had substantially increased BRCA1 and BRCA2 gene expression. Ph-ChNP-treated mice showed well-organized mammary gland structures, while DMBA-injected mice displayed dense tumor cell aggregations. Ph-ChNPs and tamoxifen treatments improved histopathological variations, with the combination treatment showing significant apoptosis of tumor cells. This study demonstrates the significant potential of Ph-ChNPs combined with tamoxifen in breast cancer treatment. The combination therapy effectively reduces tumor growth, induces apoptosis and modulates critical breast cancer markers, offering a promising therapeutic strategy.
1. Introduction
Breast cancer has emerged as a global crisis, with the World Health Organization (WHO) reporting 670,000 deaths worldwide in 2022 alone [1]. This relentless disease continues to rise, affecting women globally. Despite significant medical advancements, many patients face uncertain futures, battling against time. The emotional and financial toll on survivors and their families is immeasurable [2]. For example, one study stated that the perceptions of female patients regarding the loss of their breasts were filled with contradictions, tension and uncertainties while negotiating the discrepancy between self, the body and societal expectations and perceptions of femininity and womanhood. The analysis found that cancer patients’ spouses were 14 percent more likely to seek treatment for psychological disorders than spouses of people without cancer. The researchers also analyzed instances of anxiety and substance abuse [3].
Chemotherapy can be administered before surgery (neoadjuvant chemotherapy) to shrink tumors, making them easier to remove, or after surgery (adjuvant chemotherapy) to eliminate any remaining cancer cells and reduce the risk of recurrence [4]. For advanced breast cancer that has spread to other parts of the body, chemotherapy can help control the disease, alleviate symptoms and improve quality of life [5]. The treatment is often used in combination with other therapies, such as surgery, radiation or hormone therapy, to enhance its effectiveness [6]. Despite its potential side effects, chemotherapy remains a vital tool in the fight against breast cancer, offering hope for better outcomes and longer survival [7].
Chemotherapy is a cornerstone in breast cancer treatment, but its effectiveness is often challenged by chemotherapy resistance in all breast cancer types. The resistance mechanisms were associated with tumor cell alteration, like altered membrane drug transport, altered DNA repair and altered apoptosis [8]. In acquired chemoresistance, a variety of cells is found in the tumor micro-environment (TME) including adipocytes, bone-marrow derived stem cells and several stromal cell like cancer-associated fibroblasts (CAFs) that receive blood by a vascular network. So, the TME contributes to progression, metastasis and drug resistance [9]. This phenomenon, known as tumor heterogeneity, means different cells within the same tumor can respond differently to treatment. As a result, chemotherapy’s effectiveness diminishes, leading to treatment failure and disease progression. A previous study discussed recent advances in strategies to target breast cancer stroma [10]. Researchers are continuously exploring new strategies to overcome this resistance [11]. These include developing new chemotherapeutic agents with lower susceptibility to resistance mechanisms and combining chemotherapy with targeted therapies to attack cancer cells more effectively [12]. Natural product nano formulations are emerging as effective chemosensitizers in the treatment of breast cancer [13]. These tiny agents enhance the effectiveness of chemotherapy by precisely targeting cancer cells. In mice, they have shown promise by reducing tumor size and improving survival rates [4]. This approach could transform cancer treatment, offering more effective and less toxic therapies.
Nanoparticle-loaded natural products are emerging as powerful chemosensitizers in the treatment of breast cancer [14]. These innovative formulations enhance the effectiveness of chemotherapy by targeting drug-resistant cancer cells and improving drug delivery [15]. Natural compounds like curcumin and quercetin, when combined with nanoparticles, show increased cytotoxicity against cancer cells while minimizing side effects [16]. This approach not only boosts the therapeutic response but also reduces the overall toxicity of conventional treatments [17].
Chitosan [(1 → 4)-2-amino-2-deoxy-D-glucan] is a linear polysaccharide. It is widely used in drug delivery systems as it can be extensively formulated. Chitosan demonstrates some vital aspects as hemostatic, anti-carcinogenic, anti-cholesterol, fungistatic and bacteriostatic. Chitosan nanoparticles are a good choice for drug delivery applications due to their many beneficial properties such as responsiveness to stimuli, muco-adhesion, surface modifiability and biodegradability [18]. Ionic gelation is a simple and mild method that is widely used for chitosan nanoparticle preparation. Nanoparticles are formed by means of electrostatic interactions between the positively charged amino groups (-NH3+) of chitosan and polyanions employed as crosslinkers like tripolyphosphate (TPP) (-P3O105−). Chitosan nanoparticle diameters depend on the ratio between chitosan and TPP. It was reported that nanoparticles with a minimum size (168 nm) were obtained by the lowest chitosan and TPP concentration of 0.5 mg/mL and with a maximum size (682 nm) were obtained with chitosan concentration of 4 mg/mL and TPP 1 mg/mL [19,20].
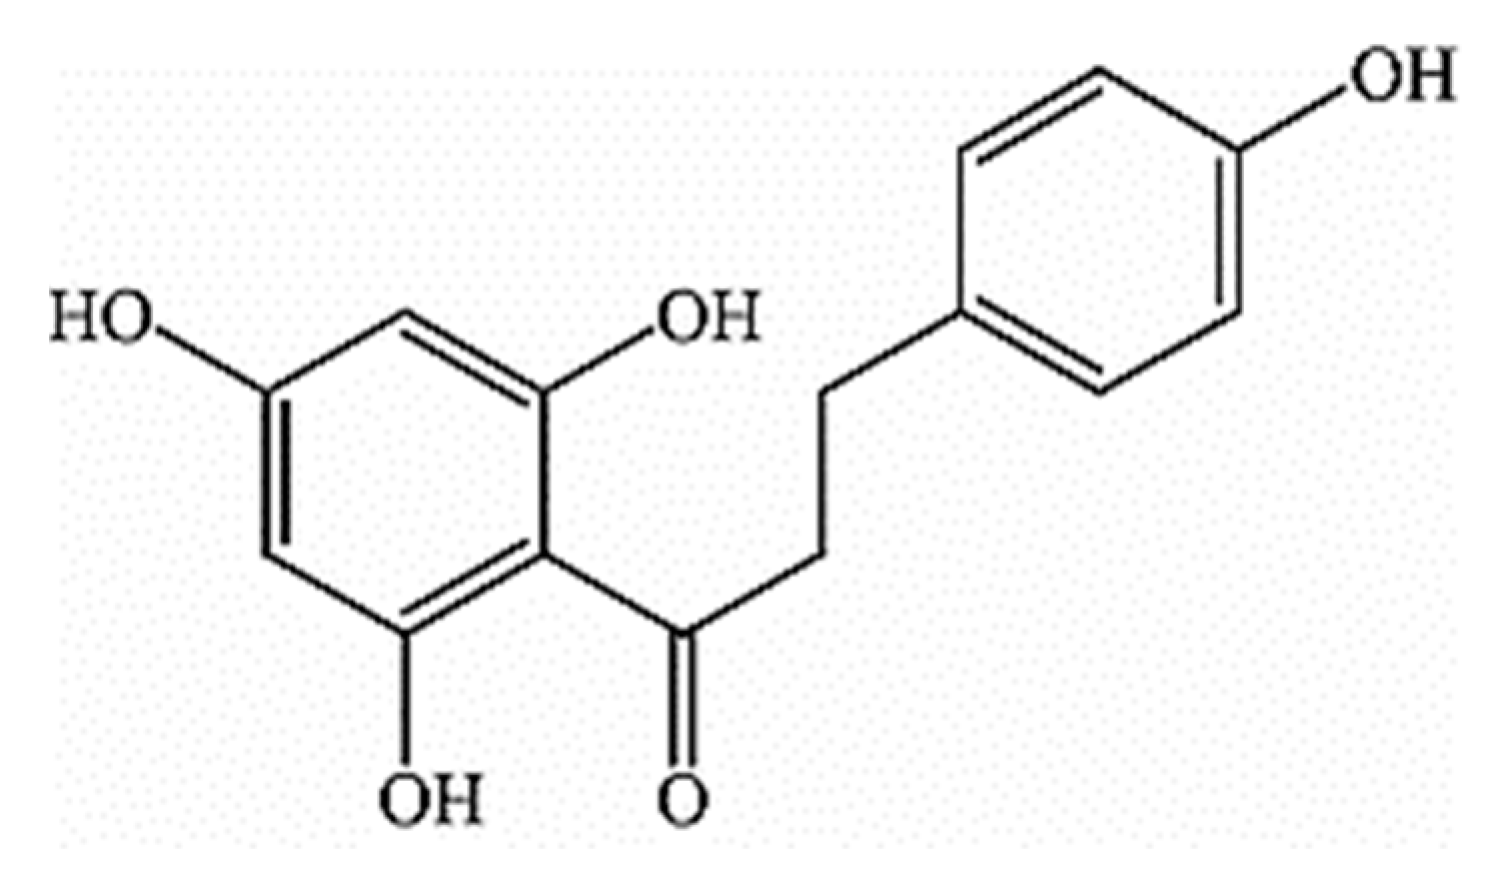
Phloretin “3-(4-Hydroxyphenyl)-1-(2,4,6-trihydroxyphenyl)propan-1-one” is a natural dihydrochalcone, as shown in Figure 1, found in various fruits and vegetables, particularly in apple tree leaves and Manchurian apricots [21].

Figure 1.
Chemical structure of phloretin [21].
It exhibits several therapeutic properties, including antioxidant, antidiabetic, anti-inflammatory and antitumor activities [22,23,24]. In cancer treatment, phloretin has shown potential as a chemosensitizer, enhancing the effectiveness of chemotherapy by targeting drug-resistant cancer cells and improving drug delivery [25]. This makes phloretin-loaded nanoparticles a promising approach for more effective and safer breast cancer therapies [26]. Several studies showed that mice treated with phloretin showed remarkable improvements in key biomarkers. Levels of IL-6, cyclin D1 and cyclin E2 were significantly reduced, indicating a powerful anti-inflammatory and anti-proliferative effect [27,28]. Additionally, the treatment increased Bax and decreased Bcl2, promoting apoptosis of cancer cells. Notably, NF-kβ and TNF-α levels were also reduced, highlighting phloretin’s potential to combat inflammation and tumor growth [29].
Phloretin, despite its promising anticancer properties, suffers from poor aqueous solubility and rapid metabolism, limiting its clinical application. To overcome these challenges, we encapsulated phloretin in chitosan nanoparticles (Ph-ChNPs), which enhance drug stability, improve bioavailability and enable targeted delivery to tumor tissues. Chitosan, a biocompatible and biodegradable polymer, facilitates controlled release and reduces off-target effects, making it an ideal carrier for phloretin. Building on the promising anti-inflammatory and antiproliferative effects of phloretin, our study delves into its chemo-sensitive potential [30]. The 7,12-dimethylbenz (a) anthracene (DMBA) with both carcinogenic and immunosuppressive effects is partly due to enhanced production of prostaglandin E2 (PGE2) and has been selected to induce breast tumors.
By examining Ph-ChNPs in DMBA-treated mice, we aim to uncover how this compound enhances the efficacy of tamoxifen. The reduction in key biomarkers like IL-6 and NF-kβ, coupled with increased apoptosis, suggests a synergistic effect [31]. This research could pave the way for more effective cancer treatments, combining natural compounds with established chemotherapeutic agents. Will Ph-ChNPs prove to be the missing link in cancer therapy?
2. Materials and Methodology
2.1. Materials
Phloretin (99%), span 80, ethanol, chloroform, potassium chloride, sodium chloride, potassium dihydrogen phosphate, folic acid, N-(3-dimethylaminopropyl)-N’-ethylcarbodiimide hydrochloride and phosphate buffer saline (PBS), washing buffer, blocking buffer, diluents buffer and substrate buffer all were purchased from Sigma-Aldrich, MA, (USA). Chitosan (Ch) (M.Wt. 14.2 × 10⁴ Da) was purchased from Shanghai Macklin Biochemical Co., Ltd. (Shanghai, China). Tween-80 was obtained from Jiangsu Fengyuan Biotechnology Co., Ltd. (Suqian, Jiangsu, China). MCF-7 cells were obtained from the National Cancer Institute, Cairo University, Cairo, Egypt. In a humidified cell culture incubator at 37 °C with 5% CO2, MCF-7 cells were cultured in RPMI-1640 media (RPM1) purchased from Gibco (Invitrogen Corp., Waltham, MA, USA) with 10% Fetal Bovine Serum (FBS) were procured from Sigma-Aldrich Massachusetts, USA.
2.2. Synthesis of Ph-ChNPs
Ph-ChNPs was prepared using the ionic gelation method [32], with some modifications. Sodium tripolyphosphate (TPP) (0.5 mg/mL) solution was prepared using distilled water. Chitosan (0.5 mg/mL) was prepared by dissolving it in a preheated 2% glacial acetic acid solution under magnetic stirring overnight at 450 rpm. The pH was adjusted to 4.7 using 20% (w/v) sodium hydroxide solution. The obtained chitosan solution was filtered through a 0.45 μm filter. A 10 mL of phloretin solution (3 mg/mL) in (polyethylene glycol: distilled water; 1:1) was prepared and added to 10 mL of the chitosan solution under magnetic stirring at 700 rpm for 15 min. Subsequently, 3 mL of sodium tripolyphosphate were added dropwise to the Ph-Ch solution as a crosslinking agent and stirred at 380 rpm for 1 h. The solution was then sonicated using ultrasonic homogenizer (Daihan SONIC-150, Korea). Next, 15 mL of the sample in polypropylene tube was maintained at 4 ± 1 °C in an ice bath; the sonication duration was 6 min (3 cycles × 2 min) with the mode of pulsed (5 s ON/2 s OFF) at 60% of max power (equivalent to ~180 W/cm²). The nanoparticles (NPs) were collected after centrifugation at 13,000 rpm for 20 min and lyophilized. Trehalose, as a cryoprotectant, was added to the optimized NP suspension at 2.5% w/v and lyophilized at −80 °C for 24 h. After maturing overnight at 4 °C, the obtained Ph-ChNPs were employed for characterization [33].
2.3. Entrapment Efficiency
The separation and determination of free (non-encapsulated) phloretin from the nanoparticle system was determined by using a cooling centrifuge (VS-18000M, Republic of Korea) at 14,000 rpm for 45 min at 4 °C. The free phloretin-containing supernatant was carefully removed without disturbing the sediment. The supernatant was then dissolved in a mixture of chloroform and methanol (40:60) using a vortex mixer. After mixing thoroughly, the amount of unbound phloretin was measured using a UV-VIS spectrophotometer (JENWAY 6405, UK) at 285 nm. All measurements were performed in triplicate. The following equation was used to calculate phloretin entrapment efficiency (EE %):
EE (%) = [(Total amount of phloretin − Free amount of phloretin)/Total amount of phloretin] × 100
2.4. Characterization of Ph-ChNPs
2.4.1. UV-VIS Absorption Spectra
The UV-VIS absorption spectra of Ph-ChNPs, free chitosan and free phloretin were measured using a double beam UV-VIS 2401PC spectrophotometer (Shimadzu, Kyoto, Japan) at 25 °C. Absorption spectra were read in the wavelength range of 200–900 nm range at 1.0 nm intervals [33].
2.4.2. Transmission Electron Microscope of Ph-ChNPs
Ph-ChNPs were subjected to TEM measurements utilizing High-Resolution Transmission Electron Microscopy 200 kv (HRTEM) (JEOL-2100, Tokyo, Japan). The images of the Ph-ChNPs were obtained by dropping a colloidal solution over a 400-mesh carbon-coated copper grid and letting the solvent evaporate at room temperature.
2.4.3. Particle Size and Zeta Potential of Ph-ChNPs
The average size, polydispersity index and zeta potential of Ph-ChNPs were determined using dynamic light scattering (DLS) with a Malvern Zetasizer (Malvern Instruments, Worcestershire, UK). Prior to measurements, a water dispersion was prepared by mixing 950 μL of water with 50 μL of nanoparticle suspension to achieve a total volume of 1 mL. Measurements were conducted at 25 °C.
2.4.4. Infrared Spectra (FTIR) of Ph-ChNPs
The FTIR spectra of phloretin and phloretin–chitosan nanoparticles were analyzed using an FTIR spectrometer FT/IR-4100 (A Basic Vector, Germany). Then, 30–40 mg of the phloretin and Ph-ChNPs samples was mixed with potassium iodide using pestle and mortar to obtain a fine powder, then placed in the 13 mm diameter die then pressed by hydraulic press to make pellets. The pellets were placed in the FTIR sample holder. The analysis was made in the region of 500–4000 cm−1 wave numbers at 4cm−1 resolution at 25 °C.
2.5. In Vitro Cytotoxicity on Cancer Cells
The MTT (3-[4,5-dimethylthiazol-2-yl]-2,5 diphenyl tetrazolium bromide) assay is based on the conversion of MTT into formazan crystals by living cells, which determines mitochondrial activity. Since for most cell populations, the total mitochondrial activity is related to the number of viable cells, this assay is used to measure the in vitro cytotoxic effects of the nanoparticles Ph-ChNPs on human breast cancer cell lines (MCF-7). The cancer cells (1 × 10⁵ cells/mL) were seeded on a 96-well tissue culture plates, 1 mL per well, with RPMI supplemented with 10% FBS and incubated at 37 °C for 48 h in 5% CO2 to achieve 70–80% confluence. Upon achieving confluence, the growth medium was removed, and the cell monolayer was washed twice with washing medium. The Ph-ChNP sample (200 μg/mL) was then serially diluted (100, 50, 25, 12.5, 6.25, 3.125, 0.78, 0.39, 0.19) μg/mL in RPMI medium containing 2% serum (maintenance medium). Each dilution (100 μL) was added to the wells. The plate was incubated at 37 °C for 48 h in 5% CO2. After incubation, 20 μL of MTT solution (5 mg/mL in PBS) was added per well and the plate was shaken at 150 rpm for 5 min to ensure mixing, followed by incubation for 4 h to allow MTT metabolism. The medium was then carefully removed, and formazan crystals were dissolved in 200 μL of DMSO. Optical density (OD) was measured at 560 nm (formazan signal) with background subtraction at 620 nm to account for nonspecific absorbance. The medium with cells without treatment was considered as a negative control (100%). Each concentration was assessed in triplicate and the mean value was computed [34,35]. The relative viability was calculated using the formula:
Relative viability (%) = [OD of the sample/OD of the control] × 100.
The IC50 value was determined by linear regression of the dose-response curve (concentration vs. % viability) using the equation:
where:
Y = M X + C
Y = % viability (mean of triplicates).
X = Ph-ChNPs concentration (µg/mL).
M = slope of the curve.
C = y-intercept.
The IC50 was derived by solving for X when Y = 50
IC50 = [50 − C]/M
Data were validated by logarithmic transformation (log10[Ph-ChNPs concentration]), yielding comparable results.
2.6. Estimation of the LD50 of Ph-ChNPs
2.6.1. Mouse Acclimation
A total of 96 mice (25 ± 3 g) were purchased from the National Cancer Institute. Of these, 60 mice were used to estimate the LD50 of Ph-ChNPs and 36 mice were used to evaluate the antitumor activities of Ph-ChNPs against breast carcinoma-bearing mice. The mice were housed individually in cages within an air-conditioned environment, maintained on a 12 h light/dark cycle (8:00 to 20:00), at a temperature of 22 ± 2 °C and a relative humidity of 60%. During the acclimation phase, each animal was provided with standard food ad-libitum. All experiments of animals were conducted according to the guidelines of Ethics Committee of the Faculty of Applied Health Sciences Technology, 6 October University, Egypt (approval number: 20250205).
2.6.2. LD50 Determination
The LD50 was evaluated using the method described by Abal et al. [36]. Six groups, each of 10 mice, received the test compounds orally at different doses. The number of animals that died within 24 h was recorded. The LD50 was then calculated using the following formula:
Dm = The dose that kills all the mice in the group.
Z = Half the sum of the dead mice from two successive groups.
d = The difference between two successive doses.
n = Number of animals in each group.
2.7. Biochemical Investigations
The animals were divided into six groups, each group has six mice, with three control groups and three treatment groups, as described in Table 1.

Table 1.
Treatment groups and dosages.
2.7.1. Plasma Metabolic Parameters Assays
On the 57th day, blood samples were collected from the retro-orbital venous plexus of ether-anesthetized mice (0.4 mL blood/mice) in heparin-containing tubes, centrifuged at 1000 rpm for 20 min. The obtained plasma was used fresh for estimation of plasma total cholesterol (TC), Triglycerides (TGs) and high-density lipoprotein-cholesterol (HDL-c) using commercially available kits (Asan Pharmaceutical Co., Ltd., Seoul, Republic of Korea) [39,40,41].
2.7.2. Breast Tissue Investigations
Breast tissues, from all grouped mice (GI-GVI), were removed and rinsed in ice-cold 0.9% sodium chloride solution. Breast tissues were divided into three portions: one was homogenized in PBS (1:10 w/v) for biochemical assays (SOD, CAT, GSH, MDA, ELISA) and the second was snap-frozen in liquid nitrogen for RNA extraction and RT-qPCR analysis. The third part was immersed in formalin solution 10% for histopathological studies.
Antioxidant Enzymes and Tumor Biomarker Assays
The first part of breast tissue was washed in distilled water and then homogenized with a ten-fold volume of physiological saline using an electrical homogenizer at 3000 rpm for 15 min at 4 °C. The supernatant fractions were separated and stored at −20 °C until the estimation of GSH, SOD, CAT and malondialdehyde (MDA) [42,43,44,45]. ELISA kits [ab233624, ab227899, ab176648 and AAD08816.1, Abcam, TX, USA] were used to estimate Bax, BcL2, NF-κB and TNF-α, respectively. Additionally, IL-6, cyclin D1 and cyclin E2 were estimated by ELISA kits [CA583371, Cayman, Ann Arbor, MI, USA; NBP2-75101, Novus Biologicals, LLC, USA; and AAD08816.1, MyBioSource, San Diego, CA, USA], respectively.
Real-Time Quantitative Polymerase Chain Reaction (RT-qPCR)
Total RNA was extracted from 10 to 15 mg of breast tissue using Sepasol-RNA1Super, following the manufacturer’s instructions. Real-time quantitative PCR (RT-qPCR) was performed with 50 ng of RNA template per reaction using the SensiFAST™ SYBR® Hi-ROX One-Step Kit (Meridian Bioscience Inc./Bioline, Memphis, TN, USA). Each 25 μL reaction volume contained 70 nM of specific primers and was run on the Applied Biosystems 7500 Fast Real-Time PCR System (Foster City, CA, USA). The sequences of the primers are listed in Table 2. Amplification conditions: 95 °C for 10 min (initial denaturation), followed by 40 cycles of 95 °C for 15 s and 60 °C for 1 min. Gene expression was normalized to β-actin and calculated using the 2-ΔΔCT method.
Table 2.
Primer sequences for real-time PCR.
2.8. Histological Analysis
The second sections of breast tissues, fixed in 10% formalin solution at room temperature, were dehydrated in graded alcohol and embedded in paraffin blocks. Fine slices (5 μm thick) were stained with hematoxylin-eosin (H&E) and mounted on glass slides for light microscopic examination, following the method described by Bancroft and Stevens [46].
2.9. Statistical Analysis
Data were entered and analyzed using IBM SPSS software package version 20.0 (Armonk, NY, USA: IBM Corp). The Shapiro–Wilk test was used to verify the normality of distribution. Quantitative data were described using mean and standard deviation. Results were considered significant at the 5% level. For normally distributed quantitative variables, an F-test (ANOVA) was employed to compare more than two groups, followed by a Post Hoc test (Tukey) for pairwise comparisons.
3. Results and Discussion
3.1. Synthesis and Characterization of Phloretin–Chitosan Nanoparticles (Ph-ChNPs)
3.1.1. UV Absorption Spectra
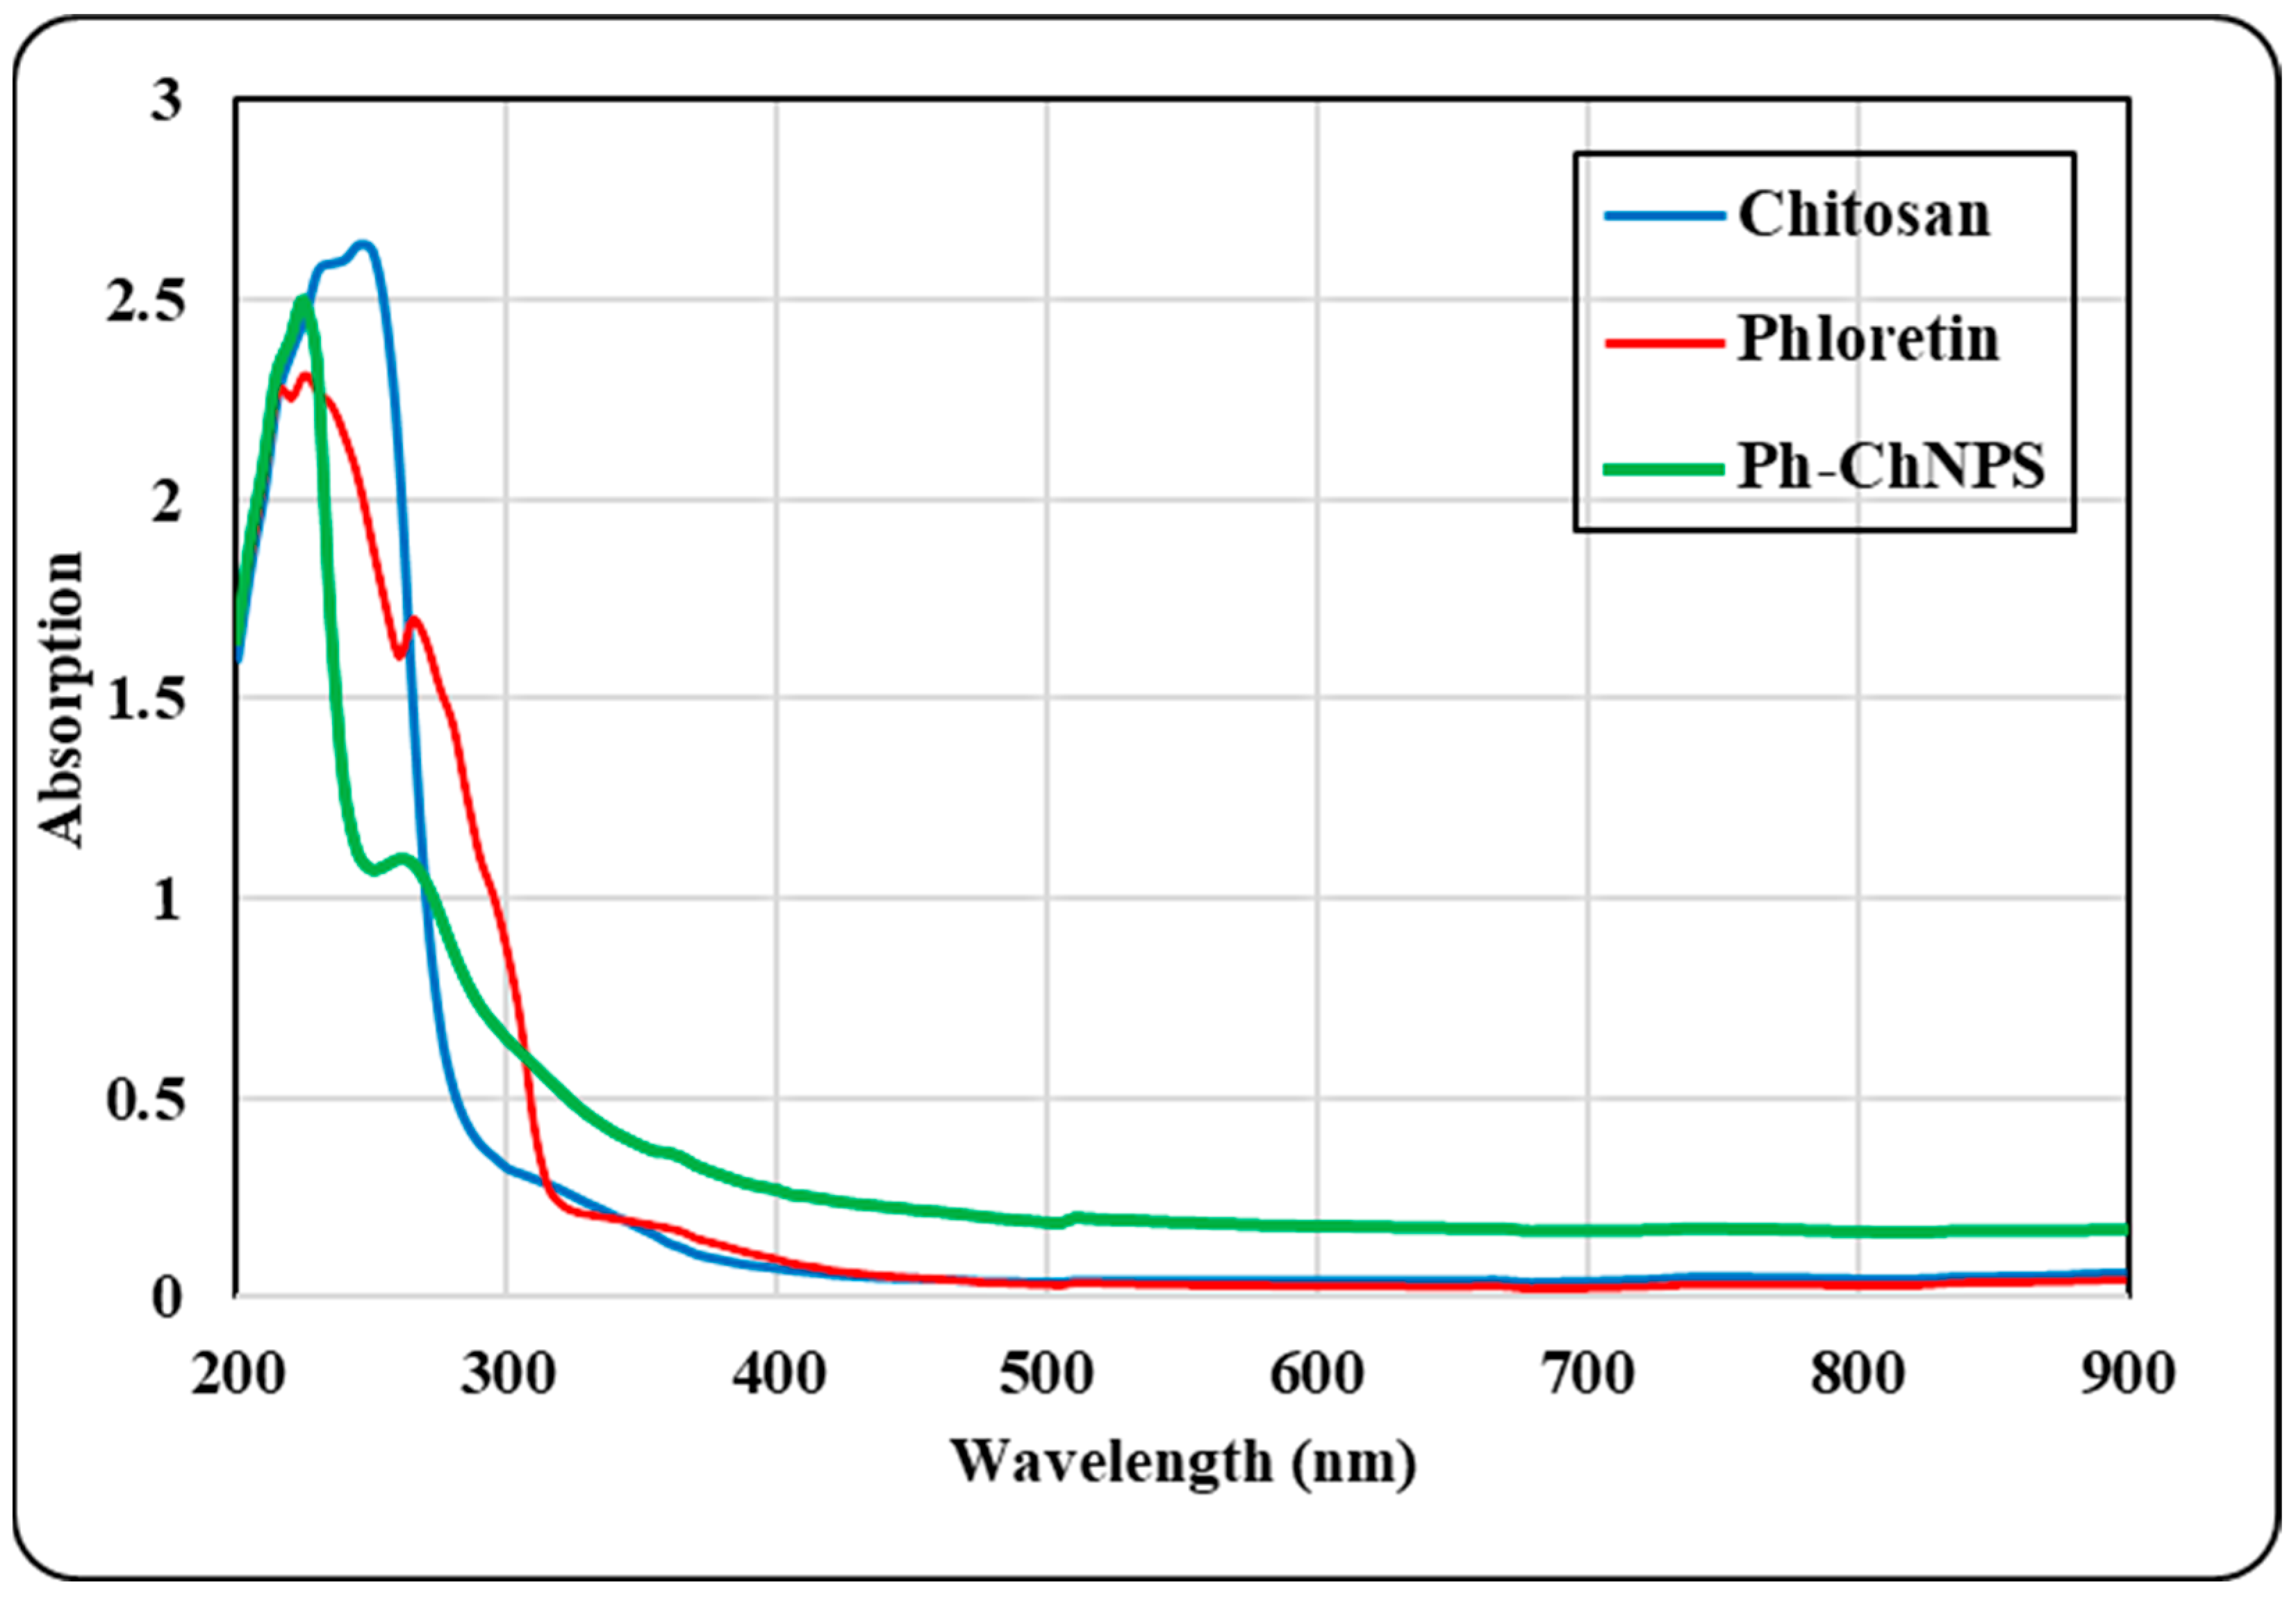
The absorption spectra of pure chitosan, pure phloretin and Ph-ChNPs are illustrated in Figure 2. Phloretin shows prominent bands observed at 227 nm and 265 nm. The UV spectra of Ph-ChNPs also displayed two bands at 225 nm and 270 nm, corresponding to the benzoyl and cinnamoyl systems, respectively. These bands were prominent in phloretin as well. The absorption spectra show that Ph-ChNPs retain the characteristic bands of phloretin at 225 nm and 270 nm, suggesting successful incorporation. These findings collectively underscore the successful formation and stability of Ph-ChNPs.

Figure 2.
UV absorbance spectra of chitosan, phloretin and phloretin–chitosan nanoparticles (Ph-ChNPs).
3.1.2. Morphology, Particle Size and Zeta Potential of Ph-ChNPs
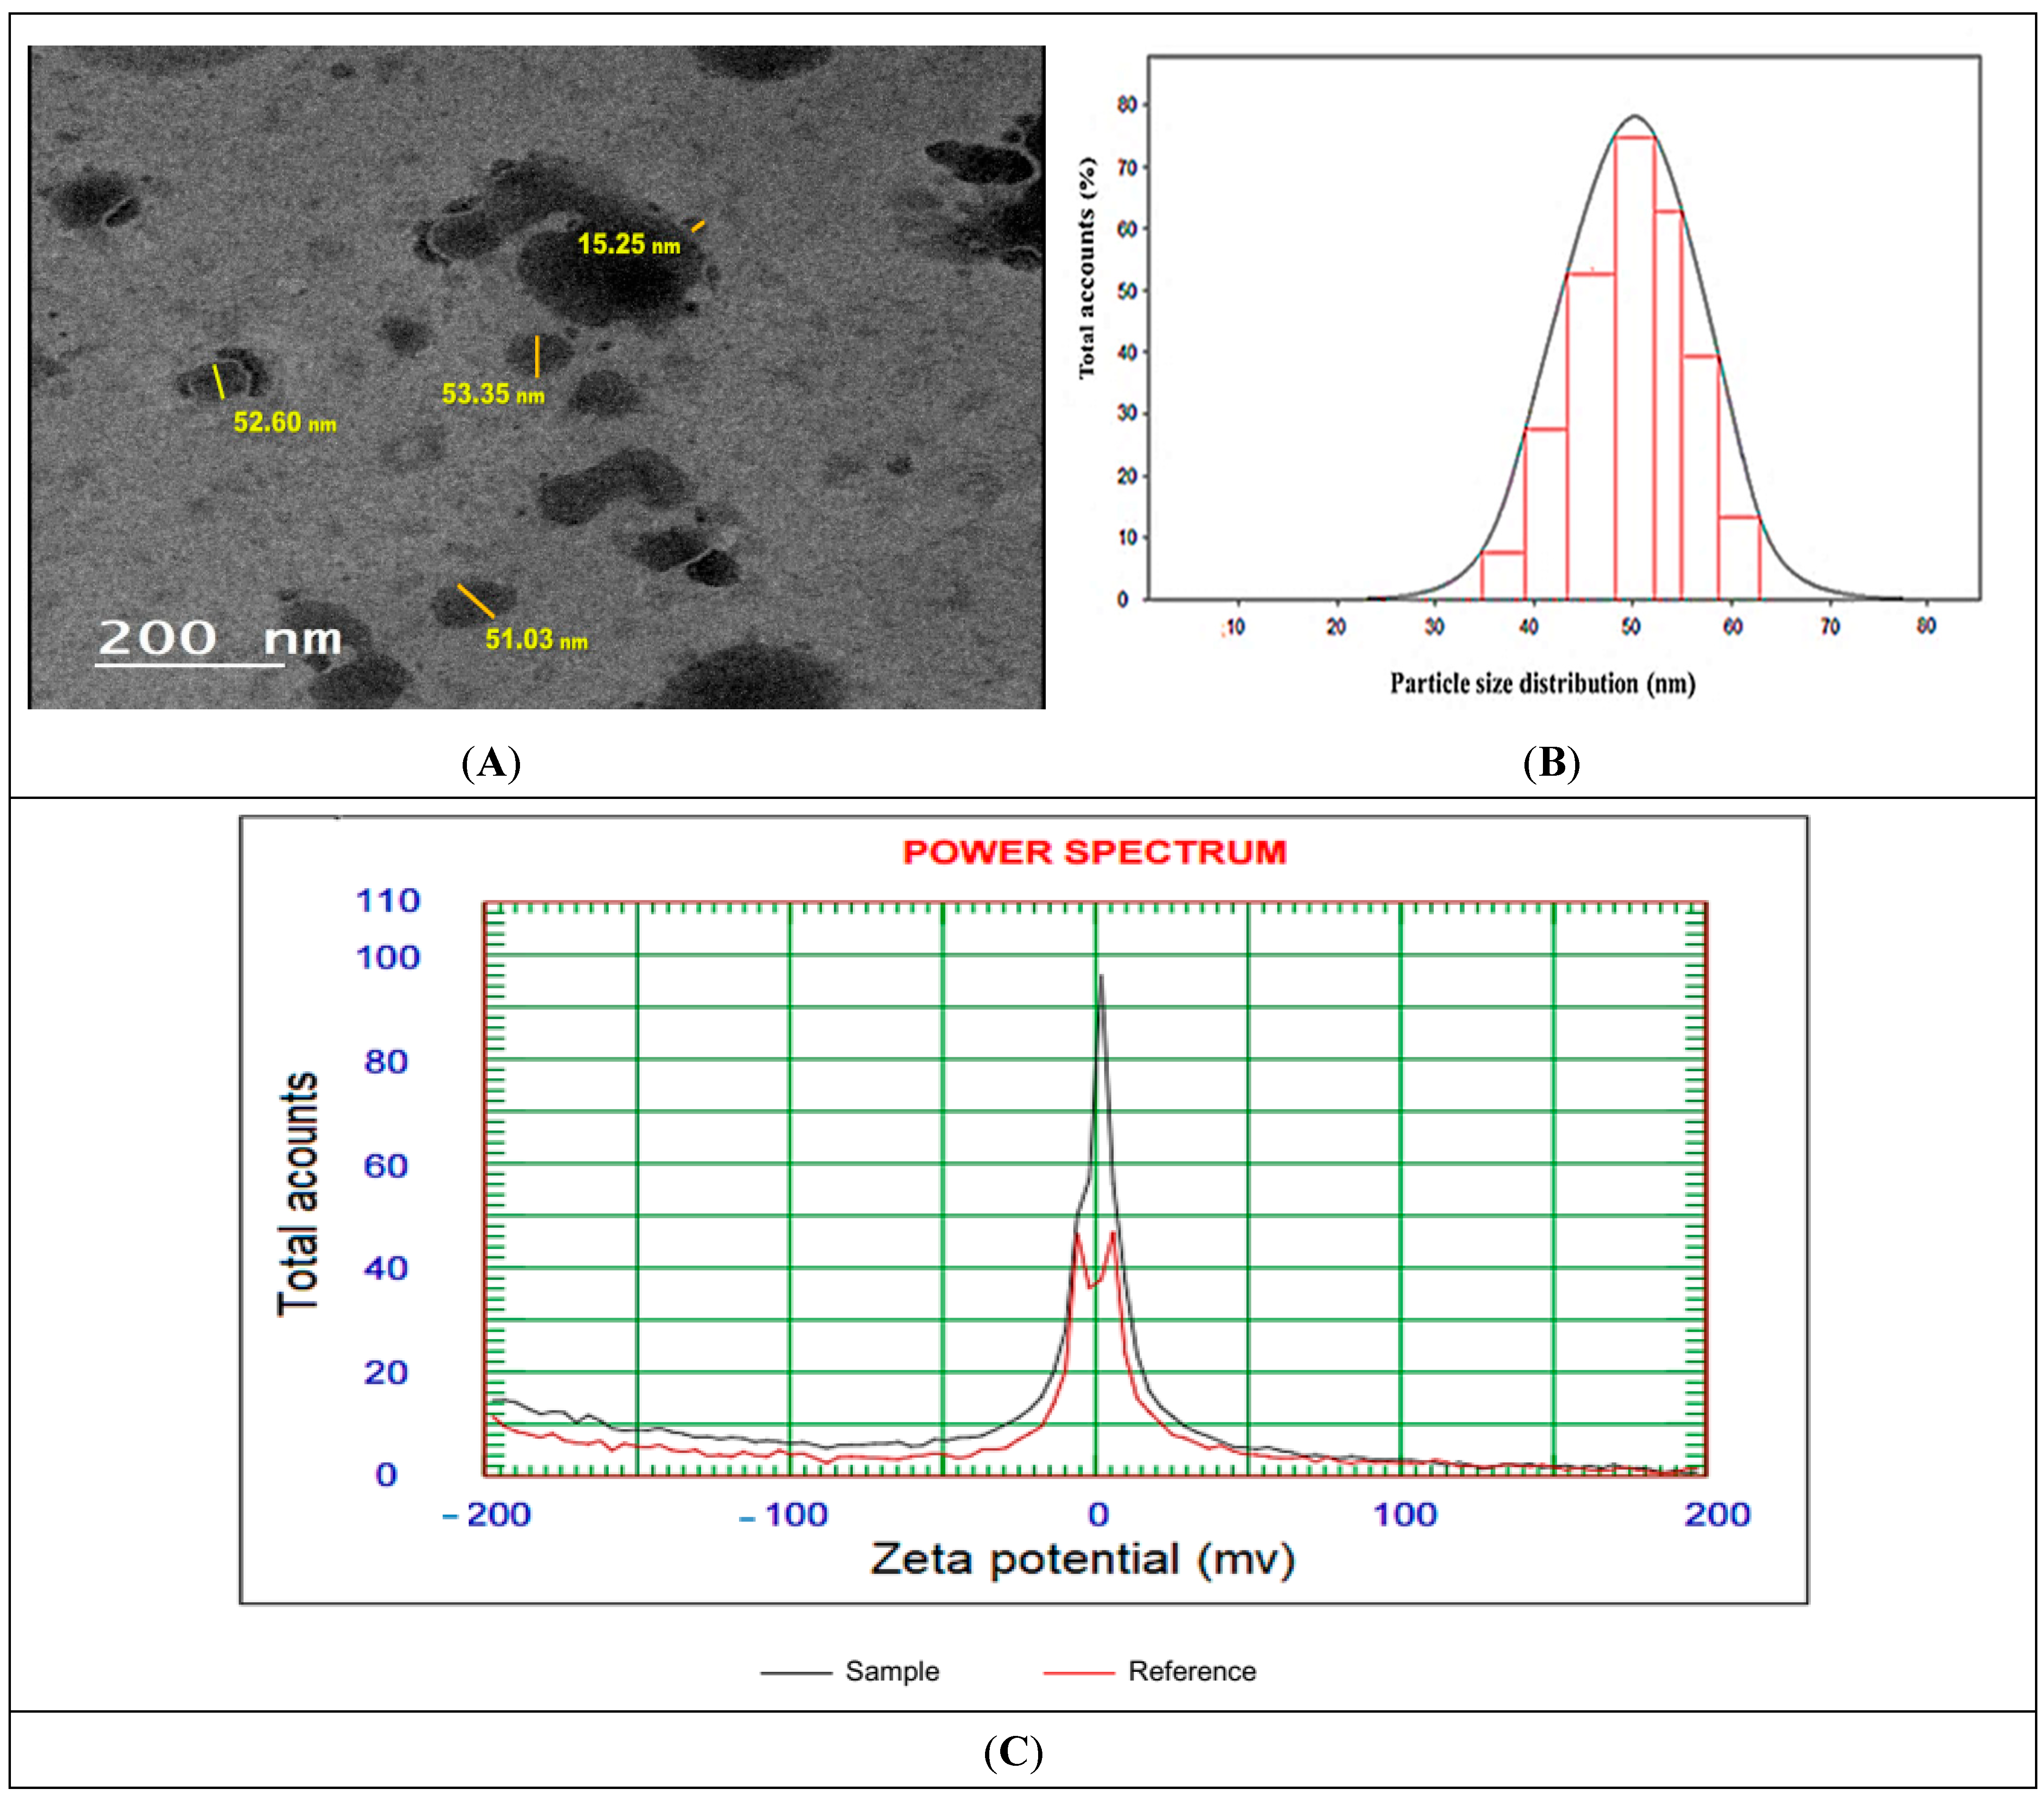
TEM micrographs of Ph-ChNPs are shown in Figure 3A,B, revealing their average vesicle size of 52.33 ± 1.18 nm. The nanoparticles are spherical, smooth and transparent. Additionally, Ph-ChNPs exhibited a polydispersity index (PDI) of 0.15, indicating a narrow particle size distribution and the homogeneity of the synthesis, with a zeta potential value of 28.52 ± 0.4 mV (Figure 3C). Their small size and stability, as indicated by their narrow size distribution and positive zeta potential, make them suitable for efficient drug delivery [47]. Also, these results suggest stability and cytocompatibility, because there is less risk of destabilizing cellular membrane while keeping the values of Z potential in the range of −30 to 30 mV [48].

Figure 3.
Characterization of Ph-ChNPs. (A) Transmission Electron Microscopy (TEM), (B) particle size distribution curve and (C) zeta potential distribution demonstrating the surface charge and stability of the nanoparticles in suspension.
3.1.3. FTIR Spectroscopy
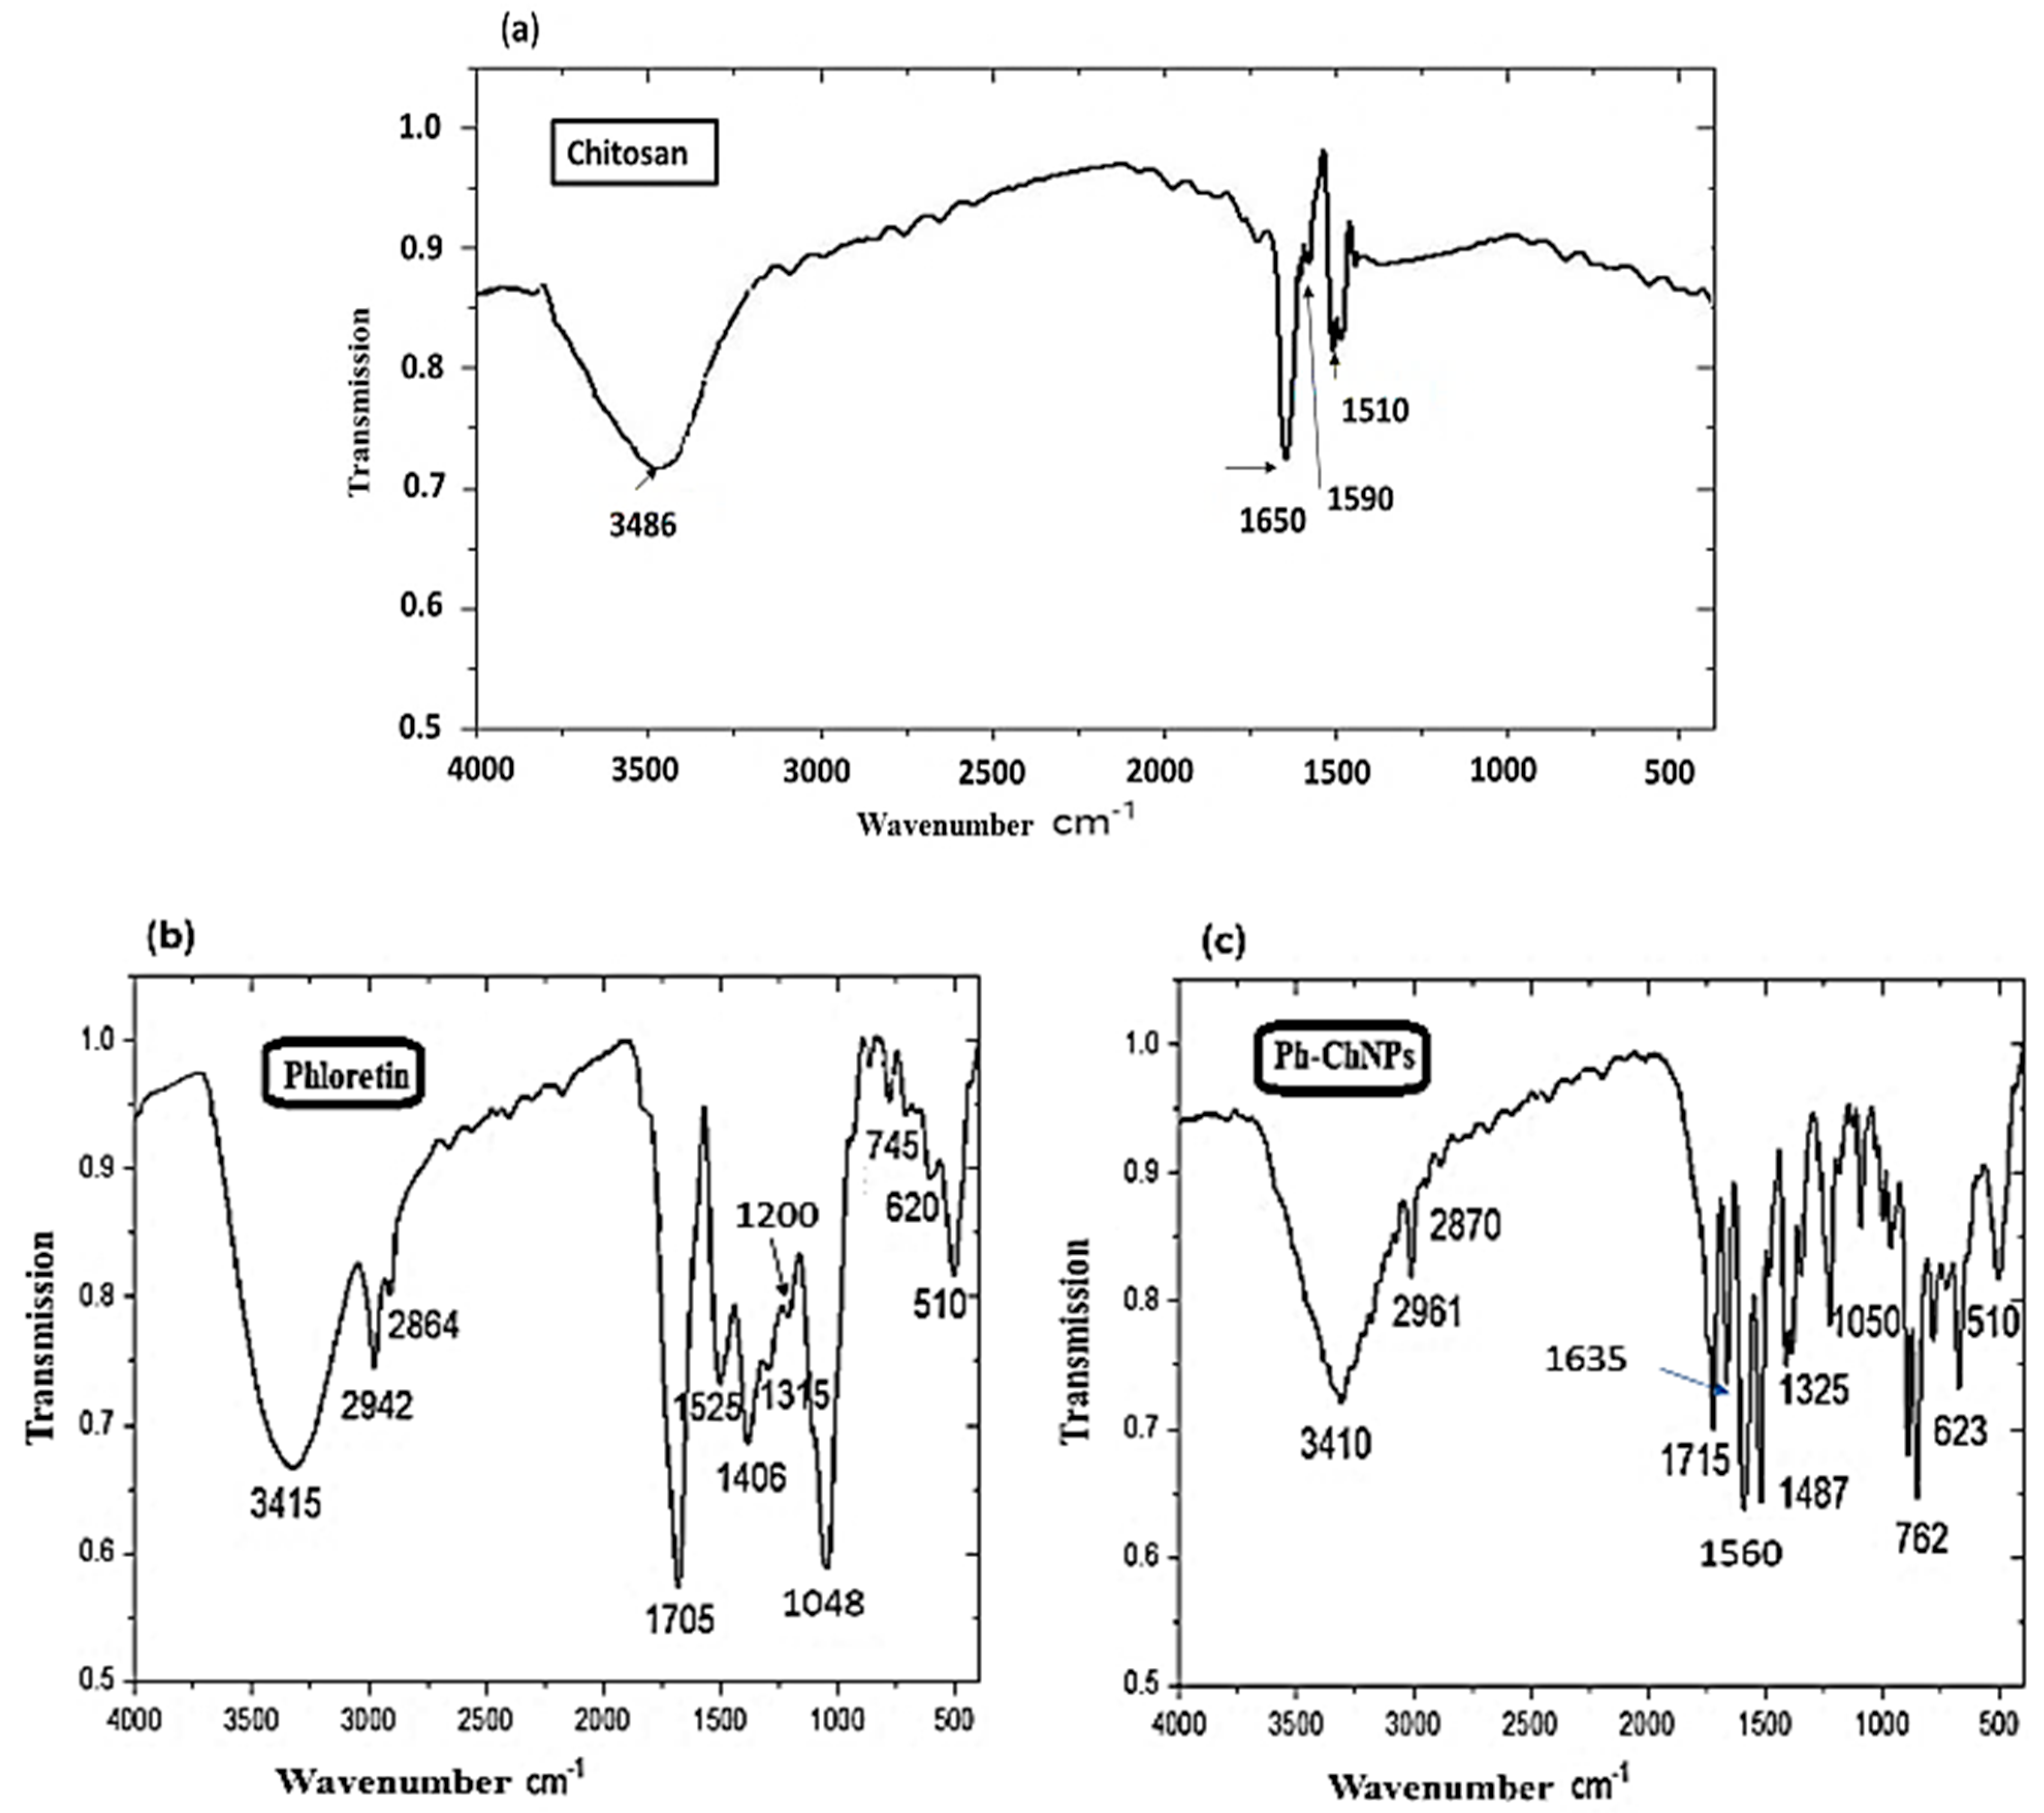
Phloretin and Ph-ChNPs were characterized by using Fourier-transform infrared spectroscopy (FTIR) to compare their spectra and confirm successful incorporation. In Figure 4a, the spectrum of chitosan showed characteristic peaks at 1650 cm−1 (amide I) and 1590 cm−1 (NH2 bending). Figure 4b shows the FTIR spectra of phloretin revealed peaks corresponding to various functional groups. These groups were identified at 3415 cm−1 (O-H bending), 2942 cm−1 (CH-aromatic), 2864 cm−1 (CH-aliphatic), 1705 cm−1 (C=O) and 1525 cm−1 (C=C). Additionally, bands at 1315, 1200 and 1048 cm−1 were attributed to C–O stretching in the aryl ether ring, C–O stretching in phenol and C–CO–C stretching and bending in ketone. In Ph-ChNPs (Figure 4c), the shifted of peaks to 1635 cm−1 and 1560 cm−1 confirmed ionic interaction between chitosan’s amino groups and phloretin’s hydroxyl groups, demonstrating successful encapsulation. The incorporation of phloretin into chitosan nanoparticles helps preserve its functional properties, as confirmed by UV absorption and FTIR spectra [49].

Figure 4.
FTIR spectra of (a) chitosan, (b) phloretin and (c) Ph-ChNPs.
3.2. Cell Viability Evaluation
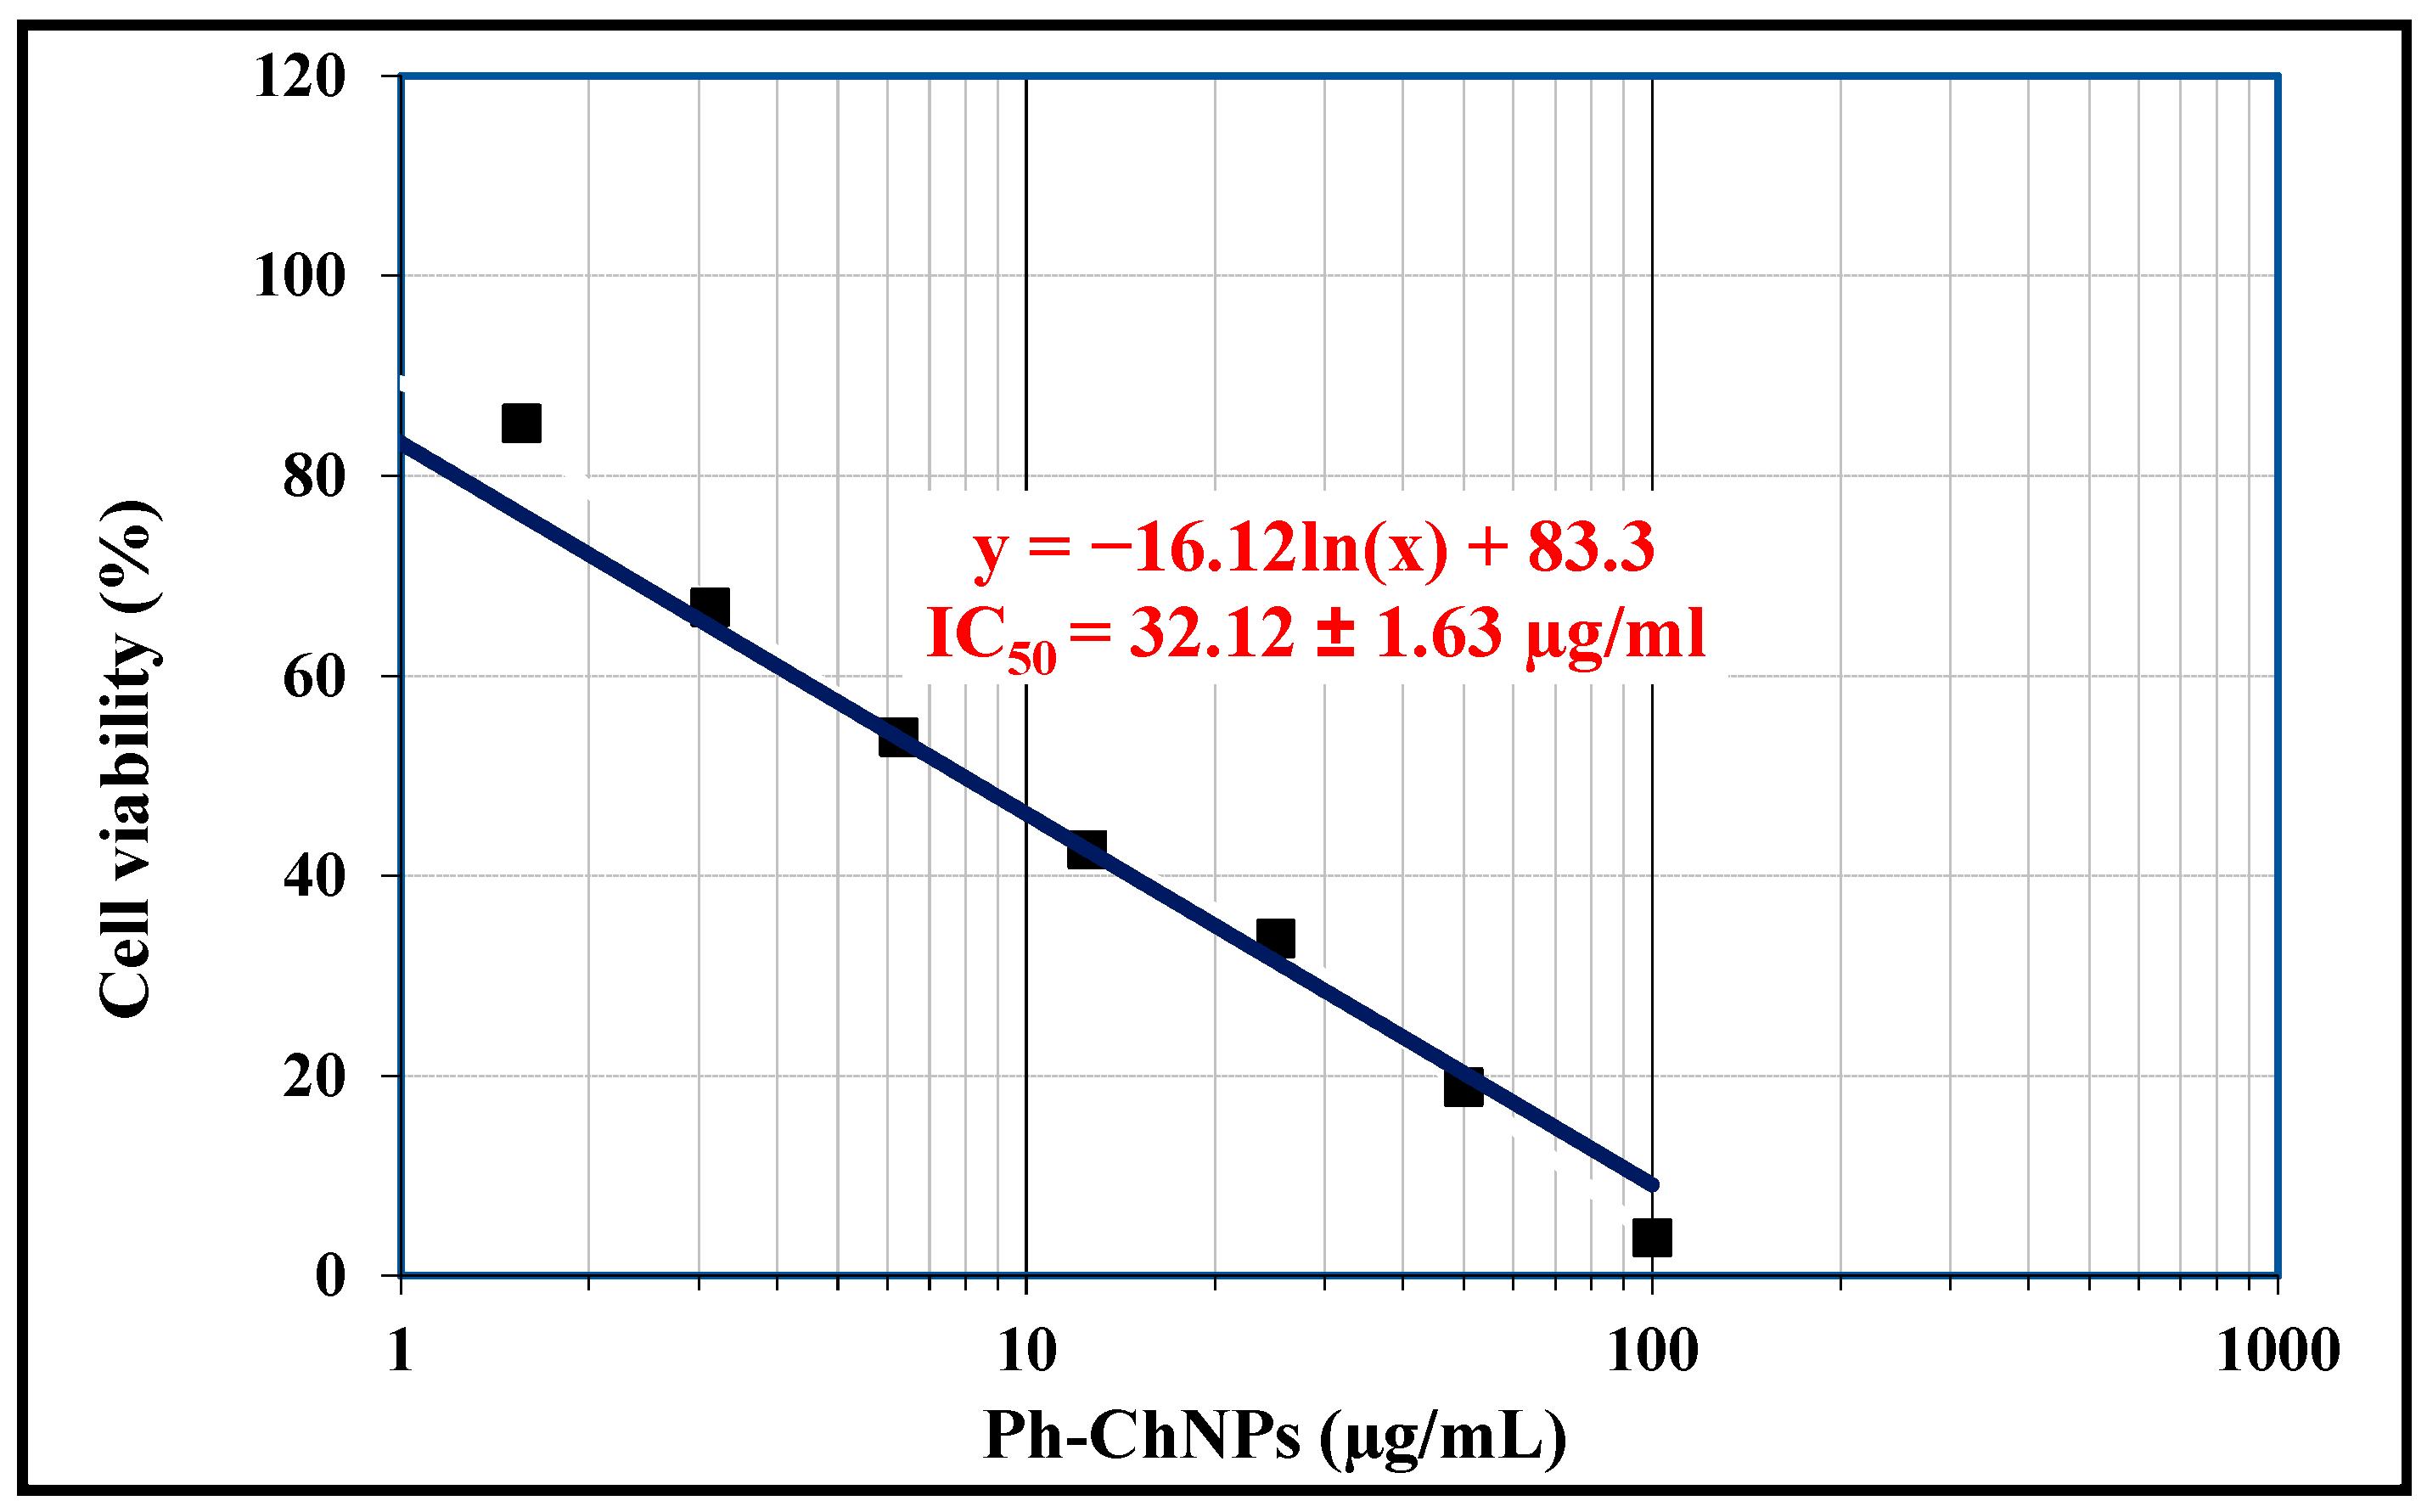
The indirect cytotoxicity of Ph-ChNPs was evaluated in MCF-7 cell lines using the MTT assay, as a measurement of cell viability in response to nanomaterial exposition. Table 3 and Figure 5 illustrate the IC50, viability and inhibitory values of Ph-ChNPs against MCF-7 cell lines. The IC50 of Ph-ChNPs (32.12 µg/mL) was significantly lower than free phloretin (58.74 µg/mL), demonstrating enhanced cytotoxicity. Linear and logarithmic analyses produced concordant results (R2 > 0.95). At a concentration of 0.19 µg/mL, the cell viability was 99.58% and the inhibitory value was 0.42%. At 50 µg/mL, the cell viability decreased to 18.84%, while the inhibitory value increased to 81.16%. Furthermore, at 100 µg/mL, the cell viability was 3.76% and the inhibitory value was 96.24%. These results demonstrate that Ph-ChNPs at lower concentrations had minimal impact on cell viability. However, as the concentration increased, the nanoparticles became significantly more effective, drastically reducing cell viability and increasing the inhibition of cancer cell growth. This dose-dependent cytotoxicity suggests that Ph-ChNPs could be a promising candidate for breast cancer treatment, capable of significantly reducing cancer cell viability at higher doses. The effectiveness of Ph-ChNPs against MCF-7 breast cancer cell lines can be attributed to several factors. Phloretin enhances the cytotoxic effects on cancer cells by inducing apoptosis and inhibiting cell proliferation [50]. Chitosan, known for its biocompatibility and ability to form stable nanoparticles, aids in the efficient delivery of phloretin to the cancer cells [51]. The combination of these components in nanoparticle form allows for targeted delivery, improved stability and enhanced cellular uptake, leading to significant reductions in cell viability and increased inhibitory effects [52]. This targeted approach minimizes damage to healthy cells and enhances the overall therapeutic efficacy against breast cancer [53].
Table 3.
The cell viability percentages of MCF-7 cells, both untreated and treated with Ph-ChNPs.

Figure 5.
The IC50 value of Ph-ChNPs against MCF-7 cells.
3.3. Determination of LD50 of Ph-ChNPs
Our findings reveal that oral administration of Ph-ChNPs at doses of 1100, 1600, 2000, 2400, 3000 and 3500 mg/kg (BW) resulted in a progressive increase in mortalities: 1, 2, 4, 7, 8 and 10, respectively. The LD50 of Ph-ChNPs was calculated to be 2180 mg/kg BW, as detailed in Table 4.
Dm = Highest lethal dose (3500 mg/kg BW); n = total animals per group; Z = average mortality
between adjacent groups; d = dose interval.
between adjacent groups; d = dose interval.
Table 4.
The determination of the LD50 of Ph-ChNPs when administered orally to adult mice.
Based on the LD50 value of 2180 mg/kg BW for Ph-ChNPs, which considered slightly toxic according to previous reports [54], so using 1/20th of this dose for treatment ensuring a safer administration for therapeutic purposes. Given the previous results, this lower dose is expected to minimize toxicity while still leveraging the therapeutic benefits of Ph-ChNPs [54]. At this concentration, the nanoparticles should maintain their efficacy in targeting cancer cells without causing significant harm to the mice. This approach balances the need for effective treatment with the imperative of safety, reducing the risk of adverse effects observed at higher doses [55].
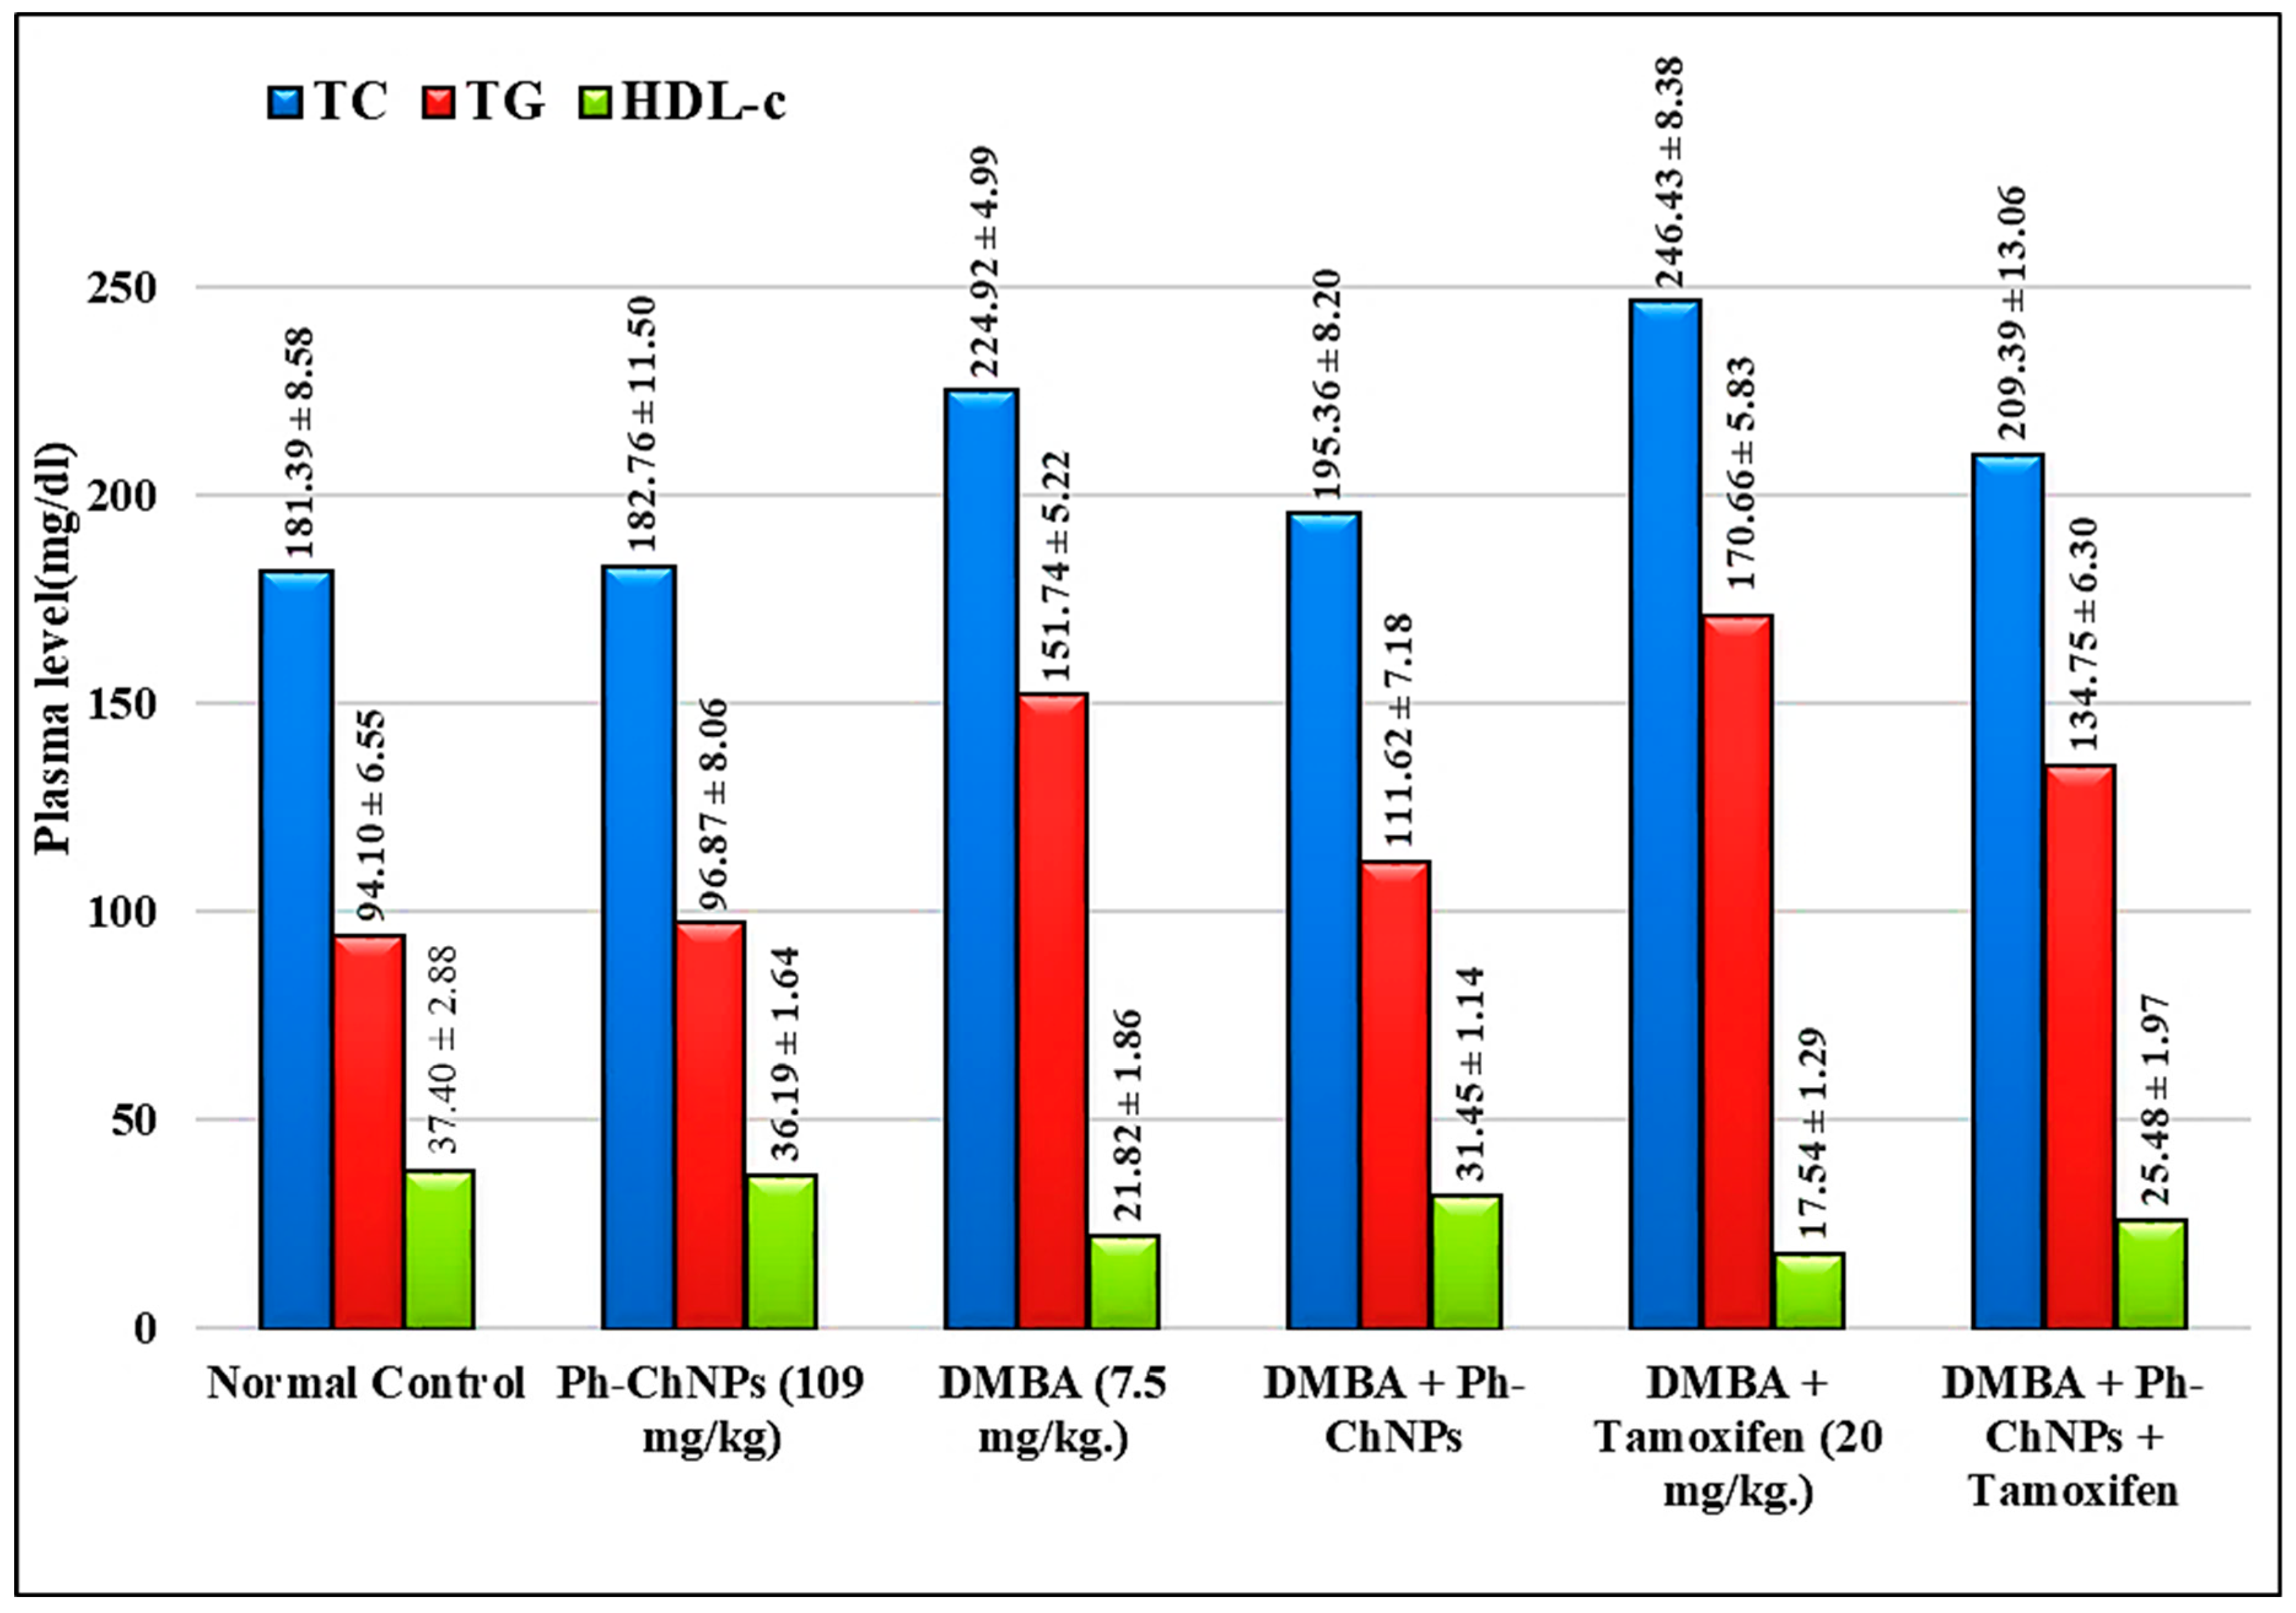
3.4. Effect of Ph-ChNPs and Tamoxifen on Plasma TC, TG and HDL-c in Treated Mice
Figure 6 represents plasma TC, TG and HDL-c levels in the different treated mice groups (GI-GVI). There was no significant change in the levels of lipid profile in normal mice when treated with Ph-ChNPs (109 mg/kg BW) (GII) compared to the normal control group (GI). When compared to normal mice, DMBA-injected mice (GIII) had a considerable rise (p < 0.05) in plasma TC and TG levels of 24% and 61.26%, respectively, as well as a significant drop in HDL-c level by 41.45%. Furthermore, when compared to DMBA-injected mice (GIII) (p < 0.05), plasma TC and TG levels in Ph-ChNPs-treated mice (GIV) were substantially decreased by 13.25% and 26.44%, respectively, as well as a significant increase in HDL-c level by 44.05%. The observed effects of Ph-ChNPs on the lipid profile in treated mice (GIV) can be attributed to the combined properties of phloretin and chitosan. Phloretin, a natural antioxidant, has been shown to modulate lipid metabolism, potentially reducing cholesterol and Triglyceride levels while increasing HDL cholesterol level [56]. Chitosan, known for its lipid-lowering effects, enhances the bioavailability and stability of phloretin, facilitating its beneficial impact on lipid profiles [57]. In addition, as compared to DMBA-treated mice (GIII), administration of tamoxifen (2 mg/kg BW) (GV) considerably increased plasma TC and TG levels by 9.57% and 12.47%, respectively, while significantly decreasing HDL-c level by 19.61% (p < 0.05). On the other hand, the levels of plasma TCs showed non-significant changes in a group of mice treated with Ph-ChNPs in combination with tamoxifen (GVI) as compared with DMBA-injected mice (GIII). Furthermore, administration of Ph-ChNPs in combination with tamoxifen decreased the plasma TG level by 11.19%, while increasing the HDL-c level by 16.78% (p < 0.05) as compared with DMBA-injected mice. The significant improvements in lipid parameters in DMBA-injected mice treated with Ph-ChNPs and tamoxifen (GVI), compared to those treated with tamoxifen alone (GV), highlight the potential of Ph-ChNPs to mitigate adverse lipid changes associated with cancer and its treatment [58]. This suggests that Ph-ChNPs could offer a dual benefit of enhancing cancer therapy while improving lipid metabolism.

Figure 6.
Plasma levels of TC, TG and HDL-c in different treated mice groups.
3.5. Biomarkers Assays in Breast Tissues
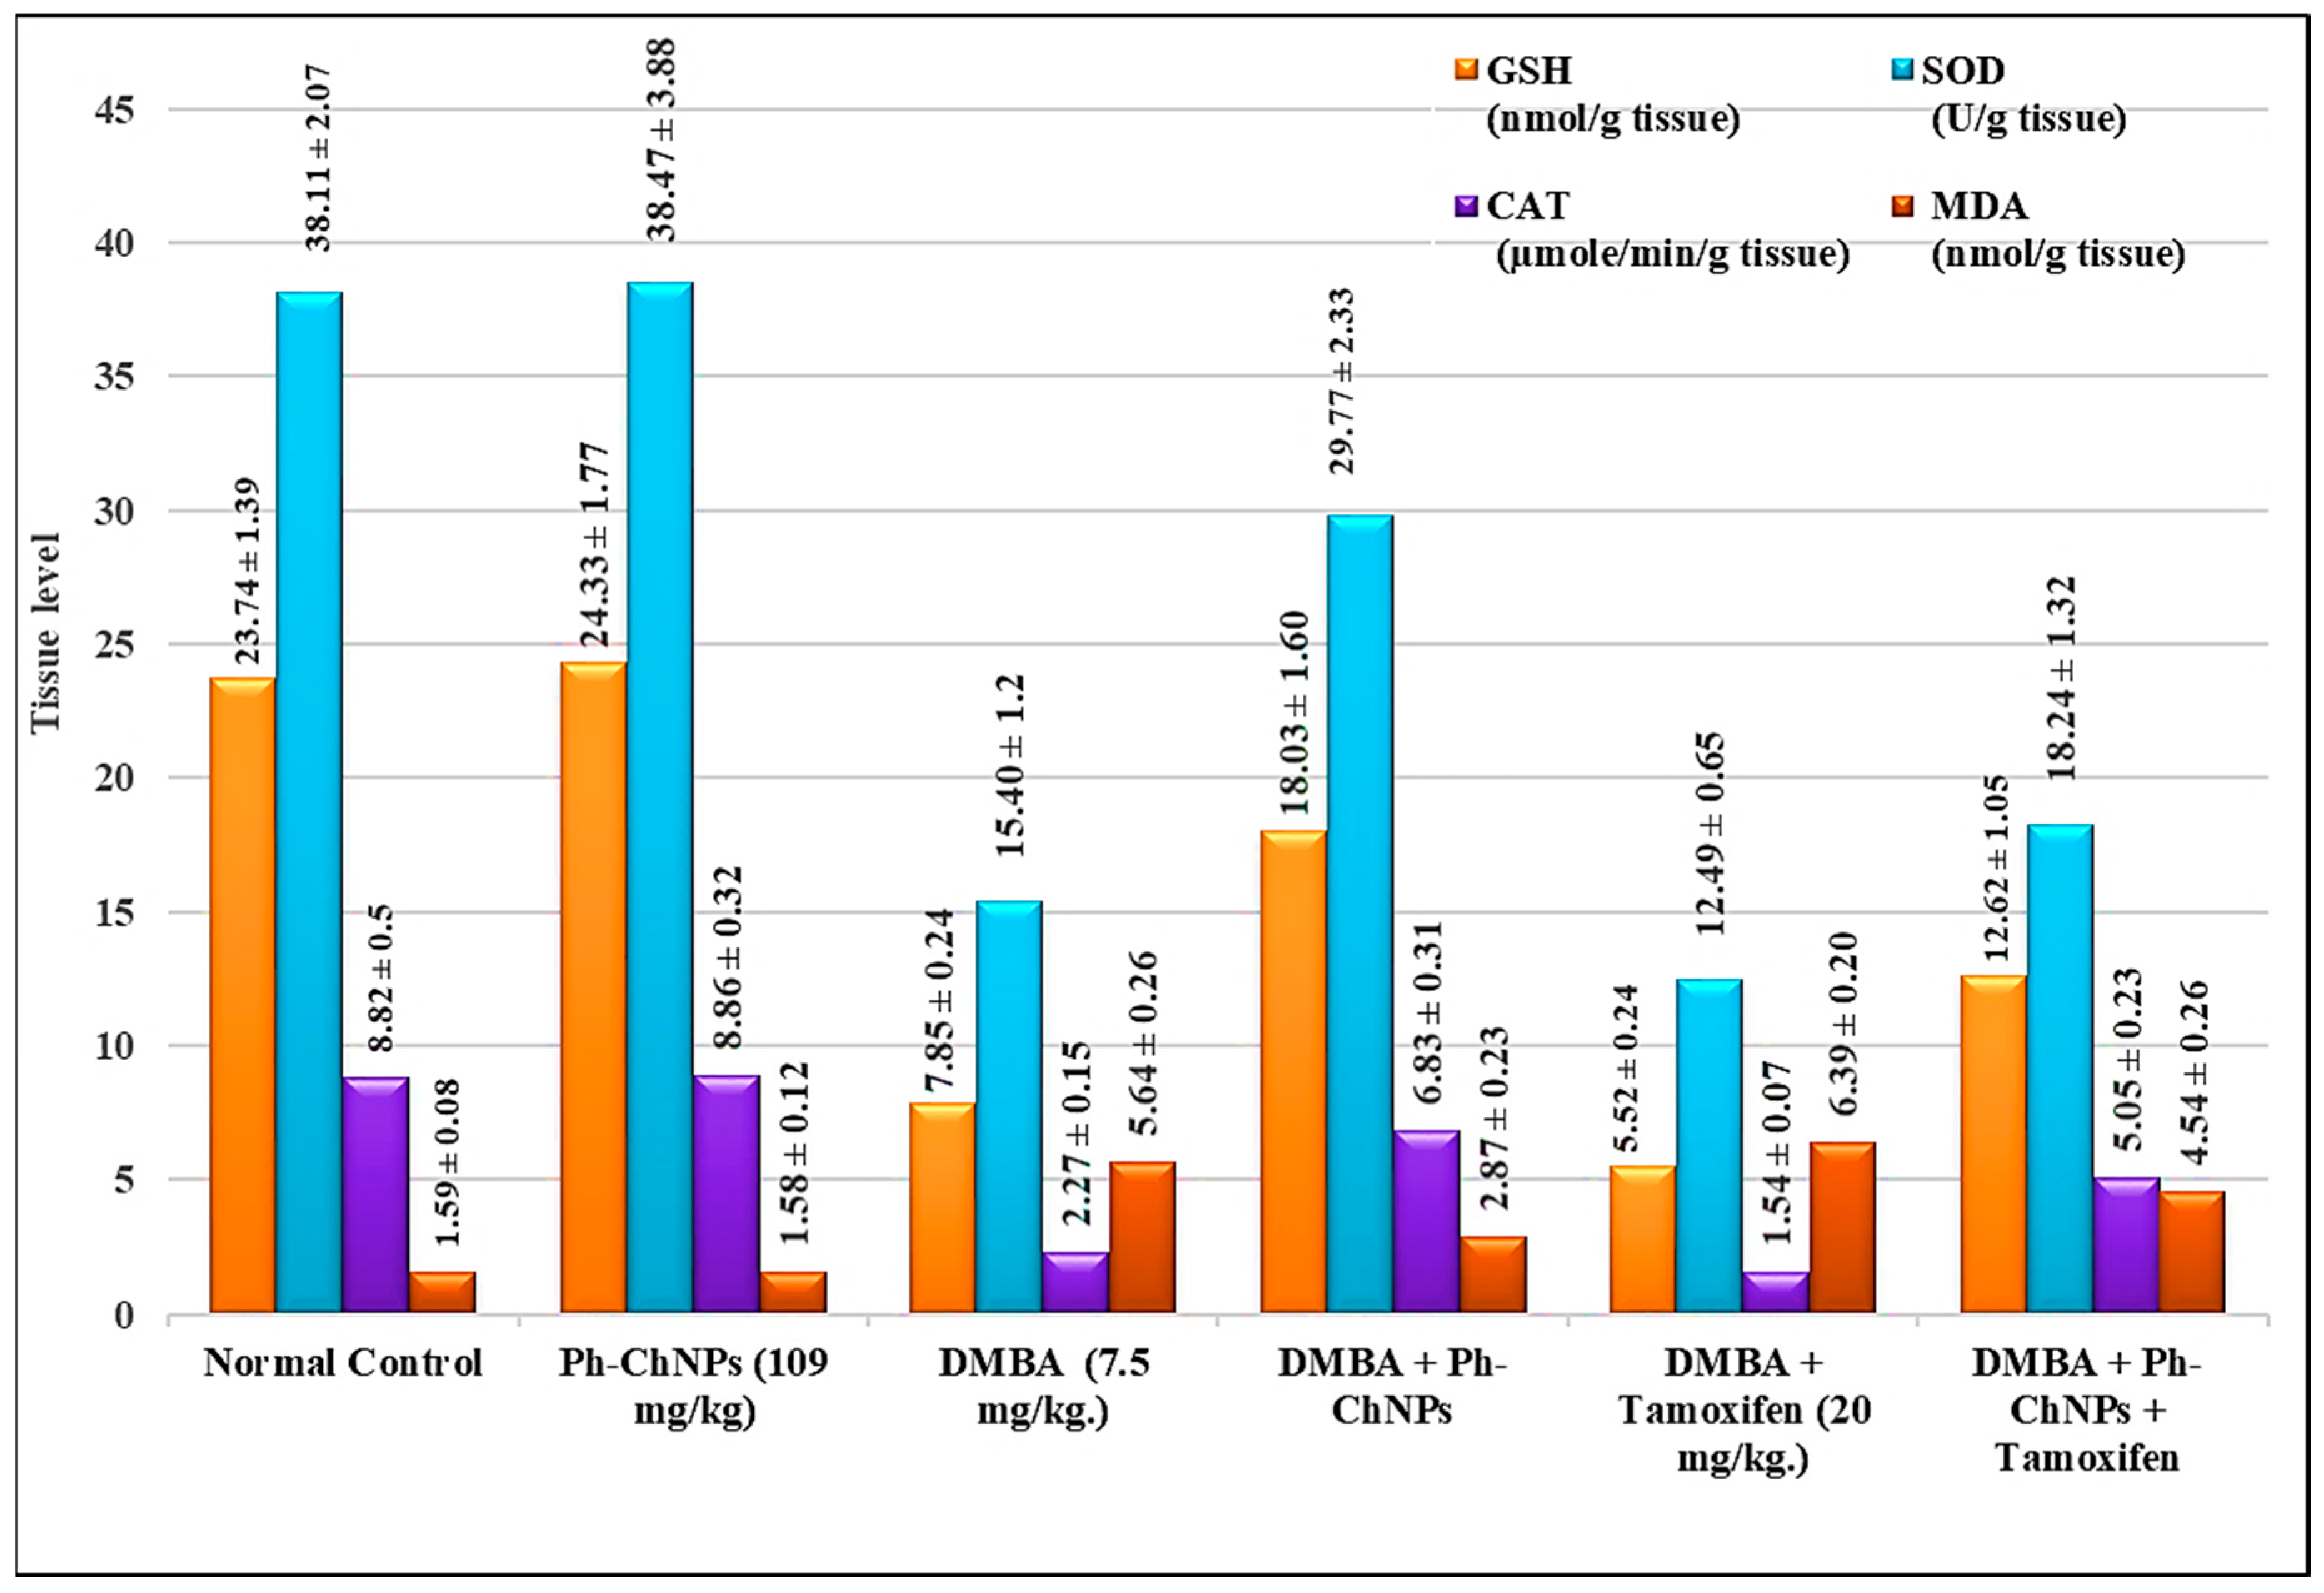
3.5.1. Antioxidant Enzymes (SOD and CAT) Reduced Glutathione (GSH) and Malondialdehyde (MDA) Evaluation
Antioxidant enzymes, such as superoxide dismutase (SOD) and catalase (CAT) as well as reduced glutathione (GSH), which is considered as a hydrogen donor of glutathione peroxidase, play a major role in the protection of cells against free radical damage.
MDA is one of the final products of the polyunsaturated fatty acids peroxidation. Its elevation is indicative of high levels of free radicals. Assays of the mentioned compounds were carried out on breast tissues samples isolated from all treated mice groups (GI-GVI). Figure 7 shows breast GSH, SOD, CAT and MDA levels in treated mice. No significant change in levels of breast GSH, SOD, CAT and MDA in normal mice when treated with Ph-ChNPs (109 mg/kg BW) (GII), compared to the normal control group (GI). Breast GSH, SOD and CAT levels significantly decreased in DMBA-injected mice (GIII) by 66.93%, 59.36%, 74.26%, respectively, while MDA levels significantly increased by 254.72%. Also, breast GSH, SOD and CAT levels were significantly higher (p < 0.05) in mice treated with Ph-ChNPs (GIV), while the MDA level was also significantly lower by 49.11% compared to DMBA-exposed mice (GIII). In DMBA-injected mice given tamoxifen (2 mg/kg BW) (GV), breast GSH, SOD and CAT levels decreased significantly (p < 0.05) by 29.68%, 18.89% and 32.15%, respectively, while MDA levels elevated significantly by 13.30% compared to DMBA-injected mice (GIII). However, giving Ph-ChNPs in combination with tamoxifen (GVI) significantly increased breast GSH, SOD and CAT levels by 60.77%, 15.45% and 5.05%, respectively, as well as significantly decreased MDA levels by 19.5% (p < 0.05) compared to DMBA-administered mice (GIII).

Figure 7.
Breast tissue levels of antioxidant enzymes (SOD and CAT), GSH and MDA in different treated mice groups.
The current results indicate that Ph-ChNPs significantly improve antioxidant enzyme levels and reduce oxidative stress markers in the breast tissue of treated mice. In normal mice, Ph-ChNPs did not alter the levels of GSH, SOD, CAT and MDA, suggesting no adverse effects on healthy tissue. However, in DMBA-injected mice (GIII), which simulate a breast cancer model, there was a significant decrease in antioxidant enzymes (GSH, SOD, CAT) and a substantial increase in MDA, a marker of oxidative stress. Treatment with Ph-ChNPs (GIV) significantly elevated the levels of these antioxidant enzymes and reduced MDA levels, indicating a protective effect against oxidative damage. In contrast treatment with tamoxifen alone (GV) decreased antioxidant enzyme levels and increased MDA, highlighting its oxidative stress-inducing side effects [59]. When combined with tamoxifen (GVI), Ph-ChNPs significantly improved antioxidant enzyme levels and reduced MDA levels, suggesting that Ph-ChNPs can mitigate the oxidative stress associated with tamoxifen treatment and enhance its therapeutic efficacy [60,61].
3.5.2. Apoptotic and Inflammatory Biomarkers in Breast Tissue of Treated Mice
The key apoptotic and inflammatory markers Bax, BcL2, NF-kβ and TNF-α in breast tissue of treated mice were estimated in all mice groups (GI − GVI). The results show that there is no significant change in levels of breast Bax, BcL2, NF-kβ and TNF-α in normal mice when treated with Ph-ChNPs (109 mg/kg BW) (GII), compared to normal control group (Table 5). Mice injected with DMBA (GIII) had considerably lower (p < 0.05) levels of breast Bax by 63.81% as well as significantly higher BcL2, NF-kβ and TNF-α levels by 440.52%, 435.16% and 243.65%, respectively, compared to normal mice. Also, compared to DMBA-injected mice, the administration of Ph-ChNPs (109 mg/kg BW) (GIV) significantly increased breast Bax levels by 71.59%, as well as significantly decreased breast BcL2, NF-kβ and TNF-α levels by 67.36%, 60.02% and 54.14%, respectively (p < 0.05). The levels of breast Bax, NF-kβ and TNF-α levels were significantly increased by 90.21%, 18.86% and 13.25%, respectively, as well as while the levels of breast BcL-2 levels were significantly decreased by 74.43%, in mice treated with tamoxifen (2 mg/kg BW) (GV), when compared with DMBA-injected mice (GIII). As compared to DMBA-injected mice, the level of breast Bax was significantly increased in mice treated with tamoxifen and Ph-ChNPs in combination (GVI) by 124.61%, as well as significantly decreased in BcL-2, NF-kβ and TNF-α levels by 77.68%, 25.06% and 37.48%, respectively.
Table 5.
Effect of Ph-ChNPs and tamoxifen on breast Bax, BcL2, NF-kβ and TNF-α in treated mice.
The results indicate that Ph-ChNPs significantly modulate key apoptotic and inflammatory markers in breast tissue of treated mice. In normal mice, Ph-ChNPs did not alter the levels of Bax, BcL2, NF-kβ and TNF-α, suggesting no adverse effects on healthy tissue. However, in DMBA-injected mice, which simulate a breast cancer model, there was a significant decrease in the pro-apoptotic protein Bax and a substantial increase in the anti-apoptotic protein BcL2, as well as elevated levels of NF-kβ and TNF-α, indicating enhanced cell survival and inflammation. Treatment with Ph-ChNPs significantly increased Bax levels and decreased BcL2, NF-kβ and TNF-α levels, suggesting a restoration of apoptotic balance and reduction in inflammation [62,63]. In contrast, tamoxifen alone increased Bax and decreased BcL2 but also raised NF-kβ and TNF-α levels, highlighting its pro-inflammatory side effects. When combined with tamoxifen, Ph-ChNPs further enhanced Bax levels and reduced BcL2, NF-kβ and TNF-α levels, indicating a synergistic effect that enhances apoptosis and reduces inflammation [64].
3.5.3. Tumor Marker Assay in Treated Mice
Cyclin D1 oncogene is frequently overexpressed in a broad range of human tumor types [65]. IL-6 is a multifunctional cytokine that is important for immune responses, cell survival, apoptosis and proliferation [66]. Cyclin E2 is the second member of the E-type cyclin family. Abnormal expression of cyclin E2 in human cells accelerate G (1) phase, suggesting that it is rate limiting for G (1) phase progression [67].
Biochemical analysis of IL-6, cyclin D1 and cyclin E2 in treated mice to follow the effect of Ph-ChNPs on the level of these biomarker. As illustrated in Table 6, no significant change in levels of breast IL-6, cyclin D1 and cyclin E2 were seen in normal mice when treated with Ph-ChNPs (109 mg/kg BW), compared to the normal control group. Higher levels of IL-6, cyclin D1 and cyclin E2 (p < 0.05) were found in DMBA-administered mice (GIII) by 392.6%, 345.84% and 110.77%, compared to the normal control group. Also, the levels of IL-6, cyclin D1 and cyclin E2 went down by 68.60%, 35.24% and 37.50%, respectively, in the breast of Ph-ChNPs-treated mice (GIV) compared to mice that were given DMBA (GIII) (p < 0.05). Giving tamoxifen (2 mg/kg BW) to mice that have been injected with DMBA (GV) increases breast IL-6 and cyclin E2 levels by 32.64% and 52.24%, respectively, as well as lowers cyclin D1 levels by 49.86% compared to mice that have been injected with DMBA (p < 0.05). Compared to mice that were injected with DMBA, mice that were given Ph-ChNPs and tamoxifen in combination (GVI) had a significant drop in IL-6 and cyclin D1 levels by 40.68% and 64.15%, respectively, and a significant elevation in cyclin E2 level by 14.24%.
Table 6.
Effect of Ph-ChNPs and tamoxifen on breast IL-6, cyclin D1 and cyclin E2 in treated mice.
The current results reveal intriguing insights into the effects of Ph-ChNPs and tamoxifen on breast cancer markers in mice. In normal mice, Ph-ChNPs did not alter IL-6, cyclin D1 or cyclin E2 levels, indicating no adverse effects on healthy tissue. However, DMBA-injected mice exhibited significantly elevated levels of these markers, highlighting their role in tumorigenesis. Remarkably, treatment with Ph-ChNPs significantly reduced these elevated levels, suggesting a strong therapeutic potential. Tamoxifen, while reducing cyclin D1, increased IL-6 and cyclin E2, reflecting its complex biological effects. Interestingly, the combination treatment significantly reduces IL-6 and cyclin D1 levels, indicating a synergistic effect in reducing inflammation and cell proliferation [68]. The slight increase in cyclin E2 levels might be due to the combined influence of both treatments on cell cycle regulation. Our results were confirmed with the results of Emara et al. [69], who showed that Ph-ChNPs and tamoxifen can modulate key breast cancer markers. These findings underscore the promising role of Ph-ChNPs, alone and in combination with tamoxifen, in modulating key breast cancer markers and potentially improving therapeutic outcomes.
3.5.4. Gene Expression in Treated Mice
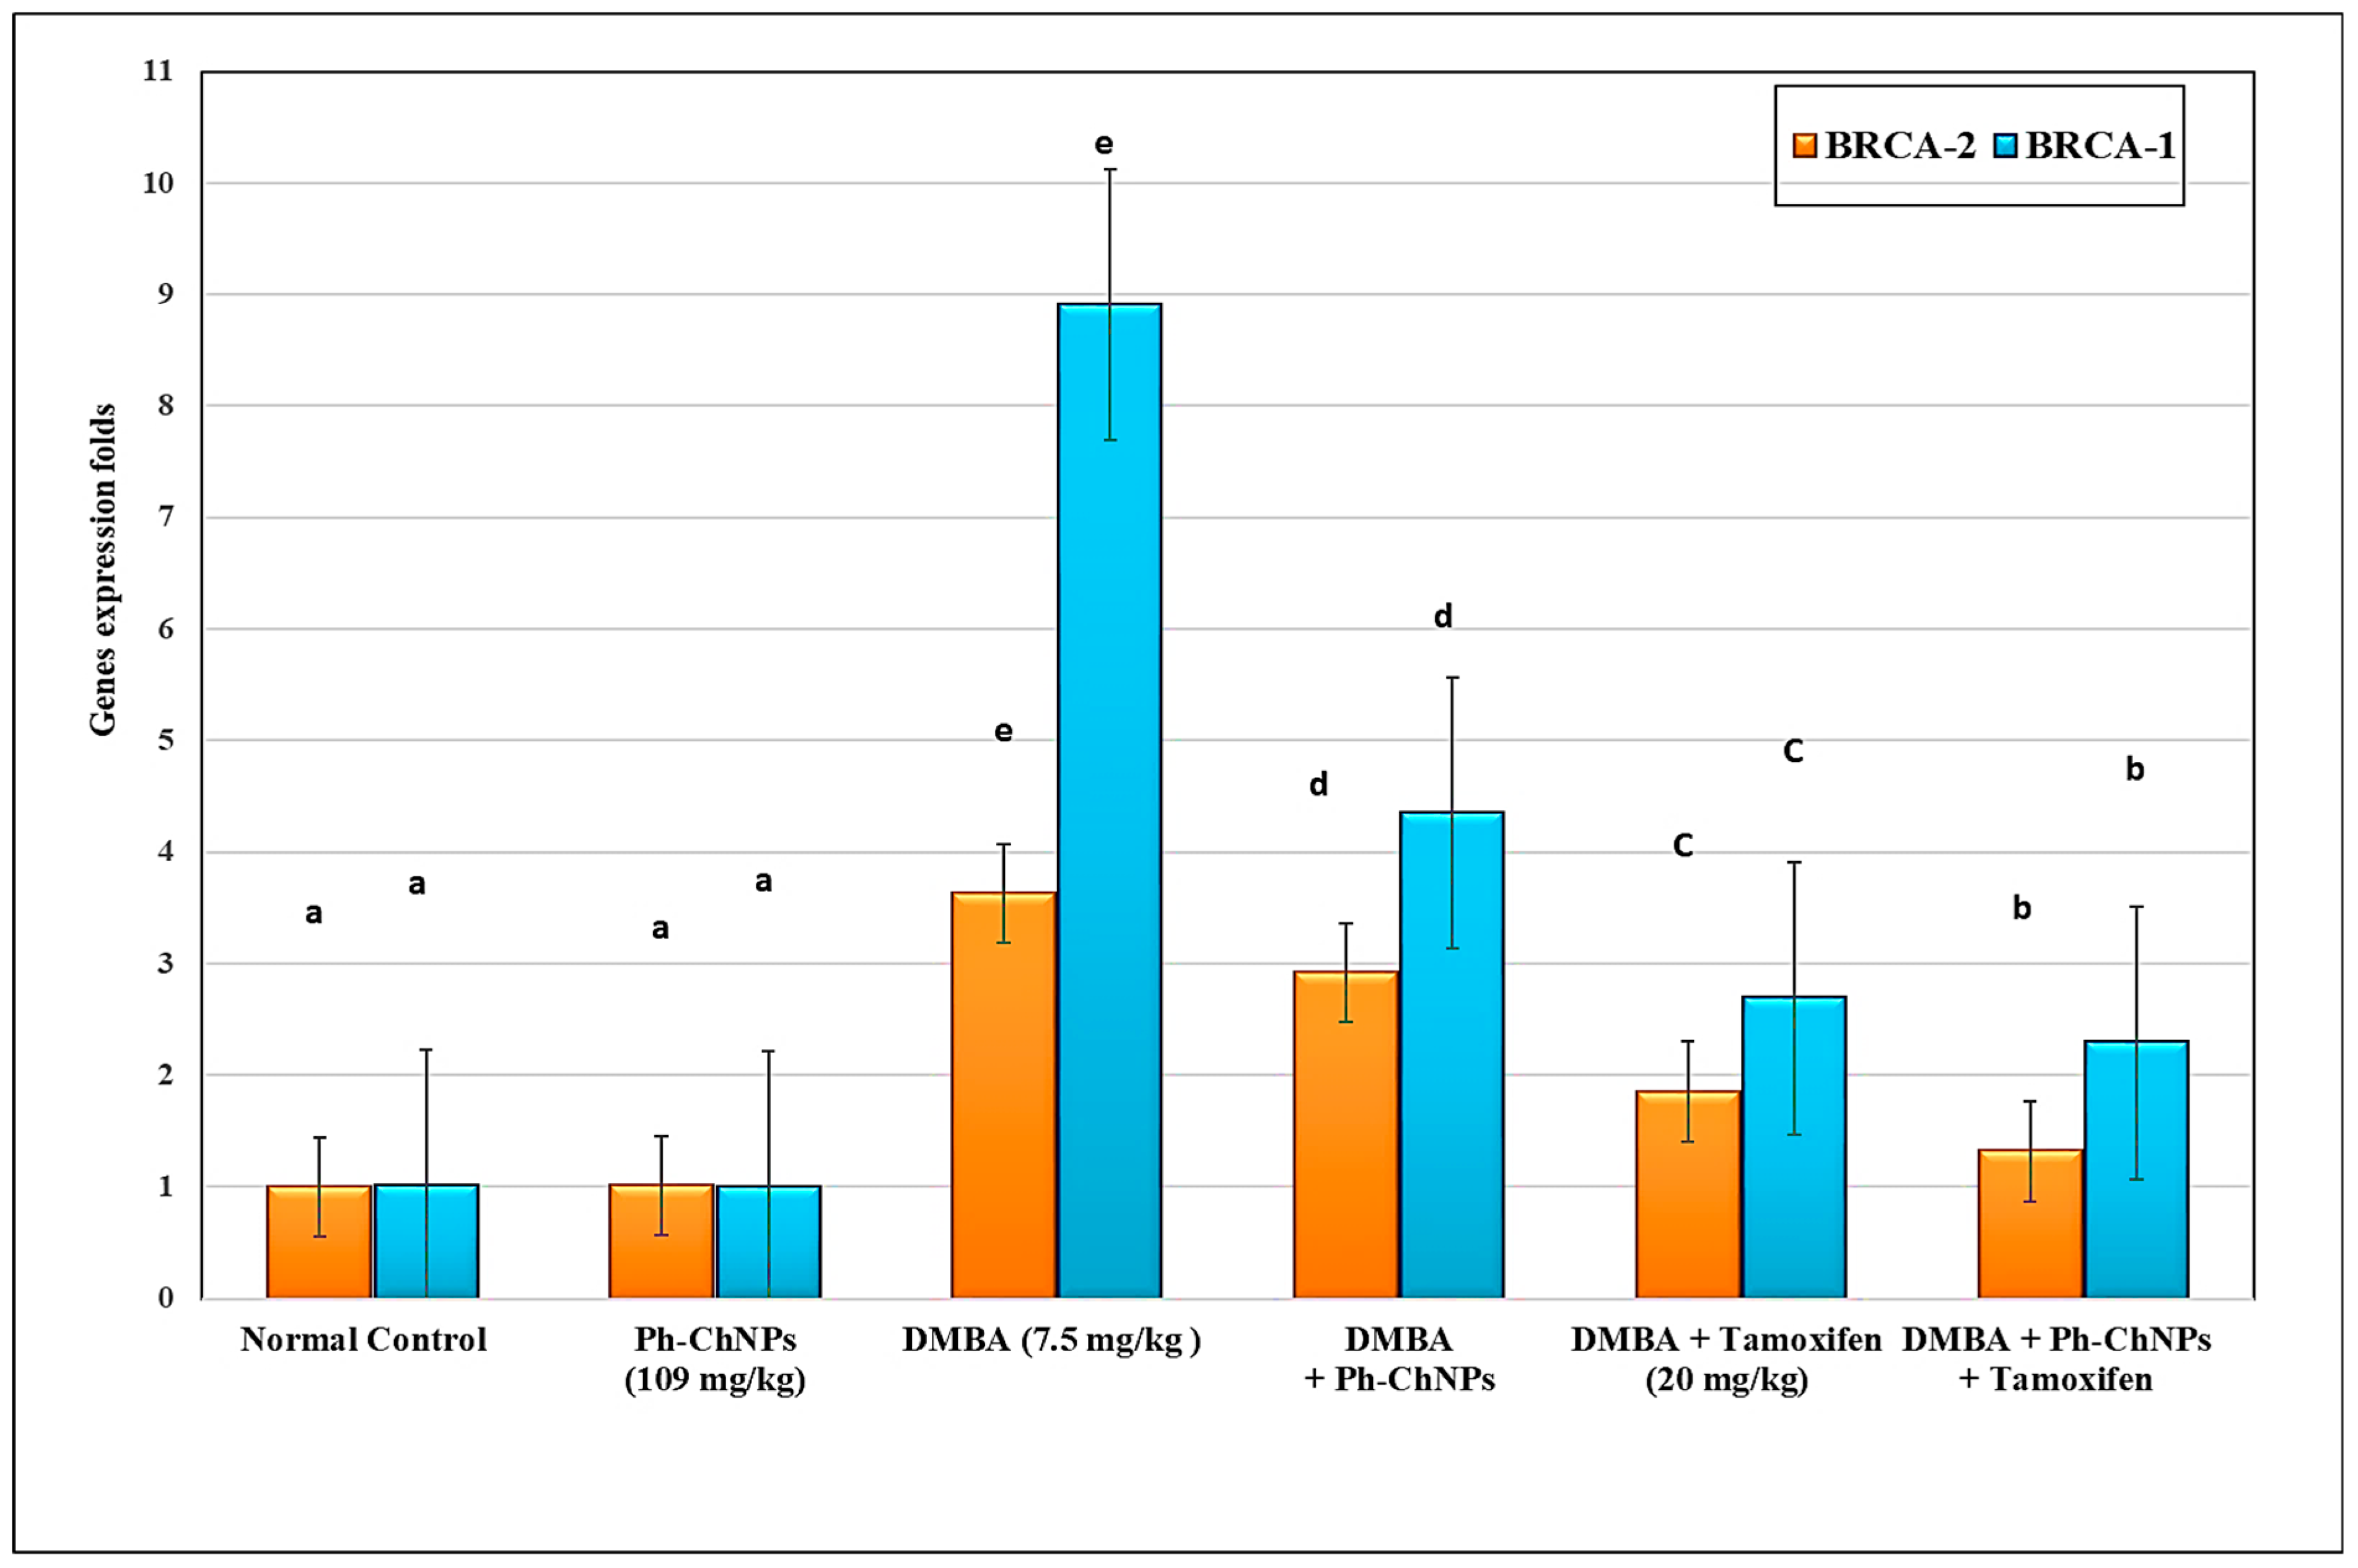
Both BRCA1 and BRCA2 gene were assayed using Real-Time Quantitative Polymerase Chain Reaction (RT-qPCR). The results, shown in Figure 8, illustrate no significant change in the levels of breast BRCA1 and BRCA2 gene expression in normal mice when treated with Ph-ChNPs (109 mg/kg BW), compared to the normal control group. Compared to normal mice, DMBA-injected mice (GIII) have substantially increased (p < 0.05) breast BRCA1 and BRCA2 gene expression levels by 363.0% and 791.0%, respectively. When mice were given Ph-ChNPs (109 mg/kg BW) (GIV), their BRCA1 and BRCA2 gene expression levels dropped significantly (p < 0.05) by 19.56% and 51.18%, respectively, compared to mice that were injected with DMBA (p < 0.05). When DMBA injected mice were treated with tamoxifen (2 mg/kg BW) (GV), the levels of the BRCA1 and BRCA2 gene expression in their breasts dropped by 49.03% and 92.28%, respectively. In addition, administration of Ph-ChNPs and tamoxifen together (GVI) decreased breast BRCA1 and BRCA2 gene expression levels by 63.25% and 74.29%, respectively (p < 0.05).

Figure 8.
Effect of Ph-ChNPs and tamoxifen on breast BRCA1 and BRCA2 gene expression levels in treated mice. Data are presented as mean ± SD (n = 3). The high significant levels of the parameters were in the order of alphabet a < b < c < d < e. Data with superscript “a” are significantly lower than data with superscript “b” while data with “b” are lower than data with superscript “c, d and e” at p < 0.05.
The current investigation provides valuable insights into the effects of Ph-ChNPs and tamoxifen on BRCA1 and BRCA2 gene expression in mice. In normal mice, Ph-ChNPs did not significantly alter BRCA1 and BRCA2 gene expression levels, indicating no adverse effects on these genes in healthy tissue. However, DMBA-injected mice showed a substantial increase in BRCA1 and BRCA2 gene expression, highlighting the carcinogenic impact of DMBA. Treatment with Ph-ChNPs significantly reduced these elevated levels, suggesting a potential therapeutic effect. Tamoxifen treatment in DMBA-injected mice resulted in a more pronounced reduction in BRCA1 and BRCA2 gene expression. Interestingly, the combination of Ph-ChNPs and tamoxifen led to an even greater decrease in BRCA1 and BRCA2 gene expression. Our results were confirmed with the results of DeCensi et al. [70], who showed that low-dose tamoxifen can effectively modulate breast cancer markers. These findings underscore the promising role of Ph-ChNPs, alone and in combination with tamoxifen, in regulating BRCA1 and BRCA2 gene expression and potentially improving therapeutic outcomes in breast cancer.
3.6. Histological Alteration of Breast Tissues of Different Treated Mice Groups
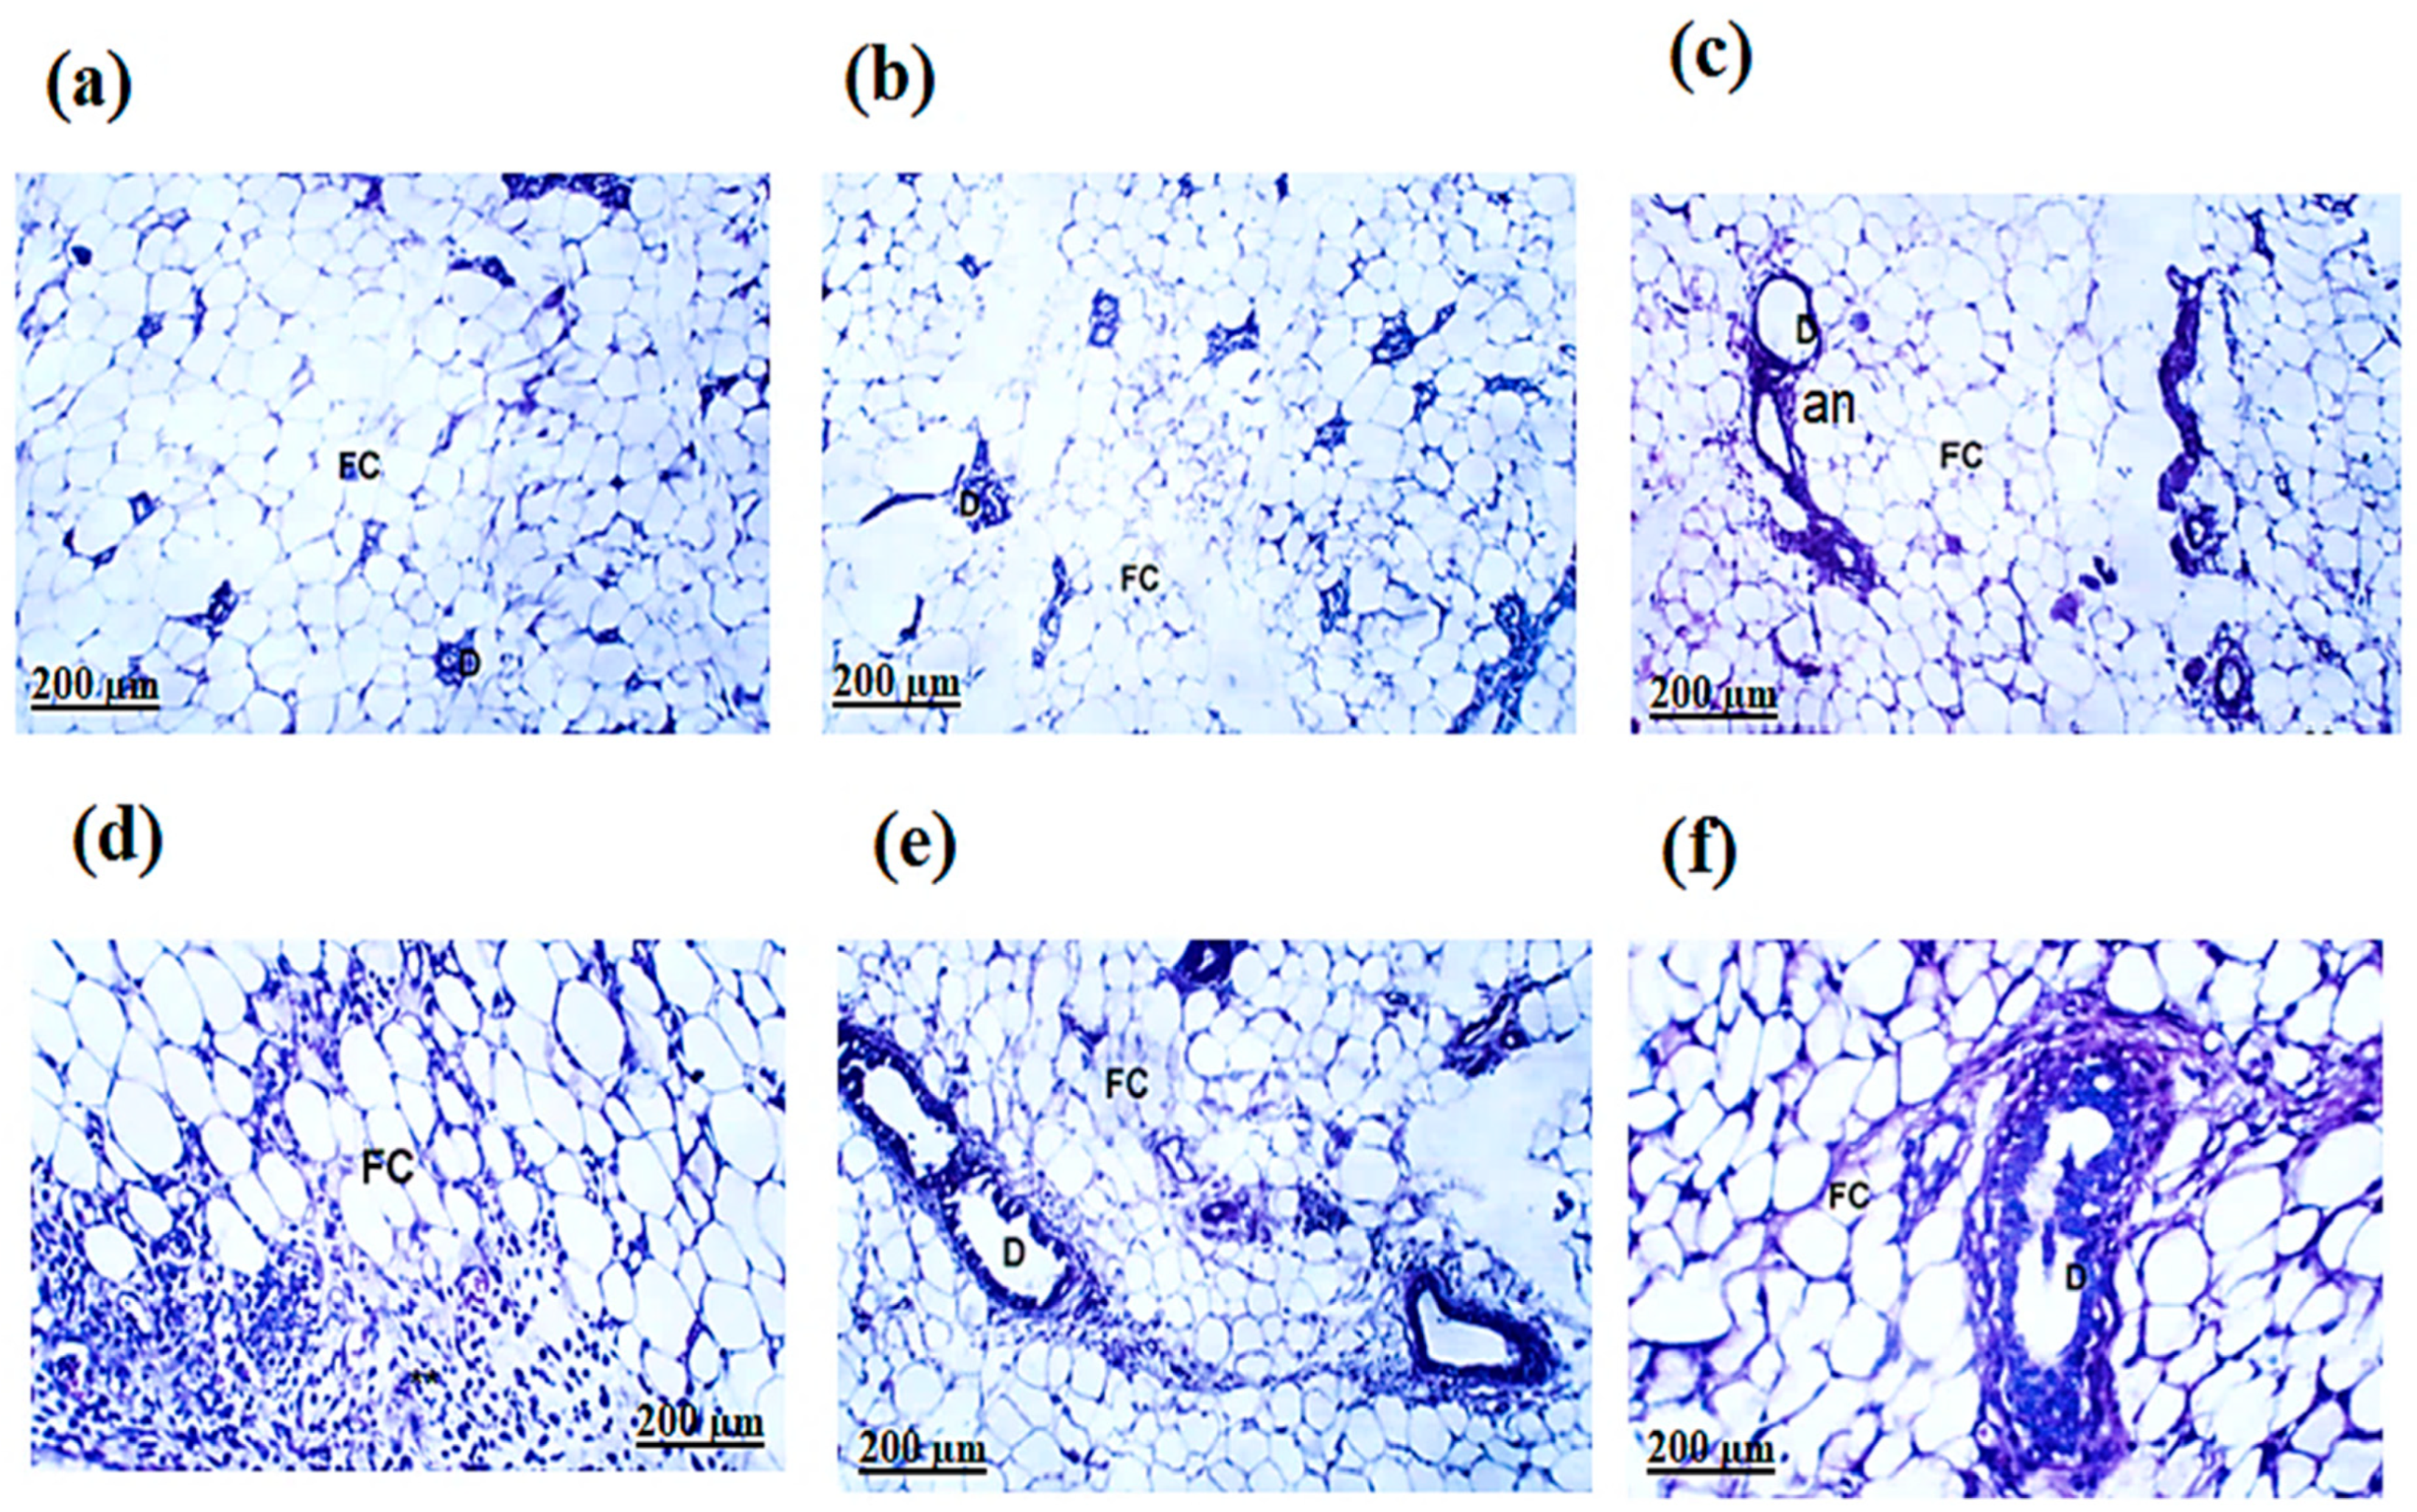
The H&E-stained sections of the mammary glands in the normal and Ph-ChNPs (109 mg/kg BW) treated mice and revealed lactiferous ducts lined with a single layer of well-organized epithelial cells. These cells, ranging from cuboidal to columnar shapes, had prominent nuclei. The ducts had clear lumens and the surrounding connective tissue was primarily composed of interconnected adipose cells (Figure 9a,b). Also, Figure 9c revealed a dense aggregation of cells from the solid tumor tissue, showing substantial growth. These cells formed solid layers of undifferentiated tumor cells. The malignant cells displayed tumor-like characteristics, including increased anaplasia, pleomorphism and abnormal mitotic activity. Remarkably, Ph-ChNPs treatment of DMAB-injected mice significantly improved the histopathological variation of the mammary glands, except for areas still showing substantial anaplastic alterations (Figure 9d). Intriguingly, despite the presence of numerous apoptotic cells and a sizable number of persistent tumor cells, the study revealed an average decrease in tumor development in DMBA + tamoxifen-treated mice. The tumor cells exhibited widespread, necrotic and non-cohesive penetration, lacking stiffness (Figure 9e), adding a layer of complexity to the findings. Moreover, most of the tumor cells in mice treated with the combination of Ph-ChNPs and tamoxifen showed significant signs of necrosis and apoptosis. The tumors’ growth notably slowed, revealing large regions filled with apoptotic cells and numerous tumor cell remnants (Figure 9f). This striking observation underscores the potential effectiveness of the combined treatment in combating tumor progression.

Figure 9.
Histological examination of breast sections. (a) Group I, normal group; (b) Group II was injected with Ph-ChNPs (109 mg/kg BW); (c) Group III was injected with DMBA (7.5 mg/kg BW); (d) Group IV was injected with DMBA+ Ph-ChNPs; (e) was injected with DMBA + tamoxifen (20 mg/kg BW); (f) was injected with DMBA + Ph-ChNPs + tamoxifen. Abbreviations: Fat cell (FC), lactiferous ducts (D), anaplastic (an), cancer cells and fibrous tissue (F).
The histopathological examination of the mammary glands in normal and Ph-ChNPs-treated mice showed well-organized lactiferous ducts with clear lumens and epithelial cells ranging from cuboidal to columnar shapes. In contrast, DMBA-injected mice displayed dense aggregations of undifferentiated tumor cells with increased anaplasia and abnormal mitotic activity. Ph-ChNPs treatment significantly improved these histopathological variations, although some anaplastic alterations remained. Tamoxifen-treated mice showed a decrease in tumor development, with widespread necrosis and non-cohesive tumor cells. Notably, the combination of Ph-ChNPs and tamoxifen resulted in significant apoptosis of tumor cells, suggesting a synergistic effect of the combined treatment. This combination enhances the therapeutic efficacy, leading to more extensive tumor cell death and reduced tumor progression.
Limitations of the Current Study
While this study provides promising insights into the potential of Ph-ChNPs and tamoxifen in breast cancer treatment, it is important to acknowledge its limitations. Future studies will assess Ph-ChNPs’ selectivity using non-cancerous cell lines (e.g., MCF-10A) to evaluate therapeutic safety. The use of an animal model means the results may not fully translate to humans and the specific dosages and administration methods require further optimization for clinical application. Additionally, the study focuses on short-term outcomes, leaving long-term effects and potential side effects unexplored. The exact molecular mechanisms behind the observed effects need further investigation and extensive clinical trials are necessary to confirm the safety and efficacy of this combination therapy in human patients. Addressing these limitations will be crucial for advancing Ph-ChNPs and tamoxifen as viable treatments for breast cancer.
4. Conclusions
This study highlights the significant potential of Ph-ChNPs and tamoxifen in breast cancer treatment. The findings demonstrate that Ph-ChNPs, alone and in combination with tamoxifen, can effectively reduce tumor growth and induce apoptosis in breast cancer cells, suggesting a promising therapeutic strategy. The safety of Ph-ChNPs in normal tissue further supports their potential for clinical application. The results showed that Ph-ChNPs had a minimal impact on cell viability at lower concentrations but significantly reduced cancer cell viability at higher doses, indicating dose-dependent cytotoxicity. Biochemical measurements revealed that Ph-ChNPs significantly improved antioxidant enzyme levels and reduced oxidative stress markers in breast cancer tissue, while also modulating key apoptotic and inflammatory markers. Additionally, Ph-ChNPs and tamoxifen significantly reduced BRCA1 and BRCA2 gene expression in DMBA-injected mice, highlighting their potential to modulate these critical genes involved in breast cancer. However, the study’s limitations, including the use of an animal model, the need for dosage optimization and the necessity for long-term and mechanistic studies, must be addressed in future research. Overall, this research provides a strong foundation for developing more effective and targeted breast cancer therapies, offering hope for improved treatment outcomes.
Author Contributions
Conceptualization, A.A.A. and S.F.M.; methodology, A.A.A. and S.F.M.; investigation, resources, data curation: A.A.A.; writing—original draft: A.A.A. writing—review and editing: S.F.M. All authors have read and agreed to the published version of the manuscript.
Funding
This research received no external funding.
Institutional Review Board Statement
Not applicable.
Informed Consent Statement
Not applicable.
Data Availability Statement
The data presented in this study are available upon request from the corresponding author.
Conflicts of Interest
The authors declare no conflicts of interest.
References
- World Health Organization (WHO). Breast Cancer. Available online: https://www.who.int/news-room/fact-sheets/detail/breast-cancer (accessed on 13 March 2024).
- Yin, S.Y.; Wei, W.C.; Jian, F.Y.; Yang, N.S. Therapeutic applications of herbal medicines for cancer patients. Evid. Based Complement. Altern. Med. 2013, 2013, 302426. [Google Scholar] [CrossRef] [PubMed]
- Sun, L.; Ang, E.; Ang, W.H.D.; Lopez, V. Losing the breast: A meta-synthesis of the impact in women breast cancer survivors. Psychooncology 2018, 27, 376–385. [Google Scholar] [CrossRef] [PubMed]
- American Cancer Association. Chemotherapy for Breast Cancer. Available online: https://www.cancer.org/content/dam/CRC/PDF/Public/8581.00.pdf (accessed on 27 October 2021).
- Cancer Research UK. Chemotherapy for Breast Cancer. Available online: https://www.cancerresearchuk.org/about-cancer/breast-cancer/treatment/chemotherapy (accessed on 11 July 2023).
- Andreani, T.; Cheng, R.; Elbadri, K.; Ferro, C.; Menezes, T.; Santos, M.; Pereira, C.; Santos, H. Natural compounds-based nanomedicines for cancer treatment: Future directions and challenges. Drug Deliv. Transl. Res. 2024, 14, 2845–2916. [Google Scholar] [CrossRef] [PubMed]
- Datta, S.; Saha, P.; Dey, S.; Sinha, D. Natural Products as Chemosensitizers for Adjunct Therapy in Cancer Management. In Pharmacotherapeutic Botanicals for Cancer Chemoprevention; Kumar, M., Sharma, A., Kumar, P., Eds.; Springer: Singapore, 2020. [Google Scholar]
- Tang, Y.; Wang, Y.; Kiani, M.F.; Wang, B. Classification, treatment strategy, and associated drug resistance in breast cancer. Clin. Breast Cancer 2016, 16, 335–343. [Google Scholar] [CrossRef]
- Mao, Y.; Keller, E.T.; Garfield, D.H.; Shen, K.; Wang, J. Stromal cells and tumor microenvironment and breast cancer. Cancer Metastasis Rev. 2013, 32, 303–315. [Google Scholar] [CrossRef]
- Van der Spek, Y.M.; Kroep, J.R.; Tollenaar, R.A.E.M.; Mesker, W.E. Chemotherapy resistance and stromal targets in breast cancer treatment: A review. Mol. Biol. Rep. 2020, 47, 8169–8177. [Google Scholar] [CrossRef]
- Hussein, M.A.; Soad Mohamed, A.G. In vivo Hepato-protective Properties of Purslane Extracts on Paracetamol-Induced Liver Damage. Malays. J. Nutr. 2010, 16, 161–170. [Google Scholar]
- Mohamad, E.A.; Mohamed, Z.N.; Hussein, M.A.; Elneklawi, M.S. GANE can improve lung fibrosis by reducing inflammation via promoting p38MAPK/TGF-β1/NF-κB signaling pathway downregulation. ACS Omega 2022, 7, 3109–3120. [Google Scholar] [CrossRef]
- Aly, S.H.; Abulsoud, A.I.; Moustafa, Y.M.; Abdel Mageed, S.S.; Abdelmaksoud, N.M.; El-Dakroury, W.A.; Mohammed, O.A.; Abdel-Reheim, M.A.; Zaki, M.B.; Rizk, N.I.; et al. Harnessing natural compounds to modulate miRNAs in breast cancer therapy. Funct. Integr. Genom. 2024, 24, 211. [Google Scholar] [CrossRef]
- El Gizawy, H.A.; Abo-Salem, H.M.; Ali, A.A.; Hussein, M.A. Phenolic profiling and therapeutic potential of certain isolated compounds from Parkia roxburghii against AChE activity as well as GABA A α5, GSK-3β, and p38α MAP-kinase genes. ACS Omega 2021, 6, 20492–20511. [Google Scholar] [CrossRef]
- Ortíz, R.; Quiñonero, F.; Beatriz García-Pinel, B.; Marco Fuel, M.; Mesas, C.; Cabeza, L.; Melguizo, C.; Prados, J. Nanomedicine to Overcome Multidrug Resistance Mechanisms in Colon and Pancreatic Cancer: Recent Progress. Cancers 2021, 13, 2058. [Google Scholar] [CrossRef] [PubMed]
- Teoh, P.L.; Liau, M.; Cheong, B.E. Phylanodiflora L. Extracts induce apoptosis and cell cycle arrest in human breast cancer cell line, MCF-7. Nutr. Cancer 2019, 71, 668–675. [Google Scholar] [CrossRef] [PubMed]
- Li, X.; Qu, L.; Dong, Y.; Han, L.; Liu, E.; Fang, S. A review of recent research progress on the astragalus genus. Molecules 2014, 19, 18850–18880. [Google Scholar] [CrossRef] [PubMed]
- Nguyen, D.D.; Lai, J.Y. Advancing the stimuli response of polymer-based drug delivery systems for ocular disease treatment, Polym. Chem. 2020, 11, 6988–7008. [Google Scholar]
- Agarwal, M.; Agarwal, M.K.; Shrivastav, N.; Pandey, S.; Das, R.; Gaur, P. Preparation of Chitosan Nanoparticles and their in-vitro Characterization. Int. J. Life. Sci. Scienti. Res. 2018, 4, 1713–1720. [Google Scholar] [CrossRef]
- Jafari, A.M.; Morsali, A.; Bozorgmehr, M.R.; Beyramabadi, S.A.; Mohseni, S. Modeling and characterization of lenalidomide-loaded tripolyphosphate-crosslinked chitosan nanoparticles for anticancer drug delivery, Int. J. Biol. Macromol. 2024, 260, 129360. [Google Scholar] [CrossRef]
- Elrod, H.A.; Sun, S.Y. PPARgamma and Apoptosis in Cancer. PPAR Res. 2008, 2008, 704165. [Google Scholar] [CrossRef]
- Flamant, L.; Notte, A.; Ninane, N.; Raes, M.; Michiels, C. Anti-apoptotic role of HIF-1 and AP-1 in paclitaxel exposed breast cancer cells under hypoxia. Mol. Cancer 2010, 9, 191. [Google Scholar] [CrossRef]
- Üremiş, N.; Üremiş, M.M.; Çiğremiş, Y.; Tosun, E.; Baysar, A.; Türköz, Y. Cucurbitacin I exhibit anticancer efficacy through induction of apoptosis and modulation of JAK/STAT3, MAPK/ERK, and AKT/mTOR signaling pathways in HepG2 cell line. J. Food Biochem. 2022, 46, e14333. [Google Scholar] [CrossRef]
- Xu, D.; Shen, H.; Tian, M.; Chen, W.; Zhang, X. Cucurbitacin I inhibit the proliferation of pancreatic cancer through the JAK2/STAT3 signalling pathway in vivo and in vitro. J. Cancer 2022, 13, 2050–2060. [Google Scholar] [CrossRef]
- Mariadoss, A.V.A.; Vinayagam, R.; Senthilkumar, V.; Paulpandi, M.; Murugan, K.; Xu, B.; Gothandam, K.M.; Kotakadi, V.S.; David, E. Phloretin loaded chitosan nanoparticles augments the pH-dependent mitochondrial-mediated intrinsic apoptosis in human oral cancer cells. Int. J. Biol. Macromol. 2019, 130, 997–1008. [Google Scholar] [CrossRef] [PubMed]
- Alsanea, S.; Gao, M.; Liu, D. Phloretin prevents high-fat diet-induced obesity and improves metabolic homeostasis. AAPS J. 2017, 19, 797–805. [Google Scholar] [CrossRef] [PubMed]
- Wang, Y.; Li, D.; Lin, H.; Jiang, S.; Han, L.; Hou, S.; Lin, S.; Cheng, Z.; Bian, W.; Zhang, X.; et al. Enhanced oral bioavailability and bioefficacy of phloretin using mixed polymeric modified self-nanoemulsions. Food Sci. Nutr. 2020, 8, 3545–3558. [Google Scholar] [CrossRef] [PubMed]
- Abu-Azzam, O.; Nasr, M. In vitro anti-inflammatory potential of phloretin microemulsion as a new formulation for prospective treatment of vaginitis. Pharm. Dev. Technol. 2020, 25, 930–935. [Google Scholar] [CrossRef]
- Alamir, M.; Hussein, M.A.; Aboud, H.; Khedr, M.; Zanaty, M. Optimization of phloretin-loaded nanospanlastics for targeting of FAS/SREBP1c/AMPK/OB-Rb signaling pathway in HFD-induced obesity. Curr. Pharm. Biotechnol. 2024, 26, 92–107. [Google Scholar] [CrossRef]
- Kakkar, S.; Kaur, I.P. Spanlastics—A novel Nano vesicular carrier system for ocular delivery. Int. J. Pharm. 2011, 413, 202–210. [Google Scholar] [CrossRef]
- Fazil, M.; Md, S.; Haque, S.; Kumar, M.; Baboota, S.; Sahni, J.; Ali, J. Development and evaluation of rivastigmine loaded chitosan nanoparticles for brain targeting. Eur. J. Pharm. Sci. 2012, 47, 6–15. [Google Scholar] [CrossRef]
- Song, H.; Su, C.; Cui, W.; Zhu, B.; Liu, L.; Chen, Z.; Zhao, L. Folic acid-chitosan conjugated nanoparticles for improving tumor-targeted drug delivery. Biomed. Res. Int. 2013, 2013, 723158. [Google Scholar] [CrossRef]
- Salar, R.K.; Kumar, N. Synthesis and characterization of vincristine loaded folic acid–chitosan conjugated nanoparticles. Resour.-Effic. Technol. 2016, 2, 199–214. [Google Scholar]
- Santosh, K.B.Y.; Arun, M.I.; Mohan, K.G.C.; Inamuddin; Abdullah, M.A. Nanohydroxyapatite reinforced chitosan composite Hydrogel with tunable mechanical and biological properties for cartilage regeneration. Sci. Rep. 2019, 9, 15957. [Google Scholar]
- Abeer, A.A.; Sahera, F.M. New Carrageenan/2-Dimethyl Aminoethyl Methacrylate/Gelatin/ZnO Nanocomposite as a Localized Drug Delivery System with Synergistic Biomedical Applications. Processes 2024, 12, 2702. [Google Scholar] [CrossRef]
- Abal, P.; Louzao, M.C.; Antelo, A.; Alvarez, M.; Cagide, E.; Vilariño, N. Acute oral toxicity of tetrodotoxin in mice: Determination of lethal dose 50 (LD50) and no observed adverse effect level (NOAEL). Toxins 2017, 9, 75. [Google Scholar] [CrossRef] [PubMed]
- Sabaa, M.; Sharawy, M.H.; El-Sherbiny, M.; Said, E.; Salem, H.A.; Ibrahim, T.M. Canagliflozin interrupts mTOR-mediated inflammatory signaling and attenuates DMBA-induced mammary cell carcinoma in rats. Biomed. Pharmacother. 2022, 155, 113675. [Google Scholar] [CrossRef] [PubMed]
- Elia, S.G.; Al-Karmalawy, A.A.; Nasr, M.Y.; Elshal, M.F. Loperamide potentiates doxorubicin sensitivity in triple-negative breast cancer cells by targeting MDR1 and JNK and suppressing mTOR and Bcl-2: In vitro and molecular docking study. J. Biochem. Mol. Toxicol. 2022, 36, e22938. [Google Scholar] [CrossRef]
- Fossati, P.; Prencipe, L. Serum triacylglycerols determined calorimetrically with an enzyme that produces hydrogen peroxide. Clin. Chem. 1982, 1, 2077–2080. [Google Scholar] [CrossRef]
- Allain, C.C.; Poon, L.S.; Chan, C.S.; Richmond, W.; Fu, P.C. Enzymatic determination of total serum cholesterol. Clin. Chem. 1974, 4, 470–475. [Google Scholar] [CrossRef]
- Burnstein, M.; Selvenick, H.R.; Morfin, R. Rapid method for isolation of lipoprotein from human serum with polyanions. J. Lipid Res. 1970, 11, 583–595. [Google Scholar] [CrossRef]
- Owen, J.B.; Butterfield, D.A. Measurement of oxidized/reduced glutathione ratio. Methods Mol. Biol. 2010, 648, 269–277. [Google Scholar]
- Kakkar, P.; Das, B.; Visvanathan, P. A modified spectrophotometric assay of SOD. Indian. J. Biochem. Biophys. 1984, 21, 130–132. [Google Scholar]
- Aebi, H. Catalase in vitro. Methods Enzymol. 1984, 105, 121–126. [Google Scholar]
- Tsikas, D. Assessment of lipid peroxidation by measuring malondialdehyde (MDA) and relatives in biological samples: Analytical and biological challenges. Anal. Biochem. 2017, 524, 13–30. [Google Scholar] [CrossRef] [PubMed]
- Bancroft, G.D.; Steven, A. Theory and Practice of Histological Technique, 4th ed.; Churchill Livingstone: New York, NY, USA, 1983; pp. 99–112. [Google Scholar]
- Antoniou, V.; Mourelatou, E.A.; Galatou, E.; Avgoustakis, K.; Hatziantoniou, S. Gene Therapy with Chitosan Nanoparticles: Modern Formulation Strategies for Enhancing Cancer Cell Transfection. Pharmaceutics 2024, 16, 868. [Google Scholar] [CrossRef] [PubMed]
- Bhattacharjee, S. DLS and zeta potential—What they are and what they are not? J. Control. Release 2016, 235, 337–351. [Google Scholar] [CrossRef]
- Yadav, A.S.; Radharani, N.N.V.; Gorain, M.; Bulbule, A.; Shetti, D.; Roy, G.; Baby, T.; Kundu, G.C. RGD functionalized chitosan nanoparticle mediated targeted delivery of raloxifene selectively suppresses angiogenesis and tumor growth in breast cancer. Nanoscale 2020, 21, 10664–10684. [Google Scholar] [CrossRef]
- Sethuraman, S.P.; Velemurugan, S.; Raju, K.; Velayutham, N.K.; Ahmed, M.; Santhanabharathi, B.; Musthafa, M. Physalis Genus, a Plant Source against Breast Cancer on MCF-7 Cell Line: A Systematic Review. Curr. Pharmacol. Rep. 2024, 10, 454–466. [Google Scholar] [CrossRef]
- Shaikh, S.B.; Tambe, P.; Mujahid, Y.; Santra, M.; Biersack, B.; Ahmed, K. Targeting growth of breast cancer cell line (MCF-7) with curcumin-pyrimidine analogs. J. Chem. Sci. 2022, 134, 123. [Google Scholar] [CrossRef]
- Aniogo, E.C.; George, B.P.; Abrahamse, H. Characterization of resistant MCF-7 breast cancer cells developed by repeated cycles of photodynamic therapy. Front Pharmacol. 2022, 13, 964141. [Google Scholar] [CrossRef]
- Mansouri, S.; Alharbi, Y.; Alqahtani, A. Current status and prospects for improved targeted delivery approaches for cancer. Pathol. Res. Pract. 2024, 253, 154993. [Google Scholar] [CrossRef]
- Erhirhie, E.O.; Ihekwereme, C.P.; Ilodigwe, E.E. Advances in acute toxicity testing: Strengths, weaknesses and regulatory acceptance. Interdiscip. Toxicol. 2018, 11, 5–12. [Google Scholar] [CrossRef]
- Fayed, A.; Ibrahem, M.A.; Hassan, S.A.; Hussein, M.A.; Roshdy, T. Cranberry extract as a promising functional food to regulate srebp1/ppar–α/cpt-1/aco signaling pathways in HFD-induced obesity in rats. Adv. Anim. Vet. Sci. 2022, 10, 1933–1944. [Google Scholar] [CrossRef]
- Haberl, E.M.; Pohl, R.; Rein-Fischboeck, L.; Höring, M.; Krautbauer, S.; Liebisch, G.; Buechler, C. Hepatic lipid profile in mice fed a choline-deficient, low-methionine diet resembles human non-alcoholic fatty liver disease. Lipids Health Dis. 2020, 19, 250. [Google Scholar] [CrossRef] [PubMed]
- Wang, X.; Wu, L.; Tao, J.; Ye, H.; Wang, J.; Gao, R.; Liu, W. A lipidomic approach to bisphenol F-induced non-alcoholic fatty liver disease-like changes: Altered lipid components in a murine model. Environ. Sci. Pollut. Res. 2023, 30, 112644–112659. [Google Scholar] [CrossRef] [PubMed]
- Mouskeftara, T.; Deda, O.; Papadopoulos, G.; Chatzigeorgiou, A.; Gika, H. Lipidomic Analysis of Liver and Adipose Tissue in a High-Fat Diet-Induced Non-Alcoholic Fatty Liver Disease Mice Model Reveals Alterations in Lipid Metabolism by Weight Loss and Aerobic Exercise. Molecules 2024, 29, 1494. [Google Scholar] [CrossRef] [PubMed]
- Vilchis-Landeros, M.M.; Vázquez-Meza, H.; Vázquez-Carrada, M.; Uribe-Ramírez, D.; Matuz-Mares, D. Antioxidant Enzymes and Their Potential Use in Breast Cancer Treatment. Int. J. Mol. Sci. 2024, 25, 5675. [Google Scholar] [CrossRef]
- Huang, S.; Xu, Z.; Zhi, W.; Li, Y.; Hu, Y.; Zhao, F.; Zhu, X.; Mingsan Miao, M.; Jia, Y. pH/GSH dual-responsive nanoparticle for auto-amplified tumor therapy of breast cancer. J. Nanobiotechnol. 2024, 22, 324. [Google Scholar] [CrossRef]
- Gobba, N.A.E.K.; Hussein Ali, A.; El Sharawy, D.E.; Hussein, M.A. The potential hazardous effect of exposure to iron dust in Egyptian smoking and nonsmoking welders. Arch. Environ. Occup. Health 2018, 73, 189–202. [Google Scholar] [CrossRef]
- Boshra, S.A.; Hussein, M.A. Cranberry extract as a supplemented food in treatment of oxidative stress and breast cancer induced by N-Methyl-N-Nitrosourea in female virgin rats. Int. J. Phytomed. 2016, 8, 217–227. [Google Scholar]
- Mostafa, M.M.; Amin, M.M.; Zakaria, M.Y.; Hussein, M.A.; Shamaa, M.M.; Abd El-Halim, S.M. Chitosan Surface-Modified PLGA Nanoparticles Loaded with Cranberry Powder Extract as a Potential Oral Delivery Platform for Targeting Colon Cancer Cells. Pharmaceutics 2023, 15, 606. [Google Scholar] [CrossRef]
- Soliman, S.; Mosallam, S.; Mamdouh, M.A.; Hussein, M.A.; Abd El-Halim, S. Design and optimization of cranberry extract loaded bile salt augmented liposomes for targeting of MCP-1/STAT3/VEGF signaling pathway in DMN-intoxicated liver in rats. Drug Deliv. 2022, 29, 427–439. [Google Scholar] [CrossRef]
- Hall, M.; Peters, G. Genetic alterations of cyclins, cyclin-dependent kinases, and cdk inhibitors in human cancer Adv. Cancer Res. 1996, 68, 67–108. [Google Scholar]
- Kishimoto, T. Interleukin-6: From basic science to medicine—40 years in immunology. Annu. Rev. Immunol. 2005, 23, 1–21. [Google Scholar] [CrossRef] [PubMed]
- Payton, M.; Coats, S. Cyclin E2, the cycle continues. Int. J. Biochem. Cell Biol. 2002, 34, 315–320. [Google Scholar] [CrossRef] [PubMed]
- Mosaad, Y.O.; Hussein, M.A.; Ateyya, H.; Mohamed, A.H.; Ali, A.A.; Ramadan, Y.A.; Wink, M.; El-Kholy, A.A. Vanin 1 Gene Role in Modulation of INOS/MCP-1/TGF-β1 Signaling Pathway in Obese Diabetic Patients. J. Inflamm. Res. 2022, 15, 6745–6759. [Google Scholar] [CrossRef]
- Emara, A.; Abd Elrahman, A.M.; Hassan, A.; Abdelghaney, A.; Bastawey, A.M.; Maher, A.; Al-Wadayi, A.M.; Shalaby, A.M.; Mohamed, M.M.; Gamal El Din, M.A.; et al. CEG-AgNPs Ameliorates DMBA-Induced Mammary Carcinogenicity by Alleviating Cytokines Expression. Pak. J. Biol. Sci. 2022, 25, 485–494. [Google Scholar]
- DeCensi, A.; Puntoni, M.; Johansson, H.; Guerrieri-Gonzaga, A.; Caviglia, S.; Avino, F.; Cortesi, L.; Ponti, A.; Pacquola, M.G.; Falcini, F.; et al. Effect Modifiers of Low-Dose Tamoxifen in a Randomized Trial in Breast Noninvasive Disease. Clin. Cancer Res. 2021, 27, 3576–3583. [Google Scholar] [CrossRef]
Disclaimer/Publisher’s Note: The statements, opinions and data contained in all publications are solely those of the individual author(s) and contributor(s) and not of MDPI and/or the editor(s). MDPI and/or the editor(s) disclaim responsibility for any injury to people or property resulting from any ideas, methods, instructions or products referred to in the content. |
© 2025 by the authors. Licensee MDPI, Basel, Switzerland. This article is an open access article distributed under the terms and conditions of the Creative Commons Attribution (CC BY) license (https://creativecommons.org/licenses/by/4.0/).