Next Article in Journal
The Interventions of a Mobile Mental Health Unit on the Refugee Crisis on a Greek Island
Next Article in Special Issue
Psychotherapy as a Polyphonic and Playful Conversation
Previous Article in Journal
An Introduction to Factored Regression Models with Blimp
Previous Article in Special Issue
Empirical Evidence for the Functionality Hypothesis in Motor Learning: The Effect of an Attentional Focus Is Task Dependent
 
 
psych-logo
Article Menu
Please note that, as of 22 March 2024, Psych has been renamed to Psychology International and is now published here.
Article

Validation of the Visual Cognitive Assessment Test (VCAT) for the Early Diagnosis of Cognitive Impairment in Multilingual Population in Malaysia

by
Li Yun Ng
1,*,
Chen Joo Chin
1,
Monica Danial
1,
Stephenie Ann Albart
1,
Purnima Devi Suppiah
1,
Kurubaran Ganasegeran
1,
Wei Theng Tan
1,
Hung Eun Hoo
1,
Ewe Eow Teh
2,
Gaaitheri Karupiah
2,
Laavanya Vijaya Kumar
2,
Wen Mei Choong
2,
Hooi Ling Tan
2,
Szer Lik Yeap
2,
Al-Zilal Abdul Wahid
2,
Khian Boon Ng
2,
Mohammad Nabhan Khalil
2,
Esther G. Ebenezer
3,
Basanta Kumar Mohanty
3,
Helvinder Kaur
3,
Xin Hui Choo
3,
Wee Kooi Cheah
4,5,
Sreevali Muthuvadivelu
5,
Prema Muninathan
5,
Hoon Lang Teh
6,
Chiann Ni Thiam
6,
Jia Hui Loh
6,
Alan Swee Hock Ch’ng
1,7,
Nagaendran Kandiah
8,9 and
Irene Looi
1,7
add Show full author list remove Hide full author list
1
Clinical Research Centre, Hospital Seberang Jaya, Ministry of Health Malaysia, Seberang Jaya 13700, Malaysia
2
Psychiatric Department, Hospital Pulau Pinang, Ministry of Health Malaysia, George Town 10990, Malaysia
3
Faculty of Medicine, University Kuala Lumpur Royal College of Medicine Perak, Ipoh 31350, Malaysia
4
Medical Department, Hospital Taiping, Ministry of Health Malaysia, Taiping 34000, Malaysia
5
Clinical Research Centre, Hospital Taiping, Ministry of Health Malaysia, Taiping 34000, Malaysia
6
Medical Department, Hospital Sultanah Bahiyah, Ministry of Health Malaysia, Alor Setar 05460, Malaysia
7
Medical Department, Hospital Seberang Jaya, Ministry of Health Malaysia, Seberang Jaya 13700, Malaysia
8
Department of Neurology, National Neuroscience Institute, Singapore 308433, Singapore
9
Duke—NUS Graduate Medical School, Singapore 169857, Singapore
*
Author to whom correspondence should be addressed.
Psych 2022, 4(1), 38-48; https://doi.org/10.3390/psych4010003
Submission received: 27 October 2021 / Revised: 22 November 2021 / Accepted: 14 December 2021 / Published: 1 January 2022
(This article belongs to the Special Issue Prominent Papers in Psych  2021–2023!)

Abstract

:
As Malaysia undergoes a demographic transformation of population aging, the prevalence of dementia is expected to rise, posing a major public health threat issue. Early screening to detect cognitive impairment is important to implement appropriate clinical interventions. The Visual Cognitive Assessment Test (VCAT) is a language-neutral cognitive assessment screening tool suitable for multilingual populations. This study was aimed to validate the VCAT screening tool for the detection of cognitive impairment amongst the population of Malaysia. A total of 184 participants were recruited, comprising 79 cognitively healthy participants (CHP), 46 mild cognitive impairment (MCI) patients, and 59 mild dementia (Alzheimer’s disease and Vascular Dementia) patients from five hospitals between May 2018 and December 2019 to determine the usefulness of VCAT. Diagnostic performance was assessed using area under the curve (AUC), and receiver operating characteristic (ROC) analysies was performed to determine the recommended cutoff scores. ROC analyses for the VCAT was comparable with that of MoCA (Montreal Cognitive Assessment) in differentiating between CHP, MCI, and mild dementia (AD and VaD) participants. The findings of this study suggest the following optimal cutoff score for VCAT: Dementia 0–19, MCI 20–23, Normal 24–30. The mean ± SD time to complete the VCAT was 10.0 ± 2.75 min in the CHP group and 15.4 ± 4.52 min in the CI group. Results showed that 76.0% of subjects thought that the instructions in VCAT were similar or easier to understand compared with MoCA. This study showed that the VCAT is a valid and useful screening tool for patients with cognitive impairment in Malaysia and is feasible to be used in the clinical settings.

1. Introduction

Worldwide, over 46 million people are living with dementia and the number is estimated to increase to reach approximately 131.5 million people by 2050. Dementia has a huge economic impact, whereby the total estimated worldwide cost is USD $818 billion [1]. In Malaysia, the prevalence of dementia was 123,000 people in 2015. This number is projected to be double to about 261,000 people by 2030 and will continue to increase to 590,000 people by 2050 [2]. An urban community study done in Kuala Lumpur among the older Malay people revealed that the prevalence of dementia was 6% [3]. The disability weight of dementia was higher than many other health conditions, and its burdens on health services, community, and institutional care are substantial. Diagnosing dementia at an early stage is essential to establish effective medical interventions and social support networks [4]. Ultimately, the early diagnosis of cognitive impairment can reduce healthcare costs and dementia care burden for patients, caregivers, and the health system [2,5,6,7,8].
The ethnic composition of Malaysians is composed of 69.3% Bumiputera (Malays and other indigenous group), 22.8% Chinese, 6.9% Indians, and 1.0% other ethnicities [9]. Apart from Bahasa Melayu being the national language, few other commonly conversed local languages include English, Mandarin, and Tamil. The diversity in local languages, dialects, cultures, and levels of illiteracy pose significant challenges for the use of appropriate neuropsychological testing instruments during clinical diagnosis [10].
Cognitive tests can provide clinicians with an objective measurement of cognitive function, offering a means to reliably identify the neuropsychological and brain changes reflecting the underlying disease process [11]. There are many cognitive screening tools such as the Mini Mental State Examination (MMSE) [12], the Brief Alzheimer Screen (BAS) test [13], the Mini-Cog test [14], and the MoCA test [15] with good diagnostic performance values to differentiate between demented subjects and normal individuals. Most existing cognitive screening tools originated from the West and were designed for native English speakers. Clinical raters are forced to translate the content of test items into different languages to cater to their non-English speaking clients. As such, this process of translation may alter the intended neuropsychological properties of the test items [16].
The Visual Cognitive Assessment Test (VCAT) is a brief and visual-based assessment tool that was developed by a group of experts in Singapore. It is designed to detect early stages of cognitive impairment by assessing five different cognitive domains - memory, visuospatial function, executive function, language, and attention. It may be more suitable for multicultural and multilingual societies around the world as it offers the advantage of circumventing any need to translate or adapt to other languages or dialects as long as the administrator and participant speak the same language. According to the study published by Kandiah and colleagues in 2015, the sensitivity and the specificity of the VCAT for the diagnosis of early cognitive impairment (MCI and mild AD) were 85.6% and 81.1%, which is comparable to those of the MoCA in the same cohort [17].
A study done by Lim and colleagues in 2018 demonstrated that VCAT was useful in detecting cognitively impaired patients across multinational, multiethnic and multilingual Southeast Asian countries, with MoCA scores but not VCAT performance differing by language of administration [18]. However, in that study, the participants from Malaysia were largely recruited from an urban population with higher education background; as such, the usefulness of VCAT in other states within Malaysia is still unknown. Validating the VCAT for the multilingual and multicultural population in Malaysia is important. If the VCAT is validated, it can be widely used in Malaysia to facilitate the diagnosis of early stages of dementia. Additionally, a standardized cognitive battery may facilitate information flow through the health system. Clinicians can use cognitive evaluation to chart progress as patients with dementia transit between the different healthcare settings for diagnosis, treatment, and management [19]. In this study, we aimed to evaluate the diagnostic performance of VCAT, its feasibility, and its reliability within multilingual rural and urban population settings in Malaysia.

2. Methods

2.1. Study Design, Setting and Duration

This prospective multicenter study was carried out across five hospitals in Northern Malaysia: Hospital Seberang Jaya and Hospital Pulau Pinang within the state of Penang, Hospital Raja Permaisuri Bainun and Hospital Taiping within the state of Perak, and Hospital Sultanah Bahiyah in the state of Kedah. The study was conducted between May 2018 and December 2019.

2.2. Sample Size and Participants Recruitment

The sample size was calculated in accordance to logical justifications as proposed by Lakens [20], and the calculation was calculated based on the probability proportionate to size sampling (PPS) technique. The sample size was computed based on the expected proportion of 25% of patients having memory or cognitively related conditions for the population within the Northern Region of Malaysia, with a desired precision estimate of 0.05 and a power of 90% [21], thus yielding a total sample size of 203. The average number of patients with memory or cognitively related conditions within the past six months was calculated from each hospital’s outpatient psycho-geriatric or memory clinics. A 10% deflation rate on the average number of patients in each hospital was computed, assuming the non-follow-ups, drop-out or did not fulfill the study’s inclusion or exclusion criteria. The proportion of patients to be recruited in each hospital was then calculated by the number of patients in each hospital divided by the total number of patients in all the hospitals, and subsequently each proportion was multiplied by the calculated sample size to determine the number of patients to be recruited for each hospital site based on pre-determined inclusion and exclusion criteria (Table 1). Although 203 patients were approached, the final participatory rate was 91.0%, with nineteen patients being excluded in the final analyses due to drop-out, failing to fulfill the study’s inclusion or exclusion criteria or did not consent to participate in the study.
All participants that fulfilled the inclusion and exclusion criteria and agreed to participate were recruited to this study. Of the 184 participants, 66 participants were recruited from the Neuro-Geriatric Clinic of Hospital Seberang Jaya, 45 participants were recruited from the Psycho-Geriatric Clinic of Hospital Pulau Pinang, 42 participants were recruited from the Memory Clinic of Hospital Raja Permaisuri Bainun, 17 participants were recruited from the Division of Geriatric Medicine, Hospital Taiping, and 14 participants were recruited from the Division of Geriatric Medicine, Hospital Sultanah Bahiyah.
Cognitively healthy participants (CHPs) were recruited from health screening programs organized by the respective psycho-geriatric or memory clinic team of the hospitals, while MCI, mild VaD and mild AD participants were recruited from follow-up patients within the specialist outpatient clinics. Of the 184 participants, 79 participants were CHPs, 46 participants were mild cognitive impairment (MCI), 38 participants were mild Alzheimer’s disease (AD) and 21 participants were mild Vascular Dementia (VaD).

2.3. Study Inclusion, Exclusion and Diagnostic Criteria

Inclusion criteria were CHPs, MCI, VaD, and AD subjects. Classifications of MCI was based on the Petersen’s criteria and the National Institute on Aging and Alzheimer’s Association (NIA-AA) [22]; classification of mild VaD was based on National Institute of Neurological Disorders and Stroke and the Association Internationale pour la Recherché et l’Enseignement en Neurosciences (NINCDS-AIREN) criteria [23]; and classification for mild AD was based on NIA-AA criteria [24]. MCI participants were required to have a Clinical Dementia Rating (CDR) score of 0.5, whereas mild VaD and mild AD participants were required to have a CDR score of 1 [25]. CHPs were required to have no cognitive complaints, and a CDR score of 0. Only participants with at least six years of education and aged 50 years and older were recruited in this study. Participants with a Geriatric Depression Scale (GDS) score of six or more, suggestive of depression, were also excluded [26]. Participants with poor vision were also excluded. After that, participants were classified into two groups, either the CHP group or CI group, which consists of MCI, mild VaD, and mild AD participants.

2.4. Data Collection and Instruments Used

Basic demographic information was collected which include age, gender, ethnicity, years of education and employment status. During each interview, the first accessor administered the CDR, GDS, and MoCA assessments; the second accessor performed the VCAT assessment and blinded from the first accessor to prevent bias. All the assessments were conducted in the same setting. All participants were also given a semi-structured questionnaire to collect their feedback on VCAT.
The VCAT is a 30-point test whereby a higher score denotes higher cognitive functions. The VCAT is comprised of eleven items, which include three memory items (13 points), one attention item (3 points), three executive functioning items (6 points), two visuospatial items (3 points), and two language items (5 points). Instructions are communicated in a language that both the test administrator and the participant are comfortable in conversing in [17].

2.5. Statistical Analyses

Statistical analysis was performed using SPSS version 22. Descriptive analyses were presented for demographic and cognitive data. The association of categorical variables were analyzed using chi-square (X2) or Fisher exact test. Independent t-test was used to perform between-group comparisons on normally distributed continuous data, while the Mann-Whitney test was used to analyze non-normally distributed continuous data. Further analyses were performed using a Generalized Linear Model (GLM) to adjust for confounding demographic variables. Receiver operating characteristic (ROC) analysis was used to determine the best VCAT cutoffs to differentiate: (1) CHPs from patients with cognitive impairment (MCI + mild AD + mild VaD); and (2) MCI from mild dementia (mild AD + mild VaD). Diagnostic performance was assessed using the area under the curve (AUC), sensitivity (Se), specificity (Sp), positive (PPV) and negative predictive values (NPV), and positive (PLR) and negative likelihood ratio (NLR). The ROC curves were compared according to Hanley & McNeil AUC comparison method [27]. Concurrent validity was evaluated using Pearson correlation coefficient (r) with the MoCA. The level of statistical significance tests was set at p < 0.05 with two-tailed distribution. The coefficient McDonald’s Omega for the total VCAT score was yielded to interpret the reliability statistics.

3. Results

3.1. Characteristics of Study Sample

The total sample was 184 participants which consisted of males (43.5%) and females (56.5%), with mean (SD) age of 68.8 (8.75) years old. The sample consisted of 71.7% Chinese, 14.7% Malays, 11.4% Indians and 2.2% of other ethnicities. The majority of the participants were retirees (60.9%) and the mean (SD) years of education was 12.0 (4.75) (Table 2).
There were 79 CHP and 105 CI participants. Between group comparisons, demographic variable age was found to be significantly different (p < 0.001), with the CI group being significantly older (71.5 ± 8.80) than the CHP group (65.3 ± 7.35) (Table 1). Significant gender differences were identified with a higher proportion of females in the CHP group (65.8%), compared to the CI group (49.5%). Participants in the CI group tended to have fewer years of formal education (11.2 ± 3.07). In terms of employment, the CI group compared to the CHP group had more retirees (66.7% vs. 53.2%) and unemployed (21.0% vs. 13.9%).
On GLM analysis, after controlling for age, years of education, gender, and employment, the two groups were found to have significant differences in MoCA (25.9 ± 0.54 vs. 19.2 ± 0.47, p < 0.001), total VCAT score (24.6 ± 0.68 vs. 17.9 ± 0.58, p < 0.001), and all individual VCAT domain scores. In all of the cognitive tests, the CHP scored higher than the CI participants. GDS was not significantly different between two groups (1.1 ± 1.21 vs. 2.2 ± 1.43, p = 0.056) (Table 3).

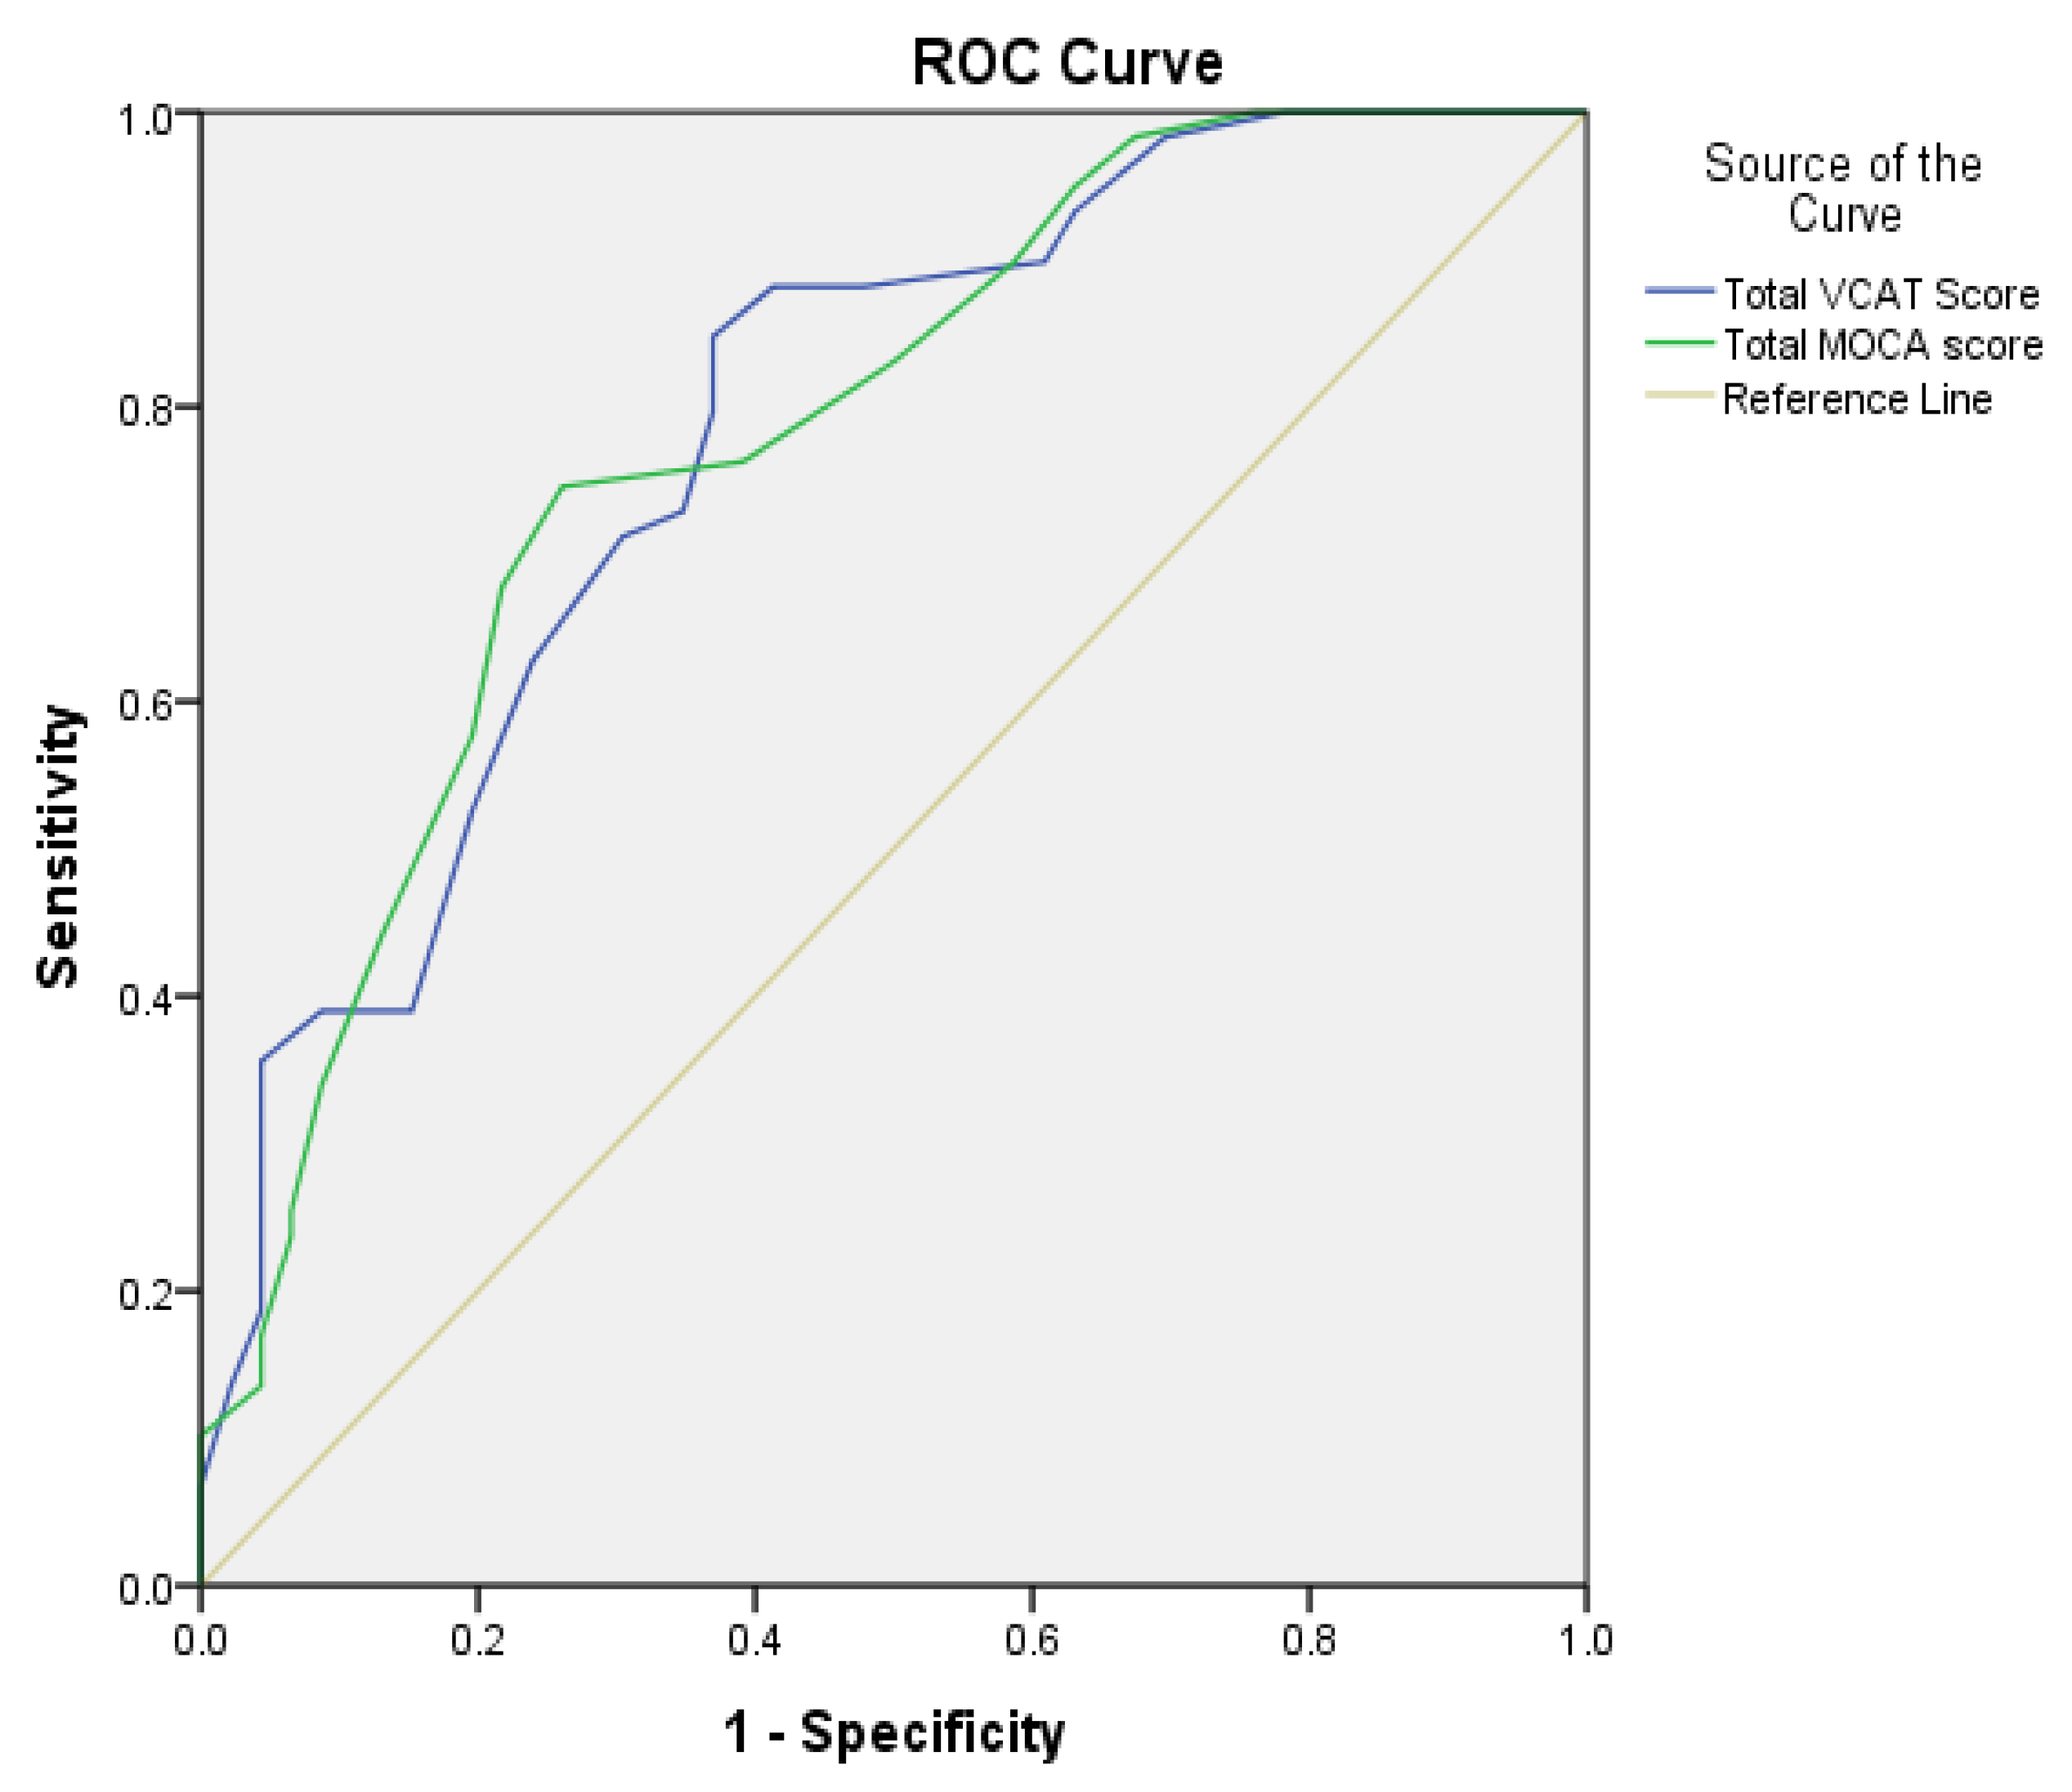
3.2. Diagnostic Accuracy and Optimal VCAT Cutoff Scores

For discriminating between CHP and CI (MCI + AD + VAD) participants, the AUCs (95% CI) were 0.837 (0.780–0.894) for the total VCAT score and 0.916 (0.874–0.957) for the MoCA score (Figure 1).
Comparison between these AUCs using the method of Hanley McNeil showed that it was not significantly different (p = 0.051) [24]. The optimal VCAT cutoff to differentiate CI with CHP was ≤ 23. This cutoff attained a sensitivity of 77.1% (95% CI: 67.9–84.8%), specificity of 72.2% (95% CI: 60.9–81.7%), PPV was 78.6% (95% CI: 71.8–84.2%), NPV was 70.4% (62.0–77.6%), PLR was 2.8 (1.9–4.0), and NLR was 0.3 (0.2–0.5) (Table 4).
Further ROC analyses (Figure 2) for discriminating between MCI and mild dementia (AD + VAD) showed that the VCAT was generally satisfactory and similar to MoCA. The AUCs for total VCAT score were 0.781 (95% CI: 0.692–0.870) and 0.778 (95% CI: 0.689–0.868). Comparison between ROC curve for discriminating between MCI and mild dementia (AD + VAD) for VCAT and MoCA was performed, and the result showed that it was not significance difference (p = 0.967) [27].
The optimal VCAT cutoff to differentiate mild dementia (AD + VAD) with MCI was ≤ 19. This cutoff attained a sensitivity of 84.8% (95% CI: 73.0–92.8%), specificity of 63.0% (95% CI: 47.6–76.8%), PPV was 74.3% (95% CI: 66.5–81.3%), NPV was 76.3% (62.9–86.0%), PLR was 2.3 (1.6–3.4), and NLR was 0.2 (0.1–0.5) (Table 5).
Inspection of scatter plots (Figure 3) between VCAT and MoCA showed homoscedasticity. Therefore, a Pearson’s correlation (r) was run on the data. The results showed a positive correlation between the VCAT and MoCA, with r = 0.819, p ≤ 0.001, which suggests a high correlation [28]. The VCAT obtained McDonald’s Omega of 0.814 indicating a good internal consistency [29].

3.3. Test-Feasibility

There was no significant difference for completion time between VCAT vs. MoCA. Mean (SD) time to complete VCAT vs. MoCA in the CHP group (10.0 ± 2.75 min vs. 10.4 ± 2.49 min, p = 0.770) and in the CI group (15.4 ± 4.52 min vs. 15.4 ± 4.56 min, p = 0.968).
A total of 180 participants provided feedback for evaluating test burden by using the semi-structured questionnaire. Compared with MoCA, 76.0% thought that the instructions in VCAT were similar or easier to understand and 76.6% thought VCAT test were similar or less tiring.

4. Discussion

This multicenter study was carried out across Northern Malaysia to investigate the VCAT performance in multi-ethnic, multicultural, and multilingual participants. The findings of this study demonstrated that the overall discriminative ability was comparable between the VCAT and MoCA in discriminating between CHPs, Cis, and mild dementia (AD + VaD) participants. ROC analyses revealed an optimal cutoff score, which was almost similar to the cutoff score by Low et al. (Dementia 0–19, MCI 20–24, Normal 25–30) [30]. This study showed that there was no statistical difference when comparing VCAT scores between Chinese, Malay, and Indians after correcting for age and education. Therefore, VCAT was well suited for the multiracial population in Malaysia. The majority of the multilingual patients in Malaysia found that the VCAT instructions were simple to follow and culturally appropriate.
The MoCA showed a slightly larger AUC than the VCAT in discriminating between CHP from those with CI. Comparison of AUCs using the method of Hanley and McNeil showed no significant difference between the MoCA and the VCAT [27]. In this study, the AUCs for the VCAT was slightly lower in discriminating between CHPs and CIs compared to the study done by Low et al. [30]. The cutoff score derived in this study was lower compared to the study done by Low et al. whose cut off score was ≤24. The sensitivity and specificity in this study was higher compare to the study done by Low et al, where the sensitivity was 75.4% and specificity was 71.1% [30]. Compared to a previous study done by Kandiah et al., for the cut of score of ≤22, the sensitivity was 85.6% and specificity was 81.1% [17].
The VCAT performed well compared to the MoCA in discriminating between MCI and mild dementia (mild AD + mild VaD). The VCAT showed a slightly larger AUC than the VCAT. The findings are consistent with previous study done by Low et al. (AUC = 0.842, 95% CI = 0.791–0.893) and Kandiah et al. (AUC = 0.820, 95% CI = 0.751–0.889) [17,30]. The cutoff score derived in this study was consistent with the study done by Low et al. where their cutoff score was ≤19 with sensitivity of 68.3% and specificity of 84.8% [30].
The mean time to complete VCAT and MoCA was similar in the CHP and CI groups. It was similar to the previous study done by Lim et al., whereby the mean time to complete the VCAT was 10.37 ± 3.70 min in the CHP group and 13.88 ± 6.18 min in the CI group [18].
Based on the VCAT qualitative assessment questionnaire surveying participants’ opinions on the practicality of VCAT compared to MoCA, participants thought that the instructions in VCAT were similar or easier to understand and were similar or less tiring. Therefore, it was found to be feasible in the normal routine clinical settings.
There were several limitations in this study. First, the education level for our overall sample was relatively high, and therefore the results may not be generalized to individuals with lower levels of education. Secondly, the majority of our participants were Chinese, and the common language used was English, which did not represent the actual Malaysian populations. Thirdly, there is a lack of description on the precision of the test with respect to it’s severity as it only compares CHPs versus MCI and MCI versus mild dementia (mild AD + mild VaD). Fourthly, the MoCA test was selected for comparison as it is widely used in clinical settings even with full knowledge of its limitations, especially the potential influence on language and culture on MoCA performance. Finally, the subjects were accessed once and were unable to be re-assessed for test-retest learning effect. Future work could compare visual test MemTrax with VCAT, and to assess the VCAT’s ability to detect various forms of dementia, and to evaluate the influence of learning effects on the VCAT.

5. Conclusions

Overall, this multicenter study showed that the VCAT was comparable to the MoCA. This suggests that the VCAT was a valid and useful screening tool for patients with cognitive impairment in Malaysia. Further studies should include a larger sample size and longitudinal cohorts.

Author Contributions

L.Y.N., C.J.C., K.G., E.E.T., E.G.E., W.K.C., H.L.T. (Hoon Lang Teh), A.S.H.C. and I.L. contributed to the conceptualization, data curation, formal analysis, investigation, methodology, project administration, resources, supervision, validation, visualization, writing-original draft and writing-review and editing, S.A.A., P.D.S., M.D., W.T.T., H.E.H., G.K., L.V.K., W.M.C., H.L.T. (Hooi Ling Tan), S.L.Y., A.-Z.A.W., K.B.N., M.N.K., B.K.M., H.K., X.H.C., S.M., P.M., C.N.T. and J.H.L. contributed to investigation, data curation, final analysis, visualization and writing-review and editing. N.K. contributed to the conceptualization, data curation, formal analysis, methodology, validation, visualization, and writing-review and editing. All authors have read and agreed to the published version of the manuscript.

Funding

This research did not receive any specific grant from funding agencies in the public, commercial, or not-for-profit sectors.

Institutional Review Board Statement

Ethical approval was obtained from Medical Research & Ethics Committee (MREC) (approval number: NMRR-17-3083-33965), Ministry of Health Malaysia. This study was conducted in compliance with the ethical principles as outlined in the Declaration of Helsinki and the Malaysian Good Clinical Practice Guidelines.

Informed Consent Statement

Informed consent was obtained from all subjects involved in this study. Written informed consent was obtained from the patients to publish this paper.

Data Availability Statement

L.Y.N. and I.L. had full access to all the data in the study and take responsibility for the integrity of the data and the accuracy of the analysis. The datasets generated during and/or analyzed during the current study are not publicly available but are available from the corresponding author on reasonable request.

Acknowledgments

The authors would like to acknowledge the Director General of the Ministry of Health for the permission to publish the research findings of this study. The authors would like to thank Shahrul Aiman bin Soelar for helping out in data analysis, Siew Chen Ooi from Occupational Therapy Unit Hospital Pulau Pinang for assistance in the data collection.

Conflicts of Interest

The authors declare that they have no competing interests.

References

  1. Prince, M.U.; Wimo, A.; Guerchet, M.; Ali, G.C.; Wu, Y.-T.; Prina, M.A. World Alzheimer Report 2015—The Global Impact of Dementia: An Analysis of Prevalence, Incidence, Cost and Trends; Alzheimer’s Disease International: London, UK, 2015. [Google Scholar]
  2. Alzheimer’s Disease International. Dementia in the Asia Pacific Region; Alzheimer’s Disease International: London, UK, 2014. [Google Scholar]
  3. Krishnaswamy, S.; Kadir, K.; Ali, R.A.; Sidi, H.; Mathews, S. Prevalence of dementia among elderly Malays in an urban settlement in Malaysia. Neurol. J. Southeast Asia 1997, 2, 154–162. [Google Scholar]
  4. Njegovan, V.; Hing, M.M.; Mitchell, S.L.; Molnar, F.J. The hierarchy of functional loss associated with cognitive decline in older persons. J. Gerontol. Ser. A Biol. Sci. Med. Sci. 2001, 56, M638–M643. [Google Scholar] [CrossRef] [PubMed]
  5. Collinson, S.L.; Yeo, D. Neuropsychology in Singapore: History, development and future directions. In The Neuropsychology of Asian Americans; Fujii, D.E.M., Ed.; Psychology Press: New York, NY, USA, 2011; pp. 293–300. [Google Scholar]
  6. Comas Herrera, A.; Northey, S.; Wittenberg, R.; Knapp, M.; Bhattacharyya, S.; Burns, A. Future costs of dementia-related long-term care: Exploring future scenarios. Int. Psychogeriatr. 2010, 23, 20–30. [Google Scholar] [CrossRef]
  7. Brookmeyer, R.; Gray, S.; Kawas, C. Projections of Alzheimer’s disease in the United States and the public health impact of delaying disease onset. Am. J. Public Health 1998, 88, 1337–1342. [Google Scholar] [CrossRef] [PubMed] [Green Version]
  8. Ferri, C.P.; Prince, M.; Brayne, C.; Brodaty, H.; Fratiglioni, L.; Ganguli, M.; Hall, K.; Hasegawa, K.; Hendrie, H.; Huang, Y.; et al. Global prevalence of dementia: A Delphi consensus study. Lancet 2005, 366, 2112–2117. [Google Scholar] [CrossRef]
  9. Malaysia Department of Statistics. Current Population Estimates, Malaysia 2018–2019; Malaysia Department of Statistics: Putrajaya, Malaysia, 2019. [Google Scholar]
  10. Kalaria, R.N.; Maestre, G.E.; Arizaga, R.; Friedland, R.P.; Galasko, D.; Hall, K.; Luchsinger, J.A.; Oginniyi, A.; Perry, E.K.; Potocnik, F.; et al. Alzheimer’s disease and vascular dementia in developing countries: Prevalence, management, and risk factors. Lancet Neurol. 2008, 7, 812–826. [Google Scholar] [CrossRef] [Green Version]
  11. Bender, H.A.; Martín García, A.; Barr, W.B. An interdisciplinary approach to neuropsychological test construction: Perspectives from translation studies. J. Int. Neuropsychol. Soc. 2010, 16, 227–232. [Google Scholar] [CrossRef]
  12. Folstein, M.F.; Folstein, S.E.; McHugh, P.R. “Mini-mental state”. A practical method for grading the cognitive state of patients for the clinician. J. Psychiatr. Res. 1975, 12, 189–198. [Google Scholar] [CrossRef]
  13. Mendiondo, M.S.; Ashford, J.W.; Kryscio, R.J.; Schmitt, F.A. Designing a Brief Alzheimer Screen (BAS). J. Alzheimers Dis. 2003, 5, 391–398. [Google Scholar] [CrossRef] [Green Version]
  14. Borson, S.; Scanlan, J.M.; Chen, P.; Ganguli, M. The Mini-Cog as a screen for dementia: Validation in a population-based sample. J. Am. Geriatr. Soc. 2003, 51, 1451–1454. [Google Scholar] [CrossRef]
  15. Nasreddine, Z.S.; Phillips, N.A.; Bédirian, V.; Charbonneau, S.; Whitehead, V.; Collin, I.; Cummings, J.L.; Chertkow, H. The Montreal Cognitive Assessment, MoCA: A brief screening tool for mild cognitive impairment. J. Am. Geriatr. Soc. 2005, 53, 695–699. [Google Scholar] [CrossRef] [PubMed]
  16. Ng, T.P.; Niti, M.; Chiam, P.C.; Kua, E.H. Ethnic and educational differences in cognitive test performance on mini-mental state examination in Asians. Am. J. Geriatr. Psychiatry 2007, 15, 130–139. [Google Scholar] [CrossRef] [PubMed]
  17. Kandiah, N.; Zhang, A.; Bautista, D.C.; Silva, E.; Ting, S.K.S.; Ng, A.; Assam, P. Early detection of dementia in multilingual populations: Visual Cognitive Assessment Test (VCAT). J. Neurol. Neurosurg. Psychiatry 2016, 87, 156–160. [Google Scholar] [CrossRef]
  18. Lim, L.; Ng, T.P.; Ong, A.P.; Tan, M.P.; Cenina, A.R.; Gao, Q.; Ng, A.; Kandiah, N. A novel language-neutral Visual Cognitive Assessment Test (VCAT): Validation in four Southeast Asian countries. Alzheimers Res. Therapy 2018, 10, 6. [Google Scholar] [CrossRef] [PubMed]
  19. Kua, J. Community Psychogeriatric Services in Singapore—The Missing Piece in the Jigsaw Puzzle. Hong Kong J. Psychiatry 2004, 14, 16–20. [Google Scholar]
  20. Lakens, D. Available online: https://psyarxiv.com/9d3yf/download?format=pdf (accessed on 15 December 2021).
  21. Sergeant, ESG. Epitools Epidemiological Calculators. Ausvet. Available online: https://hero.epa.gov/hero/index.cfm/reference/details/reference_id/6834307 (accessed on 15 December 2021).
  22. Albert, M.S.; DeKosky, S.T.; Dickson, D.; Dubois, B.; Feldman, H.H.; Fox, N.C.; Gamst, A.; Holtzman, D.M.; Jagust, W.J.; Petersen, R.C.; et al. The diagnosis of mild cognitive impairment due to Alzheimer’s disease: Recommendations from the National Institute on Aging-Alzheimer’s Association workgroups on diagnostic guidelines for Alzheimer’s disease. Alzheimers Dementia 2011, 7, 270–279. [Google Scholar] [CrossRef] [Green Version]
  23. Roman, G.C.; Tatemichi, T.K.; Erkinjuntti, T.; Cummings, J.L.; Masdeu, J.C.; Garcia, J.H.; Amaducci, L.; Orgogozo, J.M.; Brun, A.; Hofman, A.; et al. Vascular dementia: Diagnostic criteria for research studies. Report of the NINDS-AIREN International Workshop. Neurology 1993, 43, 250–260. [Google Scholar] [CrossRef] [PubMed]
  24. McKhann, G.M.; Knopman, D.S.; Chertkow, H.; Hyman, B.T.; Jack, C.R., Jr.; Kawas, C.H.; Klunk, W.E.; Koroshetz, W.J.; Manly, J.J.; Mayeux, R.; et al. The diagnosis of dementia due to Alzheimer’s disease: Recommendations from the National Institute on Aging-Alzheimer’s Association workgroups on diagnostic guidelines for Alzheimer’s disease. Alzheimers Dementia 2011, 7, 263–269. [Google Scholar] [CrossRef] [Green Version]
  25. Morris, J. The Clinical Dementia Rating (CDR): Current version and scoring rules. Neurology 1993, 43, 2412–2414. [Google Scholar] [CrossRef] [PubMed]
  26. Burke, W.J.; Houston, M.J.; Boust, S.J.; Roccaforte, W.H. Use of the Geriatric Depression Scale in Dementia of the Alzheimer Type. J. Am. Geriatr. Soc. 1989, 37, 856–860. [Google Scholar] [CrossRef]
  27. Hanley, J.A.; McNeil, B.J. The meaning and use of the area under a receiver operating characteristic (ROC) curve. Radiology 1982, 143, 29–36. [Google Scholar] [CrossRef] [PubMed] [Green Version]
  28. Martin, D. Statistical Methods for Health Care Research; Munro, B.H., Ed.; Lippincott: Philadelphia, PA, USA, 2000; ISBN 078172175 X. [Google Scholar]
  29. JASP (Version 0.16). Available online: https://www.softpedia.com/get/Science-CAD/JASP-Statistics-Project.shtml (accessed on 15 December 2021).
  30. Low, A.; Lim, L.; Lim, L.; Wong, B.; Silva, E.; Ng, K.P.; Kandiah, N. Construct validity of the Visual Cognitive Assessment Test (VCAT)-a cross-cultural language-neutral cognitive screening tool. Int. Psychogeriatr. 2019, 32, 141–149. [Google Scholar] [CrossRef] [PubMed] [Green Version]
Figure 1. Receiver operating characteristic (ROC) curves: area under the curve (AUC) for discriminating between CHP (Cognitively Healthy Participants) and CI (Cognitive Impairment) participants on VCAT and MoCA scores. MoCA Montreal Cognitive Assessment, VCAT Visual Cognitive Assessment Test.
Psych 04 00003 g001
Figure 2. Receiver operating characteristic curves: area under the curve (AUC) for discriminating between MCI and mild dementia (AD + VAD) participants on VCAT and MoCA scores. MoCA Montreal Cognitive Assessment, VCAT Visual Cognitive Assessment Test.
Psych 04 00003 g002
Figure 3. Scatterplot showing correlation between VCAT and MoCA score. VCAT, Visual Cognitive assessment Test; MoCA, Montreal Cognitive Assessment.
Psych 04 00003 g003
Table 1. The Required Sample Size Calculation.
HospitalAverage Patients with Memory or Cognitively Related Conditions Over the Past 6 MonthsDeflate 10% Assuming non-Follow-UpsProportionCalculated Sample Size Required (n)Final Sample Size Recruited and Included for Analysis (n)Participatory Rate (%)
Hospital Seberang Jaya807272/200 = 36% × 203736690.4
Hospital Pulau Pinang544949/200 = 25% × 203504590.0
Hospital Raja Permaisuri Bainun514646/200 = 23% × 203474289.4
Hospital Taiping201818/200 = 9% × 203181794.4
Hospital Sultanah Bahiyah171515/200 = 8% × 203151493.3
Total22220020318491.0
Table 2. Demographic characteristic of CHP, MCI, mild AD and mild VaD participants.
CHP
(n = 79)
MCI
(n = 46)
Mild AD
(n = 38)
Mild VaD
(n = 21)
Total
(n = 184)
p-Value
(Univariate)
Age
Mean (SD)65.3 (7.35)68.9 (8.39)74.7 (8.20)71.3 (9.24)68.8 (8.75)<0.001
Years of education
Mean (SD)13.0 (4.00) 11.1 (2.97)11.8 (3.06)10.3 (3.2)12 (4.75)<0.001
Gender, n (%) 0.020
Male27 (34.2)18 (39.1)21 (55.3)14 (66.7)80 (43.5)
Female52 (65.8)28 (60.9)17 (44.7)7 (33.3)104 (56.5)
Ethnicity, n (%) 0.167 §
Malay10 (12.7)6 (13.0)6 (15.8)5 (23.8)27 (14.7)
Chinese60 (75.9)37 (80.4)25 (65.8)10 (47.6)132 (71.7)
Indian8 (10.1)3 (6.5)5 (13.2)5 (23.8)21 (11.4)
Others1 (1.3)0 (0.0)2 (5.3)1 (4.8)4 (2.2)
Employment, n (%) 0.003
Employed26 (32.9)21 (45.7)27 (71.1)9 (42.9)39 (21.2)
Unemployed11 (13.9)9 (19.6)3 (7.9)8 (38.1)33 (17.9)
Retired42 (53.2)16 (34.8)8 (21.1)4 (19.0)112 (60.9)
Language administered, n (%) 0.068
English44 (55.7)21 (45.7)27 (71.1)9 (42.9)101 (54.9)
Malay15 (19.0)9 (19.6)3 (7.9)8 (38.1)35 (19.0)
Mandarin20 (25.3)16 (34.8)8 (21.1)4 (19.0)48 (26.1)
CHP, cognitively healthy participants; MCI, mild cognitive impairment; AD, Alzheimer’s disease; VaD, Vascular Dementia; SD, standard deviation. Presented as median (IQR). Chi-square test for independence. § Fisher’s exact test.
Table 3. VCAT domain and total scores.
CHP
(n = 79)
CI
(n = 105)
MCI
(n = 46)
AD
(n = 38)
VaD
(n = 21)
p-Valuep-Value
(GLM) *
MoCA
Mean (SD)26.9 (2.43)18.9 (5.33)21.7 (4.77)16.6 (4.75)16.7 (4.61)<0.001<0.001
VCAT memory (13 points)
Mean (SD)12.0 (2.00) 6.7 (4.01)8.9 (3.41)2.5 (5.25) 6.7 (3.00)<0.001<0.001
VCAT language (5 points)
Mean (SD)5.0 (1.00) 3.5 (0.85)3.9 (0.82)3.3 (0.69)3.1 (0.83)<0.001<0.001
VCAT visuospatial (3 points)
Mean (SD)2.6 (0.52)2.0 (1.00) 2.4 (0.54)2.0 (1.00) 2.1 (0.94)0.001<0.001
VCAT executive (6 points)
Mean (SD)4.4 (1.29)3.7 (1.70)4.0 (1.69)3.5 (1.69)3.4 (1.75)0.001<0.001
VCAT attention (3 points)
Mean (SD)2.0 (1.22)1.0 (1.34)1.6 (1.41)0.0 (1.00) 0.0 (0.00) <0.001<0.001
VCAT total (30 points)
Mean (SD)25.1 (3.09)17.1 (6.59)20.8 (5.99)13.3 (5.64)15.9 (5.10)<0.001<0.001
CHP, cognitively healthy participants; CI, cognitive impairment; MCI, mild cognitive impairment; AD, Alzheimer’s disease; VaD, Vascular Dementia; GLM, general linear model; SD, standard deviation; MoCA, Montreal Cognitive Assessment; VCAT, Visual Cognitive Assessment Test. Presented as median (IQR). * GLM adjusted by age, years of education, gender and employment.
Table 4. Overall diagnostic performance, clinical acceptance/ utility and diagnostic accuracy of VCAT and MoCA for CI and CHP.
Diagnostic PerformanceAcceptability/ UtilityDiagnostic Accuracy
SenSpPPVNPVLR+LRAUC
VCAT 77.1
(67.9–84.8)
72.2
(60.9–81.7)
78.6
(71.8–84.2)
70.4
(62.0–77.6)
2.8
(1.9–4.0)
0.3
(0.2–0.5)
0.837
(0.780–0.894)
MoCA81.0
(72.1–88.0)
91.1
(82.6–96.4)
92.4
(85.6–96.1)
78.3
(70.7–84.3)
9.1
(4.5–18.6)
0.2
(0.1–0.3)
0.916
(0.874–0.957)
PPV—Positive Predictive Value; NPV—Negative Predictive Value; LR+—Positive Likelihood Ratio; LR—Negative Likelihood Ratio; AUC—Area under the curve. Sensitivity (Sen); specificity (Sp); predictive values (PPV/NPV); likelihood ratios (LR+/LR); discriminatory capacity (diagnostic accuracy of AUC) is reported with values (%) with corresponding 95% confidence intervals (95% CI).
Table 5. Overall diagnostic performance, clinical acceptance/ utility and diagnostic accuracy of VCAT and MoCA for mild dementia (AD + VAD) and MCI.
Diagnostic PerformanceAcceptability/ UtilityDiagnostic Accuracy
SenSpPPVNPVLR+LRAUC
VCAT 84.8
(73.0–92.8)
63.0
(47.6–76.8)
74.6
(66.5–81.3)
76.3
(62.9–86.0)
2.3
(1.6–3.4)
0.2
(0.1–0.5)
0.781
(0.692–0.870)
MoCA74.6
(61.6–85.0)
73.9
(58.9–85.7)
78.6
(68.8–85.9)
69.4
(58.6–78.3)
2.9
(1.7–4.8)
0.3
(0.2–0.6)
0.778
(0.689–0.868)
PPV—Positive Predictive Value; NPV—Negative Predictive Value; LR+—Positive Likelihood Ratio; LR—Negative Likelihood Ratio; AUC—Area under the curve. Sensitivity (Sen); specificity (Sp); predictive values (PPV/NPV); likelihood ratios (LR+/LR); discriminatory capacity (diagnostic accuracy of AUC) are reported with values (%) with corresponding 95% confidence intervals (95% CI).
Publisher’s Note: MDPI stays neutral with regard to jurisdictional claims in published maps and institutional affiliations.

