Abstract
The aim of this study was to develop a finite element model to investigate the forces on tendons which ensue due to trigger finger. The model was used to simulate both flexor and extensor tendons within the index finger; two test cases were defined, simulating a “mildly” and “severely” affected tendon by applying constraints. The finger was simulated in three different directions: extension, abduction and hyper-extension. There was increased tension during hyper-extension, with tension in the mildly affected tendon increasing from 1.54 to 2.67 N. Furthermore, there was a consistent relationship between force and displacement, with a substantial change in the gradient of the force when the constraints of the condition were applied for all movements. The intention of this study is that the simulation framework is used to enable the in silico development of novel prosthetic devices to aid with treatment of trigger finger, given that, currently, the non-surgical first line of treatment is a splint.
1. Introduction
The hand is considered the most dexterous and well-coordinated part of the body, having great complexity and utility [1,2]. Its mobility is vital for any individual’s independence during daily activities. Stenosing tenosynovitis, more commonly known as trigger finger, is one of the most common pathologies seen in hand surgery [3,4,5]. In a healthy hand, the flexor tendon should be able to move freely inside the tendon sheath. However, in this condition, the tendon and/or sheath become inflamed or irritated, forming scar tissue due to fibrocartilagenous metaplasia of the tendon, which restricts tendon movement through the sheath [6,7].
This restriction from trigger finger can result in painful locking and clicking of the finger [3,5,8,9,10]. “Triggering” refers to the sudden release of the tendon after catching during finger extension. Trigger finger is more commonly found in healthy middle-aged women [4,8,10,11] but is also associated with conditions such as diabetes, arthritis [10,11,12,13] and carpal tunnel syndrome [5,13]. The exact cause of the condition is unclear and can vary between cases, but the tendon can be further aggravated by hand use at work or during sport [12]. Symptoms include tenderness in the affected area, movement pain and locking or clicking; if attended to promptly, pain and swelling can be reduced easily. Surgery is only considered if other treatment options fail or the condition goes untreated for an extended period of time [8]. Non-surgical treatments include splinting, physiotherapy, nonsteroidal anti-inflammatory drugs and corticosteroid injections [3,8,10,12]. Surgery is performed under local anaesthetic, with an incision created in the roof of the tendon sheath in order to widen the tunnel so that the tendon can move freely [14].
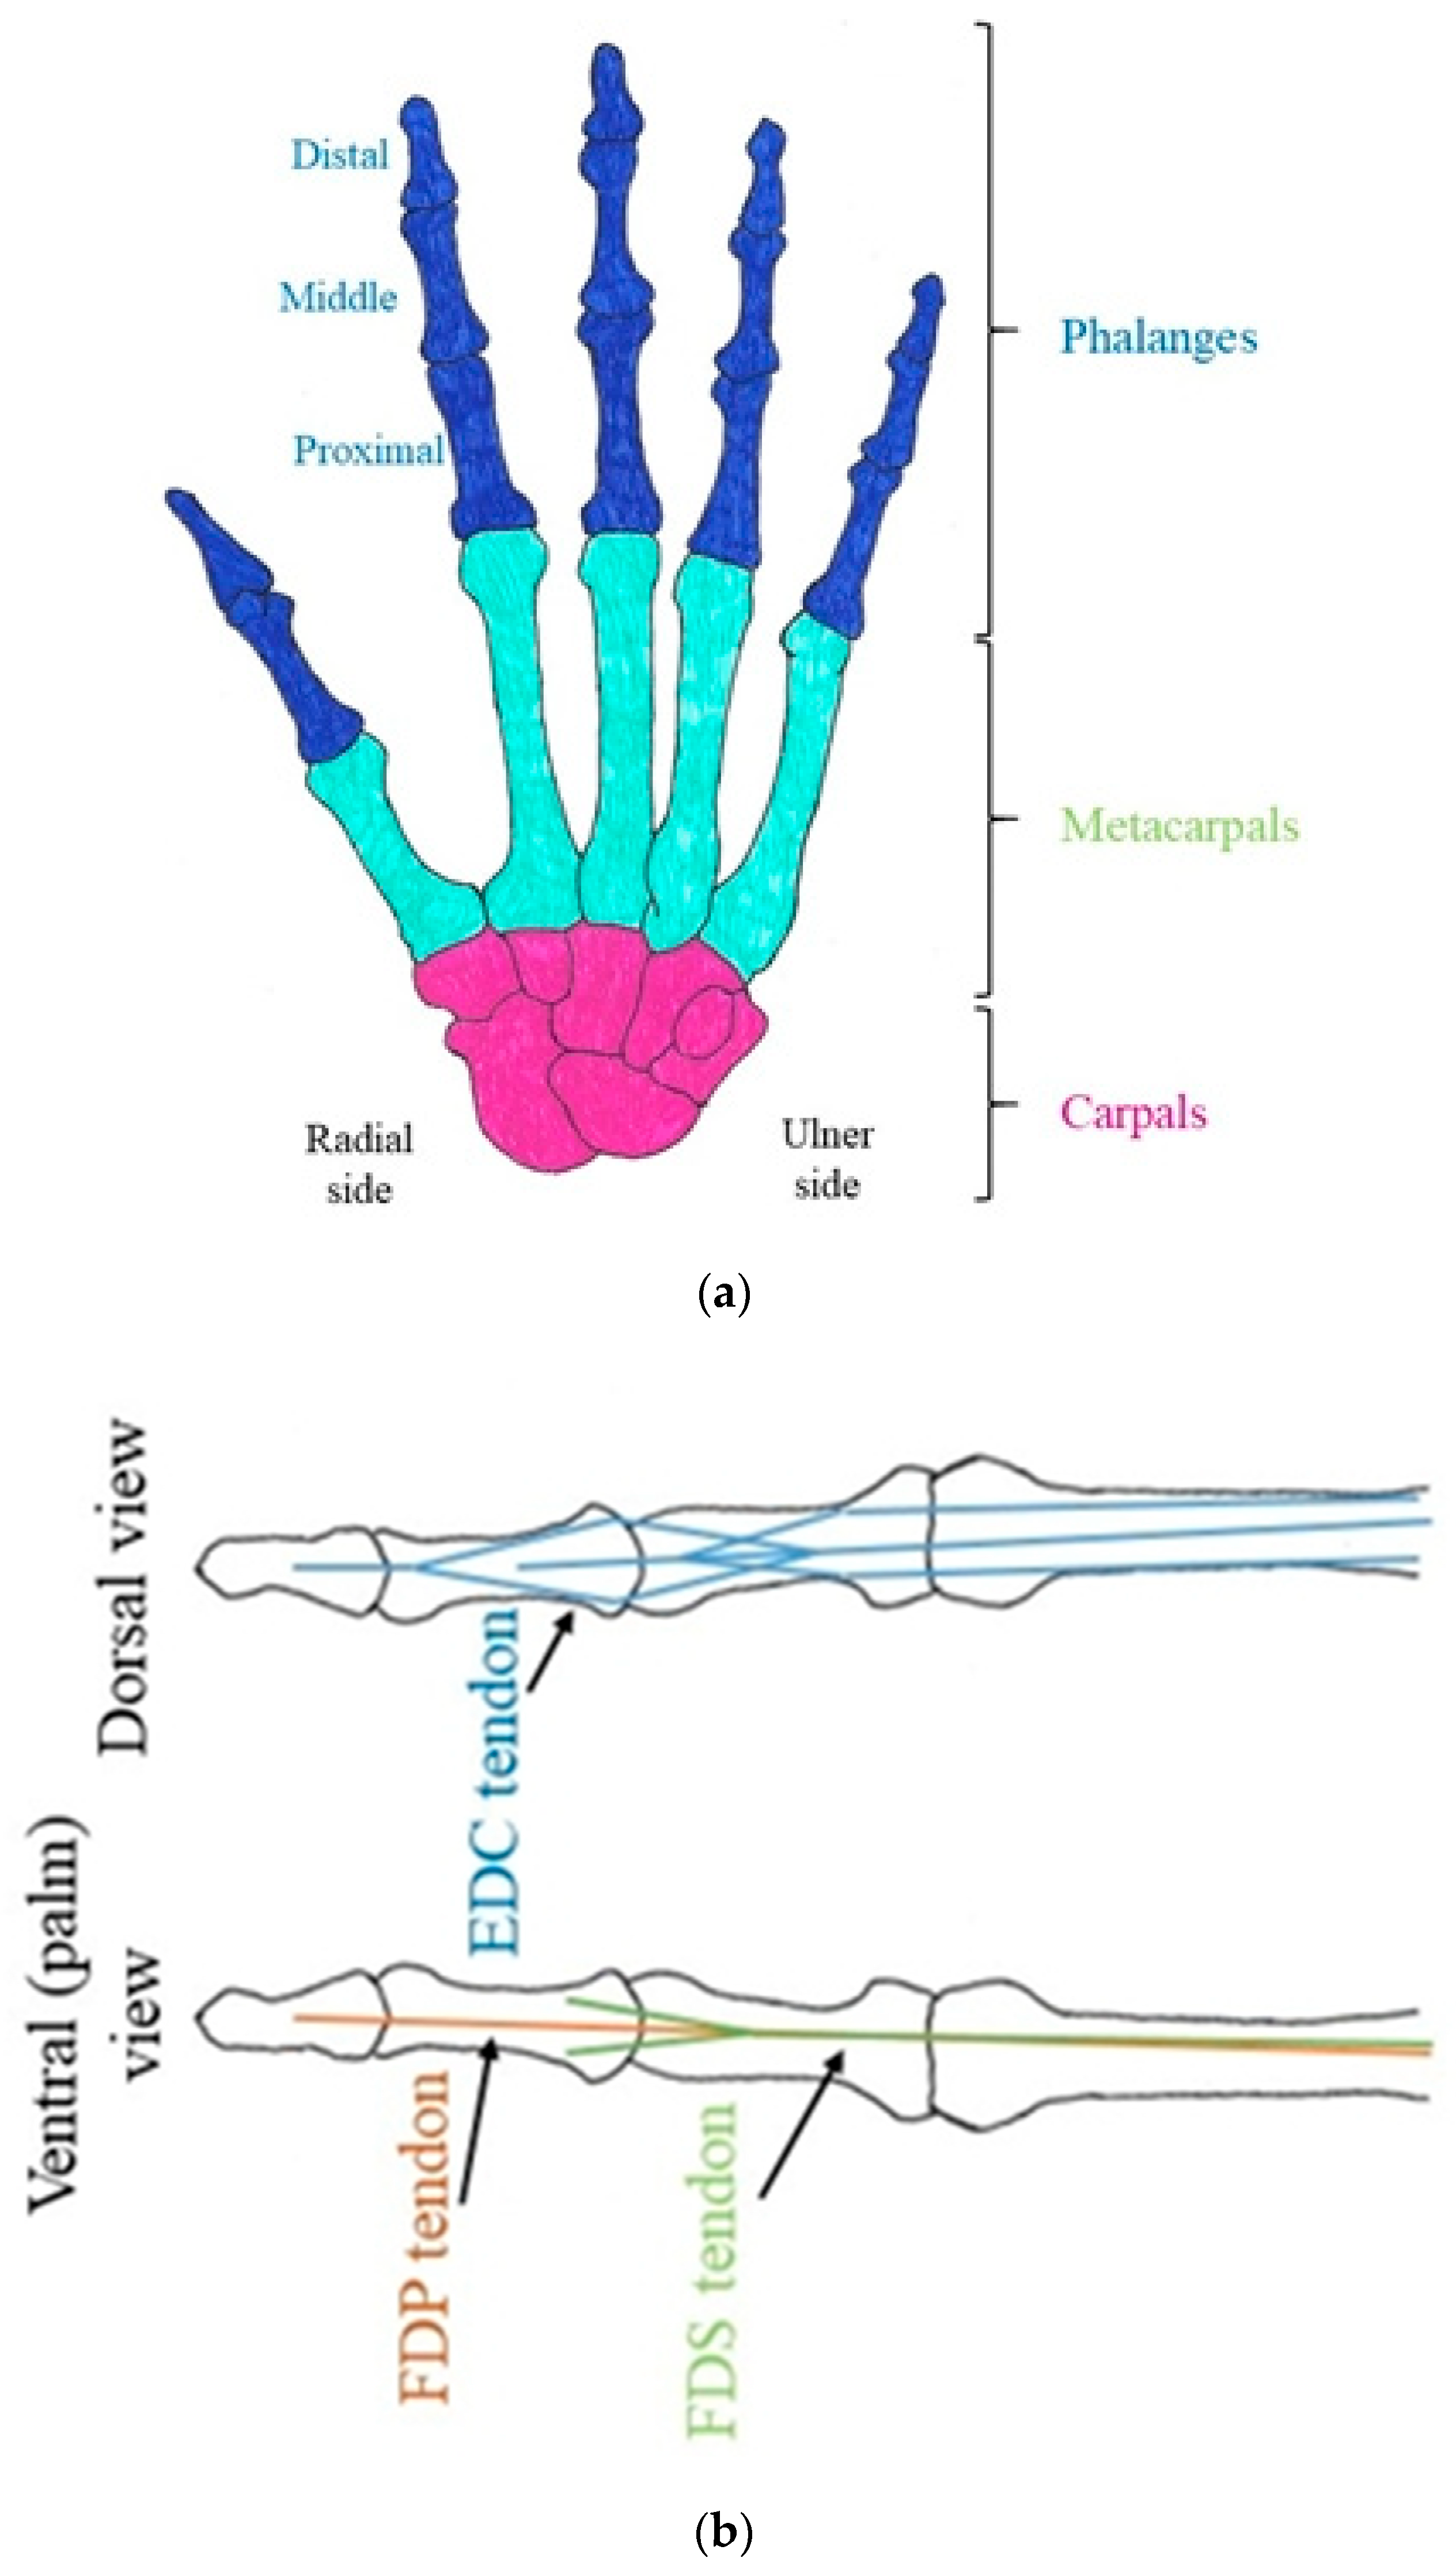
The hand is comprised of twenty-seven different bones consisting of phalanges, metacarpals and carpals (Figure 1). Effective function is coordinated by a linkage system of tendons, ligaments and muscles. Tendons transmit loads from the bones to the intrinsic muscles and are interconnected by aponeuroses; this is commonly referred to as the extensor mechanism [15,16]. All fingers have an extensor tendon, located on the posterior surface of the hand, and two flexor tendons, located on the palmar side; furthermore, the second and fifth fingers have an additional extensor tendon. The extensor digitorum communis (EDC) straightens the finger [17] from both the proximal and distal interphalangeal joints. Flexing (bending) of the finger is achieved through the flexor digitorum profundus (FDP) and the flexor digitorum superficialis (FDS) tendons that connect to the distal and middle phalanx, respectively. Flexor tendons are channelled through and constricted by the tendon sheath [18], with some lubrication provided by synovial fluid.
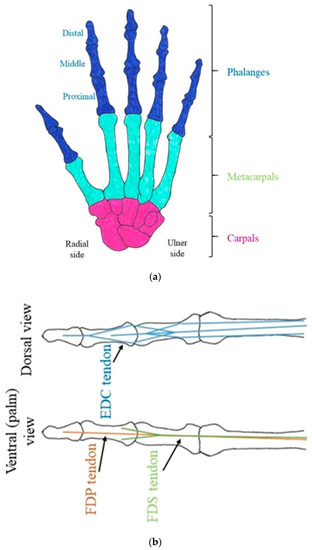
Figure 1.
Schematic diagram of the hand. (a) Arrangement of the bones in the hand. (b) Simplified diagram of the attachment point of tendons in a finger.
There is limited research on the biomechanical impact of trigger finger and how it immobilises and generates stress within the hand. Most existing studies have been based on physical examinations of patients with the condition, using methods such as motion analysis and electromagnetic tracking systems. The higher the grade, the lower the range of movement for each joint in the finger, and restricted tendon mobility can measurably change comparative exerted force between the thumb and fingers [19,20]. Long-term, however, even after treatment, some disability may persist [21]. While a few biomechanical models are available for determining forces in tendons of the hand, limitations persist for their extrapolation to an understanding of the mechanics of trigger finger. For example, some models are specific to climbing techniques [22]. Others explore the finger extensor tendon network but do not model trigger finger [2]. Arguably, the most comprehensive model is provided by Lu et al. [23] to evaluate the forces within different tendons, predicting higher tension in the FDP tendon than in the FDS tendon when both tendons were triggering. There is scope, though, to evaluate the effect of trigger finger on the tension in the tendons of the hand during a range of movements. Such a model would enable a simulation framework to be available to test future prosthetic devices intended to aid in trigger finger “treatment”, as an objective technique for early stage development.
The aim of this study is to develop a model, using finite element analysis (FEA), which can predict the forces within tendons in the hand during trigger finger. The focus is on the right hand’s index finger as this is where trigger finger is most likely to occur [14]. Models developed include a healthy case along with both a mild and a severe model for trigger finger to enable direct comparison. The contribution made by this study is, therefore, in developing an FEA model for mild and severe levels of stenosing tenosynovitis (i.e., trigger finger).
2. Results
2.1. Outline of Results
Figure 2, Figure 3, Figure 4, Figure 5, Figure 6, Figure 7 and Figure 8 present the results for the forces acting on the tendons and their displacement. Stress–strain curves have also been plotted to analyse the data. Forces on the tendons followed a nonlinear relationship, with clear differences between healthy tendons and those with the constraints of mild and severe trigger finger. The effects of extension, abduction and hyper-extension are outlined in Section 2.2, Section 2.3 and Section 2.4, with Section 2.5 outlining the variation of tension and cross-sectional area within a tendon.
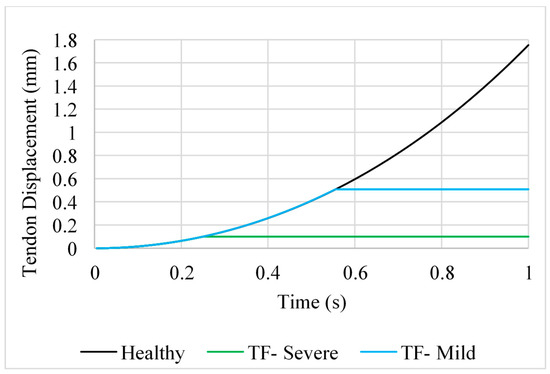
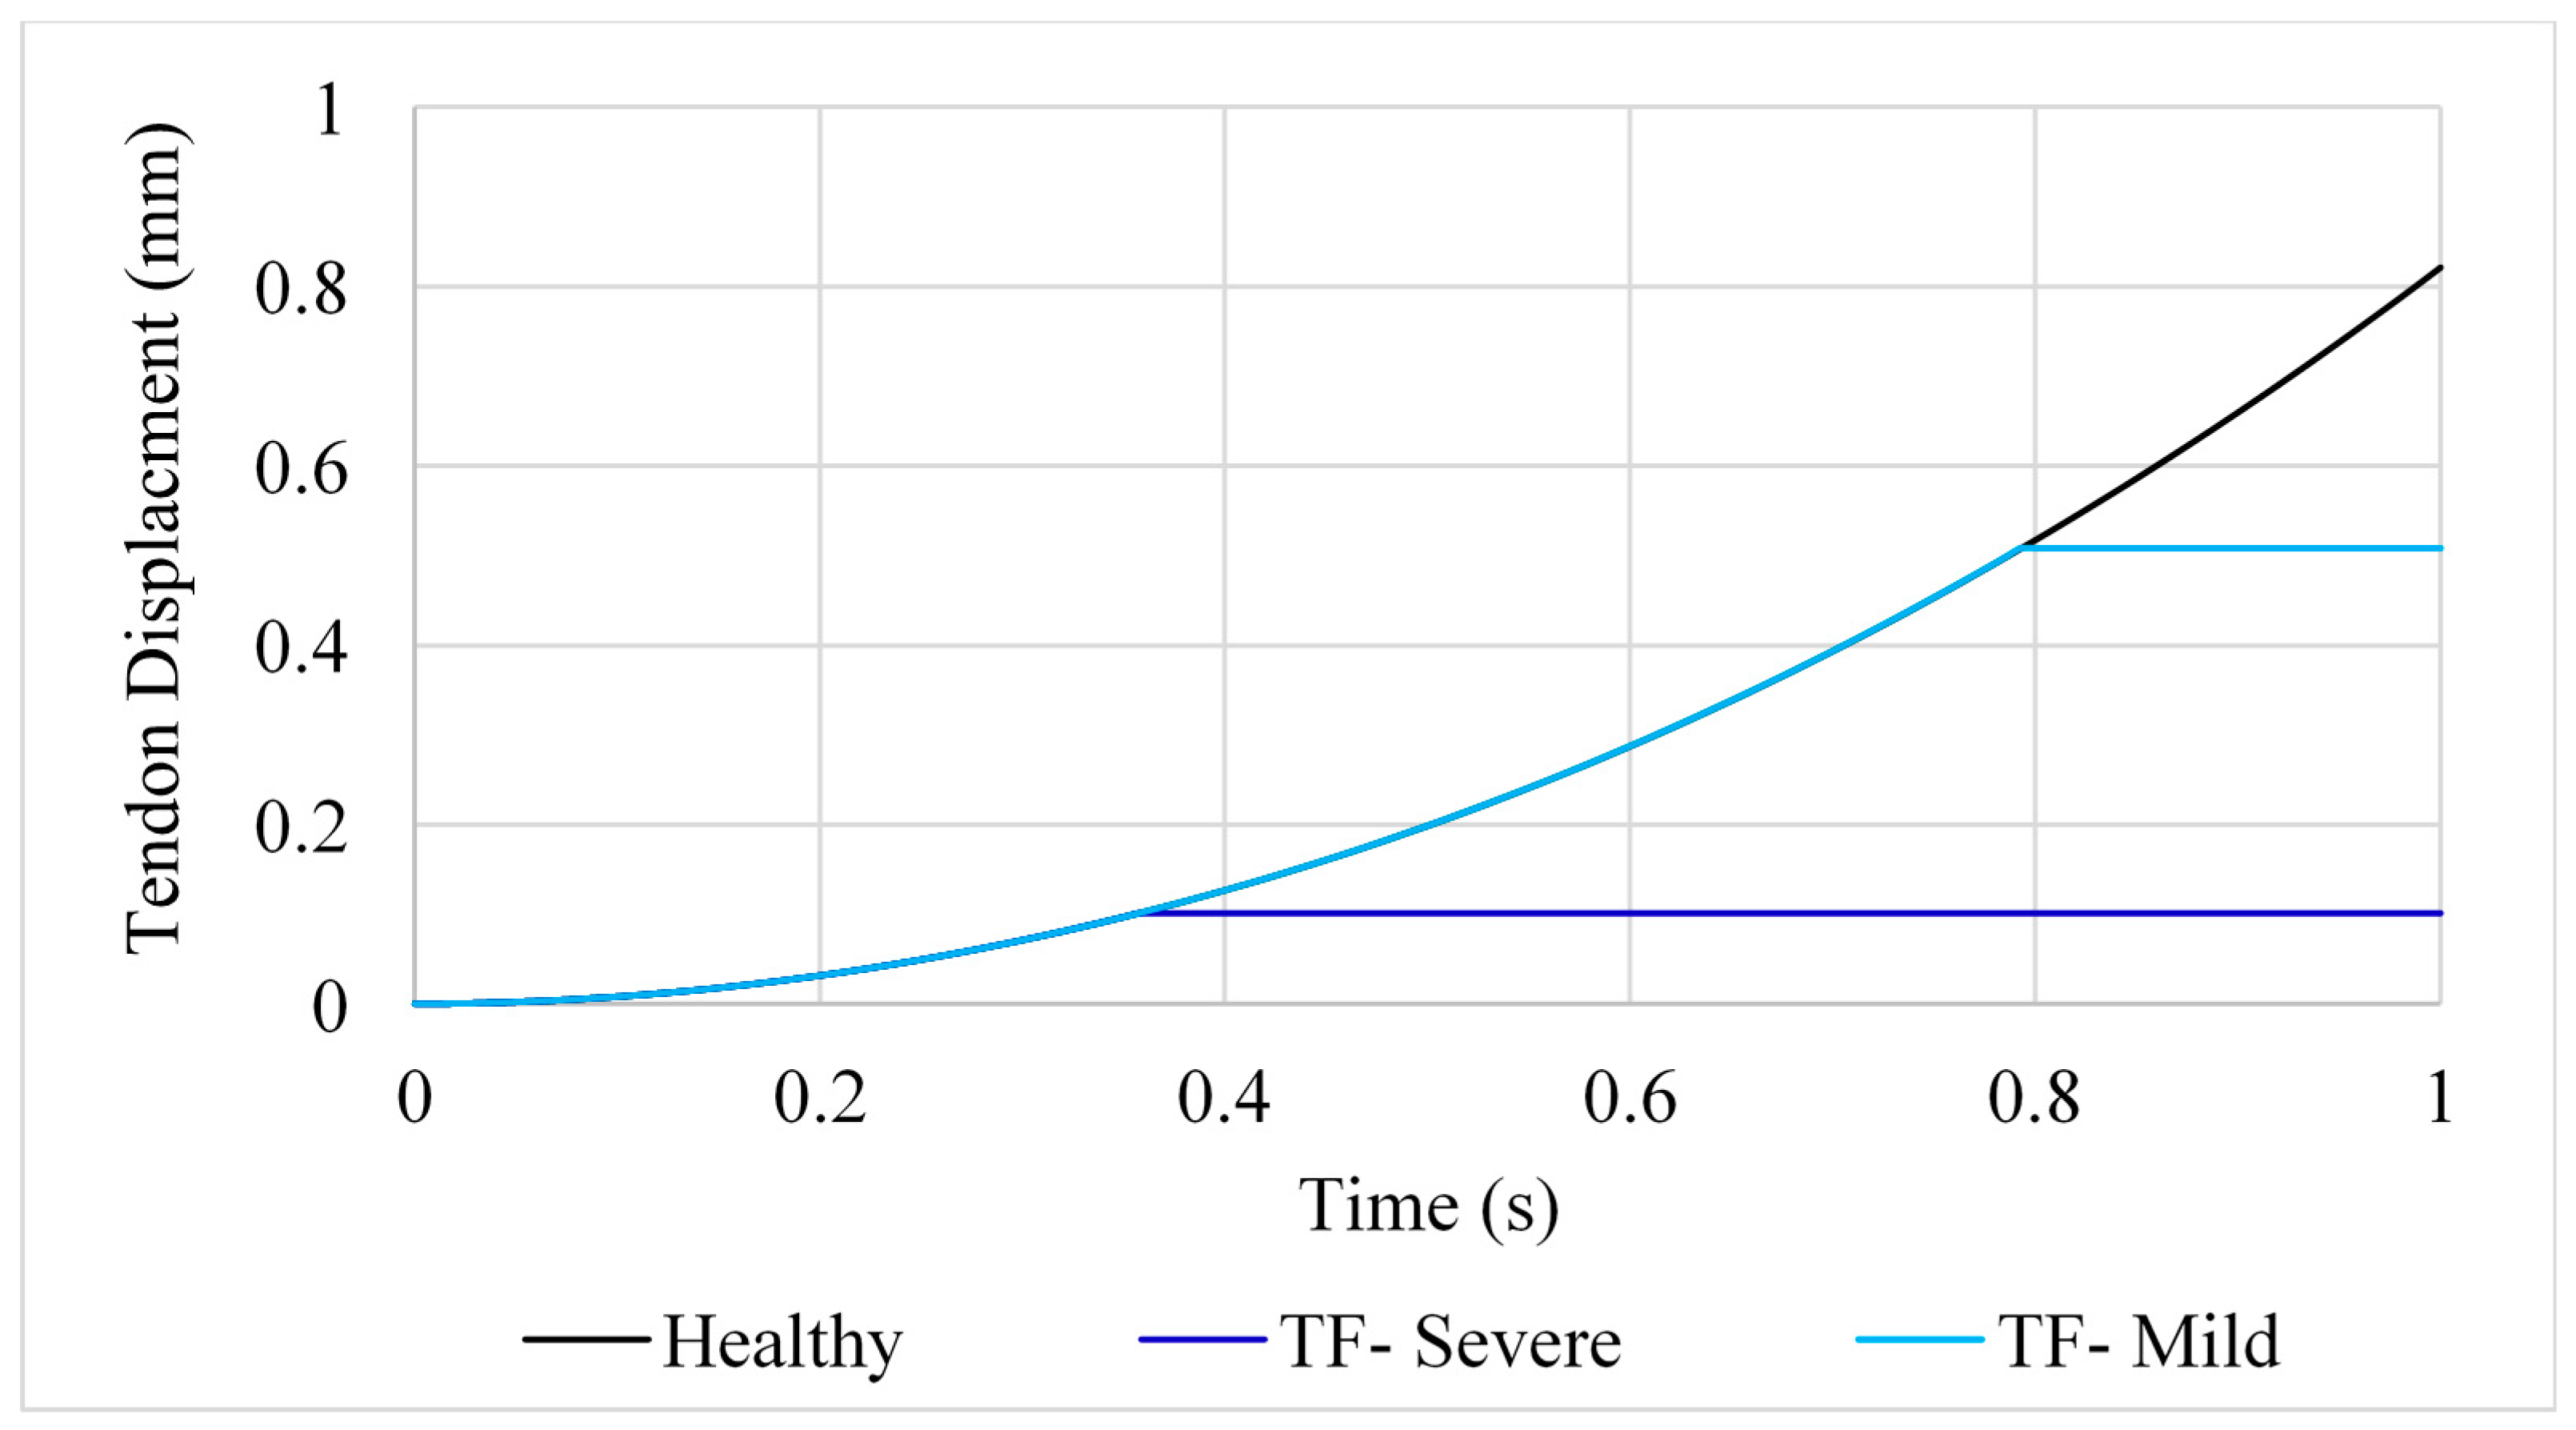
Figure 2.
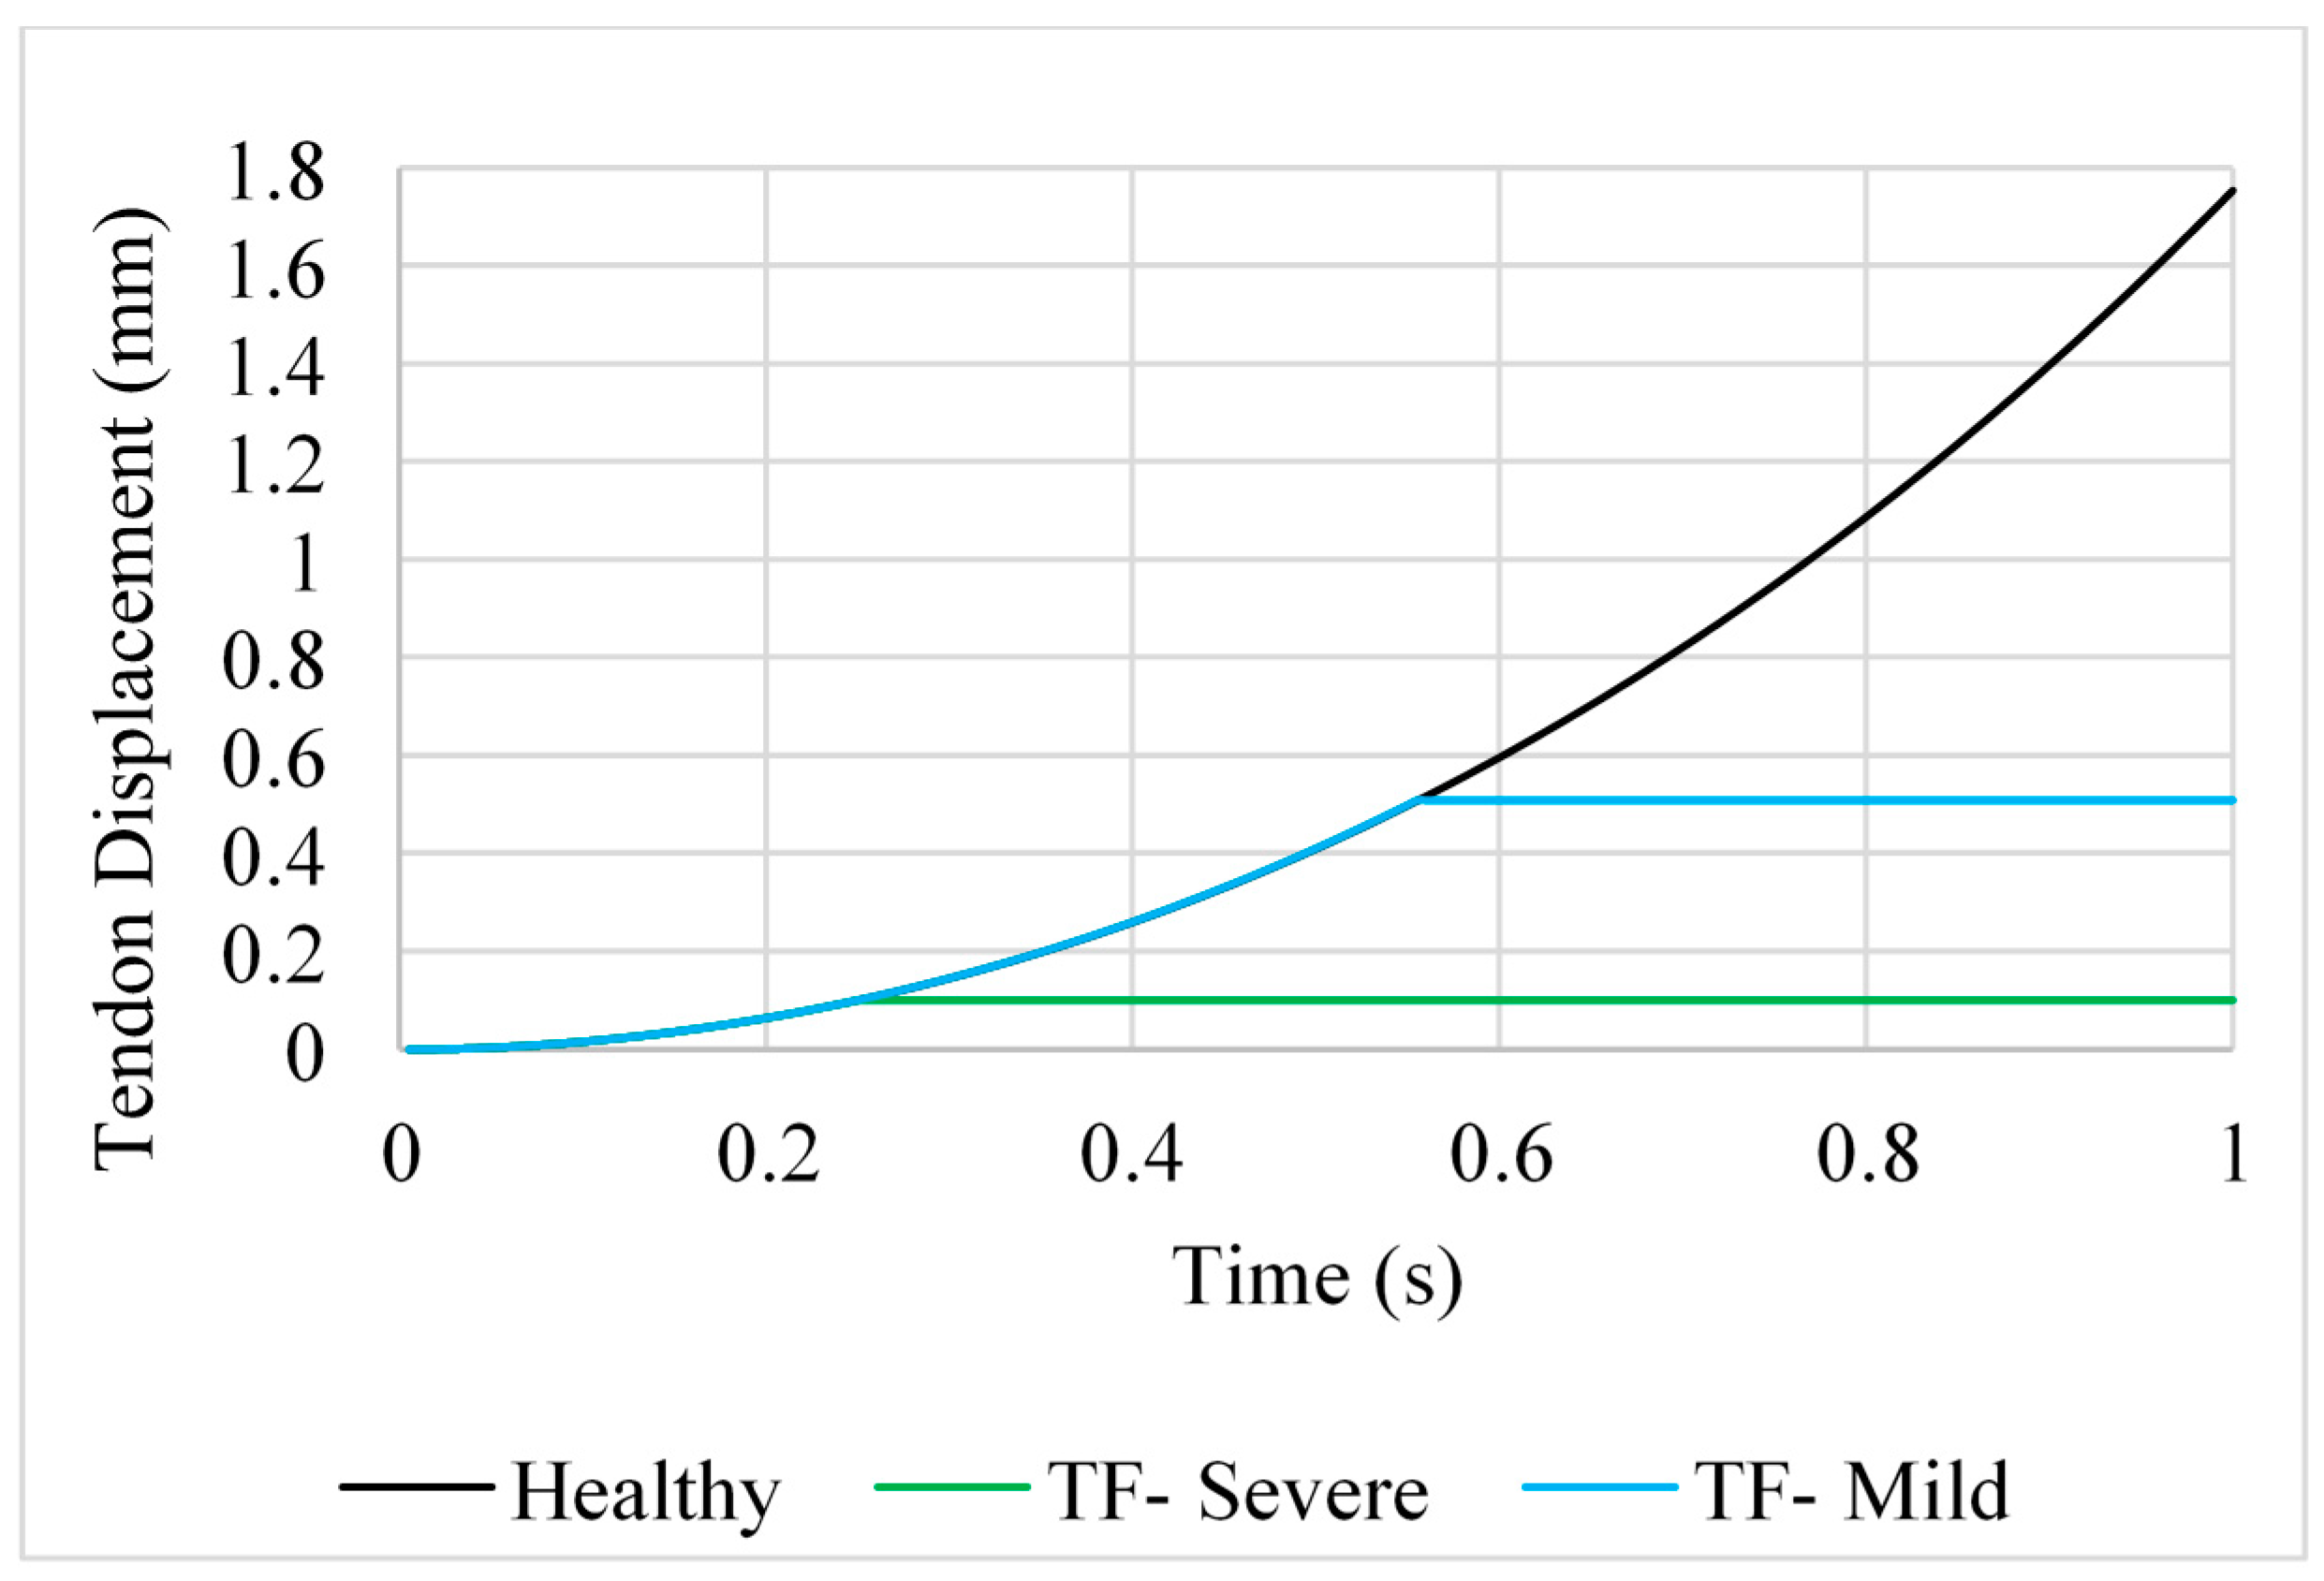
Tendon displacement for position A for healthy, mildly and severely affected tendons.
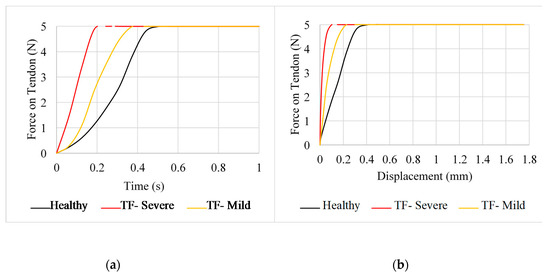
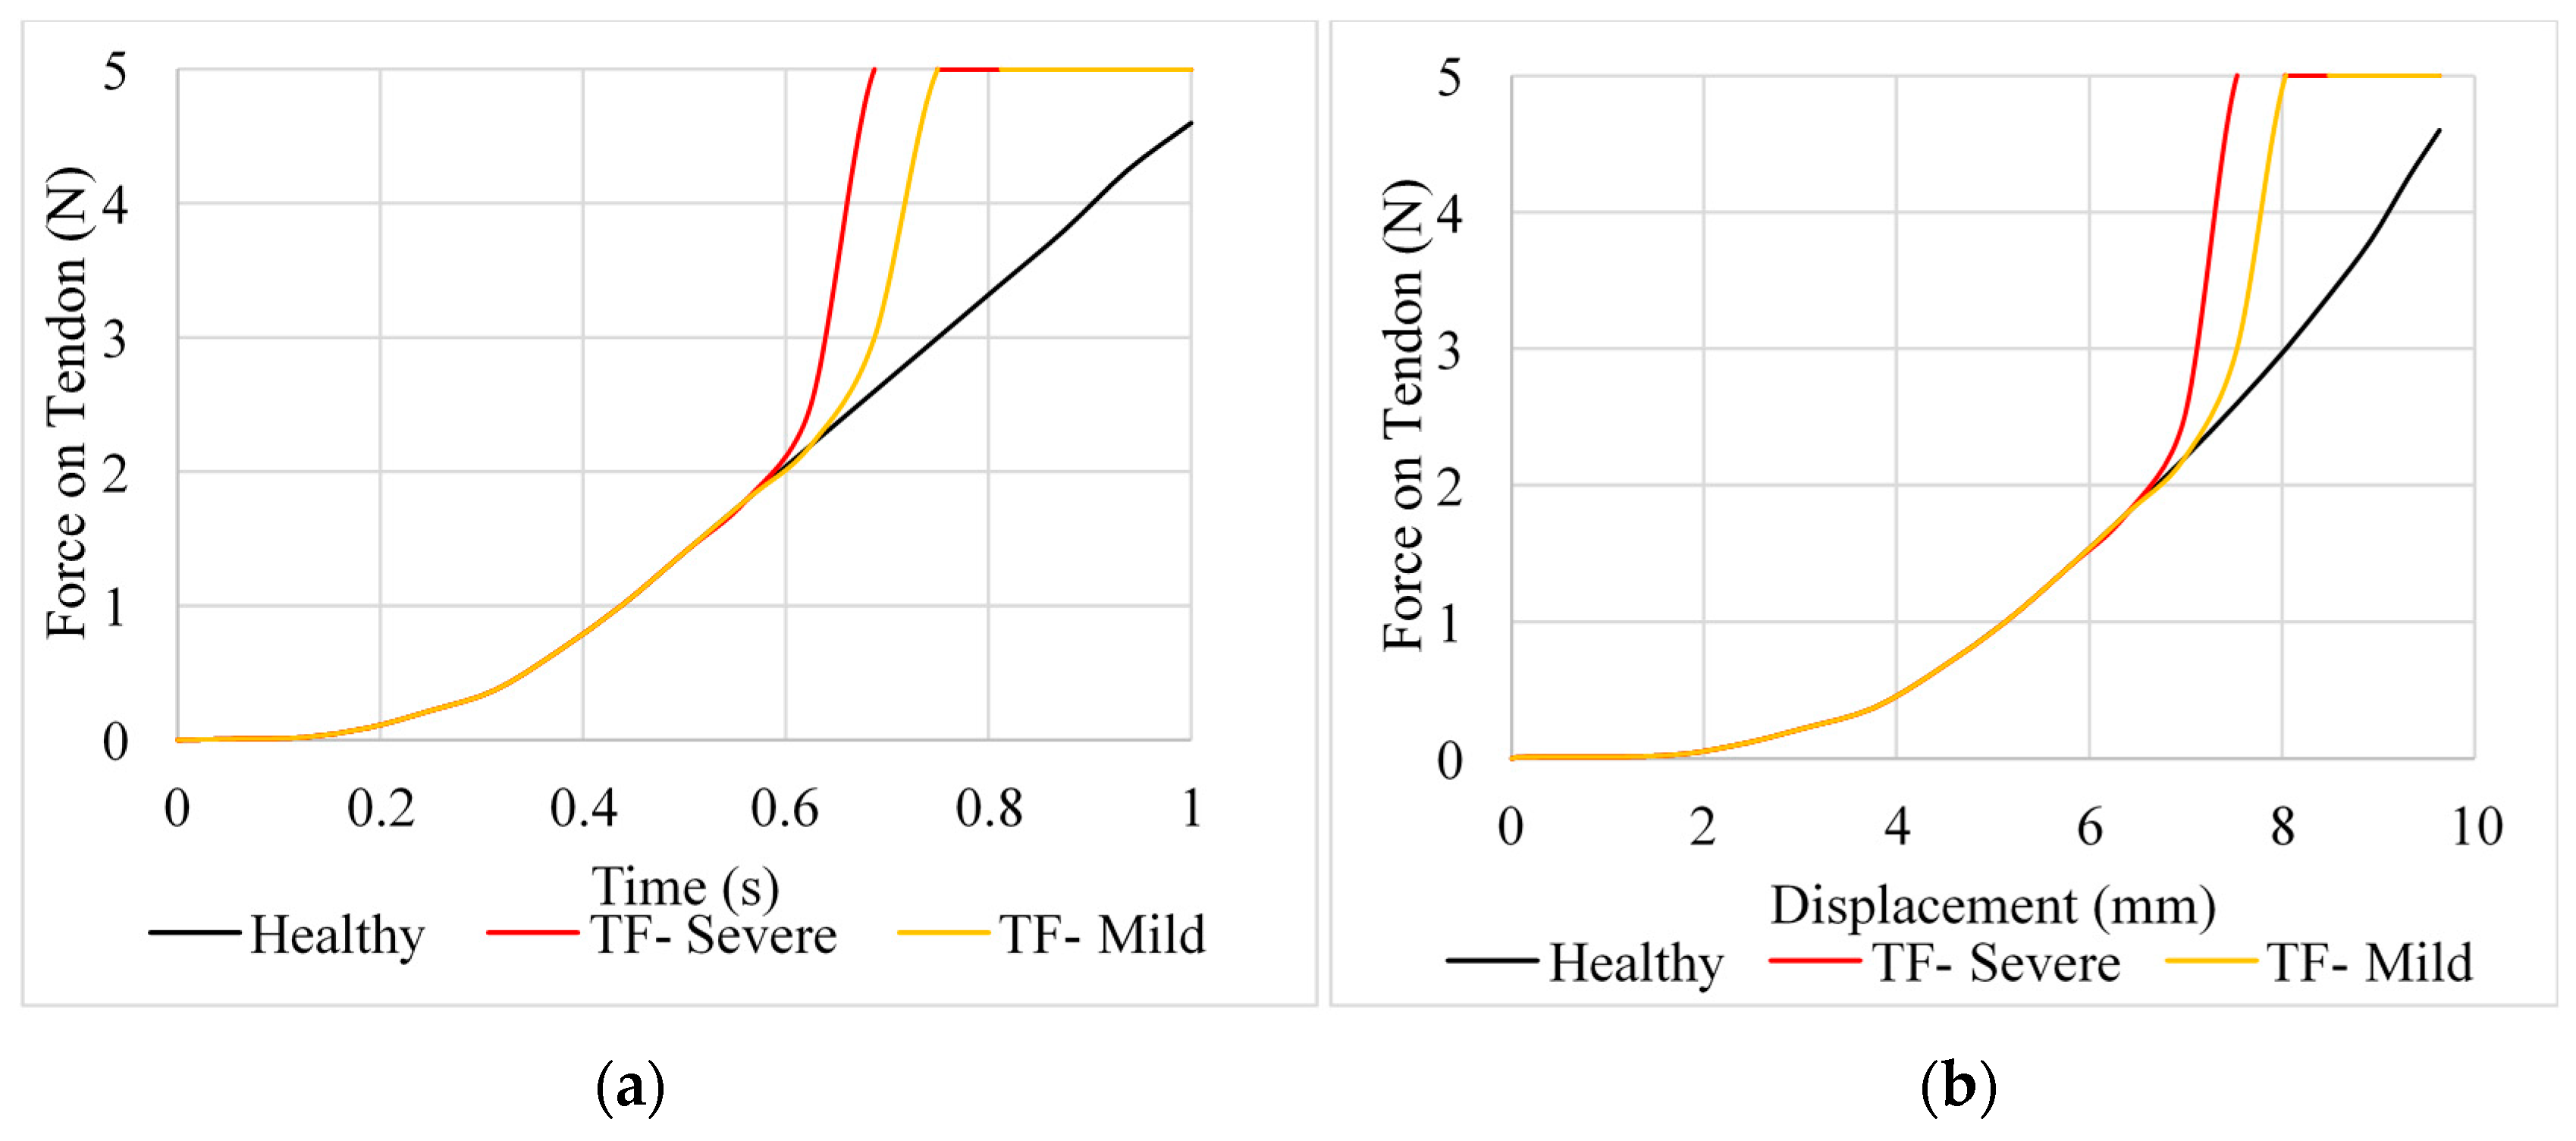
Figure 3.
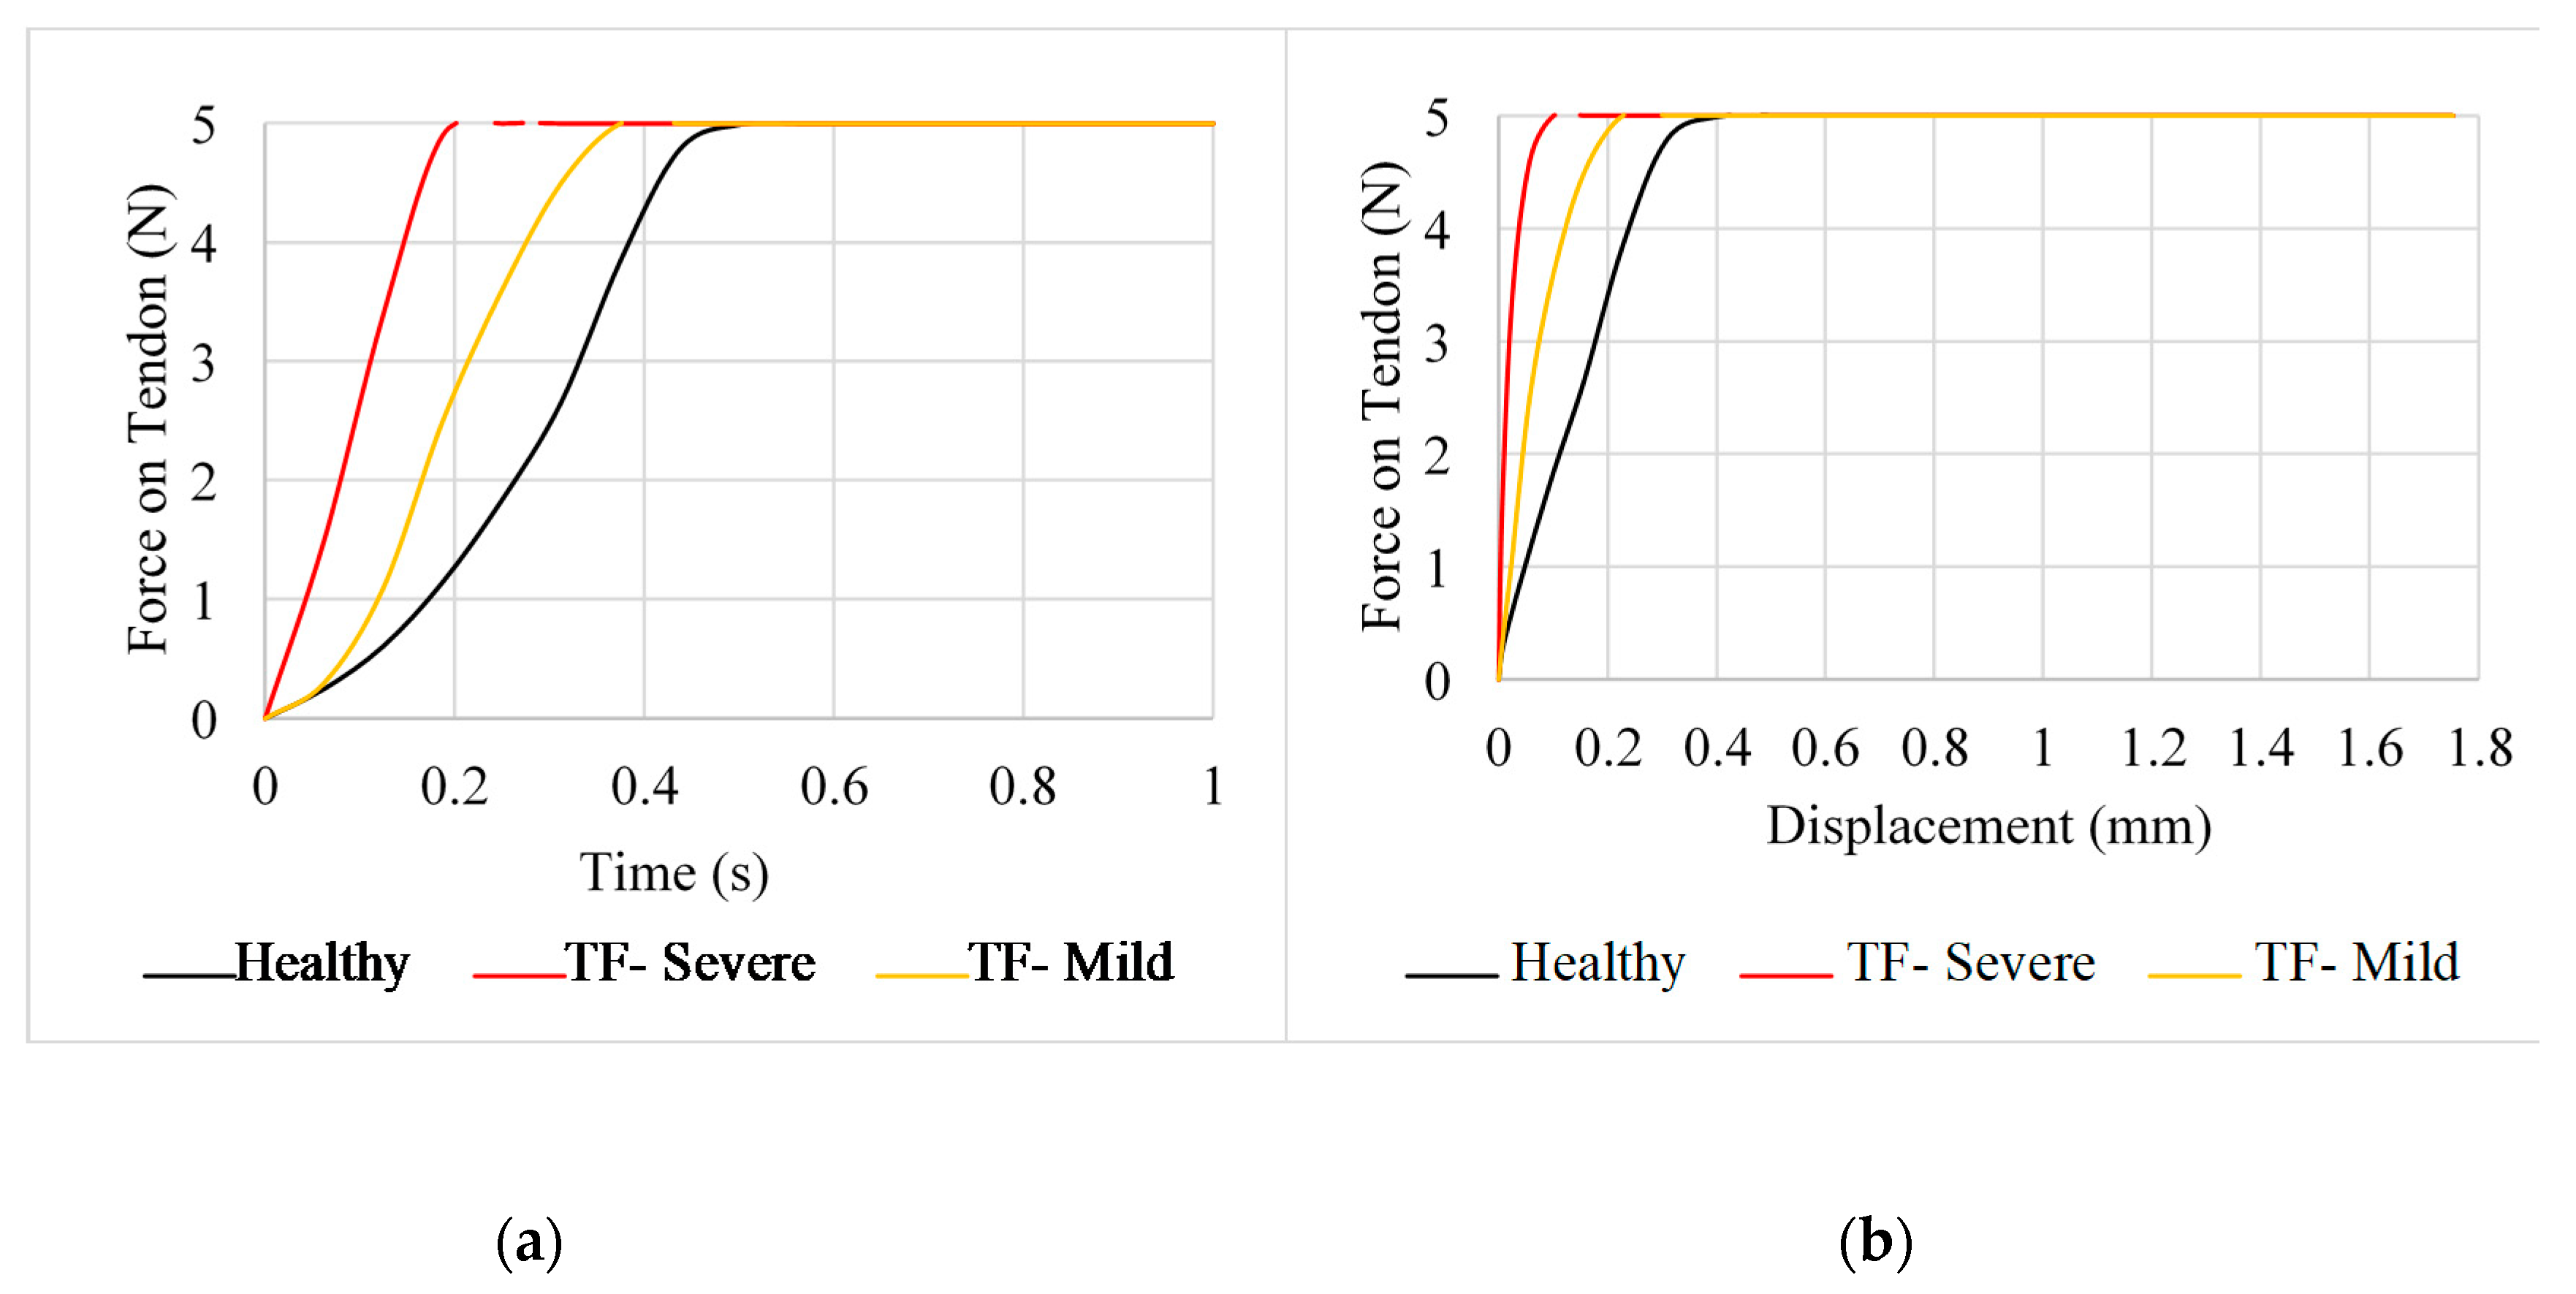
Force predicted for flexor digitorum profundus (FDP) and flexor digitorum superficialis (FDS) tendons (position A). (a) Force against time for the FDP and FDS tendons, (b) force against displacement of the FDP and FDS tendons.
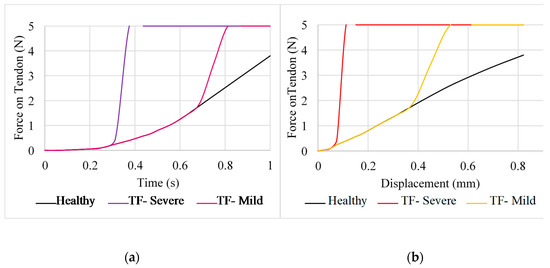
Figure 4.
Force predicted for the extensor digitorum communis (EDC) tendon (position A). (a) Force against time, (b) force against displacement.
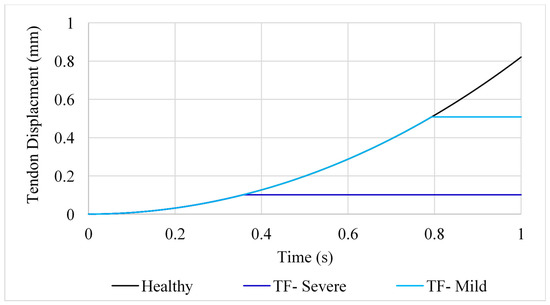
Figure 5.
Time-dependent displacement of the FDS tendon (position A; note: TF: trigger finger).
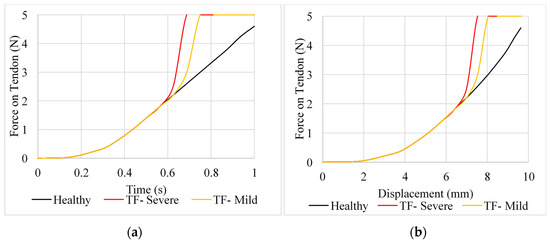
Figure 6.
Force predicted for the FDP and FDS tendons (position B). (a) Force against time, (b) force against displacement.
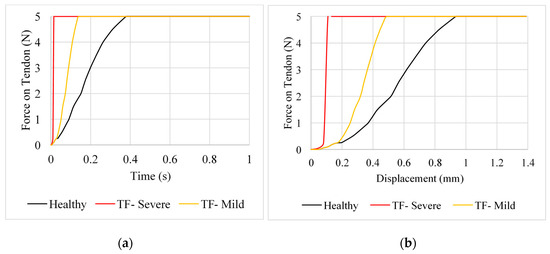
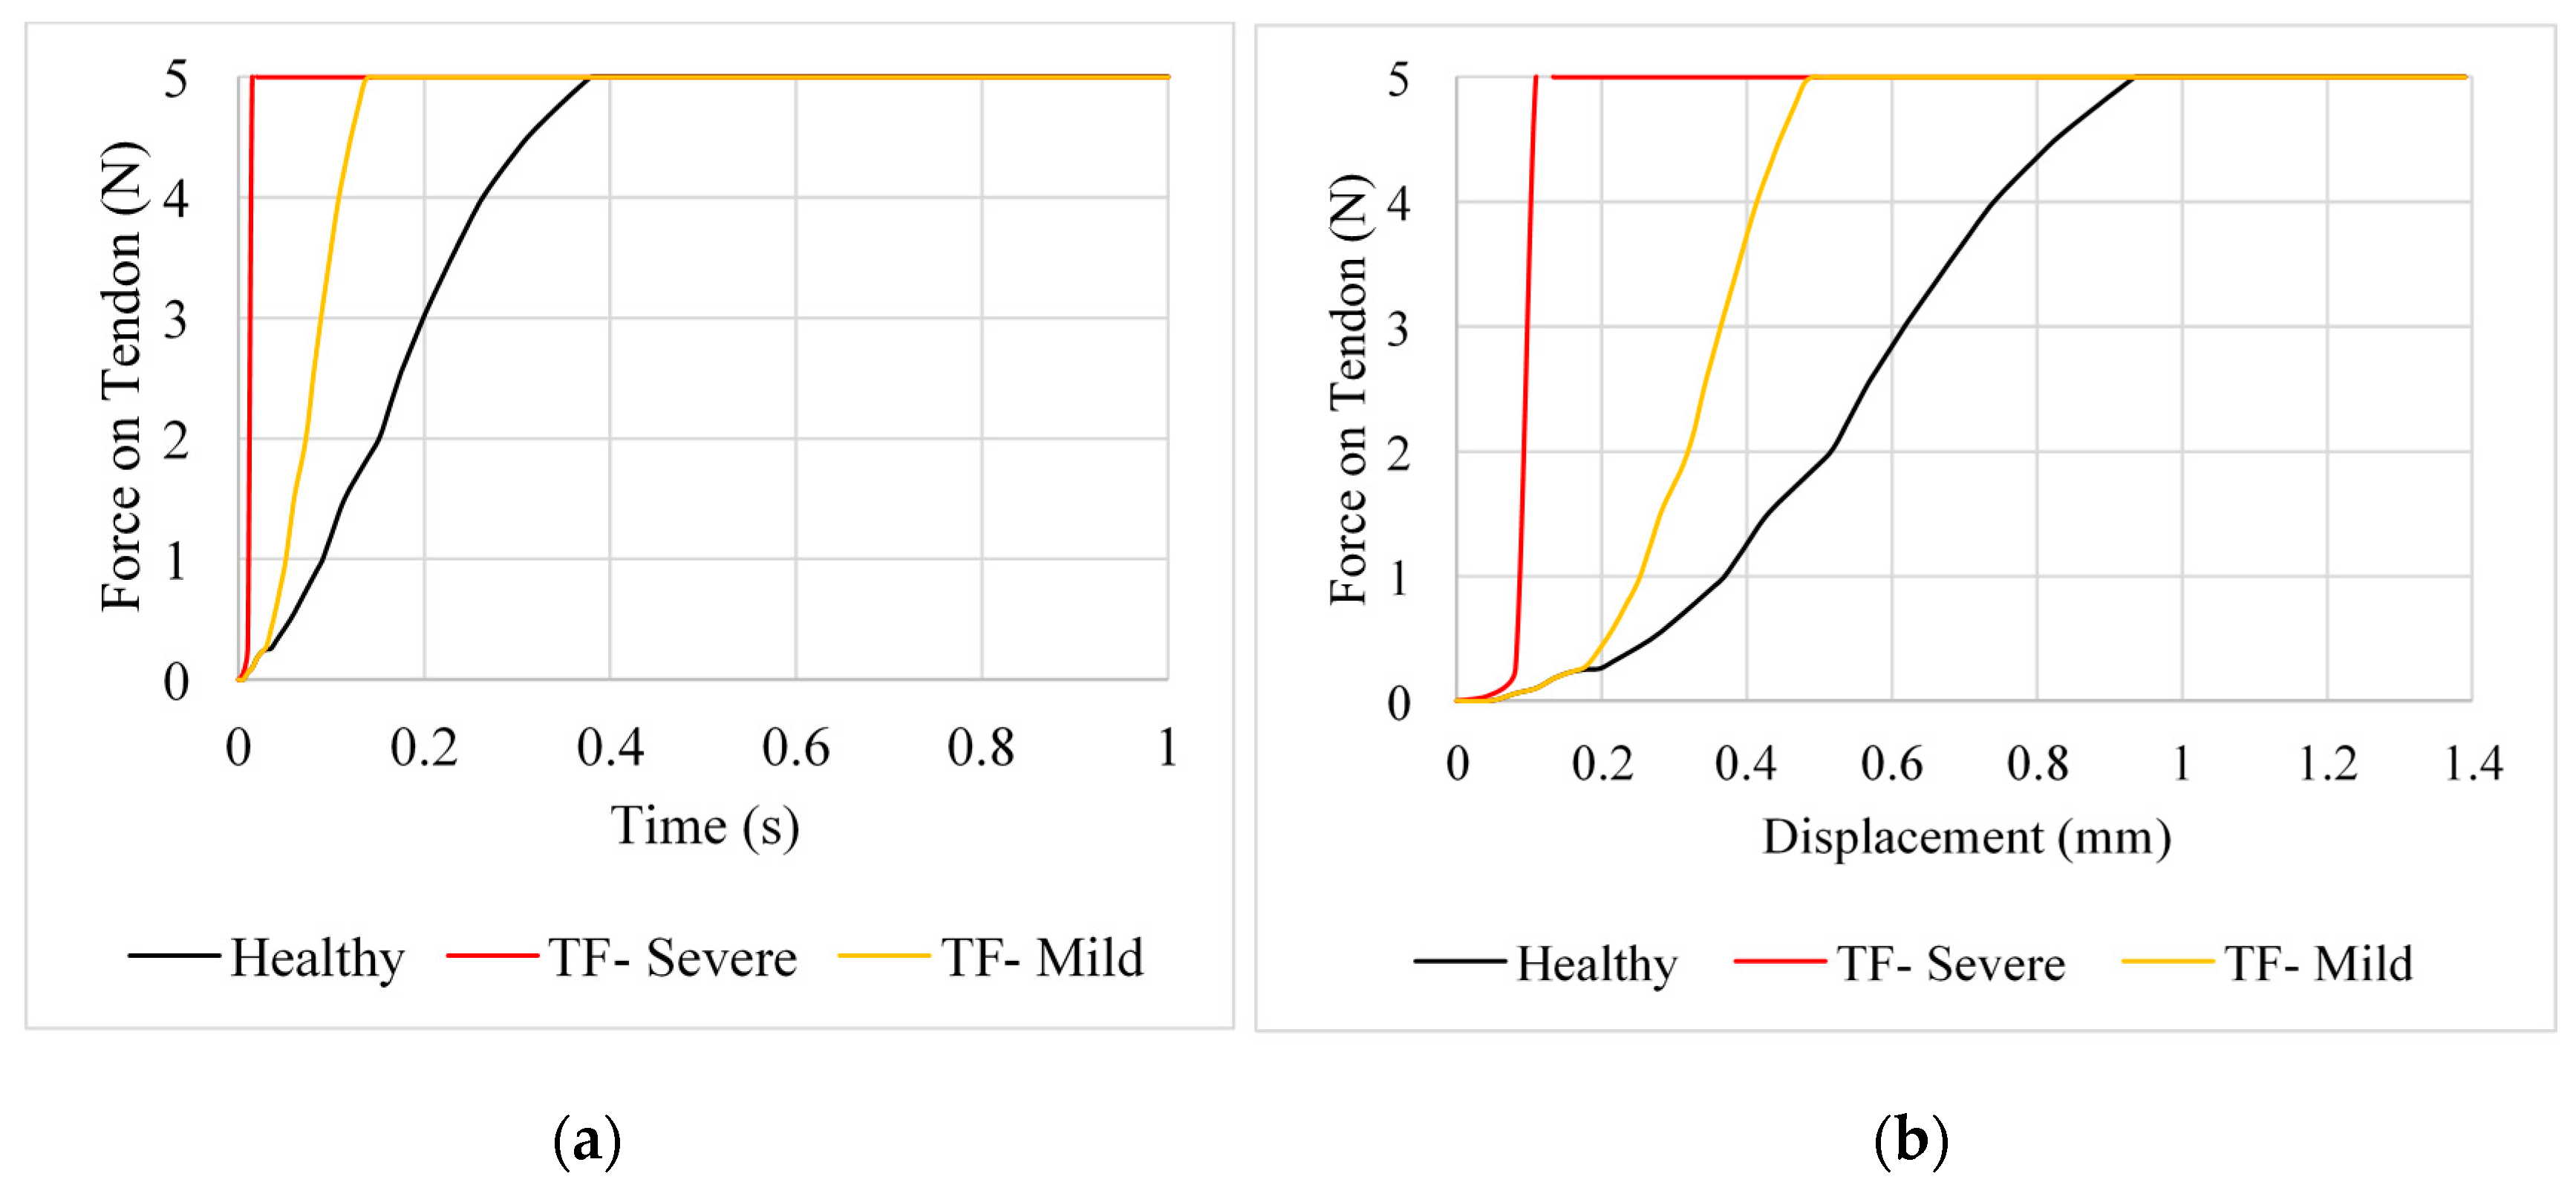
Figure 7.
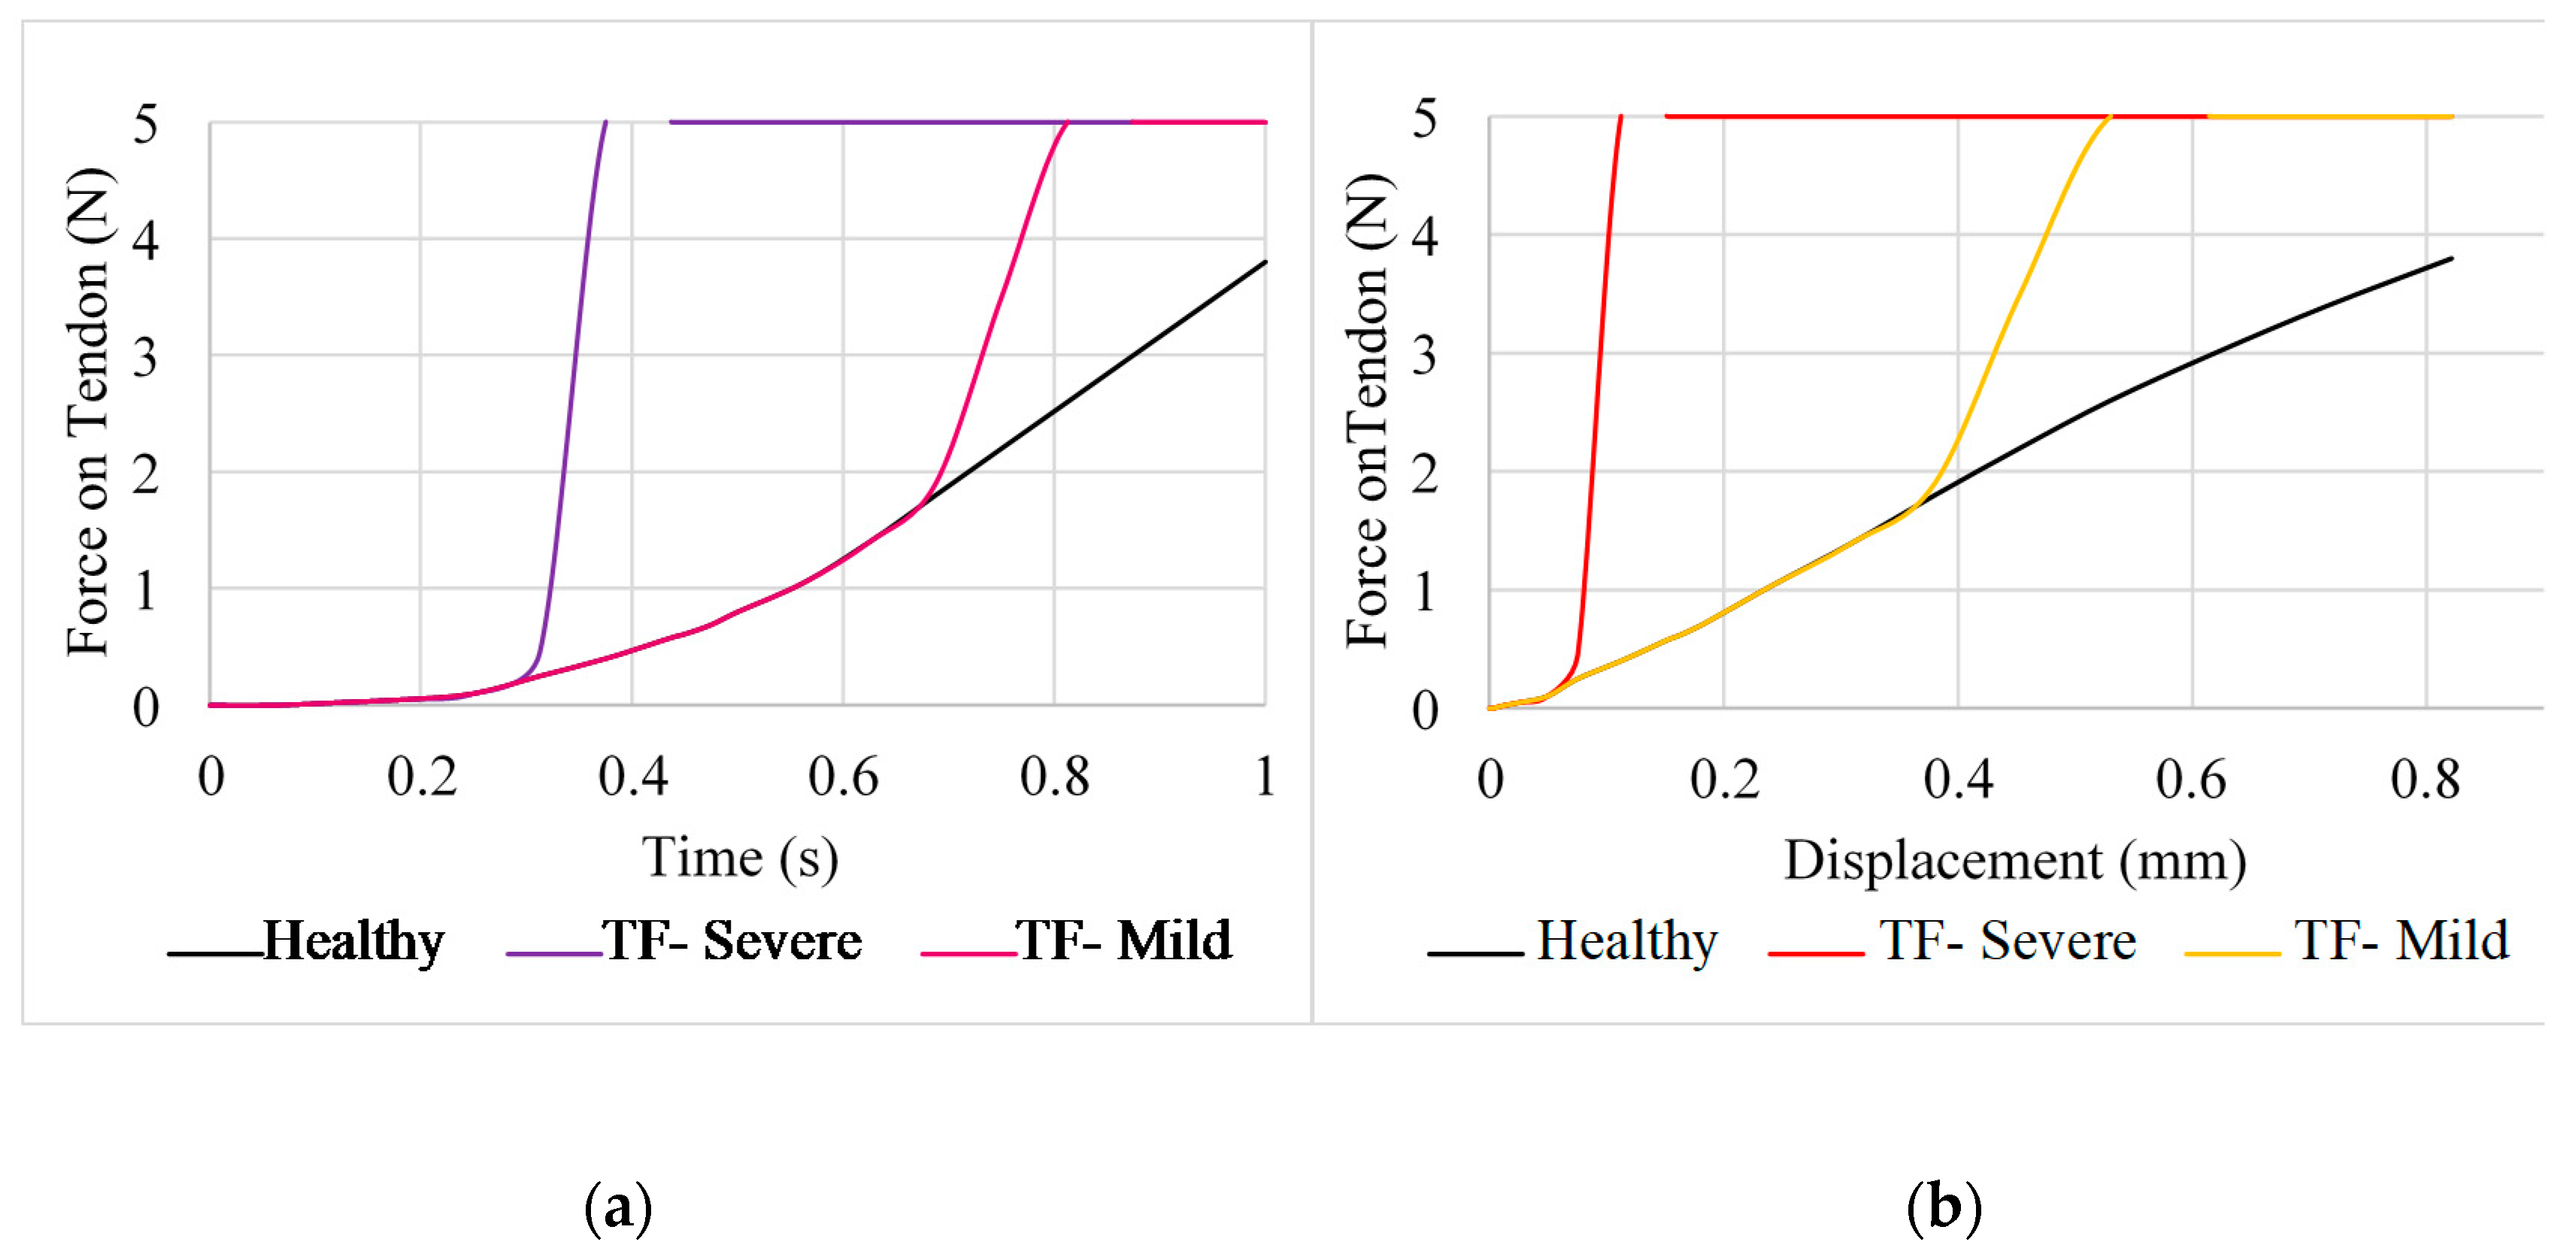
Force predicted for the FDP and FDS tendons (position C). (a) Force against time, (b) force against displacement.
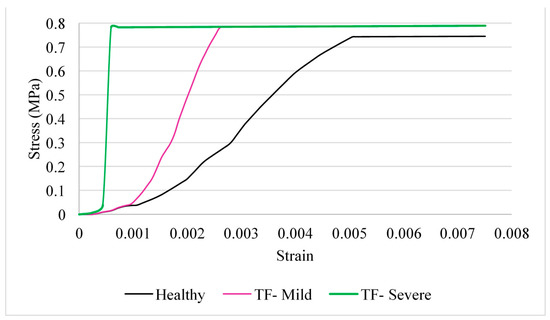
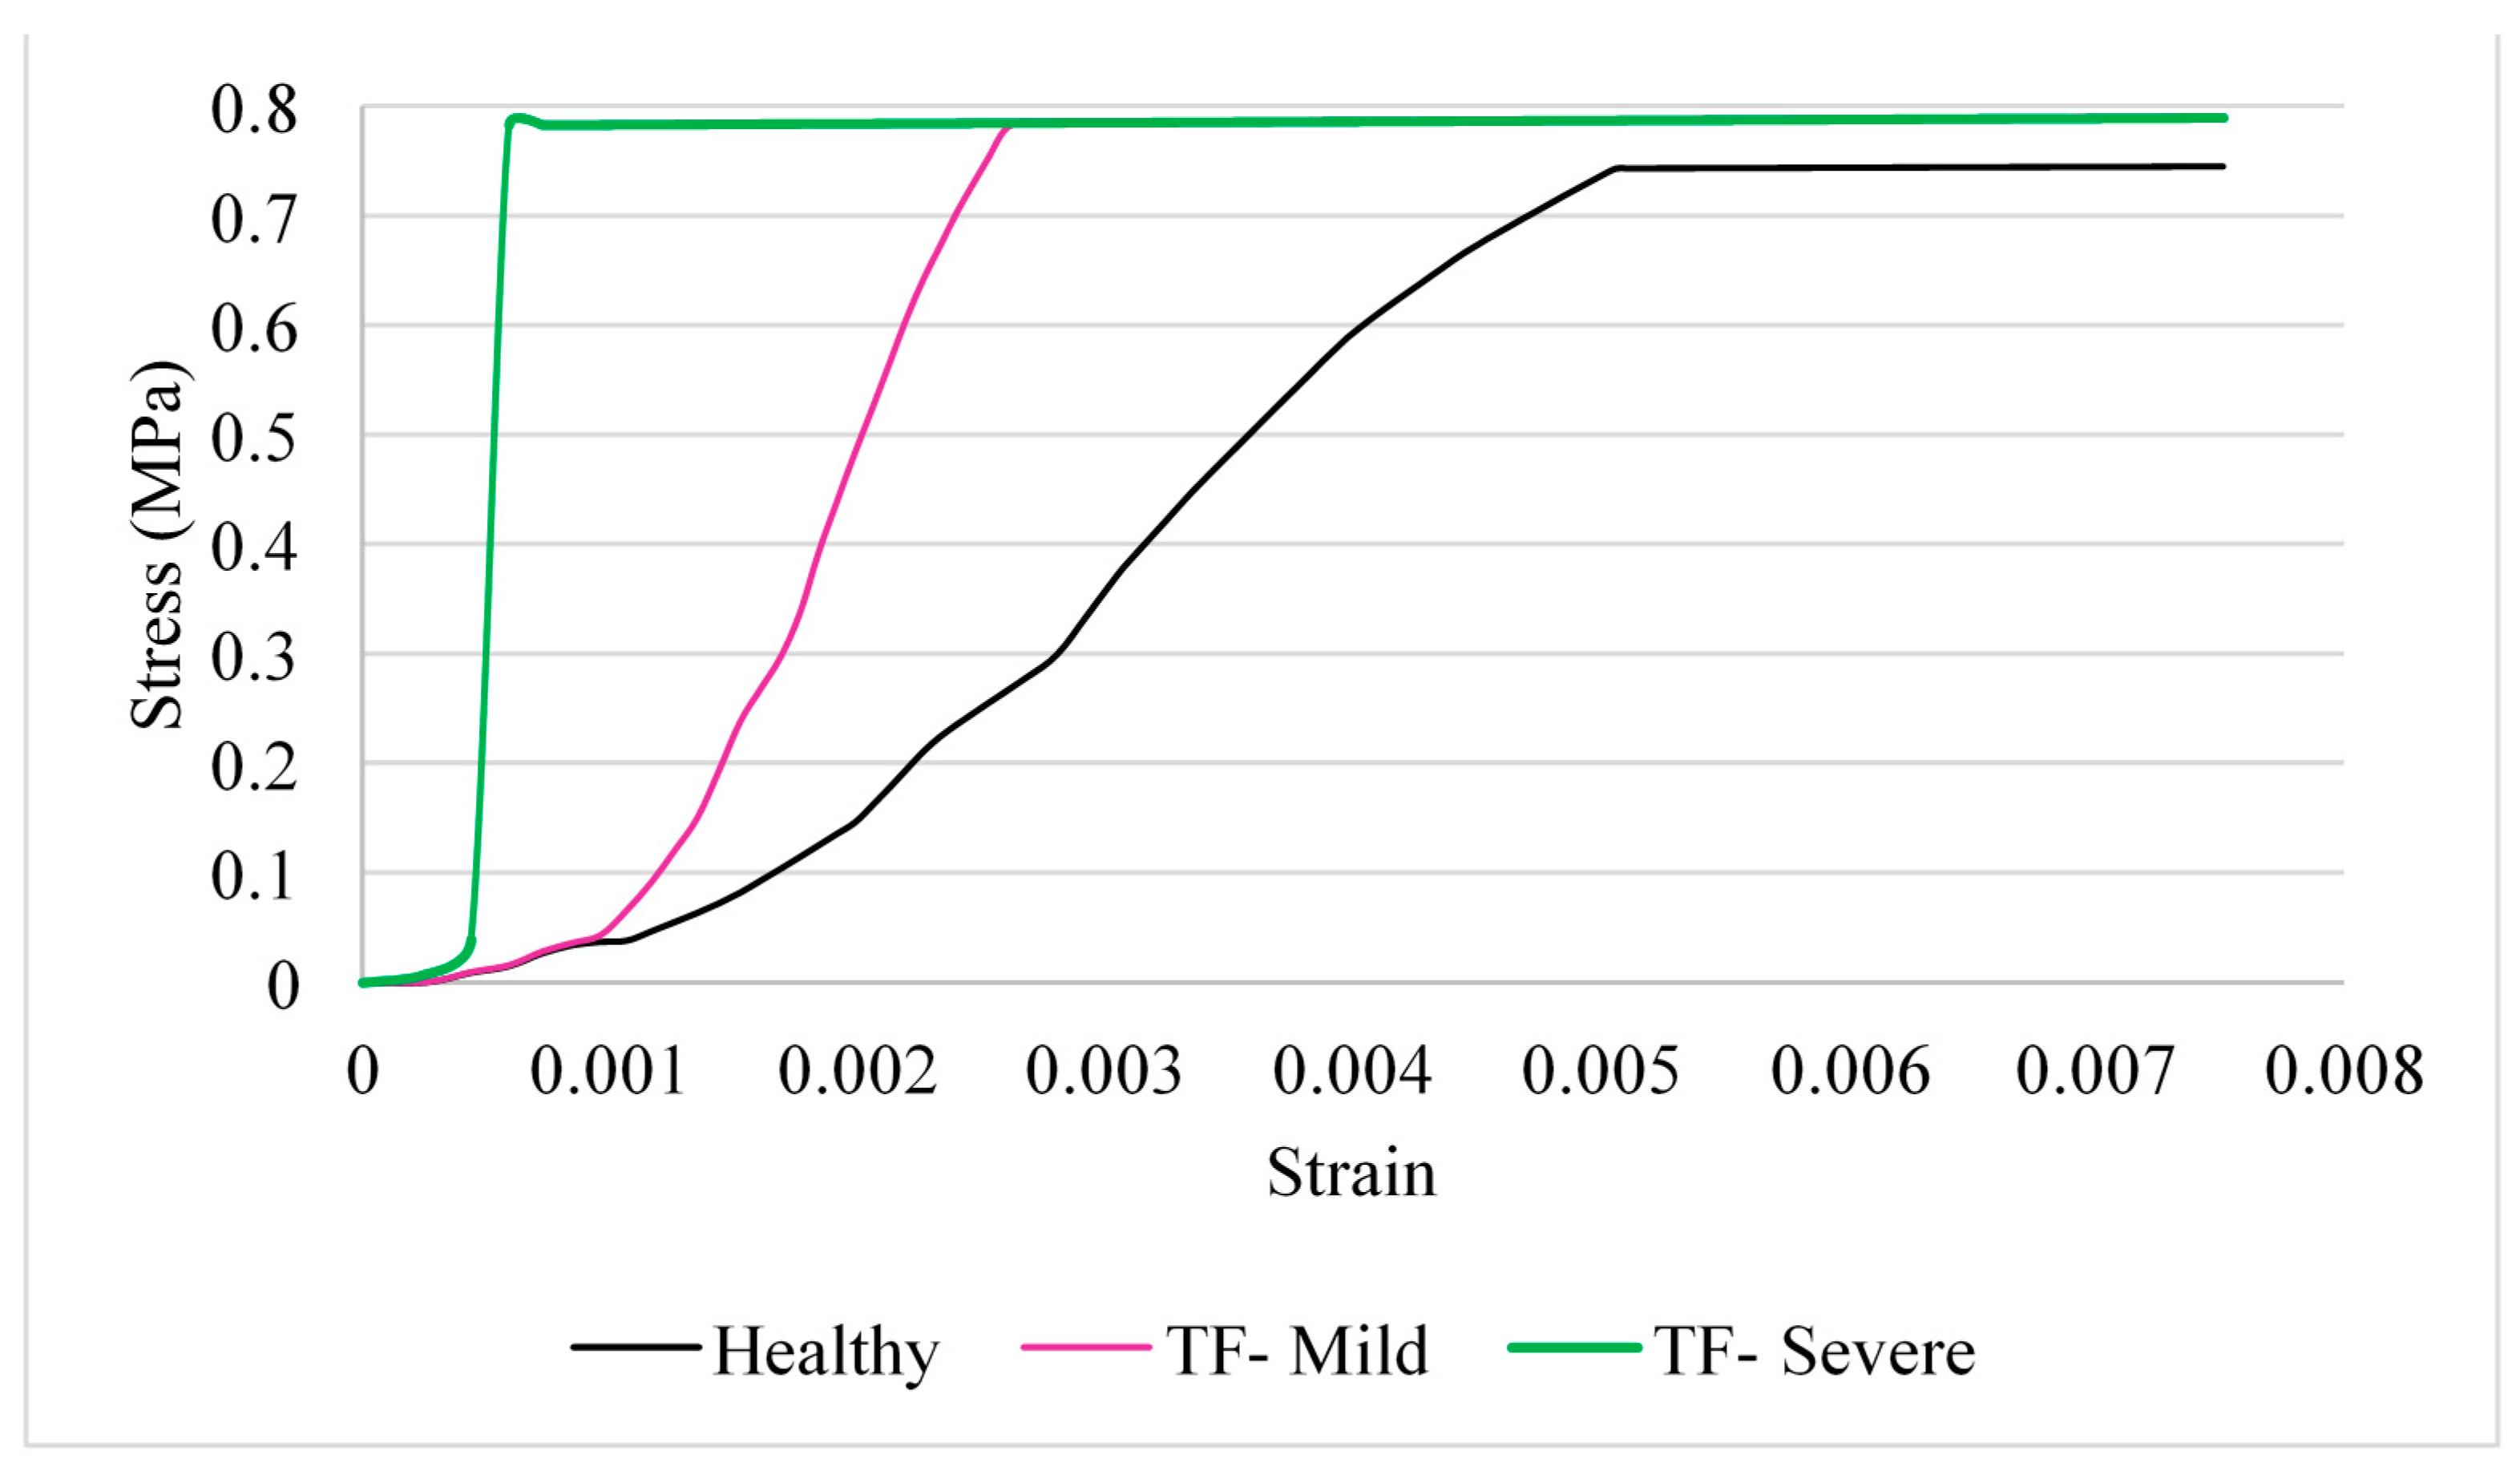
Figure 8.
Stress–strain predicted for the FDP and FDS tendons (position C).
2.2. Position A—Extension
The locking of the tendon, caused by trigger finger, had a notable effect on the forces exerted in the tendons. In the case of severe trigger finger, a sharp increase in exerted force is observed at the point at which the tendon is restricted, in contrast to the healthy tendon where force increases gradually over time (Figure 2 and Figure 3). There are much greater forces on the severely affected tendons as compared to those of the mildly affected tendon and the healthy tendon at the same displacement. For example, at 0.1 mm, forces are ≥5 N for the case of severe trigger finger, whereas, for the mildly affected and healthy tendon, the forces are 3.6 and 1.83 N, respectively. Healthy and affected tendons followed a linear stress–strain relationship until triggering, with a Young’s modulus of approximately 1.5 MPa [24].
For the EDC tendon (Figure 4), the increase in force in the mildly affected tendon is less as compared to the equivalent condition for the FDS tendon (Figure 5). For example, a large increase in the measured force in the mildly affected tendon only noticeably increases at 0.38 mm for the EDC tendon, whereas, for the FDS tendon, the increase is immediate.
2.3. Position B—Abduction
Displacement of the tendons themselves was negligible during abduction for position B. For this motion, measuring the displacement of each node from its initial position provided much clearer results. Comparing the force–displacement graph for position B (Figure 6) to that of the extended finger in position A (Figure 3), the finger is able to undergo a larger displacement before an increase in force is observed. For the severe case of trigger finger in position B, force starts to increase rapidly at a displacement of 6.98 mm and at 7.53 mm for the mild trigger finger. Additionally, the rate of increase in force for severe trigger finger does not differ from that of the healthy tendon until 0.625 s, whereas the equivalent point was observed at 0.3125 s in position A.
2.4. Position C—Hyper-Extension
For position C, up to the point at which locking occurs in the severely affected tendon at 0.08 mm (Figure 7), measured force increases rapidly, similar to the force increase in position A (Figure 3). The change in force gradient was noticeably lower for the mildly affected tendon when approaching the 5 N limit, with an initial rise at 0.18 mm.
A “toe” region is observed in the stress–strain curves (Figure 8) of the hyper-extension movement of the finger before the relationship becomes linear. The mildly affected tendon can withstand a greater amount of strain over a longer period before triggering occurs. The mildly affected tendon reached a strain of 0.26% at the maximum stress of 0.78 MPa, whereas the severely affected tendon only reaches a strain of 0.059%.
2.5. Cross-Sectional Area and Tension
The cross-sectional area (CSA) of the tendons decreased when loads were applied (Table 1). As a result of the severely affected tendon’s force increasing more rapidly before movement is restricted, the CSA is much greater than that of the mildly affected tendon, which has a much greater capacity to extend before finger movement is restrained. This is also the case for the tension in the tendons presented in Table 2. Tension in the mildly affected tendon in both positions was more than double that in the severely affected tendons, due to their greater capacity to extend.

Table 1.
The calculated values for cross-sectional area, comparing positions A and C. Using Equations (1)–(7).

Table 2.
The calculated values for tension, comparing positions A and C. Using Equations (1)–(7).
3. Discussion
This study has highlighted a clear increase in exerted force on tendons restricted by trigger finger when compared to healthy tendons under the same range of motion. The force analysis further indicates that the more severe the condition, the greater the stress induced in the tendon.
As expected, tension was higher when the tendons were under hyper-extension as compared to extension (position C vs. position A). Even for the healthy tendon, tension for position C (4.70 N) was measured to be more than double that at position A (2.00 N). This is in alignment with evidence found in the literature that demonstrates that hyper-extension injuries can occur when tendons or ligaments become overstretched [11]. In the case of trigger finger, greater tension was observed in the FDS tendon for position C as compared to position A (1.13 N greater under mild trigger finger). Further tendon injury could occur during hyper-extension as a result of trigger finger; tendons could become ruptured or separated from the bone, resulting in disrupted muscle function and joint instability.
For validation of the healthy tendon, several studies have been reviewed. Yang et al. [25] and Tanaka et al. [26] both tested this using tendons taken from fresh cadavers, whereas Kursa et al. [27] and Edsfeldt et al. [28] carried out testing during open carpal tunnel surgery. These studies all reported on loading forces during flexion. Loading forces on each joint in full flexion in the study by Yang et al. ranged from 1.69 to 7.93 N [25]. The forces in the study by Kursa et al. [27] ranged from 1.3 to 4 N in FDP tendons and 1.3–8.5 N in FDS tendons, and Edsfeldt et al. [28] reported forces of up to 13 N. Although the lock constraints may have meant that the model in our study has under-predicted the highest values for force, the results for the healthy FDP observed a trend which appears consistent with the maximum force values reported in the literature.
There are limitations to using cadaver models; for instance, specimens might be embalmed or treated with chemicals to prevent degradation, embalming may increase stiffness of the tissue [29,30], and treatments such as dehydration [31] and cross-linking (e.g., using glutaraldehyde) alter the physical and mechanical properties of tissues. If samples undergo freeze-thaw cycles, this too may alter their mechanical properties [32,33]. In the case of cross-linking, chemicals such as glutaraldehyde reduce degradation through the process of cross-linking of collagen, with a side-effect of increased stiffness, though this may depend on the state of crimp of the collagen which has undergone cross-linking [34].
When considering the forces acting on the FDS tendon during trigger finger, the results in this study were compared with Lu et al. [23]. The results from this study are particularly meaningful as it is the only study detailing the direct correlation between trigger finger and its effect on the forces acting on the tendon. External force increased gradually as extension angle increased; as triggering occurred, there was an abrupt increase in force, with the maximum force reaching 5.4 N. This coincides with results from this study, with peak values of around 5 N, which implies that any limitations in using connector elements may account for less than 10% of peak predictions. Therefore, this model is in agreement with the results found in the literature for extension.
One of the most common treatments for trigger finger is splinting; the affected finger is tied to a splint to restrict movement in flexion and extension while not restricting movement in abduction and adduction. For both the mildly and severely affected tendons, a displacement of 6.9 mm was reached before a sudden increase in observed force. These findings imply that there may be value in early treatment and the necessity of healthy tendons, providing further understanding of the impact of trigger finger to avoid the need for surgery. It is noteworthy that the current conservative treatment is splinting and physiotherapy; therefore, there is clear scope for innovation in this field. Active devices could be developed which enable the appropriate loading of tendons within the hand, potentially with a limit on loading/extension as necessary, e.g., to prevent hyper-extension, etc. One option for an active, external prosthetic device could be the use of electroactive polymers. There is also the possibility to combine this technology with micro-electro-mechanical systems to sense loading. Such a device could potentially be used at home, with data recorded and logged so that, during visits to the clinic, data could be evaluated—for instance, using a radio frequency identification (RFID) tag.
There is agreement in the literature that tension in the FDP tendon is greater than that in the FDS tendon for healthy fingers [25,27]. More specifically, in a study by Lu et al., tension generated during passive extension modelling was estimated in the FDP tendon as 1.41 to 22.93 N compared to 0.78 to 11.97 N in the FDS tendon [23]. If the FDS tendon is inflamed, as experimented with in this study, the overall strain on the FDP tendon would be greater, leading to significant long-term damage. Larger moments are necessary about the joints with trigger finger, so if there is an increase in repetitive high tendon loads, further deformation may occur. Tendons may also suffer elongation with sustained loads. There is less strain on both flexor tendons with mild trigger finger.
Ultimately, the intention of this paper is partly to encourage innovation for prosthetic devices to treat trigger finger, by providing a framework for initial stage development in silico. Patient specific models [35] can be useful to tailor any technologies to individuals. Alternatively, there is scope to scale the model used in this study to more quickly enable the clinical assessment of tension for a given individual; such scalable models have been of value in other areas of orthopaedics [36]. Setting up these types of models is feasible by producing scripts which generate input files directly and request input data such as boundary conditions in a specific format (e.g., .dat files) to then enable the FEA software to perform the numerical solution. Boundary conditions for models can also use boundary conditions specific to an individual [37]. One advantage of the generation of any computer-aided design model is that it can be 3D printed [38], which can also be useful for evaluation or interaction with patients when explaining the condition.
4. Materials and Methods
4.1. Geometry
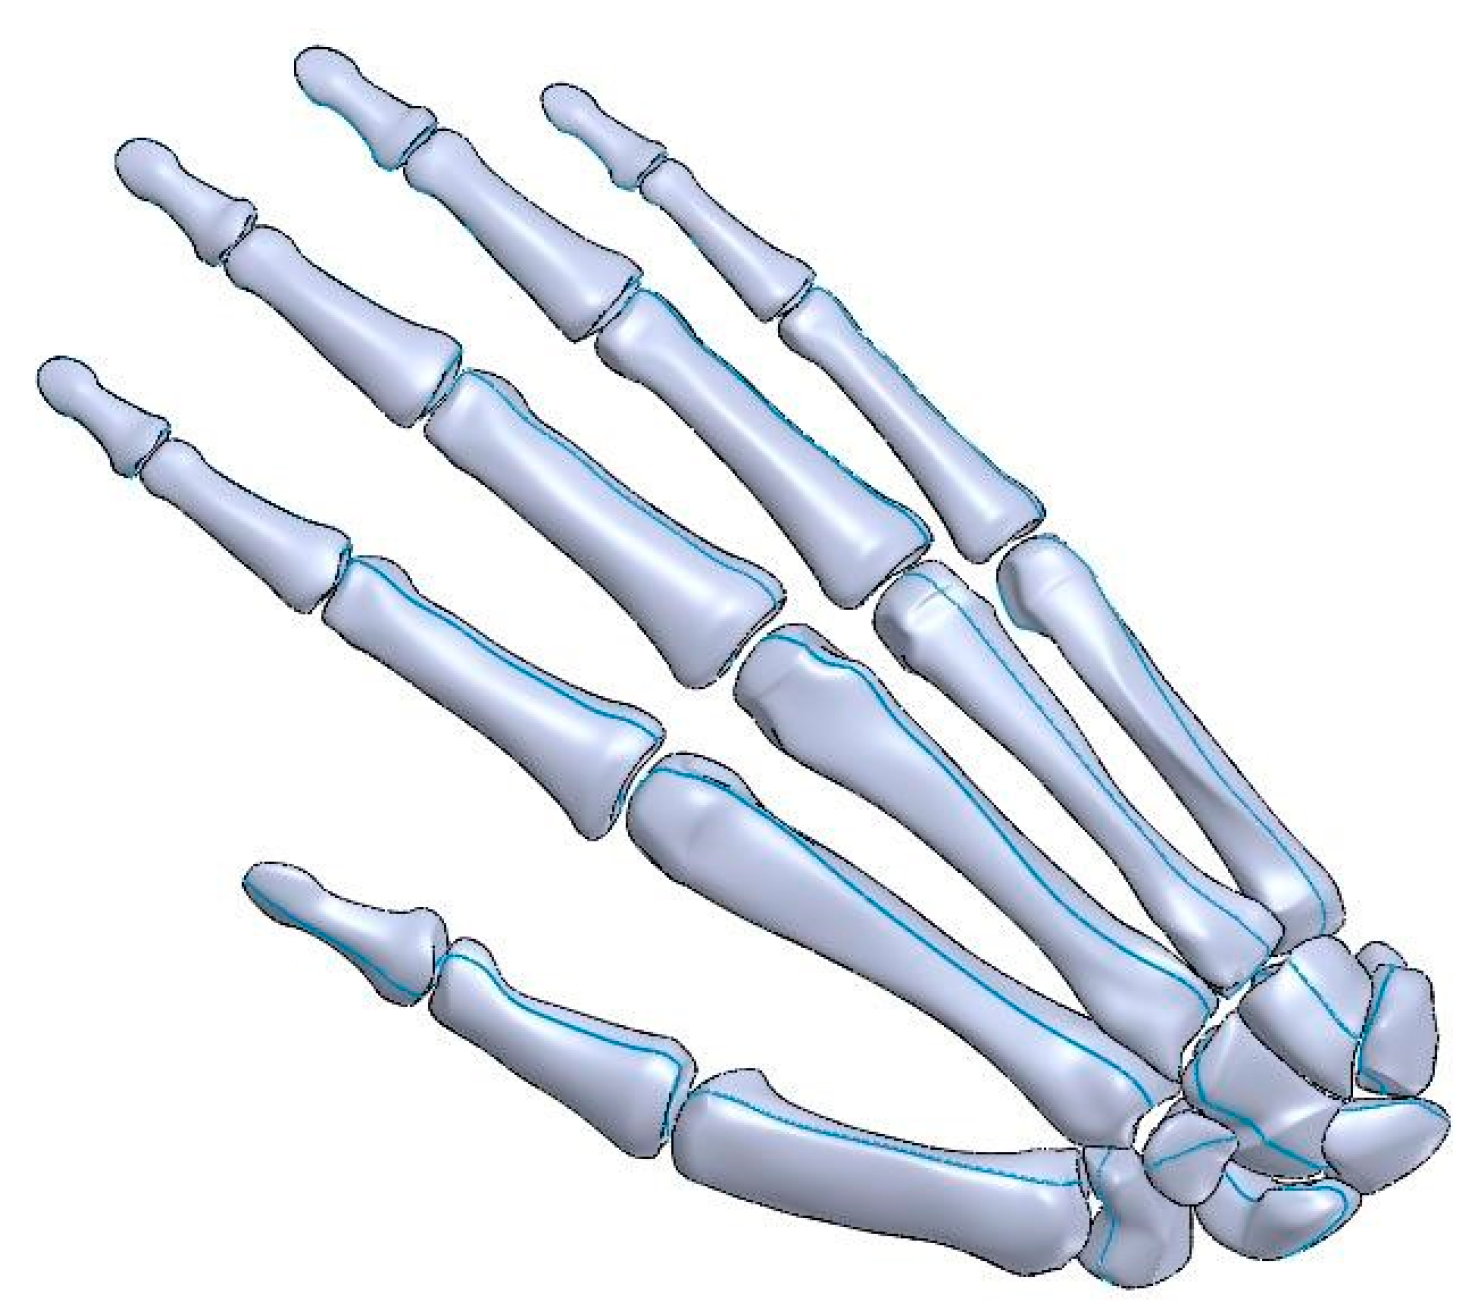
A geometric model of a human skeleton was sourced [39] (Figure 9) and imported into computer-aided design software (SolidWorks, Dassault Systémes, Vélizy-Villacoublay, France), from which the hand bone structure was extracted. The bones were scaled using Solidworks; scaling was implemented so as to match the dimensions of an adult female available from the literature [40] (Table 3). The distal, middle and proximal phalanges and the metacarpal bone of the index finger were saved as separated parts before being imported into ABAQUS (Dassault Systems, Providence, RI, USA) as three-dimensional (3D) deformable components. The tendons and ligaments were then modelled using connector elements and constraints.
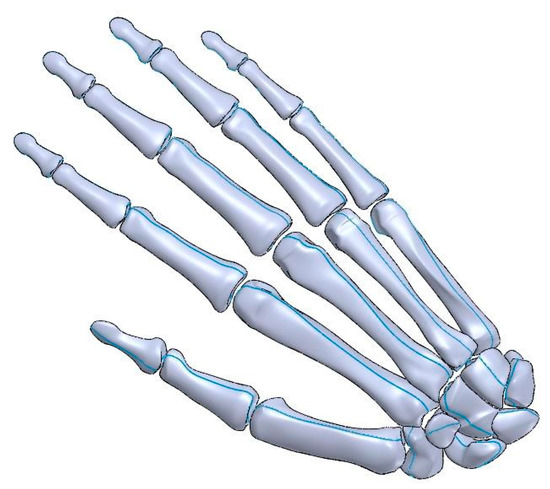
Figure 9.
CAD model of the right hand used for simulations.

Table 3.
The phalangeal and metacarpal lengths used in the CAD model.
4.2. Material Properties
The material properties for cortical bone [41] were assigned to each component, as detailed in Table 4. Ligaments and tendons are comprised of bundles of closely packed collagen fibrils [42,43,44,45], organised in parallel to resist strong tensile loads. Therefore, tendons, for instance, display hyperelastic properties, and as the finger is straightened in response to an applied load, the tendons start to deform in a linear fashion and become aligned [45].

Table 4.
The properties of cortical bone implemented into the ABAQUS model; from the literature [41].
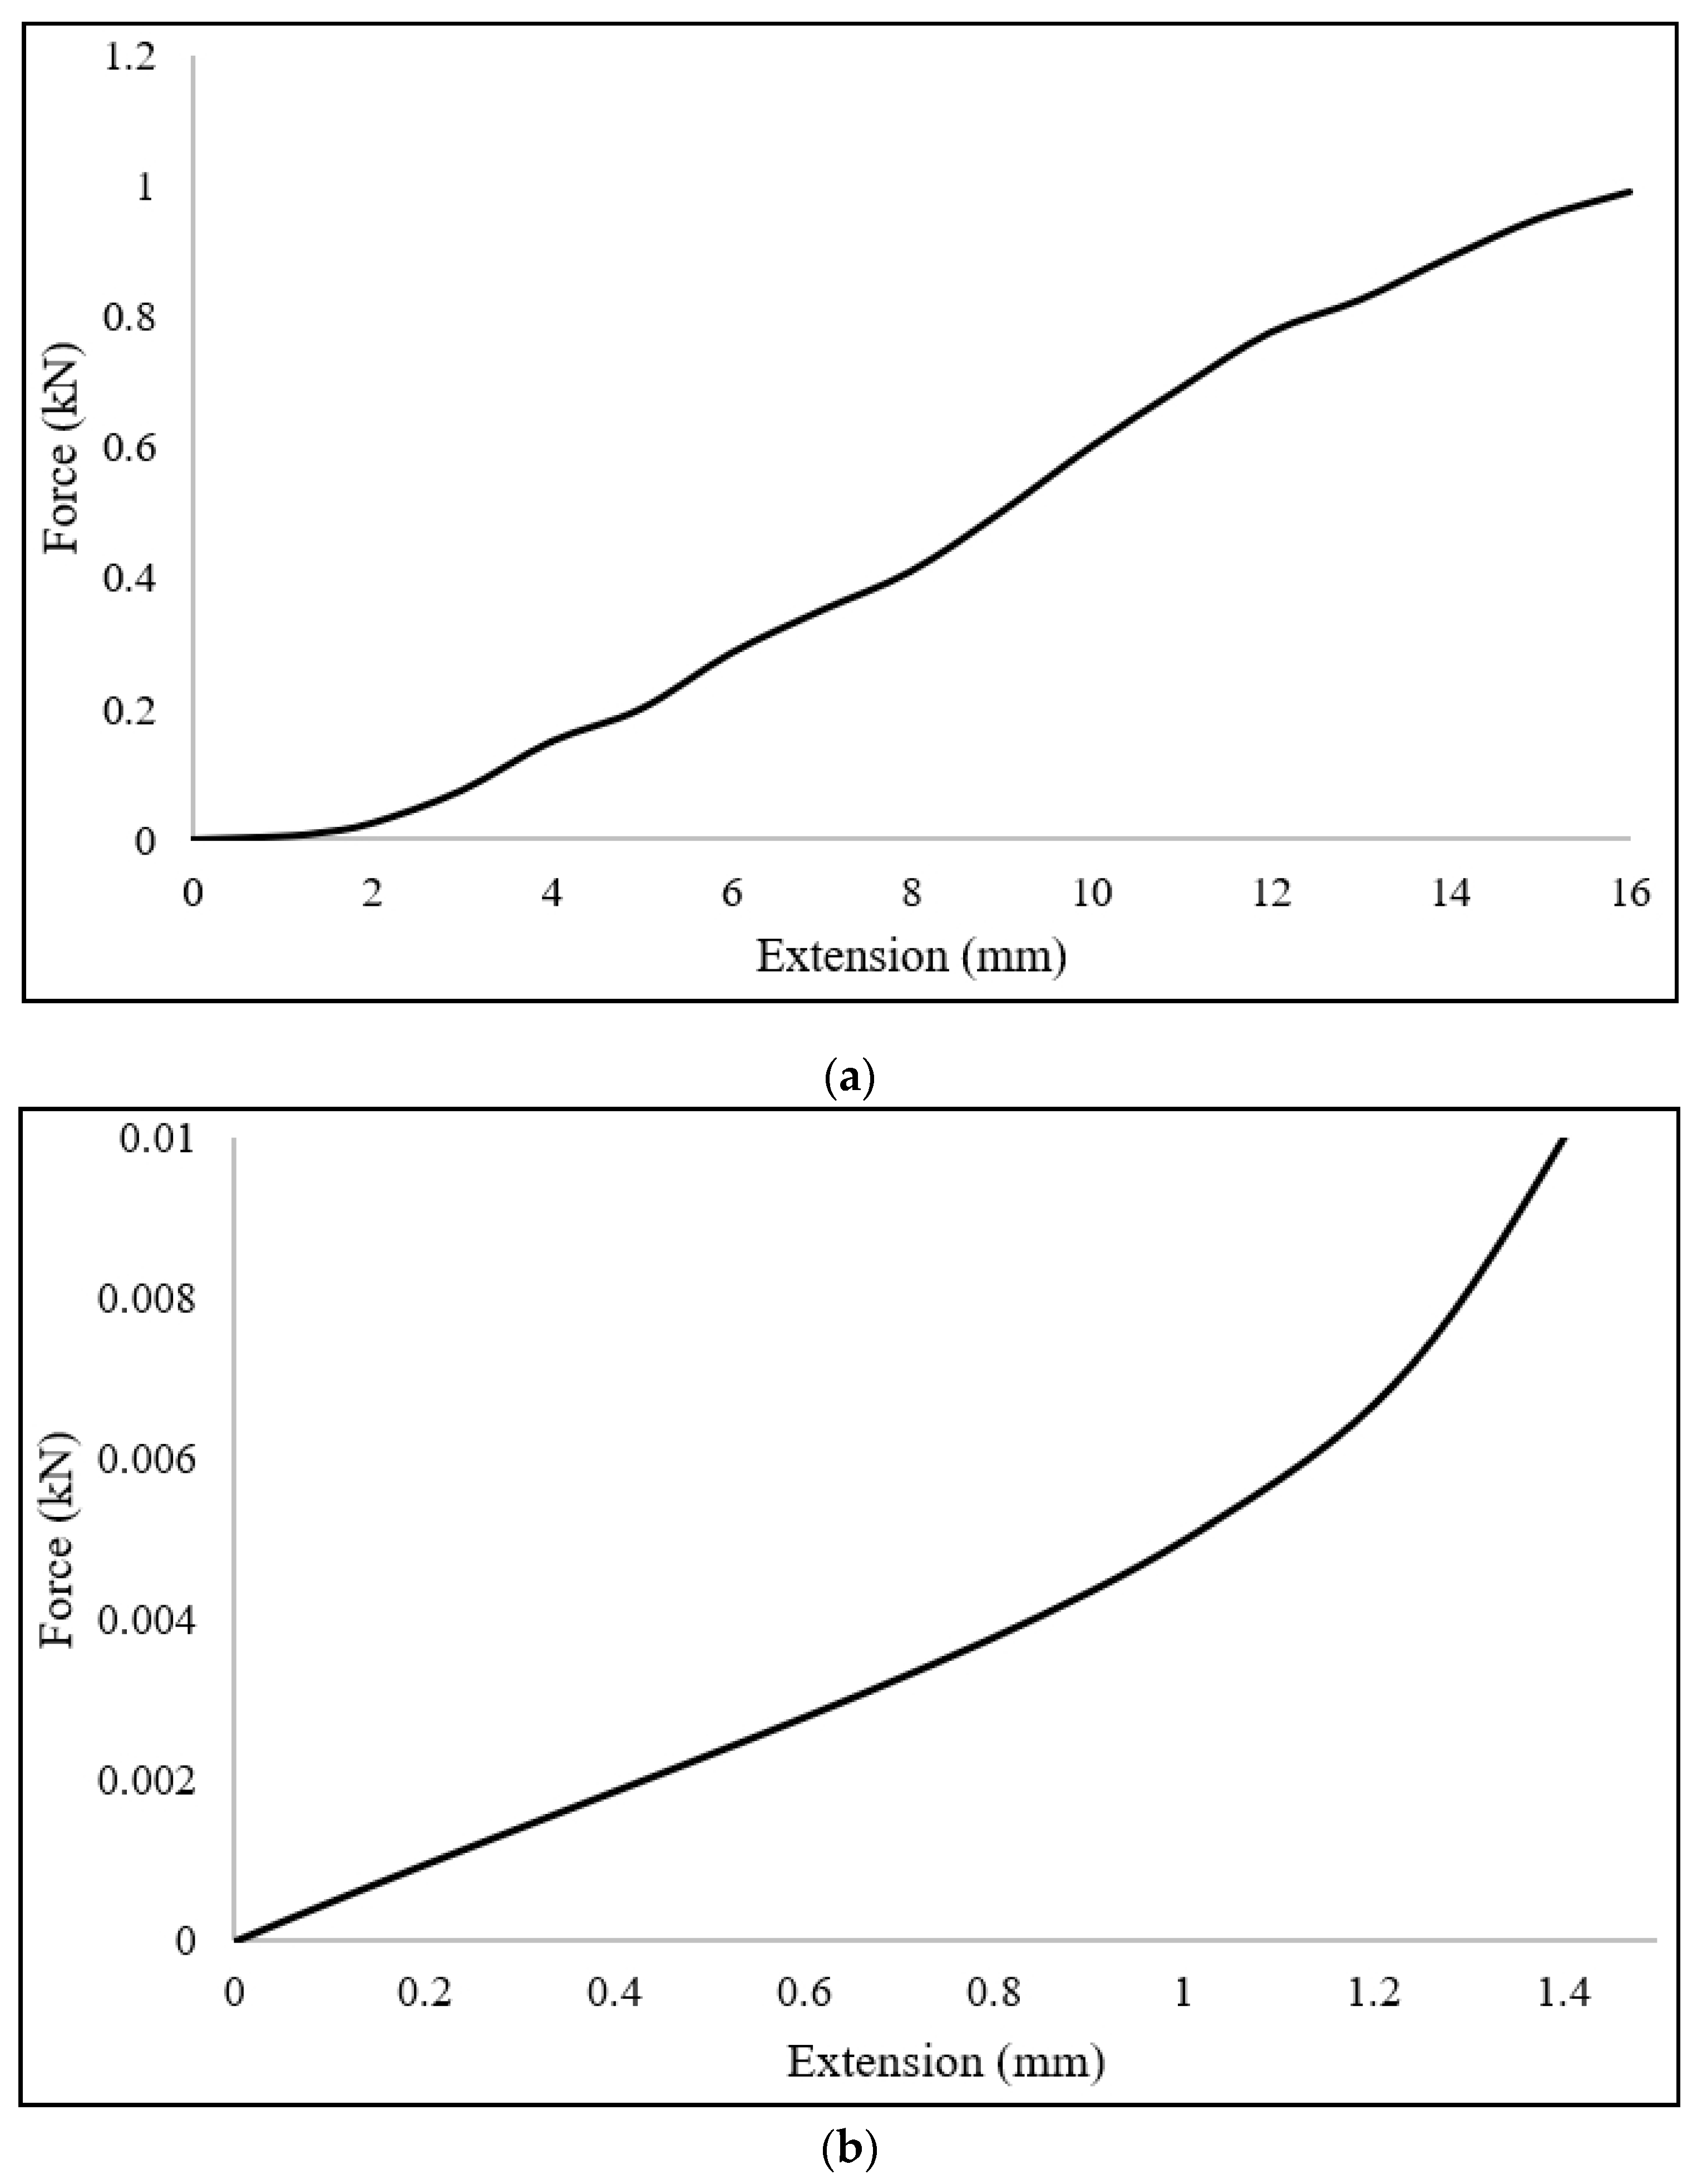
Tendons were assumed to be incompressible, with no change in volume. Additionally, tendons were modelled as undergoing frictionless motion through the tendon sheath. However, where trigger finger was included in a simulation, the motion was restricted, as explained in Section 4.3.2. The path of the tendon was assumed to follow a straight line along the surface of the bone between two points in the tendon network. The loads experienced by a tendon were assumed to be distributed uniformly throughout the tendon network. Tendons were modelled using material properties from the literature [46]; this data was inputted directly into the ABAQUS, such as the data shown in Figure 10.
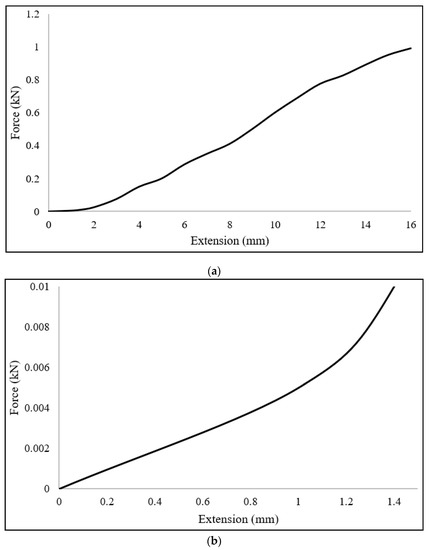
Figure 10.
Sample force-extension data used to simulate tendons. (a) Full data set used from the literature [46]; (b) portion of the data relevant to the loading range within the simulations solved.
4.3. Model Set-Up
4.3.1. Joint Orientation
A kinematic model of the hand can be mathematically approximated as a number of revolute joints that are linked together. The index finger model is based on methods commonly used in the literature [1,47,48]. The distal (DIP) and proximal interphalangeal (PIP) joints have one degree-of-freedom (DOF) and are modelled as frictionless hinge joints capable of flexion-extension motion. The metacarpophalangeal (MCP) joint represents two DOF and is modelled as a frictionless saddle joint capable of flexion-extension and adduction-abduction. Coordinate systems were defined for each bone in the index finger with respect to a common inertial frame of reference to provide orientation of the joints and tendon configuration. A coordinate system for the distal, middle and proximal phalanx was used [49]. Each system is located in the centre of rotation in the convex articular surfaces of the phalangeal and metacarpal heads. The x-axis is projected along the shaft of the bones, with the y-axis projected dorsally and the z-axis projected radially for the right hand (note: these frames of reference are local to each individual bone).
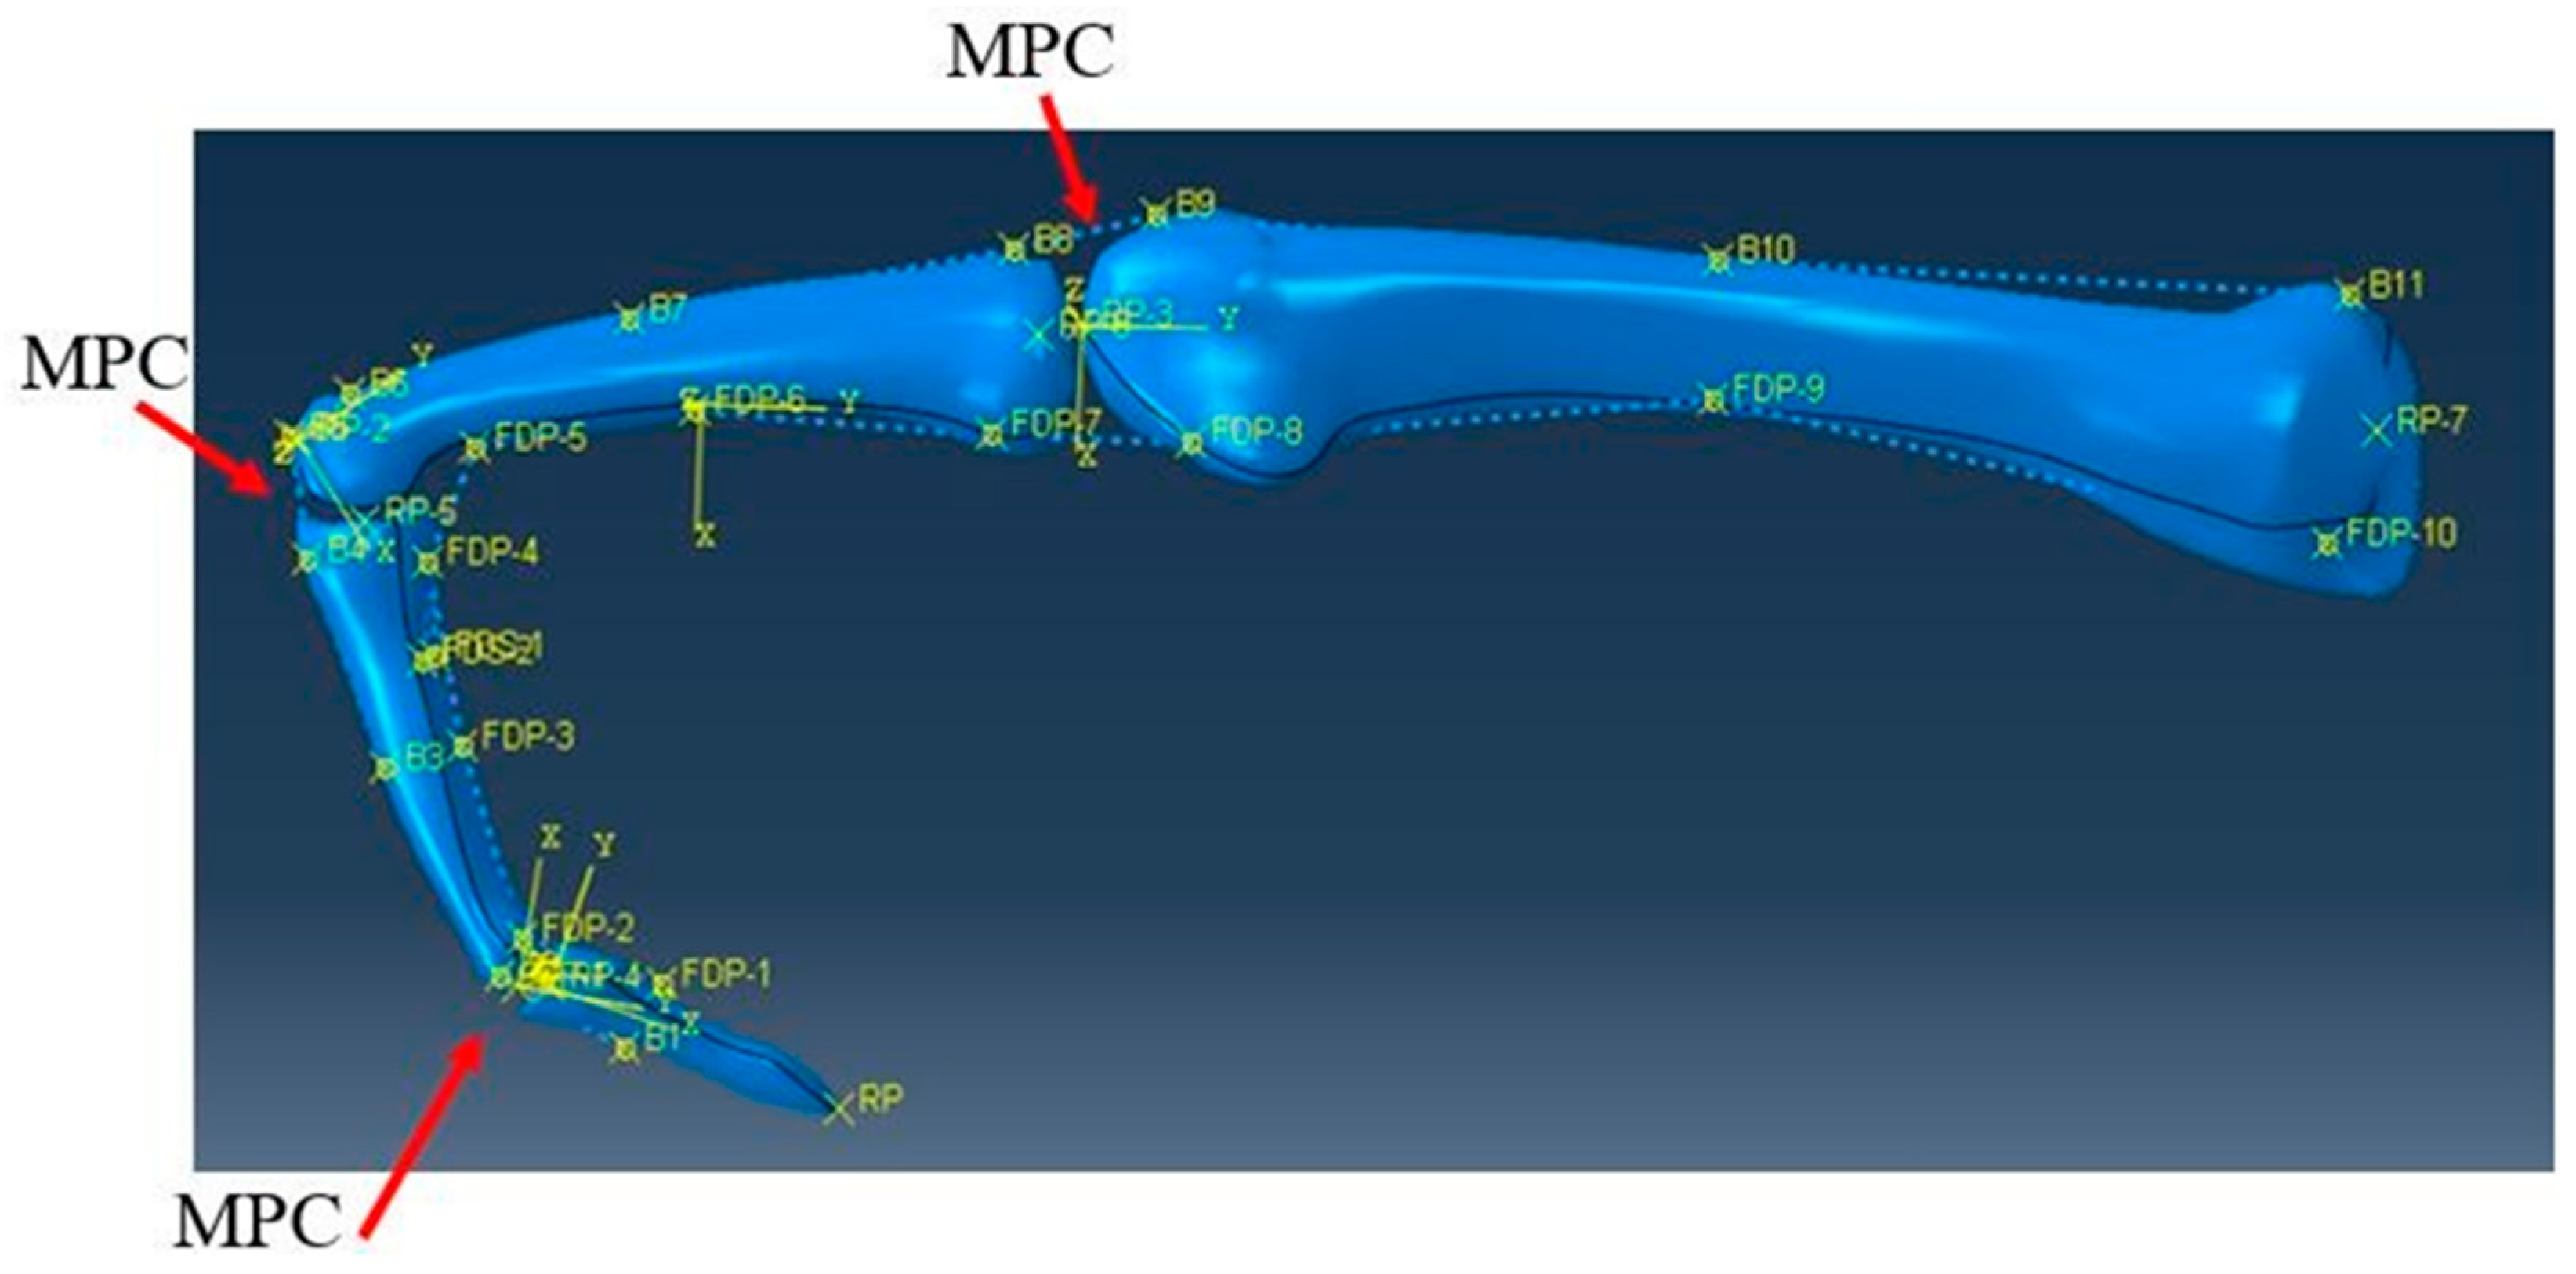
Initially, the phalanges were arranged in a flexed position [48] to resemble how the finger may be immobilised in the “trigger” position (Figure 11). Constraints were applied to ensure that each bone moved in the appropriate DOF and rotated accordingly within each coordinate system. A reference point was assigned at the centre of each convex surface of the bones. A coupling constraint was used which provides a coupling between a reference point and a group of nodes, with the necessary DOF applied between the articular surfaces. This ensures that the distal bone to the convex surface would only rotate about this surface. A general multi-point constraint (MPC) was used between each bone to ensure movement between bones was coordinated. The MPC was applied between the reference point and articular surface of each of the bones. This meant that only two displacement/rotation boundary conditions were necessary for the whole model, one to extend the finger and another to simultaneously straighten the distal phalanx.
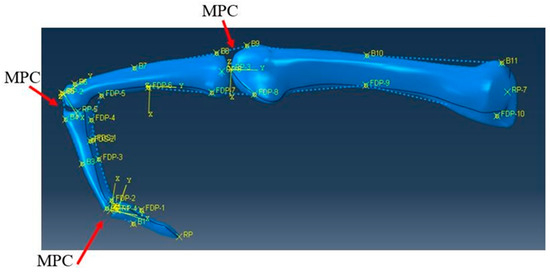
Figure 11.
The initial flexed position of the index finger with the locations of multi-point constraints (MPCs) labelled.
4.3.2. Tendon and Ligament Modelling
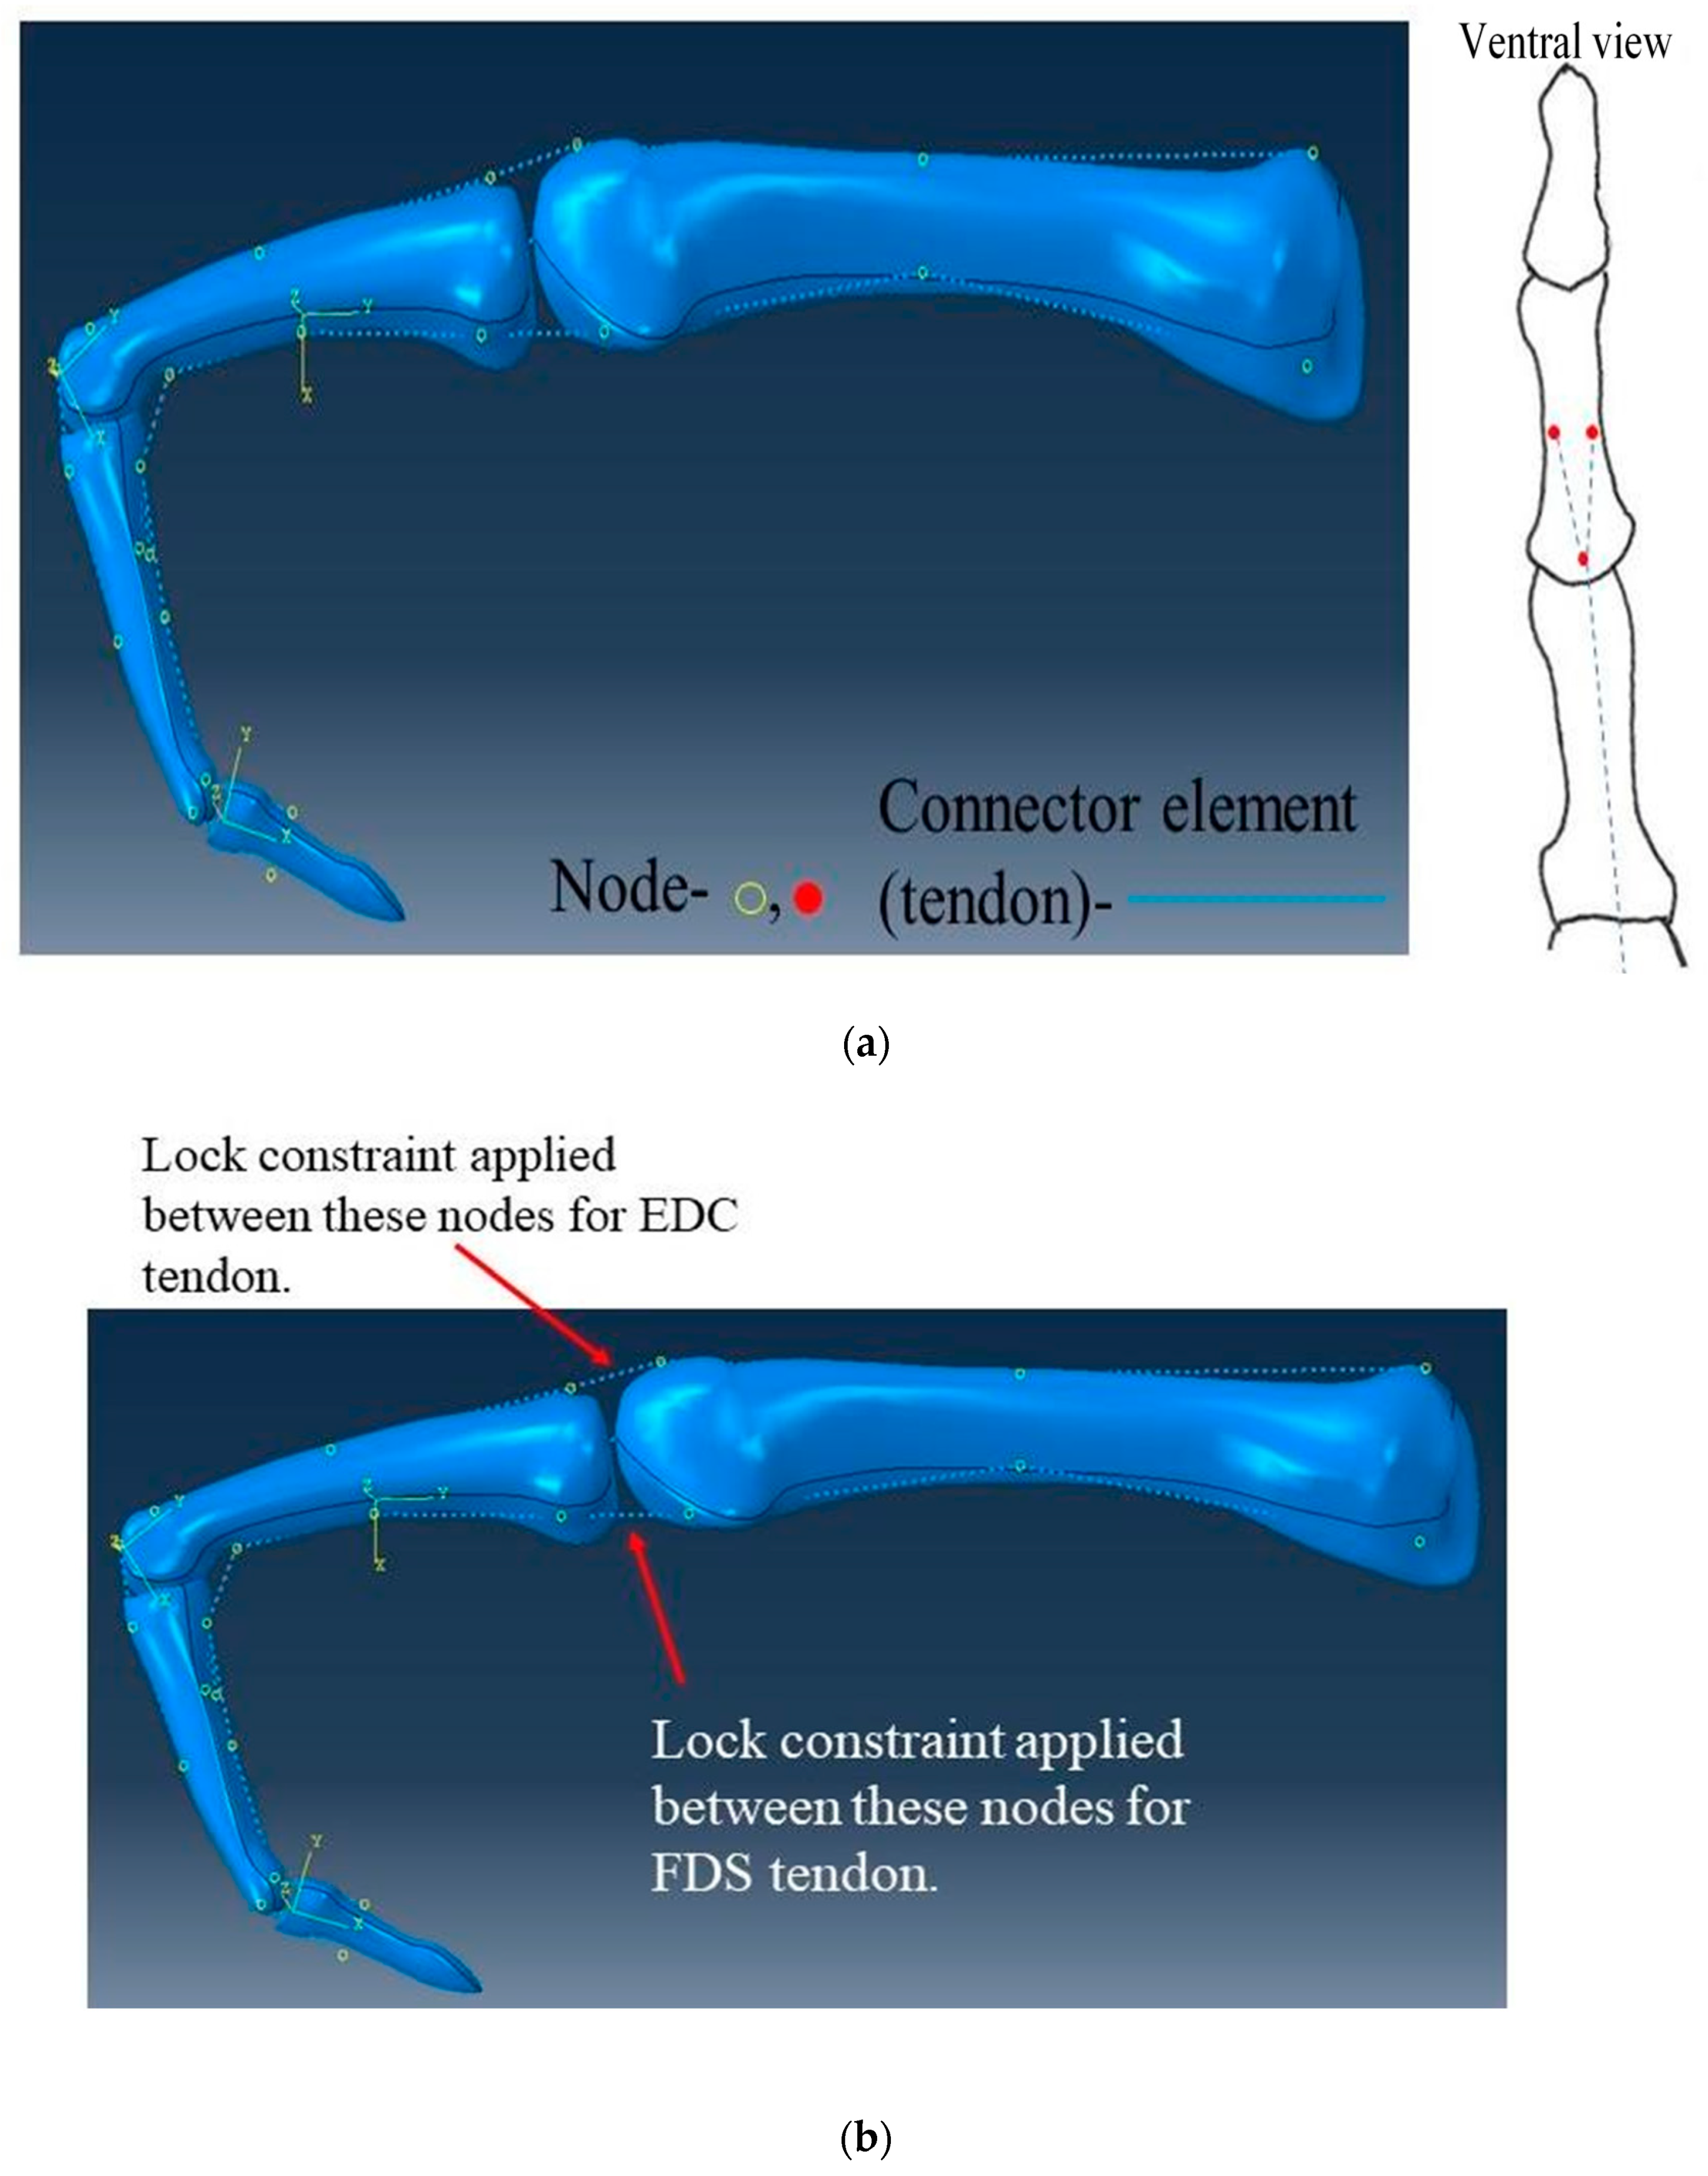
Tendons and ligaments were simulated within the model as connector elements and constraints. Following the meshing of the bone structures, nodes were placed on the mesh at points of attachment in the tendons. To replicate the tendons being constricted by ligaments along the bone, connector elements were joined between the nodes on the bone. Nodes were spread evenly along the palmar and posterior aspects of the finger (Figure 12a).
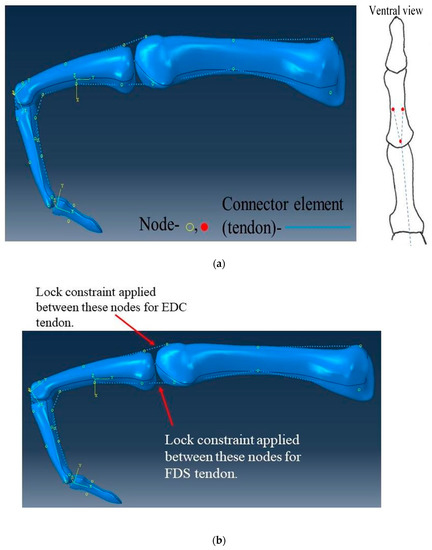
Figure 12.
Connector elements used. (a) The positioning of the nodes and connector elements on the bones (the right image shows the nodes for the FDS tendon). (b) The locations of the lock constraints on the connector elements on the FDS and EDC tendons. Please refer to Table 5 for the movements mimicked.
Connector elements were placed so as to mimic the FDP tendon extending from the distal phalanx to the proximal end of the metacarpal, with the FDS tendon attaching to the middle phalanx in a forked arrangement. The FDS tendon is also constrained by the same set of nodes as the FDP tendon to the proximal metacarpal, both on the palm side. The FDP, FDS and EDC tendons were all modelled in the simulation, with the EDC tendon extending along the full length of the back of the finger, similarly held in place by nodes. A lock constraint as part of the connector element was applied on the FDS and EDC tendons between the two nodes on either side of the MCP joint (Figure 12b). This is a common area in which tendons can experience irritation and consequently inflammation and restriction [50].
Lock constraints restrict movement after a set displacement; the displacement is the change in distance from one node to another. In this study, an estimate was made for the displacement of the lock based on the length of a flexor tendon in an index finger of an adult female. Displacement was set at 0.1 mm for severe trigger finger for relatively no movement and 0.5 mm for mild trigger finger to allow for some movement; 0.1 mm was used to avoid modelling artefacts which became evident when 0 mm was used in preliminary models, and 0.5 mm was used to determine how greater movement would alter tension and the timing of tension which would develop in tendons. To model a lock constraint in ABAQUS, two parameters are needed: firstly, a parameter being constrained (in this case, displacement at 0.1 or 0.5 mm) and a parameter which enforces this constraint (e.g., force). Preliminary models found that a 5 N load suitably enforced the lock constraint on displacement (of both 0.1 and 0.5 mm).
The movements evaluated are outlined in Table 5. For each movement type, results were taken for both severe and mild cases of trigger finger. Initially, the FDP and EDC tendons were modelled without any of the restrictions of trigger finger, whereas the FDS tendon became locked after the specified displacement. Starting from the initial flexed position, the finger was extended for position A, abducted for position B and hyperextended for position C.

Table 5.
A table presenting the different movement-types investigated.
4.3.3. Boundary Conditions
The movements outlined in Section 4.3.2 were feasible through the use of the boundary conditions outlined in Table 6. The metacarpal bone is stationary throughout the running of the simulation; therefore, an initial boundary condition of encastre was applied. In all positions, the finger started in the initial flexed position. For position A, the middle phalanx was rotated 96° about the z-axis until the finger was aligned to a straight orientation. The distal phalanx followed this direction of motion due to the MPC constraints and was simultaneously rotated 61° about the z-axis. The proximal phalanx was rotated 40° about the y-axis, simulating abduction for position B. After returning to the initial position, the finger was hyper-extended, rotating the proximal phalanx 45° about the z-axis.

Table 6.
A list of the boundary conditions used in ABAQUS. U1, U2 and U3 specify movements along Table 1. UR2 and UR3 specify rotation about the x, y and z axes, respectively.
4.4. Analysis
The cross-sectional area of a flexor tendon mid-section can range from 8.36 to 14.44 mm2 [51,52] for an index finger. For this simplified model, the assumption made was that the FDP, FDS and EDC all have an initial average circular cross-sectional area, A, taken from the literature [53] (Table 7).

Table 7.
The initial values used for initial cross-sectional area, initial length and Young’s modulus used in Equations (1)–(7).
Assuming homogenous material properties, uniform stiffness k for collagen can also be adopted along the tendon length [53]. For convenience, the mean slack length of the tendon will equal the mean initial tendon length L0. Equations (1)–(3) have been adapted from Freij et al. [54], Equation (4) from Vigouroux et al. [22] and Equations (5)–(7) from Young et al. [53] to calculate the actual cross-sectional area a, true stress σ and stiffness after each position. Where λ is the stretch ratio, L is the actual length and F is force given in ABAQUS.
The tension, T, in the tendons can be estimated by relating force on the tendon to its elongation.
The tension, T, in the tendons can be estimated by relating force on the tendon to its elongation through displacement using a quadratic function (Equation (4)).
Stiffness k is estimated using Equation (5), where E is the Young’s modulus of the tendon, which has previously been reported as being approximately 1.5 MPa [24], where ε is strain and ΔL is extension.
Equations (1)–(7) were used to calculate tension in the tendon, stress and strain. The displacement and force of the connector element in the model, between the two nodes either side of the MCP joint, have been used when evaluating the equations during movements A, B and C (Table 6) for the healthy FDP tendon and the mildly and severely affected FDS tendon. Additionally, for movement A, analysis included the EDC healthy, mildly and severely affected tendons. Table 7 contains the initial values used for Equations (1)–(7).
4.5. Mesh and Solution
The analysis was performed using ABAQUS. A dynamic, explicit solution type was used with one to two steps. A time period of one second was applied for each step with boundary conditions using a tabular amplitude. The geometric complexity of the bones favoured the use of an automatic tetrahedral mesh, deemed acceptable as the bones were not expected to undergo large deformation. Mesh convergence consisted of increasing the node seed size in equal steps and identifying the size at which it did not alter predictions of tension in tendons. Mesh convergence occurred at a seed-size of 4.5, which resulted in a mesh with 5123 elements (solution time: ~14.2 min). It should be noted that only the bone structures are actually meshed and, given the loading involved, these undergo deformation which is negligible (in essence, acting as rigid bodies); this is why mesh convergence has occurred using a low number of elements.
5. Conclusions
This study demonstrates the effects that trigger finger has on the extensor mechanism, and it predicts tendon loads as caused by trigger finger as compared to a “healthy” control case. There appears to be a substantial increase in tension during hyper-extension during trigger finger. It is hoped that the model presented could be used as a framework to enable more advanced treatment methods to be developed than currently available (e.g., prosthetic devices for rehabilitation).
Author Contributions
Conceptualization, D.M.E. and C.G.B.; methodology, H.I.R. and D.M.E.; software, H.I.R.; validation, H.I.R.; formal analysis, H.I.R.; investigation, H.I.R. and D.M.E.; data curation, H.I.R.; writing—original draft preparation, H.I.R. and D.M.E.; writing—review and editing, D.M.E., H.I.R. and C.G.B.; supervision, D.M.E. All authors have read and agreed to the published version of the manuscript.
Funding
This research received no external funding.
Conflicts of Interest
The authors declare no conflict of interest.
References
- Yun, Y.; Agarwal, P.; Deshpande, A.D. Accurate, robust, and real-time pose estimation of finger. J. Dyn. Syst. Meas. Control 2015, 137, 034505. [Google Scholar]
- Hu, D.; Ren, L.; Howard, D.; Zong, C. Biomechanical analysis of force distribution in human finger extensor mechanisms. BioMed. Res. Int. 2014, 2014, 743460. [Google Scholar] [CrossRef] [PubMed]
- Langer, D.; Maeir, A.; Michailevich, M.; Applebaum, Y.; Luria, S. Using the international classification of functioning to examine the impact of trigger finger. Disabil. Rehabil. 2016, 38, 2530–2537. [Google Scholar] [PubMed]
- Langer, D.; Maeir, A.; Michailevich, M.; Luria, S. Evaluating hand function in clients with trigger finger. Occup. Ther. Int. 2017, 2017, 9539206. [Google Scholar] [CrossRef]
- Lindner-Tons, S.; Ingell, K. An alternative splint design for trigger finger. J. Hand Ther. 1998, 11, 206–208. [Google Scholar] [CrossRef]
- Sbernardori, M.C.; Bandiera, P. Histopathology of the A1 pulley in adult trigger fingers. J. Hand Surg. 2007, 32, 556–559. [Google Scholar]
- Miyamoto, H.; Miura, T.; Isayama, H.; Masuzaki, R.; Koike, K.; Ohe, T. Stiffness of the first annular pulley in normal and trigger fingers. J. Hand Surg. 2011, 36, 1486–1491. [Google Scholar] [CrossRef]
- Doughlas, H.C.L.; Chin, D.H.; Jones, N.F. Repetitive motion hand disorders. J. Calif. Dent. Assoc. 2002, 30, 149–160. [Google Scholar]
- Makkouk, A.H.; Oetgen, M.E.; Swigart, C.R.; Dodds, S.D. Trigger finger: Etiology, evaluation, and treatment. Curr. Rev. Musculoskel Med. 2008, 1, 92–96. [Google Scholar]
- Colbourn, J.; Heath, N.; Manary, S.; Pacifico, D. Effectiveness of splinting for the treatment of trigger finger. J. Hand Ther. 2008, 21, 336–343. [Google Scholar] [CrossRef]
- Best, T.J. Post-traumatic stenosing flexor tenosynovitis. Can. J. Plast. Surg. 2003, 11, 143–144. [Google Scholar] [CrossRef] [PubMed]
- The British Society for Surgery of the Hand. Trigger Finger/Thumb. Available online: https://www.bssh.ac.uk/patients/conditions/18/trigger_fingerthumb (accessed on 10 March 2019).
- NHS Wales. Trigger Finger. Available online: https://www.nhsdirect.wales.nhs.uk/encyclopaedia/t/article/triggerfinger (accessed on 18 April 2019).
- NHS. Trigger Finger. Available online: https://www.nhs.uk/conditions/trigger-finger/ (accessed on 5 April 2019).
- Li, Z.M.; Zatsiorsky, V.M.; Latash, M.L. The effect of finger extensor mechanism on the flexor force during isometric tasks. J. Biomech. 2001, 34, 1097–1102. [Google Scholar] [CrossRef]
- Wilkinson, D.D.; Weghe, M.V.; Matsuoka, Y. An extensor mechanism for an anatomical robotic hand. In Proceedings of the International Conference on Robotics & Automation, Taipei, Taiwan, 14–19 September 2003; Volume 1, p. 243. [Google Scholar]
- Hirt, B.; Seyhan, H.; Wagner, M. Hand and Wrist Anatomy and Biomechanics: A Comprehensive Guide; Thieme Medical Publishers, Incorporated: New York, NY, USA, 2016. [Google Scholar]
- Amis, A. The mechanical properties of finger flexor tendons and development of stronger tendon suturing techniques. In Advances in the Biomechanics of the Hand and Wrist; Schuind, F., Garcia-Elias, M., An, K.N., Eds.; Springer: Boston, MA, USA, 1994; p. 41. [Google Scholar]
- Chen, P.; Lin, C.; Jou, I.M.; Chieh, H.F.; Su, F.C.; Kuo, L.C. One Digit Interruption: The altered force patterns during functionally cylindrical grasping tasks in patients with trigger digits. PLoS ONE 2013, 8, e83632. [Google Scholar] [CrossRef] [PubMed]
- Tung, W.L.; Kuo, L.C.; Lai, K.Y.; Jou, I.M.; Sun, Y.N.; Su, F.C. Quantitative evidence of kinematics and functional differences in different graded trigger fingers. Clin. Biomech. 2010, 25, 535–540. [Google Scholar] [CrossRef] [PubMed]
- Langer, D.; Luria, S.; Michailevich, M.; Maeir, A. Long-term functional outcome of trigger finger. J. Disabil. Rehabil. 2016, 40, 90–95. [Google Scholar]
- Vigouroux, L.; Quaine, F.; Labarre-Vila, A.; Moutet, F. Estimation of finger muscle tendon tensions and pulley forces during specific sport-climbing grip techniques. J. Biomech. 2006, 39, 2583–2592. [Google Scholar] [CrossRef]
- Lu, S.; Kuo, L.; Jou, I. Quantifying catch-and-release: The extensor tendon force needed to overcome the catching flexors in trigger fingers. J. Orthop. Res. 2013, 31, 1130–1135. [Google Scholar] [CrossRef]
- Weber, J.F.; Agur, A.M.R.; Fattah, A.Y.; Gordon, K.D.; Oliver, M.L. Tensile mechanical properties of human forearm tendons. J. Hand Surg. (Eur. Vol.) 2015, 40, 711–719. [Google Scholar] [CrossRef]
- Yang, T.; Lu, S.; Lin, W.; Zhao, K.; Zhao, C.; An, K.N.; Jou, I.M.; Lee, P.Y.; Kuo, L.C.; Su, F.C. Assessing finger joint biomechanics by applying equal force to flexor tendons in vitro using a novel simultaneous approach. PLoS ONE 2016, 11, e0160301. [Google Scholar]
- Tanaka, T.; Amadio, P.C.; Zhao, C.; Zobits, M.E.; An, K.N. Flexor digitorum profundus tendon tension during finger manipulation. J. Hand Ther. 2005, 18, 330–338. [Google Scholar] [CrossRef]
- Kursa, K.; Lattanza, L.; Diao, E.; Rempel, D. In vivo flexor tendon forces increase with finger and wrist flexion during active finger flexion and extension. Orthop. Res. 2006, 24, 763–769. [Google Scholar] [CrossRef] [PubMed]
- Edsfeldt, S.; Rempel, D.; Kursa, K.; Diao, E.; Lattanza, L. In vivo flexor tendon forces generated during different rehabilitation exercises. J. Hand Surg. 2015, 40, 705–710. [Google Scholar] [CrossRef]
- Barberio, C.G.; Chaudhry, T.; Power, D.M.; Tan, S.; Lawless, B.M.; Espino, D.M.; Wilton, J.C. Towards viscoelastic characterisation of the human ulnar nerve: An early assessment using embalmed cadavers. Med. Eng. Phys. 2019, 64, 15–22. [Google Scholar] [PubMed]
- Barberio, C.; Chaudhry, T.; Power, D.; Lawless, B.M.; Espino, D.M.; Tan, S.; Wilton, J.C. The effect of shoulder abduction and medial epicondylectomy on ulnar nerve strain. J. Musculoskelet Surg. Res. 2019, 3, 134–140. [Google Scholar] [CrossRef]
- Burton, H.E.; Williams, R.L.; Espino, D.M. Effects of freezing, fixation and dehydration on surface roughness properties of porcine left anterior descending coronary arteries. Micron 2017, 101, 78–86. [Google Scholar] [CrossRef] [PubMed]
- Burton, H.E.; Freij, J.M.; Espino, D.M. Dynamic viscoelasticity and surface properties of porcine left anterior descending coronary arteries. Cardiovasc. Eng. Technol. 2017, 8, 41–56. [Google Scholar] [CrossRef]
- Burton, H.E.; Cullinan, R.; Jiang, K.; Espino, D.M. Multiscale three-dimensional surface reconstruction and surface roughness of porcine left anterior descending coronary arteries. R. Soc. Open Sci. 2019, 6, 190915. [Google Scholar] [CrossRef]
- Constable, M.; Burton, H.E.; Lawless, B.M.; Gramigna, V.; Buchan, K.G.; Espino, D.M. Effect of glutaraldehyde based cross-linking on the viscoelasticity of mitral valve basal chordae tendineae. BioMed. Eng. Online 2018, 17, 93. [Google Scholar]
- Öhman, C.; Espino, D.M.; Heinmann, T.; Baleani, M.; Delingette, H.; Viceconti, M. Subject-specific knee joint model: Design of an experiment to validate a multi-body finite element model. Vis. Comput. 2011, 27, 153–159. [Google Scholar] [CrossRef]
- Lavecchia, C.E.; Espino, D.M.; Moerman, K.M.; Tse, K.M.; Robinson, D.; Lee, P.V.S.; Shepherd, D.E.T. Lumbar model generator: A tool for the automated generation of a parametric scalable model of the lumbar spine. J. R. Soc. Interface 2018, 15, 20170829. [Google Scholar] [CrossRef]
- Bahraseman, H.G.; Hassani, K.; Navidbakhsh, M.; Espino, D.M.; Sani, Z.A.; Fatouraee, N. Effect of exercise on blood flow through the aortic valve: A combined clinical and numerical study. Comput. Methods Biomech. Biomed. Eng. 2014, 17, 1821–1834. [Google Scholar] [CrossRef] [PubMed]
- Jewkes, R.; Burton, H.E.; Espino, D.M. Towards additive manufacture of functional, spline-based morphometric models of healthy and diseased coronary arteries: In vitro proof-of-concept using a porcine template. J. Funct. Biomater. 2018, 9, 15. [Google Scholar] [CrossRef] [PubMed]
- Sterling, S. Human Skeleton Used for a Parametric Gait Study. Available online: https://grabcad.com/library/human-skeleton-used-for-a-parametric-gait-study-1 (accessed on 10 November 2018).
- Jasuja, O.P.; Singh, G. Estimation of stature from hand and phalange length. J. indian Acad. Forensic Med. 2004, 26, 100–106. [Google Scholar]
- Pal, S. Mechanical properties of biological materials. In Design of Artificial Human Joints & Organs; Pal, S., Ed.; Springer: Boston, MA, USA, 2014; p. 23. [Google Scholar]
- Hooley, C.J.; McCrum, N.G.; Cohen, R.E. The viscoelastic deformation of tendon. J. Biomech. 1980, 13, 521–528. [Google Scholar] [CrossRef]
- Pradas, M.M.; Calleia, R.D. Nonlinear viscolelastic behaviour of the flexor tendon of the human hand. J. Biomech. 1990, 23, 773–781. [Google Scholar] [CrossRef]
- Proske, U.; Morgan, D.L. Tendon stiffness: Methods of measurement and significance for the control of movement. A review. J. Biomech. 1987, 20, 75–82. [Google Scholar] [CrossRef]
- Woo, S.L.; Johnson, G.A.; Smith, B.A. Mathematical modelling of ligaments and tendons. J. Biomech. Eng. 1993, 115, 468–473. [Google Scholar]
- Pring, D.J.; Amis, A.A.; Coombs, R.R. The mechanical properties of human flexor tendons in relation to artificial tendons. J. Hand Surg. Br. Eur. Vol. 1985, 10, 331–336. [Google Scholar] [CrossRef]
- Brook, N.; Mizrahi, J.; Shoham, M.; Daya, J. A biomechanical model of index finger dynamics. Med. Eng. Phys. 1995, 17, 54–63. [Google Scholar]
- Fok, K.S.; Chou, S.M. Development of a finger biomechanical model and its considerations. J. Biomech. 2010, 43, 701–713. [Google Scholar] [CrossRef]
- An, K.N.; Chao, E.Y.; Cooney, W.P.; Linscheid, R.L. Normative model of human hand for biomechanical analysis. J. Biomech. 1979, 12, 775–788. [Google Scholar] [CrossRef]
- Williams, M.; Temperley, D.; Murali, R. Radiology of the hand. Orthop. Trauma 2019, 33, 45–52. [Google Scholar] [CrossRef]
- Ward, S.R.; Loren, G.J.; Lundberg, S.; Lieber, R.L. High stiffness of human digital flexor tendons is suited for precise finger positional control. Neurophysiol 2006, 96, 2815–2818. [Google Scholar] [CrossRef]
- Boyer, M.I.; Meunier, M.D.; Lescheid, J.; Burns, M.E.; Gelberman, R.H.; Silva, M.J. The influence of cross-sectional area on the tensile properties of flexor tendons. J. Hand Surg. 2001, 26, 828–832. [Google Scholar] [CrossRef] [PubMed]
- Young, S.R.; Gardiner, B.; Mehdizadeh, A.; Rubenson, J.; Umberger, B.; Smith, D.W. Adaptive remodeling of achilles tendon: A multi-scale computational model. PLoS Comput. Biol. 2016, 12, e1005106. [Google Scholar] [CrossRef]
- Freij, J.M.; Burton, H.E.; Espino, D.M. Objective uniaxial identification of transition points in non-linear materials: Sample application to porcine coronary arteries and the dependency of their pre- and post-transitional moduli with position. Cardiovasc. Eng. Technol. 2019, 10, 61–68. [Google Scholar] [CrossRef]
© 2020 by the authors. Licensee MDPI, Basel, Switzerland. This article is an open access article distributed under the terms and conditions of the Creative Commons Attribution (CC BY) license (http://creativecommons.org/licenses/by/4.0/).

