Article

The Effects of Elevated Temperatures on the Reproductive Biology of a Mediterranean Coral, Oculina patagonica

1
Department of Marine Biology, The Leon H. Charney School of Marine Sciences, University of Haifa, Haifa 3103301, Israel
2
Centre for Genomic Regulation (CRG), Barcelona Institute of Science and Technology (BIST), 08028 Barcelona, Spain
3
Marine Mariculture Department, Ramot-Yam High School, Meevot-Yam Youth Village, Michmoret 4029600, Israel
4
Morris Kahn Marine Research Station, The Leon H. Charney School of Marine Sciences, University of Haifa, Haifa 3780400, Israel
*
Author to whom correspondence should be addressed.
These authors contributed equally to this work.
Oceans 2024, 5(4), 758-769; https://doi.org/10.3390/oceans5040043
Submission received: 21 May 2024 / Revised: 27 August 2024 / Accepted: 30 September 2024 / Published: 9 October 2024

Abstract

:
Global climate change is profoundly impacting coral ecosystems. Rising sea surface temperatures, in particular, disrupt coral reproductive synchrony, cause bleaching, and mortality. Oculina patagonica, a temperate scleractinian coral abundant across the Mediterranean Sea, can grow at a temperature range of 10–31 °C. Studies conducted three decades ago documented this species bleaching during the summer months, the same time as its gonads mature. However, the Eastern Mediterranean Sea is experiencing some of the fastest-warming sea surface temperatures worldwide. This study repeated the year-round in situ assessment of the reproductive cycle and gonad development and correlation to summer bleaching. In addition, thermal performance of the holobiont was assessed in an ex situ thermal stress experiment. In situ monitoring revealed no temporal changes in gonad development compared to previous studies, despite sea surface warming and concurrent bleaching. Experimental thermal performance curves indicated that photosynthetic rate peaked at 23 °C, bleached coral area was significant at 29 °C, and peaked at 34 °C. With local sea surface temperature reaching 31 °C, O. patagonica is exposed beyond its bleaching threshold during the summer months in situ. Despite this, O. patagonica maintains gonad development and physiologically recovers at the end of summer demonstrating resilience to current warming trends.

1. Introduction

Stony corals are the dominant reef-building organisms. They inhabit tropical and subtropical, typically oligotrophic, seas [1,2]. The ecological success of stony corals is due to their relationship with endosymbiotic dinoflagellate algae from the family Symbiodiniaceae [3], which can supply over 90% of the coral host’s daily carbon requirements through the translocation of metabolites [4]. Due to current global warming trends, Marine Heat Waves (MHWs) have become increasingly frequent, exposing corals to temperatures that exceed their thermal tolerance. MHWs can trigger coral bleaching and potentially lead to coral death [5,6,7,8,9,10,11]. Consequently, coral mass mortality events have become more frequent and severe over the past few decades [6]. In addition, prolonged elevated temperatures can lead to asynchronistic or stunted gonad development in a variety of coral species and consequently reduce sexual reproductive capacity [1,12,13].
More so than tropical reefs, temperate reefs typically have strong seasonal fluctuation in sea surface temperature [2,14]. In the Mediterranean Sea for example, the annual cycle is characterized by two seasonal extremes, the winter and summer, with annual temperatures ranging between 12 and 24 °C in the northwest and 16 and 31 °C in the southeast [10,15,16,17,18,19]. Temperate corals often have a facultative relationship with their photosymbionts. They combine photosynthates with heterotrophic feeding strategies, allowing them to thrive in diminished light conditions and a wide range of water temperatures [17].
The Mediterranean coral O. patagonica is an example of such a species. O. patagonica was first reported in the Mediterranean Sea in 1966 in the Gulf of Genoa, Italy [20]. It was believed to have invaded the Mediterranean from the South Atlantic via the Straits of Gibraltar. However, multi-locus [21] genetic analysis showed that the Mediterranean O. patagonica population is genetically distinct from the Atlantic population and estimated the divergence time to be ~5.4 million years ago. This led to the conclusion that O. patagonica is a native Mediterranean species. It is likely that it was only detected following population expansion due to environmental changes. The relatively fast expansion is suggested to relate to its relatively early sexual maturity of 1–2 years, high growth rates of 1–2 cm per year, and high tolerance to turbidity, pollution, and organic matter [15,16,18,21,22]. As a facultative symbiotic coral, it exhibits high plasticity in its symbiont density, even within a single colony. The same colony may have white patches with very low to no photosymbionts present, while other areas can be seen as dark brown with a high density of photosymbionts (Supplementary Figure S1) [23]. Moreover, along the Levant coast, O. patagonica exhibits a seasonal bleaching phenomenon, in which, during the summer months (July to September) when temperatures rise above 29 °C, the coral undergoes a substantial loss of its algal symbionts before recovering them in the following months when temperatures decline [15,16]. However, whether experimental high temperatures induce bleaching in O. patagonica, the threshold at which bleaching occurs, and time to recovery have never been reported. Given its remarkable ability to withstand a broad spectrum of temperatures, undergo seasonal bleaching, and thrive in a wide range of light intensities [24], O. patagonica serves as a fascinating model for investigating thermal stress and its impact on the coral host, the algae symbionts, and their symbiotic relationship.
O. patagonica is a gonochoric broadcast spawner, meaning that male and female colonies release their gametes into the water column, where fertilization occurs [16,25]. In the Eastern Mediterranean, this once-annual event occurs over two nights following the full moon of September [16]. Fine et al. (2001) reported that during 1994–1999, female gonads of O. patagonica were first observed in May and male gonads in July. Both reached maturity in late August to early September. Thus sexual maturity and the annual summer bleaching seen in this species coincide [16].
Since the mid-1980s, SST of the Mediterranean Sea has increased by an average of ~0.04 °C/year and is expected to increase significantly in the future, with estimates of a 0.12 ± 0.07 °C rise per year in the Eastern Mediterranean [26] putting corals at an increased risk of temperature-induced bleaching. Reproductive success is essential for species survival; thus, the potential impact of bleaching on coral reproduction has profound long-term implications, especially if bleaching events are repeated annually. This study was designed to repeat the year-round assessment of reproductive phenology conducted three decades ago to determine if any temporal changes have occurred and how the reproductive cycle currently correlates with bleaching in situ. In addition, an ex situ thermal stress experiment was conducted to determine the thermal bleaching threshold of O. patagonica.

2. Materials and Methods

2.1. Sample Collection

Samples of O. patagonica were collected from the Israeli Mediterranean Sea at Michmoret (32.24049 N, 34.51530 E, Figure 1A,C). Fragments of five randomly chosen colonies ranging in size from 1 cm2 to 2 cm2 of O. patagonica were sampled monthly (different colonies each month) from 2 to 3 m depth, at distances of between 2 and 5 m from each other from January 2021 to November 2021 using a hammer and chisel to remove them from the substrate. At this site, O. patagonica typically grows in small caves, crevasses, and overhangs which reduce the average PAR level to ~20–100 µmol m−2 s−1. Each sample was divided into two fragments. One fragment was fixed with formaldehyde for histology sections to identify and monitor gonadal development. The second fragment was used for physiology parameters as described below (Supplementary Figure S2). Long-term measurements of the average, minimum, and maximum temperature of each month at 0–30 m were conducted at the same location by the Israeli School of Marine Sciences in Michmoret. (Data available: RECO_Database—Google Sheets (Figure 1B). Within one hour post-collection, the photochemistry of the algal symbionts of each colony was accessed using a Maxi Imaging-PAM (Walz, Germany) [27]. Live coral samples were first dark-acclimated for 30 min before measurements. A light curve with 13 incremental steps between 0 and 701 µmol photons m−2 s−1 was conducted [28]. Data were used to calculate the maximal quantum yield (Fv/Fm) of photosystem II (PSII), initial slope of the light response curve (α), relative maximal electron transport rate (rETRmax), and minimum saturating irradiance (Ek) [28]. After the measurements, all fragments were stored at −80 °C pending further physiological analyses.

2.2. Physiology

The tissue of each coral fragment was removed using an airbrush and suspended in 3 mL of phosphate buffer saline (PBS) solution inside a sterile ziplock bag. Coral skeletons were used to calculate the surface area of the coral fragment for normalization. The tissue was transferred into 15 mL centrifuge tubes and electrically homogenized for 20 s. The homogenate was centrifuged at 5000× g for 5 min at 4 °C to separate the debris and the symbiont cells from the coral host tissue. The protein concentration of the coral host was determined using the fluorometric BCA protein kit (Pierce BCA, Thermo Fisher Scientific, Waltham, MA, USA) following the manufacturer’s protocol. A PerkinElmer (2300 EnSpire R, Waltham, MA, USA) plate reader was used to determine the total protein concentration with a 540 nm wavelength emission.
The density of symbiont cells in the homogenate was determined by placing a sample on a hemocytometer and imaged with a Nikon Eclipse (Nikon Eclipse Ti–S Inverted Microscope System) microscope whilst exciting the chlorophyll autofluorescence with blue light. For each sample, five replicates of 1 mm2 each were counted. Each replica was photographed in fluorescent light using 440 nm emission to identify chlorophyll. The color threshold of images was adjusted to isolate algal cells using ImageJ2 version 2.9.0 software and the number of cells in five replicate corner squares was counted using the ‘Analyse Particles’ function [29]. To measure chlorophyll-a concentrations, a 1 mL tissue homogenate pellet was resuspended with 1 mL of 90% cold acetone and incubated overnight at 4 °C. A NanoDrop (Thermo-Fisher, Waltham, MA, USA) was used for reading the spectrophotometric measurements at wavelengths of 630, 647, 664, and 691 nm, and the light absorbance results were used to calculate the chlorophyll-a concentration following a standardized equation [30].

2.3. Gametogenesis

Gametogenesis was assessed using histological sections of corals throughout the year. Following collection, sampled coral fragments were immediately placed in 15 mL tubes with 10 mL filtered sea water and 2 mL of 1 M MgCl2 for 15 min to prevent contraction of the polyps. The samples were fixed in a solution of 4% formaldehyde in seawater for 24 h, rinsed in PBS solution, and preserved in 70% ethanol. Decalcification of the coral skeleton was conducted using a solution of 1:1 formic acid (50% in DDW) and sodium citrate (20% in DDW) [31]. Following decalcification, the tissue was rinsed in PBS. Next, the tissue was dehydrated in graded ethanol solutions, cleaned through a series of graded butanol, and then embedded in paraffin. The paraffin block was sectioned and mounted on glass slides. Following deparaffinization, the cross-sections (10 µm thick) were stained with hematoxylin and eosin and analyzed under a light microscope (Nikon ECLIPSE Ti2 inverted microscope, Melville, NY, USA) to determine the number and size of gonads per polyp. Each colony was analyzed using 5 cross-sections to ensure comprehensive coverage. To prevent redundant counts of the same polyps, cross-sections were selected at intervals of 10 (approximately 100 µm). Polyps were individually counted, and within each polyp, the number of oocytes and sperm sacs was recorded. Additionally oocyte diameter was measured using the Nikon Nis-Elements software, version 5.02 (Nikon Instruments, Melville, NY, USA).

2.4. Thermal Stress Experiment

Five different O. patagonica colonies were collected from a depth of 5 m near the coast of Michmoret (32.24049 N, 34.51530 E) in September 2022, and kept in a water table with continuously flowing seawater at a light intensity of 100 µmol photons m−2 s−1 (as was measured at the collection site) for three months. The temperature of the water table was set to match that of the collection site and varied between 23 and 28 °C. At the beginning of December 2022, each colony was fragmented into three individual ramet nubbins with an average size of 5 cm2 (for metabolic measurements), and ten smaller fragments with an average size of 1 cm2 (for physiological analyses) (Supplementary Figure S1). Coral nubbins were cleaned by removing all epiphytes (other animals and algae) from the coral skeletons. After fragmentation, all nubbins were acclimated for an additional two weeks within the same water table under the same aforementioned light and temperature conditions. Two days before the experiment, nubbins were transferred into a water table with a 12:12 light-dark cycle at 23 °C and a light intensity of 100 µmol photons m−2 s−1. Water was recirculated and controlled for temperature using a thermostat system (STC-1000 Temperature controller, covvy-06-061-072) with an accuracy of ±0.2 °C. Throughout the experiment, water temperatures and light intensities were monitored using a logger (HOBO Pendant MX Temperature/Light Data Logger MX2202, Lakeville, MN, USA) and a full spectrum underwater quantum meter for PAR measurements (Quantum Flux, apogee instruments, model MQ-500, London, UK), respectively.
Metabolic responses of the coral nubbins were measured at eight different water temperatures (21 °C, 23 °C, 25 °C, 27 °C, 29 °C, 31 °C, 32 °C, 34 °C). The water temperature was raised by two degrees every 48 h; 24 h after temperature elevation, photosynthesis rates were measured by generating photosynthesis vs. irradiance (PI) curves for each. For conducting the measurements, fragments were placed in individual acrylic respiration chambers (Supplementary Figure S3; 620 mL) with a magnetic stir bar and the ambient seawater, with individual fiber optic oxygen and temperature probes (PyroScience Optical Oxygen & Temp Meter FireSting-O2, FSO2-C4, Aachen, Germany).
Data were collected simultaneously using two supported devices of Optical Oxygen & Temp Meter FireSting-O2, 4 Channels each, and the Pyroscience software V1.5.3. All calibrations were conducted according to the manufacturer’s manual.
Oxygen concentrations were measured first in the dark (after 30 min of dark acclimation) to calculate respiration rates and then followed by measurements in six different light intensities (20, 40, 80, 160, 250, 320, 360, and 430 µmol photons m−2 s−1), for 15 min in each intensity. Rates of oxygen flux were extracted and gross photosynthesis (GP) was calculated as the absolute values of net photosynthesis plus dark respiration per surface area. The surface area of each fragment was measured using scaled pictures in ImageJ [29].
After measurements, the fragments were returned to the experiment aquarium at the same temperature as was tested. The temperature was raised again 24 h later. A small fragment (~1 cm2) from each colony was collected for additional physiological tests (protein concentration, algae count, chlorophyll concentrations) in each temperature tested. This procedure was repeated for every temperature treatment at the same hour of the day. Different fragments from the same colony were tested in each temperature treatment to minimize the accumulated light stress of the fragments. A subset of 3 nubbins from each of the four colonies was repeatedly photographed to measure the percentage of bleached area during the progression of the experiment using ImageJ [29].

2.5. Statistical Analyses

All data exploration, statistical analyses, and graphics were produced with R Studio. Where relevant, the functions and packages used are denoted in brackets. Data groups were shown to deviate significantly from a normal distribution using the Shapiro–Wilk Test (shapiro.test {stats}). Outliers were defined as values outside the 2.5th and 97.5th percentiles within each group and were removed from all downstream analyses. The non-parametric Kruskal–Wallis test was used to determine statistical significance between groups (kruskal.test {stats}). A p-value of <0.05 was considered statistically significant.
Where statistical significance was found, Dunn’s multiple comparisons test (dunnTest {FSA}) was used to find which data groups differed from one another. An adjusted p-value of <0.05 was considered statistically significant. Where data are presented as boxplots (ggplot {ggplot2}), horizontal black lines within boxes are median values, and box limits represent first and third quartiles. Whiskers represent 1.5 times the interquartile range. Round black points are individual sample data. Different lowercase letters indicate statistically significant differences between treatments (adjusted p < 0.05). Lowercase letters are absent from graphs where there are no statistically significant differences.
In the thermal stress experiment, the bleached area for each colony was normalized to the starting bleached area (before temperature ramping began), i.e., any existing bleached area was taken into account, and colonies were effectively considered 100% unbleached at the start. Thereafter, the Kruskal–Wallis test, followed by Dunn’s multiple comparisons test was conducted and the adjusted p-values were reported.

3. Results

3.1. Seasonal Physiological and Photochemical Patterns in O. patagonica

Symbiont cell density was not significantly statistically different between January and June. However, in June and September, there was a significantly higher density of algae cells per surface area relative to August only. A significant decrease in symbiont density was observed between June and August (Figure 2A, Kruskal–Wallis χ2 = 18.771, df = 8, p = 0.01613). Chlorophyll concentration per area was significantly higher in January, with a significant decrease in the summer months (July and August) (Figure 2B). These observations correspond to the annual bleaching period of O. patagonica in the Eastern Mediterranean Sea. Though there was month-to-month variation in protein concentration per unit area, with protein concentrations highest in June and lowest in the summer, post hoc tests did not reveal significant statistical differences in protein concentration per unit area between months (Figure 2C). There was significant variation in photosynthetic efficiency (Kruskal–Wallis χ2 = 19.221, df = 6, p = 0.003807). Fv/Fm was significantly lower in July (0.37 ± 0.13) and August (0.47 ± 0.09) compared to a mean high of 0.62 ± 0.02 in November (Figure 2D). Relative maximum electron transport rate (rETRMAX) and photosynthetic alpha were both significantly lower in July and October compared to April (Figure 2E,F). No statistically significant changes in EK were observed between any of the sampling points.

3.2. Seasonal Gametogenesis Patterns in O. patagonica

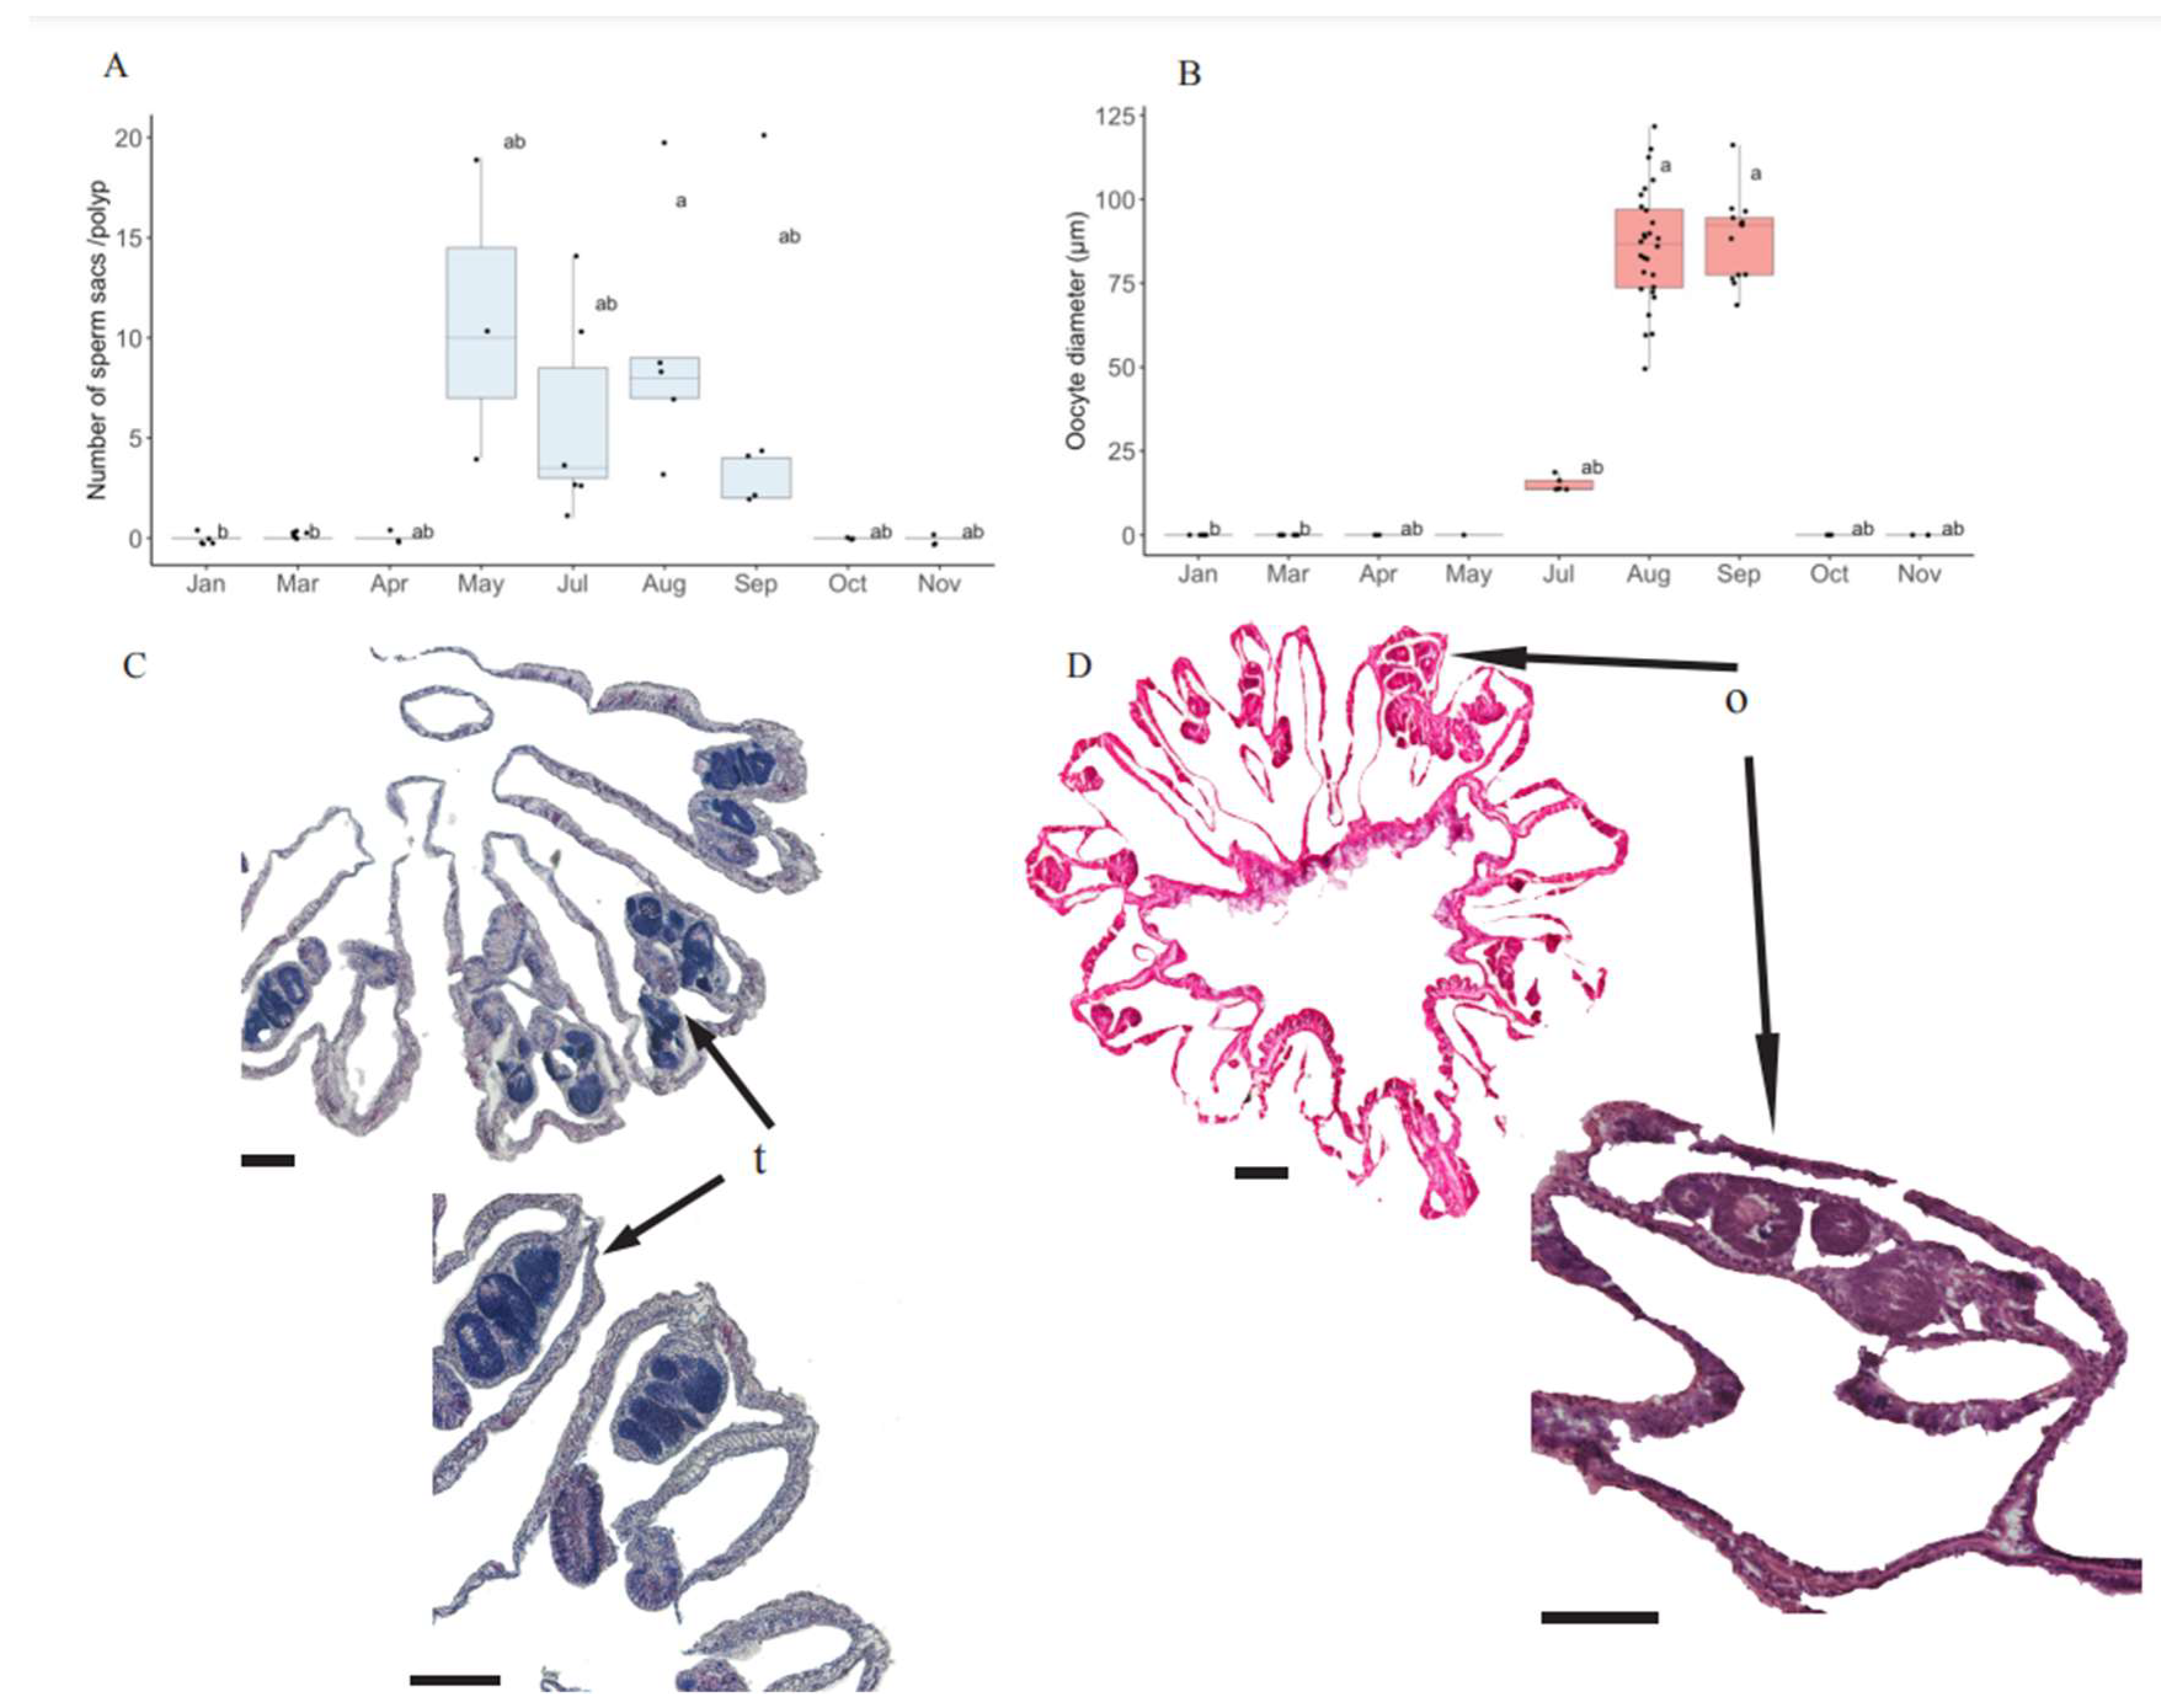
Histological screening revealed that sperm sacs started to develop in May and were present until September. The maximum number of sperm sacs per polyp peaked at 20 in August and September. Oocytes were first visible in July and persisted until September. We were unable to generate sections from the samples collected in June; therefore, the results for this month are missing. Oocyte diameter was greatest in August and September (Kruskal–Wallis chi-squared = 47.5, df = 8, p-value = 1.231 × 10⁻⁷). Maximum mean oocyte diameter was found in September (88.13 ± 12.79, n = 13). From October through April, no sperm sacs or oocytes were observed (Figure 3).

3.3. Thermal Stress Experiment: Physiology and Photosynthetic Activity

Symbiont cell density was greatest at 23 °C (323.06 ± 198.89 cells per cm2) and from 29 °C to 34 °C there was a significant decrease in cell density (Kruskal–Wallis χ2 = 13.118, df = 6, p = 0.04119) with 34 °C (21.59 ± 17.29 cells per cm2) being significantly lower (Dunn’s post hoc test). Chlorophyll-a concentration per algae cell appeared to increase as algal density decreased but these temperature-induced changes in chlorophyll-a concentration were not statistically significant (Supplementary Figure S4B). The highest protein concentration (635.14 ± 241.31 mg cm−2) was observed at 23 °C (Kruskal–Wallis χ2 = 15.782, df = 6, p = 0.01497). As the temperature increased above 23 °C, the protein concentration decreased, reaching a minimum mean at 31 °C (170.83 ± 51.86 mg cm−2).

3.4. Thermal Stress Experiment: Photochemical Performance

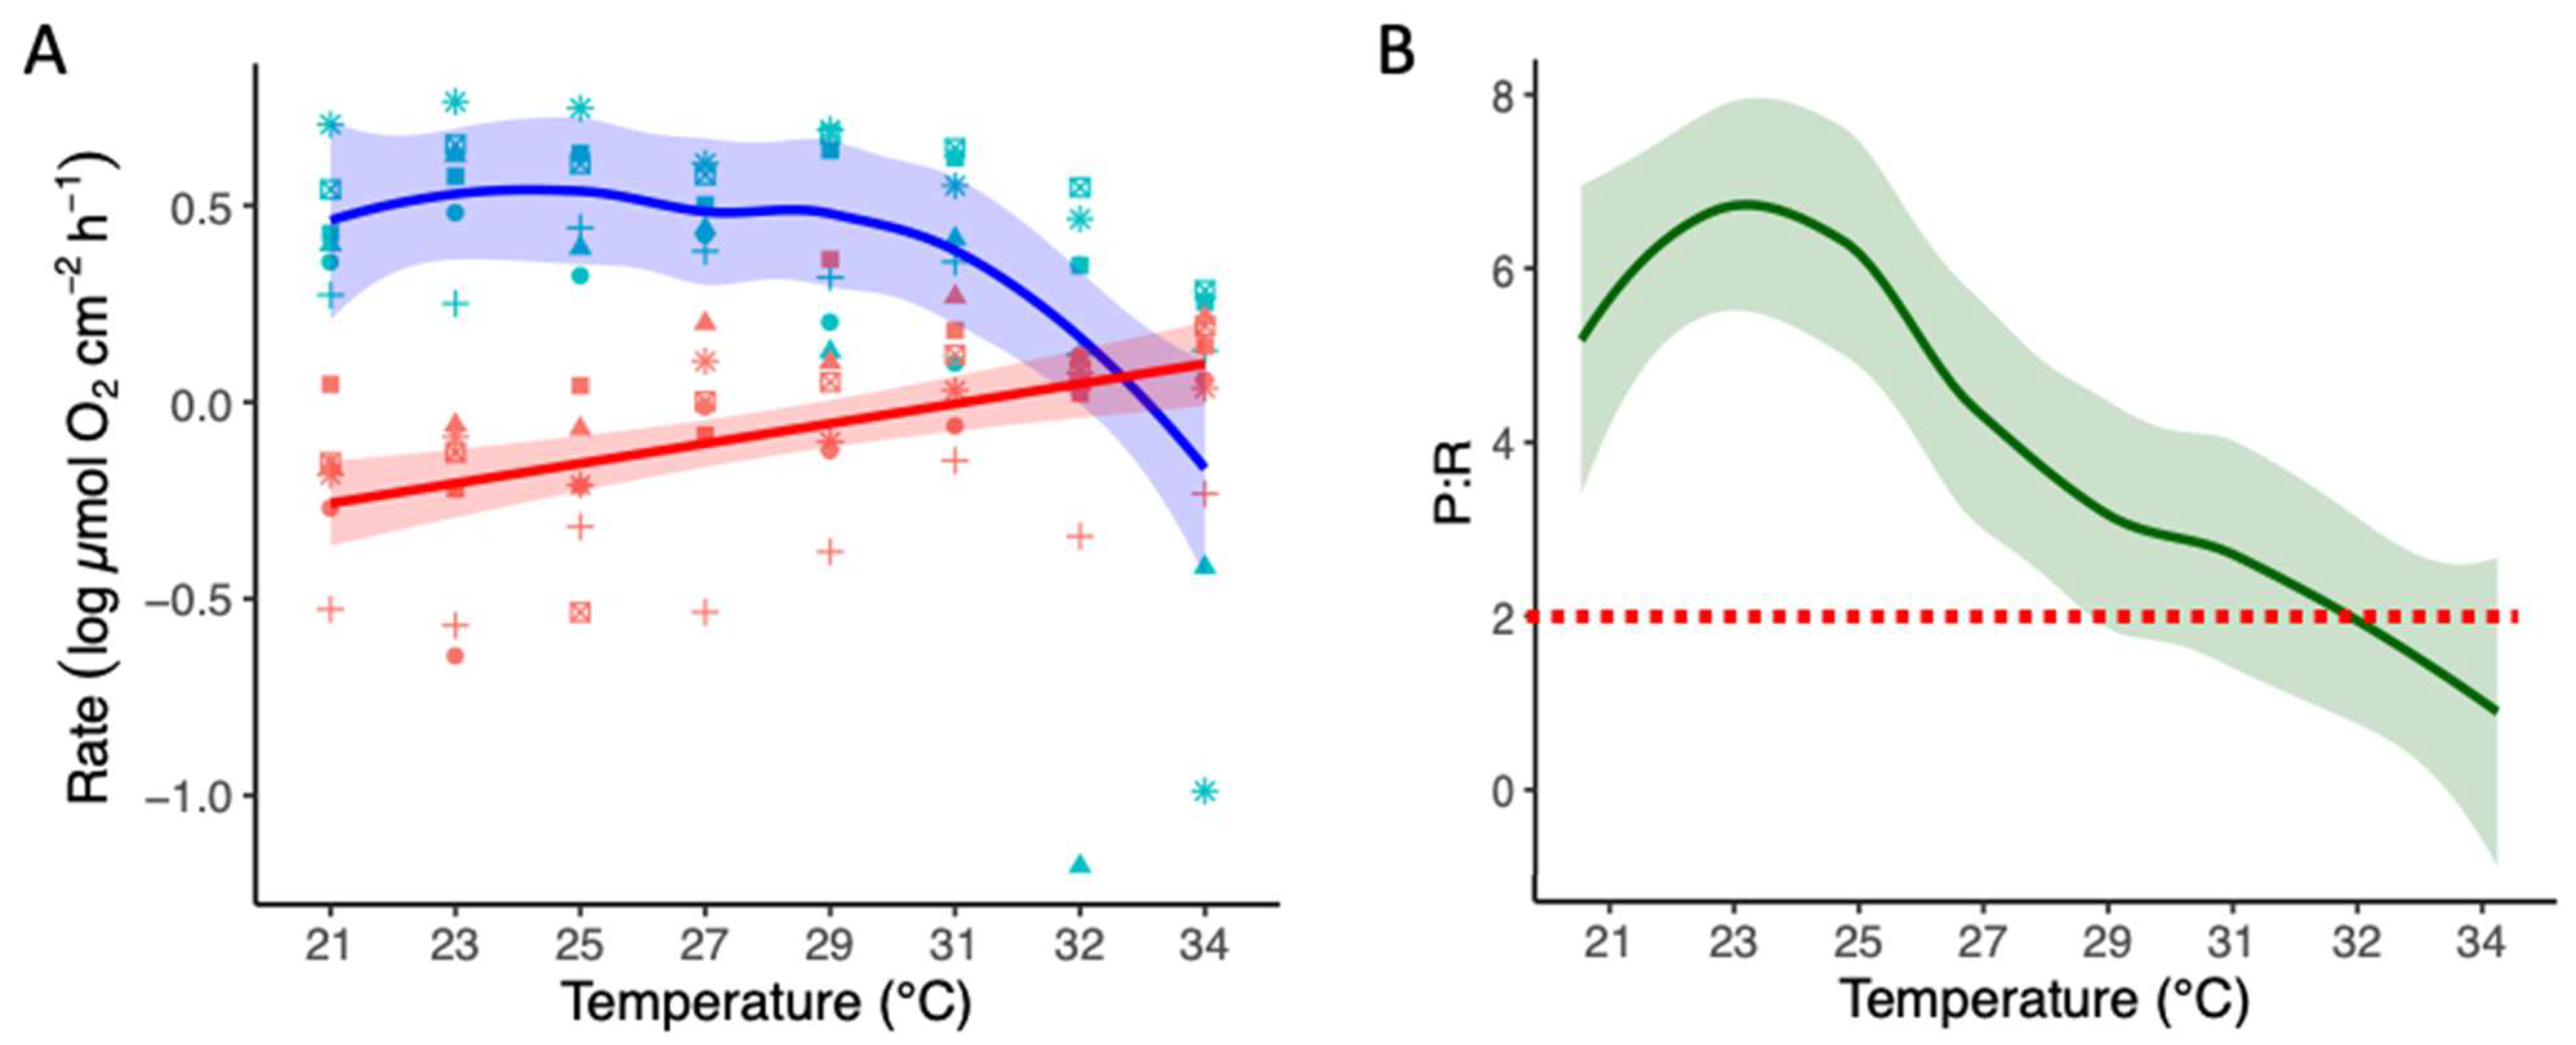
Gross photosynthesis was highest at 23 °C, with a significant decline at 34 °C (Supplementary Figure S4D). The photosynthetic parameters, alpha and Ik, showed no significant differences between the various temperatures (Supplementary Figure S4E,F). Gross photosynthesis rate declined significantly from 29 °C to 34 °C (Figure 4A, Kruskal–Wallis χ2 = 14.466, p = 0.04349). The maximum P:R ratios occurred between 23 °C and 25 °C and after that decreased with increasing temperature. P:R values began to fall below 2 at 29 °C (95% confidence interval) and the mean P:R value was less than 2 at 32 °C (Kruskal–Wallis χ2 = 24, p = 0.001139) (Figure 4B).

3.5. Thermal Stress Experiment: Bleached Area

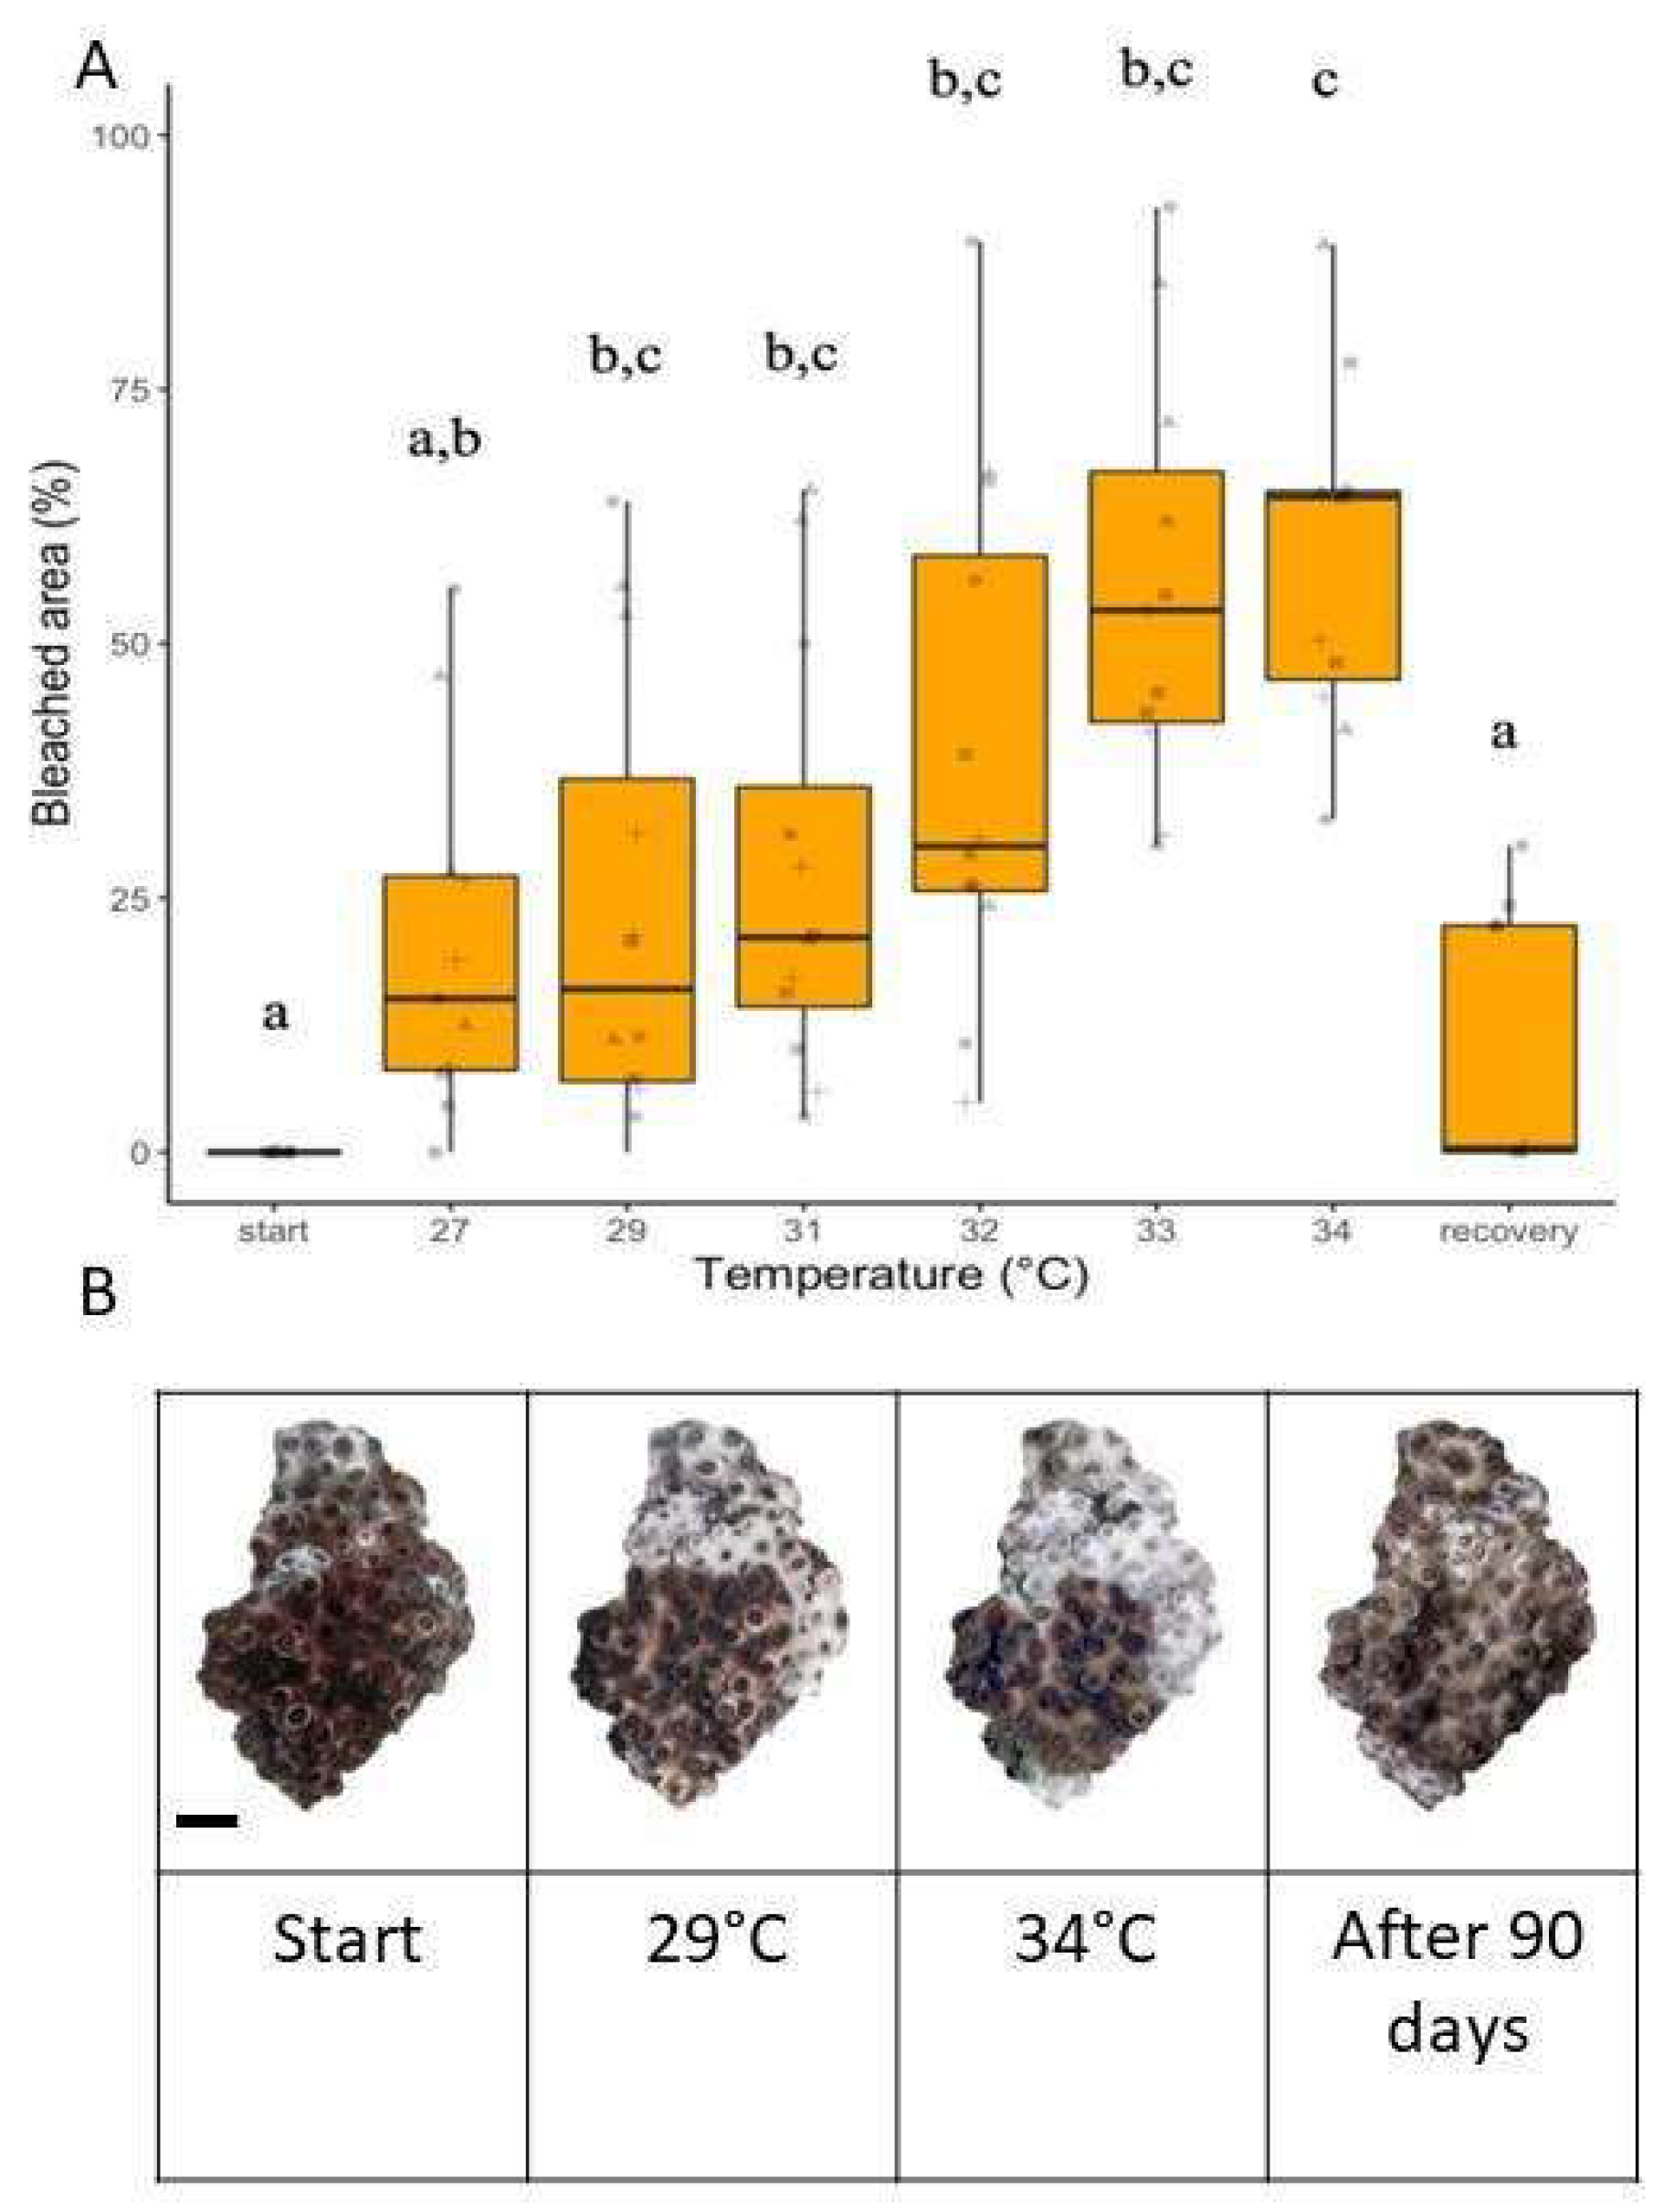
The bleached area significantly increased compared to the starting baseline at every experimental temperature above 29 °C (Figure 5A, Kruskall–Wallis test statistic = 56.436, df = 7, p-value ≤ 0.00001). Mean bleached area peaked at 32 °C (60.85 ± 25.25%) and 34 °C (41.52 ± 16.67%). There was a noticeable difference between the bleaching rate per degree temperature rise between 21 and 31 °C and the bleaching rate between 31 and 34 °C (Figure 5A). The corals underwent bleaching at an average rate of 1.273% new bleached area per 1 °C rise up to 31 °C. From 31 °C to 34 °C, the corals experienced bleaching at a rate of 16.509% new bleached area per 1 °C temperature increase (t-Test: Paired Two Sample for Means. p-value < 0.008911) After ninety days of recovery at 21 °C, all coral colonies had largely recovered so that the bleached area (3.54 ± 18.72%) was not significantly different compared to the start of the experiment (Figure 5A,B).

4. Discussion

This study demonstrated that O. patagonica colonies maintain gonad production in the Eastern Mediterranean Sea despite rapidly increasing sea surface temperatures (SST) over the past three decades and the co-occurrence of annual bleaching as gonads mature [15,16]. During this period, colonies experienced visible bleaching (Supplementary Figure S1) and a quantifiable loss of their algal symbionts (July to September, Figure 2). Despite this, oocyte size peaked in September and was absent in October, indicative of synchronized gamete release (Figure 3). The timing of gamete release matched the timing reported three decades ago; on the night of the full moon in September [16]. Additionally, the size of oocytes observed in this study, throughout the progression of the reproductive season, resembled the sizes reported in previous studies of this species at the same location [16,32]. This finding suggests that O. patagonica continues to successfully reach full maturity before spawning despite local warming. This conflicts with recent reports of asynchronous spawning and reduced oocyte sizes in response to bleaching and heat stress in other scleractinian coral species [33,34,35,36]. However, it is important to note that fertilization and recruitment success of this population remains to be assessed.
Photosynthetic efficiency is often evaluated based on the highest achievable conversion of light energy to chemical energy, measured as the maximum quantum yield, and with electron transport rate (ETR). Our results indicated that during the summer months when temperatures are above 29 °C, the quantum efficiency of the algal symbionts declines (Figure 2D–F). In addition, our survey indicated a significant decrease in algal density, together with a decrease in chlorophyll concentration per surface area in July (Figure 2A,B), i.e., bleaching. This result is similar to previous field observations reporting annual bleaching in the summer months in this species at this site [32,37,38]. During the ex situ heat stress experiment, O. patagonica exhibited a distinctive ‘patchy’ bleaching pattern similar to summer observations in the field. The temperature that initiated bleaching was 29 °C (Figure 5 and Supplementary Figure S4), which is consistent with the aforementioned physiological analyses conducted on coral colonies from the field. Assuming an in situ mean monthly maximum (MMM) temperature of 29 °C, these colonies have a relatively low bleaching threshold (29 °C) following the degree heating weeks model (DHW). In addition, the extent of the bleaching was relatively severe (up to 100% cover).
Thermal performance curves (TPC) describe performance through the ratio between photosynthesis and respiration (P:R). When measured over a temperature gradient, this ratio serves as a proxy for the corals’ thermal threshold as it estimates the extent to which algal production of organic material surpasses the combined consumption by the holobiont (algae and coral) [39]. O. patagonica exhibited the highest P:R ratio, Pmax, and algal density at 23 °C (Figure 4 and Supplementary Figure S4). These results are corroborated by the in situ physiology data, where in June, when water temperatures rise to 23 °C, algal density peaks, along with chlorophyll concentration per surface area (Figure 2A,B). When temperatures exceeded the thermal optimum of 23 °C in the experiment, P:R decreased. For corals to survive long-term, P:R values of 2 or higher are essential [39,40,41]. In this experiment, P:R fell below 2 at 32 °C (Figure 4). Despite a bleaching threshold of ca. 29 °C and P:R below 2, all corals, including those exposed to 34 °C for 48 h (3–5 DHW, 6 days with up to 6 °C above MMM), survived and exhibited recovery to an unbleached state after 90 days at 21 °C (Figure 5). This recovery rate is a noteworthy observation. A longer-term heat stress experiment would be relevant to ascertain this species’ long-term survival threshold.
One of the key questions arising from this study, as well as from previous studies, is why O. patagonica expels its symbionts during the critical period of gonad development, a highly energy-demanding process. Our study shows that when gonads are close to maturity, photosynthesis is inefficient, which may lead to oxidative stress and tissue damage, including the gonads [42,43]. One option to mitigate potential oxidative stress is for O. patagonica to expel its algal symbionts and shift to a more heterotrophic mode. Martinez et al. (2021) [28] reported that O. patagonica colonies, at the same location, are predominantly heterotrophic in the summer and less reliant on photosynthesis compared to other symbiotic corals. Future studies may aim to measure oxidative stress or gene expression patterns in this species during the summer to better understand the causes and mechanisms underlying repeated bleaching observations.
With an increasing number of days exceeding 29 °C and some days surpassing 31 °C at this site (RECO_Database—Google Sheets), this coral may remain bleached for increasingly longer periods in the future. Consequently, its survival will likely depend on its ability to maintain a heterotrophic feeding mode. This study highlights the reproductive resilience and adaptive capacity of O. patagonica, a temperate coral native to the Mediterranean region, despite rising temperatures over the past three decades. This resilience suggests that O. patagonica could potentially offer valuable insights into adaptive mechanisms that other coral species might employ under changing environmental conditions.

Supplementary Materials

The following supporting information can be downloaded at: https://www.mdpi.com/article/10.3390/oceans5040043/s1, Figure S1: Seasonal bleaching Ocullina patagonica at 4–6 m depth during June–August; Figure S2: Experimental design: the experiment from the sea (in situ) throughout the year (top) and the thermal tolerance experiment in the laboratory (in vitro) (bottom); Figure S3: Respiration chambers: An Oculina patagonica fragment is mounted inside one sealed chamber; in the grove below the fragment, there is a space for a magnetic stirrer (left). A respirometer stand with 8 identical sealed chambers is inserted on an underwater stirring table (AIMS) (right); Figure S4: Physiological analyses of O. patagonica thermal stress experiment.

Author Contributions

Conceptualization, T.S. and T.M.; Methodology, T.S., A.E. and S.L.; Formal analysis, T.S., A.E., I.K., S.L. and J.B.; Resources, T.M.; Writing—original draft preparation, T.S., S.L. and T.M.; Writing—review and editing, T.S., S.L., J.B., I.K. and T.M.; Visualization, T.S. and J.B.; Supervision, T.M.; Funding acquisition, T.M. All authors have read and agreed to the published version of the manuscript.

Funding

This research was funded by the Ministry of Innovation, Science and Technology, Israel (Grant # 0002193).

Institutional Review Board Statement

Not applicable.

Informed Consent Statement

Not applicable.

Data Availability Statement

All data needed to evaluate the conclusions of this paper are present in the paper.

Acknowledgments

We thank Rafi Yavetz and Liel Uziahu for their technical support and the School of Mevoot-Yam for the facility.

Conflicts of Interest

The authors declare no conflicts of interest.

References

  1. Torda, G.; Donelson, J.M.; Aranda, M.; Barshis, D.J.; Bay, L.; Berumen, M.L.; Bourne, D.G.; Cantin, N.; Foret, S.; Matz, M.; et al. Rapid Adaptive Responses to Climate Change in Corals. Nat. Clim. Chang. 2017, 7, 627–636. [Google Scholar] [CrossRef]
  2. Mumby, P.J.; Steneck, R.S. Coral Reef Management and Conservation in Light of Rapidly Evolving Ecological Paradigms. Trends Ecol. Evol. 2008, 23, 555–563. [Google Scholar] [CrossRef]
  3. Putnam, H.M.; Barott, K.L.; Ainsworth, T.D.; Gates, R.D. The Vulnerability and Resilience of Reef-Building Corals. Curr. Biol. 2017, 27, R528–R540. [Google Scholar] [CrossRef] [PubMed]
  4. Muscatine, L.; Falkowski, P.G.; Porter, J.W.; Dubinsky, Z. Fate of Potosynthetic Fixed Carbon in Light and Shade-Adapted Colonies of The Symbiotic Coral Stylophora Pistillata. Proc. R. Soc. Lond. Ser. B Biol. Sci. 1984, 222, 181–202. [Google Scholar] [CrossRef]
  5. Drake, J.L.; Mass, T.; Stolarski, J.; Von Euw, S.; van de Schootbrugge, B.; Falkowski, P.G. How Corals Made Rocks through the Ages. Glob. Chang. Biol. 2020, 26, 31–53. [Google Scholar] [CrossRef]
  6. Oliver, E.C.J.; Benthuysen, J.A.; Darmaraki, S.; Donat, M.G.; Hobday, A.J.; Holbrook, N.J.; Schlegel, R.W.; Gupta, A. Marine Heatwaves. Sen. Annu. Rev. Mar. Sci. 2021, 13, 313–342. [Google Scholar] [CrossRef] [PubMed]
  7. Oakley, C.A.; Davy, S.K. Cell Biology of Coral Bleaching. In Coral Bleaching: Patterns, Processes, Causes and Consequences; Springer: New York, NY, USA, 2018; pp. 189–211. [Google Scholar]
  8. Baker, A.C.; Glynn, P.W.; Riegl, B. Climate Change and Coral Reef Bleaching: An Ecological Assessment of Long-Term Impacts, Recovery Trends and Future Outlook. Estuar. Coast. Shelf Sci. 2008, 80, 435–471. [Google Scholar] [CrossRef]
  9. Hoegh-Guldberg, O. Climate Change, Coral Bleaching and the Future of the World’s Coral Reefs. Mar. Freshw. Res. 1999, 50, 839–866. [Google Scholar] [CrossRef]
  10. Rodolfo-Metalpa, R.; Hoogenboom, M.O.; Rottier, C.; Ramos-Esplá, A.; Baker, A.C.; Fine, M.; Ferrier-Pagès, C. Thermally Tolerant Corals Have Limited Capacity to Acclimatize to Future Warming. Glob. Chang. Biol. 2014, 20, 3036–3049. [Google Scholar] [CrossRef]
  11. Hughes, T.P.; Kerry, J.T.; Álvarez-Noriega, M.; Álvarez-Romero, J.G.; Anderson, K.D.; Baird, A.H.; Babcock, R.C.; Beger, M.; Bellwood, D.R.; Berkelmans, R.; et al. Global Warming and Recurrent Mass Bleaching of Corals. Nature 2017, 543, 373–377. [Google Scholar] [CrossRef]
  12. Lin, C.H.; Nozawa, Y. The Influence of Seawater Temperature on the Timing of Coral Spawning. Coral Reefs 2023, 42, 417–426. [Google Scholar] [CrossRef]
  13. Shlesinger, T.; Loya, Y. Breakdown in Spawning Synchrony: A Silent Threat to Coral Persistence. Science 2019, 365, 1002–1007. [Google Scholar] [CrossRef]
  14. Deser, C.; Alexander, M.A.; Xie, S.P.; Phillips, A.S. Sea Surface Temperature Variability: Patterns and Mechanisms. Ann. Rev. Mar. Sci. 2010, 2, 115–143. [Google Scholar] [CrossRef]
  15. Fine, M.; Loya, Y. The Coral Oculina patagonica: A New Immigrant to the Mediterranean Coast of Israel. Isr. J. Zool. 1995, 41, 81. [Google Scholar]
  16. Fine, M.; Zibrowius, H.; Loya, Y. Oculina patagonica: A Non-Lessepsian Scleractinian Coral Invading the Mediterranean Sea. Mar. Biol. 2001, 138, 1195–1203. [Google Scholar] [CrossRef]
  17. Hoogenboom, M.; Rodolfo-Metalpa, R.; Ferrier-Pagès, C. Co-Variation between Autotrophy and Heterotrophy in the Mediterranean Coral Cladocora Caespitosa. J. Exp. Biol. 2010, 213, 2399–2409. [Google Scholar] [CrossRef]
  18. Serrano, E.; Ribes, M.; Coma, R. Recurrent Partial Mortality Events in Winter Shape the Dynamics of the Zooxanthellate Coral Oculina patagonica at High Latitude in the Mediterranean. Coral Reefs 2017, 36, 27–38. [Google Scholar] [CrossRef]
  19. Serrano, E.; Ribes, M.; Coma, R. Demographics of the Zooxanthellate Coral Oculina patagonica along the Mediterranean Iberian Coast in Relation to Environmental Parameters. Sci. Total Environ. 2018, 634, 1580–1592. [Google Scholar] [CrossRef]
  20. Zibrowius, H. Oculina patagonica, Scl Ractiniaire Hermatypique Introduit En M Diterran e. Helgol. Mar. Res. 1974, 26, 153–173. [Google Scholar]
  21. Leydet, K.P.; Hellberg, M.E. The Invasive Coral Oculina patagonica Has Not Been Recently Introduced to the Mediterranean from the Western Atlantic Speciation and Evolutionary Genetics. BMC Evol. Biol. 2015, 15, 79. [Google Scholar] [CrossRef]
  22. Rubio-Portillo, E.; Vázquez-Luis, M.; Valle, C.; Izquierdo-Muñoz, A.; Ramos-Esplá, A.A. Growth and Bleaching of the Coral Oculina patagonica under Different Environmental Conditions in the Western Mediterranean Sea. Mar. Biol. 2014, 161, 2333–2343. [Google Scholar] [CrossRef]
  23. Shaltout, M.; Omstedt, A. Recent Sea Surface Temperature Trends and Future Scenarios for the Mediterranean Sea. Oceanologia 2014, 56, 411–443. [Google Scholar] [CrossRef]
  24. Zaquin, T.; Zaslansky, P.; Pinkas, I.; Mass, T. Simulating Bleaching: Long-Term Adaptation to the Dark Reveals Phenotypic Plasticity of the Mediterranean Sea Coral Oculina patagonica. Front. Mar. Sci. 2019, 6, 662. [Google Scholar] [CrossRef]
  25. Brooke, S.; Young, C.M. Embryogenesis and Larval Biology of the Ahermatypic Scleractinian Oculina Varicosa. Mar. Biol. 2005, 146, 665–675. [Google Scholar] [CrossRef]
  26. Ozer, T.; Gertman, I.; Kress, N.; Silverman, J.; Herut, B. Interannual Thermohaline (1979–2014) and Nutrient (2002–2014) Dynamics in the Levantine Surface and Intermediate Water Masses, SE Mediterranean Sea. Glob. Planet. Change 2017, 151, 60–67. [Google Scholar] [CrossRef]
  27. Ralph, P.J.; Gademann, R.; Larkum, A.W.D.; Schreiber, U. In Situ Underwater Measurements of Photosynthetic Activity of Coral Zooxanthellae and Other Reef-Dwelling Dinoflagellate Endosymbionts. Mar. Ecol. Prog. Ser. 1999, 180, 139–147. [Google Scholar] [CrossRef]
  28. Martinez, S.; Bellworthy, J.; Ferrier-Pagès, C.; Mass, T. Selection of Mesophotic Habitats by Oculina patagonica in the Eastern Mediterranean Sea Following Global Warming. Sci. Rep. 2021, 11, 18134. [Google Scholar] [CrossRef]
  29. Schneider, C.A.; Rasband, W.S.; Eliceiri, K.W. NIH Image to ImageJ: 25 Years of Image Analysis. Nat. Methods 2012, 9, 671–675. [Google Scholar] [CrossRef]
  30. Ritchie, R.J. Universal Chlorophyll Equations for Estimating Chlorophylls a, b, c, and d and Total Chlorophylls in Natural Assemblages of Photosynthetic Organisms Using Acetone, Methanol, or Ethanol Solvents. Photosynthetica 2008, 46, 115–126. [Google Scholar] [CrossRef]
  31. Rinkevich, B.; Loya, Y. The Reproduction of the Red Sea Coral Stylophora Pistillata. I. Gonads and Planulae. Mar. Ecol. Prog. Ser. 1979, 1, 133–144. [Google Scholar] [CrossRef]
  32. Armoza-Zvuloni, R.; Segal, R.; Kramarsky-Winter, E.; Loya, Y. Repeated Bleaching Events May Result in High Tolerance and Notable Gametogenesis in Stony Corals: Oculina patagonica as a Model. Mar. Ecol. Prog. Ser. 2011, 426, 149–159. [Google Scholar] [CrossRef]
  33. Levitan, D.R. The Relationship between Egg Size and Fertilization Success in Broadcast-Spawning Marine Invertebrates. In Proceedings of the Integrative and Comparative Biology, Seattle, WC, USA, 3–7 June 2006; Volume 46, pp. 298–311. [Google Scholar]
  34. Jones, A.M.; Berkelmans, R. Tradeoffs to Thermal Acclimation: Energetics and Reproduction of a Reef Coral with Heat Tolerant Symbiodinium Type-D. J. Mar. Biol. 2011, 2011, 1–12. [Google Scholar] [CrossRef]
  35. Leinbach, S.E.; Speare, K.E.; Rossin, A.M.; Holstein, D.M.; Strader, M.E. Energetic and Reproductive Costs of Coral Recovery in Divergent Bleaching Responses. Sci. Rep. 2021, 11, 23546. [Google Scholar] [CrossRef] [PubMed]
  36. Timmins-Schiffman, E.; Axworthy, J.B.; Rie, M.; Nunn, B.L.; Padilla-Gamiño, J.L. Reproductive Resilience: Pathways to Gametogenic Success in Montipora Capitata after Bleaching. Preprint 2024. [Google Scholar] [CrossRef]
  37. Kushmarol, A.; Rosenberg, E.; Fine, M.; Haim, Y.B.; Loyal, Y. Effect of Temperature on Bleaching of the Coral Oculina patagonica by Vibrio AK-1. Mar. Ecol. Prog. Ser. 1998, 171, 131–137. [Google Scholar] [CrossRef]
  38. Shenkar, N.; Fine, M.; Kramarsky-Winter, E.; Loya, Y. Population Dynamics of Zooxanthellae during a Bacterial Bleaching Event. Coral Reefs 2006, 25, 223–227. [Google Scholar] [CrossRef]
  39. Coles, S.L.; Jokiel, P.L. Effects of Temperature on Photosynthesis and Respiration in Hermatypic Corals*. Mar. Biol. 1977, 43, 209–216. [Google Scholar] [CrossRef]
  40. Silbiger, N.J.; Goodbody-Gringley, G.; Bruno, J.F.; Putnam, H.M. Comparative Thermal Performance of the Reef-Building Coral Orbicella Franksi at Its Latitudinal Range Limits. Mar. Biol. 2019, 166, 126. [Google Scholar] [CrossRef]
  41. Gould, K.; Bruno, J.F.; Ju, R.; Goodbody-Gringley, G. Upper-Mesophotic and Shallow Reef Corals Exhibit Similar Thermal Tolerance, Sensitivity and Optima. Coral Reefs 2021, 40, 907–920. [Google Scholar] [CrossRef]
  42. Yakovleva, I.; Bhagooli, R.; Takemura, A.; Hidaka, M. Differential Susceptibility to Oxidative Stress of Two Scleractinian Corals: Antioxidant Functioning of Mycosporine-Glycine. Comp. Biochem. Physiol. B Biochem. Mol. Biol. 2004, 139, 721–730. [Google Scholar] [CrossRef]
  43. Lesser, M.P. Using Energetic Budgets to Assess the Effects of Environmental Stress on Corals: Are We Measuring the Right Things? Coral Reefs 2013, 32, 25–33. [Google Scholar] [CrossRef]
Figure 1. The sampling location situated in Michmoret, Israel (A,C). The graph shows the water temperature record sampled in front of the Israeli School of Marine Sciences in Michmoret during the year of the study—2021 (B). Data available: RECO_Database—Google Sheets satellite image by Google.
Oceans 05 00043 g001
Figure 2. Physiological and photochemical analyses of O. patagonica from January to September 2021. (A) Symbiodiniaceae cell density per skeletal surface area. (B) Chlorophyll concentration per skeletal surface area. (C) Protein concentration per skeletal surface area. (D) Maximum quantum yield (Fv/Fm). (E) Relative maximum electron transport rate (ETR). (F) Photosynthetic efficiency at light-limiting irradiances (alpha). Horizontal black lines within boxes are median values, and box limits represent the first and third quartiles. Whiskers represent 1.5 times the interquartile range. Round black points are individual sample data. Different lowercase letters indicate statistically significant differences between sampling months (adjusted p < 0.05). Lowercase letters are absent from graphs where there are no statistically significant differences between months.
Oceans 05 00043 g002
Figure 3. Seasonal gametogenesis in O. patagonica. (A) Number of sperm sacs per polyp from January to November 2021. (B) Oocyte diameter from January to November 2021. (C) Histological sections of a male colony showing developed testes (t). Thick black bars indicate a scale of 100 µM. (D) Histological sections of a female colony showing mature oocytes (o). Thick black bars indicate a scale of 100 µM (top) and 500 µM (bottom). Horizontal black lines within boxplots are median values, and box limits represent the first and third quartiles. Whiskers represent 1.5 times the interquartile range. Round black points are individual sample data. Different lowercase letters indicate statistically significant differences between months (adjusted p < 0.05).
Oceans 05 00043 g003
Figure 4. (A) Thermal performance curves of gross photosynthesis (blue line) and dark respiration (red line) rates (µmol O2 cm−2 h−1) as a function of temperature for O. patagonica. Each point represents an individual fragment from five different colonies (genotype indicated by shape). (B) Change in photosynthesis: respiration ratio with temperature. The horizontal red dotted line is where P:R = 2 (i.e., the lower threshold for long-term survival). In both graphics, solid lines represent the average fitted values and the gray bands represent the 95% confidence interval.
Oceans 05 00043 g004
Figure 5. (A) The bleaching percentage of O. patagonica colonies at eight different temperatures, including colonies recovered at 21 °C for 90 days. Different lowercase letters indicate statistically significant differences between sampling months (adjusted p < 0.05). (B) Representative bleaching progression of one fragment, starting from 21 °C at the beginning of the experiment, progressing through 29 °C, reaching 34 °C at the end and recovering after 90 days at 21 °C. Black scale bar in the leftmost image represents 1 cm.
Oceans 05 00043 g005
Disclaimer/Publisher’s Note: The statements, opinions and data contained in all publications are solely those of the individual author(s) and contributor(s) and not of MDPI and/or the editor(s). MDPI and/or the editor(s) disclaim responsibility for any injury to people or property resulting from any ideas, methods, instructions or products referred to in the content.