Article

Study on the Impact Mitigation Effect of Artificial Rock Backfill Layers for Submarine Pipelines Based on Physical Model Tests and Numerical Simulations

1
State Key Laboratory of Coastal and Offshore Engineering, School of Civil Engineering, Dalian University of Technology (DUT), Dalian 116000, China
2
Offshore Oil Engineering Co., Ltd., Tianjin 300461, China
3
School of Chemical Engineering, Ocean and Life Sciences, Dalian University of Technology (DUT), Panjin 124221, China
*
Author to whom correspondence should be addressed.
Oceans 2025, 6(2), 22; https://doi.org/10.3390/oceans6020022
Submission received: 28 February 2025 / Revised: 12 April 2025 / Accepted: 15 April 2025 / Published: 17 April 2025

Abstract

:
Submarine pipelines laid across navigational channels are highly susceptible to anchor drop impacts, which can cause deformation and disrupt normal pipeline operations. In severe cases, anchor impacts may lead to oil and gas leaks, resulting in significant economic losses and environmental damage. To ensure the safe operation of submarine pipelines, artificial rock backfilling is widely employed as a protective measure. Compared with complex pipeline protection structures, this approach is both cost-effective and efficient. In the physical model experiment, a combination of total force sensors and thin-film sensors was used to measure the dynamic response of pipelines under anchor impact. Additionally, The FEM-DEM numerical method was used to simulate the dynamic response and interaction process of anchor impact on the rock protection layer and pipeline. Numerical results were compared with experimental data to analyze the effects of rock protection layer thickness, backfill rock particle size, and pipeline sublayer types on pipeline impact response. The results show a good agreement between the physical model tests and numerical simulation studies, revealing several factors that influence the mitigation effect of the rock protection layer. This study provides a valuable scientific reference for the installation of rock protection layers for pipelines.

1. Introduction

Submarine pipelines are widely used in modern marine resource development projects due to their reliable structure and low cost. However, due to the complexity of the underwater environment, ship anchor damage, frequent fishing activities, and other potential factors, the normal operation of submarine pipelines is often at risk. According to data from domestic and international literature, pipeline damage caused by falling objects and ship anchors accounts for more than 50% of cases [1,2]. Therefore, additional reinforcement and protection for submarine pipelines to prevent anchor impacts is necessary. The protection methods for submarine pipelines include trenching [3,4,5], followed by artificial rock backfilling [6,7,8], concrete mattress placement [9], and others. For submarine pipelines in navigational channel areas [10], exposed pipelines [11], and naturally silted areas, the risk of pipeline damage may increase. Trenching followed by artificial rock backfilling is widely used due to its low cost and broad applicability. Therefore, research on the anchor impact resistance of artificial rock backfill protection layers for submarine pipelines is essential.
Currently, there has been much research on the impact of falling objects or anchor drops on pipelines, as well as studies on the effectiveness of different pipeline protection measures. Zhang Yiping et al. [12] conducted anchor drop impact experiments using different protective layer materials (such as rocks, concrete blocks, rubber mats, and composite flexible layers). Based on pipeline strain testing results, they identified the most effective cushioning material for impact mitigation. Wang Yi et al. [13] conducted large-scale outdoor model tests to study the influence of backfill stone shape and protection layer thickness on anchor drop impacts to pipelines. Jiang Fengyuan et al. [14] studied pipeline deformation caused by falling objects through physical model experiments and used large deformation finite element simulations to analyze the effects of pipeline burial depth, object type, internal pressure, and other factors on pipeline deformation. M. Zeinoddini et al. [15] analyzed the impact of the pipeline sublayer and internal pressure on pipeline deformation through pressure head tests and numerical simulations.
In terms of numerical simulation, for pipeline protection, Qiu Changlin et al. [16] used the finite element method coupled with the discrete element method (FEM-DEM) numerical simulation approach to model the process of a falling object penetrating a gravel protection layer. The penetration depth results from the numerical simulation were consistent with the formula provided in the DNV-RP-F107 [17] standard. Using this method, they analyzed the dynamic response of pipelines under gravel layer protection. Mun-Beom Shin et al. [18] employed the smoothed particle hydrodynamics coupled with finite element method (SPH-FEM) numerical simulation method in ABAQUS [19] to study the strain response of the pipeline–rock–clay system under anchor impact. Yu et al. [20]. used the local Galerkin discretization method and a three-dimensional numerical method to study pipeline deformation caused by transverse anchor impacts. This method offers high resolution and low computational cost.
In the latest research on pipeline impact from dropped objects/anchors, Jiang Fengyuan et al. conducted numerical simulations on pipelines buried in spatially varying soils [21] and pipelines with corrosion defects [22]. Based on convolutional neural networks [23], they developed an integrated surrogate model to predict the impact damage of pipelines buried in spatially variable soils. Fuheng Hou et al. [24] carried out numerical simulations on pipe-in-pipe (PIP) systems, a specialized pipeline structure known for its excellent thermal insulation and resistance to external loads, analyzing its dynamic response to dropped anchor impacts and assessing damage evaluation methods.
From the existing literature, it is clear that research on the dynamic response of submarine pipelines to falling object impacts has been thoroughly explored, with various pipeline protection measures and their effectiveness being proposed. This study focuses on trenching followed by artificial rock backfilling, a widely used and cost-effective engineering method. The study analyzes the impact of different protection layer thicknesses, rock particle sizes, pipeline bedding layers, and other factors on impact mitigation performance. This paper establishes an experimental platform for simulating anchor drop impacts on the pipeline, artificial backfill protection layer, and soil bedding layer coupling. Combined with the FEM-DEM numerical simulation method, the physical simulation experiments used in this study not only reflect the dynamic response of the pipeline under anchor drop impacts but also, through the use of thin-film sensors, capture the effect of the rock protection layer in spreading and dissipating the anchor impact force. In terms of numerical methods, the DEM approach, when compared with traditional finite element methods, better simulates the gravel structure and, when coupled with traditional finite elements, also accounts for the buffering effect of the soil sublayer during anchor impacts.

2. Materials and Methods

2.1. Theoretical Basis and Scale Relationships of Physical Model Experimentation

After the ship’s anchor is thrown into the water, it falls freely under the influence of gravity, eventually reaching a certain velocity v. The anchor will then impact the pipeline and its protective layer at this speed. According to Han Chongchong [25], the ship’s anchor will reach a maximum terminal velocity vmax during its free fall in the water (when the water depth is sufficient). According to DNV-RP-F107, the impact energy that the pipeline, with a concrete weight layer, can withstand is compared with the maximum impact energy achievable by the falling anchor in the water (calculated from the terminal velocity vmax) to evaluate whether the pipeline is damaged. Finally, the overall technical roadmap of this paper is in the Figure 1 below.

2.1.1. Anchor’s Falling Velocity in Air

As the weight of impact objects such as rocks or ship anchors is generally large, air resistance on the impact objects can be neglected. Therefore, the forces acting on the impact objects are considered to be only due to their own weight. Based on the law of conservation of mechanical energy, the motion process of the impact objects is modeled as follows:
v 1 = 2 g h 1 ,
in the above equation v1 refers to the velocity of the impact object when its bottom just touches the pipeline or rock protection layer and h1 represents the distance traveled by the impact object in the air.
From Equation (1), the velocity v1 when the anchor strikes the pipeline or rock protection layer can be calculated based on the known height h1, or the falling height h1 can be inferred from the impact velocity v1. Conducted in a water-free environment, this experiment utilizes the terminal velocity vmax of the Hall anchor in the water derived in Section 2.1.2. By integrating Equation (1) with the scaling relationships of physical model tests (see Section 2.1.5), the actual drop height H of the anchor in the physical model test can be calculated.

2.1.2. Anchor’s Maximum Terminal Falling Velocity vmax in Water

When an object moves in water, it is subjected to the combined effects of its own gravity, the buoyancy of the water, and fluid resistance. Based on Newton’s second law, the motion process of the object falling in water is modeled as follows:
( m + m a ) a = m g F F B ,
where F represents the buoyancy exerted by the water on the anchor and F = ρ w V a g , Va is the volume of the object. The added mass of the anchor, ma, can be expressed using Equation (3). and FB is the fluid resistance, calculated using Equation (4).
m a = ρ w C a Θ ,
where Ca is the added mass coefficient; ρ W is the density of water, which is 1025 kg/m3; and Θ is the volume of the anchor. DNV-RP-F107 specifies the added mass coefficients for falling objects of different shapes, as shown in Table 1.
F B = 1 2 ρ w A r C N v 2 2 ,
in the equation, CN represents the drag coefficient of the object, Ar is the effective cross-sectional area of the object, v2 is the velocity of the object in water.
By substituting Equation (4) into Equation (2), we obtain the following:
m g ρ V a g 1 2 ρ A r C N v 2 2 = m + m a a ,
The irregularly shaped Hall anchor used in this study adopts parameter CN = 1 from Table 2, which is consistent with the value employed by Han Congcong et al. [25] in their physical model experimental research on the anchor penetration depth of Hall anchors. To conservatively evaluate the pipeline’s resistance to damage, it is assumed that the anchor impacts the pipeline at its terminal velocity (vmax) in water. When the anchor descends through the water and accelerates to vmax, the fluid resistance (FB) balances its submerged weight (defined as the anchor weight minus buoyancy), resulting in zero acceleration. The Equation (5) can thus be rewritten as shown below Table 2.
m g ρ V a g 1 2 ρ A r v m a x 2 = 0 ,
where Va is the volume of the object and vmax is the maximum terminal velocity of the rock or anchor falling in water. In this paper, for safety considerations, v2 = vmax.

2.1.3. Anchor’s Kinetic Energy When Impacting the Pipeline or Protective Layer

As specified in DNV-RP-F107, the energy EE of the impacting object reaching the surface of the pipeline during rock dumping or anchor drop can be expressed using Equation (7).
E E = E T + E A = 1 2 m + m a v 2 2 ,
where ET represents the kinetic energy of the anchor and EA represents the kinetic energy generated by the anchor’s added mass. The added mass of the anchor, ma, can be expressed using Equation (3).

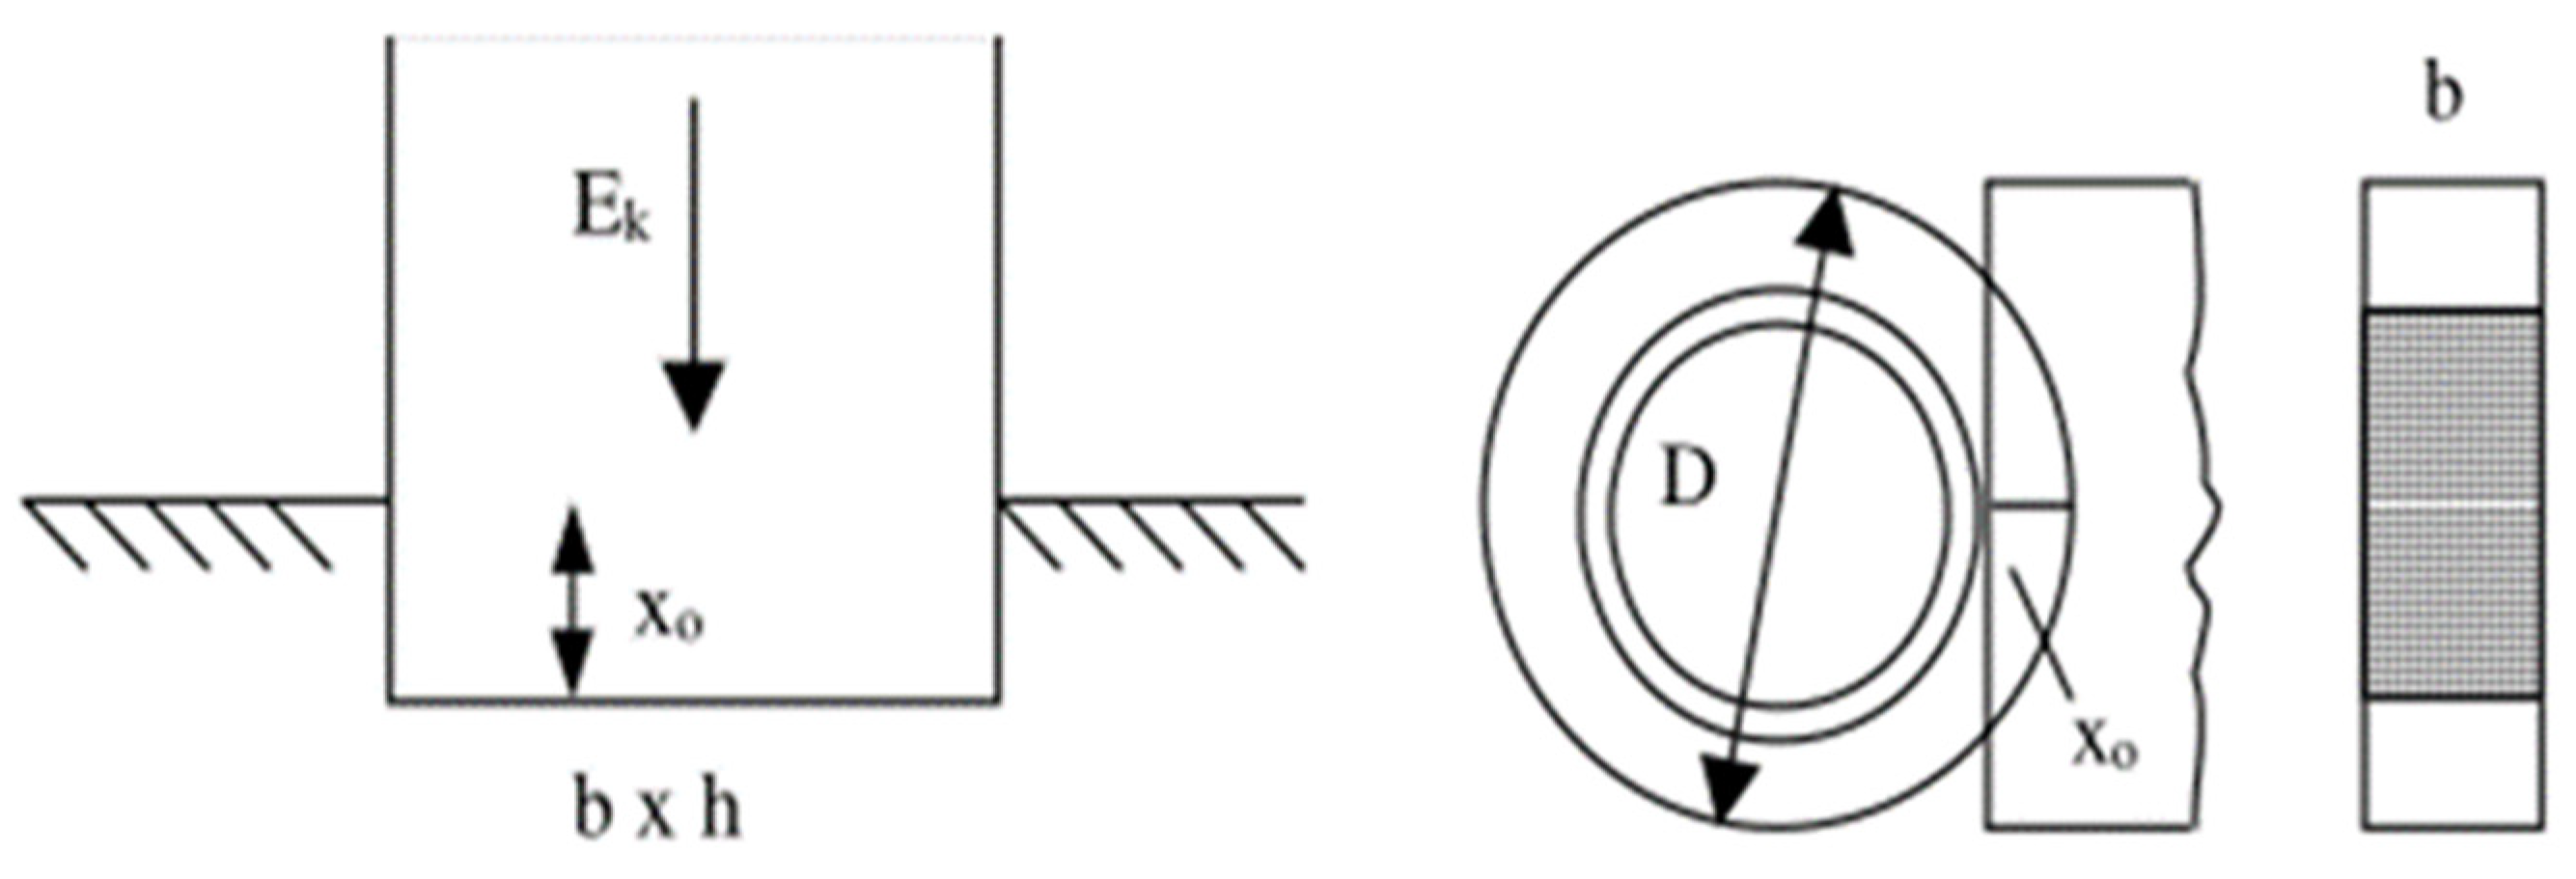
2.1.4. Kinetic Energy That Concrete Coating Can Resist from the Impact

The concrete coating can be used to resist potential impact damage, such as from rock dumping or anchor impact. The impact energy that the concrete coating can absorb can be expressed as a function of the embedded volume of the impacting object and the multiplicity of the concrete compressive strength (Y). According to a paper published by Jensen in 1978, Y represents 3–5 times the cubic strength of normal density concrete and 5–7 times the cubic strength of lightweight concrete. In this paper, the lower limit of 3 times is used. The cubic strength of normal density concrete typically ranges from 35–45 MPa, and in this paper, the lower limit of 35 MPa is used.
The energy that the concrete coating can absorb in two different conditions, namely crater formation and cutting, as shown in Figure 2, can be expressed by Formulas (8) and (9).
E k = Y b h x 0 ,
E k = Y b 4 3 D x 0 3 ,
where x0 represents the penetration depth, b is the width of the impacting object, h denotes the length of the impacting object, and D represents the diameter of the pipeline.
The two formulas indicate that the impact resistance of the concrete coating depends on the compressive strength of the concrete, the thickness of the concrete coating, the pipeline diameter D, and the contact surface dimensions b and h between the impacting object and the concrete coating. Equation (8) shows that the smaller the value of b, the greater the cutting damage caused by the impacting object to the concrete coating.

2.1.5. Scale Relationships of Physical Model Experiments

In this experiment, the anchor relies on its gravitational potential energy and the kinetic energy gained during its descent in water to impact the seabed pipeline or its rock protection layer. Throughout the entire process, the anchor’s self-weight plays the primary role. Therefore, the model experiment adopts the Froude similarity criterion for scaling (gravitational similarity criterion). The expression is as follows:
F r = v g h ,
where v is velocity in m/s and g is gravitational acceleration in m/s2.
The geometric scale ratio is λ L . According to Formula (11), the velocity scale ratio is as follows:
λ v = λ L ,
The time scale ratio λ t can be derived based on the velocity scale ratio λ v and the length scale ratio λ L , as follows:
λ t = λ L λ v = λ L ,
In the absence of a rock protection layer, the pipeline absorbs the full impact energy of the anchor. With a rock protection layer, the resistance of the rock disperses the impact energy of the anchor, which is then shared by the seabed, the rock protection layer, and the pipeline. During the high-speed penetration of the anchor into the rock protection layer, the total energy (Etotal) acquired by the anchor as it falls to the surface of the gravel pile/pipeline is converted into the work that is undertaken to overcome water and gravel resistance. The total energy consists of two parts: the kinetic energy (EE) and the gravitational potential energy (Ep) relative to the final penetration depth (z) in the rock protection layer. This process can be described by Equation (13):
E t o t a l = E E + E p = 1 2 m + m a v 2 2 + W z ,
where m is the mass of the anchor, and where the added mass of the anchor, ma, can be expressed using Equation (3). v2 is the final velocity before the impact with the pipeline, for safety considerations, v2 = vmax. W is the buoyant weight of the anchor in water.
If the penetration depth scale ratio λ z in the model test is the same as the geometric scale ratio λ L , i.e.,
λ z = z p / z m = λ L ,
then, in the equation, zp and zm represent the penetration depths of the anchor into the rock protection layer for the prototype and the model, respectively. According to Equation (13), the scale of gravitational potential energy can be expressed as follows:
λ e p = E p , p E p , m = m p g p z p m m g m z m ,
Under 1g conditions, the scale ratio of gravitational acceleration g is 1. The physical model test uses the same material as the prototype, so the density scale ratio is λ ρ = 1 , and the volume is proportional to the cube of the length,   λ V = λ L 3 . From this, the mass scale ratio,   λ m = λ L 3 , and the potential energy scale ratio can be derived, λ e p = λ L 4 . The scale ratio of kinetic energy can be expressed as Equation (16):
λ e e = E E , p E E , m = m p v p 2 m m v m 2 ,
To ensure that the scale of kinetic energy is the same as that of gravitational potential energy, λ e p = λ e e = λ L 4 , the scale ratio of velocity can be expressed as Equation (17):
λ v = v p / v m = λ L ,
Equation (17) is consistent with Equation (11) derived using the Froude similarity criterion. The acceleration scale can be expressed by the following equation:
λ a = v p / t p v m / t m = 1 ,
According to Newton’s second law, the scale ratio of impact force F is given by the following:
λ F = m p a p m m a m = V p a p V m a m = λ L 3 ,
The scale relations of all physical quantities used in this paper have been derived from Equations (11)–(19) and are summarized in Table 3:

2.2. Establishment of Physical Model Experiments

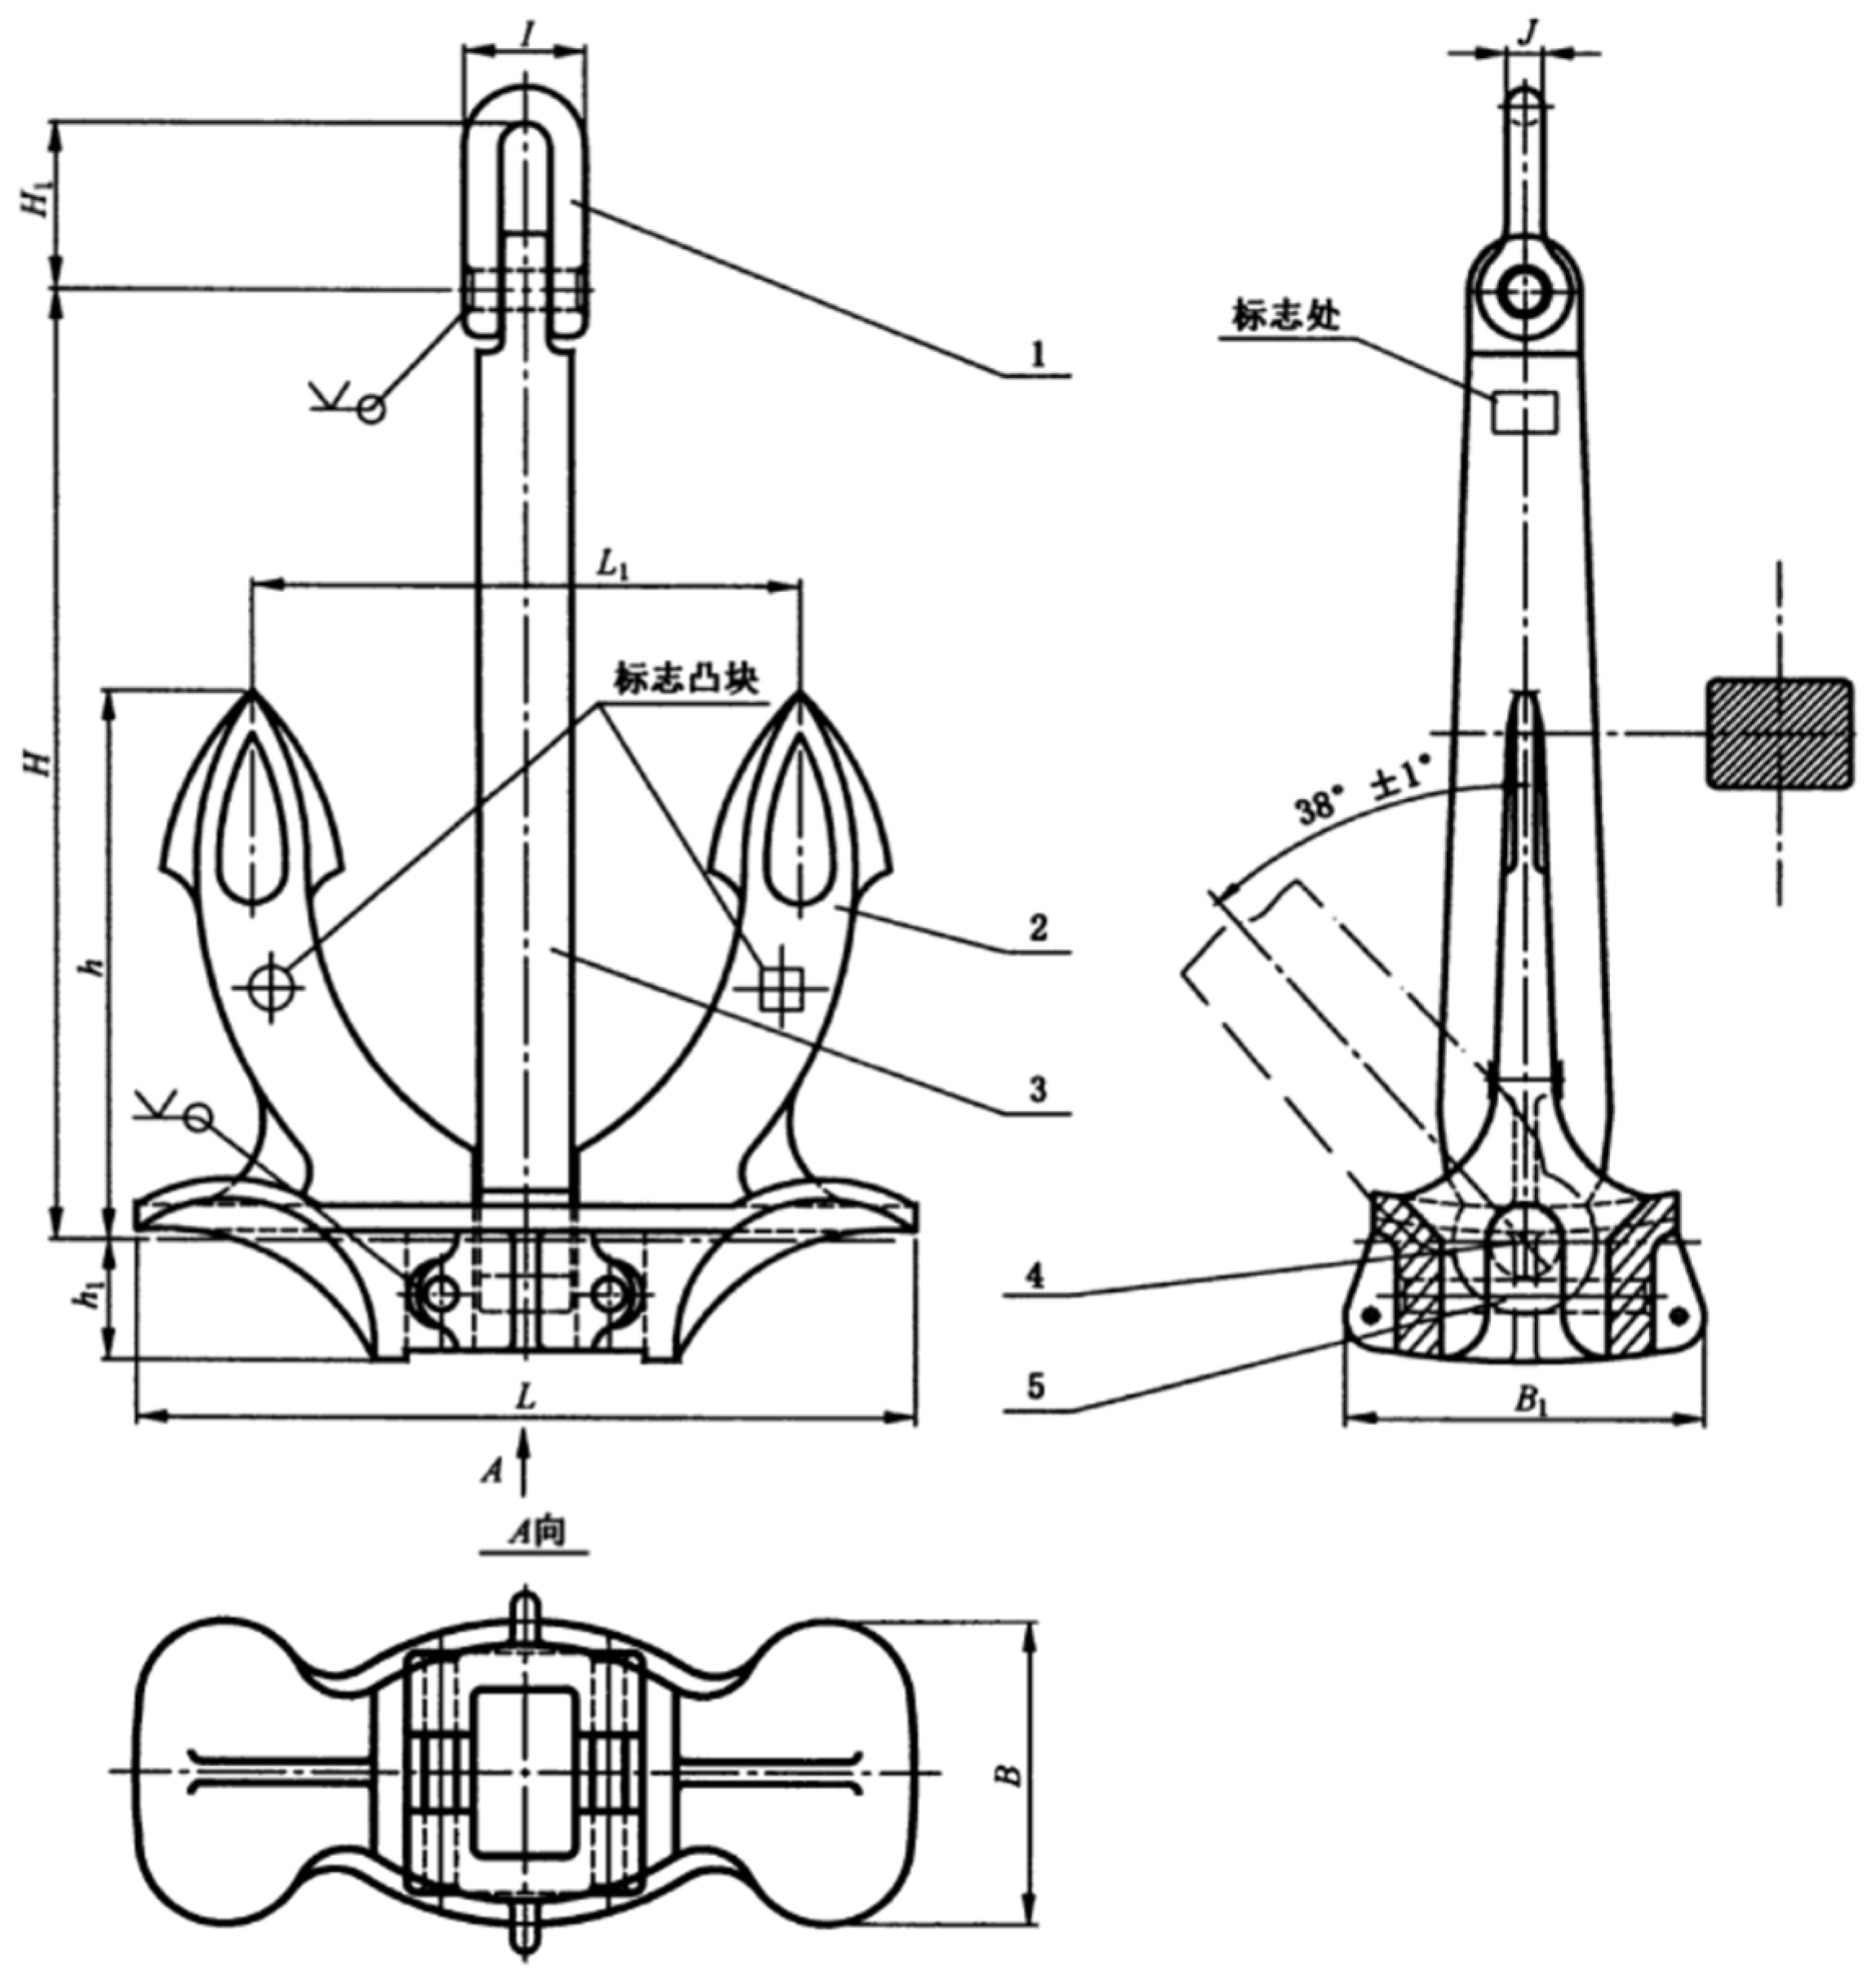
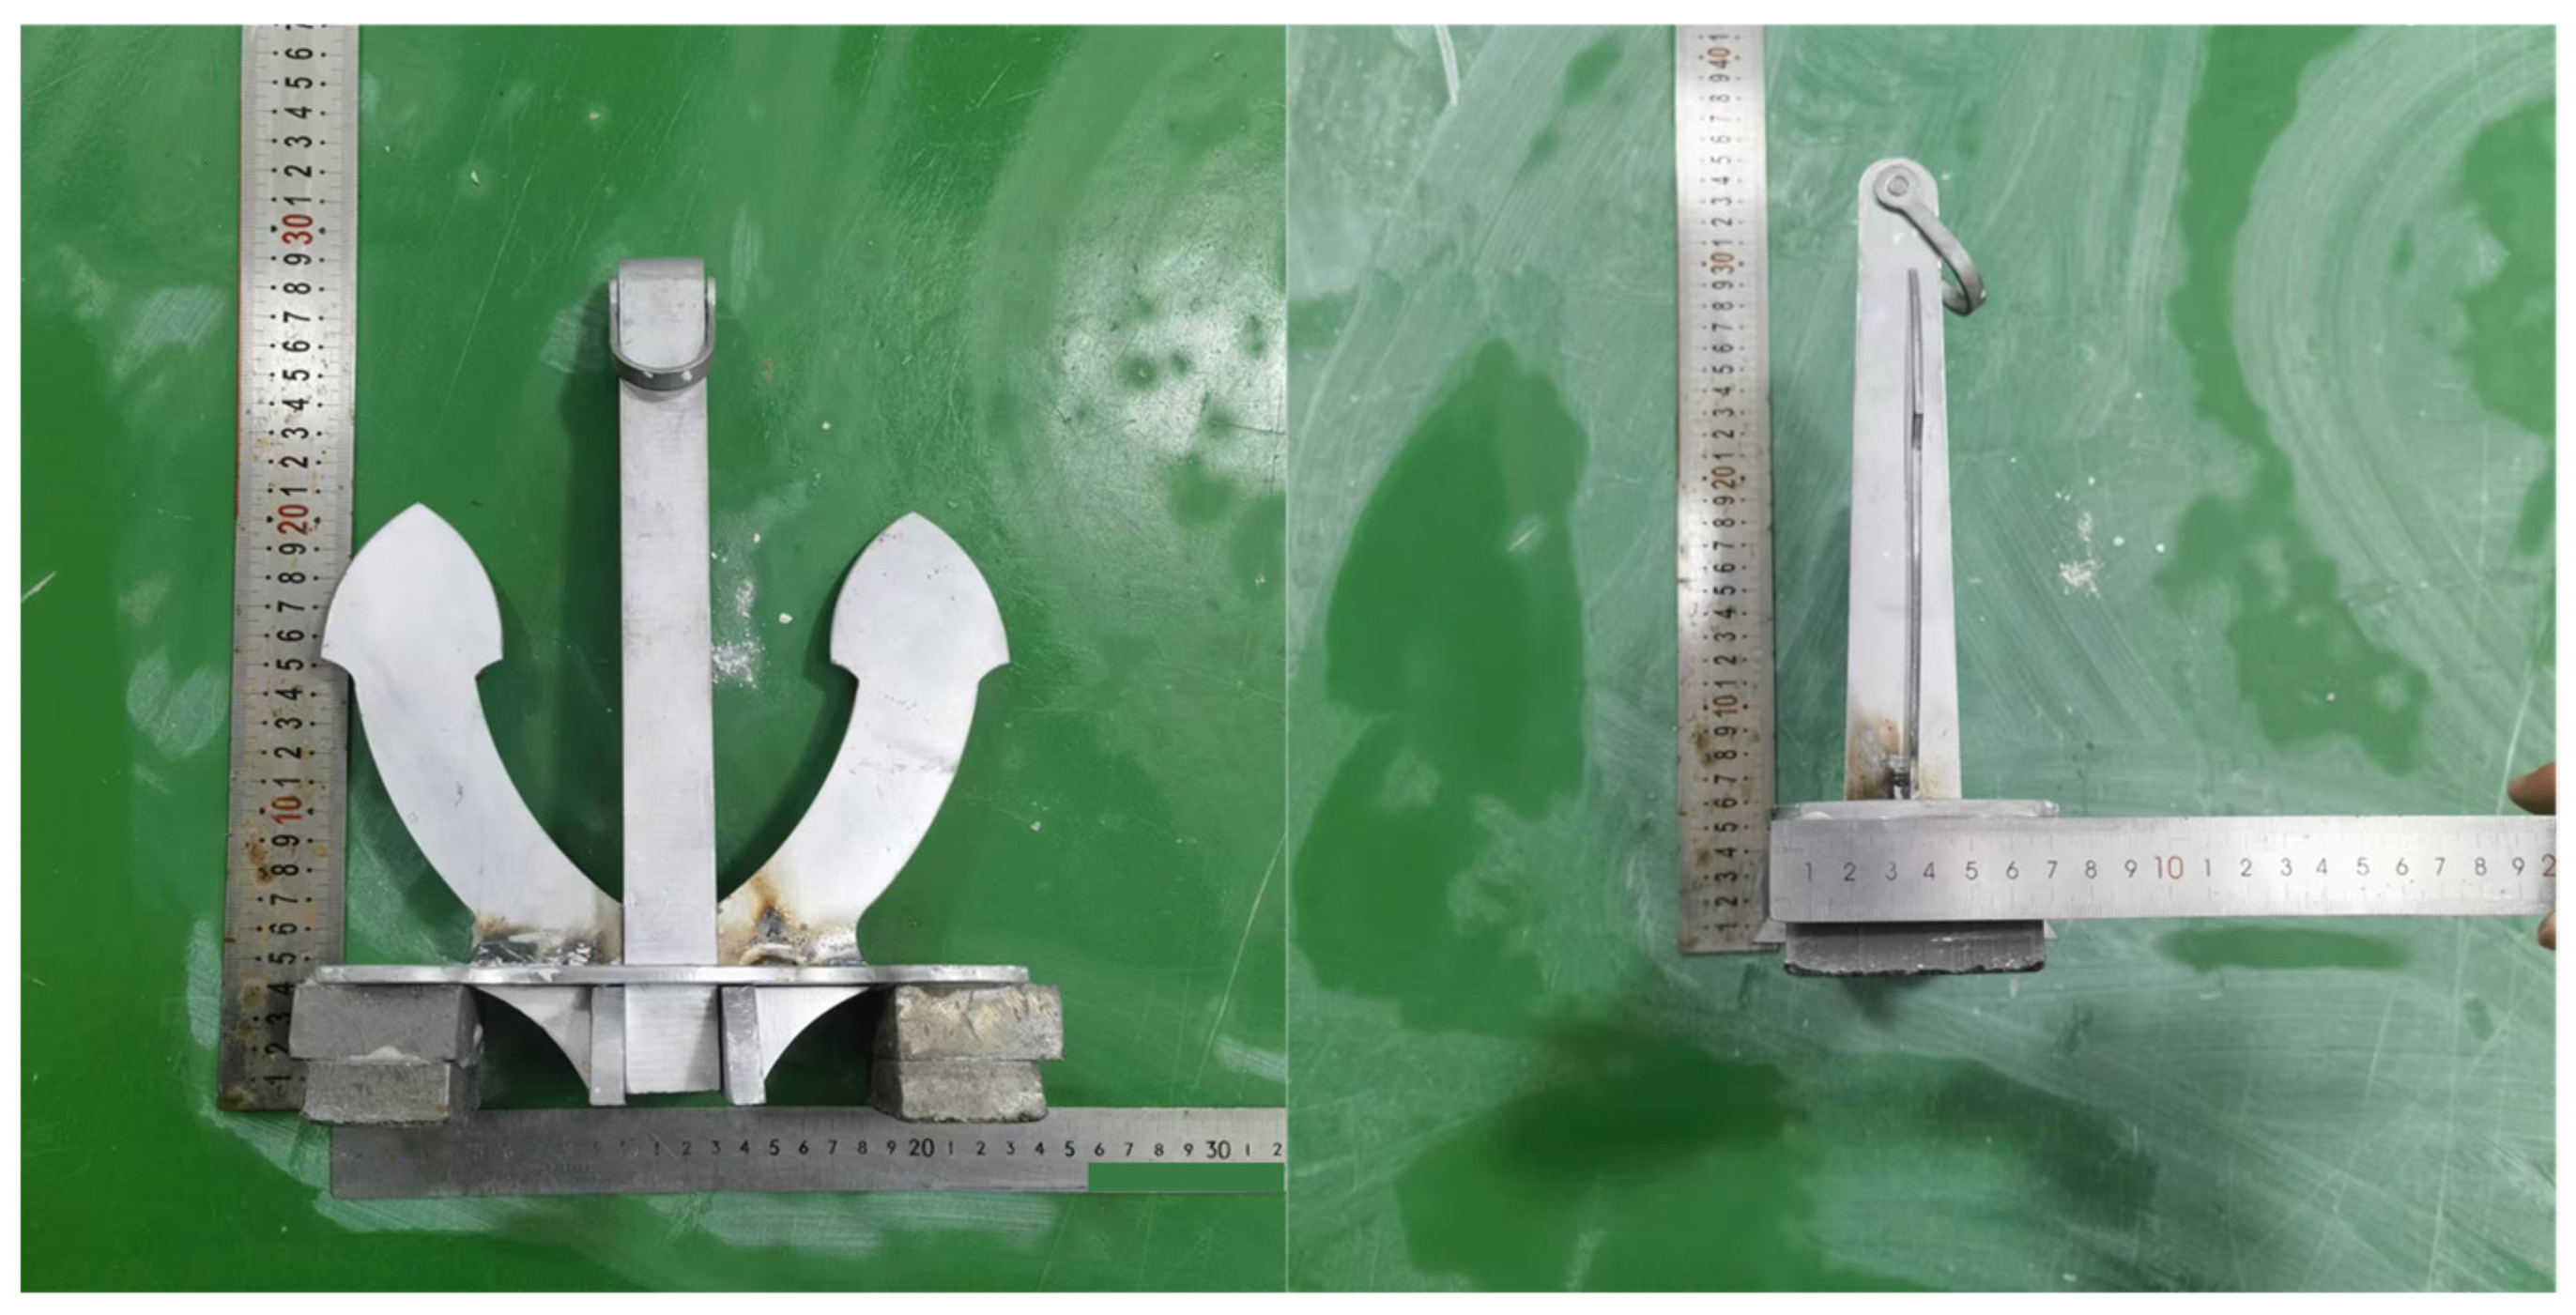
2.2.1. Anchor Selection and Model Anchor Preparation

According to GB/T546-2016 [26], a 15.4 t Hall anchor (a larger type of anchor used by vessels in the subsea pipeline laying area) was selected for the anchoring experiment. The geometric scale of the experiment was set to λL = 15, and the model Hall anchor weighed 4.56 kg. The dimensions of the prototype and model anchors are shown in the Table 4. The schematic diagram of the prototype is shown in Figure 3, and the physical model of the anchor is shown in Figure 4.

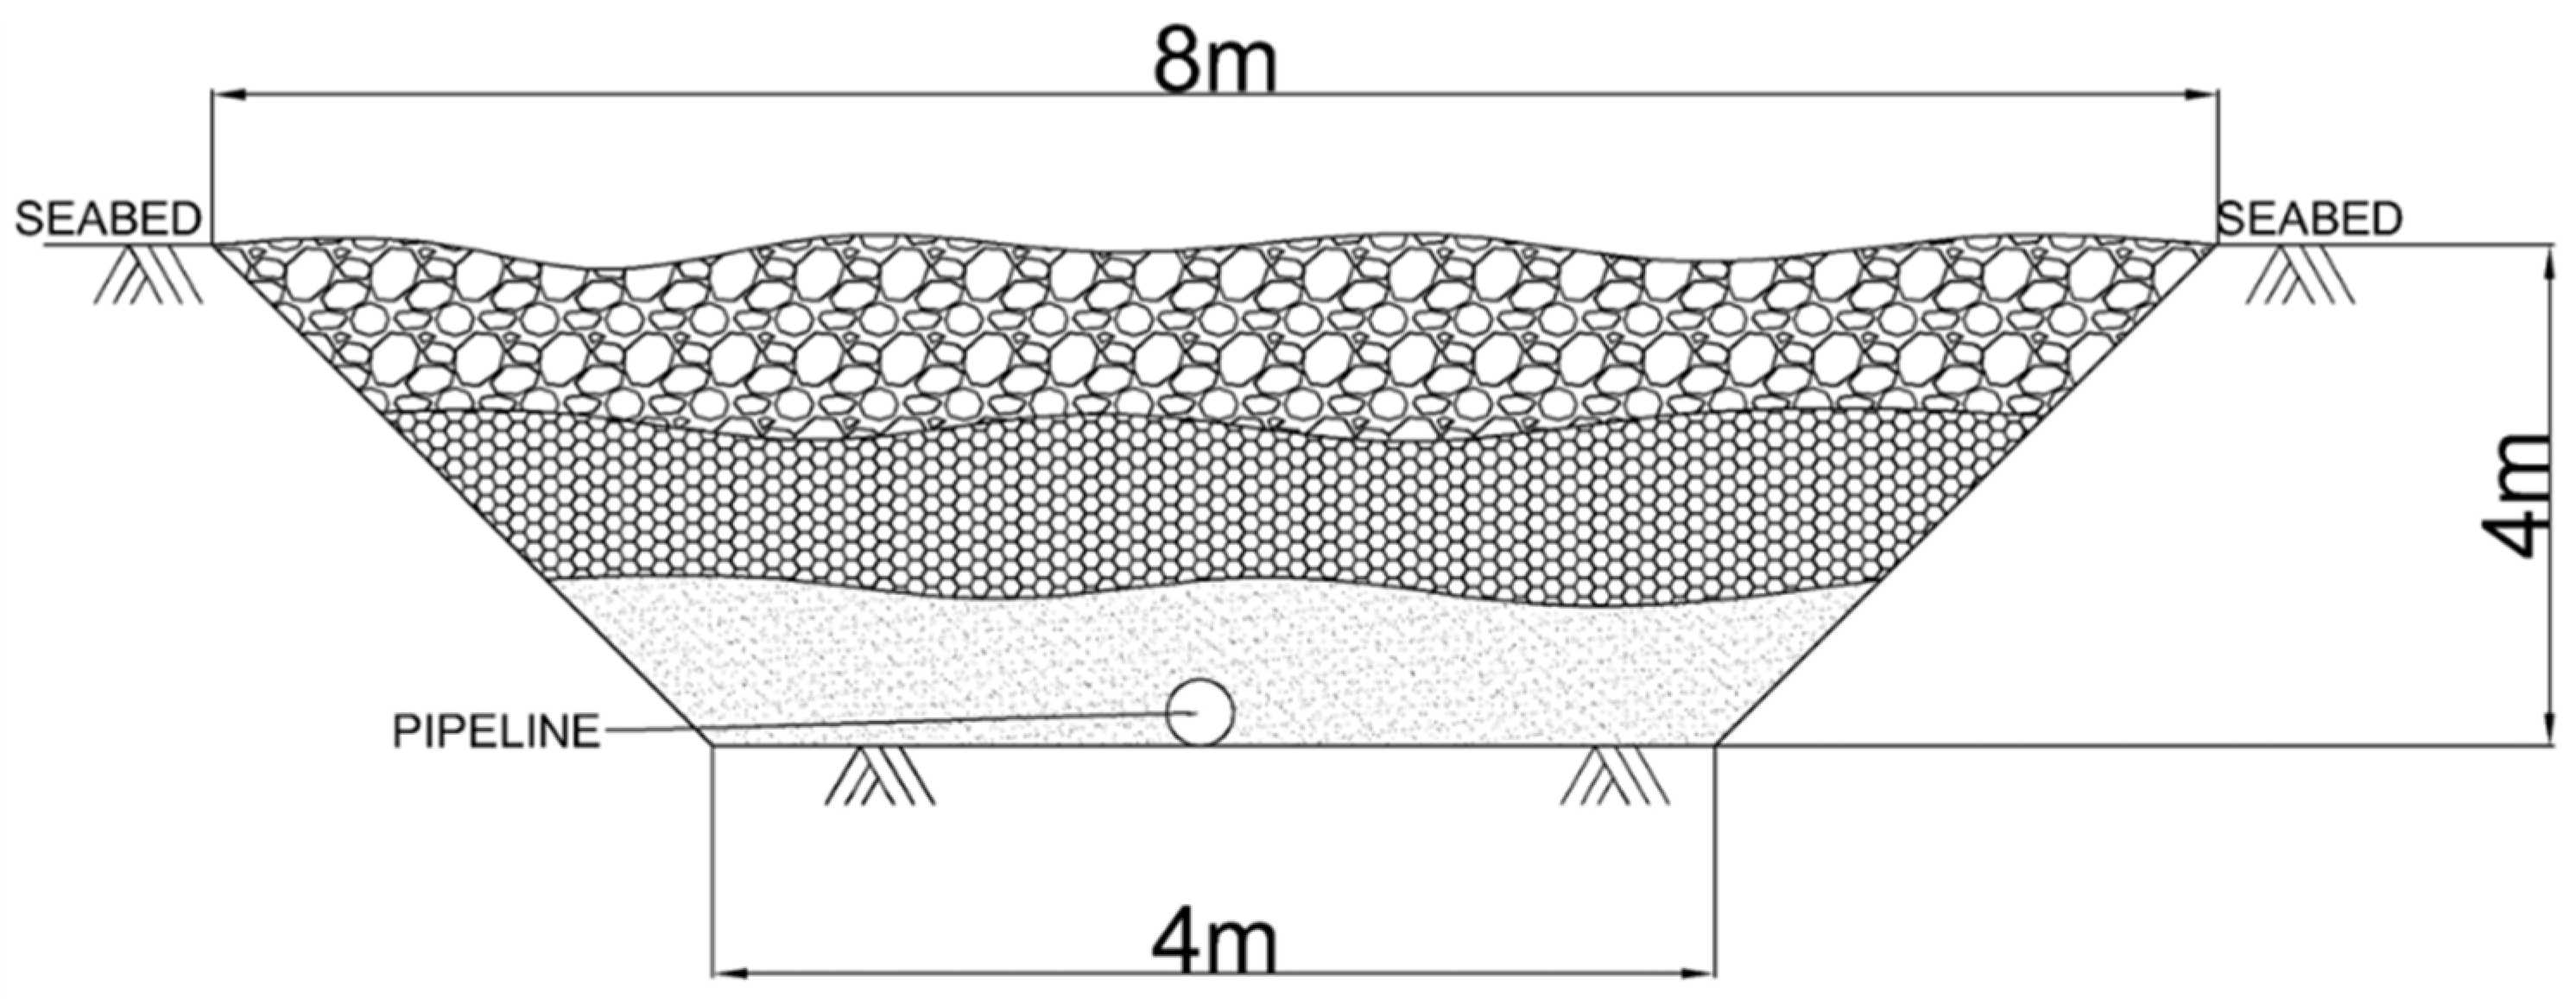
2.2.2. Pipeline Trench Shape

The main method used for subsea pipeline protection at the site is trench excavation followed by artificial backfilling with rock materials. Due to the complex trench shape and backfilling methods at the site, as well as the large variation in particle size of the backfill, this study selects a typical trench shape from the cross-channel area (Figure 5) for small-scale testing. While maintaining a consistent slope ratio, the thickness of different sizes of rock backfill layers covering the trench shape is varied for comparison tests. The goal is to study the protective effects of backfill materials with different thicknesses and types on subsea pipelines.

2.2.3. Gradation of Rock Protection Layer Particle Size and Trench Model Soil Sample

The prototype trench backfill uses three different particle sizes of rocks: small-sized rocks ranging from 30 mm to 45 mm, medium-sized rocks ranging from 150 mm to 225 mm, and large-sized rocks ranging from 330 mm to 440 mm. After scaling, the following Table 5 can be obtained:
The model test uses sand to simulate small-sized rocks, with fine sand particle sizes ranging from 2 to 3 mm corresponding to the prototype small-sized backfill material. Gravel is used to simulate medium and large-sized rocks, with small gravel particles ranging from 8 to 15 mm corresponding to the prototype medium-sized backfill material. Finally, large gravel particles ranging from 20 to 40 mm correspond to the prototype large-sized backfill material.
The bottom of the pipeline trench at the project site is typically composed of clay or sandy soil layers. In this experiment, three different trench bedding layers (a high-strength clay layer, a soft mud layer, and a sandy soil layer) are used to analyze their impact on the impact buffering effect. The undrained shear strength of the clay bedding layer model soil samples is measured using the cross-plate shear test method. The soil strength of the high-strength clay layer su = 5.5 kPa and the soil strength of soft mud is su = 0.5 kPa.

2.3. Physical Model Test Plan

2.3.1. Impact Energy Ek That the Concrete Coating Can Resist

The commonly used pipeline coating at the construction site is 40 mm. According to Formulas (9) and (10), the maximum impact energy that a pipeline with a 40 mm concrete coating can withstand when subjected to a direct impact from a 15,400 kg Hall anchor is 870 KJ. The detailed calculation parameters are shown in the Table 6:

2.3.2. Maximum Impact Energy EE That the Anchor Can Reach in Water

According to Formulas (3)–(6), the maximum fall velocity vmax = 8.172 m/s that the anchor can reach in water can be calculated. Based on Han Chongchong et al. [21], the Hall anchor’s added mass coefficient Ca = 5.11. The maximum impact energy EE that the anchor can reach is then calculated using Formulas (7) and (8). The detailed calculation parameters are shown in Table 7, below:
The maximum impact energy EE that the anchor can reach in water is very close to the energy Ek that the 40 mm thick concrete coating pipeline can withstand, meaning that the pipeline is in a critical failure state. Therefore, the baseline test condition H0 is established by directly impacting the 40 mm thick concrete coating pipeline with the anchor at its maximum fall velocity, vmax = 8.172 m/s, in water. The safety factor NA = 1 for condition H0 is defined, and experimental research is conducted to analyze the effects of factors such as the rock protection layer particle size, thickness, and trench bedding type on the resistance to anchor impact.

2.3.3. Anchor Drop Height H

Given that the maximum fall velocity of the anchor in water is vmax = 8.172 m/s, the maximum fall velocity of the model anchor is calculated based on the scale ratio. Using Formula (2), the required anchor drop height H for the experiment can be determined. The specific calculation details are shown in Table 8, below:

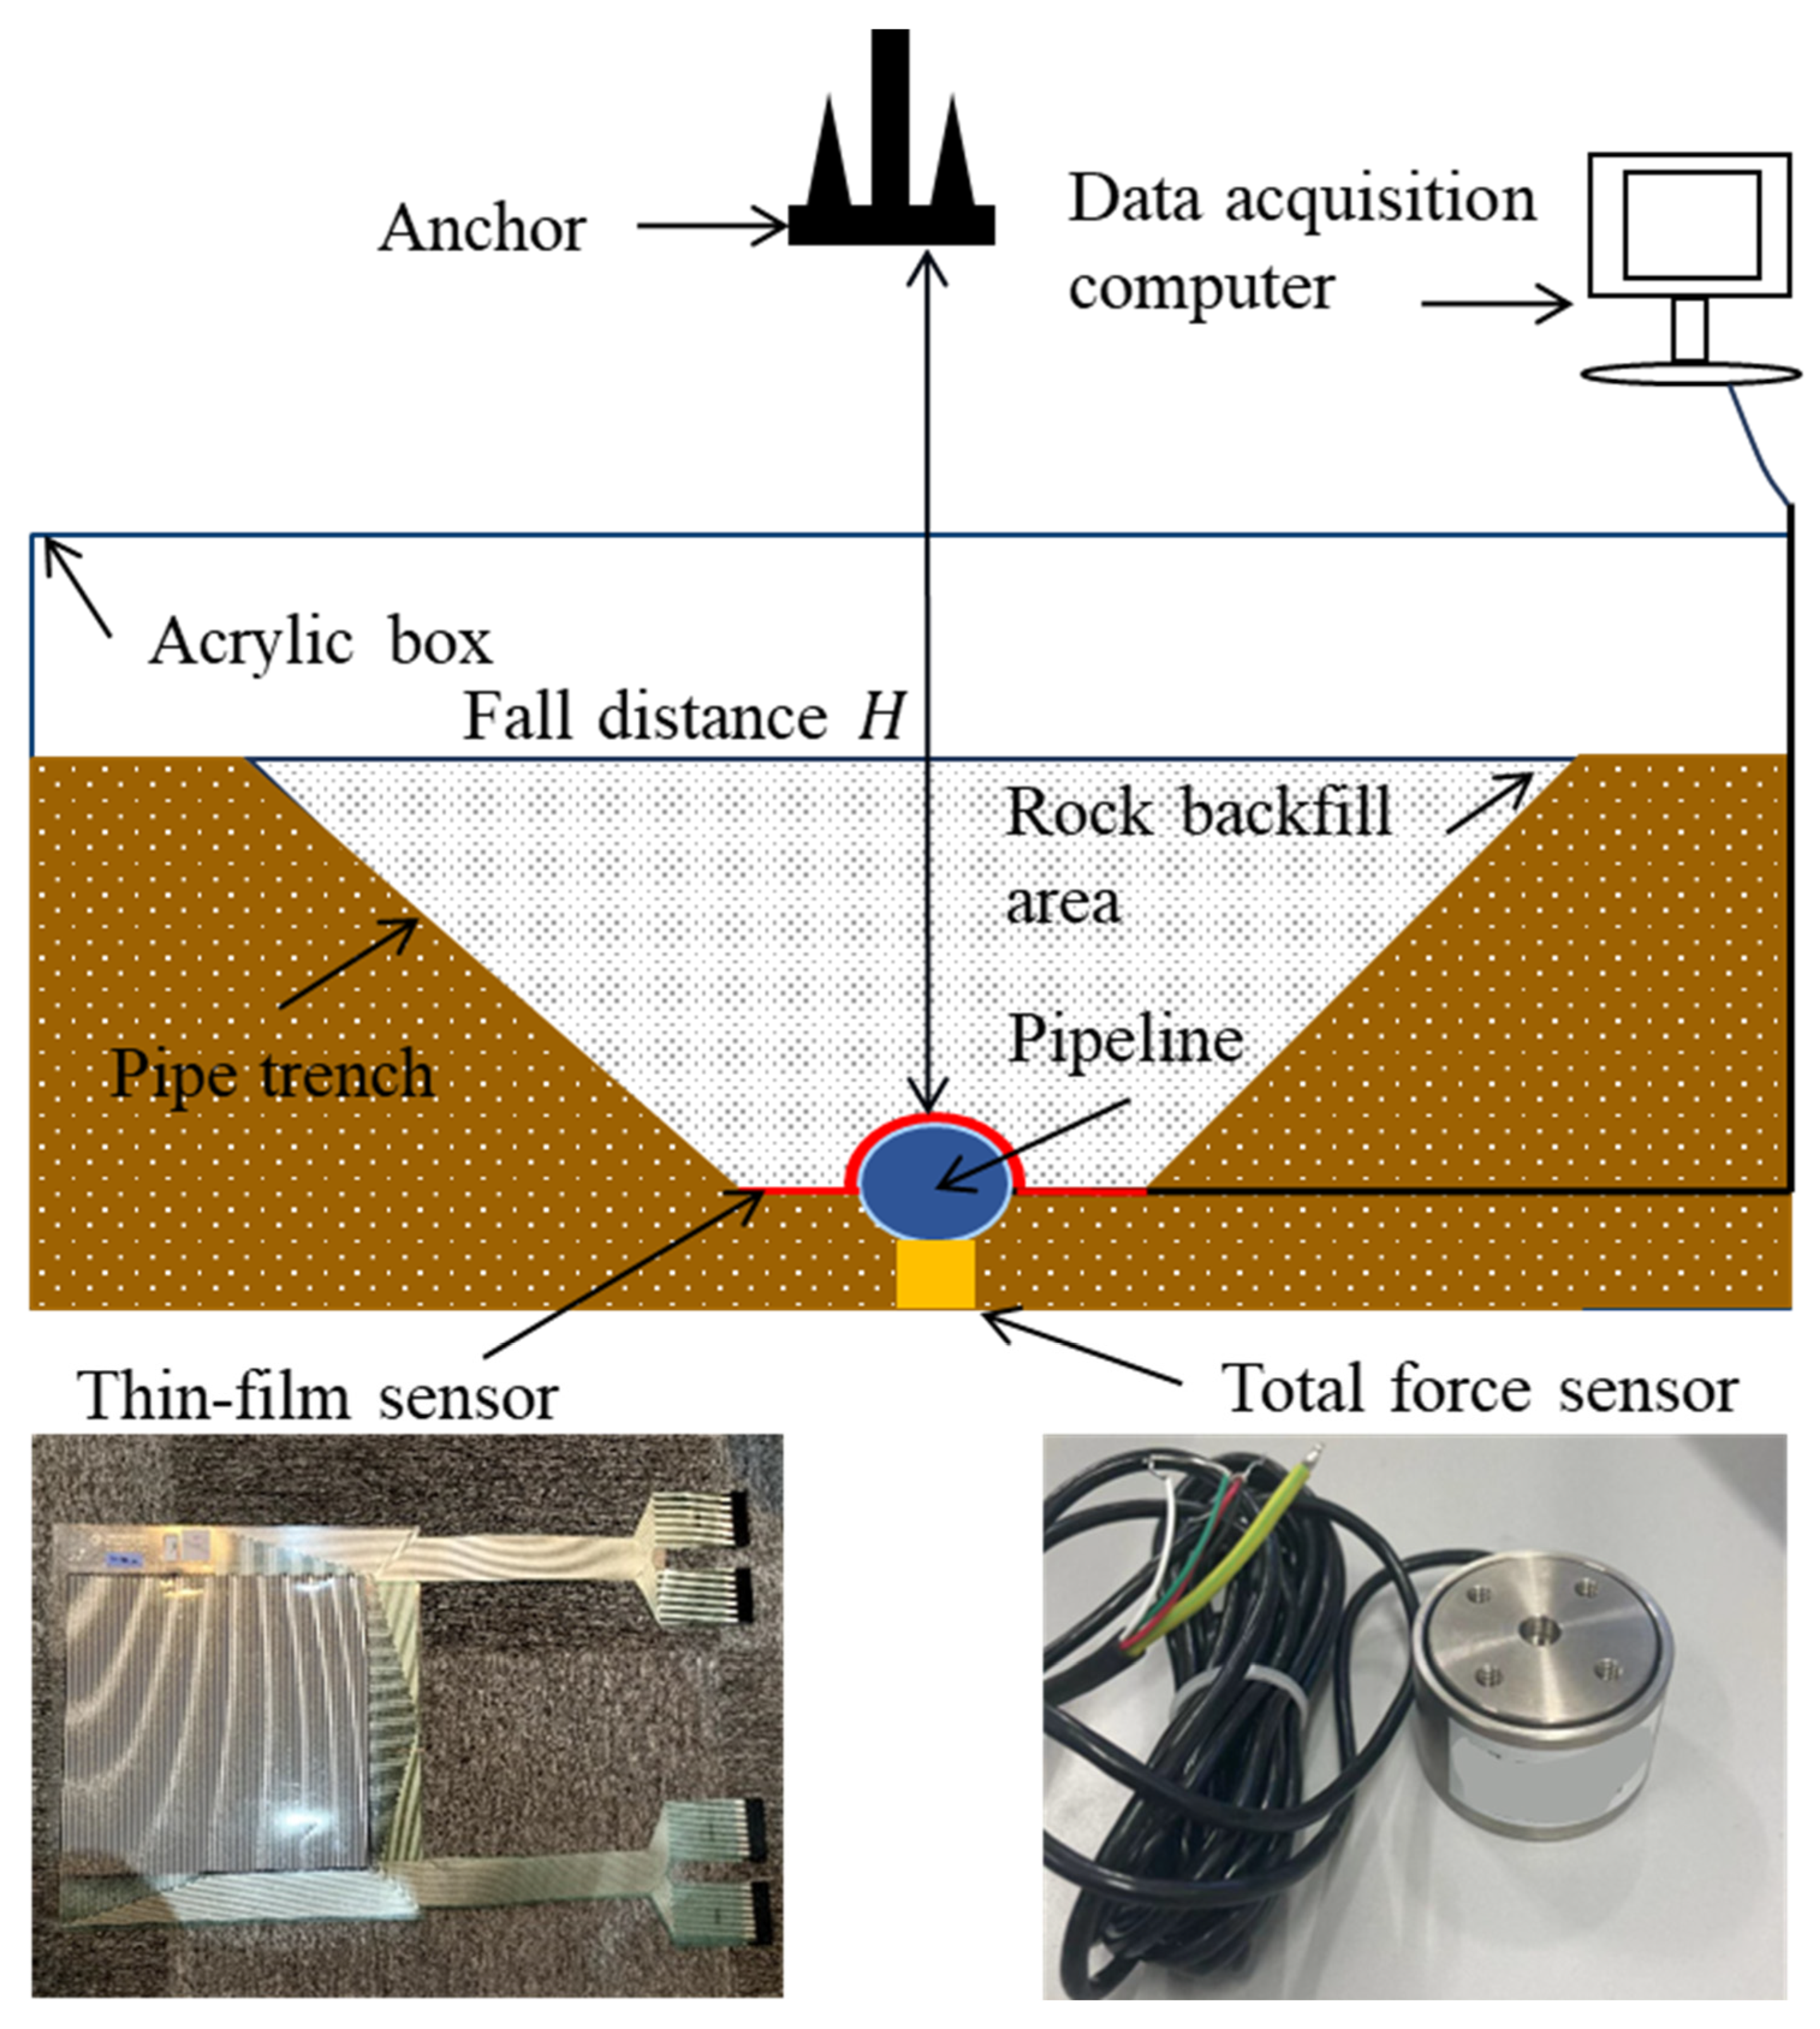
2.4. Experimental Setup and Procedure

The experiment is conducted in a model box. Different bedding layers are placed at the bottom of the model box, and the pipeline is arranged above the bedding layers. Total force sensors are placed below the model pipeline to collect the impact force when the anchor drops and strikes the pipeline. A thin-film sensor is placed above the pipeline to obtain the distribution of the impact force on the pipeline caused by the falling anchor. A rock backfill layer is placed above the pipeline and sensors. The model anchor is set at a height of H = 0.227 m above the pipeline. The experimental setup is shown in Figure 6 and Figure 7.
The steps for the anchor drop test are as follows:
(1) Place the total force sensors, pipeline, and thin-film sensors sequentially from bottom to top on the acrylic test box floor. The trench shape on both sides of the pipeline is simulated using sandy soil or barriers. The trench bedding layer is placed below the pipeline and an artificial backfill protection layer with different particle sizes is placed above the pipeline.
(2) Suspend the model anchor above the pipeline or pipeline protection layer at a height of 0.227 m (H) using fishing line.
(3) Cut the fishing line to allow the model anchor to fall freely, and collect the impact force of the model anchor on the pipeline.

2.5. Numerical Model Construction

This study uses the coupled finite element method and discrete element method (FEM-DEM) numerical approach to simulate and study the deformation and dynamic response of pipelines subjected to anchor impacts under rock layer protection. Based on the ABAQUS computational platform, the seabed soil model is constructed using C3D8R elements combined with the Mohr–Coulomb model. By adjusting the material properties in the Mohr–Coulomb model, the impact of different soil strengths (su) on the pipeline’s impact force is analyzed. The pipeline model is constructed using shell elements combined with nonlinear material properties (considering the plastic deformation of steel). For the rock protection layer, the PD3D elements (discrete element model built into the ABAQUS platform) are used. As the deformation of the anchor is not considered, the anchor is modeled as a rigid body with a mass of 15,400 kg. The schematic diagram of the numerical simulation is shown in Figure 8.
The numerical model uses the particle generator feature built into ABAQUS to generate the rock particles. The generated rock particles fall into the pipeline trench model under the influence of gravity. By adjusting the rock particle diameter parameter, D, and the number of particles (as shown in the Figure 9), the protective effect of different particle sizes and thicknesses of the protection layer on the pipeline under anchor impact can be analyzed. The numerical model places the anchor directly above the pipeline or rock protection layer, with a drop distance of Hs = 3.4 m (the anchor drop height corresponding to the maximum fall velocity that the prototype anchor can reach in water).

3. Results and Discussion

3.1. Physical Model Test Conditions Setup

This study’s physical model tests include 12 test conditions, with H0 as the baseline condition, where no protective layer is applied and the anchor directly impacts the pipeline at its maximum fall velocity in water (fall height H = 0.277 m). Other test conditions vary the underlying material properties, the height of the protective layer, and particle size, which are compared with the baseline condition. The specific test conditions and analysis of influencing factors are shown in Table 9, below:

3.2. Numerical Simulation Conditions Setup

A total of five sets of numerical models were set up. The first set was a rock repose angle verification model, which validates the feasibility of the numerical simulation of the rock body by using the repose angle formed naturally by the falling rock. The other four sets correspond to the physical model test conditions H0, H1, H3, and H4, and are used to compare and validate the dynamic response of the pipeline to anchor impact, as well as the mitigation effect of different protection layer thicknesses and particle sizes on the anchor impact. The numerical conditions are shown in Table 10 below.

3.3. Physical Model Test Results and Analysis

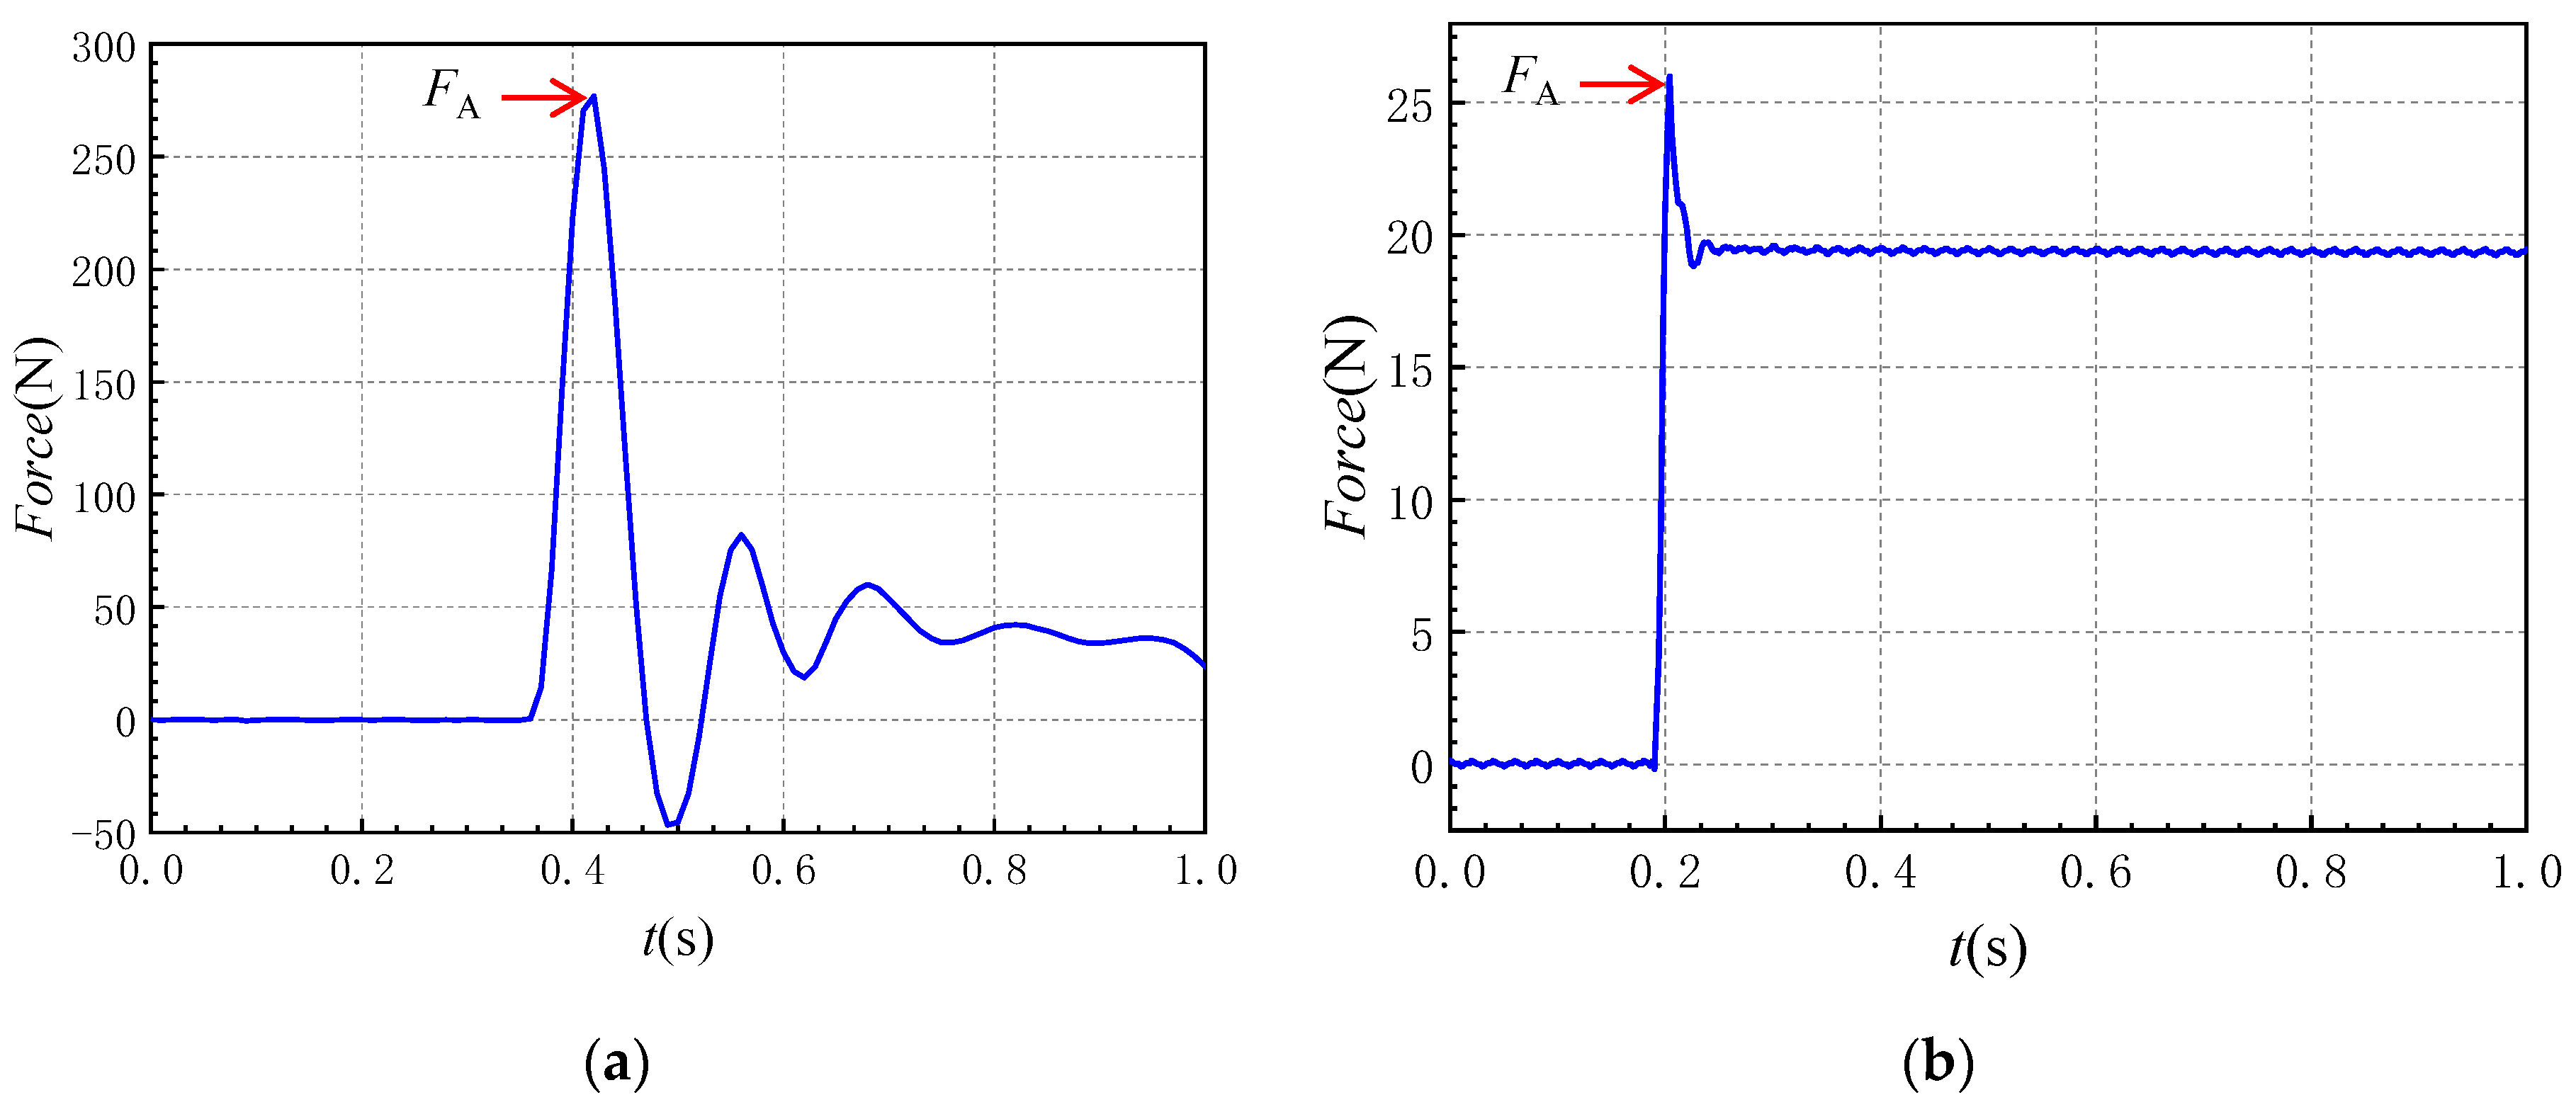
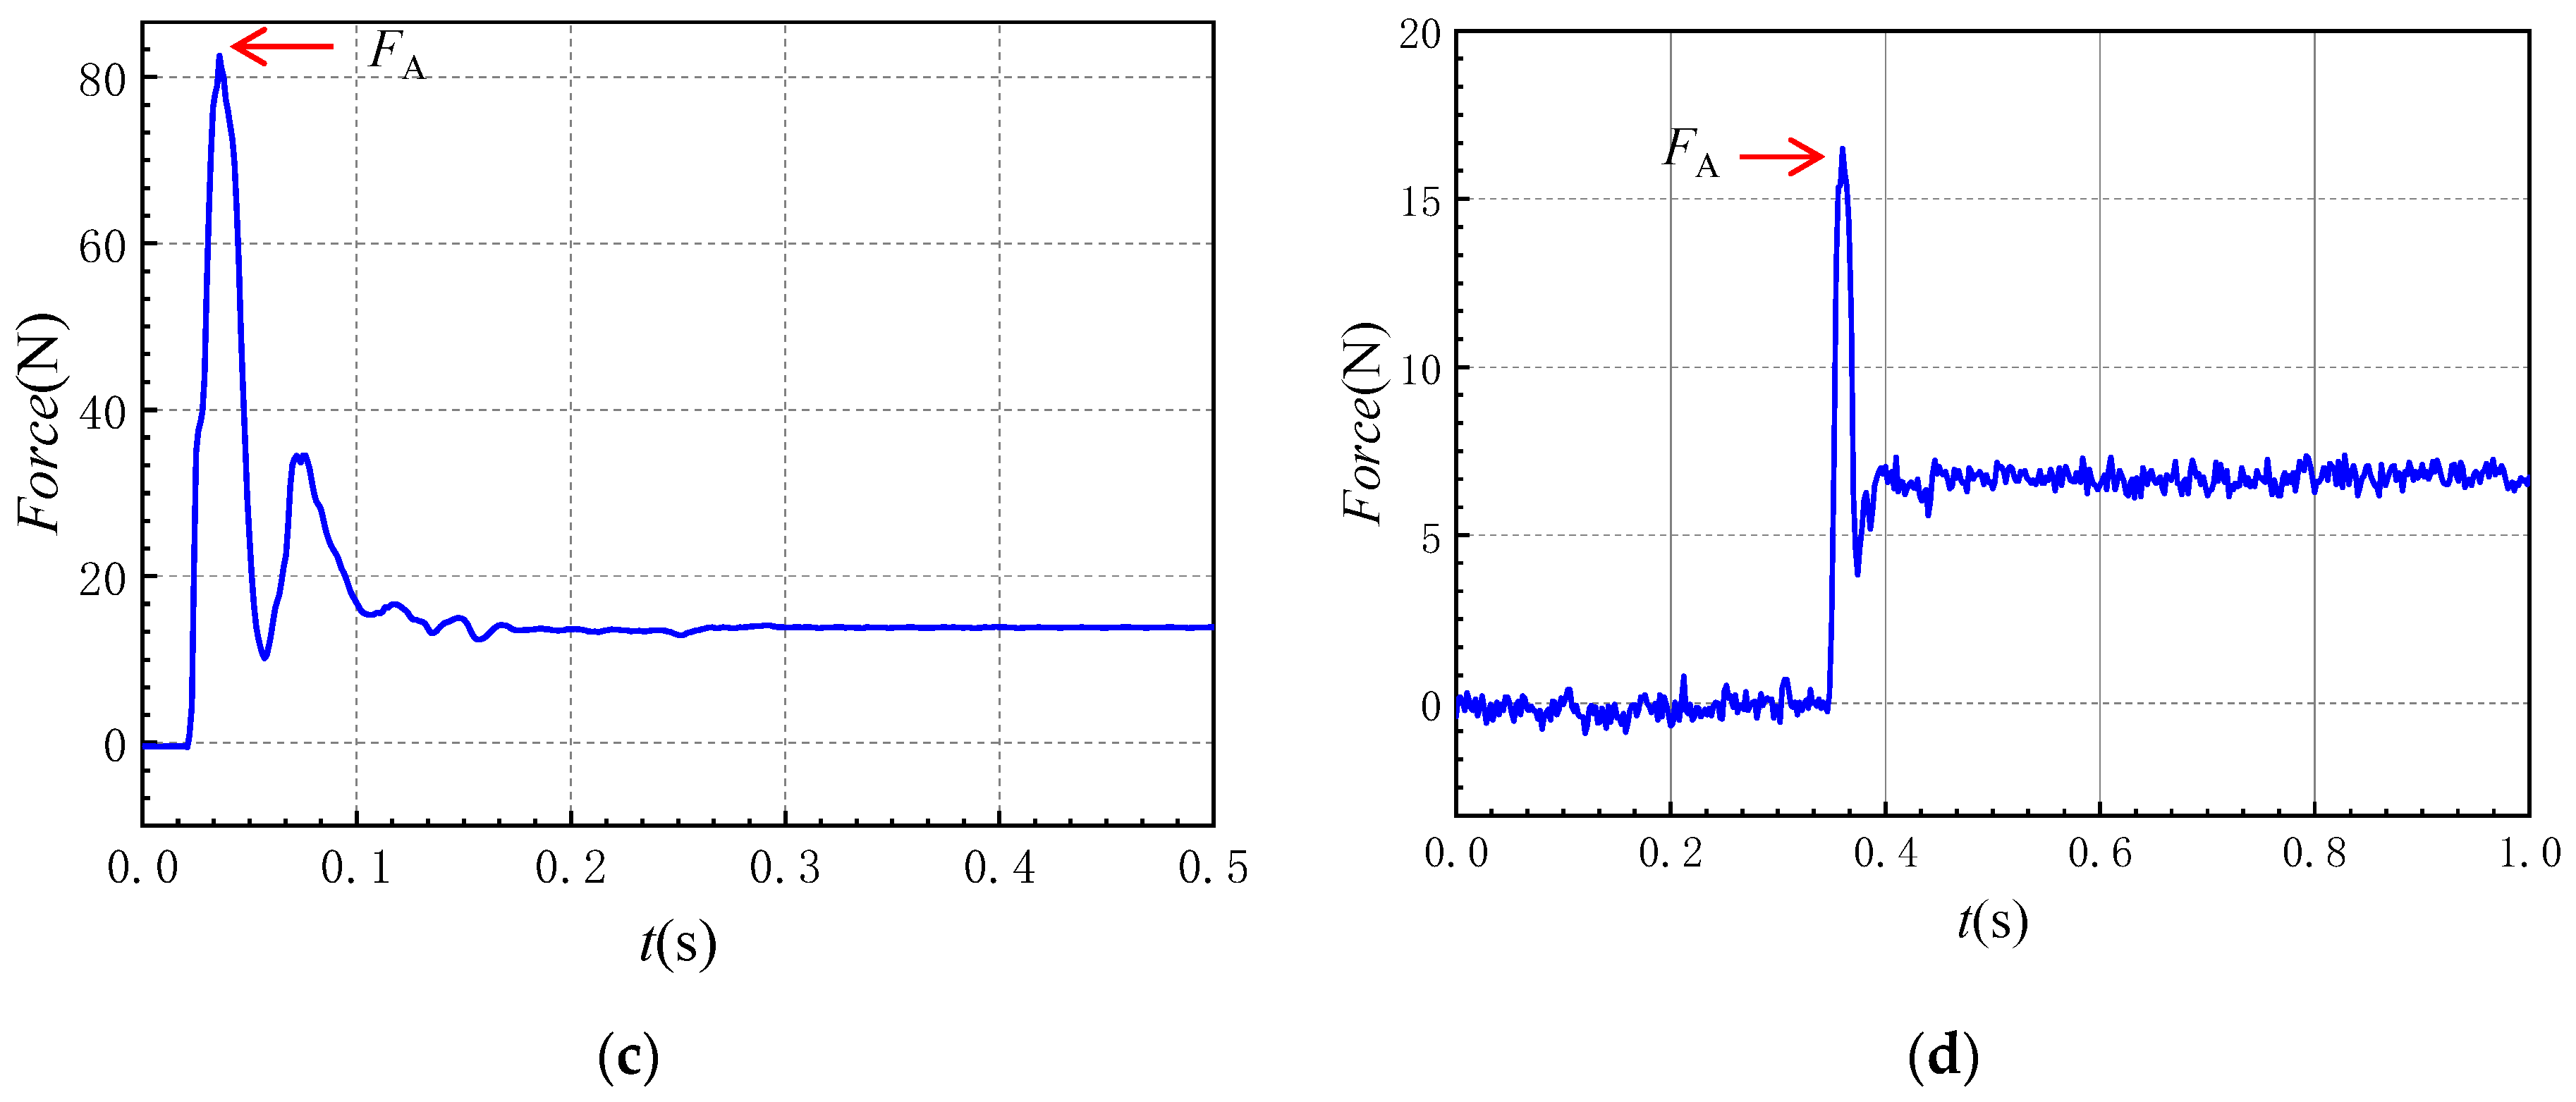
3.3.1. Total Force Sensor Results

After the pipeline is impacted by the dropped anchor, the total force sensor connected to the pipeline records the force exerted on it and outputs the results in the form of a force–time history curve. Figure 10a–d show the time history curves of pipeline impact for test conditions H0, H1, H3, and H4, respectively. From the force–time history curves of these four test conditions, it can be observed that, after the anchor impacts the pipeline or the gravel protection layer, the curve exhibits a distinct peak, followed by oscillations before gradually stabilizing.
Figure 10a shows the baseline condition H0, where the anchor directly impacts the pipeline. The peak force for this condition is FA = 288.83 N and the safety factor for condition H0 is NA = 1. Figure 10b shows the condition H1, with a peak force of FA = 82.54 N. The safety factor for condition H1 is NA = 288.83/82.54 = 3.499. The safety factor is the ratio of the peak force in the baseline condition H0 to the peak force in the target condition. A higher safety factor indicates that the test condition provides better buffering effect against the anchor impact, resulting in a smaller force applied to the pipeline.
Due to the limitations of the small-scale physical model test (with a geometric scale ratio of 15), it is necessary to apply scale transformation to the measured peak force using Equation (19) in order to compare the obtained data with actual engineering conditions or numerical simulation results. Taking condition H0 as an example, the real-scale force FAr is calculated as F A r = F A · λ F = F A · λ L 3 = 288.83 × 15 3 = 974,801   N .

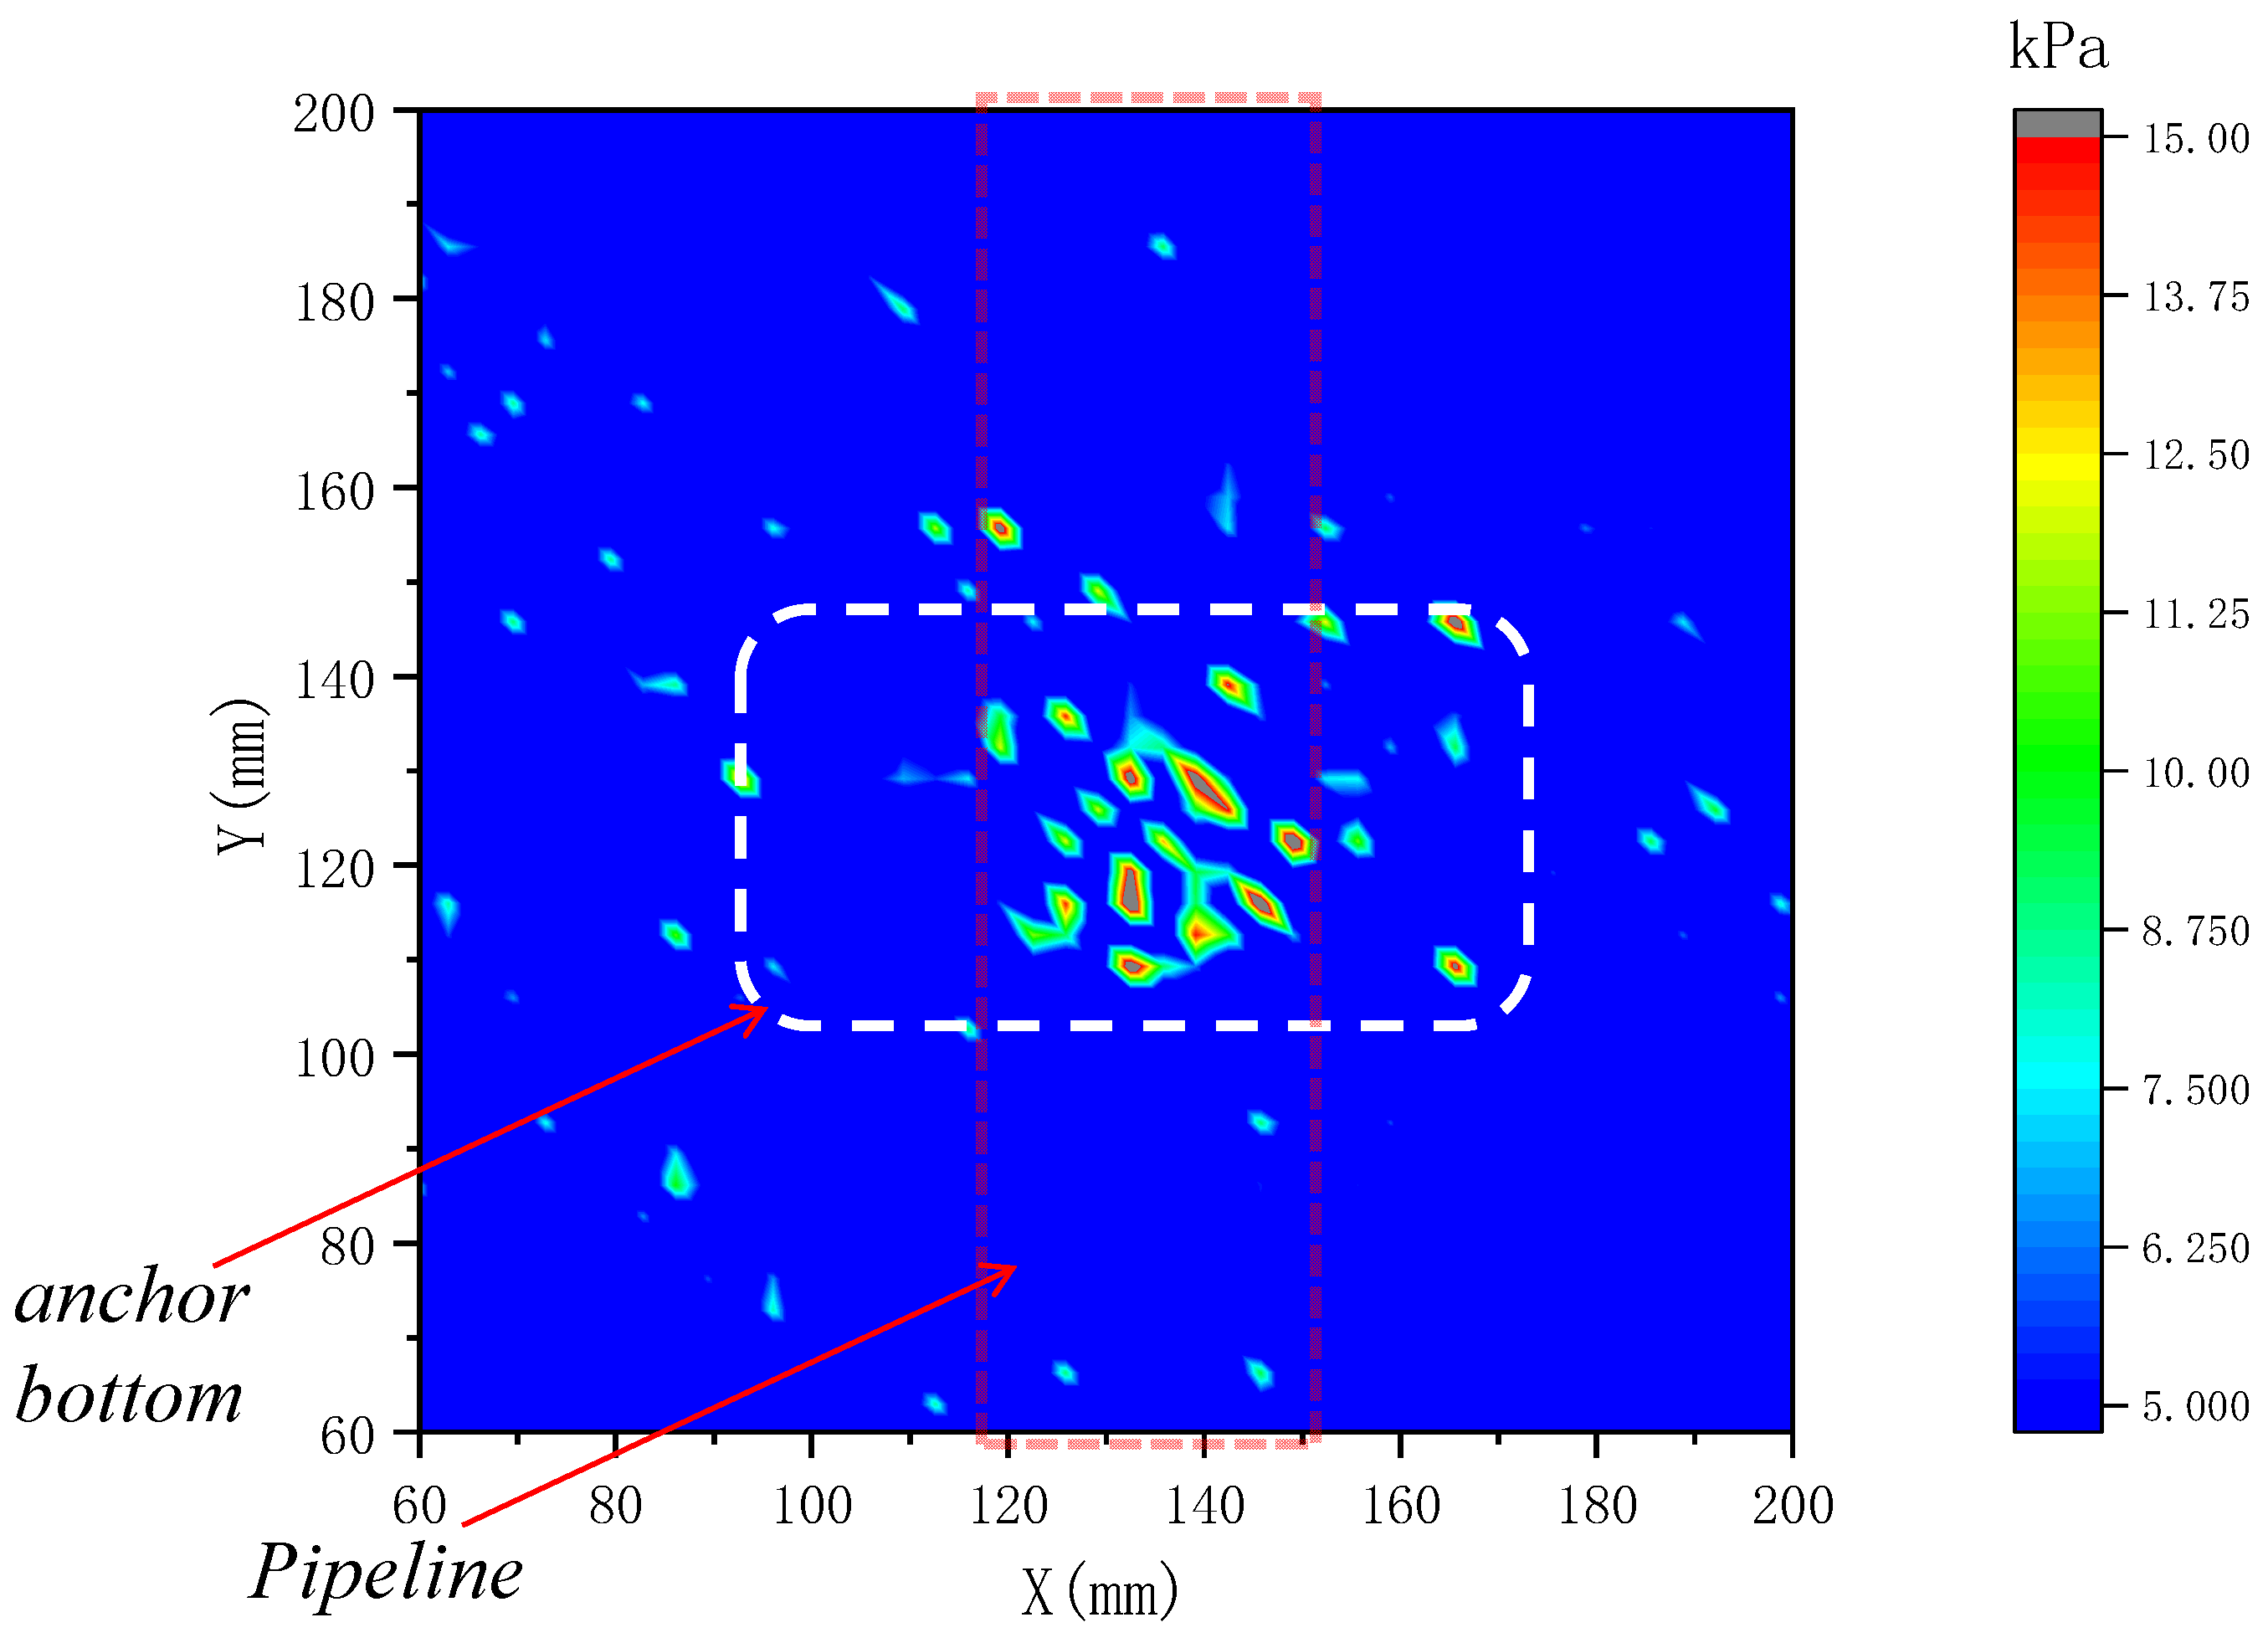
3.3.2. Thin-Film Sensor Results

As shown in Figure 11, the stress contour map collected by the film sensor at the moment of anchor impact in Condition H1 is displayed. The contour map shows that, due to the presence of the rock protection layer, the impact force propagates to the bottom of the test trench in the form of distributed pressure. However, the anchor impact force is mainly concentrated above the pipeline and within the overlapping area below the anchor’s bottom. Compared with Condition H0, where the anchor directly impacts the pipeline, in Condition H1, under the protection of the gravel layer, the anchor impact force is dissipated and spread by the gravel protection layer, resulting in a reduction of 71.4% in the impact force and a 257% increase in the safety factor.

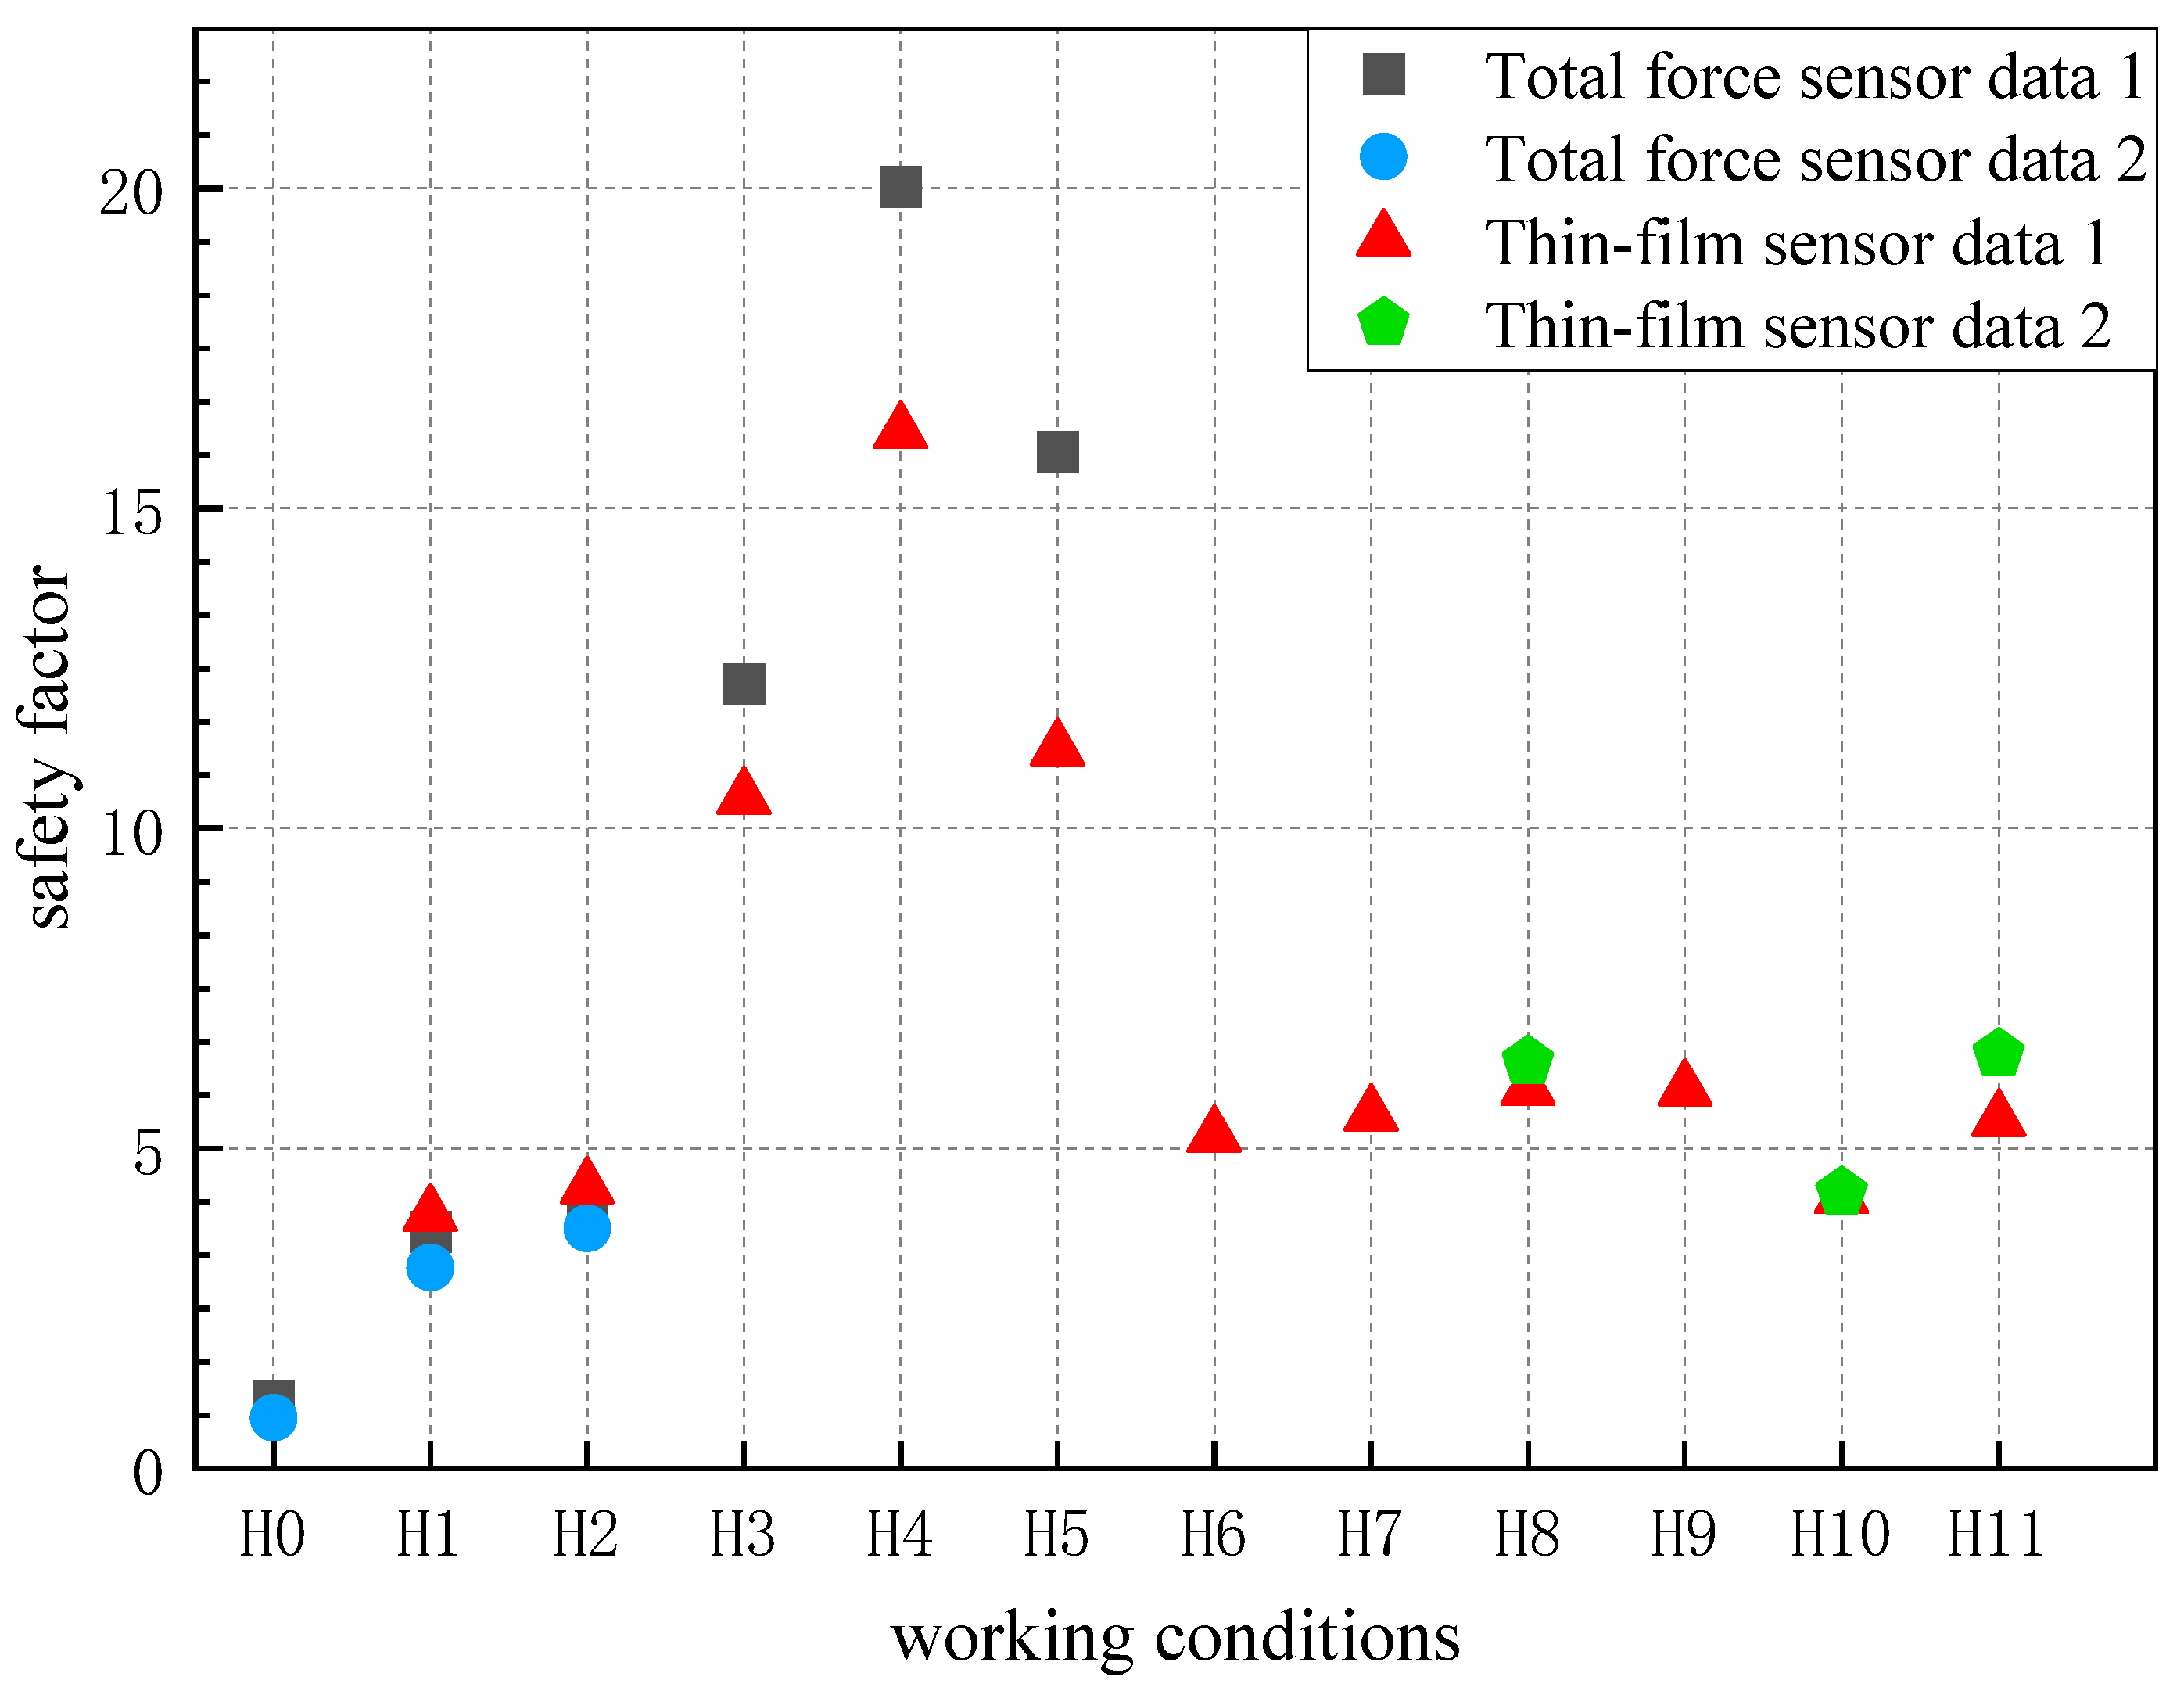
3.3.3. Summary and Analysis of Condition Safety Factors

A total of 11 test conditions and one baseline condition were set for the physical model experiment. The safety factor for the baseline condition H0 is defined as NA = 1, and the safety factor for the target condition Hx is calculated as NA = 288.83/FAx (where x represents the condition number). The safety factors for the other 11 comparison conditions were then calculated. Each test condition was repeated multiple times, and the repeated test results are shown in Figure 12. As seen in the figures, the results of the repeated tests have relatively small fluctuations. In condition H0, although the average impact force did not exceed the ultimate bearing capacity of the seabed pipeline, during multiple tests, some trials showed that the anchor impact force exceeded the pipeline’s ultimate bearing capacity. Therefore, it is essential to implement protection measures other than concrete coating.
Based on the statistical results of the safety factors, the following impacts can be concluded:
  • Influence of artificial backfill layer rock particle size: When the backfill layer thickness is 13 cm (Conditions H1, H2), adding small particle size rock to the protective layer increases the safety factor by 44%. When the backfill layer thickness increases to 26 cm (Conditions H3, H4, H5), the safety factor increases by 16% with the addition of small particle size rock. In cases with soft mud bedding layer (Conditions H6, H7), the increase in safety factor due to adding small particle size rock is not significant, at only 6%. In the case with sandy soil bedding layer (Conditions H8, H9), the protective effect of adding small particle size rock remains largely unchanged. In the case of underlying high-strength clay layers (Conditions H10, H11), adding small particle size rock increases the safety factor by 39.1%. When fully backfilled with 26 cm of medium particle size rock, compared with fully backfilled with large particles (Conditions H3, H4), the safety factor increases by 58%.
  • Influence of artificial backfill layer thickness: When the artificial backfill layer thickness increases from 0 to 13 cm with large particle size rock (Conditions H0, H1), the safety factor increases by 257%. When the thickness is further increased from 13 cm to 26 cm with large particle size backfill, the safety factor increases by 216%. The increase in safety factor shows a linear relationship with the increase in backfill layer thickness.
  • Influence of trench bedding layer type: Among the three different bedding layers (Conditions H6, H8, H10), the safety factor of the soft mud bedding layer is 21% higher than that of the high-strength clay bedding layer, while the safety factor of the sandy soil bedding layer is 18% higher than that of the soft mud bedding layer.

3.4. Numerical Simulation Results and Analysis

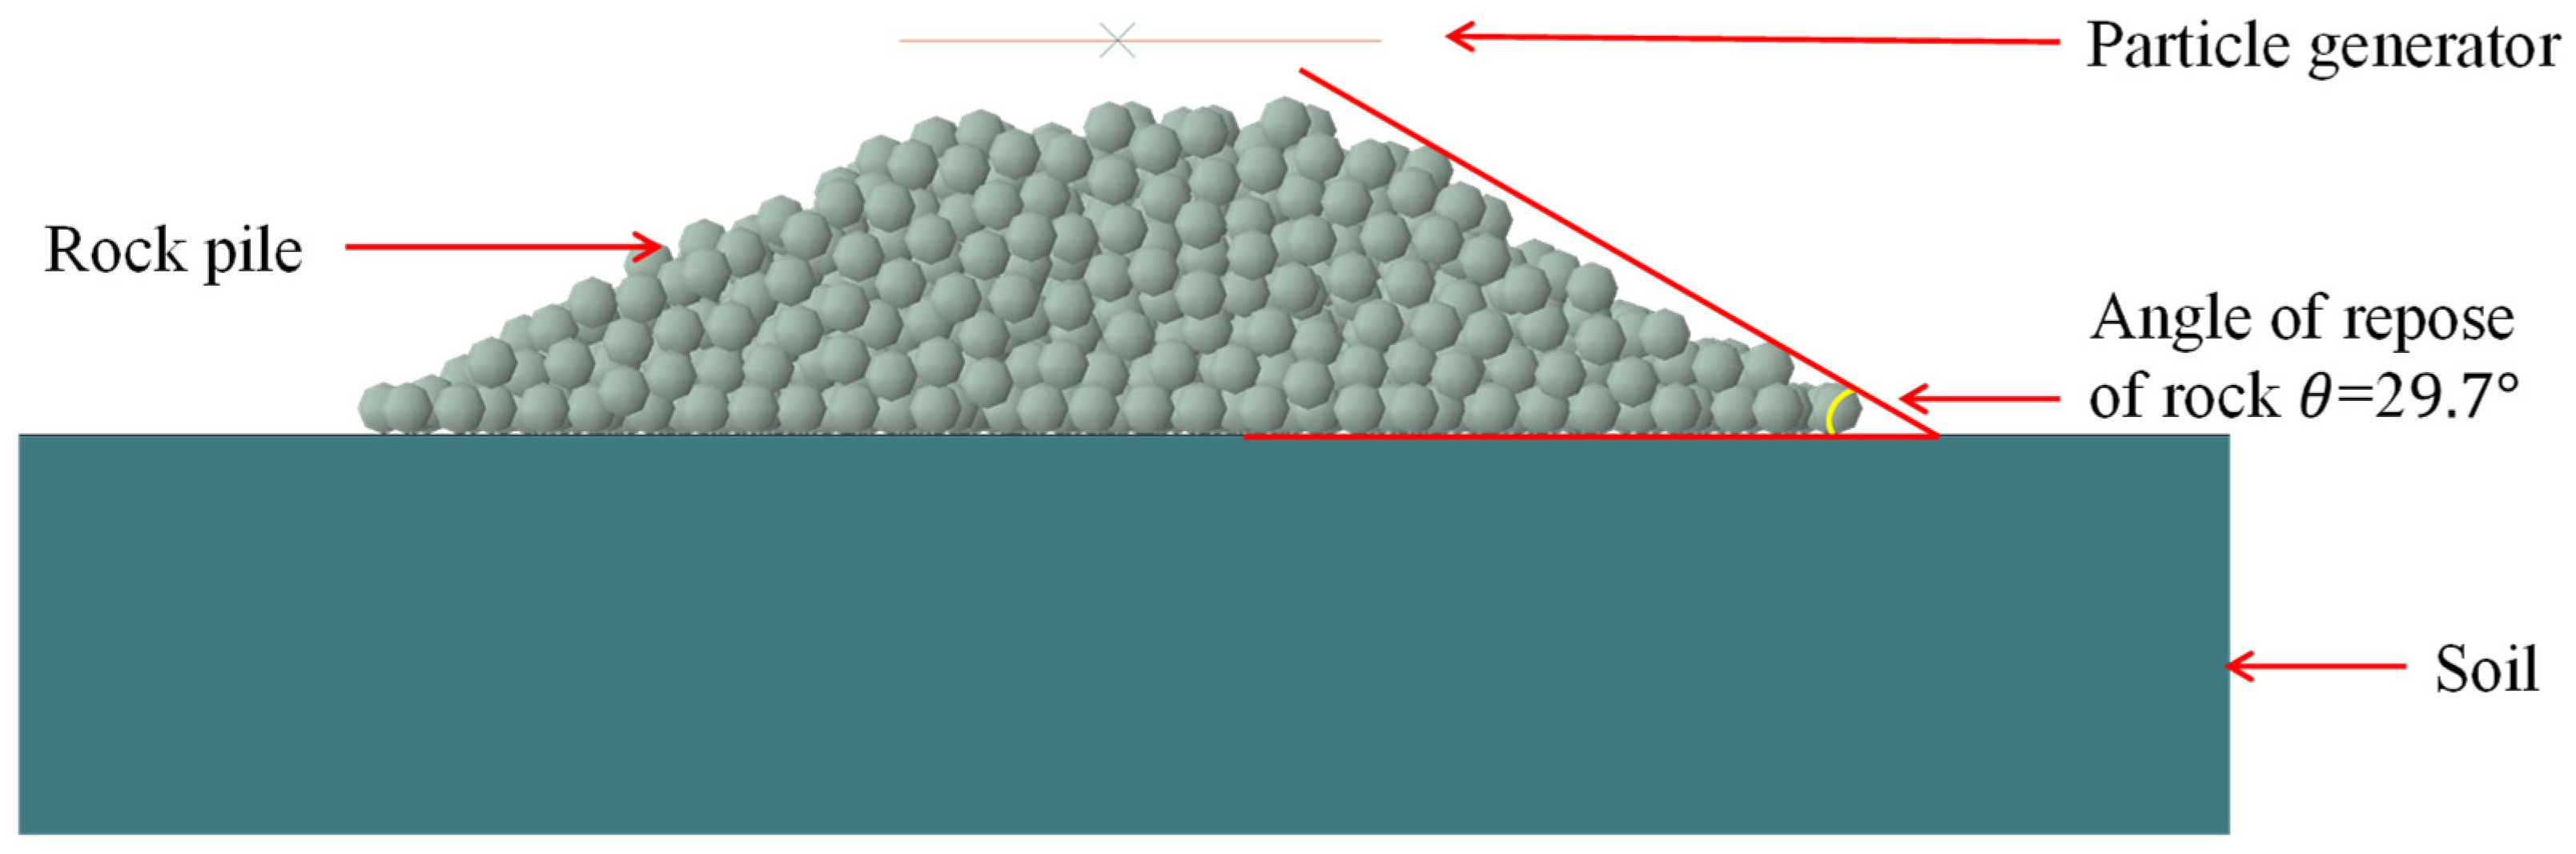
3.4.1. Validation of the Angle of Repose for Rock Pile

The formation of sand piles or rock piles is a common issue in both industrial and agricultural fields, and it is widely applied in case validation within discrete element numerical methods. In this study, the built-in particle generator feature of ABAQUS was used to generate particles that fall freely under gravity to form a rock pile, thereby validating the repose angle. Figure 13 shows the results of the numerical simulation under condition N0, where a particle generator was set above the soil model to generate rock particles, which formed a rock pile under the action of gravity. The repose angle of the pile varies depending on the contact properties and shapes of the rock particles. The particle contact properties were set with a friction coefficient of μ = 0.5, and the measured repose angle of the rock pile was θ = 29.7°, which is consistent with the numerical simulation results for rock piles obtained by Wang Yin et al. [27].

3.4.2. Numerical Simulation Conditions Results and Analysis

The numerical simulation results are also presented in the form of pipeline force–time history curves. Unlike the physical model tests, the numerical simulations are modeled based on the engineering prototype dimensions. Therefore, it is not necessary to apply scale transformation to the numerically obtained FA. The numerical simulation results are shown in Figure 14a–d, corresponding to numerical conditions N1 to N4. Conditions N1 to N4 correspond to physical model test conditions H0, H1, H3, and H4, respectively.
As shown in Figure 14a, the force–time curve of the pipeline subjected to direct impact by the falling anchor in the numerical simulation shows two force peaks, FA1 and FA2. This is because the falling anchor rebounds after striking the pipeline and then strikes it again. As the numerical simulation does not take into account the viscosity of seawater, only FA1 is selected as the result of the force on the pipeline due to the direct impact of the falling anchor in the simulation.
As shown in Figure 14b–d, the force–time curve of the pipeline also shows two force peaks, FR and FA. Here, FR represents the force peak caused by the rock particles generated by the particle generator striking the pipeline, while FA is the force peak caused by the falling anchor impact. Condition N2 has a 2 m thick protective layer, and conditions N3 and N4 have a 4 m thick protective layer. Therefore, the number of rock particles generated in N2 is smaller compared with N3 and N4. As a result, the peak force FR2 in condition N2, caused by the rock particles striking the pipeline, is smaller than FR3 and FR4. From Figure 14c,d, it is clear that the size of FR is non-negligible. Therefore, during the artificial backfilling process of rock, the impact caused by rock striking the pipeline should also be taken into consideration. The paper by Tao Li and others [28] explores the dynamic response of pipelines to impacts from artificial backfilled rock.
Figure 15 shows the peak force FA statistics curve of the numerical simulation conditions N1 to N4 for anchor impact on the pipeline, along with a comparison of the corresponding physical model test peak real force FAr (after scale conversion by Equation (19)). From the figure, it can be observed that the numerical simulation results differ from the physical model test results by less than 15%. Based on the validation of the rock pile repose angle, this further confirms the feasibility of using numerical simulation methods in studying the impact mitigation effect of artificial backfill layers on subsea pipelines.
From Figure 15, it can be observed that, as the thickness of the artificial backfill rock protection layer increases, the peak force FA of the pipeline due to anchor impact gradually decreases. This trend is consistent with the physical model test results, and the increase in the safety factor shows a linear relationship with the thickness of the artificial backfill layer. The protective effect of a medium-grained rock layer is better than that of a large-grained stone layer.
It should be noted that the numerical simulation method used in this study can only simulate spherical particles, which to some extent underestimates the protective effect of the rock layer. This is because irregularly shaped rock particles have interlocking properties that increase the repose angle of the rock pile and reduce the penetration depth of falling objects such as anchors. However, sharp-edged rock may also cause damage to the pipeline’s anti-corrosion layer. Therefore, when there are special engineering requirements, it is necessary to include smaller-grain or fine sand protection layers.

4. Conclusions

This paper introduces the anchor drop impact and weight layer pipeline failure assessment method based on DNV-RP-F107 standards, and provides a detailed derivation process of the scale relationship for physical model tests. The study establishes an experimental platform for the coupling effects of anchor drop, artificial backfill protection layer, pipeline, and soil bedding layer, and conducts a series of tests on the mitigation effects of artificial rock backfill layers on submarine pipeline impact from anchor drops. A corresponding numerical simulation model based on the FEM-DEM method is also developed. The following conclusions are drawn:
  • The experimental results are presented in the form of force–time curves measured by force sensors. The results show that, as the backfill layer thickness increases, the safety factor improvement brought by adding small-particle backfill decreases. When the bedding layer is high-strength clay, the addition of small-particle backfill significantly improves the safety factor, while the effect is smaller with soft mud and sand cushion layers. The buffering effect of medium-sized particle backfill is significantly better than that of large-particle backfill. The thickness of the backfill layer significantly improves the buffering effect in a linear manner. The buffering effect of sand bedding layers is better than that of soft mud bedding layers, while high-strength clay bedding layers perform the worst.
  • The advantage of the FEM-DEM numerical method lies in its ability to effectively simulate the discrete characteristics of the artificial backfill layer’s rock material using the discrete element method (DEM). Additionally, when coupled with the finite element method (FEM), it accurately models the dynamic responses between the artificial backfill layer, pipeline, seabed soil, and the anchor during the impact event.
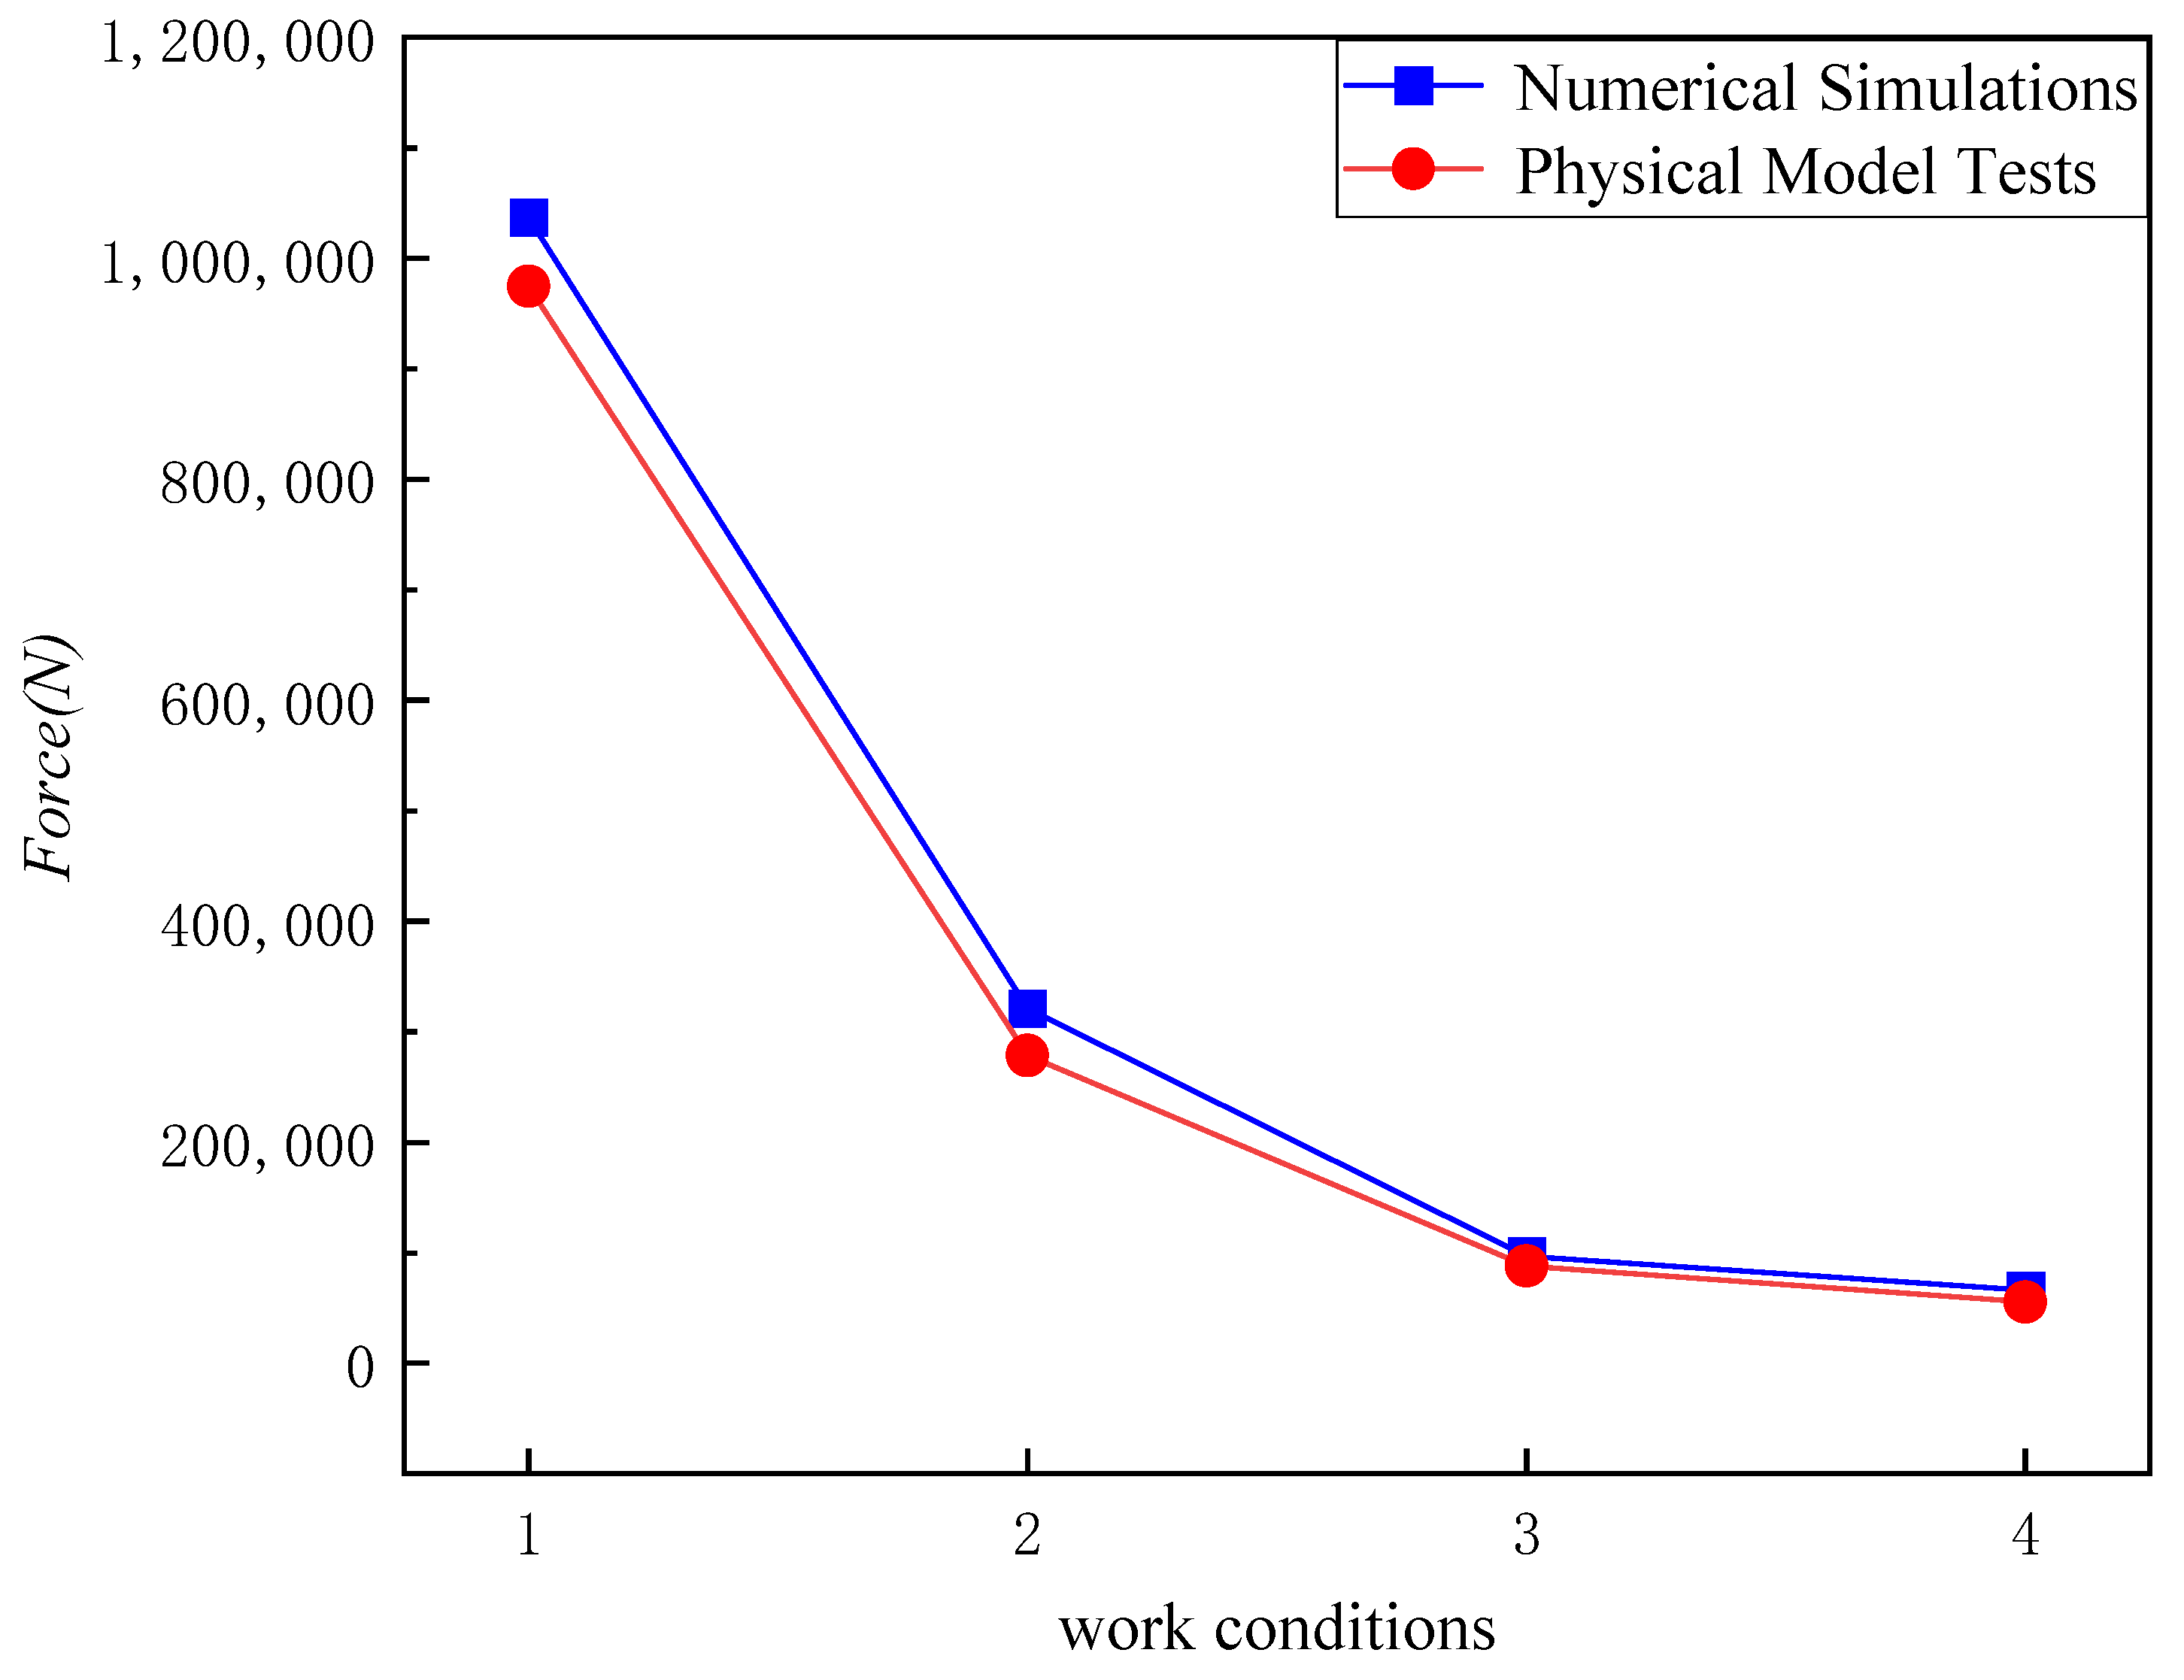
  • The feasibility of the numerical simulation method when studying the impact mitigation effect of artificial backfill layers on seabed pipelines was verified through the rock pile angle case study and four corresponding example cases based on the physical model conditions. The simulation results show that the increase in safety factor exhibits a linear relationship with the thickness of the artificial backfill layer. Additionally, the dynamic response of the rock particles impacting the pipeline during the backfilling process is also significant and should not be overlooked.
  • This study conducted physical model tests and numerical simulations to investigate the mitigation effect of the rock protection layer on pipeline impact. A series of conclusions was drawn to guide engineering applications. However, due to experimental constraints, the scale of the physical model tests was relatively small, making it difficult to accurately capture pipeline deformation. Additionally, in the numerical simulations, the irregular shape of the rock particles was not fully represented, which to some extent underestimated the mitigation effect of the protection layer. These limitations should be a key focus for improvement in future work.

Author Contributions

Conceptualization, L.Y.; Methodology, G.J.; Software, G.J.; Validation, Y.H., D.Z. and Q.Y.; Formal analysis, G.J.; Investigation, Y.H.; Resources, C.H.; Data curation, Y.H. and C.H.; Writing—original draft, G.J.; Writing—review & editing, L.Y.; Visualization, G.J.; Supervision, D.Z. and Q.Y.; Project administration, L.Y. and C.H.; Funding acquisition, L.Y. All authors have read and agreed to the published version of the manuscript.

Funding

This research was funded by National Natural Science Foundation of China (52171252) and National Natural Science Foundation of China (52109115) and Fundamental Research Funds for the Central Universities (DUT22QN236).

Institutional Review Board Statement

Not applicable.

Informed Consent Statement

Not applicable.

Data Availability Statement

Data is contained within the article.

Conflicts of Interest

Author Chunhong Hu was employed by the company “Offshore Oil Engineering Co., Ltd.”. The remaining authors declare that the research was conducted in the absence of any commercial or financial relationships that could be construed as a potential conflict of interest.

References

  1. Dai, L.; Wang, D.; Wang, T.; Feng, Q.; Yang, X. Analysis and Comparison of Long-Distance Pipeline Failures. J. Pet. Eng. 2017, 2017, 3174636. [Google Scholar] [CrossRef]
  2. Liu, Y.; Hu, H.; Zhang, D. Probability Analysis of Damage to Offshore Pipeline by Ship Factors. Transp. Res. Rec. 2013, 2326, 24–31. [Google Scholar] [CrossRef]
  3. Li, J.H.; Kim, J.T.; Lee, M.J.; Jee, S.C.; Kang, H.J.; Kim, M.K.; Kwak, H.W.; Kim, S.B.; Oh, T.W. Water Jetting Arm Optimal Design Consideration for a ROV Trencher. In Proceedings of the OCEANS 2015—Genova, Genova, Italy, 18–20 May 2015; pp. 1–5. [Google Scholar]
  4. Atangana Njock, P.G.; Zheng, Q.; Zhang, N.; Xu, Y.-S. Perspective Review on Subsea Jet Trenching Technology and Modeling. J. Mar. Sci. Eng. 2020, 8, 460. [Google Scholar] [CrossRef]
  5. Fan, Z.; Yu, L.; Han, Y.; Yang, Q. Exploring Trench of Clay with Submerged Moving Circular Vertical Jet: Numerical Analysis. Ocean Eng. 2025, 319, 120216. [Google Scholar] [CrossRef]
  6. Hou, J.; Wei, W.R.; Liang, Y.; Chang, S.J.; Sun, Q.W. Outline of Rock Dumping Protection Engineering for Subsea Pipeline in Deepwater. New Technol. New Process 2015, 6, 79–82. (In Chinese) [Google Scholar]
  7. Yan, S.W.; Guo, B.C.; Sun, L.Q.; Lei, Z.M.; Liu, R. Mechanism and model tests on protection of submarine pipelines using rock armor berms. Chin. J. Geotech. Eng. 2014, 36, 2036–2044. [Google Scholar]
  8. Li, L.; Chen, Z.Y.; Wang, T.F.; Hu, H. Numerical Simulation Study on the Degree of Submarine Cable Protection by Rockfill Against Anchor. J. Civ. Eng. Manag. 2013, 30, 1–5. [Google Scholar]
  9. Zang, Z.P.; Xu, Z.; Zou, X.; Hou, J. Deformation response of a submarine pipeline with rock berm+concrete mattress protection subjected to impact by a drop-ping anchor. Ocean Eng. 2023, 41, 114–126. [Google Scholar]
  10. Li, Q.; Ma, K.M.; Wang, F.L.; Xiong, H.R.; Cui, S.M. Analysis of Resistance to Anchor Damage in Protection Design of Subsea Pipeline at Shipping Lanes. Shipbuild. China 2012, 54, 111–116. (In Chinese) [Google Scholar]
  11. Karamanos, S.A.; Eleftheriadis, C. Collapse of Pressurized Elastoplastic Tubular Members under Lateral Loads. Int. J. Mech. Sci. 2004, 46, 35–56. [Google Scholar] [CrossRef]
  12. Zhang, Y.P.; Zhang, C.H.; Zang, Z.P.; Xu, Y.J.; Li, Q.W.; Xu, Z. Experimental study on the performance of different cover layers for protecting a submarine pipeline from a dropped anchor of the article. J. Water Harbor. 2020, 41, 140–147. [Google Scholar]
  13. Wang, Y.; Huang, J.; Li, L.W.; Deng, Z.Y.; Gu, Y.C. Study on the protection effect of the gravel layer in the channel area on submarine pipelines under hall anchor dropping conditions. Ocean Eng. 2024, 42, 179–189. [Google Scholar]
  14. Jiang, F.; Dong, S.; Zhao, Y.; Xie, Z.; Guedes Soares, C. Investigation on the Deformation Response of Submarine Pipelines Subjected to Impact Loads by Dropped Objects. Ocean Eng. 2019, 194, 106638. [Google Scholar] [CrossRef]
  15. Zeinoddini, M.; Arabzadeh, H.; Ezzati, M.; Parke, G.A.R. Response of Submarine Pipelines to Impacts from Dropped Objects: Bed Flexibility Effects. Int. J. Impact Eng. 2013, 62, 129–141. [Google Scholar] [CrossRef]
  16. Qiu, C.L.; Wang, J.; Yan, S.W. Coupled DEM-FEM analysis of submarine pipelines with rock armor berm under impact load. Chin. J. Geotech. Eng. 2015, 37, 2088–2093. [Google Scholar]
  17. DNV-RP-F107; Risk Assessment of Pipeline Protection. DNV: Høvik, Norway, 2019.
  18. Shin, M.-B.; Park, D.-S.; Seo, Y.-K. Response of Subsea Pipelines to Anchor Impacts Considering Pipe–Soil–Rock Interactions. Int. J. Impact Eng. 2020, 143, 103590. [Google Scholar] [CrossRef]
  19. Dassault Systèmes. ABAQUS 6.14 Documentation; Dassault Systèmes Simulia Corp.: Providence, RI, USA, 2014. [Google Scholar]
  20. Yu, J.; Zhao, Y.; Li, T.; Yu, Y. A Three-Dimensional Numerical Method to Study Pipeline Deformations Due to Transverse Impacts from Dropped Anchors. Thin-Walled Struct. 2016, 103, 22–32. [Google Scholar] [CrossRef]
  21. Jiang, F.; Zhao, E. Damage Mechanism and Failure Risk Analysis of Offshore Pipelines Subjected to Impact Loads from Falling Object, Considering the Soil Variability. Mar. Struct. 2024, 93, 103544. [Google Scholar] [CrossRef]
  22. Jiang, F.; Zhao, E. A Study on the Failure Mechanism of Offshore Pipelines with Corrosion Defects Subjected to Impact Loads from Falling Objects. Ocean Eng. 2025, 318, 120119. [Google Scholar] [CrossRef]
  23. Jiang, F.; Dong, S. Development of a CNN-Based Integrated Surrogate Model in Evaluating the Damage of Buried Pipeline under Impact Loads, Considering the Soil Spatial Variability. Reliab. Eng. Syst. Saf. 2025, 257, 110801. [Google Scholar] [CrossRef]
  24. Hou, F.; Chen, Y.; Yan, Y.; Liu, R.; Li, R.; Liu, Y.; Zhong, R. Structural Response and Damage Assessment Method for Subsea Pipe-in-Pipe Subjected to Anchor Impact. Mar. Struct. 2025, 99, 103714. [Google Scholar] [CrossRef]
  25. Han, C.C.; Chen, X.J.; Liu, J. Model tests on penetration depth of hall anchor. Ocean Eng. 2018, 36, 90–98. [Google Scholar]
  26. GB/T 546-2016; Hall Anchors. Standards Press of China: Beijing, China, 2016.
  27. Wang, Y.; Ai, J.; Yang, Q. CFD-DEM coupled method incorporating soil inter-particle rolling resistance. Yantu Lixue/Rock Soil Mech. 2017, 38, 1771–1780. [Google Scholar]
  28. Li, T.; Xie, P.; Chang, J.; Chen, X. Rock-Pipeline Impact Force and Pipeline Response during Deep-Water Rock Dumping Operation. Mar. Struct. 2022, 84, 103235. [Google Scholar] [CrossRef]
Figure 1. Technical roadmap.
Oceans 06 00022 g001
Figure 2. Concrete coating resisting object impact (left, crater formation; right, cutting). Image taken from DNV-RP-F107.
Oceans 06 00022 g002
Figure 3. Schematic diagram of Hall anchor structure (image taken from GB/T 546-2016, Hall anchor [26], “标志凸块&标志处” means “raised marker”; “A向” means “A direction”).
Oceans 06 00022 g003
Figure 4. Photo of the Hall anchor model.
Oceans 06 00022 g004
Figure 5. Schematic diagram of trench shape.
Oceans 06 00022 g005
Figure 6. Schematic diagram of the anchor drop test setup.
Oceans 06 00022 g006
Figure 7. Photograph of the anchor drop test setup.
Oceans 06 00022 g007
Figure 8. Schematic diagram of the numerical simulation.
Oceans 06 00022 g008
Figure 9. Numerical model of protection layer with different thickness of backfill.
Oceans 06 00022 g009
Figure 10. Force–time history curve: (a) conditions H0; (b) conditions H1; (c) conditions H3; (d) conditions H4.
Oceans 06 00022 g010aOceans 06 00022 g010b
Figure 11. Thin-film sensor force contour map.
Oceans 06 00022 g011
Figure 12. Summary of safety factors for physical model test conditions.
Oceans 06 00022 g012
Figure 13. Validation of the rock pile repose angle in numerical simulations.
Oceans 06 00022 g013
Figure 14. Force–time history curves: (a) conditions N1; (b) conditions N2; (c) conditions N3; (d) conditions N4.
Oceans 06 00022 g014
Figure 15. Summary of peak force in numerical simulation and physical model tests.
Oceans 06 00022 g015
Table 1. Added mass coefficients of objects with different shapes in water.
Object ShapesAdded Mass Coefficients, Ca
Elongated objects0.1–1.0
Box-shaped0.6–1.5
Complex shapes (spherical or complex bodies)1.0–2.0
Table 2. Drag coefficients for objects with different shapes.
Object ShapesFlat and ElongatedBox-ShapedComplex Shapes (Spherical or Complex Bodies)
Drag coefficient, CN0.7–1.51.2–1.30.6–2.0
Table 3. Scale ratio relations of physical quantities in model tests.
Physical QuantityGeometric Dimensions
(L)
Density
( ρ )
Acceleration
(a)
Time
(t)
Volume (V)Impact Force
(F)
Velocity
(v)
Penetration Depth
(z)
Kinetic Energy
(EE)
Potential Energy
(Ep)
Unitmkg/m3m/s2sm3Nm/smJJ
Symbol λ L λ ρ λ a λ t λ V λ F λ v λ z λ e e λ e p
Relation λ L 11 λ L λ L 3 λ L 3 λ L λ L λ L 4 λ L 4
Table 4. Prototype and model anchor dimensions.
Hall Anchor Dimensions
λL = 15
Weighs
(kg)
Hhh1LL1BB1H1IJ
Prototype dimensions15,400405621994833126219912201446680498150
Model dimensions4.56270146.6322081468196453310
Table 5. Scale of rock size.
Trench ShapePrototype Rock SizesScale Ratio λ L Scaled Dimensions
4 m30~45 mm152~3 mm
150~225 mm10~15 mm
330~450 mm22~30 mm
Table 6. The impact energy that the 40 mm thick concrete coating pipeline can withstand.
Anchor ShapeAnchor Weight (kg)Three Times the Concrete Compressive Strength Y (MPa)Width of the Impacting Object b (m)Length of the Impacting Object h (m)Penetration Depth x0 (mm)Ek (KJ)
Hall anchor15,4001051.223.12640870
Table 7. Maximum impact energy EE.
Anchor Weight (kg)Prototype Maximum Fall Velocity (m/s)Added Mass CoefficientMaximum Impact Energy EEEk/EE
15,4008.1725.11851.8 KJ1.02
Table 8. Anchor drop height H.
Anchor Weight (kg)Prototype Maximum Fall Velocity (m/s)Velocity Scale Ratio λvModel Maximum Fall Velocity (m/s)Anchor Drop Height H
15,4008.1723.8732.110.227
Table 9. Physical model test conditions.
Condition NumberProtection Layer and Bedding Layer ConditionAnchor Drop Height H (m)Anchor Weight (g)
H0No backfill protection layer0.2274560
H113 cm large particle size rock
H23 cm small particle size fine sand and 10 cm large particle size rock layered protection layer
H326 cm large particle size rock protection layer
H426 cm medium particle size rock protection layer
H53 cm small particle size fine sand, 10 cm medium particle size, and 13 cm large particle size rock layered protection layer
H6Soft mud bedding layer with 13 cm large particle size rock protection layer
H7Soft mud bedding layer with 3 cm small particle size fine sand and 10 cm large particle size rock protection layer
H8Sandy soil bedding layer with 13 cm large particle size rock protection layer
H9Sandy soil bedding layer with 3 cm small particle size fine sand and 10 cm large particle size rock protection layer
H10High-strength clay layer with 13 cm large particle size rock protection layer
H11High-strength clay layer with 3 cm small particle size fine sand and 10 cm large particle size rock protection layer
Table 10. Numerical simulation conditions.
Condition NumberRock Particle SizeProtection Layer ThicknessRemarks
N00.2-Rock repose angle verification
N1--Anchor directly impacts the pipeline and a comparison is made with the physical model test.
N20.44 mJoint analysis of the impact of rock particle size and protection layer thickness on anchor impact buffering effect, and comparison with the physical model test.
N30.42 m
N40.24 m
Disclaimer/Publisher’s Note: The statements, opinions and data contained in all publications are solely those of the individual author(s) and contributor(s) and not of MDPI and/or the editor(s). MDPI and/or the editor(s) disclaim responsibility for any injury to people or property resulting from any ideas, methods, instructions or products referred to in the content.

