Article

Passive-Tuned Mass Dampers for the Pointing Accuracy Mitigation of VLBI Earth-Based Antennae Subject to Aerodynamic Gust

by
Victor E. L. Gasparetto
1,
Jackson Reid
1 and
Mostafa S. A. ElSayed
1,2,*
1
Department of Mechanical and Aerospace Engineering, Carleton University, Ottawa, ON K1S 5B6, Canada
2
Mechanical and Aerospace Engineering Department, College of Engineering, United Arab Emirates University, Al-Ain P.O. Box 15551, United Arab Emirates
*
Author to whom correspondence should be addressed.
Appl. Mech. 2023, 4(3), 816-840; https://doi.org/10.3390/applmech4030042
Submission received: 1 June 2023 / Accepted: 5 July 2023 / Published: 13 July 2023

Abstract

:
This paper proposes an optimization procedure to achieve the best configuration of multiple degrees of freedom Tuned Mass Dampers (TMDs) to mitigate the pointing error of Very-Long-Baseline Interferometry (VLBI) Earth-based radio antennae operating under aerodynamic gust conditions. In order to determine the optimum sets of TMDs, a Multi-Objective design optimization employing a genetic algorithm is implemented. A case study is presented where fourteen operational scenarios of wind gust are considered, employing two models of atmospheric disturbances, namely the Power Spectral Density (PSD) function with a statistical profile presented by the Davenport Spectrum (DS) and a Tuned Discrete Gust (TDG) modeled as a one-minus cosine signal. It is found that the optimal configurations of TMDs are capable of reducing the pointing error of the antenna by an average of 66% and 50% for the PSD and TDG gust excitation scenarios, respectively, with a mass inclusion of 1% of the total mass of the antenna structure. The optimal TMD parameters determined herein can be utilized for design and field implementation in antenna systems, such that their structural efficiency can be enhanced for radio astronomy applications.

1. Introduction

VLBI Earth-based antennae are commonly utilized in radio astronomy to present high-resolution images of celestial objects originating from space radiation signals, such as galaxies, planets, and nebulas, among others [1,2,3]. The VLBI is essentially a geometrical technique, where a set of Earth-based antennae is used to simultaneously aim to an artificial or natural radio signal source, which passes through a post-processing correlation considering the time delay between the signal arrival in the antennae, allowing the creation of radio images [4].
The pointing accuracy of the antenna systems is a parameter of pivotal importance to obtain high-resolution signals. Several studies have been conducted in order to attenuate the pointing errors, taking into consideration manufacturing uncertainties [5], structural misalignments [6,7], gravity lag [8], or earthquakes [9], among others. Due to the large dimensions of those aerospace structures, they are constantly subjected to atmospheric wind disturbances, therefore minimizing the aeroelastic response is of great interest to allow the maximization of the pointing accuracy [10,11,12,13]. Several researchers have approached the minimization of the pointing error by means of robust control systems employing active [14,15,16] or passive [12] solutions. However, little attention has been given to coupling the aeroelastic effects within the analysis and actually implementing a tailored passive device system that could potentially mitigate the issues with structural efficiency.
Within this scope, the use of TMD systems attached to VLBI antennae could present great advantages in terms of mitigating the pointing error. A TMD device is used in structures with the intent of attenuating their dynamic responses to different excitations [17], and for aerospace structures, their use is mainly related to increasing the structural performance under different operational conditions, thus allowing augmentation of stability and precision [18]. In order to properly operate, the natural frequency of the TMD is tuned to a particular target structure frequency, such that when excited at that frequency, the TMD resonates out of phase with the structural motion [19]. This effect results in the dissipation of mechanical energy, by means of the resonator inertia force that acts upon the target structure.
The inclusion of TMD systems is capable of attenuating aeroelastic responses based on aerodynamic turbulence induced by gust loads. Applied to wind turbine structures, Zhang and Høeg [20] enhanced the attenuation capabilities of a simple translational TMD by including a rotational inertia double TMD (RIDTMD) in the model, in order to damp in-plane vibrations of floating offshore wind turbines. With this inclusion, it is possible to introduce an extra-resonance to the model. Chen et al. [21] compared two configurations of TMD devices, being single and multiple inclusions, applied to attenuate the aeroelastic response of offshore wind turbines. The study concluded that the control efficiency of the single-TMD (STMD) device is superior to the multiple-TMD (MTMD), when large masses are introduced in the structure. Del Campo et al. [22] demonstrated in a very interesting statistical study that by including passive damping systems in land-based wind turbines, such as optimally tuned TMD devices, a fragility reduction of 80% is reached under severe atmospheric turbulence excitations, such as cyclone-induced winds, and is considerably lower for seismic excitations. Regarding the mitigation of flutter oscillations in bridges, Boonyapinyo et al. [23] investigated a model of an STMD and MTMD, using the modal approach, demonstrating that for the correct tuning of the constitutive parameters the buffeting response can be effectively reduced. Lin et al. [24] presented a concept of a TMD capable of simultaneously reducing torsional and vertical buffeting of long-span bridges. The TMD system is tuned to the first two frequencies of the structure, related to the flexural and torsional mode shapes. Other applications of translational TMD devices for mitigation of aeroelastic response are presented in the works of Xu et al. [25], Bi et al. [26], Jiang [27], Ubertini et al. [28], and Kwok and Samali [29]. Thus, it can be concluded that the implementation of TMDs in various engineering applications is effective in the attenuation of their dynamic aeroelastic response. However, it is also found that the existing optimization frameworks for TMDs are insufficient for TMD devices applied to large structures of very high complexity such as the antenna ground stations adopted for the VLBI system. Hence, it is pertinent to develop an efficient optimization framework to determine the optimum design parameters of passive TMD devices applied to a VLBI antenna structure subjected to aerodynamic gust conditions, such that the performance of the control devices can be effectively quantified.
The work is organized as follows: First, the methodology developed is presented, where the optimization framework is discussed in detail, as well as the procedure for decreasing the computational cost of the finite element model. Next, the case study of the VLBI Earth-based radio antenna is presented, where the high-fidelity reduced order model is discussed, as well as the uncontrolled dynamic aeroelastic response of the structure, in terms of the pointing accuracy, taking into consideration 14 different operational scenarios. In sequence, the optimization of the TMD system is introduced, where the parameters utilized for a genetic algorithm are discussed, and the results are presented for the PSD and TDG cases. The last section presents the conclusions of the study.

2. Methodology

This section presents the methodology developed in this work. The procedure developed resorts on the utilization of an in-house developed routines that concurrently run in MATLAB [30] and MSC NASTRAN [31]. This was achieved in order to define the location and properties of the passive control devices, defined as mass, stiffness, and damping properties, and to calculate the dynamic aeroelastic response of the antenna model that is subjected to the aerodynamic gust conditions. The analysis of aeroelastic systems in this study utilizes the Doublet-Lattice Method (DLM), a widely accepted approach in the aerospace industry for investigating the response of structures under unsteady aerodynamics [32]. The DLM divides aerodynamic surfaces into trapezoidal panels, which are further divided into boxes to define the lifting elements on the structure. However, the aerodynamic and structural models are developed independently, and the coupling between the structural and aerodynamic nodes is achieved through splining methods [31]. Both the Davenport Spectrum and one-minus cosine gust model are applied to the VLBI antenna through the defined aeropanels. The wind-gust disturbance is defined as a vector perpendicular to the primary reflector surface, with the mean wind speed parallel to the surface. It is important to note that the splining matrix is identical across all models, ensuring that the aerodynamic forces are transferred consistently to the corresponding structural nodes. To enhance the computational efficiency of the analysis, a high-fidelity structural Reduced Order Model (ROM) is developed employing the Craig–Bampton reduction method (CBRM) [33]. This is a step of the framework that will be mathematically discussed in detail in the following subsections.

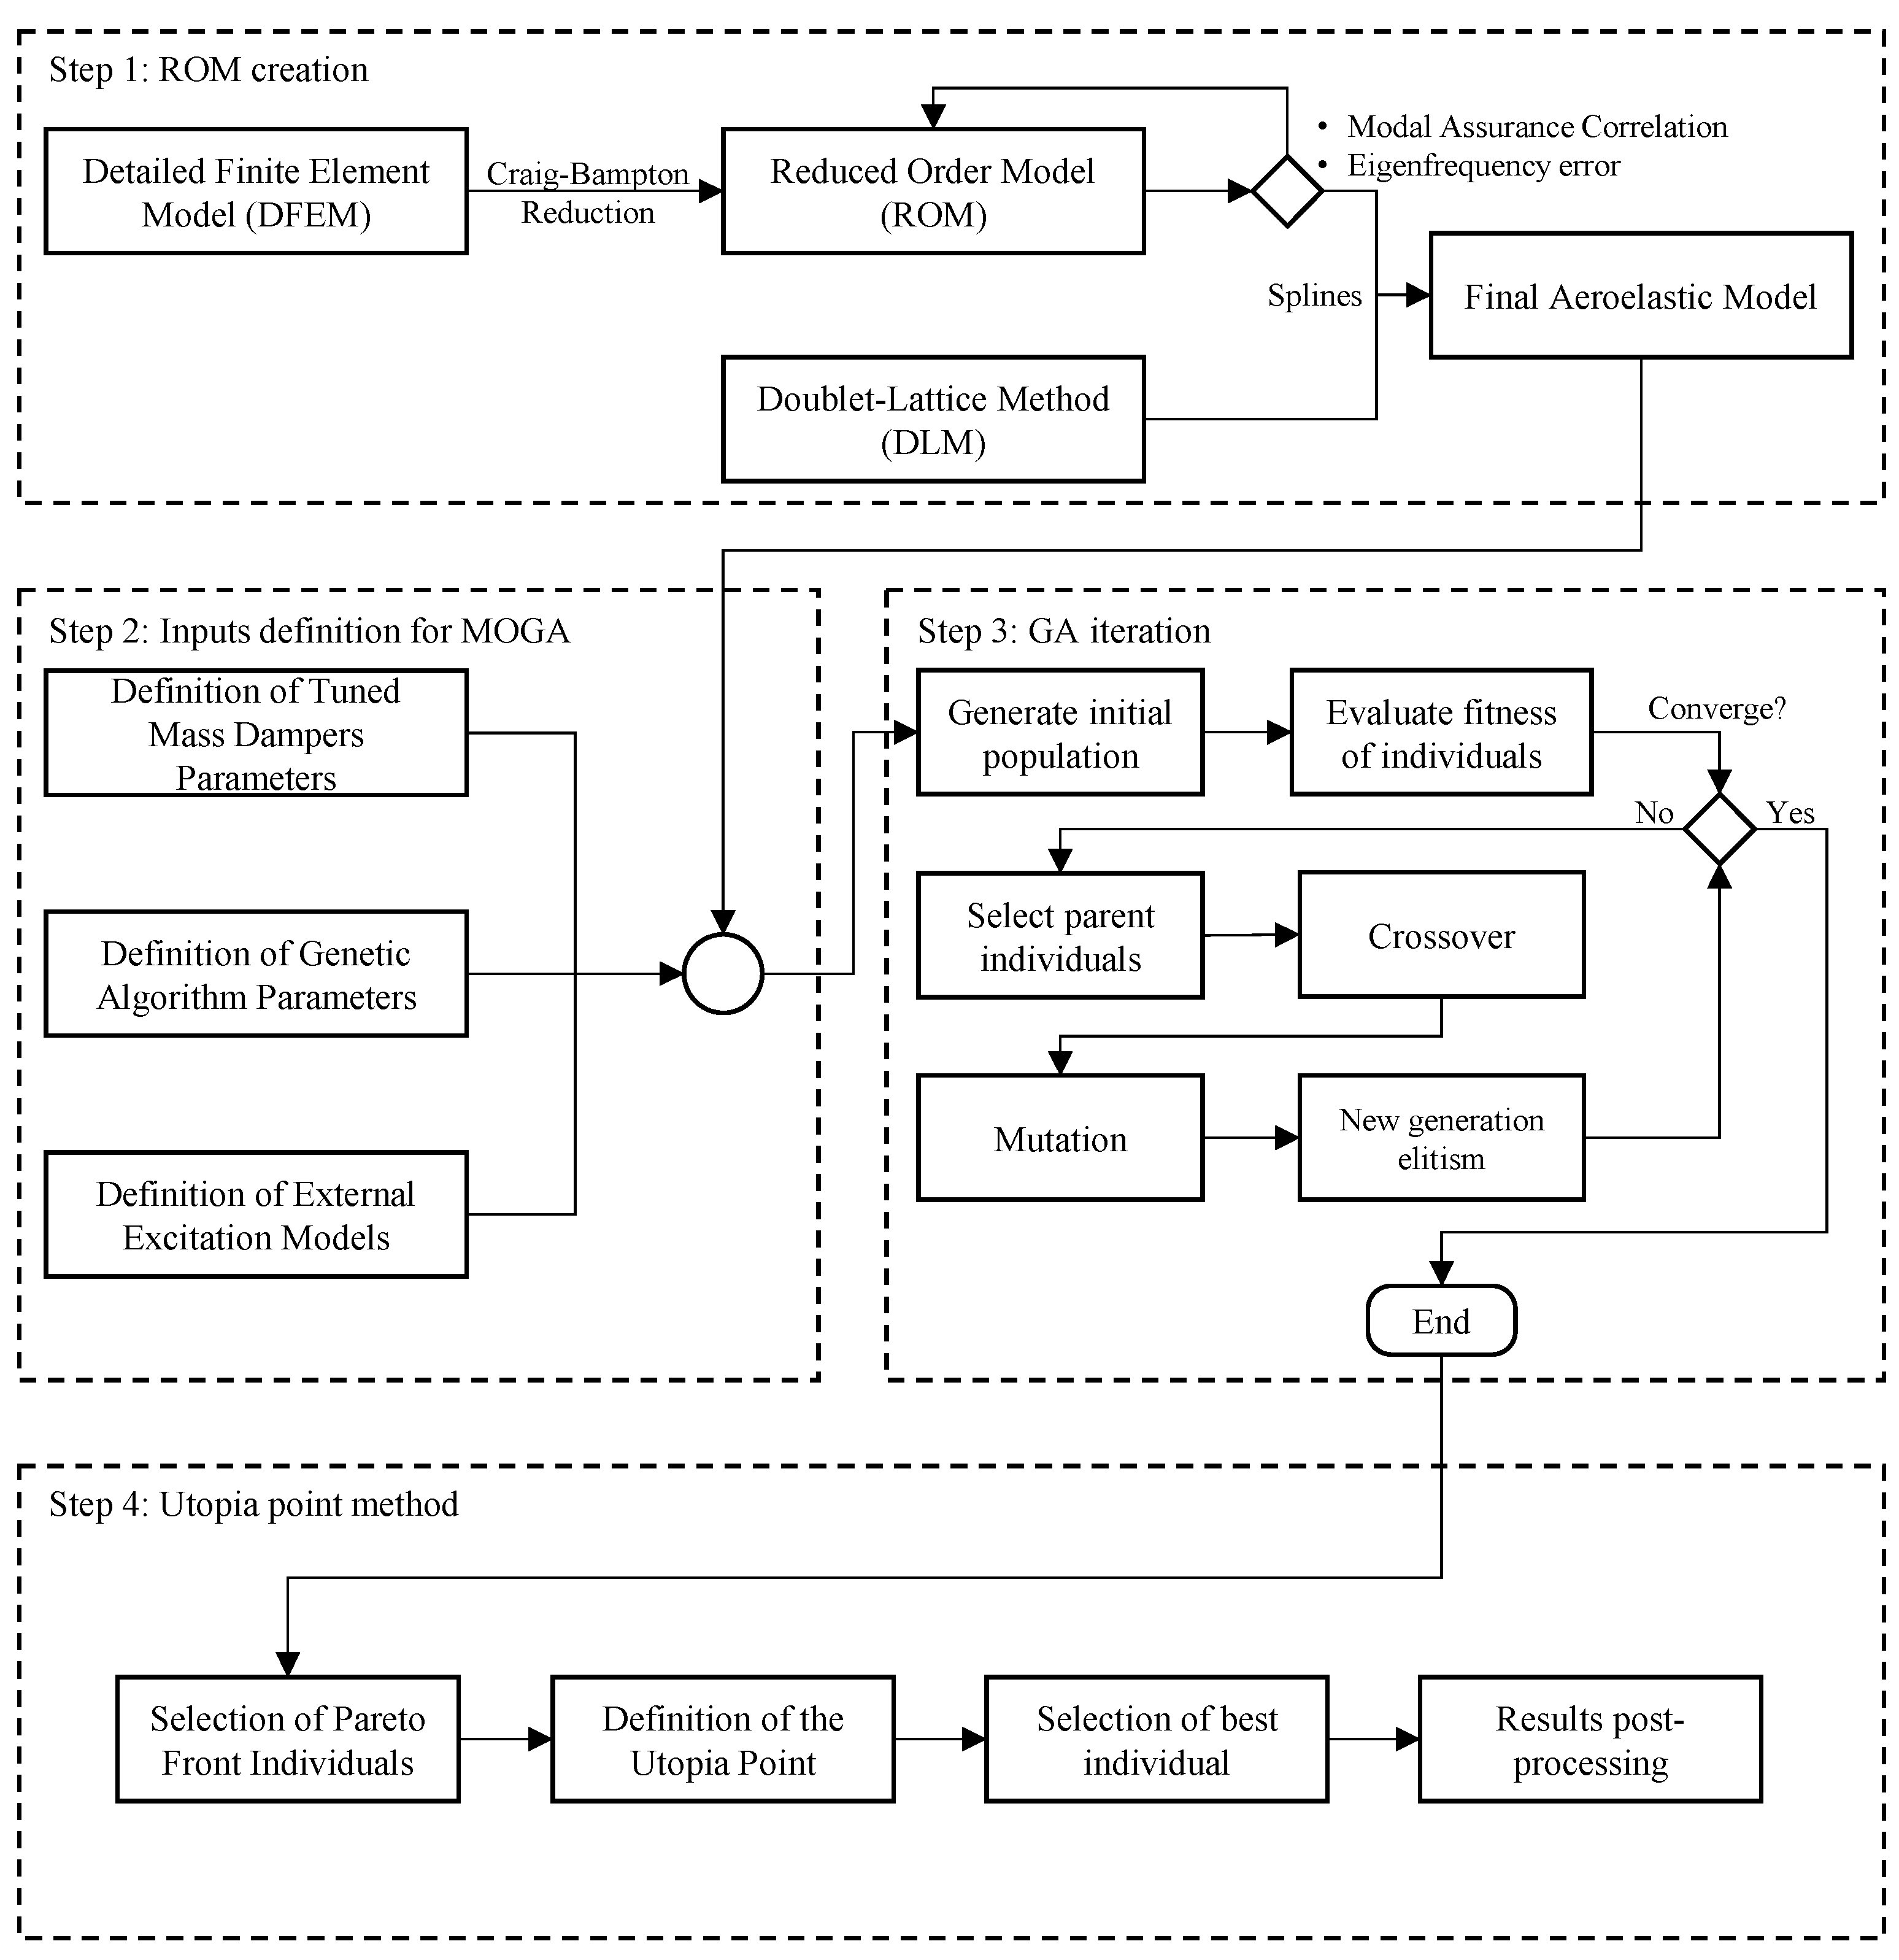
2.1. Optimization Framework

The multi-objective design optimization problem is formulated as follows,
Fitness   function :   Minimize   m T M D Minimize   U f i t n e s s Design   variables :   ξ = m T M D , c T M D , k T M D Constraints :   0 m T M D α × M c T M D m i n c T M D c T M D m a x k T M D m i n k T M D k T M D m a x
where ξ is the design variables vector that contains values for mass ( m T M D ), damping ( c T M D ) and stiffness ( k T M D ) of the TMD considered, the variable n T M D represents the count of TMD strategically attached to structural grid points as determined through the optimization process, and U f i t n e s s is a net output response of the system, for example, computed as the aeroelastic response of a structure subjected to wind gust loads. The variables c T M D m i n , c T M D m a x , k T M D m i n , and k T M D m a x represent the minimum and maximum bounds of the design space of the damping and stiffness parameters from the TMD set analyzed where c and k symbols denote damping and stiffness parameters, respectively. The parameter α represents the upper bound percentage of mass inclusion due to the attachment of the TMD, with respect to the total structure’s mass M .
The framework is divided into four steps, as depicted in Figure 1. The first step consists essentially of the creation of the ROM from the detailed finite element model, by using the CBRM, which can be coupled with the aerodynamic linearization DLM by using the spline theory, generating the final aeroelastic model to be used in the optimization iterations. The second step consists of the utilization of the developed ROM to place and tune the TMD devices and apply the external excitation and boundary conditions. Through the definition of the genetic algorithm parameters, such as crossover and mutation strategies, the elitist multi-objective iterations are defined. The select genetic operators play a critical role in improving the fitness of individuals in each generation of the genetic algorithm. These operators ensure that successful characteristics are effectively transmitted to subsequent generations and introduce genetic variability into the population. Crossover is a probabilistic process where two parent individuals are selected from the population and their genetic material is combined to generate new offspring. The specific crossover method used in the implementation is the fully random crossover, although other crossover methods exist within the literature. Mutation, another genetic operator, introduces further genetic variability by randomly changing the genetic material of one or more individuals within the population. The adaptive mutation method is implemented within the presented optimization framework, which adjusts the mutation rate based on the fitness ranking of individuals. Individuals with lower fitness receive a higher mutation rate, while those with higher fitness have a lower mutation rate. Further details about adaptive mutation are discussed in the work from Libelli and Alba [34]. The third step corresponds to the elitist multi-objective genetic algorithm iterations, which are responsible for determining the best parameter set of the TMD that concurrently minimizes the aeroelastic response and the mass inclusion in the structure. During the optimization procedure, the iterative process of the genetic algorithm continues until the convergence criteria is met. The specified criteria include exceeding the maximum number of specified generations or achieving an average change in the spread of the Pareto front that is below a specified tolerance. Specifically, the latter criterion states that the convergence criterion is met when the spread of the Pareto front exhibits minimal changes and the final spread value is less than the average of the recent spreads. Finally, the fourth step of the multi-objective optimization method determines several sets of feasible optimal solutions according to the constraints defined; however, only a smaller set of solutions can be implemented at a time for a structure. Therefore, to quantitatively determine the best design variables set among the Pareto front points, the utopian point method was used [35]. The utopian point can be found by means of the coordinates of the extremities of the Pareto front, thus defined by values that simultaneously minimize both objective functions. The described method can be formulated to measure the distance between an individual located at the pareto Front, F ( ξ ) , and the ideal point, F 0 , as
d = min ξ i = 1 N w i f i f i 0 q 1 q ,     q N
where d = d ( ξ ) is the calculated minimum utopian metric between the utopian point, F 0 = ( f 1 0 , f 2 0 , f 3 0 , , f N 0 ) = f i 0 , and the Pareto front point, F ξ = f 1 , f 2 , f 3 , , f N = f i , with a total of N objectives. The exponent q essentially defines the degree of the utopian metric and can vary from 1 to +∞, reflecting different penalty weighting for points that are located further away from the ideal point. In the case of the value of q = 2 , the metric is defined by the standard Euclidean distance. The weights w i ,   i { 1 , , N } are defined as individual contributions originated from the objectives, representing a criterion of importance defined by the user [35]. An interesting in-depth discussion about the effects of metric weight selection is provided in the works of Lu and Anderson-Cook [35], Kasprzak and Lewis [36], and Szparaga et al. [37]. For simplicity of solution, in this paper, the weights are set as unitary values, such that the trade-off between objectives is equally balanced. For more details, in terms of mathematical formulation and algorithm description, the reader is referred to the work of Gasparetto et al. [38].

2.2. Structural Reduced Order Model

There is a multitude of methods to define a ROM [39], and the one utilized in this work is the CBRM [33]. The purpose of the use of this method is to determine and remove degrees of freedom that present lower contribution to the final structural response, therefore reducing the size of the matrices to be analyzed. In the CBRM, the primary dynamic system is partitioned into different subsystems, and each of the associated displacement vectors are expressed with a combination of physical and generalized coordinates, where a reduced set of normal modes are used to represent the model. The reduced stiffness and mass matrices of the structure are then determined by a projection in the constructed reduced subspace of the displacement modes and thus are accordingly assembled for the subsystems considered. The CBRM can be formulated from the equation of motion of the system, given in the Laplace domain, using the Laplace operator ‘s’ as
M s 2 + C s + K q s = b u s , y ( s ) = c q ( s )
where the variable y ( s ) is the actual system’s response given as a linear combination c of the q ( s )  generalized degrees of freedom. The matrices M , C , and K are the system’s structural mass, damping, and stiffness. The variable b is a matrix that scales the time or frequency dependent input force, u s . The reduction of the generalized degrees of freedom can be truncated by a subset of degrees of freedom of interest,  q r , and according to the Ritz–Galerkin displacement method [39] is given by
q q r
The derivation of T can be found in the work of Thomas et al. [39] and will not be reproduced herein. Assuming zero virtual work in the dual subspace generated by the transposed transformation matrix T T , the equation of motion of the system can be rewritten as
T T M T s 2 + T T C T s + T T K T q r s = T T b u s , y s = c T q r ( s )
It should be noted that the generalized coordinates, q , can be approximated as linear combination of the retained degrees of freedom, q r , with proportional factors in T , and are independent of the loading scenario that the structure is subjected to. This indicates that the model order reduction is necessary to be defined only once in the analysis, such that the dynamic aeroelastic response is calculated using the defined subset of degrees of freedom characterized by the reduced order. The result form this conversion is the reduction in the computation time of the model, which is a crucial asset when dealing with iterative problems, such as the design of tuned mass dampers for attenuating the aeroelastic response of the structure.
Particularly in the case of a dynamic analysis, it is important to investigate the fidelity of the developed ROM by means of the percentage error in natural frequencies and deviations in mode shapes using the Modal Assurance Criteria (MAC) [40]. The percentage error in natural frequencies is assessed as
e r r o r   [ % ] = ω R O M 1 ω R O M 2 ω R O M 1 × 100
where ω R O M 1 and ω R O M 2 are the referred natural frequencies of the ROM and the parent model. On the other hand, the MAC is formulated as
M A C = Φ R O M 1 r T Φ R O M 2 s 2 Φ R O M 1 r T Φ R O M 1 r Φ R O M 2 s T Φ R O M 2 s
where Φ R O M 1 r is the r-th mode shape of the ROM 1 considered, and Φ R O M 2 s is the s-th mode shape of the ROM 2 considered. The correlation between the mode shapes of the models considered, assessed by this method, should result in an identity matrix, thus indicating an identical comparison and present values close to zero when different mode shapes are compared.

3. Application

This section applies the concepts and the framework presented in the previous section in order to analyze the dynamic aeroelastic response of a 12 m VLBI Earth-based radio antenna that is subjected to different models of atmospheric wind gust excitations. The antenna is primarily composed of steel and aluminum while the precise geometry and composition details remain proprietary information of InterTronic Solutions [41]. First, the ROM from the detailed finite element model (DFEM) is developed, where a comparison of computational cost and normal modes consistency is performed. Then, the multiple aerodynamic gust operational cases are discussed, and the uncontrolled aeroelastic response of the antenna is assessed by means of the pointing accuracy formulation. Finally, the optimization problem is proposed, where the objective functions are discussed and the design variables and constraints are utilized.

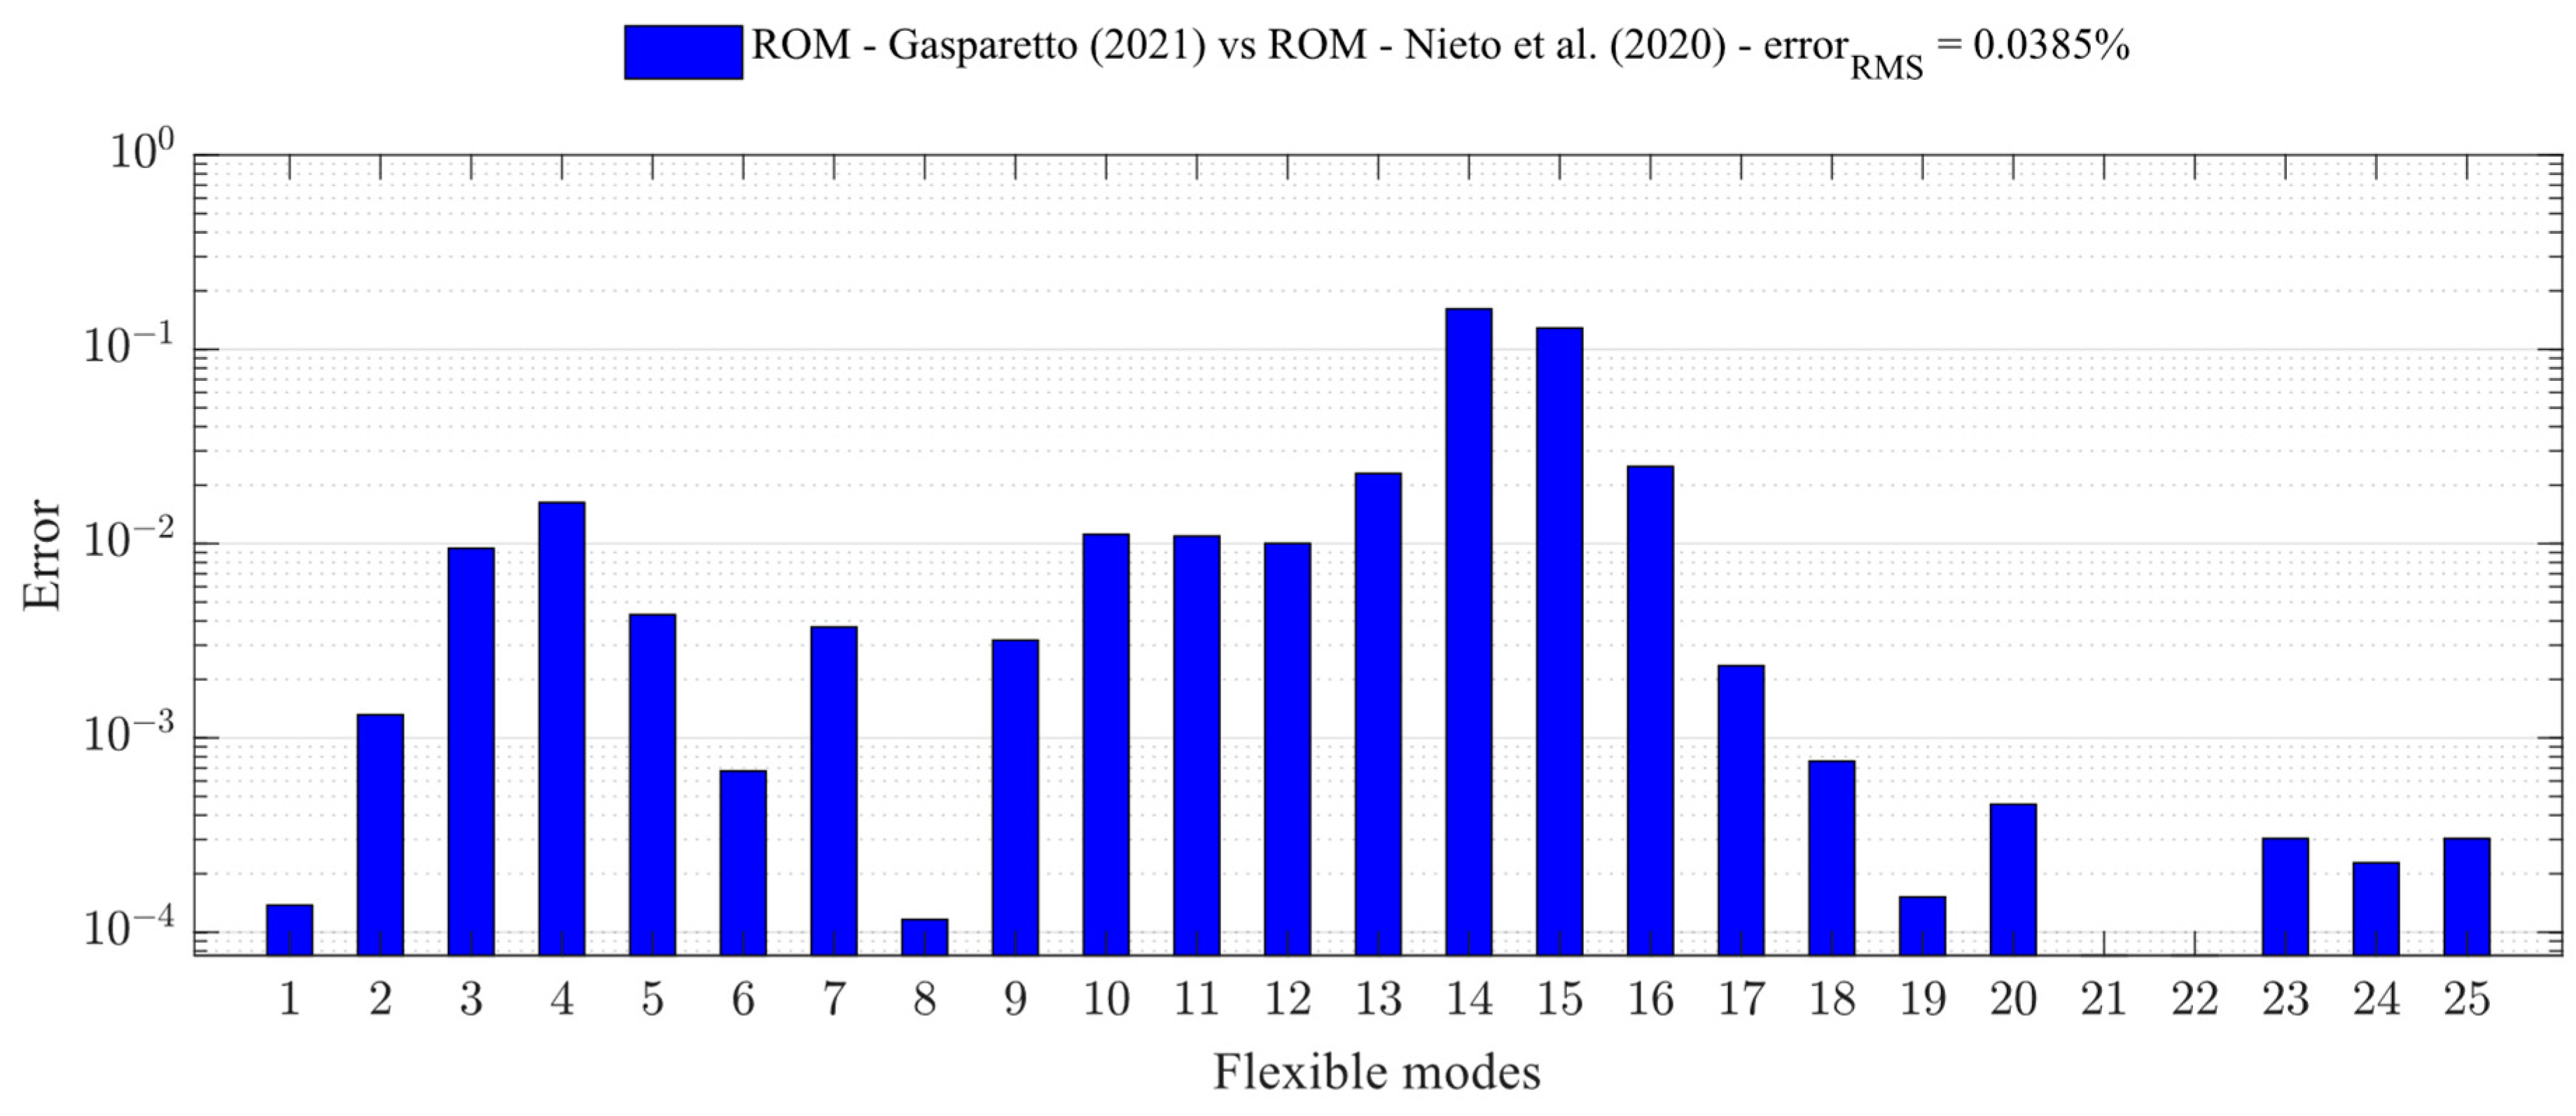
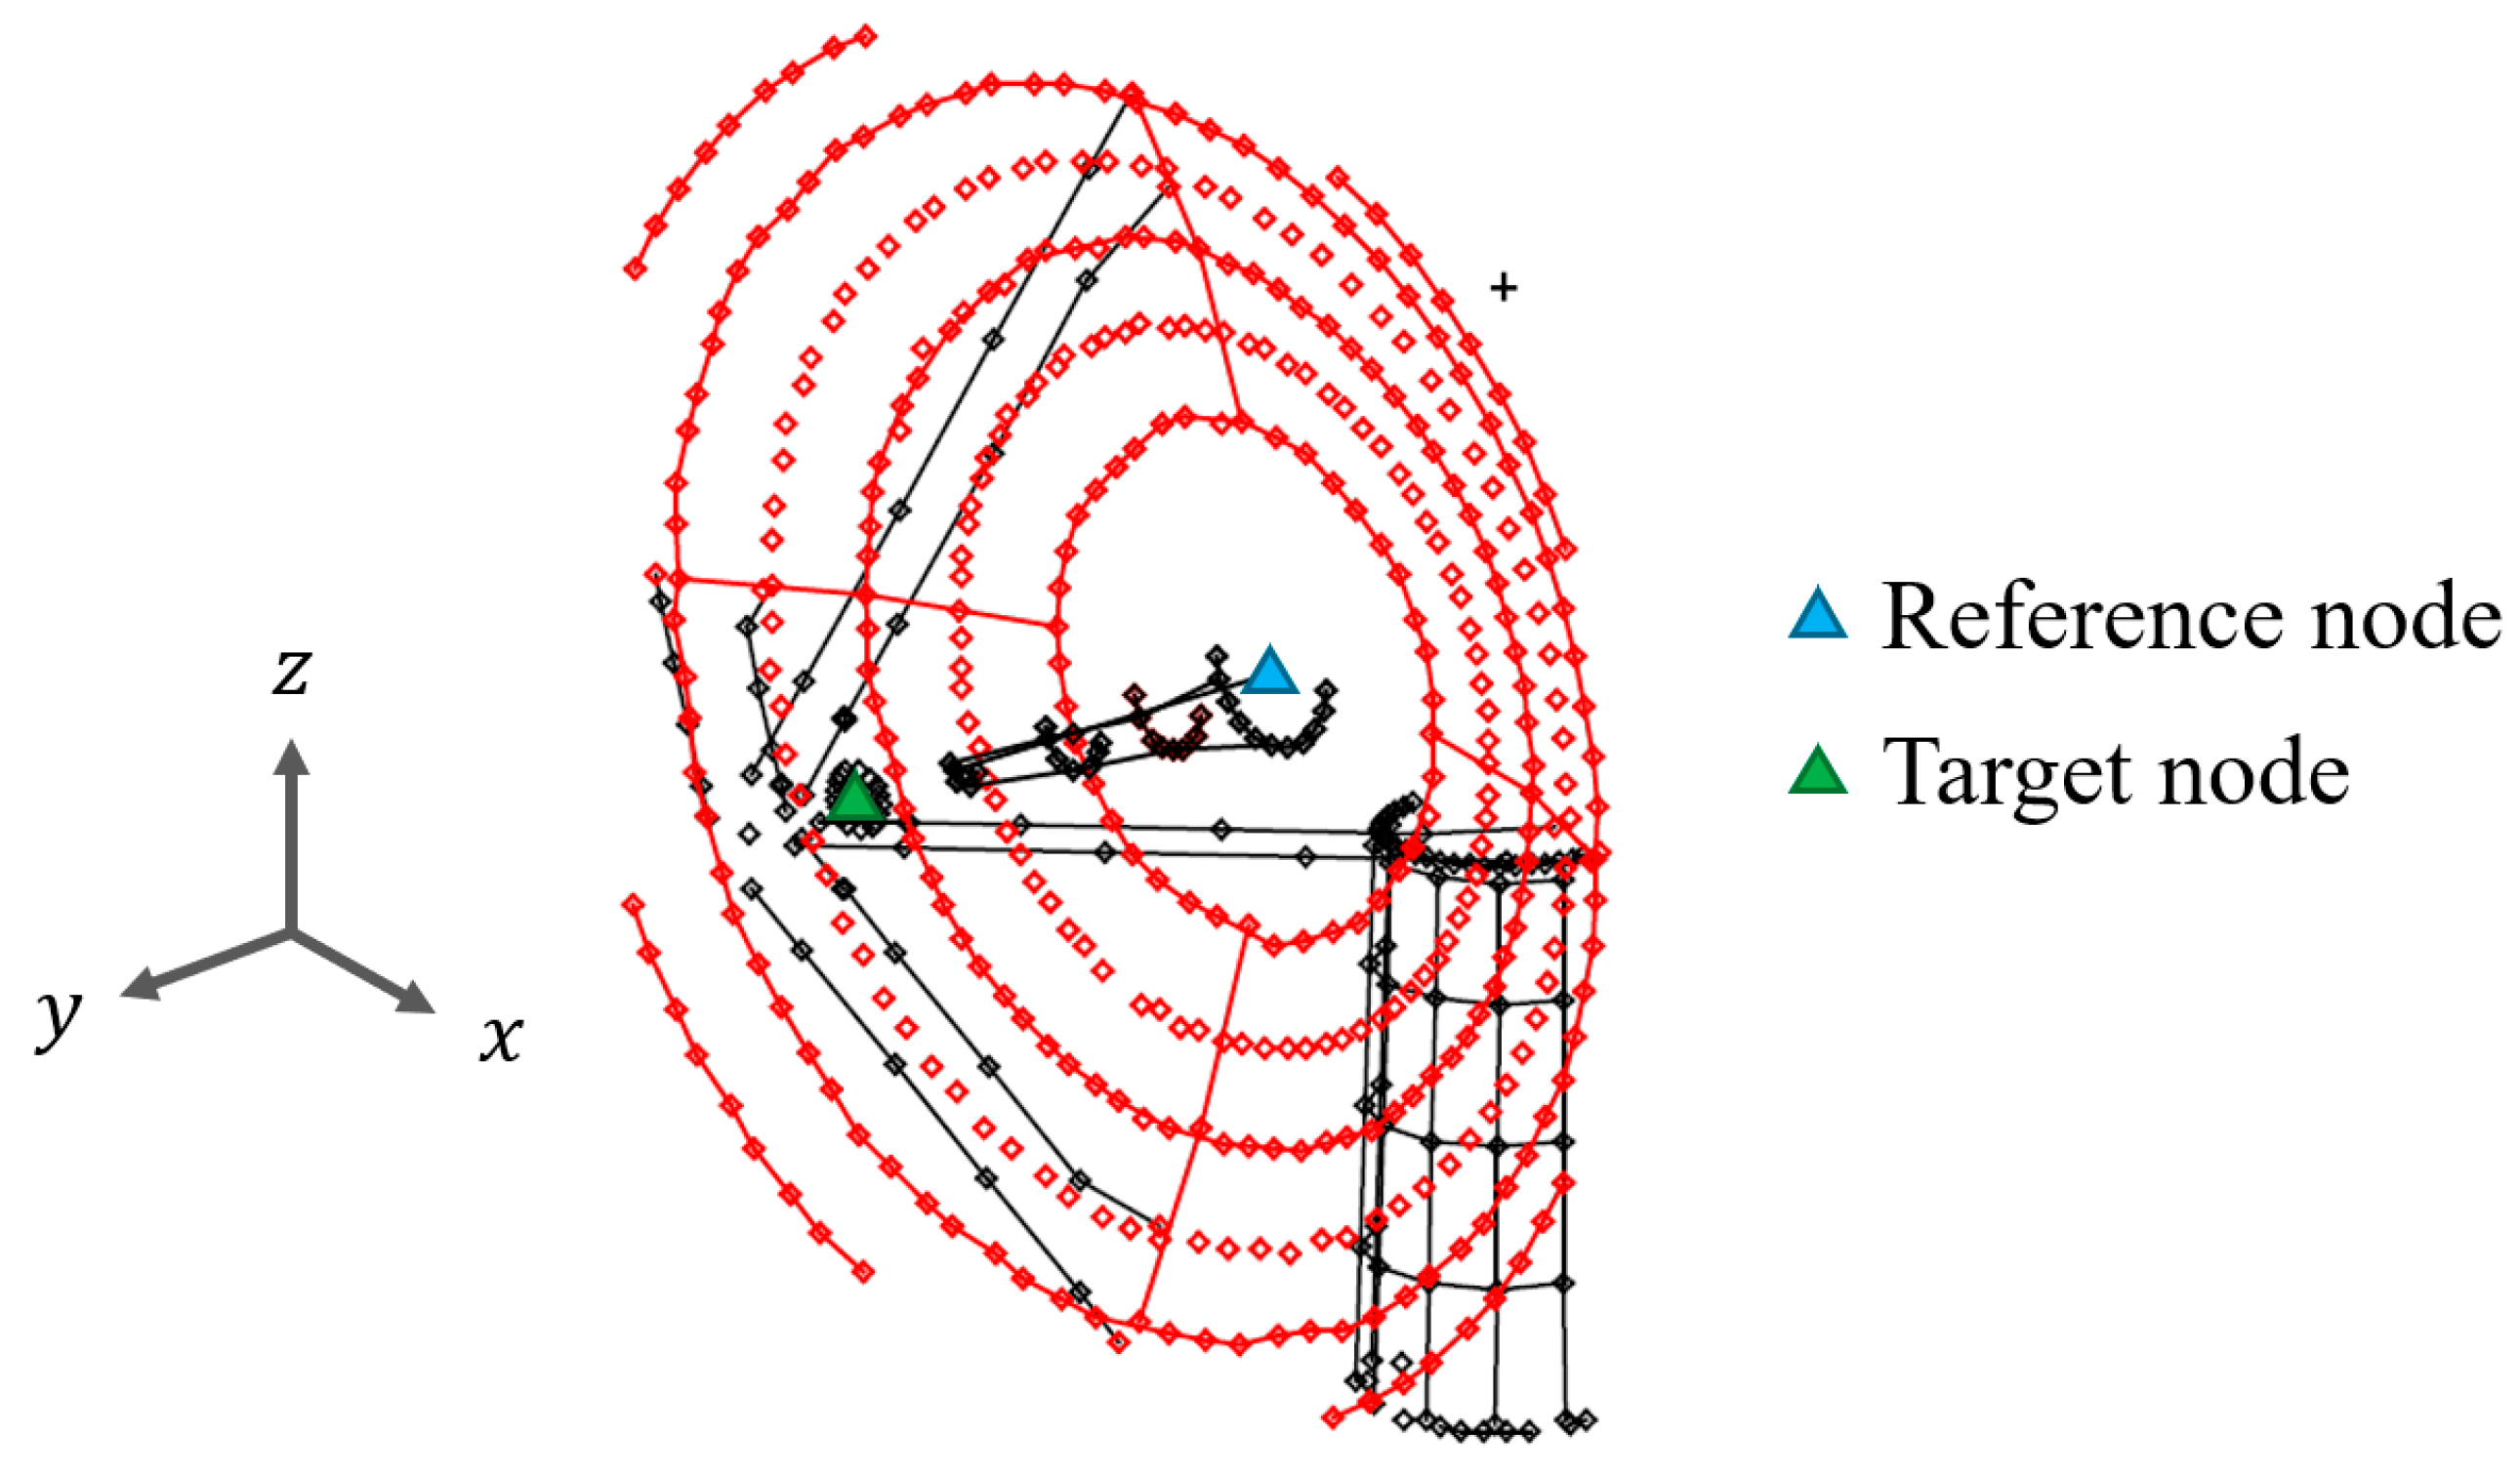
3.1. Reduced Order Model and Normal Modes Analysis

In order to carry the optimization procedure with the finite element (FE) model of the Earth-based Radio VLBI antenna, it is necessary to numerically reduce the DFEM provided by the industrial partner, which is depicted in Figure 2. Here, the previous work of Nieto et al. [42] is followed where we further reduced the dimensions of the model to meet the computational efficiency required for the optimization problem conducted in this paper. To define the Degrees of Freedom of the ROM, the only grids retained are those associated with boundary condition, structural splining, truss-structure of the boom arms that connect the primary and secondary reflector, and the monitoring grid points that were defined in the work of Nieto et al. [42] to compute the pointing accuracy.
Thus, 573 grid points are retained representing a 57% decrease in the Nieto et al. [42] model size. Figure 2 depicts the evolution of the FE model of the VLBI antenna structure. The percentage error calculated between the first 25 eigenfrequencies of the flexible modes from the two ROMs considered herein is shown in Figure 3. The percentage error is assessed with Equation (5), where ω R O M 1 and ω R O M 2 are the eigenvalues from the ROM developed by Nieto et al. [42] and in this work, respectively. From Figure 3, it can be seen that the errors achieved are very low, with RMS evaluated as low as 0.0385%, which indicates high fidelity of the developed ROM.
In order to evaluate the correlation between the mode shapes of the ROMs considered, the MAC is utilized to compare the first 25 eigen vectors and indicate the consistency of the solution. The MAC is given in Equation (6), where Φ R O M 1 r is the r-th mode shape of the ROM developed by Nieto et al. [42] and Φ R O M 2 s is the s-th mode shape of the ROM implemented in this work.
As it can be seen from Figure 4, the normal modes of the new reduced model implemented by the author present good correlation with the model developed by Nieto et al. [42]. A small loss of correlation was observed between the mode shapes 17 and 18, which represents an inversion of the order of appearance of such mode shapes. Nevertheless, despite this inversion, these mode shapes still represent full consistency with each other, as indicated by the MAC matrix values.
The solution time comparison for both models is presented in Table 1. The simulations were benchmarked in a workstation with an Intel® Core™ i7-7700K CPU 4.20 GHz with four cores and RAM 32 GB. It was possible to reduce the computation time of the modal analysis by 73% and that of a dynamic aeroelastic analysis by 66%, from the original ROM. Thus, given the considerable reduction of computation cost achieved for the new ROM and its proven fidelity to the original ROM and DFEM, it will be utilized in further analysis to minimize the pointing error caused by aerodynamic excitations.

3.2. Uncontrolled Dynamic Aeroelastic Response of the VLBI Antenna Structure

Following the methodology developed by Nieto et al. [42], the primary and secondary reflectors of the VLBI antenna are considered as the main aerodynamic surfaces in this aeroelastic model. Details of this model are outlined in Nieto et al. [42].
As shown in Figure 5, the pointing accuracy of the antenna is assessed by means of a geometrical analysis considering the deviation angle of a reference node, which is located at an imaginary static point at the center of the primary reflector, with respect to a target node, which is defined at the center of the secondary reflector. The fixed distance between the two defined monitoring nodes is measured as Δ L = 240.4   i n and is used throughout the analysis. The set of the following equations presents the computation of the pointing accuracy of the antenna structure:
X = tan 1 Δ x Δ L ,     Y = tan 1 Δ y Δ L ,     Z = tan 1 Δ z Δ L U R S S Q = X 2 + Y 2 + Z 2
where Δ x , Δ y , and Δ z represent the relative displacement of the target node with respect to the initial position in the directions x ,   y , and z . The parameters X , Y , and Z refer to the pointing angle in the referred directions. U R S S Q is the root sum of squares (RSSQ) of the pointing angles, therefore being named as the net deviation angle.

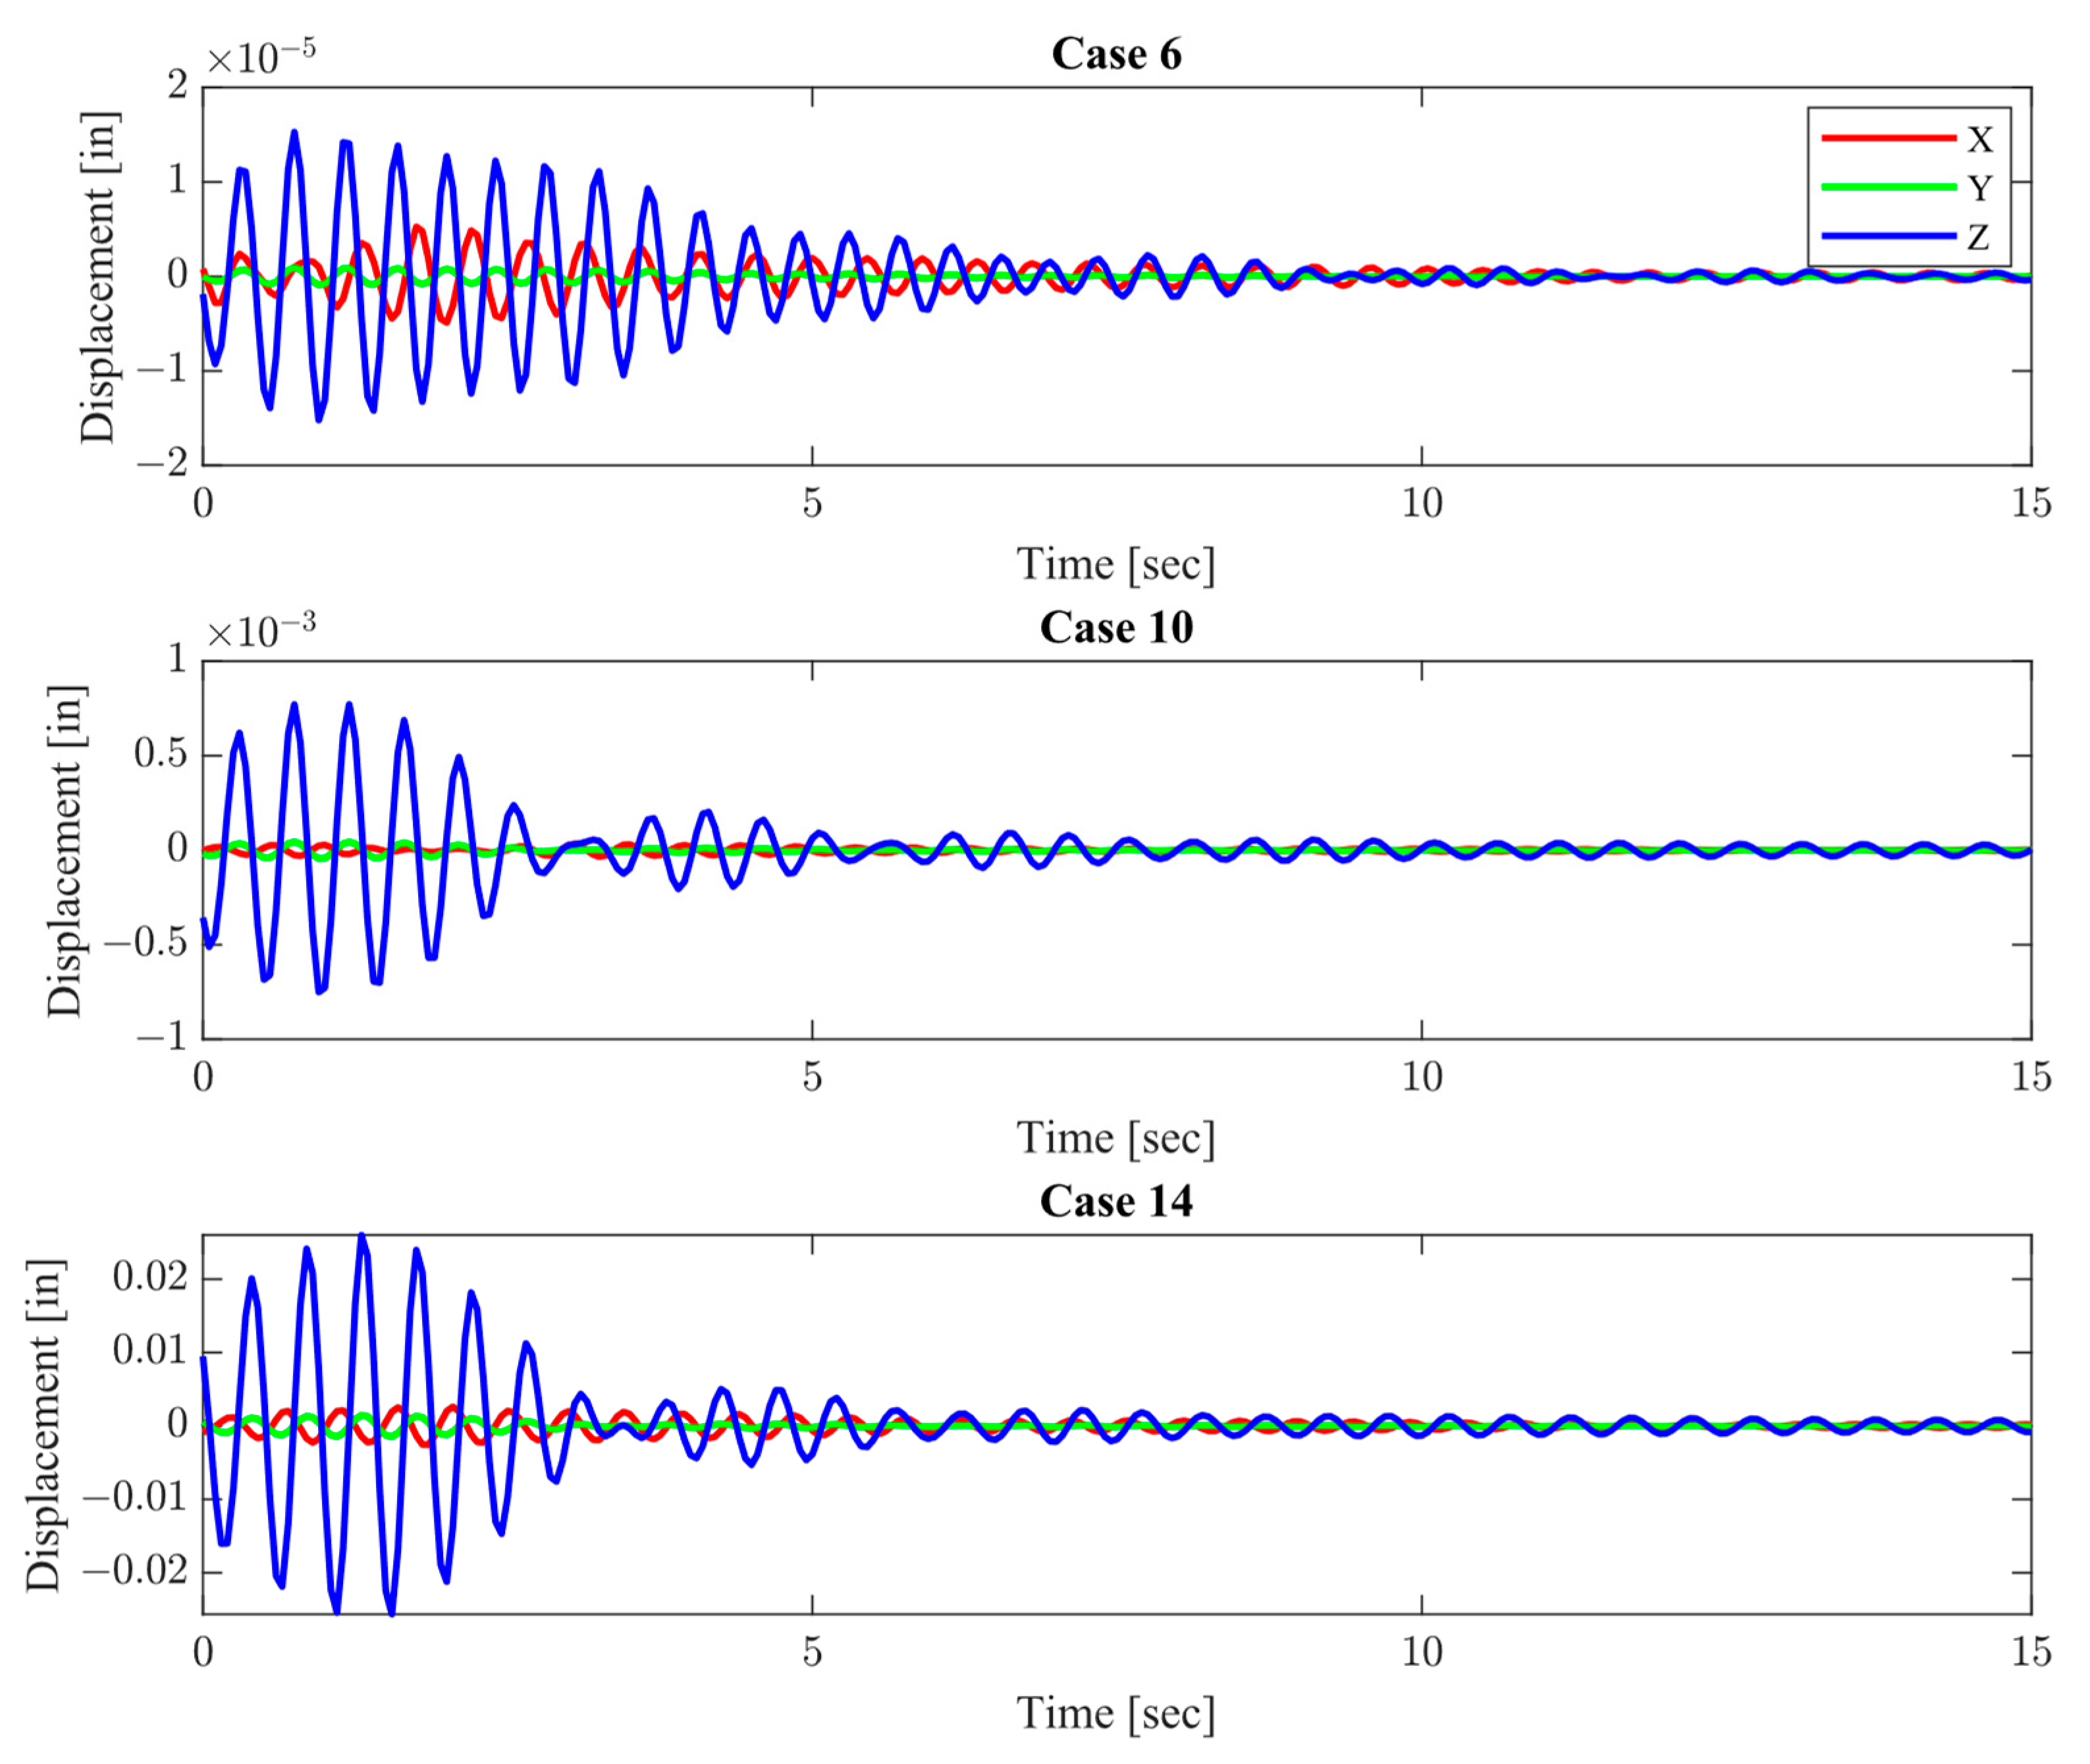
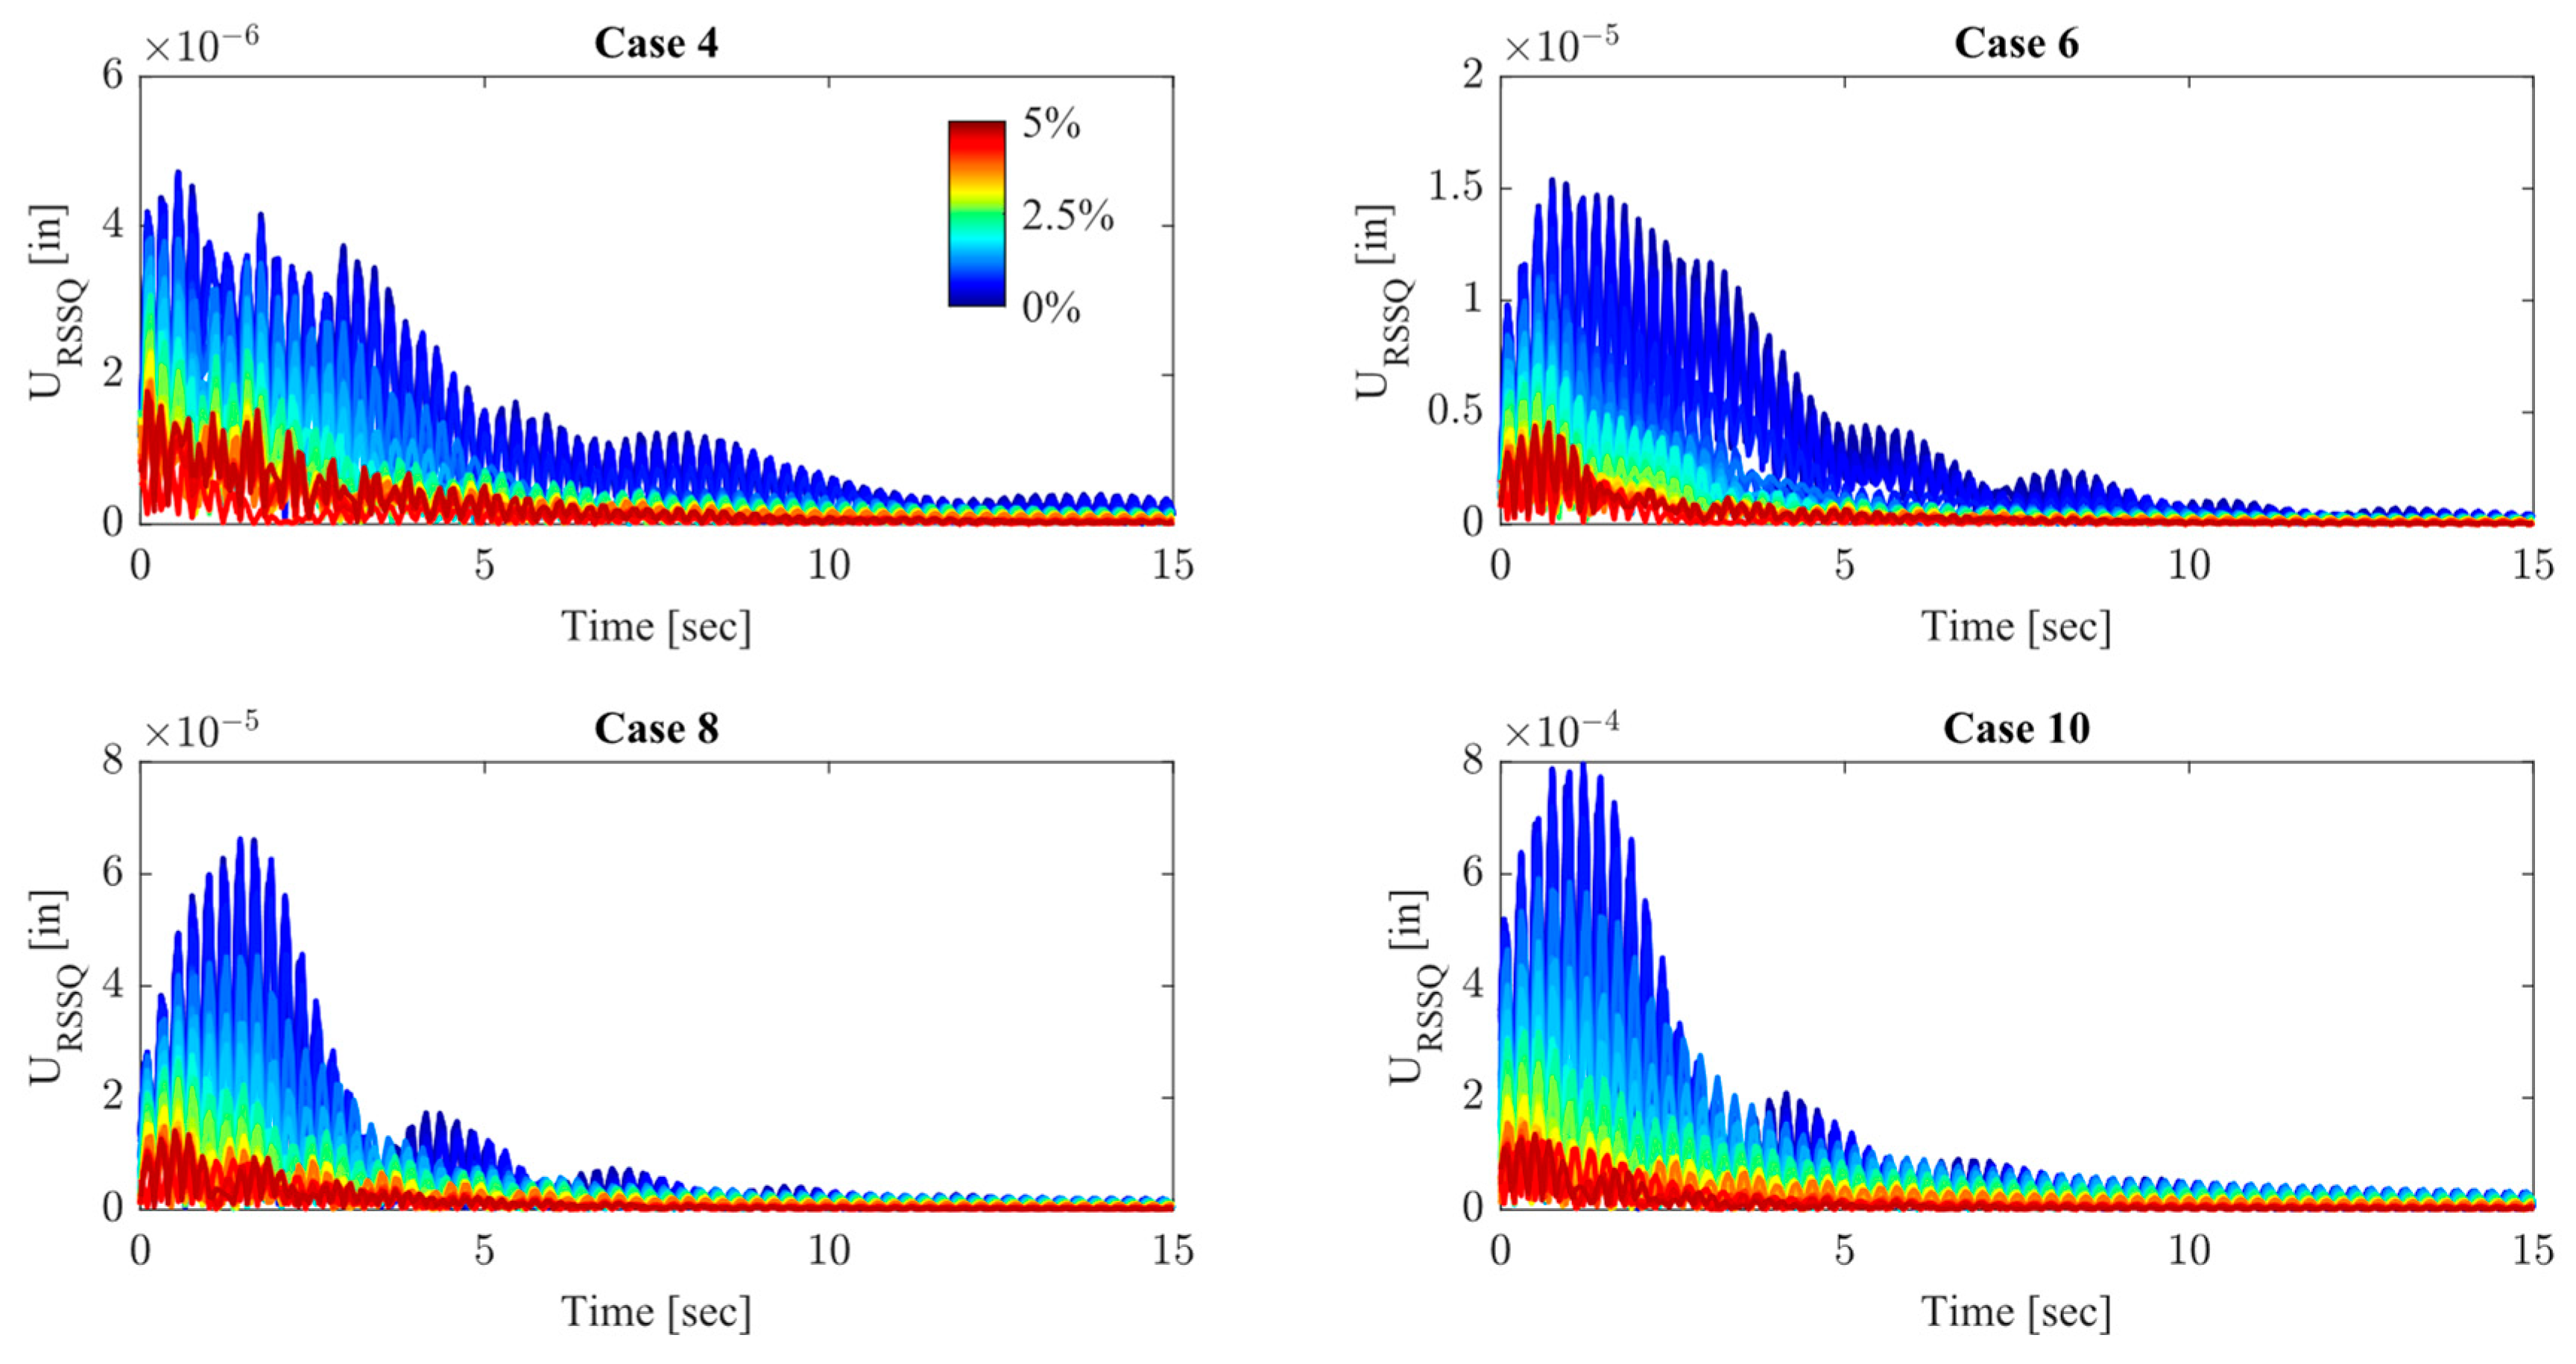
3.2.1. Dynamic Aeroelastic Response Analysis

In terms of the aerodynamic excitations, two gust models are considered, namely the PSD function modeled with the DS and the one-minus cosine gust excitation profiles. The short-time variations of the mean wind speed due to the one-minus cosine gust excitation, v ( t ) , are modeled as
v ( t ) = v r e f 1 c o s π t v m H
where v is the wind incremental velocity, v r e f is the gust reference velocity, H is gust scale length, υ m is the mean wind speed, and t is the time in seconds.
Although the Von-Karman spectrum density [42] is generally the accepted model for continuous PSD turbulence, the most recurrent model used for structures that lay within the atmospheric boundary layer is the Davenport Spectrum [42], as it considers the ground effects [43]. The gust disturbance component is described by a stochastic process represented by the DS formulation, which relies on the mean wind speed ( υ m ) and terrain roughness parameters. It is mathematically defined by Equations (9) and (10) and can be expressed as follows:
S D ( ω ) = 4800 v m κ x ( 1 + x 2 ) 4 3
κ = 1 2.5 ln z z 0 2
where S D is the velocity spectral density, x = 1200   ω / v m ( ω / v m is the wave number or inverse wavelength in cycles per meter), κ is the surface drag coefficient, z is the height from the ground up to the center of the structure, and z 0 is height of the terrain roughness, which is measured between z 0 = 3.94 and 11.81 at Goldstone, California [14]. Those operational conditions were provided by The National Aeronautics and Space Administration (NASA) and its industrial partner [41] and are based on prospective installation location of the VLBI antenna.
Fourteen operational gust cases are considered for the dynamic aeroelastic response analysis of the VLBI antenna structure and are summarized in Table 2. For each operational condition, the VLBI antenna is modeled with a structural damping coefficient of 0.03, a value commonly used in the aerospace industry for continuous metal structures [44].
The PSD displacement function and the time–response displacement of the selected target node are given in Figure 6 and Figure 7, respectively, where the operational cases 6, 10, and 14 are chosen to illustrate the behavior of the structure under the dynamic excitations. The output of the rotational DOF was omitted from the results due to their negligible values when compared to the translational ones. Furthermore, the aeroelastic response to be presented herein is limited to the VLBI antenna modeled with a 0° azimuth angle. For different azimuth angles, the mass and stiffness distribution of the antenna changes, which will likely result in distinct responses in the frequency and time-domains.
In Figure 6, it is noticeable that the displacement in the x-direction dominates the response for Case 6, due to its higher magnitude, when compared to the other DOF. This behavior is similar among cases 1 to 10, where the output value in the x-direction monotonically increases. The two resonance frequency peaks, evaluated at 2.18 Hz and 3.85 Hz, represent mode shapes related to the global displacement of the primary collector and boom arms of the antenna structure. As it will be seen in the optimization procedure section, the displacement associated with those mode shapes is targeted to globally minimize the aeroelastic response. For cases 11 to 14, a significant prominence of the response in z-direction was observed. The reason for this behavior lies on the inertial component of the aeroelastic modeling of the system, where the disturbances in the z-direction are greatly magnified due to the actuation of the gravitational field in the rear counterweights and the center of mass of the antenna.
On the other hand, the response for the one-minus cosine gust excitation, presented in Figure 7, was essentially dominated by the first global mode shape, identified at the frequency of 2.18 Hz, in all fourteen cases. It is also important to note that the response in the z-direction was magnified with the increase of the disturbance wind speed, due to the same reason as explained for the PSD frequency response analysis. Hence, the response mainly associated with the first mode shape should be targeted to minimize the dynamic aeroelastic response of the antenna, by means of the inclusion of the TMD control devices.
Finally, it is important to discuss one aspect of the numerical model developed herein. In terms of the modal characteristics, i.e., natural frequencies and mode shapes vectors, the ROM analyzed matches the high-fidelity detailed FE model provided by the industrial partner, therefore being accurate and precise in predicting the modal response of the structure. However, when dealing with the aerodynamic analyses, approximations are necessary to be implemented, such as with the use of the DLM to estimate the aerodynamic properties of the antenna structure [42]. The DLM presents limitations in terms of its approximations due to the use of linearized potential equations, therefore not considering essential effects for the aerodynamic analysis, such as the geometry thickness of structures and large angles of attack [45]. The antenna model investigated has not yet been validated with higher-order computational fluid dynamic analysis or via experimental results; therefore, the results estimated within this spectrum are taken as qualitative. The true level of error, while assumed to be small, will need to be properly validated to improve this framework.
In this way, Table 3 presents a comparison between the first five estimated global displacement modal frequencies of the DFEM and the associated resonance frequencies obtained from the aeroelastic analysis of the new ROM. It can be seen that the low percentual error indicates good agreement between the values, especially regarding the first two frequencies, demonstrating that the model investigated is qualitatively correct. However, further refinement in the study must be considered, related to the model validation, in order to establish a good quantitative correspondence of the results from the aeroelastic analysis. This validation approach, nonetheless, is something out of scope from this study, and it is therefore suggested as a future work for further analysis refinement.

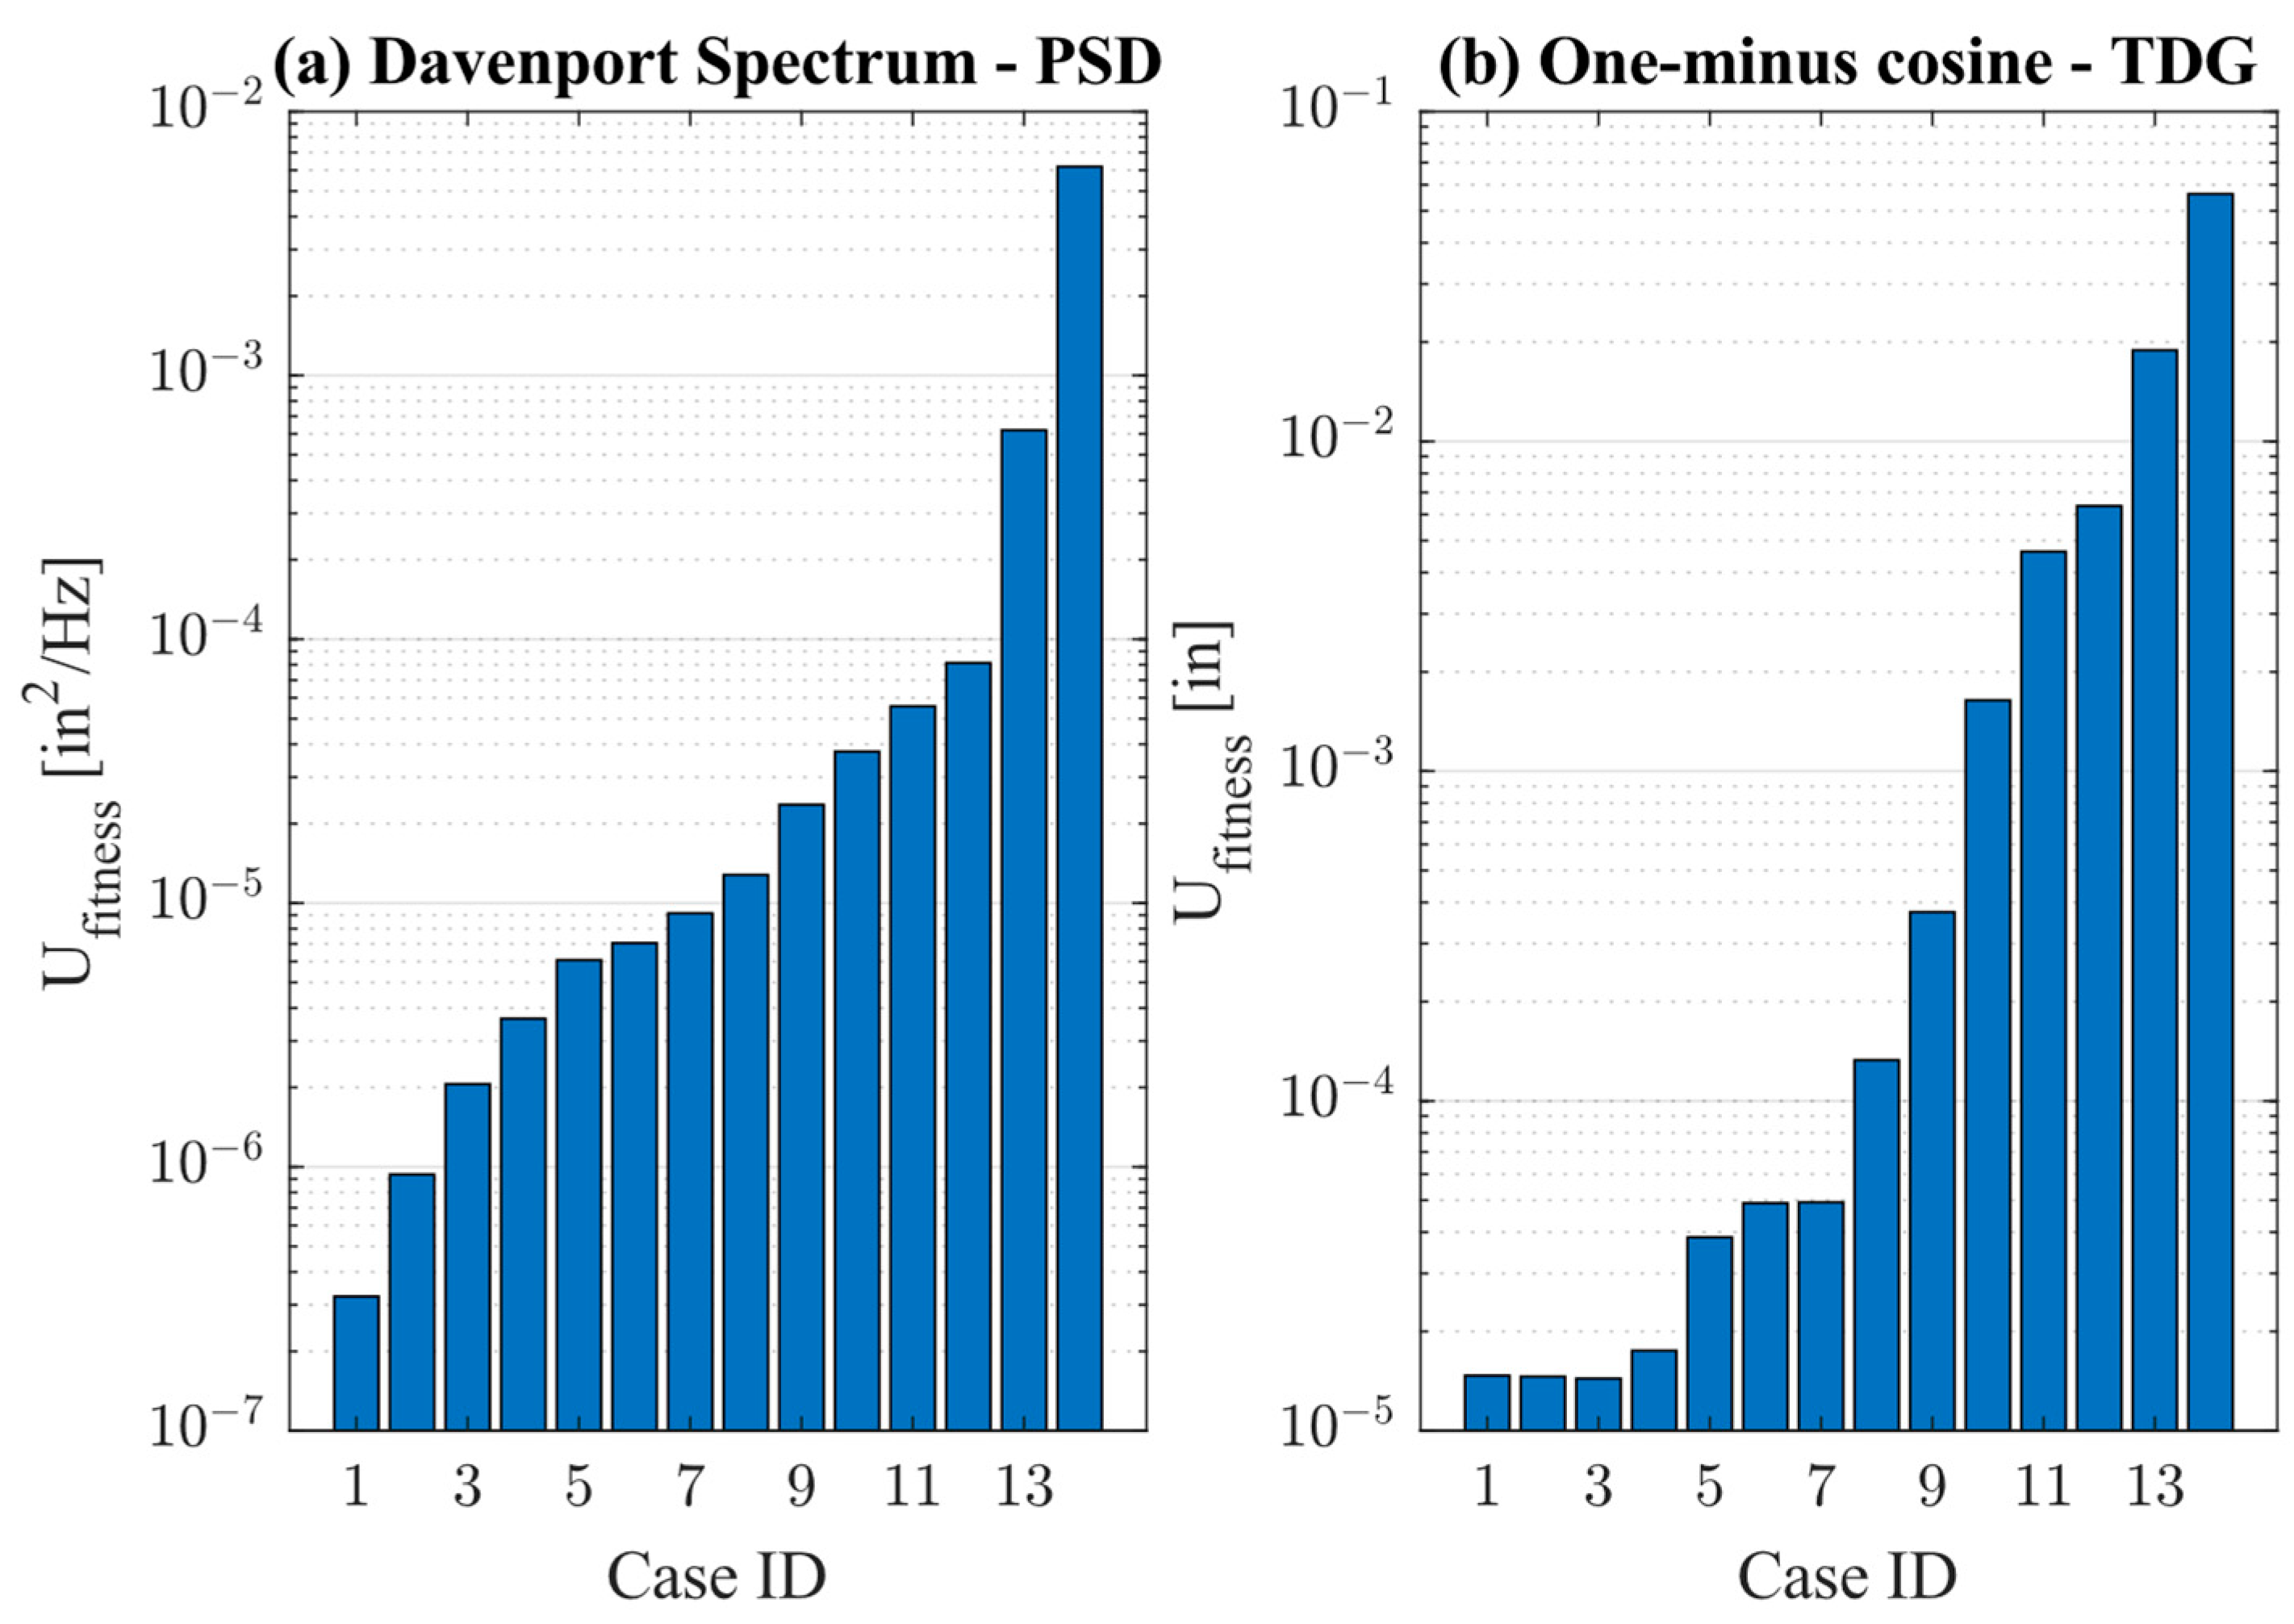
3.2.2. Aeroelastic Response Fitness Function Definition

The fitness functions utilized are essentially defined as the minimization of the total mass of resonators included and the minimization of the peak displacement of the target node defined at the VLBI antenna. This is calculated as the maximum peak of the PSD displacement function, taken among all DOF considered. On the other hand, the area under the U R S S Q × t curve is used to define the fitness function in the transient response analysis. This way, a lower area indicates that the signal is being attenuated faster than a case with a higher graph area value. Equations (11) and (12) describe the fitness function implemented.
PSD :   U f i t n e s s j = m a x S x j ω c r i t , S y j ω c r i t , S z j ( ω c r i t ) , j = 1 , 2 , , N c a s e
TDG :   U f i t n e s s j = 0 t f U R S S Q j d t , U R S S Q j ( t ) = U x j 2 ( t ) + U y j 2 ( t ) + U z j 2 ( t )
where U f i t n e s s is the fitness function to be minimized for both frequency and time domain analysis, S x j ,   S y j ,   S z j are the PSD displacement functions obtained for each DOF, ω c r i t is the associated critical frequency, and N c a s e is the number of operational cases considered. The variable U R S S Q is the RSSQ output from the displacements in the time domain U x ,   U y ,   U z .
Moreover, multiple operational cases are concurrently analyzed within a single iteration. In this way, several cases can be defined as objectives to be minimized for the same set of design variables. This improvement brings some advantages, especially related to finding an optimal solution that can s attenuate the response for a variety of aerodynamic disturbance profiles.
In order to summarize the U f i t n e s s values for the uncontrolled structure under each operational case, considering the two gust excitation profiles, Figure 8 is presented. It is possible to observe a trend of increase in their values with the increase of the wind speed of the correspondent operational case. The values presented herein are utilized for a percentual comparison of pointing error reduction after the inclusion of the optimized set of TMDs.

4. Results and Discussion

One configuration of TMD is investigated to minimize the aeroelastic response of the VLBI antenna structure, being based on the inclusion of a STMD in the secondary reflector, specifically at the assigned target node. This configuration brings the advantage of simplicity of implementation in the real structure, due to the fact that only one TMD is necessary to be attached into the boom arms. With this strategy, a single MDOF resonator is assigned to the structure and can be tuned accordingly to the resonance frequencies identified in the previous sections.
The mass inclusion in the VLBI antenna structure again is a critical design parameter of the analysis, especially because the TMD needs to be proportional to the entire system’s mass. To execute the analysis with realistic inputs, a limit of 5% of mass inclusion due to TMD placement is adopted herein. As will be shown in further sections, even with very low mass inclusions, it is possible to characterize a significant attenuation in the structure’s response when the other design parameters are correctly tuned. In terms of the settings of the MOGA procedure, the following parameters are used in the simulation of the STMD:
  • Crossover fraction: 80%;
  • Elitism probability: 2%;
  • Migration factor: 20%;
  • Migration interval: 20;
  • Pareto fraction: 35%.
Moreover, the stopping criteria for the optimization procedure utilized are the chosen maximum number of generations or the average change in the spread of the Pareto front. For the STMD configuration, only three design variables are necessary to run the simulation, being the mass, stiffness, and damping coefficient of the TMD, as previously specified. To obtain the effective convergence of the results, a population size of 100 and a maximum number of generations of 30 are utilized. With those values, a total of 3000 analyses are carried out with the MOGA optimization procedure.
The estimations of the bounds for the design variables are based on the formulation presented in Warburton [46], where it is considered a random load, such as the aerodynamic gust excitation, and the two target frequencies that represent the peaks of resonance, as shown in Figure 6. The bounds are found based on the value of the mass inclusion ratio, which assumed a range between 0% and 5%. The values utilized in the simulations are described in Table 4.
The results for the optimization framework are now presented, considering the operational cases and both models of atmospheric disturbances. The results are given in terms of Pareto fronts, output response functions for the target node, and charts that indicate the optimum values of the STMD found.

4.1. Frequency Domain Analysis with the PSD Modeled with the Davenport Spectrum

The optimization procedure is implemented for the excitation modelled with the PSD function given by the DS model. It is important to notice that all 14 operational cases were concurrently evaluated in the analysis, and the Pareto front achieved is the result of the individuals that mostly minimized the aeroelastic response of the antenna considering all the excitations. Hence, in the graphs that follows, not necessarily an individual that achieved a good response attenuation for one operational case will be valid for others, and vice versa. However, the Pareto front individuals are the ones that concurrently minimize all cases. This observation is also valid for the time domain analysis.
Representatively, an example of output from the MOGA framework is shown in Figure 9, where the pointing error and mass inclusion are minimized for the operational cases 4, 6, 8, and 10. In Figure 9, it is possible to observe the expected behavior of decrease in the aeroelastic deviation associated with a direct increase in the mass inclusion in the antenna, therefore establishing a trade-off problem. The utopian point [36] indicated encompasses the extremes of the Pareto front, hence considering all individuals obtained at the convergence of the optimization algorithm. The selection of the utopian point followed the unitarily weighted Euclidean Metric as previously described. In addition, the percentual reduction presented in Figure 9 is given as
U f i t n e s s   r e d u c t i o n   [ % ] = U f i t n e s s ,     U N C U f i t n e s s ,     T M D U f i t n e s s ,     U N C × 100
where U f i t n e s s ,   U N C and U f i t n e s s ,   T M D are the net aeroelastic response for the uncontrolled structure and with the attached STMD, respectively. The PSD displacement response functions, for the target node, of the Pareto front individuals are presented in Figure 10 for each respective DOF considered in the study. The first noticeable aspect is that the inclusion of the STMD is capable of attenuating the response in all directions. Moreover, with the optimized constitutive parameters of the TMD, it is possible to characterize an average of 90% reduction in the aeroelastic response, with a maximum mass inclusion of 5%, thus demonstrating the excellent effectiveness of this method. However, as explained before, the mass addition is a factor that can potentially impact the structure stability in operation; therefore, it is interesting to select the individual with the best trade-off between mass inclusion and aeroelastic response attenuation. The parameters presented are the same for all DOF considered; i.e., directions x, y, and z assume the same properties of mass, damping coefficient, and stiffness.
Figure 11 is introduced in order to summarize the results obtained for the aeroelastic attenuation of all cases, using the best individual found form the optimization procedure. A comparison between the uncontrolled and controlled structure with the STMD configuration is depicted in the referred figure. As a major observation, for all operational scenarios it is possible to characterize a reduction in the aeroelastic response, with the greatest efficiency corresponding to cases 1 to 12.
It can also be seen in Figure 11 that the attenuation efficiency was significantly reduced for cases 13 and 14. This behavior is attributed to the fact that for those two last cases, the response is essentially dominated by the z-direction, as previously displayed in Figure 6a. It is observed that for case 14 (and although not displayed, this is also the case for case 13), the response is predominantly dominated by the z-direction at low frequencies (well within the range of the first resonant frequency at 2.18 Hz). The aerodynamic response has a significantly different trend with respect to the other cases which presented either a dominance of the x-direction or an equivalence in magnitude of the x- and z-direction. The STMD control device presents a limitation in terms of this characteristic, since their design is essentially dependent on a target frequency and the DOF response magnitude [19]. Therefore, this reduction of the response attenuation efficiency is expected when the same optimized TMD parameters are used to concurrently analyze multiple cases. Nevertheless, the pointing error was effectively reduced for all cases, and in specific instances, for the primary and secondary operational cases it was possible to characterize a reduction of 73.2% and 39.4%, with a structural mass inclusion of approximately 1%.

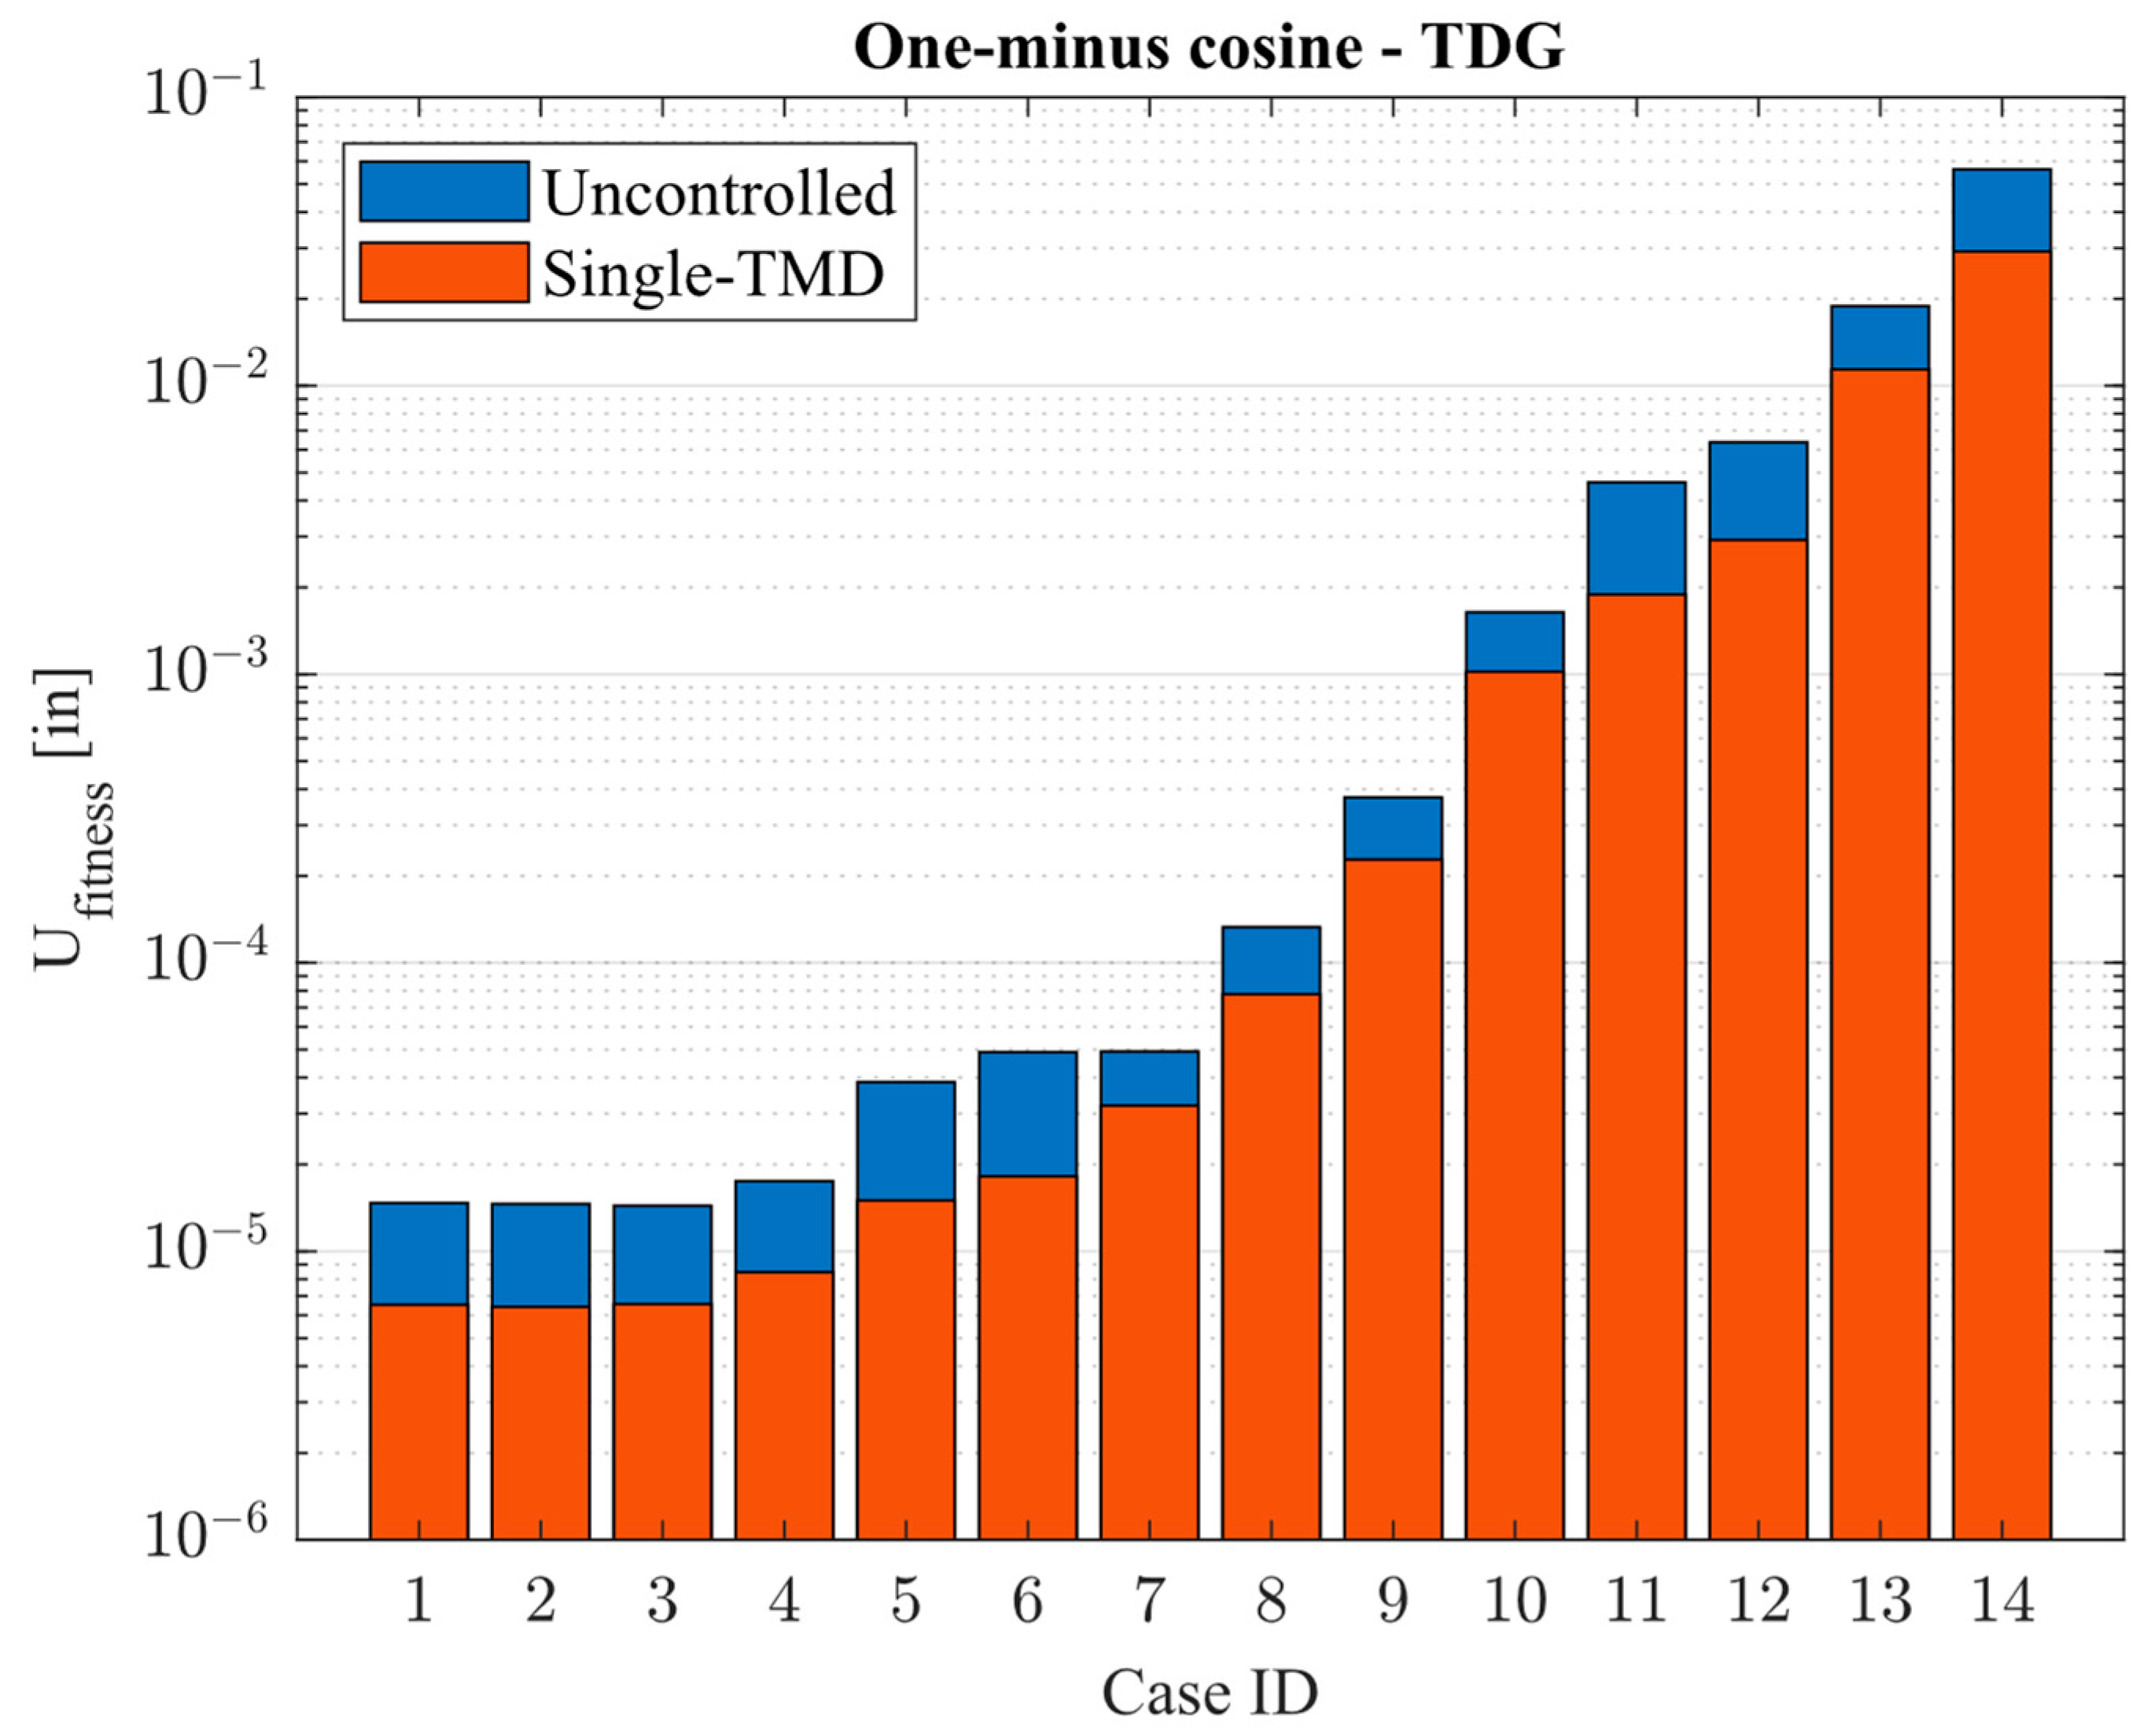
4.2. Time Domain Analysis with the One-Minus Cosine Gust Model

Utilizing now the one-minus cosine gust model [47] as the excitation profile applied to the VLBI antenna, the performance of the inclusion of an optimized STMD is investigated. Again, all 14 operational scenarios are concurrently analyzed, such that one specific configuration of design variables is capable of minimizing the dynamic aeroelastic response for multiple cases. As shown in Equation (12), the objective function related to the aeroelastic response is taken as the area underneath the graph of the net displacement of the DOF over time. This way, a lower area indicates that the signal is being attenuated faster than a case with a higher graph area value.
A representative output from the framework is presented in Figure 12 and Figure 13, where there is the concurrent minimization of mass inclusion and area underneath the curve of pointing error with respect to time, displaying the operational cases 4, 6, 8, and 10. In Figure 12, the Pareto fronts obtained indicate a similar trend of increase of mass inclusion when decreasing the aeroelastic response at the selected target node. Furthermore, similar to the frequency response analysis, it is possible to characterize an average of 85% reduction in the aeroelastic response, with a maximum mass inclusion of 3%, thus demonstrating the excellent effectiveness of this method for attenuating excitation profiles with impulse-like nature, such as the one-minus cosine gust model.
Different from the previous analysis, for mass inclusions greater than 3% it is generally observed a decrease in the attenuation efficiency for the operational cases; therefore, the Pareto fronts were only characterized up until the referred percentage. This behavior is associated with the impulse-like nature of the excitation possibly introducing an instability phenomenon due the higher values of mass inclusion, thus reducing the effectiveness of actuation of the STMD.
Figure 13 depicts the time–domain response of the target node for the Pareto front individuals for the operational cases 4, 6, 8, and 10, where the mass inclusion presents an increase from 0% to 3%. The net deviation is indicated in the graph, therefore being the RSSQ of the displacement for each DOF. When the TMD mass is near 0%, the response is similar to the uncontrolled structure, and the oscillations amplitudes are still observable until around 7.5 s after the excitation from the one-minus cosine gust [48]. With the attachment of the optimized TMD and with higher mass inclusion percentages, the signal is considerably attenuated, being damped faster, and the maximum amplitude experienced by the target node is reduced. This characteristic indicates that the pointing accuracy can be successfully maintained when the antenna structure is subjected to impulse-like excitations.
The performance of the best individual identified is compared with the uncontrolled structure, for all operational cases, in Figure 14. Again, for all excitations investigated it is possible to characterize a reduction in the aeroelastic response by including the optimized STMD. The lower mean wind speed cases, corresponding to cases 1 to 6, presented the highest reduction in the aeroelastic response of the target node between 51 and 63%. For cases with higher mean wind speed, the attenuation percentage is lower, as expected, except for cases 11 and 12 which presented an increase in the attenuation effectiveness.

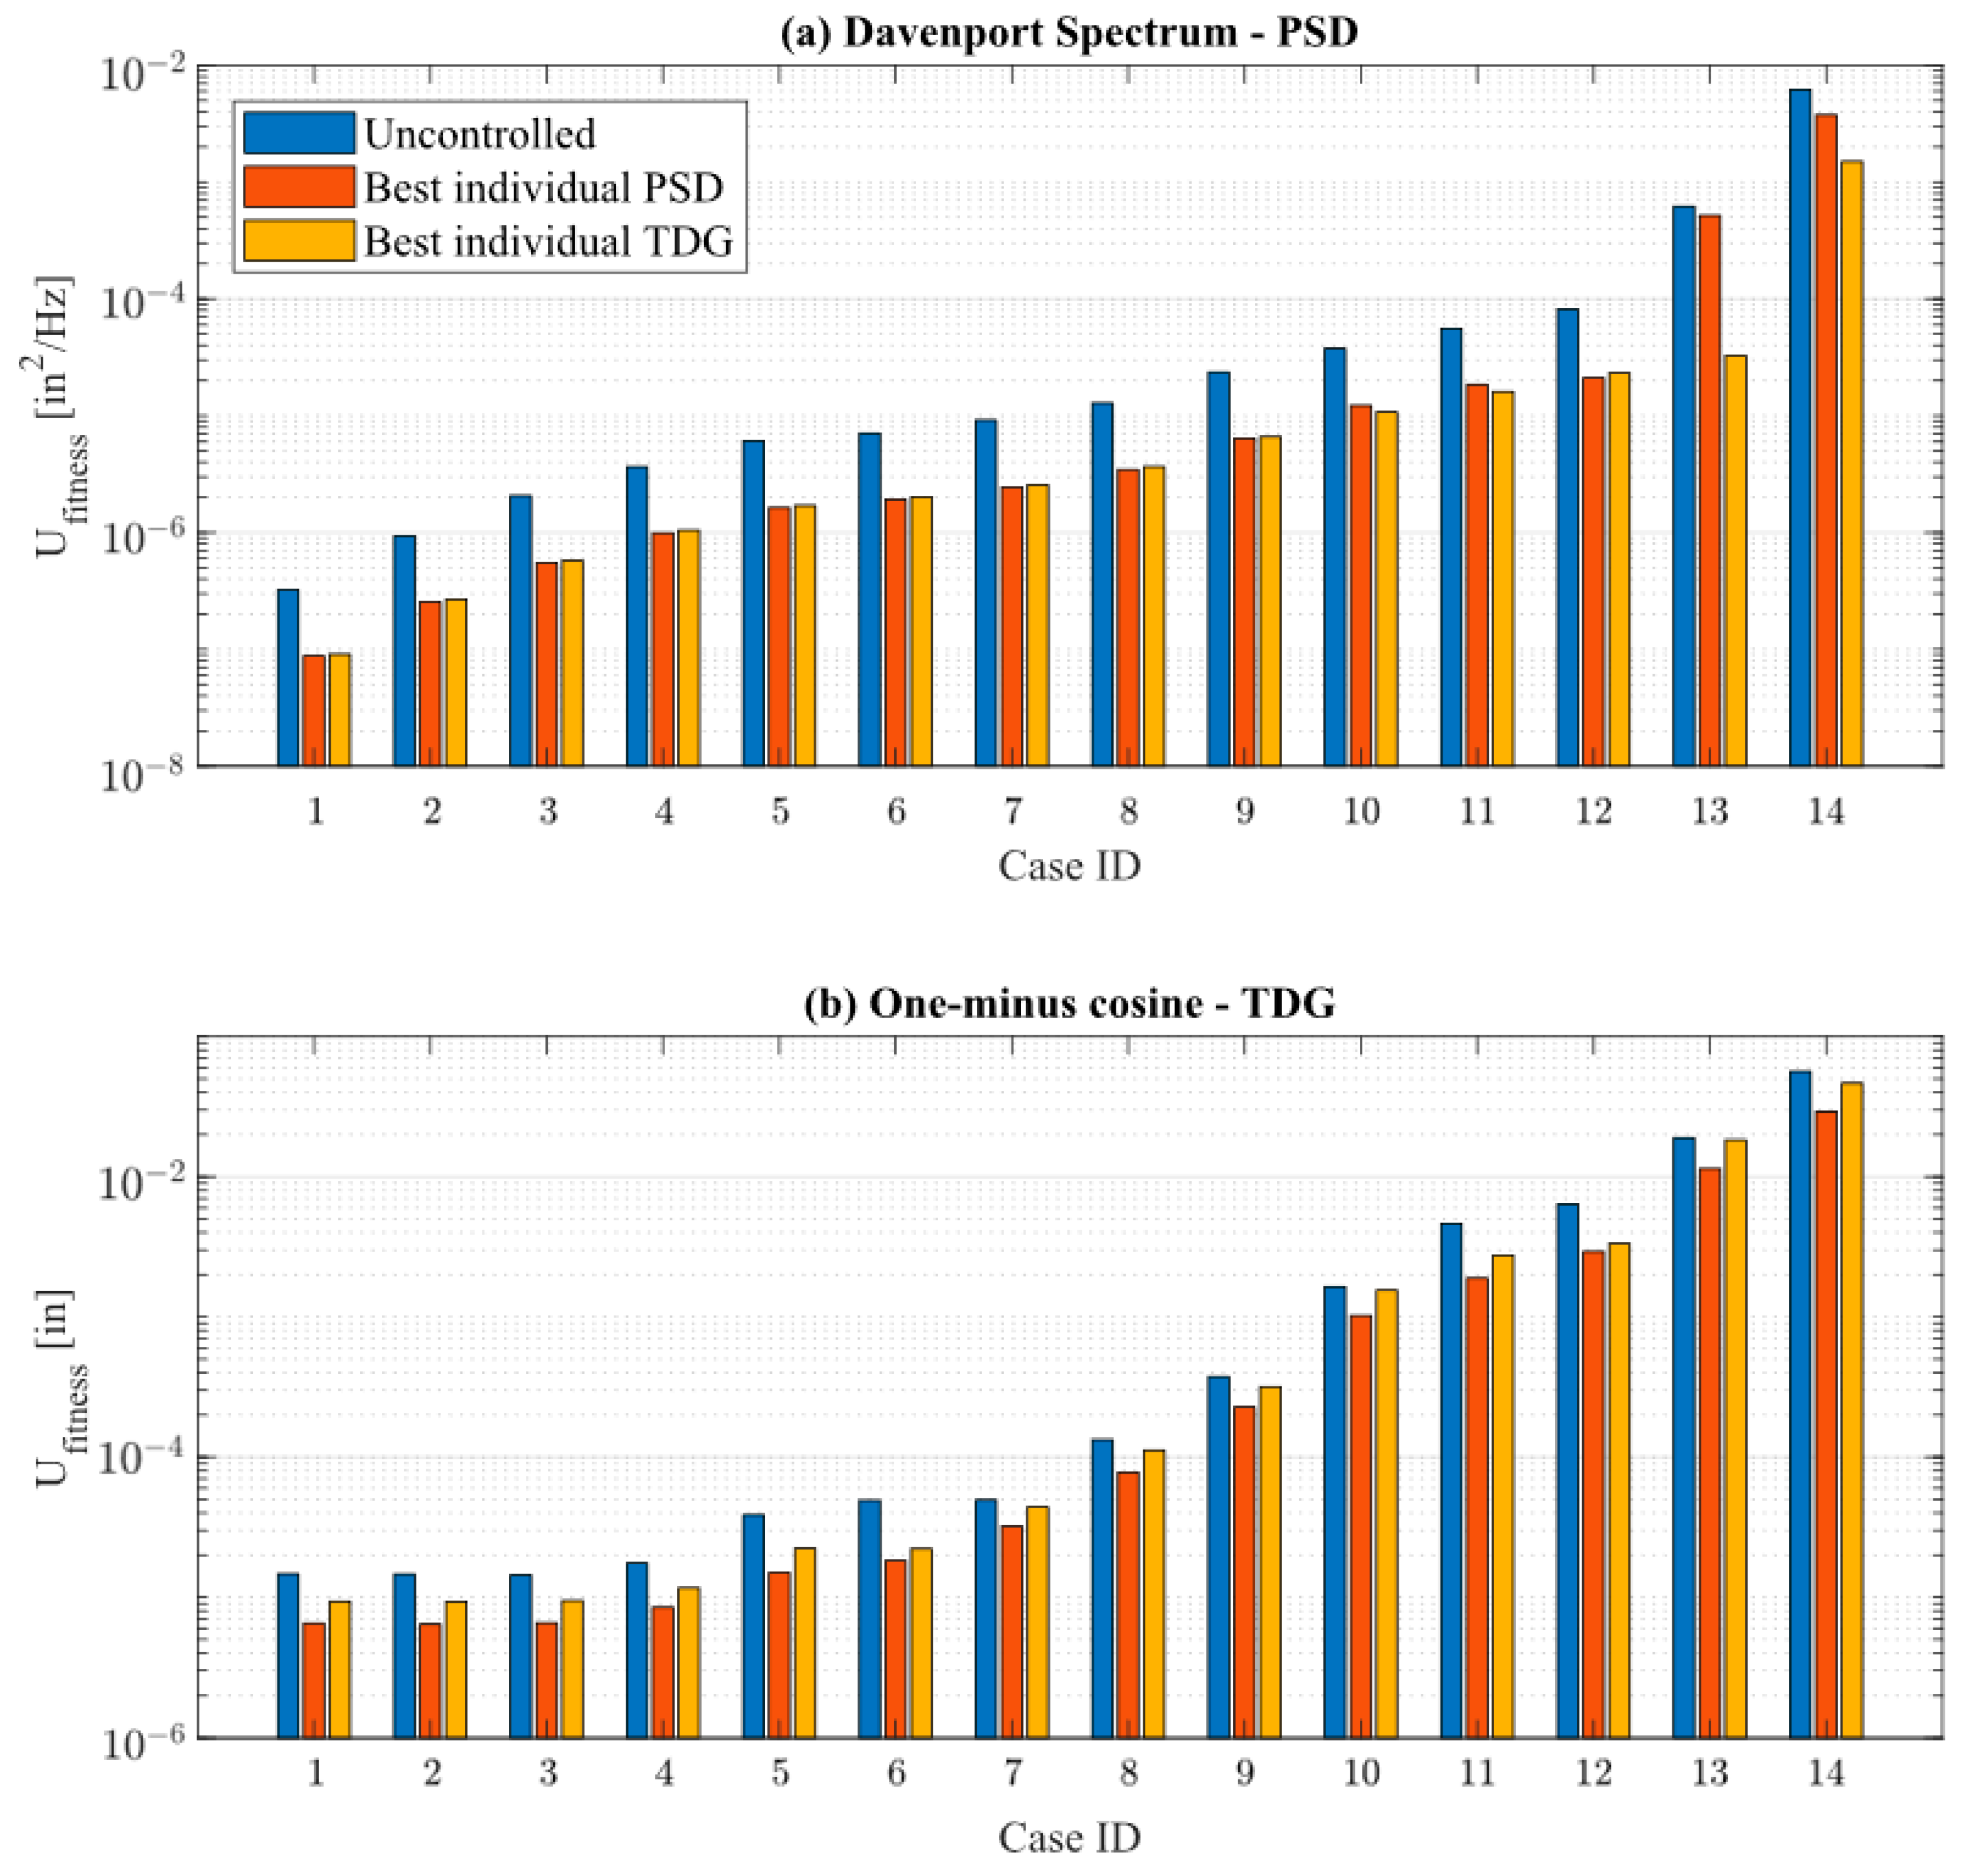
4.3. Comparison of the Aeroelastic Response Fitness for the Gust Models

As per the results presented in the previous section, both analysis in the frequency-domain and time-domain presented different values for the optimal TMD. This is expected to occur since the excitation models are different from each other, and the constitutive parameters of the TMD are dependent upon that matter. However, since the solution to be implemented in a VLBI antenna system must be unique, it is necessary to select one optimal design variables set and test among each gust excitation profile and thus evaluate the performance of the auxiliary mass. There are two ways of executing this analysis:
  • The first is the most formal and accurate, which would be to concurrently run the optimization framework considering all 14 operational cases for both gust models. This way, it would be possible to determine a set of design variables that globally minimizes the aeroelastic response of the VLBI antenna. The drawback of this method lies on the computational capacity limitation to run the framework, which would exponentially increase the computation time to evaluate the fitness functions, making it nearly impossible to obtain results within a reasonable time.
  • The second is an approximation approach, and it is related to testing the permutation of best individuals previously found using the optimization framework independently for each gust excitation profile. An example would be taking the optimal set of design variables from the frequency-domain analysis and testing it within the time-domain analysis, quantifying the performance, and vice versa. This way, the best individual can be selected based on this proposed criterion. The drawback of this approach lies in the fact that not necessarily the optimal solution for one model will attenuate the other one, thus existing the possibility of the response being magnified by the inclusion of the STMD.
For this study, the second approach is selected, such that the best solution can be found from the data set presented in the work. To do so, the following individuals presented in Table 5, identified as the best by means of the utopian point method, are used in order to find the unique solution.
Figure 15 depicts the results for the comparison of the aeroelastic response attenuated by the inclusion of the optimal TMD associated for each gust model, where configuration A is indicated by the blue line and configuration B is indicated by the red line. As it can be seen, the parameters found for the optimal TMD under configuration A presented the overall best results for minimizing the aeroelastic response in both gust models. For the PSD excitation in Figure 15a, both optimal TMDs resulted in practically the same level of attenuation from the operational cases 1 to 12; however, for the last two cases, configuration B was demonstrated to be superior in attenuating the aeroelastic response when compared to configuration A. As for the TDG excitation in Figure 15b, configuration B again displayed a slightly better performance set side by side for all cases with configuration A. Hence, the results indicate that a STMD with constitutive parameters evaluated as in configuration B could result in better attenuation performance of the aeroelastic response of the VLBI antenna structure for both of the gust excitation models.

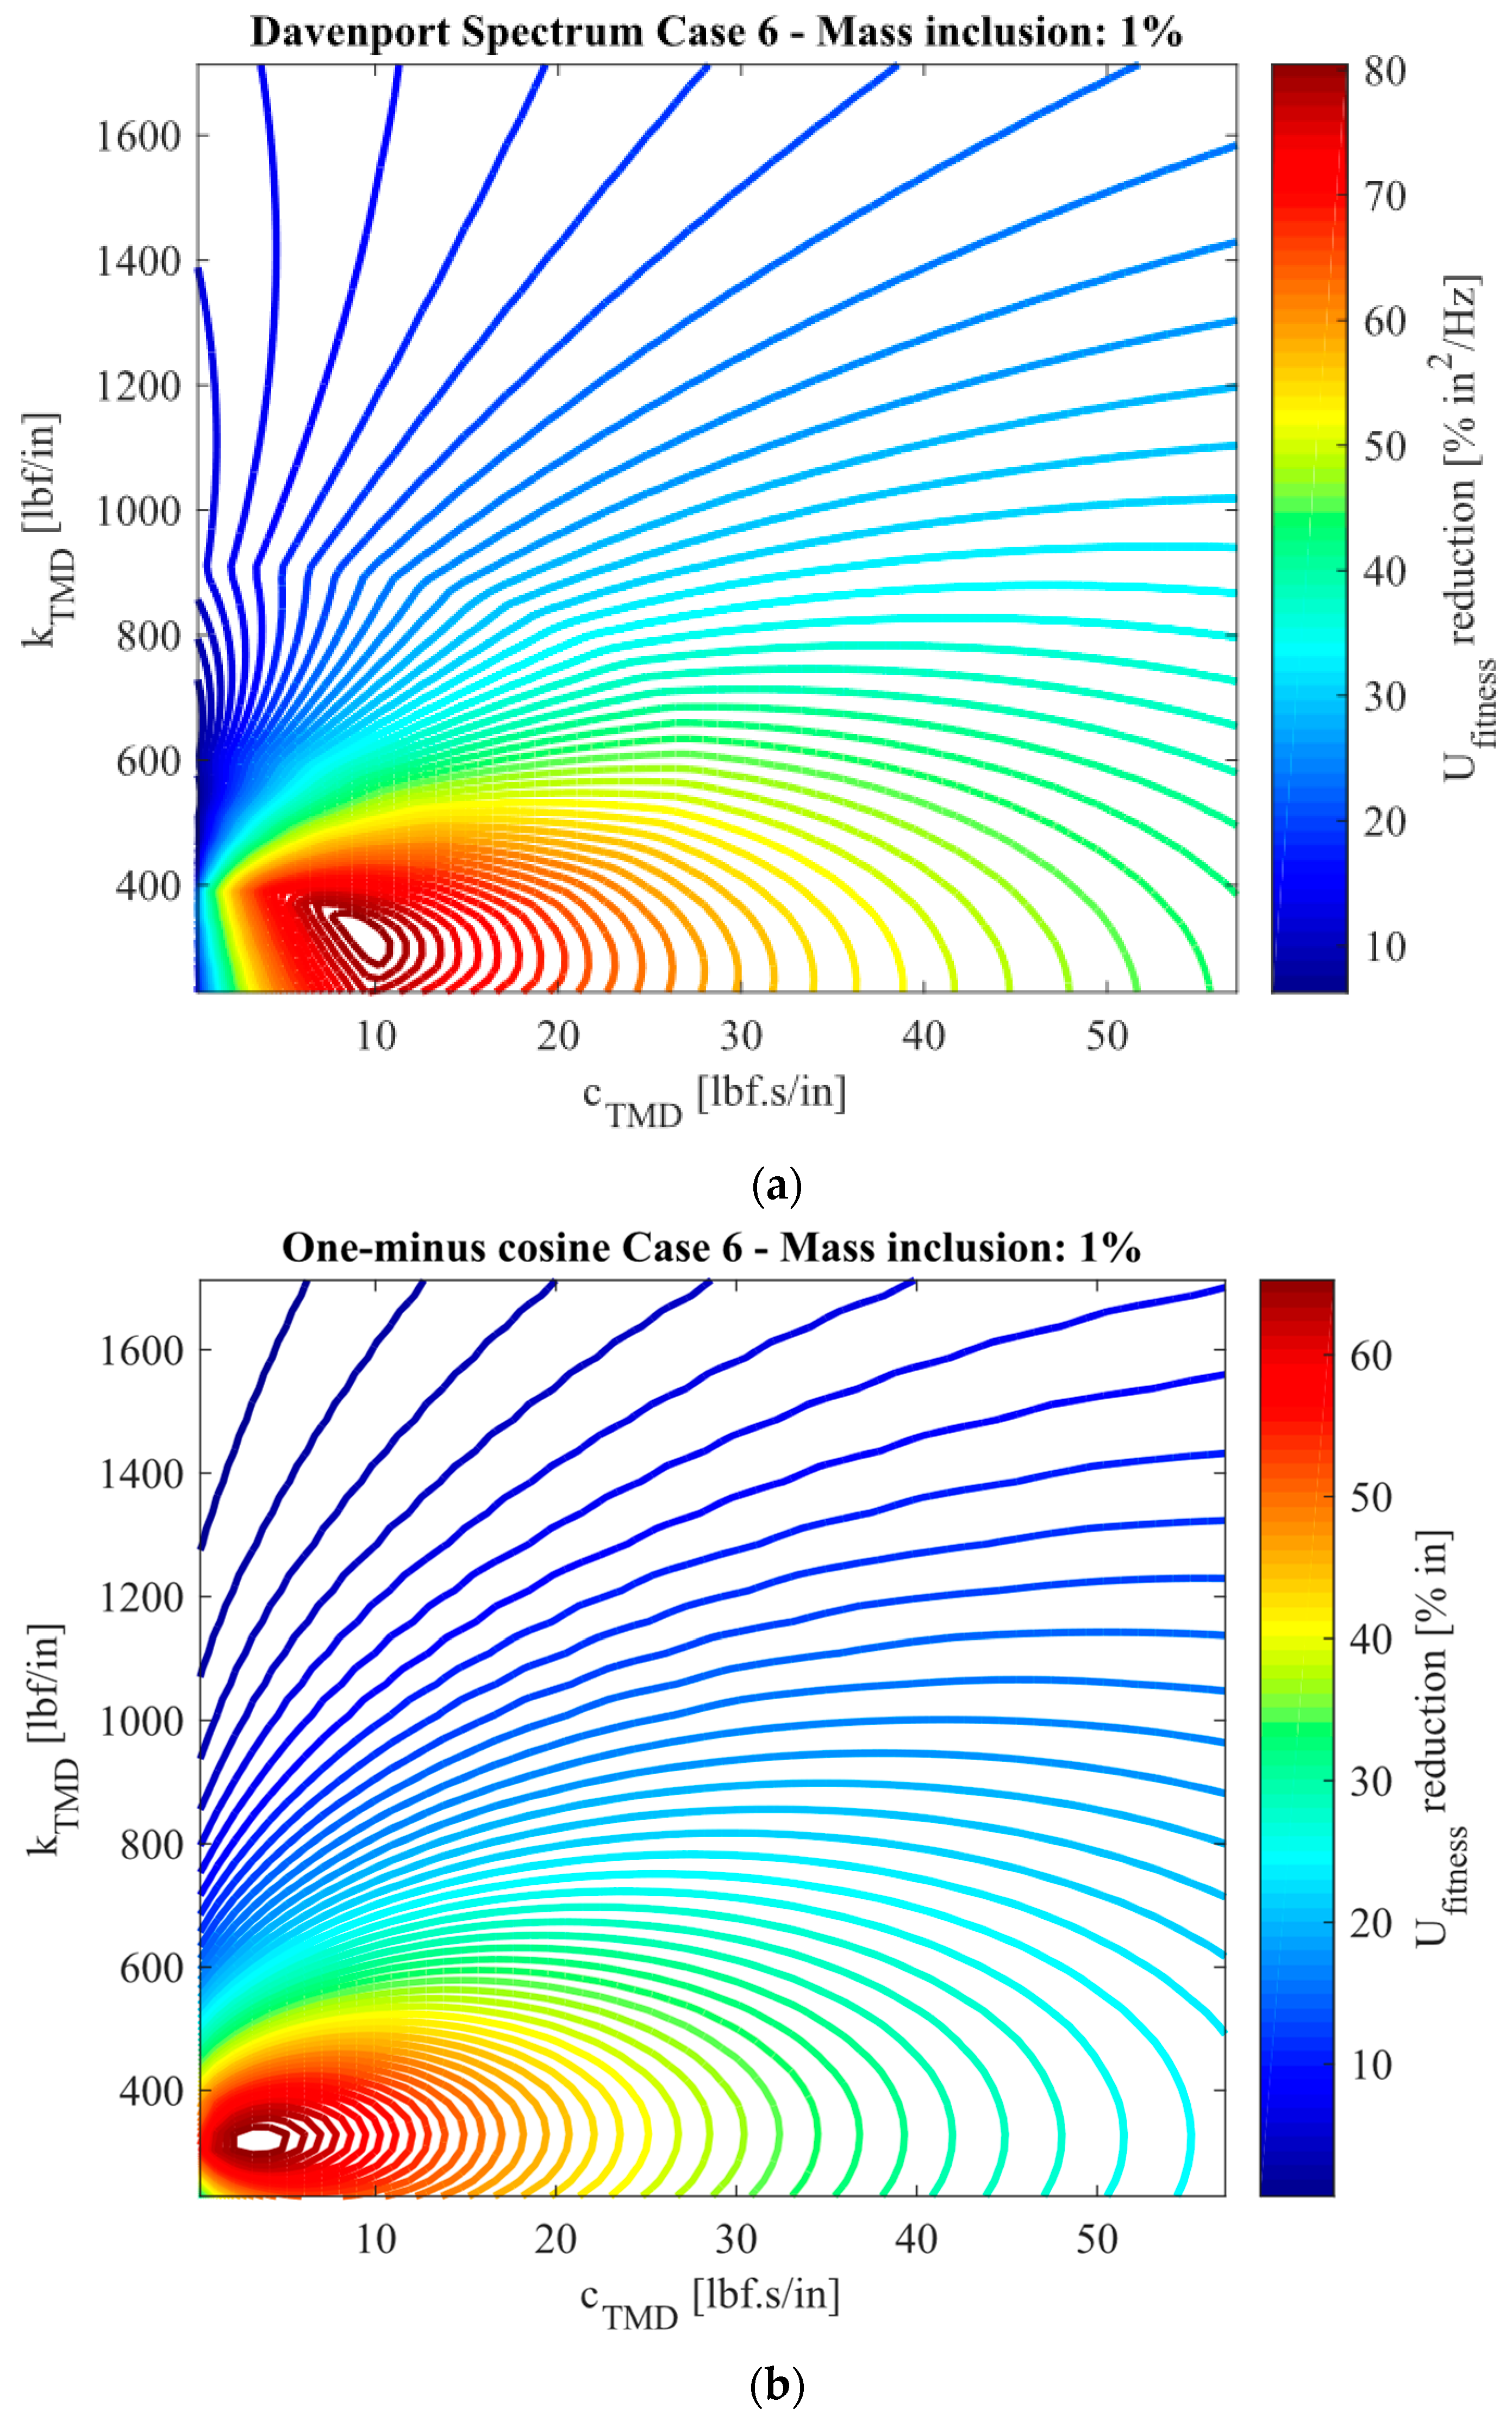
4.4. Factorial Analysis of TMD Design Variables with a Defined Mass Inclusion

In order to further understand how the change of the design variables affects the aeroelastic response of the target node, a full factorial analysis is conducted. This is an important set of results due to the fact that it should inform the designer of the effect of changing the design variables of the TMD and how they influence the final response. The Pareto front optimal solution is unique; however, there are other sets of design variables that provide similar performance to attenuate the aeroelastic response, hence being characterized as feasible solutions for the problem.
To do so, operational case 6 is selected to representatively investigate the performance of the TMD, for both DS and one-minus cosine gust models.
The mass inclusion, taken as constant in this factorial analysis, is defined as the optimal solution found in the previous section, such that m = 848   l b . As for the damping coefficient and stiffness, the ranges utilized are 0.30 c T M D 60   [ l b f . s / i n ] and 220 k T M D 1700   [ l b f / i n ] , respectively.
Figure 16 depicts the contour surfaces of the factorial analysis, for each gust excitation model. As can be seen from the design space, the global maximum percentage reduction is present at the bottom left portion of both gust excitation models, for operational case 6. These values obtained with the factorial analysis are similar to those found with the MOGA procedure, after selecting the best individual with the utopian point method, hence demonstrating that the framework is efficient in finding the best individual among a large design space.

5. Conclusions

This paper investigated the dynamic aeroelastic response attenuation by using a STMD configuration, applied to a FE model of a 12 m Earth-based radio VLBI antenna, designed by InterTronic Solutions [41]. Due to the large number of DOFs associated with the DFEM, provided by the manufacturer, the model had to be reduced in order to achieve results within a reasonable time. In the Nieto et al. model [42], a method to reduce the order of the FE model was introduced, making it possible to run solution 146 in MSC NASTRAN® within a matter of few minutes. However, to use the proposed ROM in an optimization procedure, a further refinement of the order reduction was necessary to be implemented. Within this scope, all DOFs that were not associated with boundary conditions, aerodynamic panels, structural spline, or the truss boom arms of the reflectors were eliminated from the analysis. This allowed for the reduction of each iteration time of the dynamic aeroelastic analysis by 67% while still achieving an excellent correlation measured with the MAC and low error between the natural frequencies, when benchmarked with the model presented by Nieto et al. [42].
It should be noted that, while the reduced order model shows a high accuracy in the frequency domain as well as low computational cost with respect to the detailed model, the reduced order model might also introduce errors in displacement calculation, particularly for long-time domain analysis. However, it should be noted that the analysis for tuned discrete gusts is a transient analysis, and the operational conditions displayed in Figure 7 indicate that the major oscillatory response dampens out after a few seconds. Therefore, long-time simulations are not a significant concern for this study. A quantification of possible errors that might arise requires additional simulations that are out of the scope of this research.
The aeroelastic response of the VLBI antenna indicated two frequencies that are of critical investigation, being 2.18 Hz and 3.85 Hz, representing the mode shapes related to the global displacement of the primary collector and boom arms of the antenna structure. Furthermore, with the increase of the mean wind speed of the operational cases, a prominence of the z-direction response of the target node at the antenna was observed. In order to determine the optimal STMD constitutive parameters to minimize the aeroelastic response of the antenna, an innovative approach was implemented, such that all operational cases were concurrently investigated utilizing the MOGA framework proposed. This way, the best individual found would attenuate the response for all cases. The best individual was found by means of the utopian point method, utilizing the unitarily weighted Euclidean metric. The optimal STMD solution found for the DS model excitation presented an average attenuation of 66% with a mass inclusion of 1.1%, where the operational cases 13 and 14 resulted in the lowest efficiency of attenuation. This behavior was attributed to the great increase of the z-direction and the inherent limitation of TMD systems since their design is essentially dependent on a target frequency and the DOF response magnitude. As for the one-minus cosine gust model excitation, the average attenuation of the aeroelastic response was evaluated as 50%, for a mass inclusion of 0.9%. An alike behavior of reducing the attenuation effectiveness when increasing the mean wind speed of the operational cases was also observed for the time-domain response. The optimal individuals for the frequency and time-domain analysis were different, which is expected to occur since the excitation models are different from each other. The optimal sets for the DS and one-minus cosine models were tested among each other, and it was found that the best individual associated with the time-domain excitation presented better attenuation capabilities, hence being defined as the overall optimal individual.

Author Contributions

Conceptualization: V.E.L.G. and M.S.A.E.; Methodology: V.E.L.G. and M.S.A.E.; Formal analysis and investigation: V.E.L.G., M.S.A.E. and J.R.; Writing original draft preparation: V.E.L.G.; Writing, review, and editing: J.R. and M.S.A.E.; Funding acquisition: M.S.A.E.; Resources: M.S.A.E.; Supervision: M.S.A.E. All authors have read and agreed to the published version of the manuscript.

Funding

This research was funded by The Natural Sciences and Engineering Research Council of Canada (NSERC), grant number CRDPJ 530880—18.

Data Availability Statement

Not applicable.

Acknowledgments

Mostafa S.A. ElSayed acknowledges the financial support provided by The Natural Sciences and Engineering research Council of Canada (Grant Number CRDPJ 530880—18) in collaboration with Intertronic Solutions Inc. (ISI) and The National Aeronautics and Space Administration (NASA). The authors would like to extend their acknowledgements to the engineers of ISI and the Goddard Space Flight Center of NASA for their support.

Conflicts of Interest

The authors declare no conflict of interest.

Acronyms

AcronymDefinition
CBRMCraig-Bampton Reduction Method
DFEMDetailed Finite Element Model
DLMDoublet-Lattice Method
DSDavenport Spectrum
FEFinite Element
MACModal Assurance Criteria
MTMDMultiple Tuned Mass Dampers
NASANational Aeronautics and Space Administration
PSDPower Spectral Density
RIDTMDRotational Inertia Double Tuned Mass Dampers
ROMReduced Order Model
RSSQRoot Sum of Squares
STMDSingle Tuned Mass Damper
TDGTuned Discrete Gust
TMDTuned Mass Dampers
VLBIVery-Long-Baseline Interferometry

References

  1. Inoue, M.; Algaba-Marcos, J.C.; Asada, K.; Blundell, R.; Brisken, W.; Burgos, R.; Chang, C.; Chen, M.; Doeleman, S.S.; Fish, V.; et al. Greenland telescope project: Direct confirmation of black hole with sub-millimeter VLBI. Radio Sci. 2014, 49, 564–571. [Google Scholar] [CrossRef] [Green Version]
  2. Hobiger, T.; Kondo, T.; Schuh, H. Very long baseline interferometry as a tool to probe the ionosphere. Radio Sci. 2006, 41, 1–10. [Google Scholar] [CrossRef]
  3. Brunthaler, A.; Reid, M.; Menten, K.; Zheng, X.-W.; Bartkiewicz, A.; Choi, Y.; Dame, T.; Hachisuka, K.; Immer, K.; Moellenbrock, G.; et al. The Bar and Spiral Structure Legacy (BeSSeL) survey: Mapping the Milky Way with VLBI astrometry. Astron. Nachrichten 2011, 332, 461–466. [Google Scholar] [CrossRef] [Green Version]
  4. Cotton, W.D. Very Long Baseline Interferometry. In High Angular Resolution in Astrophysics; Springer: Dordrecht, The Netherlands, 1997; pp. 165–191. [Google Scholar]
  5. Meeks, M.; Ball, J.; Hull, A. The pointing calibration of the Haystack antenna. IEEE Trans. Antennas Propag. 1968, 16, 746–751. [Google Scholar] [CrossRef]
  6. Guiar, C.; Lansing, F.; Riggs, R. Antenna Pointing Systematic Error Model Derivations; NASA Technical Reports Server: Washington, DC, USA, 1987. [Google Scholar]
  7. Kong, D.-Q.; Wang, S.-G.; Wang, J.-Q.; Wang, M.; Zhang, H.-B. A new calibration model for pointing a radio telescope that considers nonlinear errors in the azimuth axis. Res. Astron. Astrophys. 2014, 14, 733–740. [Google Scholar] [CrossRef]
  8. Gawronski, W.; Baher, F.; Gama, E. Track level compensation look-up table improves antenna pointing precision. Interplanet. Netw. Prog. Rep. 2006, 6273, 627316. [Google Scholar] [CrossRef] [Green Version]
  9. Titov, O.; Tregoning, P. Effect of post-seismic deformation on earth orientation parameter estimates from VLBI observations: A case study at Gilcreek, Alaska. J. Geodesy 2005, 79, 196–202. [Google Scholar] [CrossRef]
  10. Eisentraeger, P.; Suess, M. Verification of the active deformation compensation system of the LMT/GTM by end-to-end simulations. In Radio Telescopes; SPIE: Bellingham, DC, USA, 2000; Volume 4015, pp. 488–497. [Google Scholar] [CrossRef]
  11. Cullum, M.; Spyromilio, J. Thermal and wind control of the VLT. In Proceedings of the Telescope Structures, Enclosures, Controls, Assembly/Integration/Validation, and Commissioning, Munich, Germany, 27 March–1 April 2000; pp. 194–201. [Google Scholar] [CrossRef]
  12. Schüler, T.; Kronschnabl, G.; Plötz, C.; Neidhardt, A.; Bertarini, A.; Bernhart, S.; La Porta, L.; Halsig, S.; Nothnagel, A. Initial Results Obtained with the First TWIN VLBI Radio Telescope at the Geodetic Observatory Wettzell. Sensors 2015, 15, 18767–18800. [Google Scholar] [CrossRef] [Green Version]
  13. Gawronski, W.; Souccar, K. Control systems of the Large Millimeter Telescope. In Astronomical Structures and Mechanisms Technology; IEEE: Piscataway, NJ, USA, 2004; Volume 5495, pp. 104–115. [Google Scholar] [CrossRef] [Green Version]
  14. Gawronski, W. Modeling wind-gust disturbances for the analysis of antenna pointing accuracy. IEEE Antennas Propag. Mag. 2004, 46, 50–58. [Google Scholar] [CrossRef]
  15. Gawronski, W.; Bienkiewicz, B.; Hill, R.E. Pointing-error simulations of the DSS-13 antenna due to wind disturbances. TDA Prog. Rep. 1992, 7477, 109–134. [Google Scholar]
  16. Gawronski, W. Control and pointing challenges of antennas and telescopes. In Proceedings of the 2005, American Control Conference 2005, Portland, OR, USA, 8–10 June 2005; Volume 6, pp. 3758–3769. [Google Scholar] [CrossRef]
  17. Kareem, A.; Kijewski, T.; Tamura, Y. Mitigation of motions of tall buildings with specific examples of recent applications. Wind. Struct. An Int. J. 1999, 2, 201–251. [Google Scholar] [CrossRef] [Green Version]
  18. Tsioustas, C.; Loupis, M. Design, simulation and experimental verification of an active inductance for a low frequency tuned mass damper in an aircraft fuselage active vibration cancellation system. In Proceedings of the 2018 International Symposium on Industrial Electronics INDEL 2018, Banja Luka, Bosnia and Herzegovina, 1–3 November 2018; pp. 4–8. [Google Scholar] [CrossRef]
  19. Connor, J.J. Introduction to Structural Motion Control; Prentice Hall Pearson Education, Incorporated: Upper Saddle River, NJ, USA, 2003. [Google Scholar]
  20. Zhang, Z.; Høeg, C. Inerter-enhanced tuned mass damper for vibration damping of floating offshore wind turbines. Ocean Eng. 2021, 223, 108663. [Google Scholar] [CrossRef]
  21. Chen, D.; Huang, S.; Huang, C.; Liu, R.; Ouyang, F. Passive control of jacket–type offshore wind turbine vibrations by single and multiple tuned mass dampers. Mar. Struct. 2020, 77, 102938. [Google Scholar] [CrossRef]
  22. del Campo, J.O.M.; Pozos-Estrada, A.; Pozos-Estrada, O. Development of fragility curves of land-based wind turbines with tuned mass dampers under cyclone and seismic loading. Wind. Energy 2021, 24, 737–753. [Google Scholar] [CrossRef]
  23. Boonyapinyo, V.; Aksorn, A.; Lukkunaprasit, P. Suppression of aerodynamic response of suspension bridges during erection and after completion by using tuned mass dampers. Wind. Struct. 2007, 10, 1–22. [Google Scholar] [CrossRef]
  24. Lin, Y.-Y.; Cheng, C.-M.; Lee, C.-H. A tuned mass damper for suppressing the coupled flexural and torsional buffeting response of long-span bridges. Eng. Struct. 2000, 22, 1195–1204. [Google Scholar] [CrossRef]
  25. Xu, Y.; Kwok, K.; Samali, B. Control of wind-induced tall building vibration by tuned mass dampers. J. Wind. Eng. Ind. Aerodyn. 1992, 40, 1–32. [Google Scholar] [CrossRef]
  26. Xu, K.; Bi, K.; Han, Q.; Li, X.; Du, X. Using tuned mass damper inerter to mitigate vortex-induced vibration of long-span bridges: Analytical study. Eng. Struct. 2019, 182, 101–111. [Google Scholar] [CrossRef]
  27. Jiang, Z. The impact of a passive tuned mass damper on offshore single-blade installation. J. Wind. Eng. Ind. Aerodyn. 2018, 176, 65–77. [Google Scholar] [CrossRef]
  28. Ubertini, F.; Comanducci, G.; Laflamme, S. A parametric study on reliability-based tuned-mass damper design against bridge flutter. J. Vib. Control. 2017, 23, 1518–1534. [Google Scholar] [CrossRef]
  29. Kwok, K.; Samali, B. Performance of tuned mass dampers under wind loads. Eng. Struct. 1995, 17, 655–667. [Google Scholar] [CrossRef]
  30. MathWorks. MATLAB Software. Available online: https://www.mathworks.com/products/matlab.html (accessed on 20 July 2022).
  31. MacNeal, R.H. The NASTRAN Theoretical Manual; Scientific and Technical Information Office, National Aeronautics and Space Administration: Washington, DC, USA, 1970.
  32. Albano, E.; Rodden, W.P. A doublet-lattice method for calculating lift distributions on oscillating surfaces in subsonic flows. AIAA J. 1969, 7, 279–285. [Google Scholar] [CrossRef]
  33. Craig, R.R.; Bampton, M.C.C. Coupling of substructures for dynamic analyses. AIAA J. 1968, 6, 1313–1319. [Google Scholar] [CrossRef] [Green Version]
  34. Libelli, S.M.; Alba, P. Adaptive Mutation in Genetic Algorithms. Soft Comput. 2000, 4, 76–80. [Google Scholar] [CrossRef]
  35. Lu, L.; Anderson-Cook, C.M.; Robinson, T.J. Optimization of Designed Experiments Based on Multiple Criteria Utilizing a Pareto Frontier. Technometrics 2011, 53, 353–365. [Google Scholar] [CrossRef]
  36. Kasprzak, E.; Lewis, K. Pareto analysis in multiobjective optimization using the collinearity theorem and scaling method. Struct. Multidiscip. Optim. 2001, 22, 208–218. [Google Scholar] [CrossRef]
  37. Szparaga, A.; Stachnik, M.; Czerwińska, E.; Kocira, S.; Dymkowska-Malesa, M.; Jakubowski, M. Multi-objective optimization based on the utopian point method applied to a case study of osmotic dehydration of plums and its storage. J. Food Eng. 2018, 245, 104–111. [Google Scholar] [CrossRef]
  38. Gasparetto, V.E.L.; Reid, J.; Parsons, W.P.; ElSayed, M.S.A.; Saad, M.; Shieldand, S.; Brown, G.L.; Hilliard, L.M. Multi-Objective Design Optimization of Multiple Tuned Mass Dampers for Attenuation of Dynamic Aeroelastic Response of Aerospace Structures. Aerospace 2023, 10, 235. [Google Scholar] [CrossRef]
  39. Thomas, P.V.; ElSayed, M.S.A.; Walch, D. Review of Model Order Reduction Methods and Their Applications in Aeroelasticity Loads Analysis for Design Optimization of Complex Airframes. J. Aerosp. Eng. 2019, 32, 04018156. [Google Scholar] [CrossRef]
  40. Allemang, R.J. The modal assurance criterion–Twenty years of use and abuse. Sound Vib. 2003, 37, 14–21. [Google Scholar]
  41. Boivin, A.; Boilard, F.; Messier, P.L.; Tremblay, P. MAYA HTT. In 12 m VLBI Antenna Structural Simulation; Internal Report; Intertronics Solutions Inc.: Quebec, QC, Canada, 2014. [Google Scholar]
  42. Nieto, M.G.; Thomas, P.V.; ElSayed, M.S.A.; Saad, M.; Brown, G.L.; Hilliard, L.M. Development of Efficient Dynamic Aeroelasticity Model for High Fidelity Pointing Accuracy Assessment of VLBI Earth-Based Radio Antennas. Int. J. Aeronaut. Space Sci. 2020, 21, 693–706. [Google Scholar] [CrossRef]
  43. Davenport, A.G. The spectrum of horizontal gustiness near the ground in high winds. Q. J. R. Meteorol. Soc. 1962, 88, 197–198. [Google Scholar] [CrossRef]
  44. Orban, F. Damping of materials and members in structures. J. Physics Conf. Ser. 2011, 268, 012022. [Google Scholar] [CrossRef]
  45. Roughen, K.M.; Baker, M.L.; Fogarty, T. Computational Fluid Dynamics and Doublet-Lattice Calculation of Unsteady Control Surface Aerodynamics. J. Guid. Control. Dyn. 2001, 24, 160–166. [Google Scholar] [CrossRef]
  46. Warburton, G.B. Optimum absorber parameters for various combinations of response and excitation parameters. Earthq. Eng. Struct. Dyn. 1982, 10, 381–401. [Google Scholar] [CrossRef]
  47. Thomas, P.V.; ElSayed, M.S.; Walch, D. Development of high fidelity reduced order hybrid stick model for aircraft dynamic aeroelasticity analysis. Aerosp. Sci. Technol. 2019, 87, 404–416. [Google Scholar] [CrossRef]
  48. Abd-Elwahab, M.; Sherif, H.A. Pre-tensioned Layer Damping as a New Approach for Vibration Control of Elastic Beams. J. Vib. Acoust. 2006, 128, 338–346. [Google Scholar] [CrossRef]
Figure 1. Optimization framework developed.
Applmech 04 00042 g001
Figure 2. InterTronic Solutions 12 m VLBI antenna FE ROM evolution. (a) The DFEM provided by the industrial partner, (b) The initial ROM created by Nieto et al. [42]. (c) The further reduced ROM implemented within this optimization framework [38].
Applmech 04 00042 g002
Figure 3. Percentage error evaluated for the natural frequencies of the first 25 flexible modes for the ROM—Gasparetto et al. and Nieto et al. [38,42].
Applmech 04 00042 g003
Figure 4. First 25 normal modes correlation between the ROM—Gasparetto et al. and Nieto et al. [38,42].
Applmech 04 00042 g004
Figure 5. Reference and target monitoring grid points chosen for the VLBI antenna.
Applmech 04 00042 g005
Figure 6. Uncontrolled structure response utilizing the PSD excitation modeled with DS. (a) Target node PSD displacement functions of the operational scenarios considered. (b) Correspondent mode shapes for the first two resonance frequencies.
Applmech 04 00042 g006
Figure 7. Target node time–response displacement of the operational scenarios considered for the InterTronic VLBI antenna, utilizing the TDG model.
Applmech 04 00042 g007
Figure 8. Fitness function evaluated for the uncontrolled structure under the (a) PSD excitation modelled with the DS and (b) one-minus cosine gust models.
Applmech 04 00042 g008
Figure 9. Multi-objective Pareto front of all individuals analyzed, indicating the utopian point and the best individual using the STMD for the operational cases 4, 6, 8, and 10 modeled with the DS model.
Applmech 04 00042 g009
Figure 10. Concurrent aeroelastic response minimization using the STMD configuration for the operational cases 4, 6, 8, and 10 modeled with the DS. The PSD displacement functions of the target node are presented for each respective direction, where the color bar indicated represents the percentage of mass inclusion in the antenna.
Applmech 04 00042 g010
Figure 11. Aeroelastic response fitness function comparison between the uncontrolled and the controlled structure with an optimal STMD. Results presented for the Davenport Spectrum model.
Applmech 04 00042 g011
Figure 12. Multi-objective Pareto front of all individuals analyzed, indicating the utopian point and the best individual using the STMD for the operational cases 4, 6, 8, and 10 modeled with the one-minus cosine gust model.
Applmech 04 00042 g012
Figure 13. Concurrent aeroelastic response minimization using the STMD for the operational cases under the one-minus cosine gust model. Time response functions of the target node displacement are presented as a RSSQ of each DOF, where the color bar indicated represents the percentage of mass inclusion in the antenna.
Applmech 04 00042 g013
Figure 14. Aeroelastic response fitness function comparison between the uncontrolled and the controlled structure with an optimal STMD. Results presented for the one-minus cosine gust model.
Applmech 04 00042 g014
Figure 15. Comparison of the aeroelastic response fitness for the (a) PSD and (b) TDG gust models. The best individuals found from the optimization framework are evaluated among both gust models.
Applmech 04 00042 g015
Figure 16. Factorial analysis of design variables considering a constant mass inclusion, for operational case 6. (a) Davenport Spectrum and (b) one-minus cosine gust models.
Applmech 04 00042 g016
Table 1. Computational cost comparison.
ModelComputational Time Analysis—First 30 Flexible Modes (s)
Normal Modes (SOL103)Dynamic Aeroelasticity (SOL146)
DFEM [41]1638.02352.6
ROM—Nieto et al. [42]65.4186.4
ROM—Gasparetto et al. [38]17.761.0
Table 2. Operational cases for the VLBI antenna structure [41].
Case IDDisturbance Speed Δv [in/s]Mean Wind Speed vm [in/s]Mach NumberDynamic Pressure [lb/in3]
134.15109.360.0081730.000555
251.20164.040.0122590.001249
368.20218.720.0163460.002221
485.26273.400.0204320.003470
5102.30328.080.0245190.004997
6 *109.10349.950.0261530.005686
7119.30382.760.0286050.006802
8136.20437.440.0326920.008884
9170.20546.800.0408650.013881
10204.00656.160.0490380.019989
11237.90765.520.0572110.027207
12271.70874.890.0653840.035535
13305.50984.250.0735570.044974
14 339.201093.610.0817300.055524
Note: * Primary operational scenario, Secondary operational scenario.
Table 3. Frequency comparisons between DFEM and the new ROM developed.
Modal Frequency DFEM
SOL103 [Hz]
Frequency ROM
SOL146 [Hz]
Error [%]
2.2142.1881.2
3.9433.8552.2
6.4916.1665.0
8.8438.2416.8
9.1098.4327.4
Table 4. Design variables bounds for the STMD analysis.
BoundsmTMD [lb]cTMD [lbf.s/in]kTMD [lbf/in]
Lower (min.)77.20.30228.40
Upper (max.)3861.0571.017,130.0
Table 5. Best TMD individuals for the PSD and TDG excitation models.
Configuration IDGust Modelm (lb)c (lbf.s/in)k (lbf/in)
APSD8.48 × 1021.67 × 1015.04 × 102
BTDG6.76 × 1026.07 × 1002.93 × 102
Disclaimer/Publisher’s Note: The statements, opinions and data contained in all publications are solely those of the individual author(s) and contributor(s) and not of MDPI and/or the editor(s). MDPI and/or the editor(s) disclaim responsibility for any injury to people or property resulting from any ideas, methods, instructions or products referred to in the content.

