Empirical Investigation of Properties for Additive Manufactured Aluminum Metal Matrix Composites

Abstract
:1. Introduction
2. Materials and Methods
3. Results and Discussion
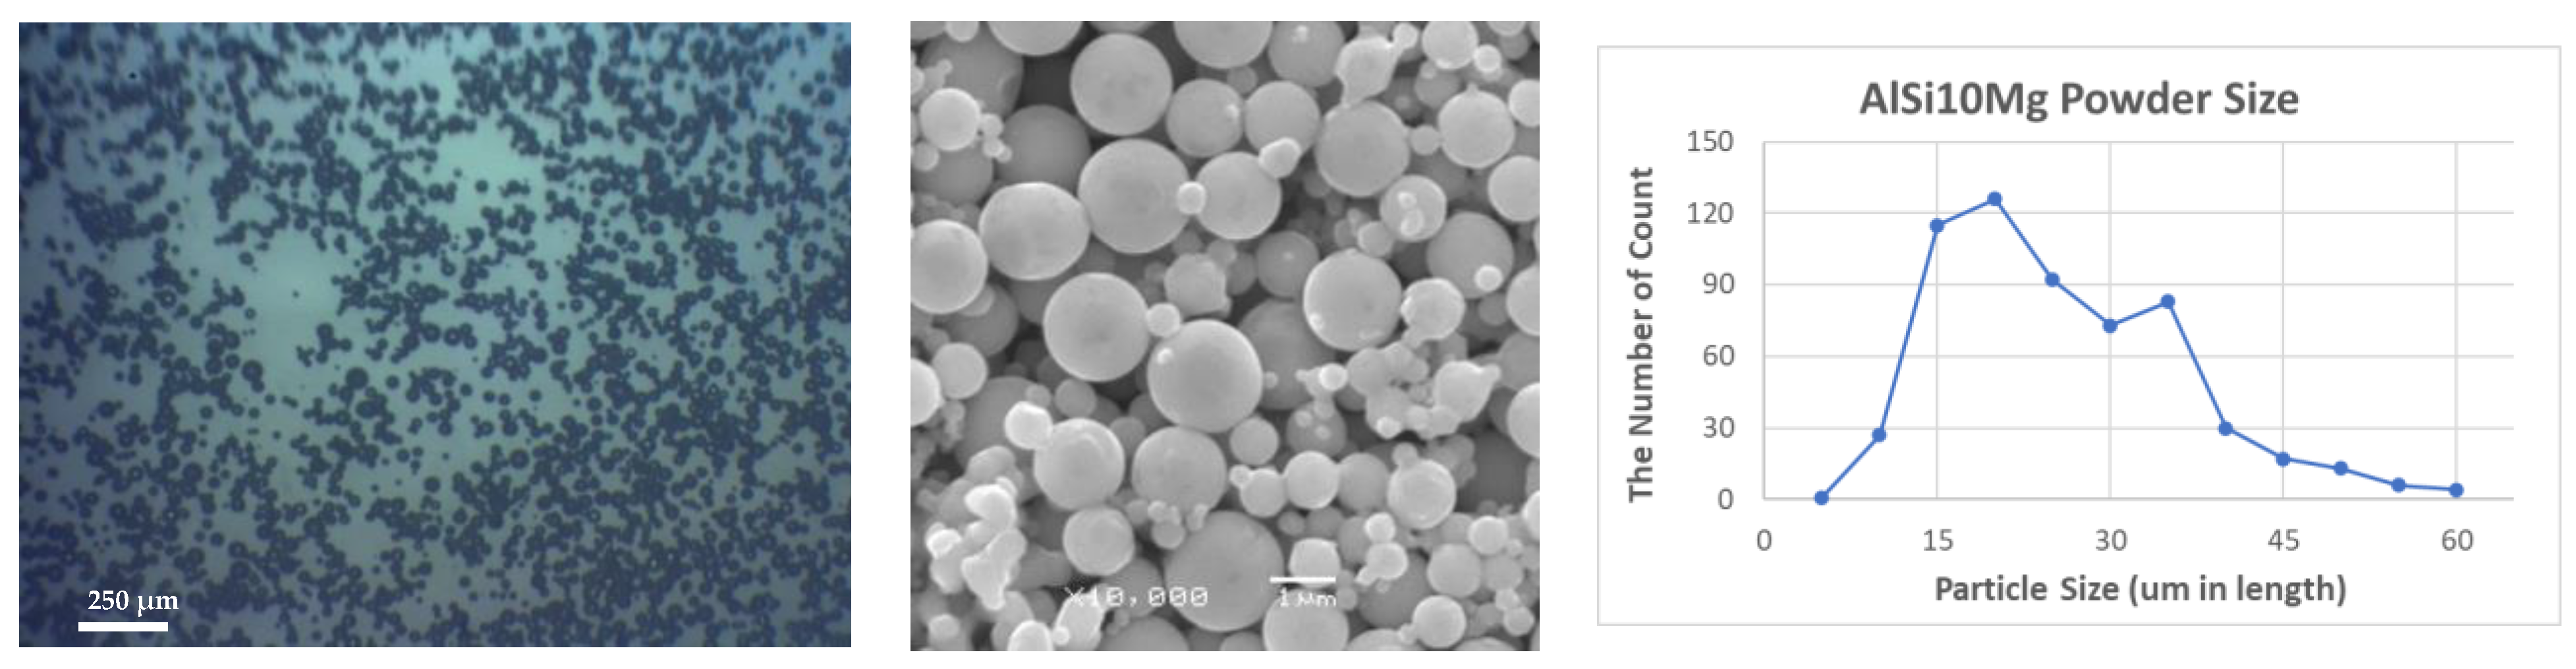
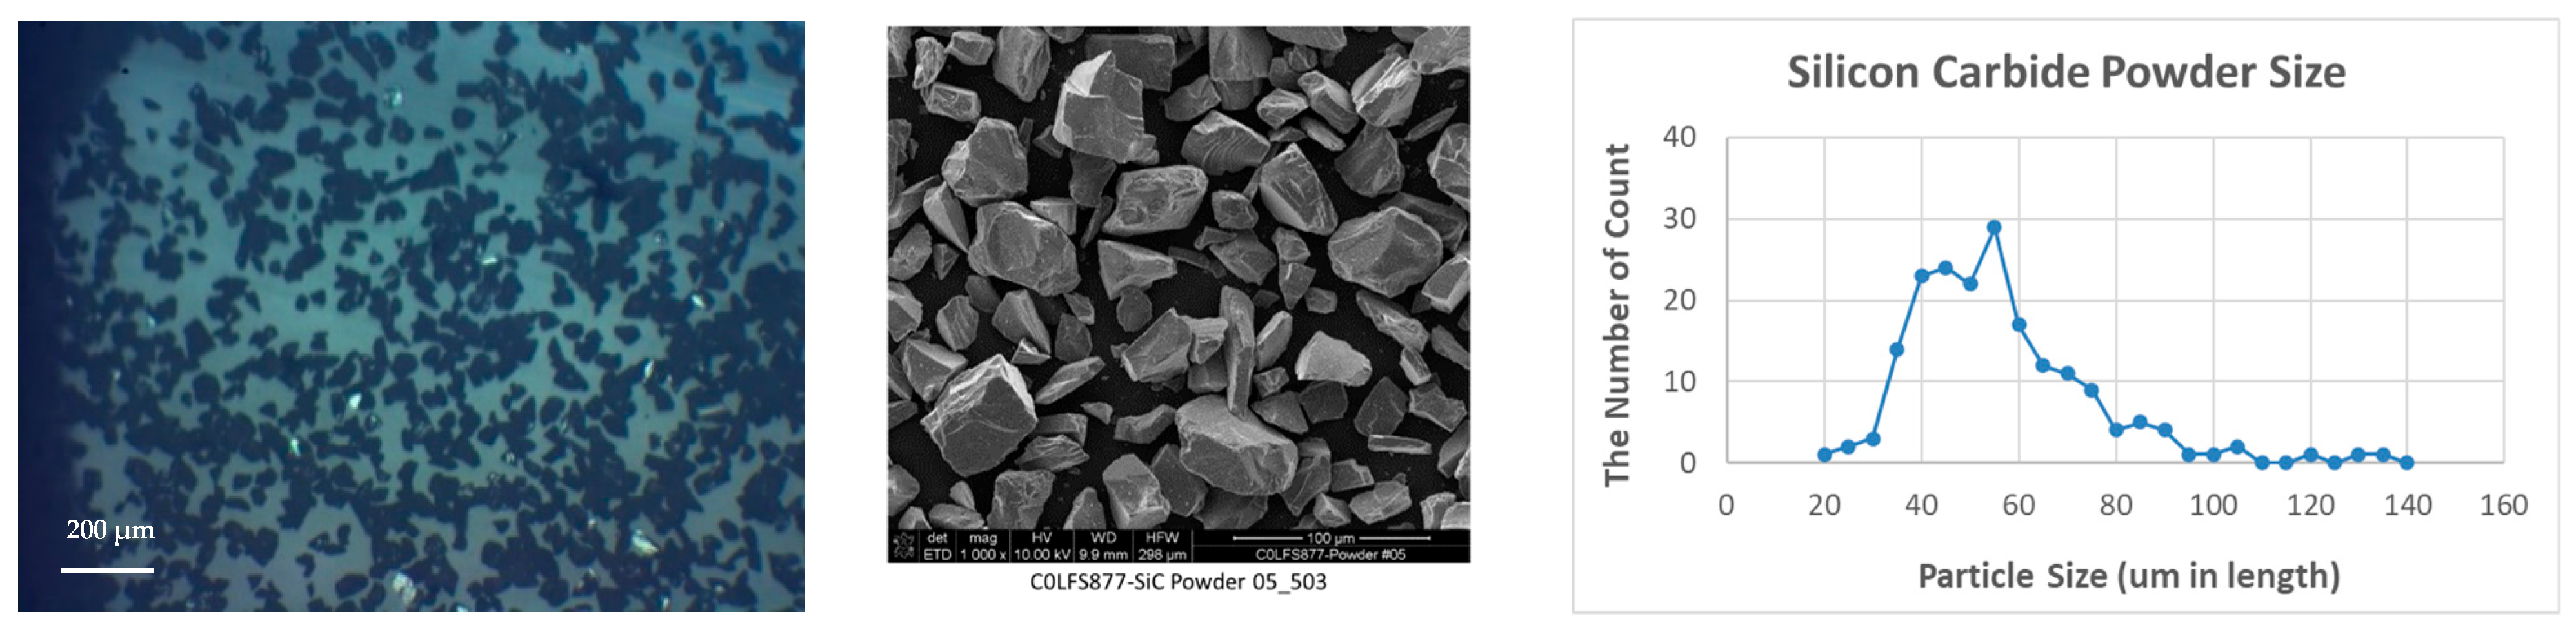
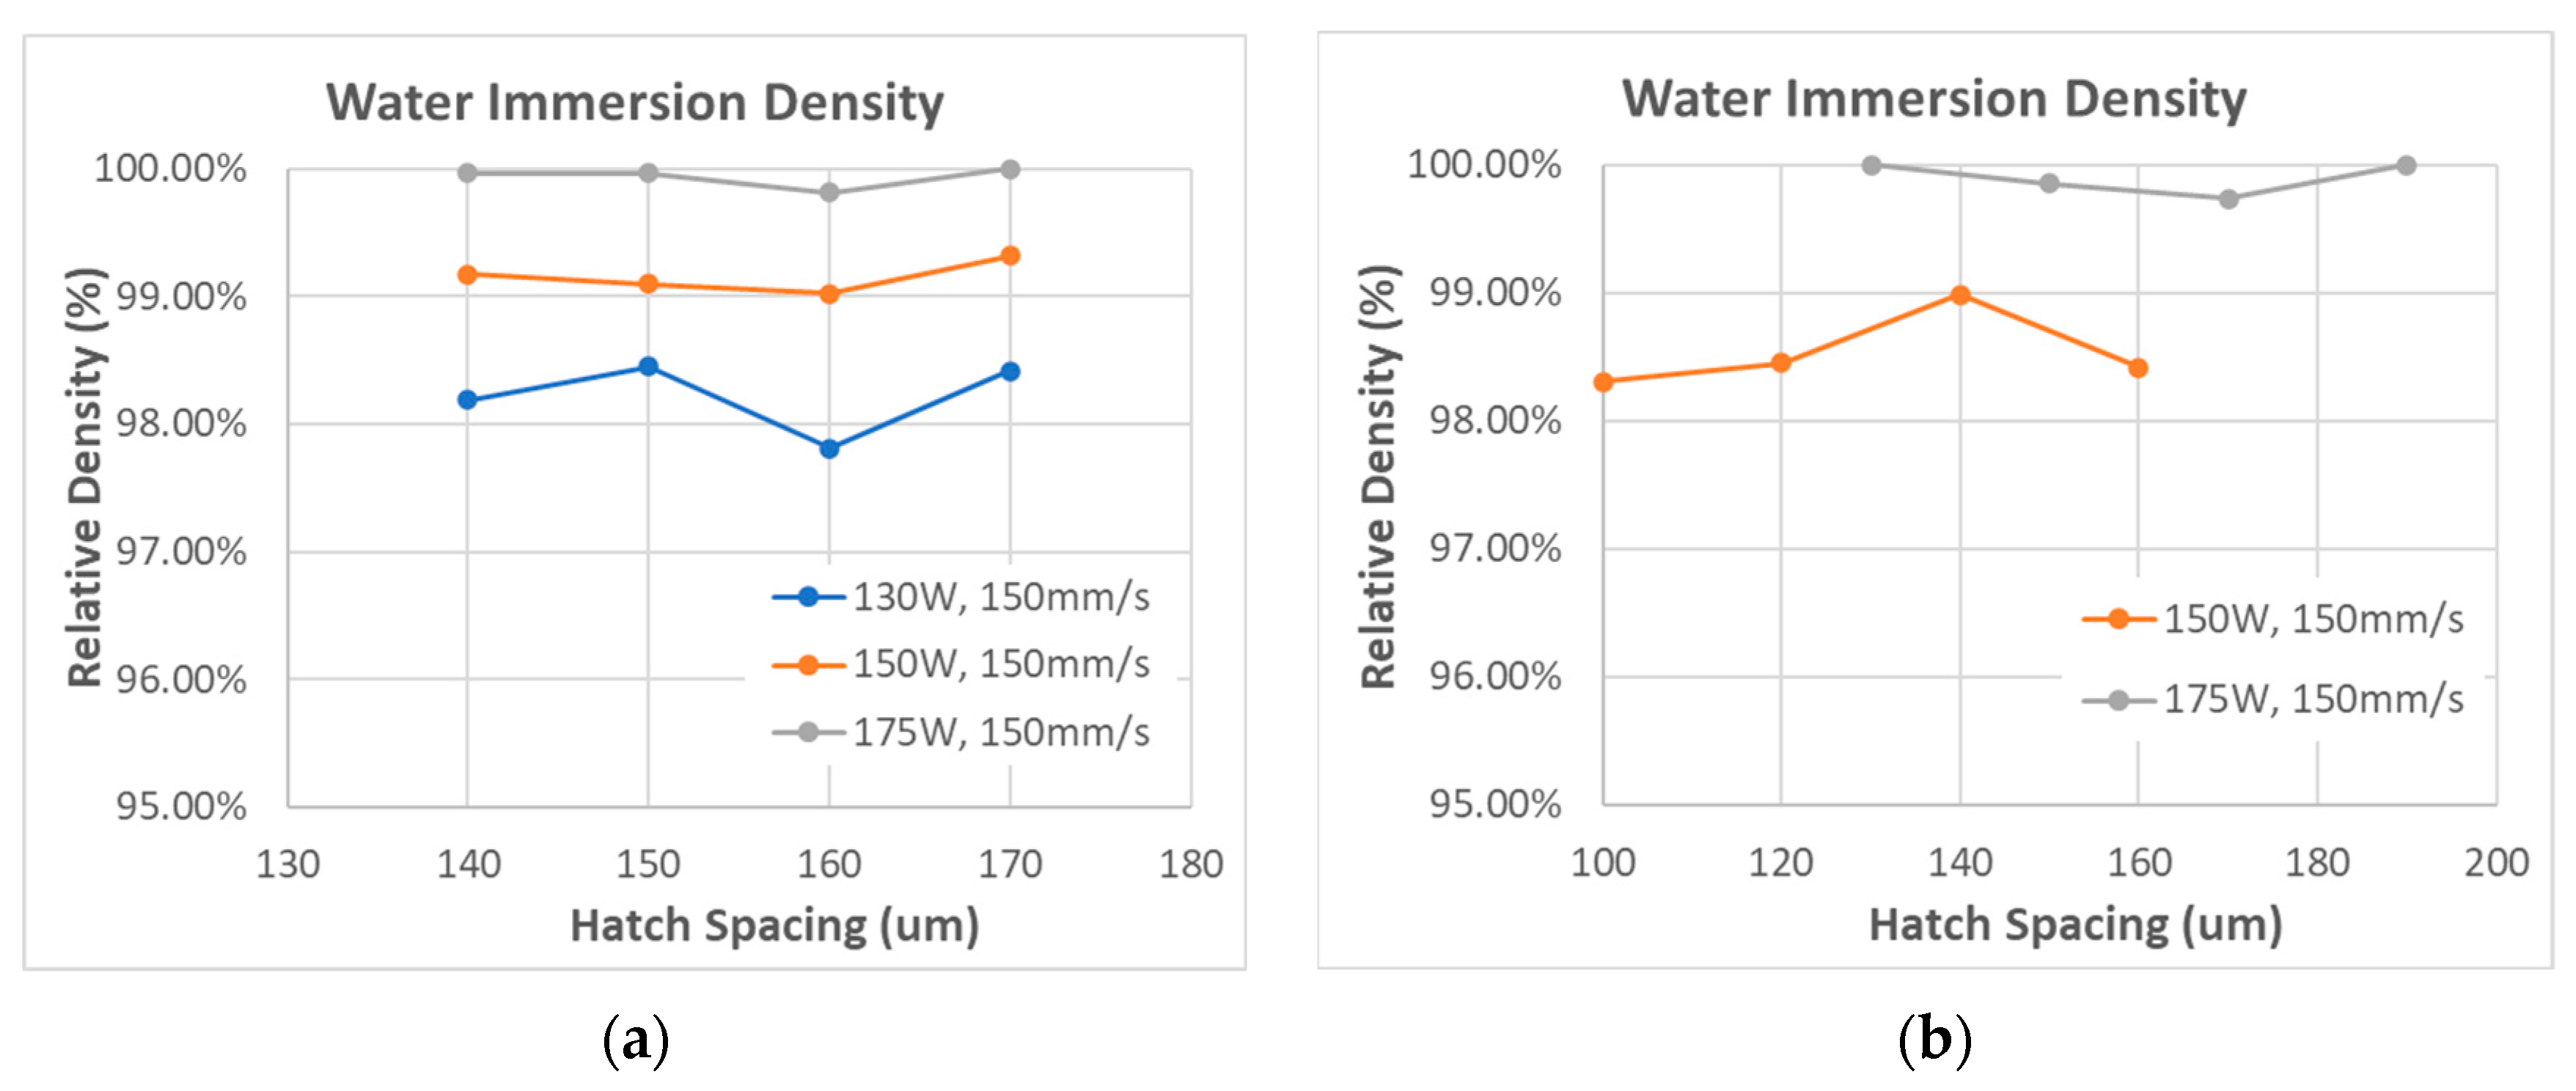
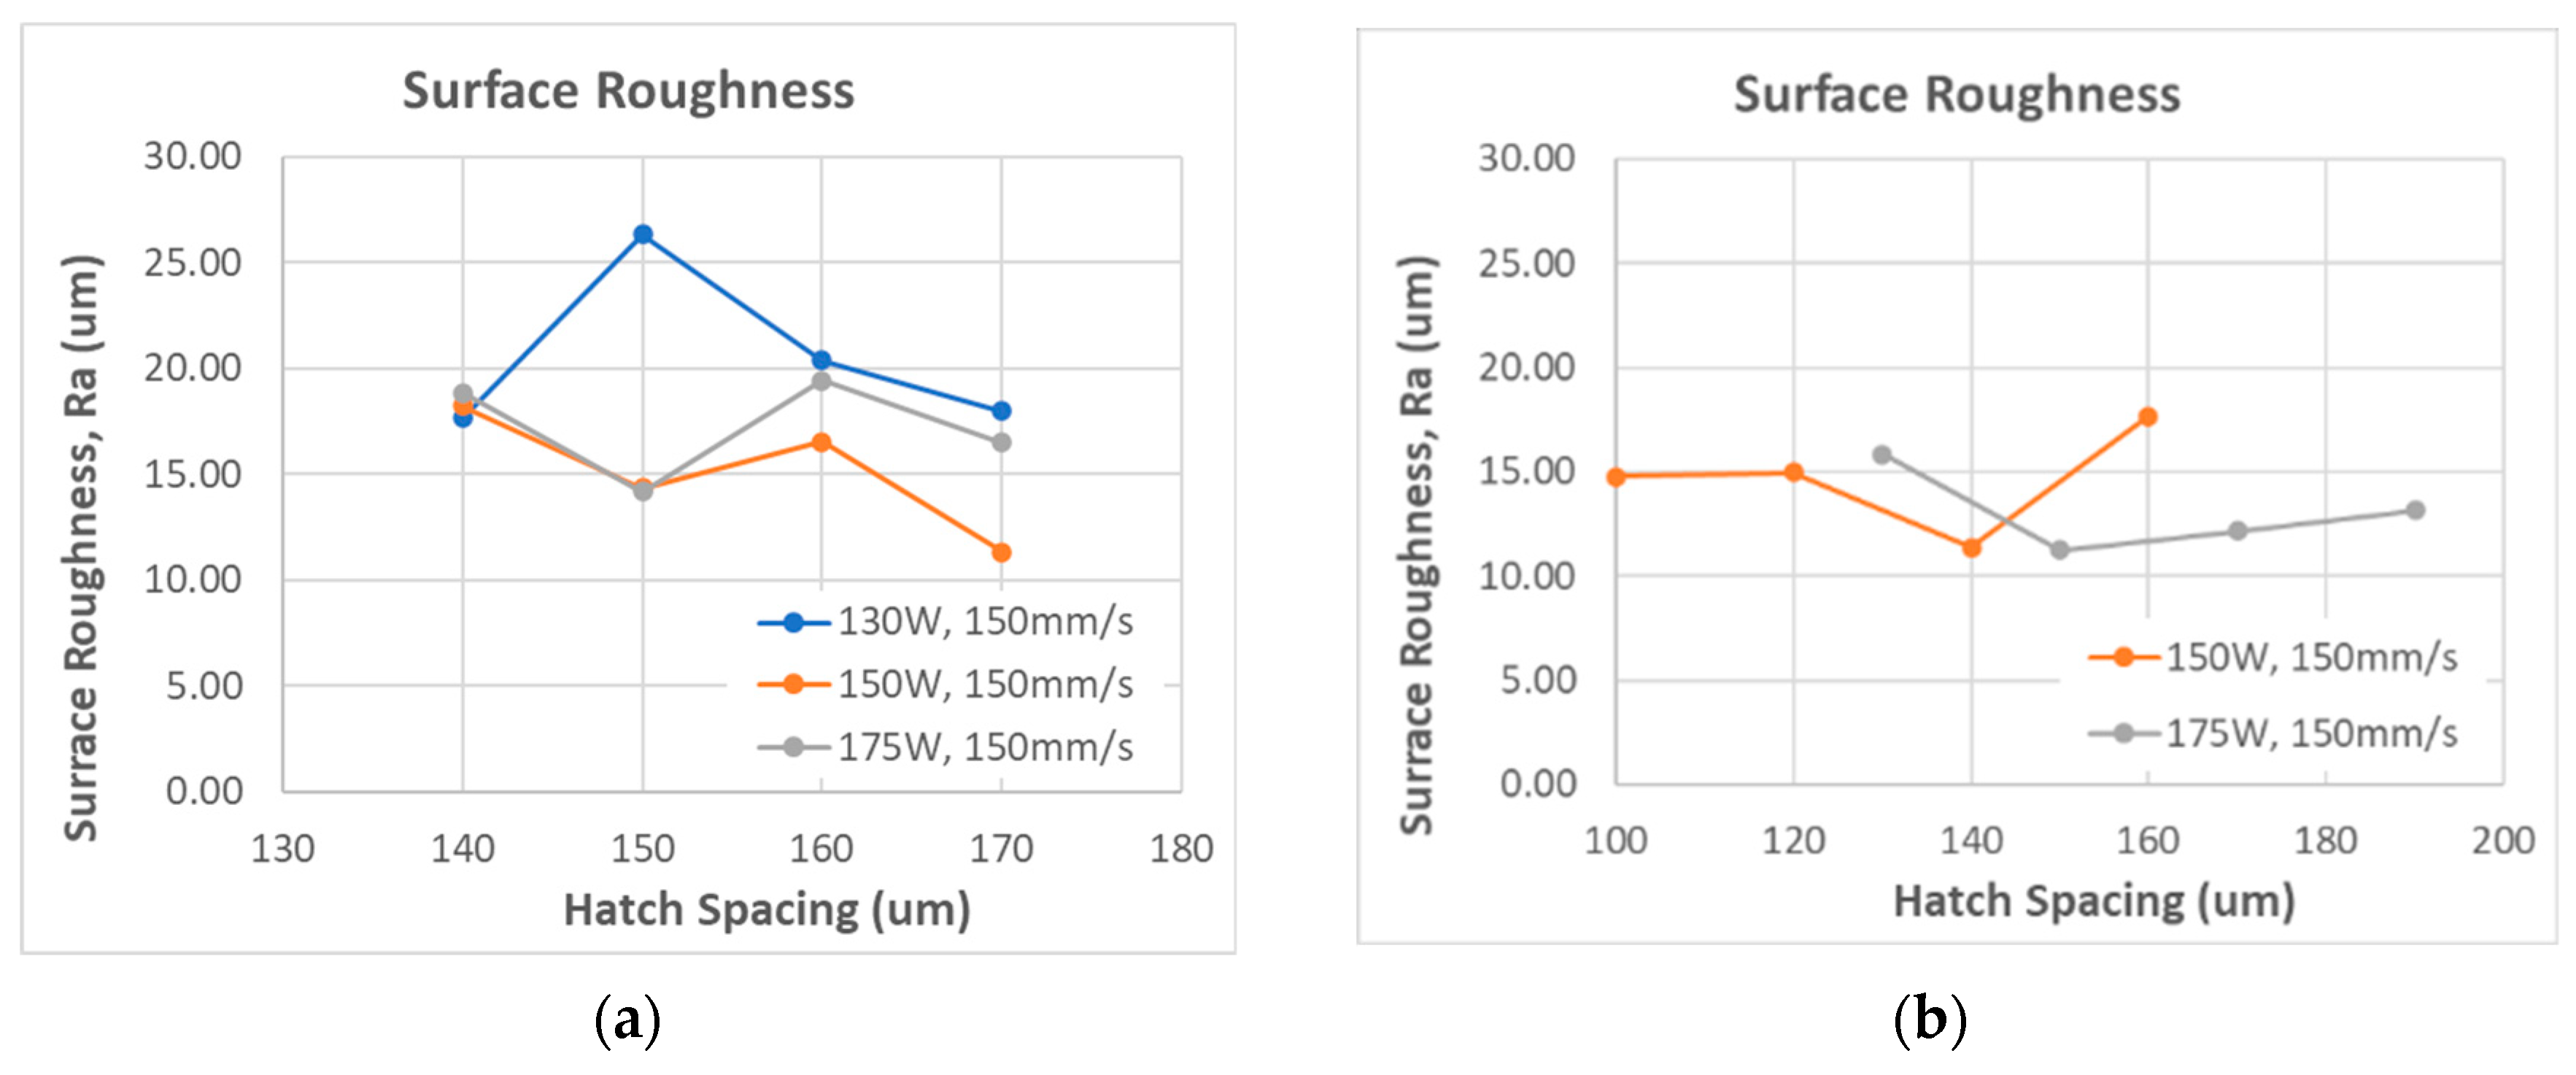
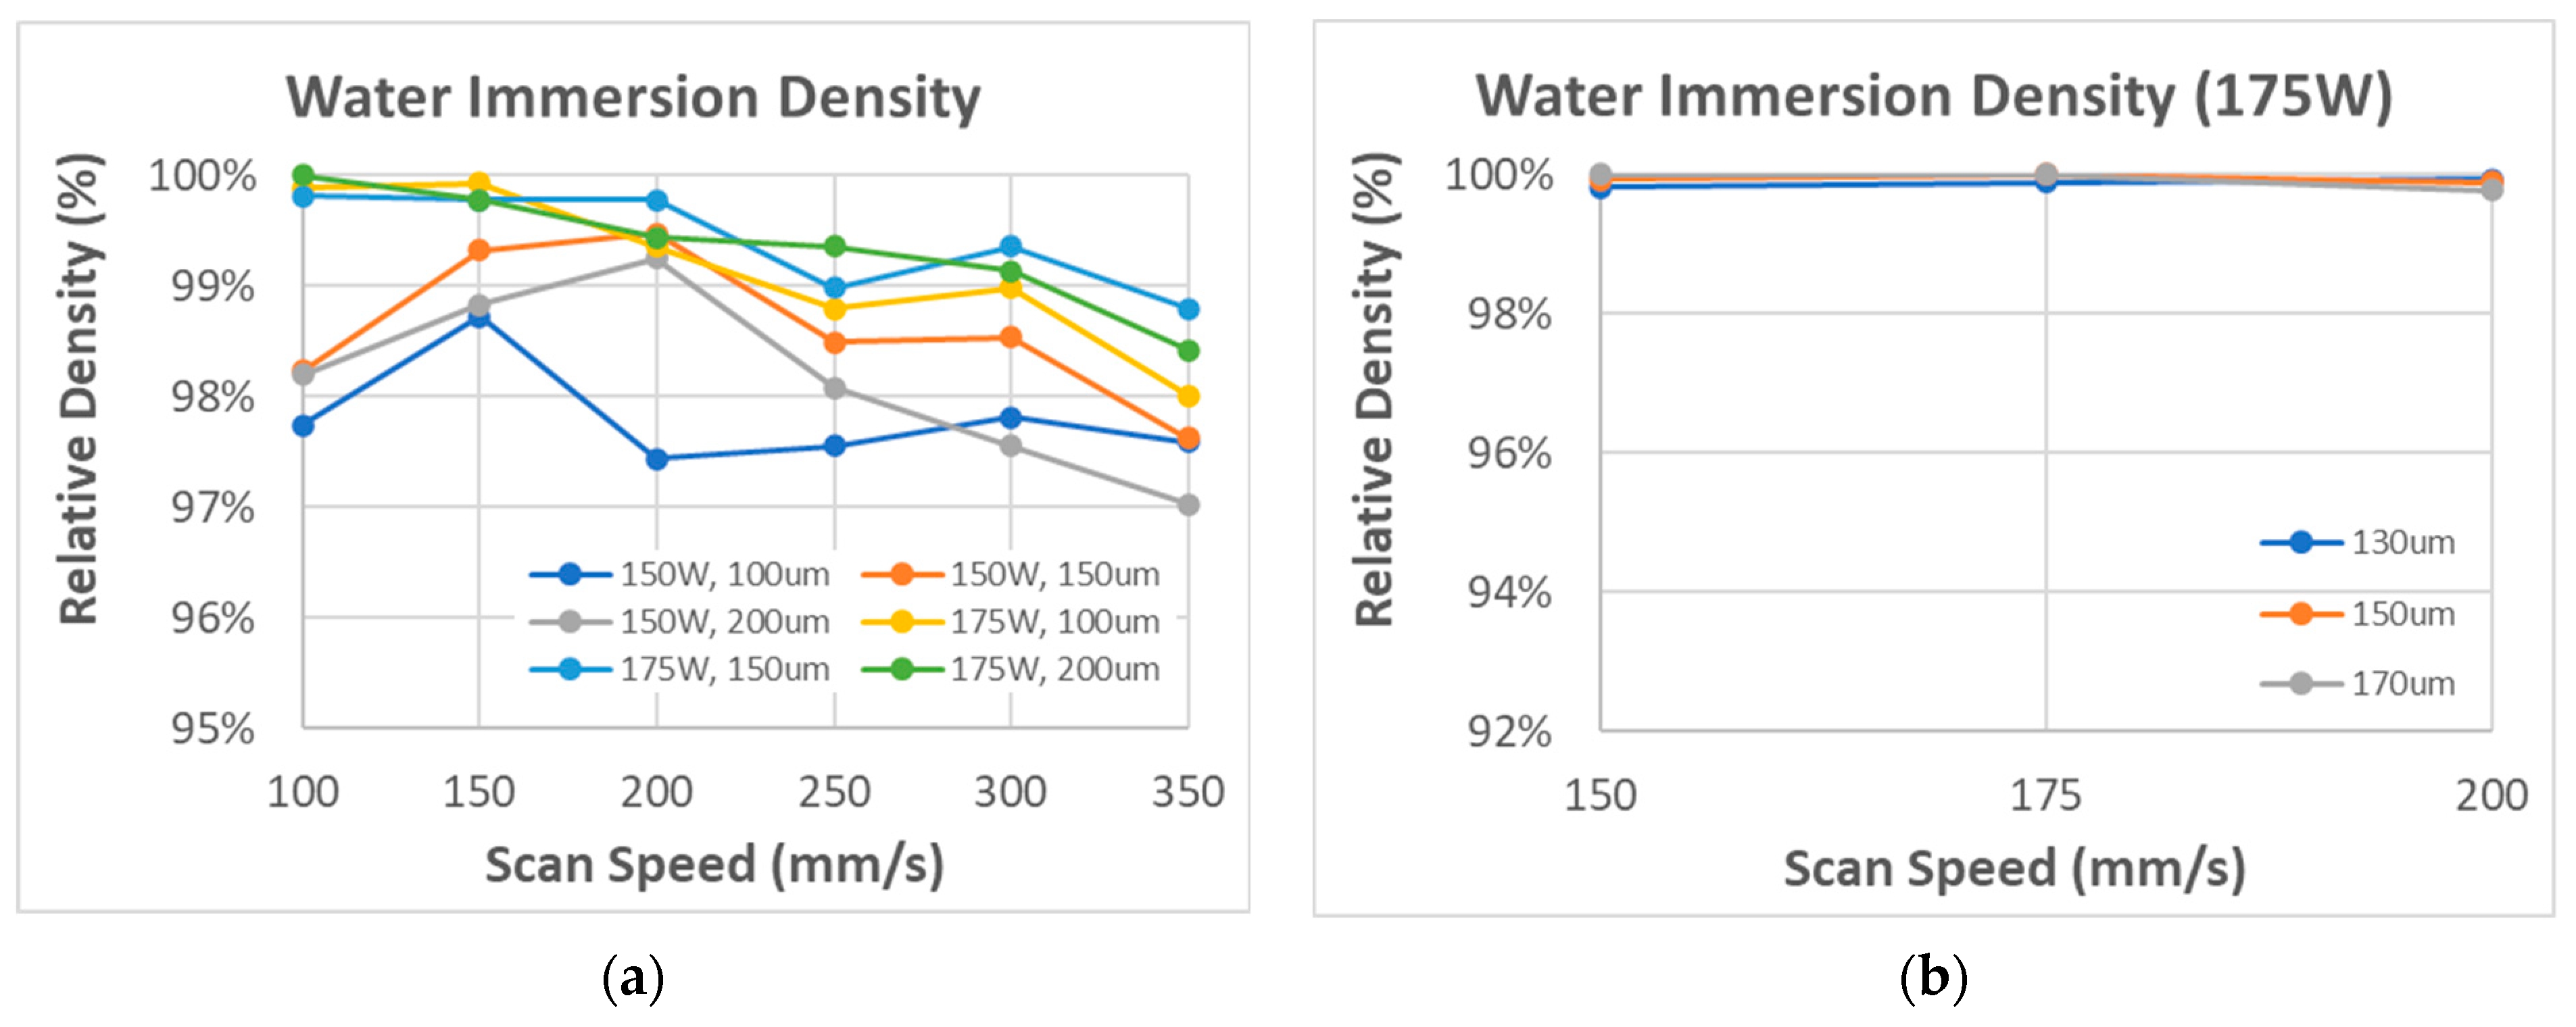
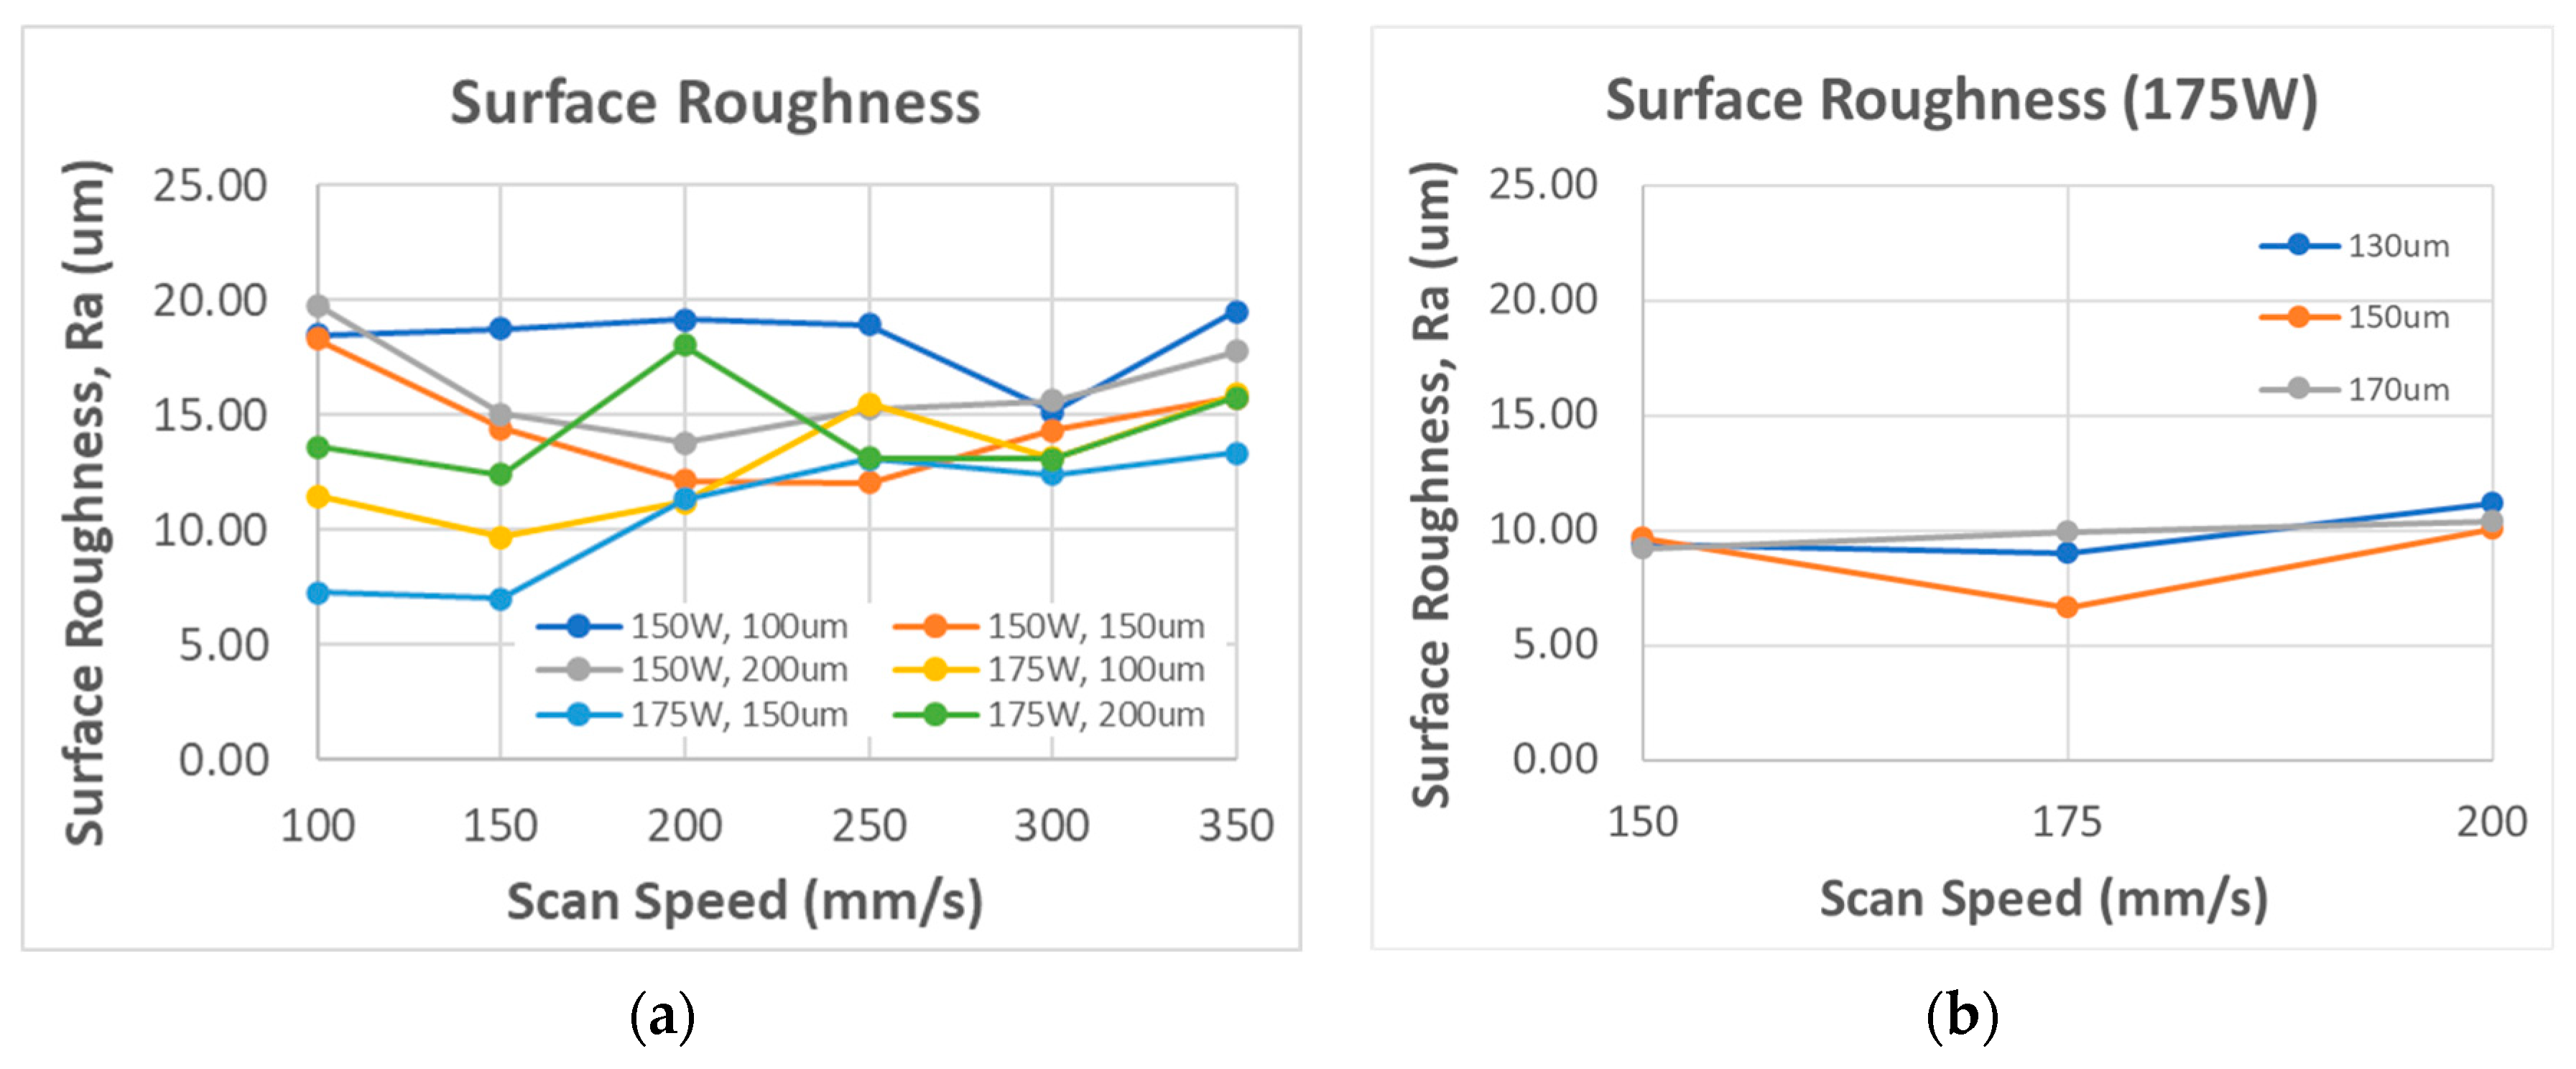
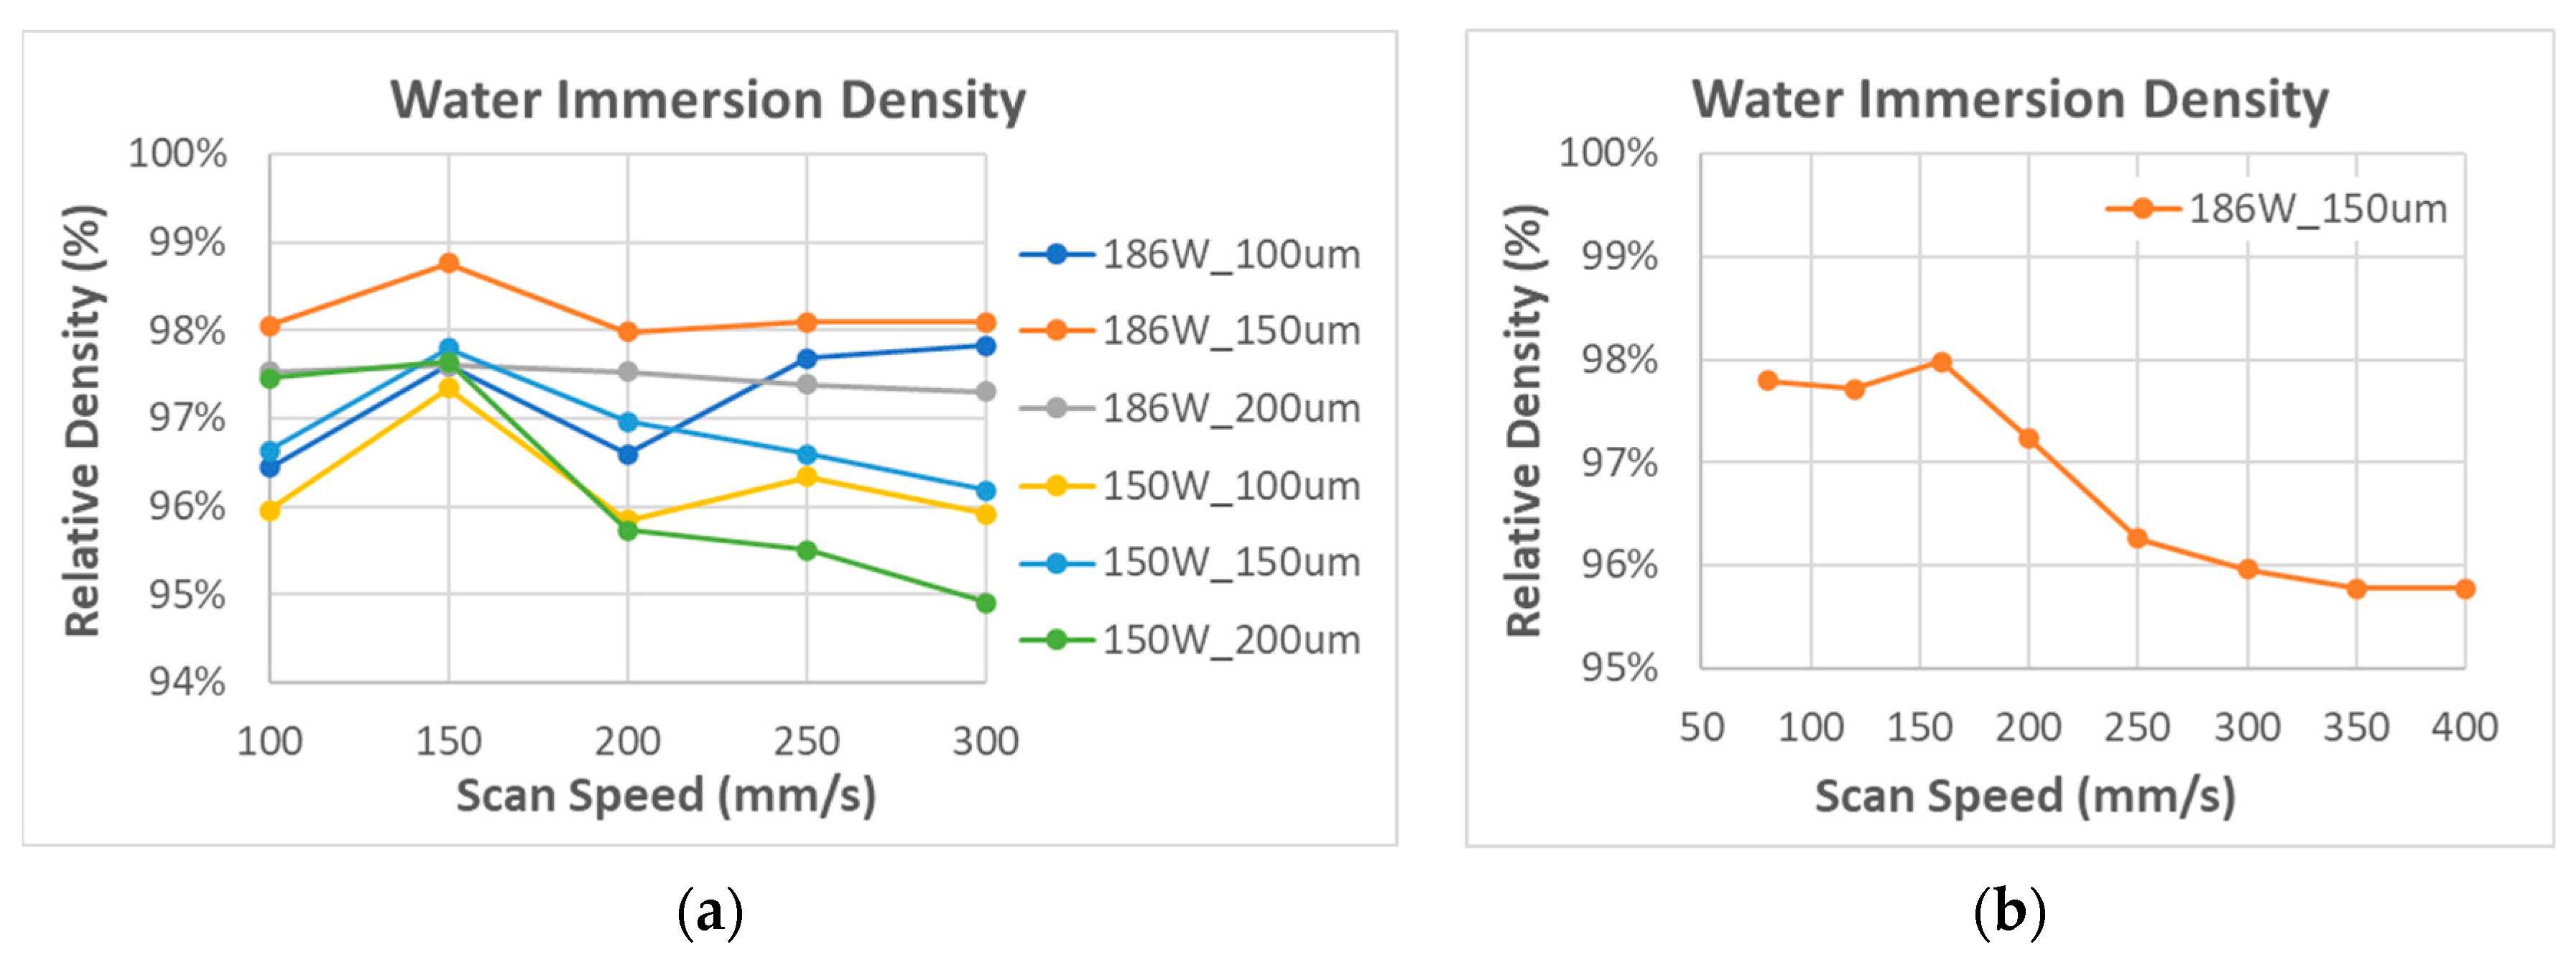
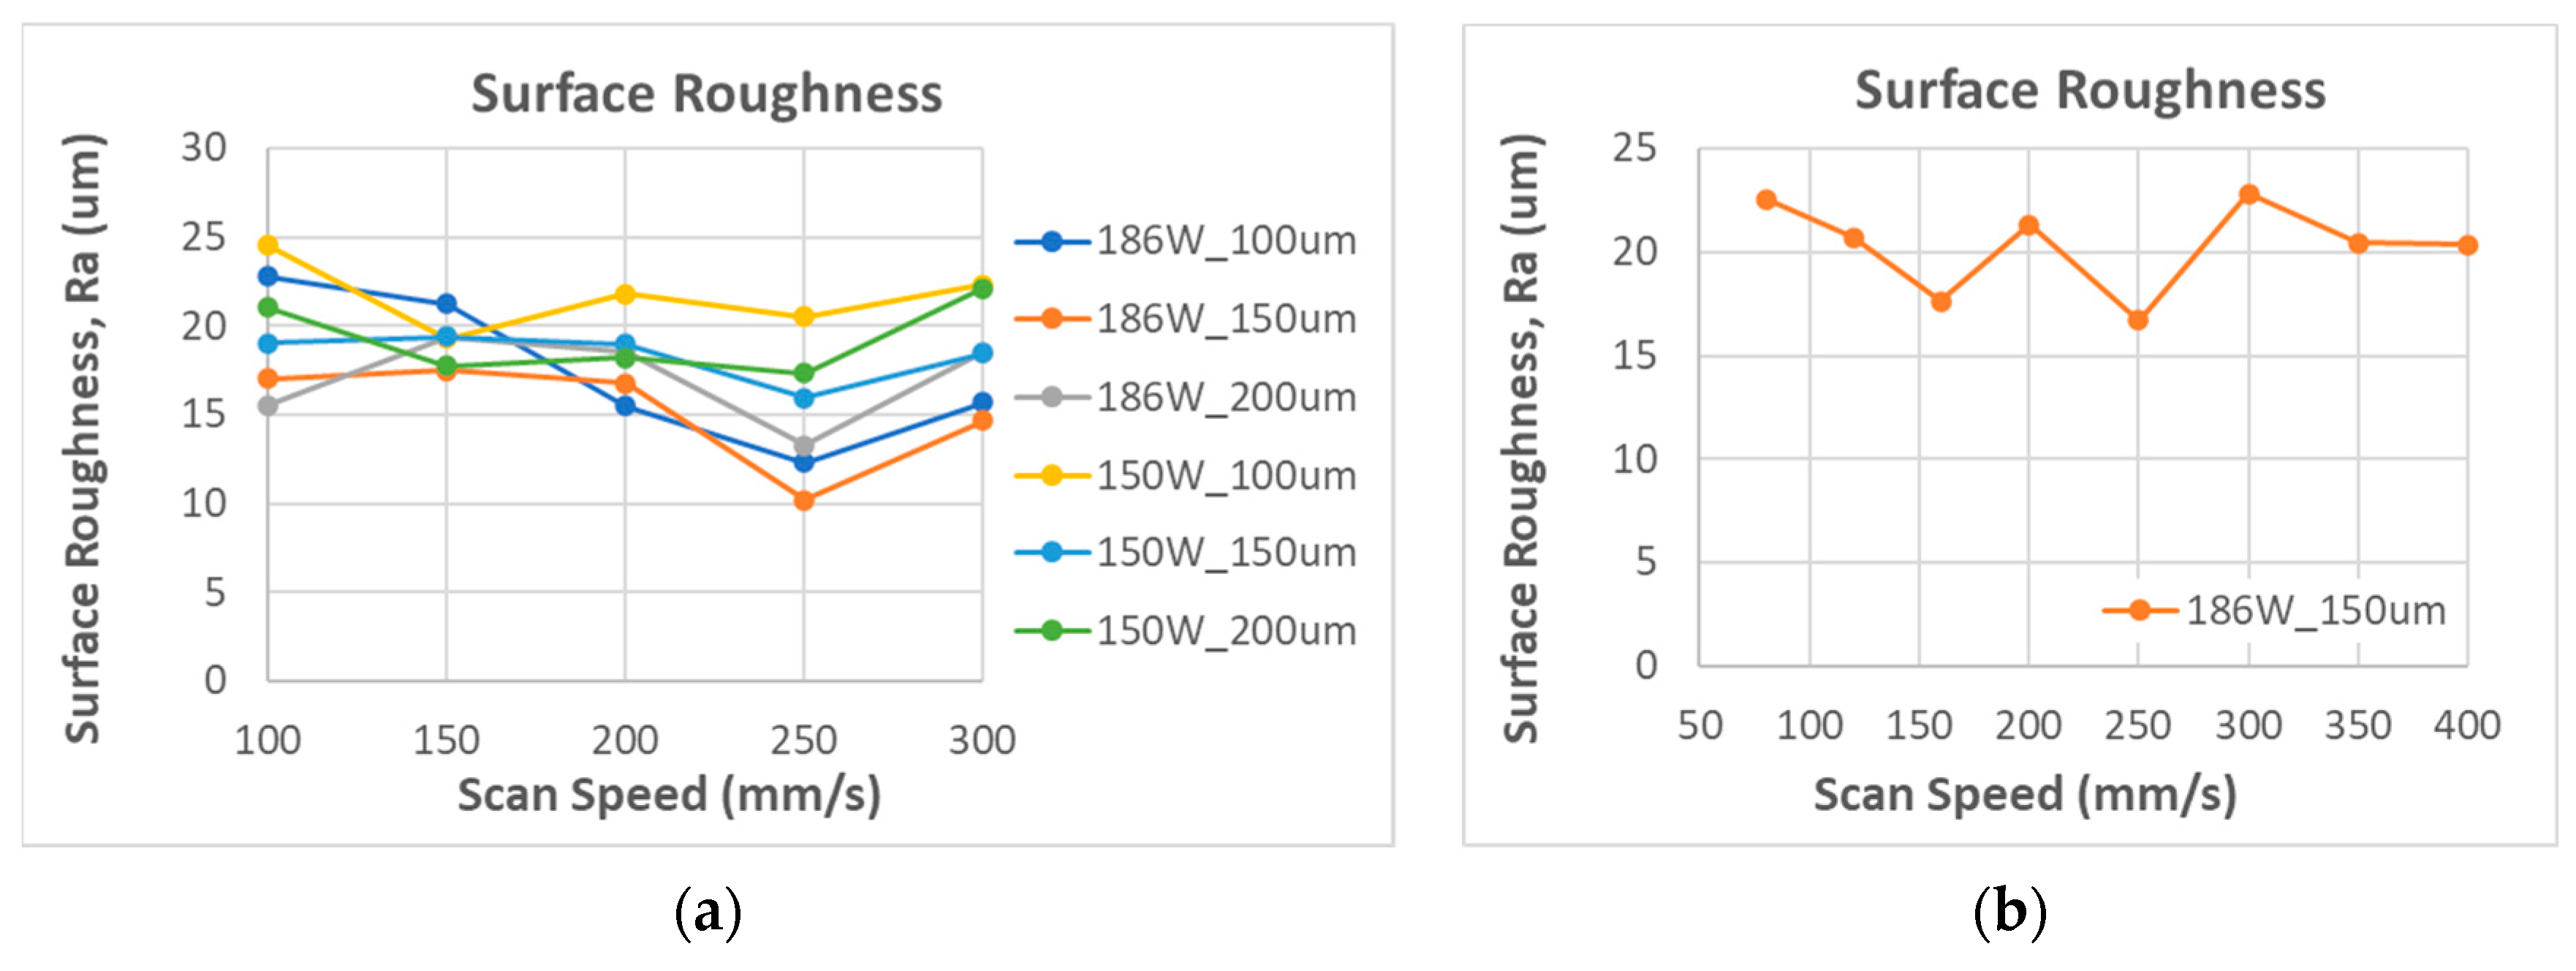
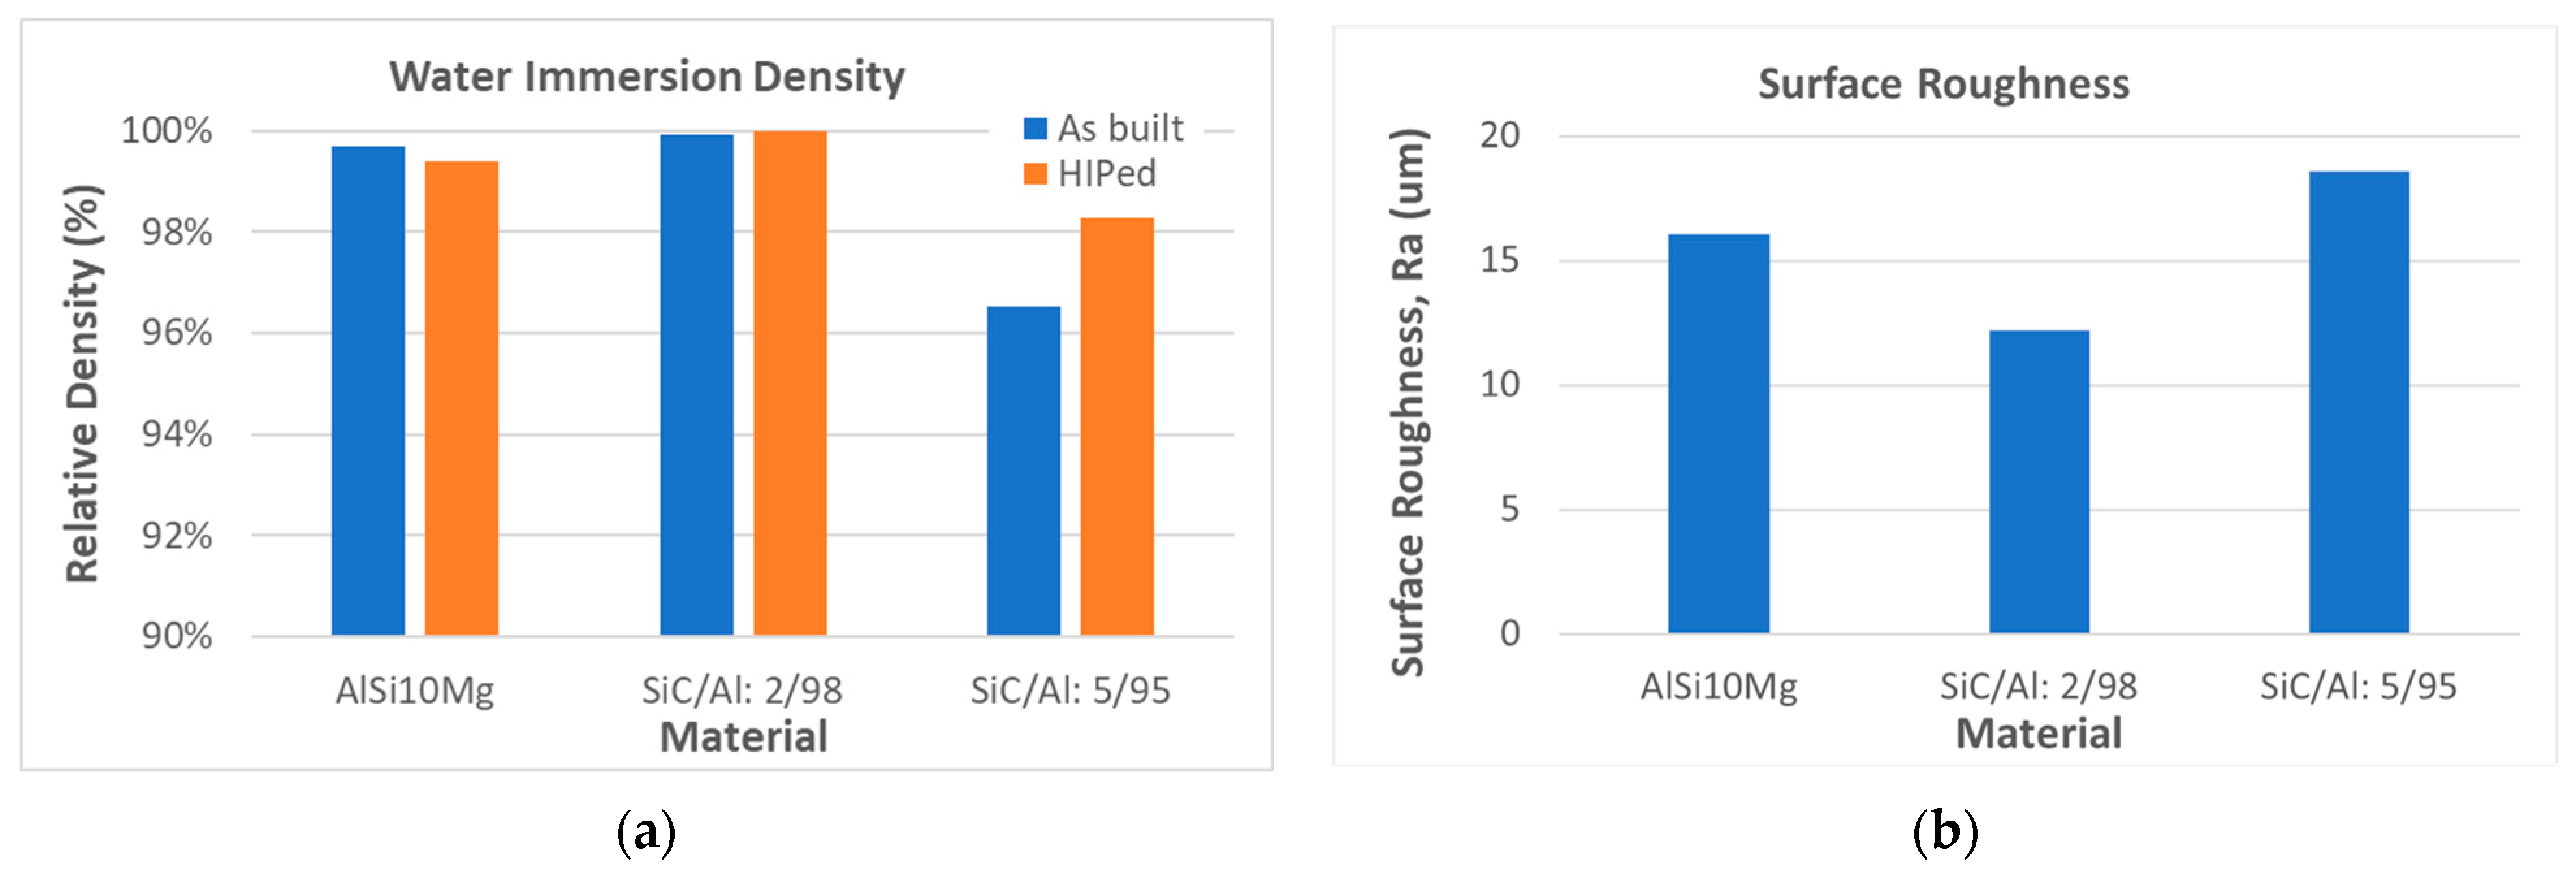
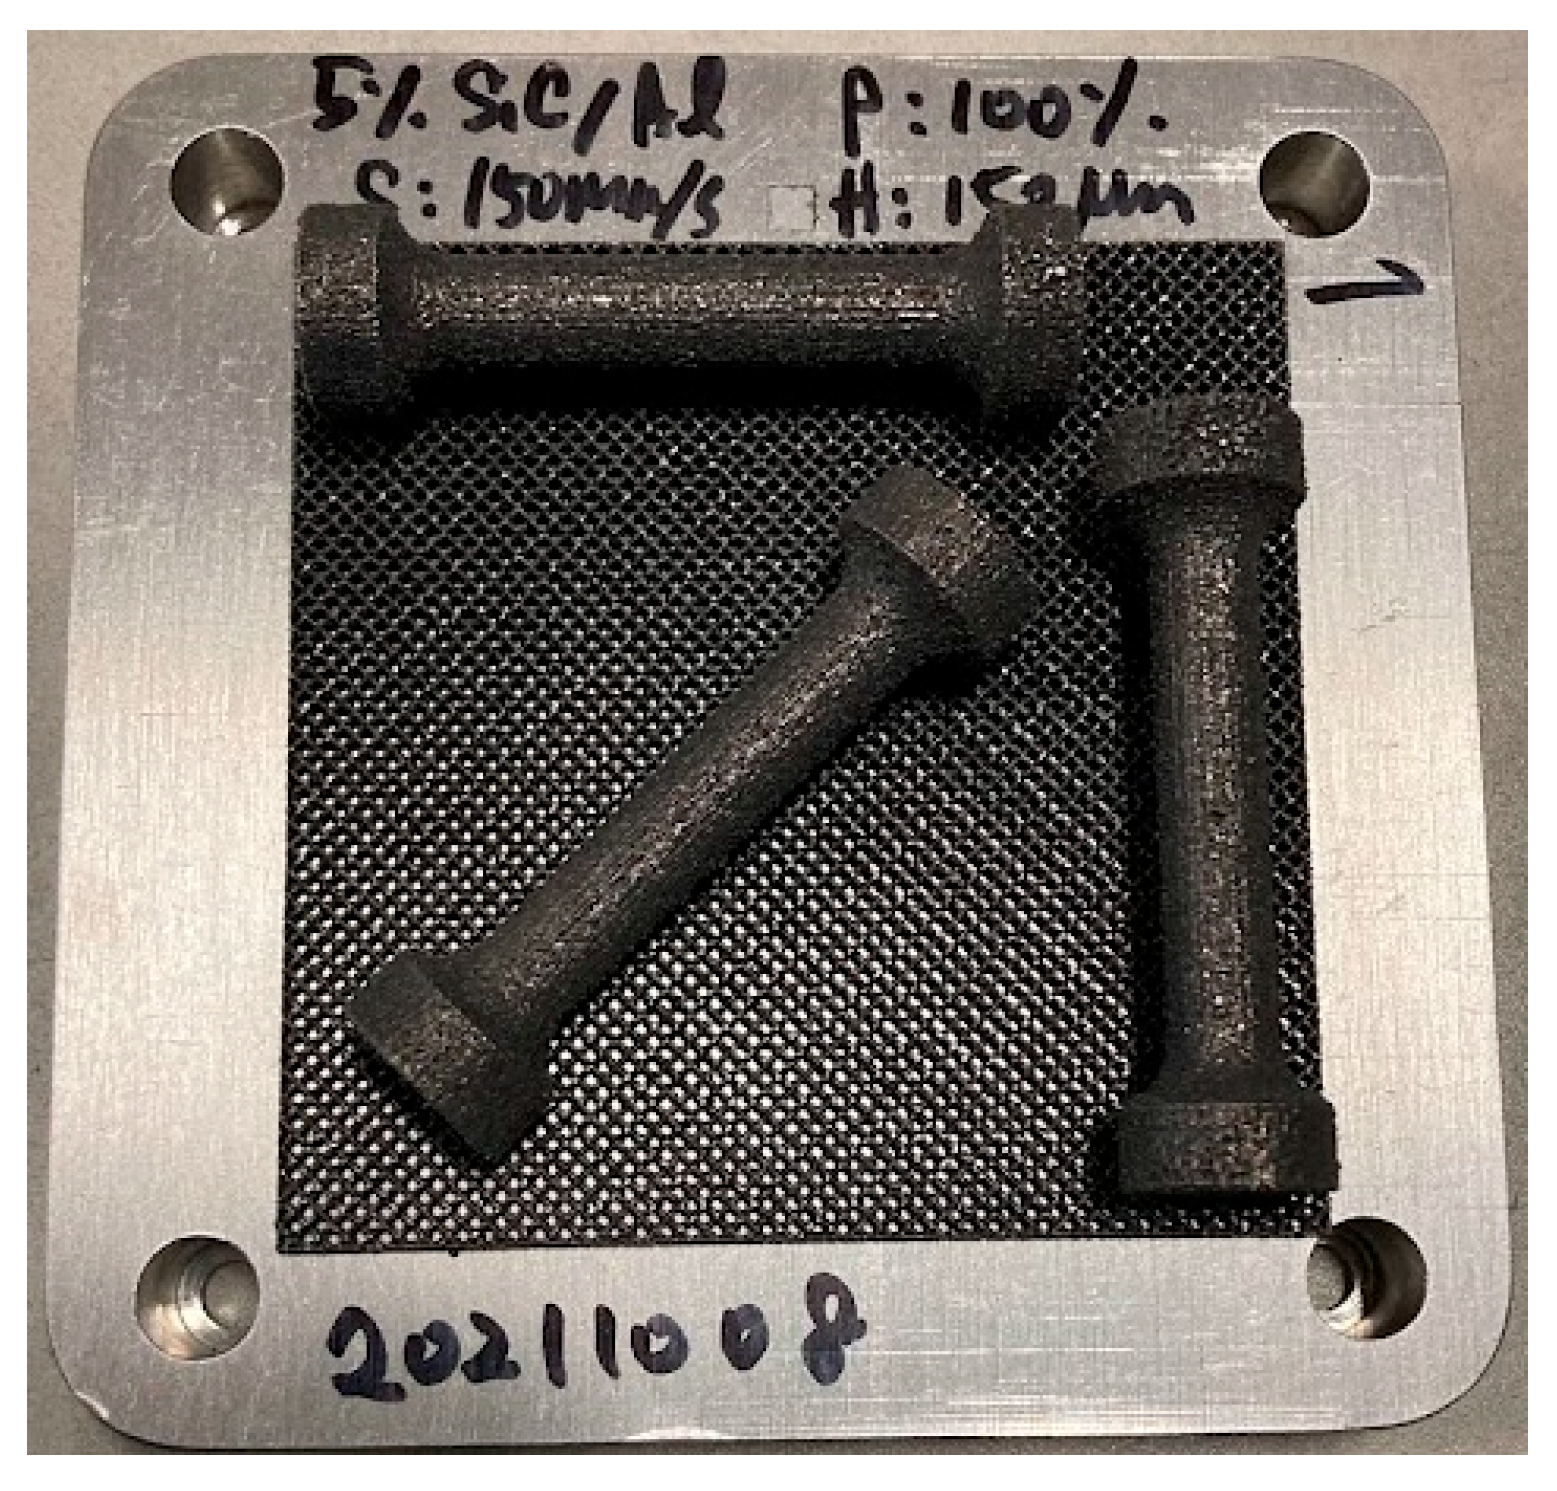
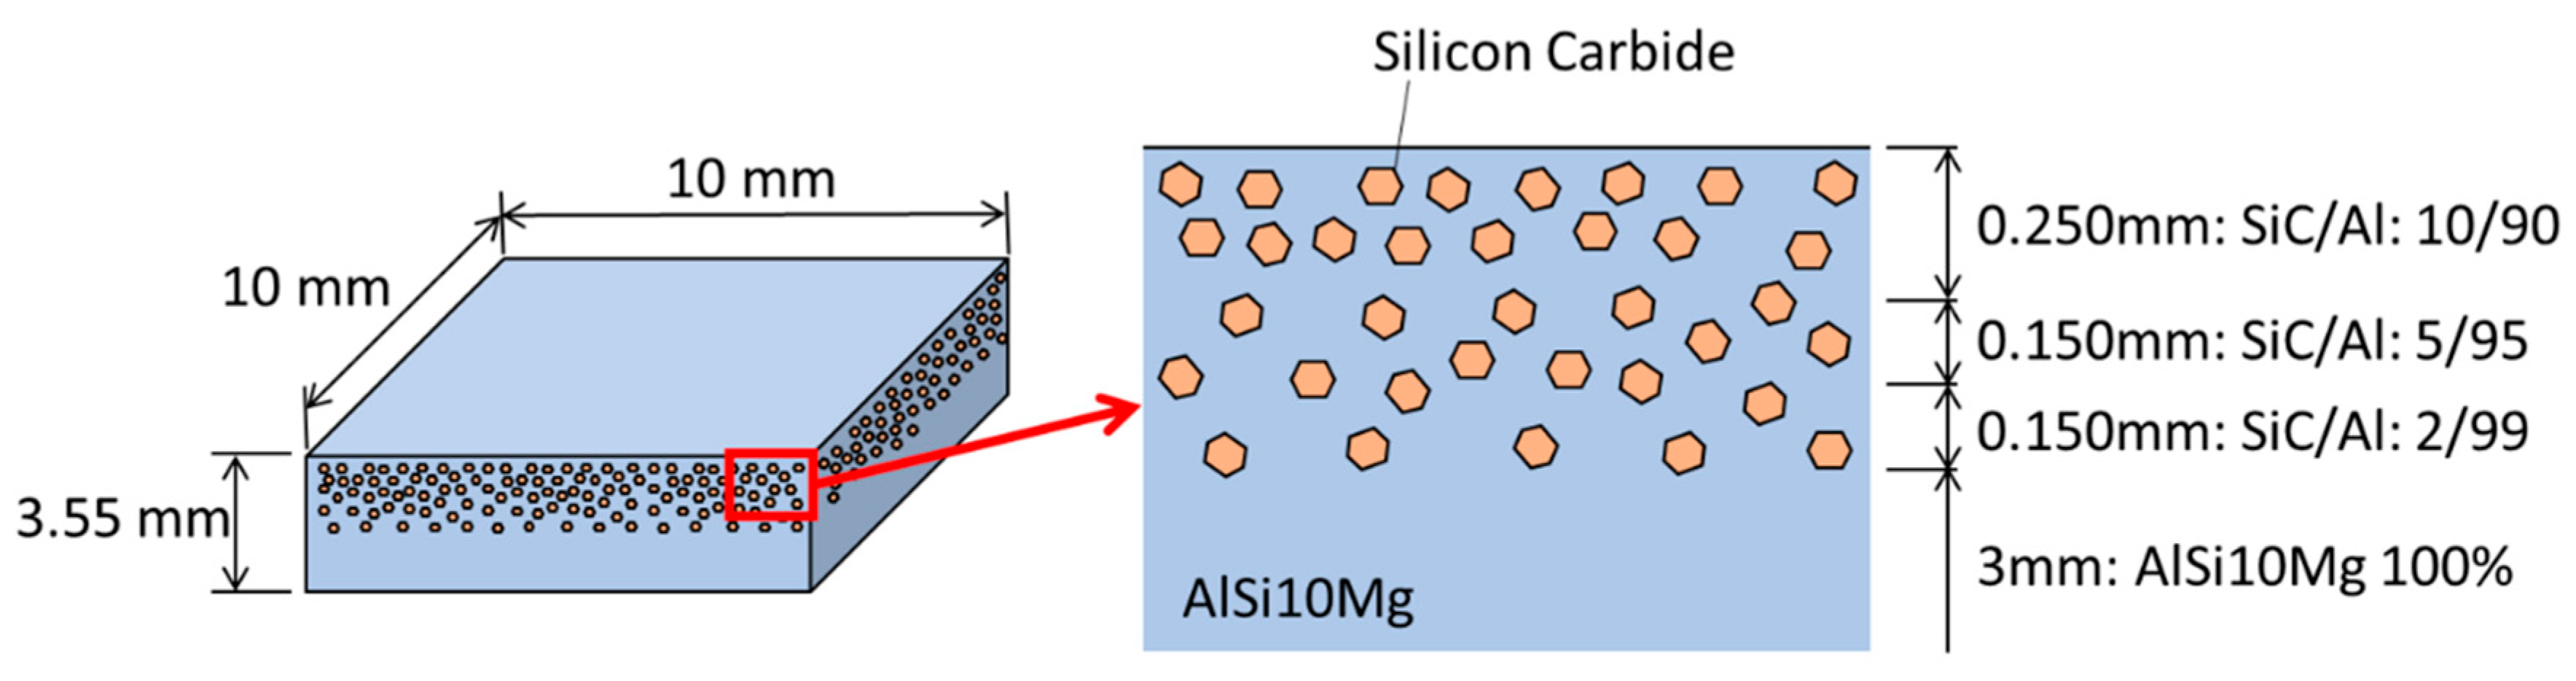
3.1. AM Process Optimization
- A: AlSi10Mg
- B: SiC/Al: 2/98
- C: SiC/Al: 5/95
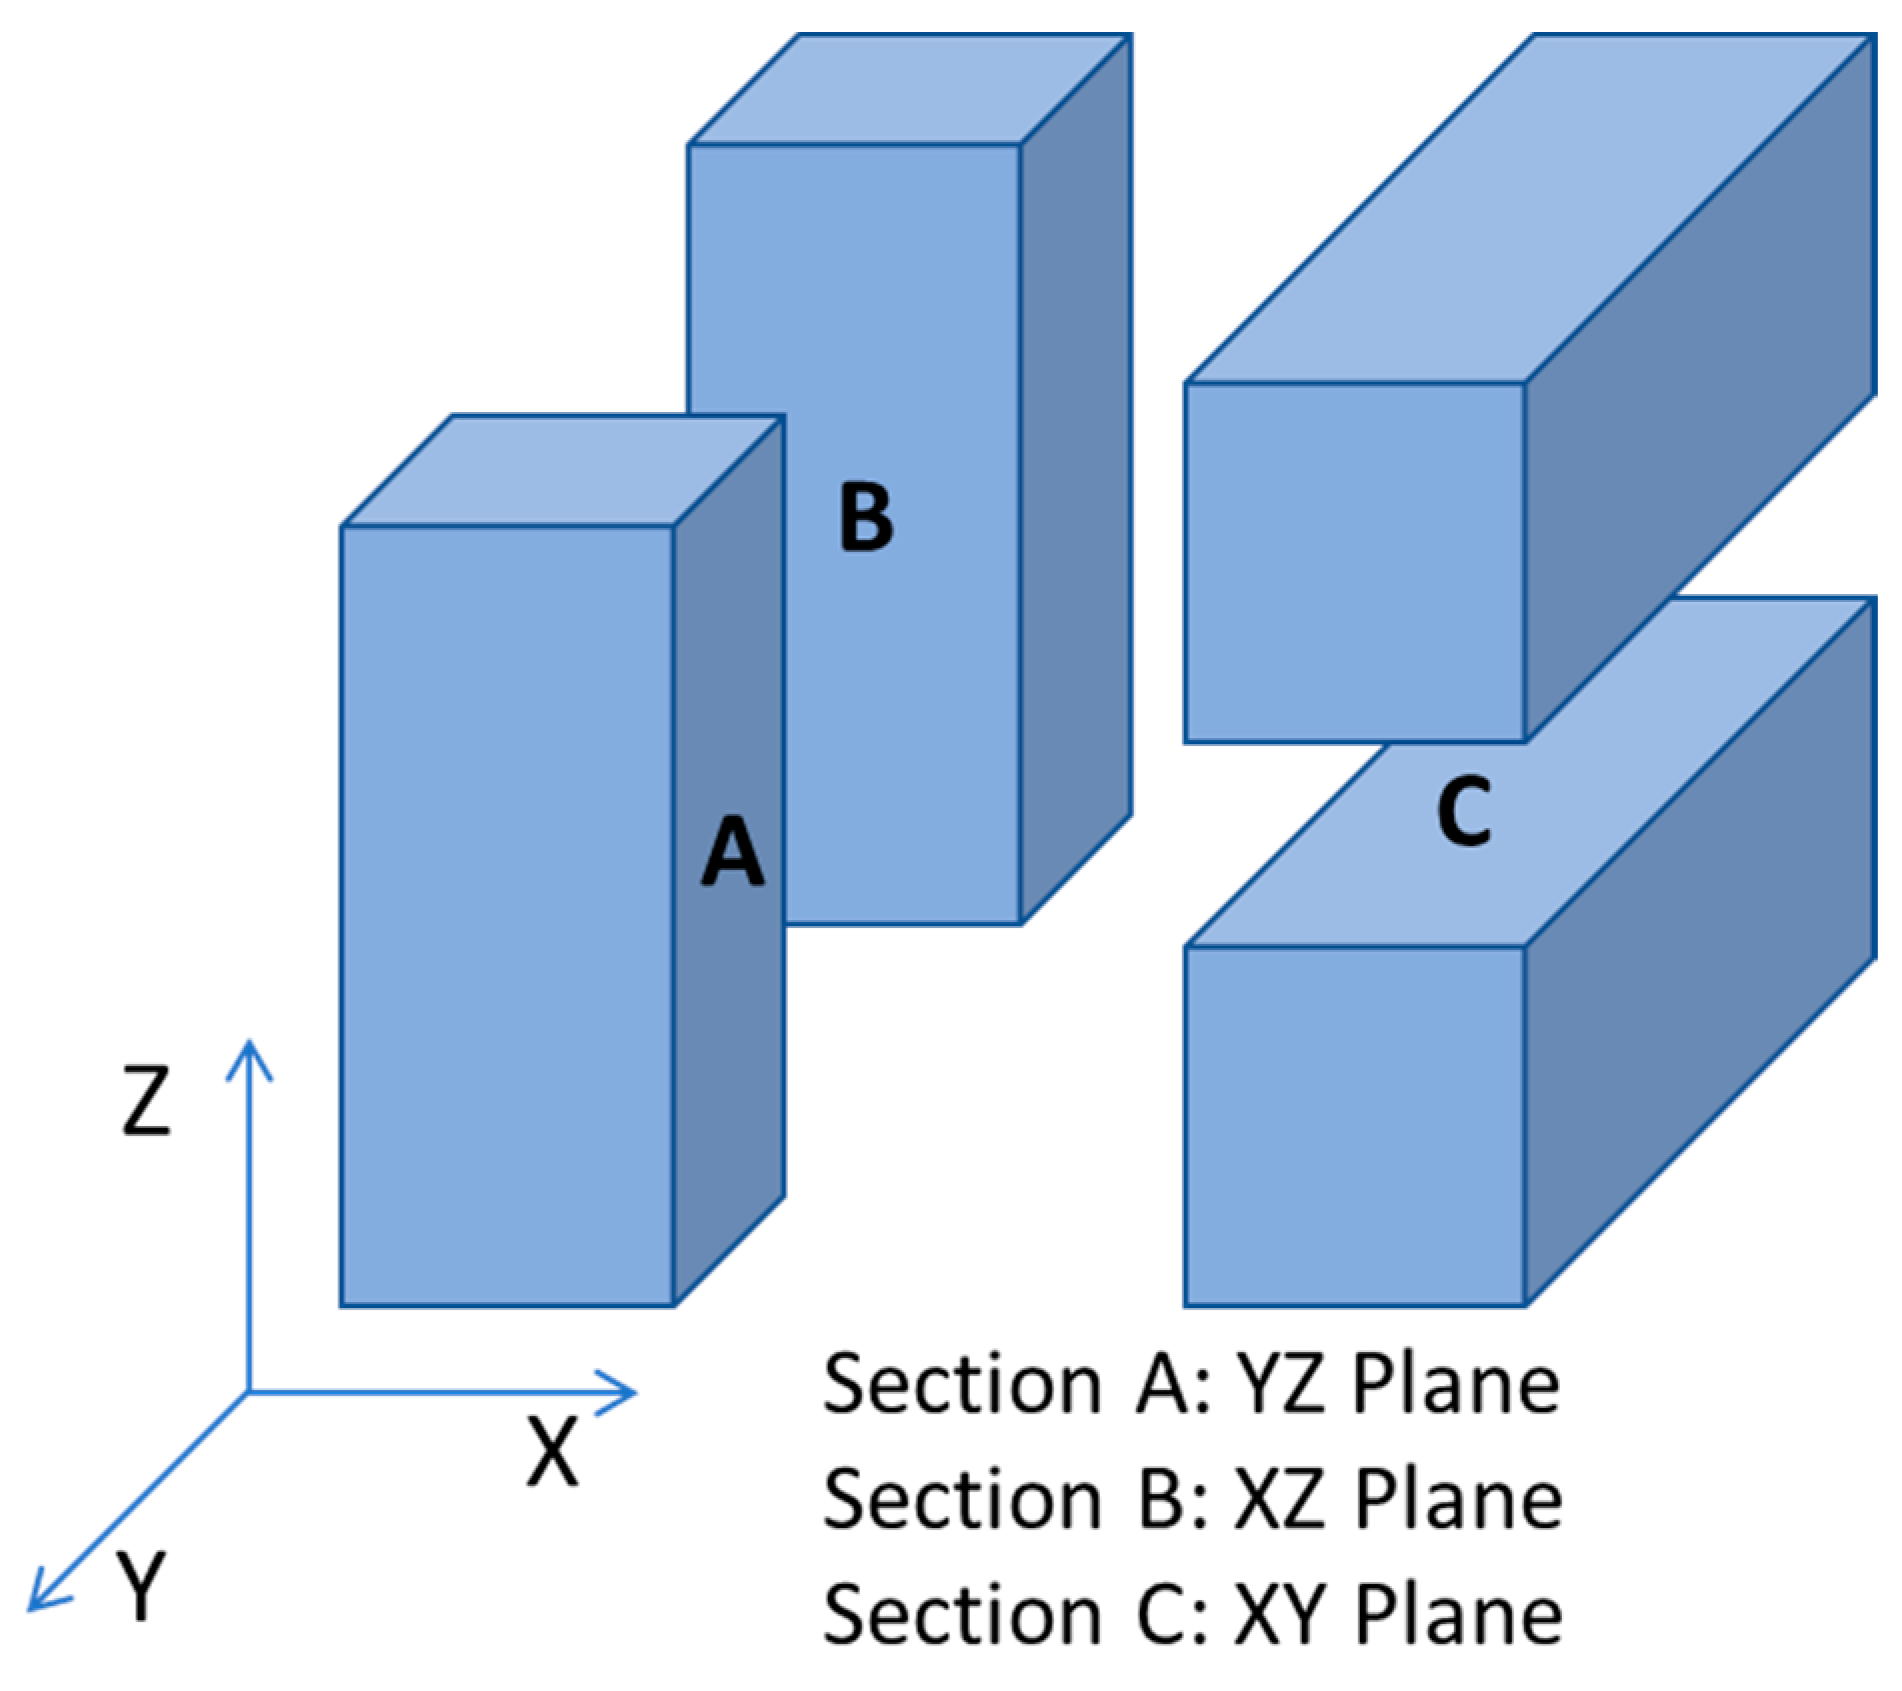
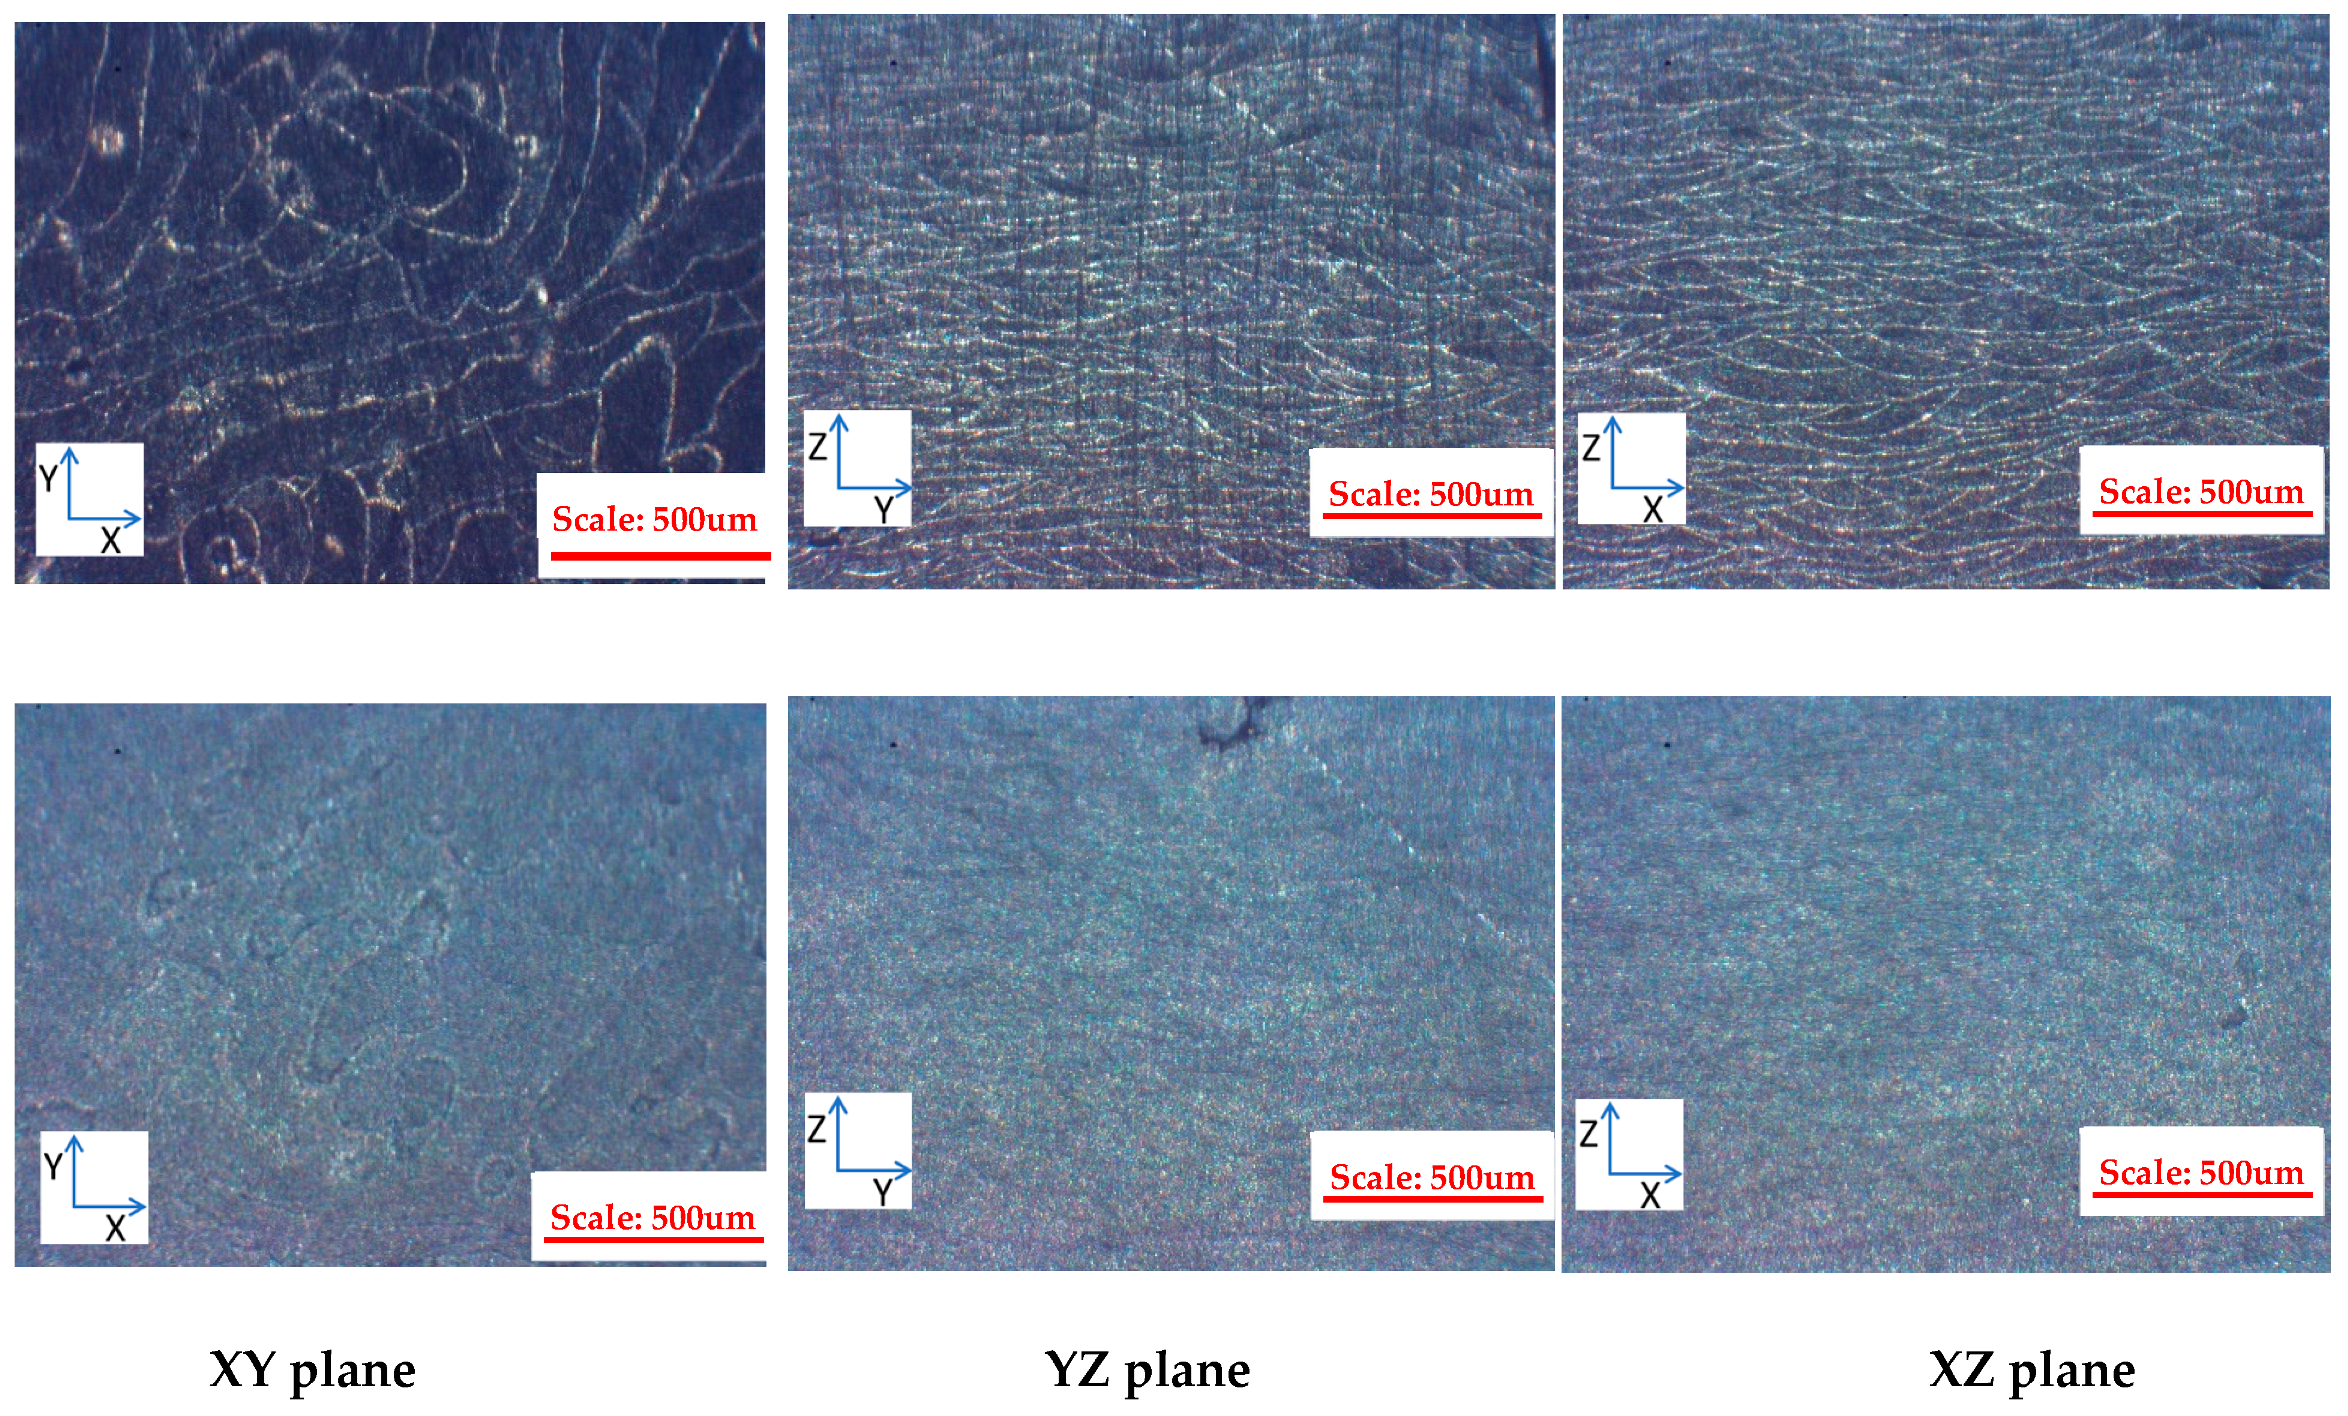
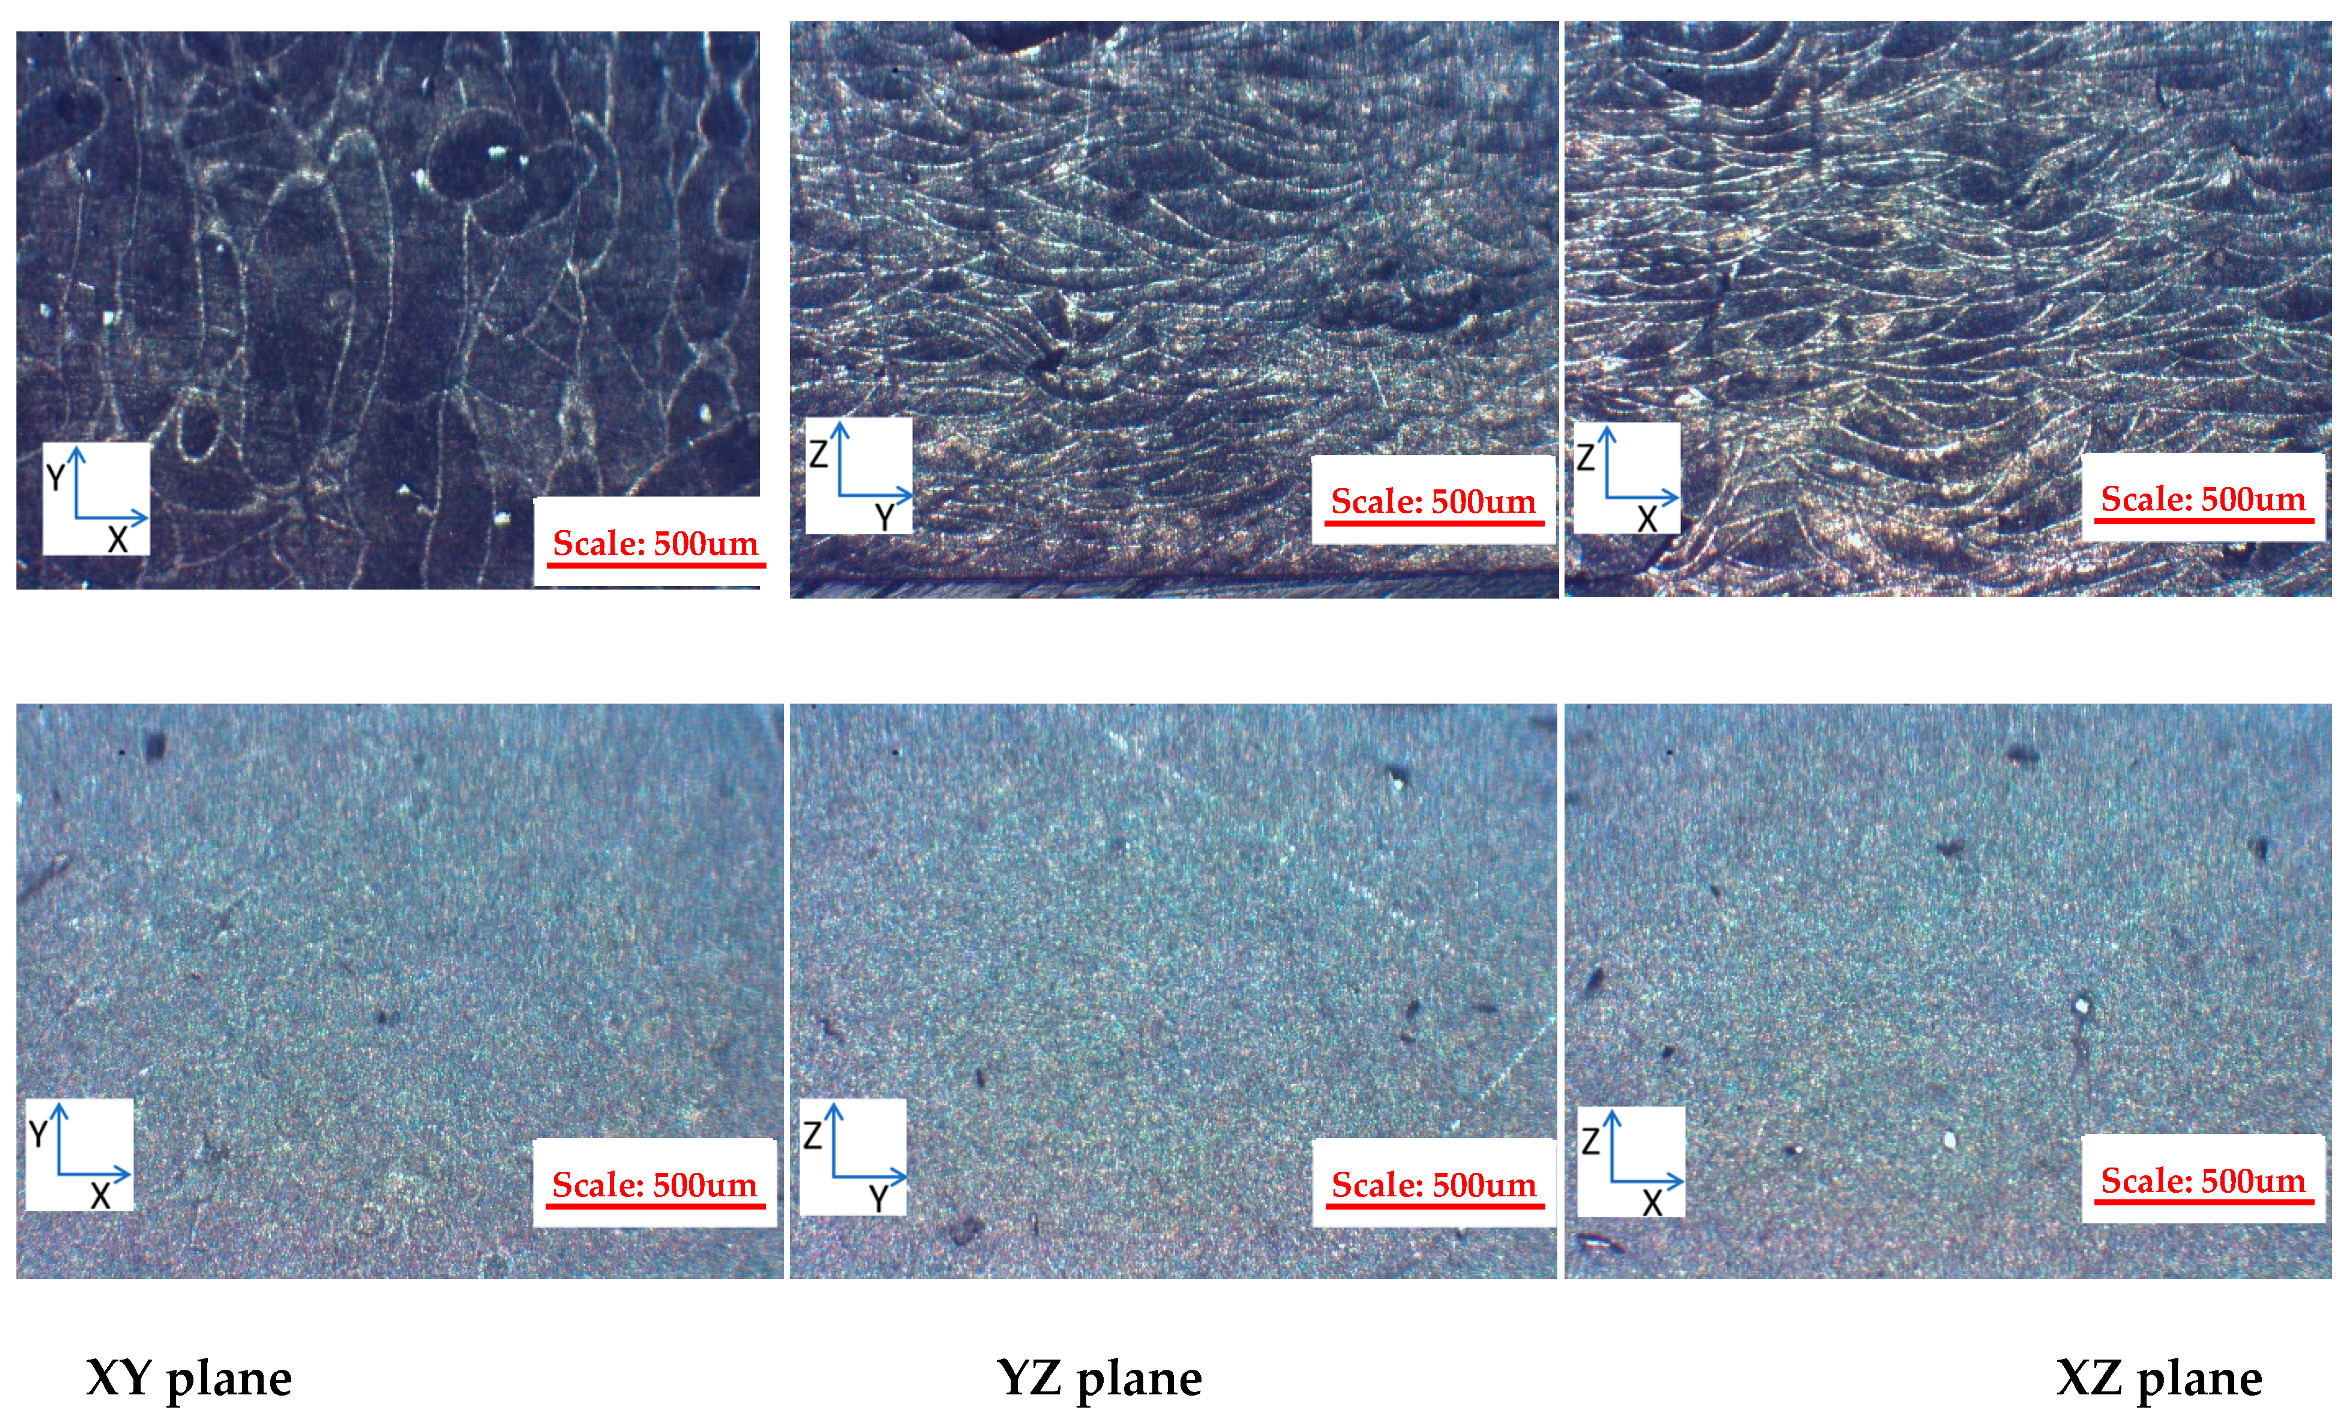
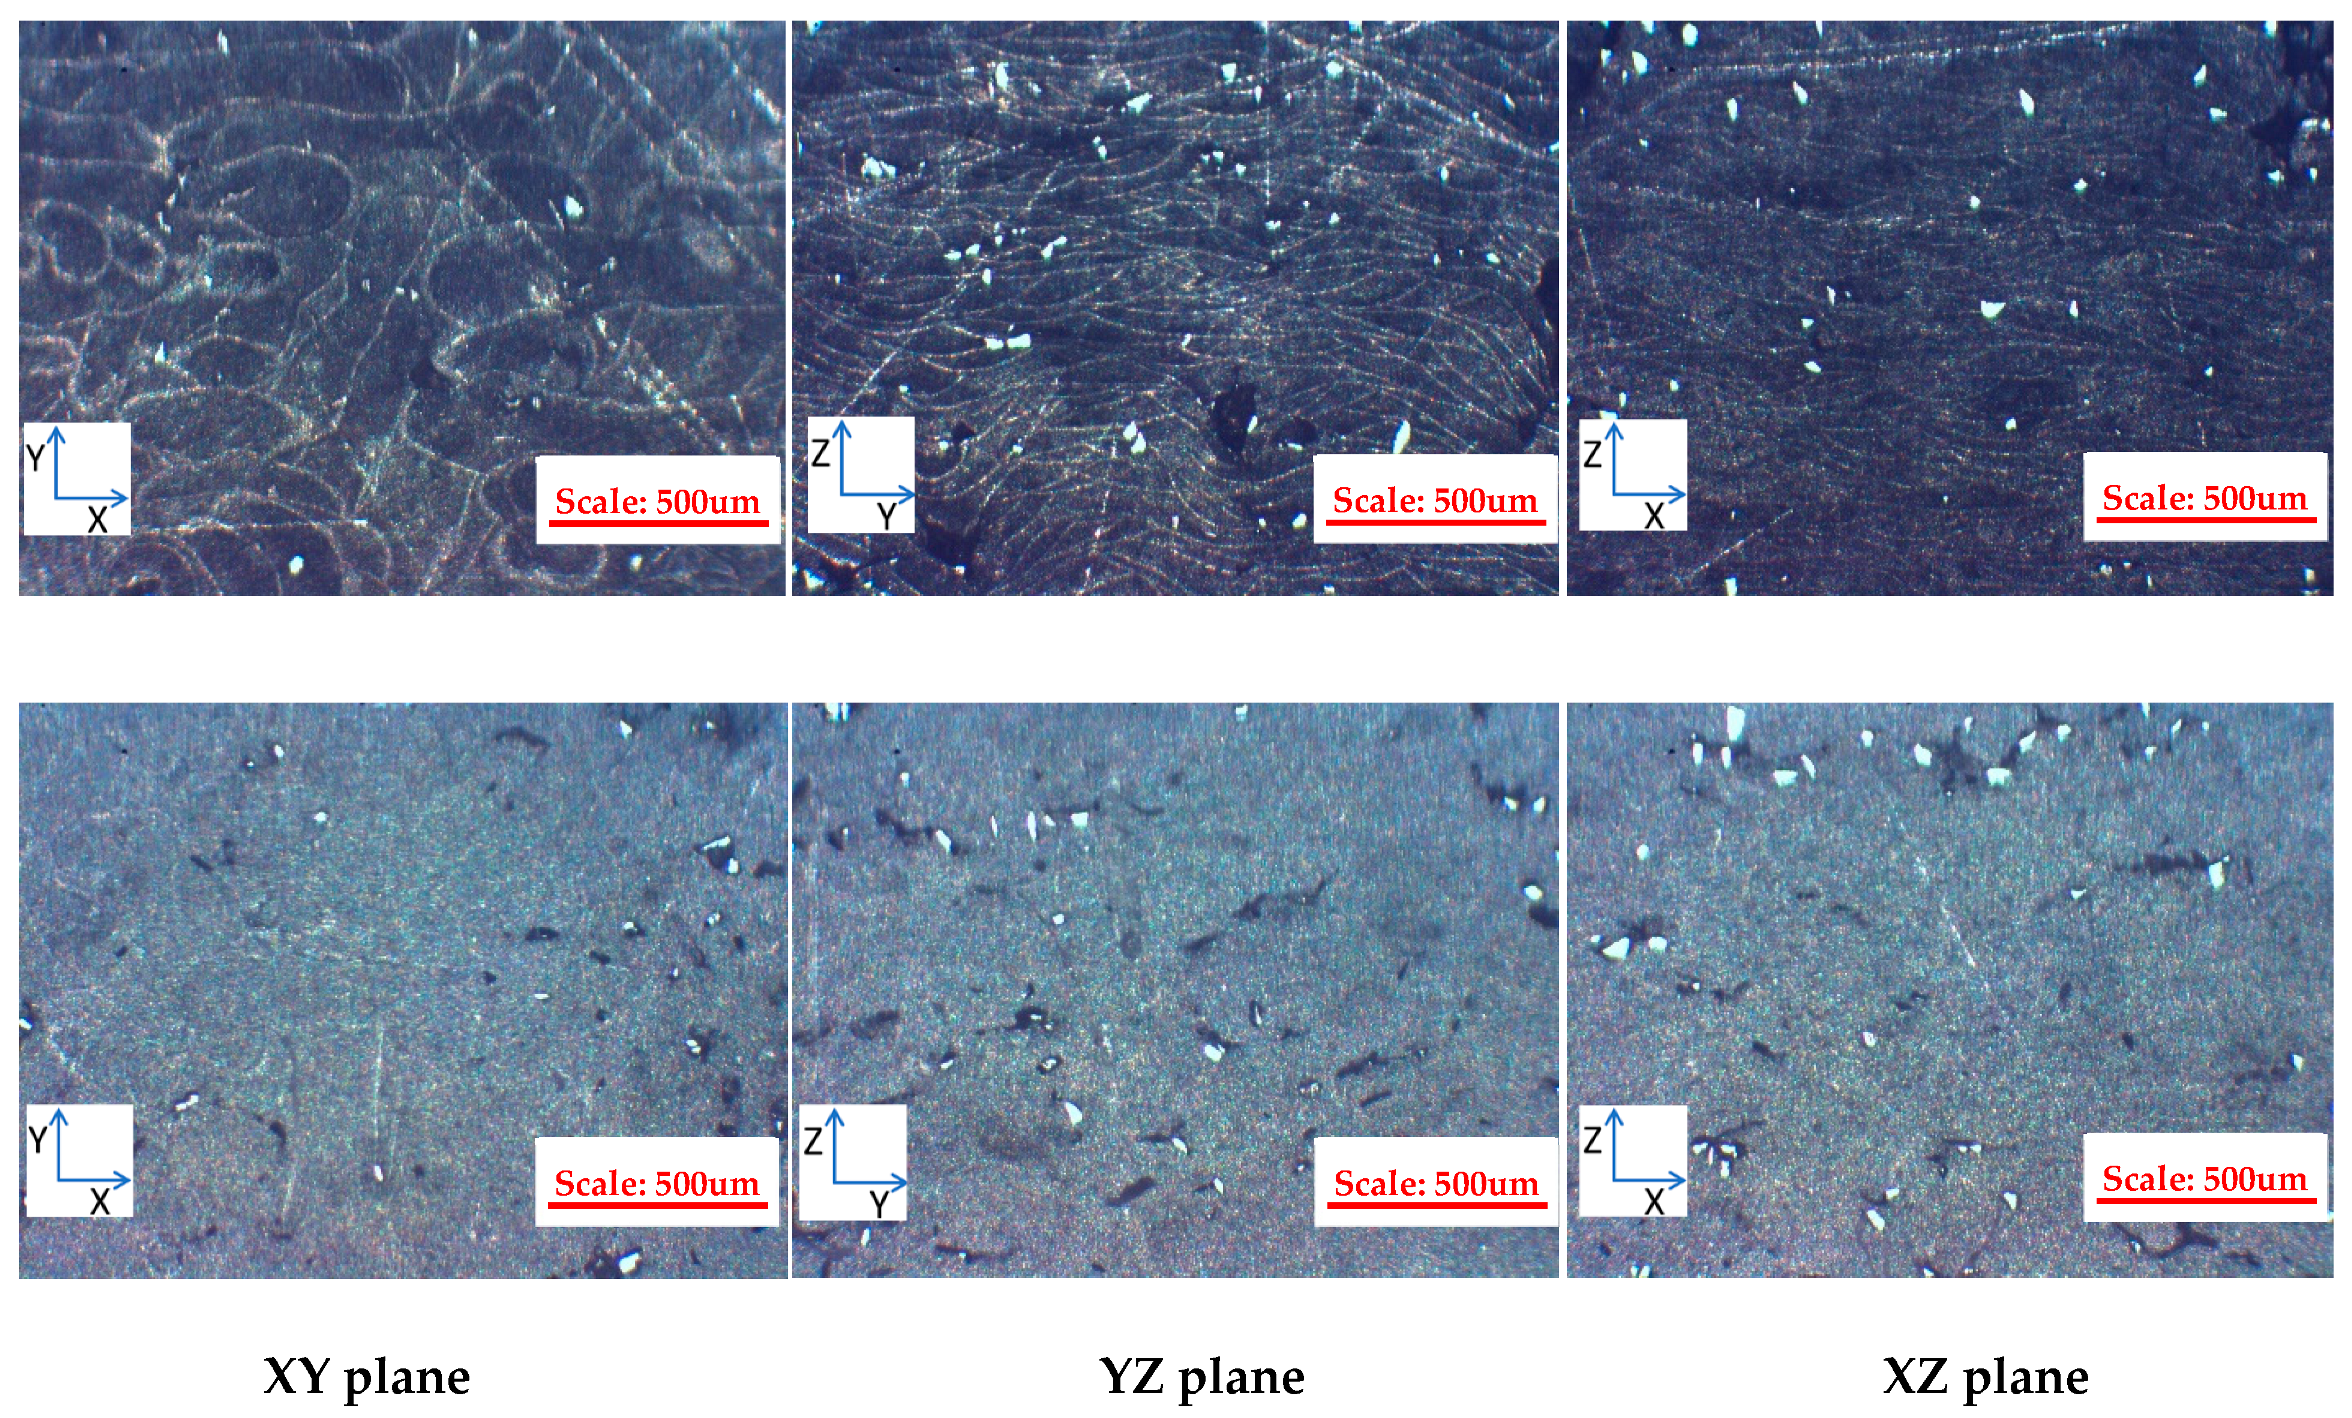
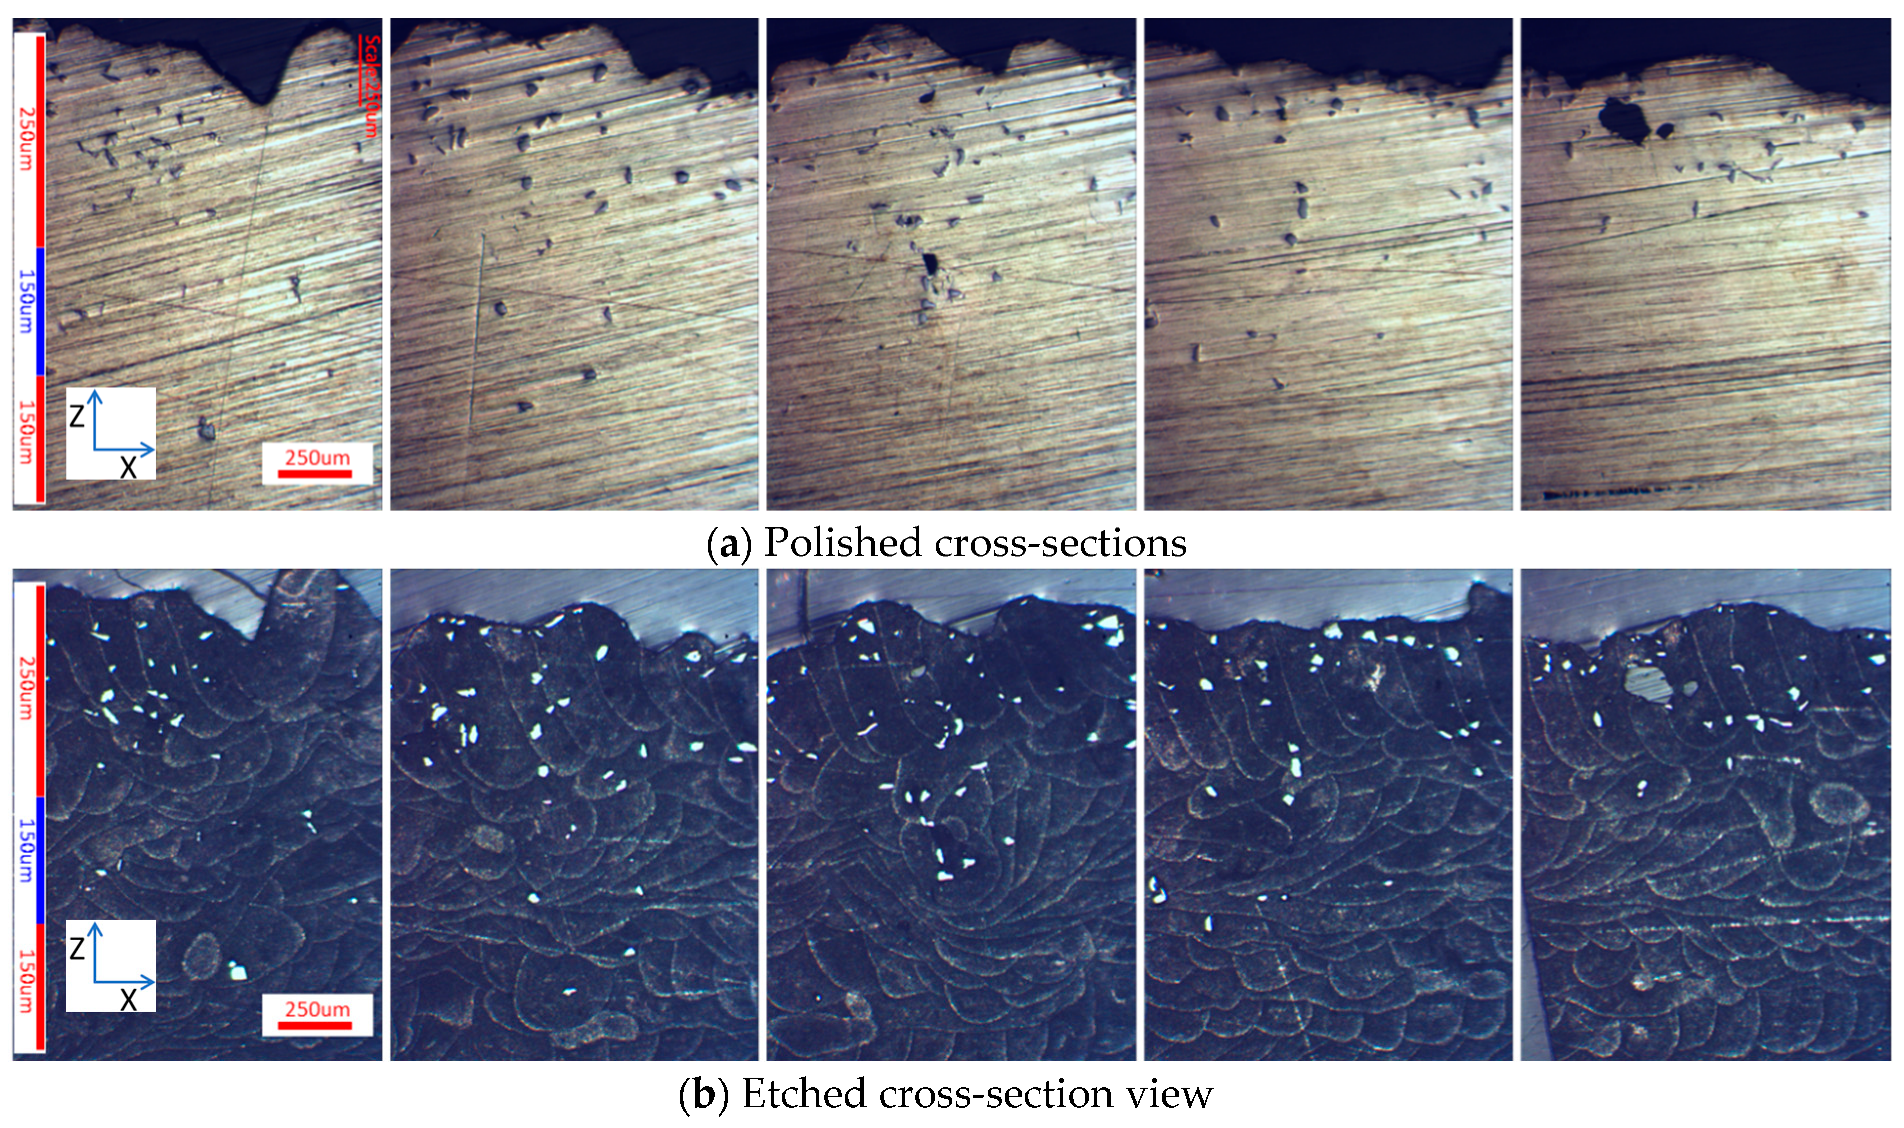
3.2. Microstructure Comparison at Different Orientations
3.3. Test on Mechanical Properties
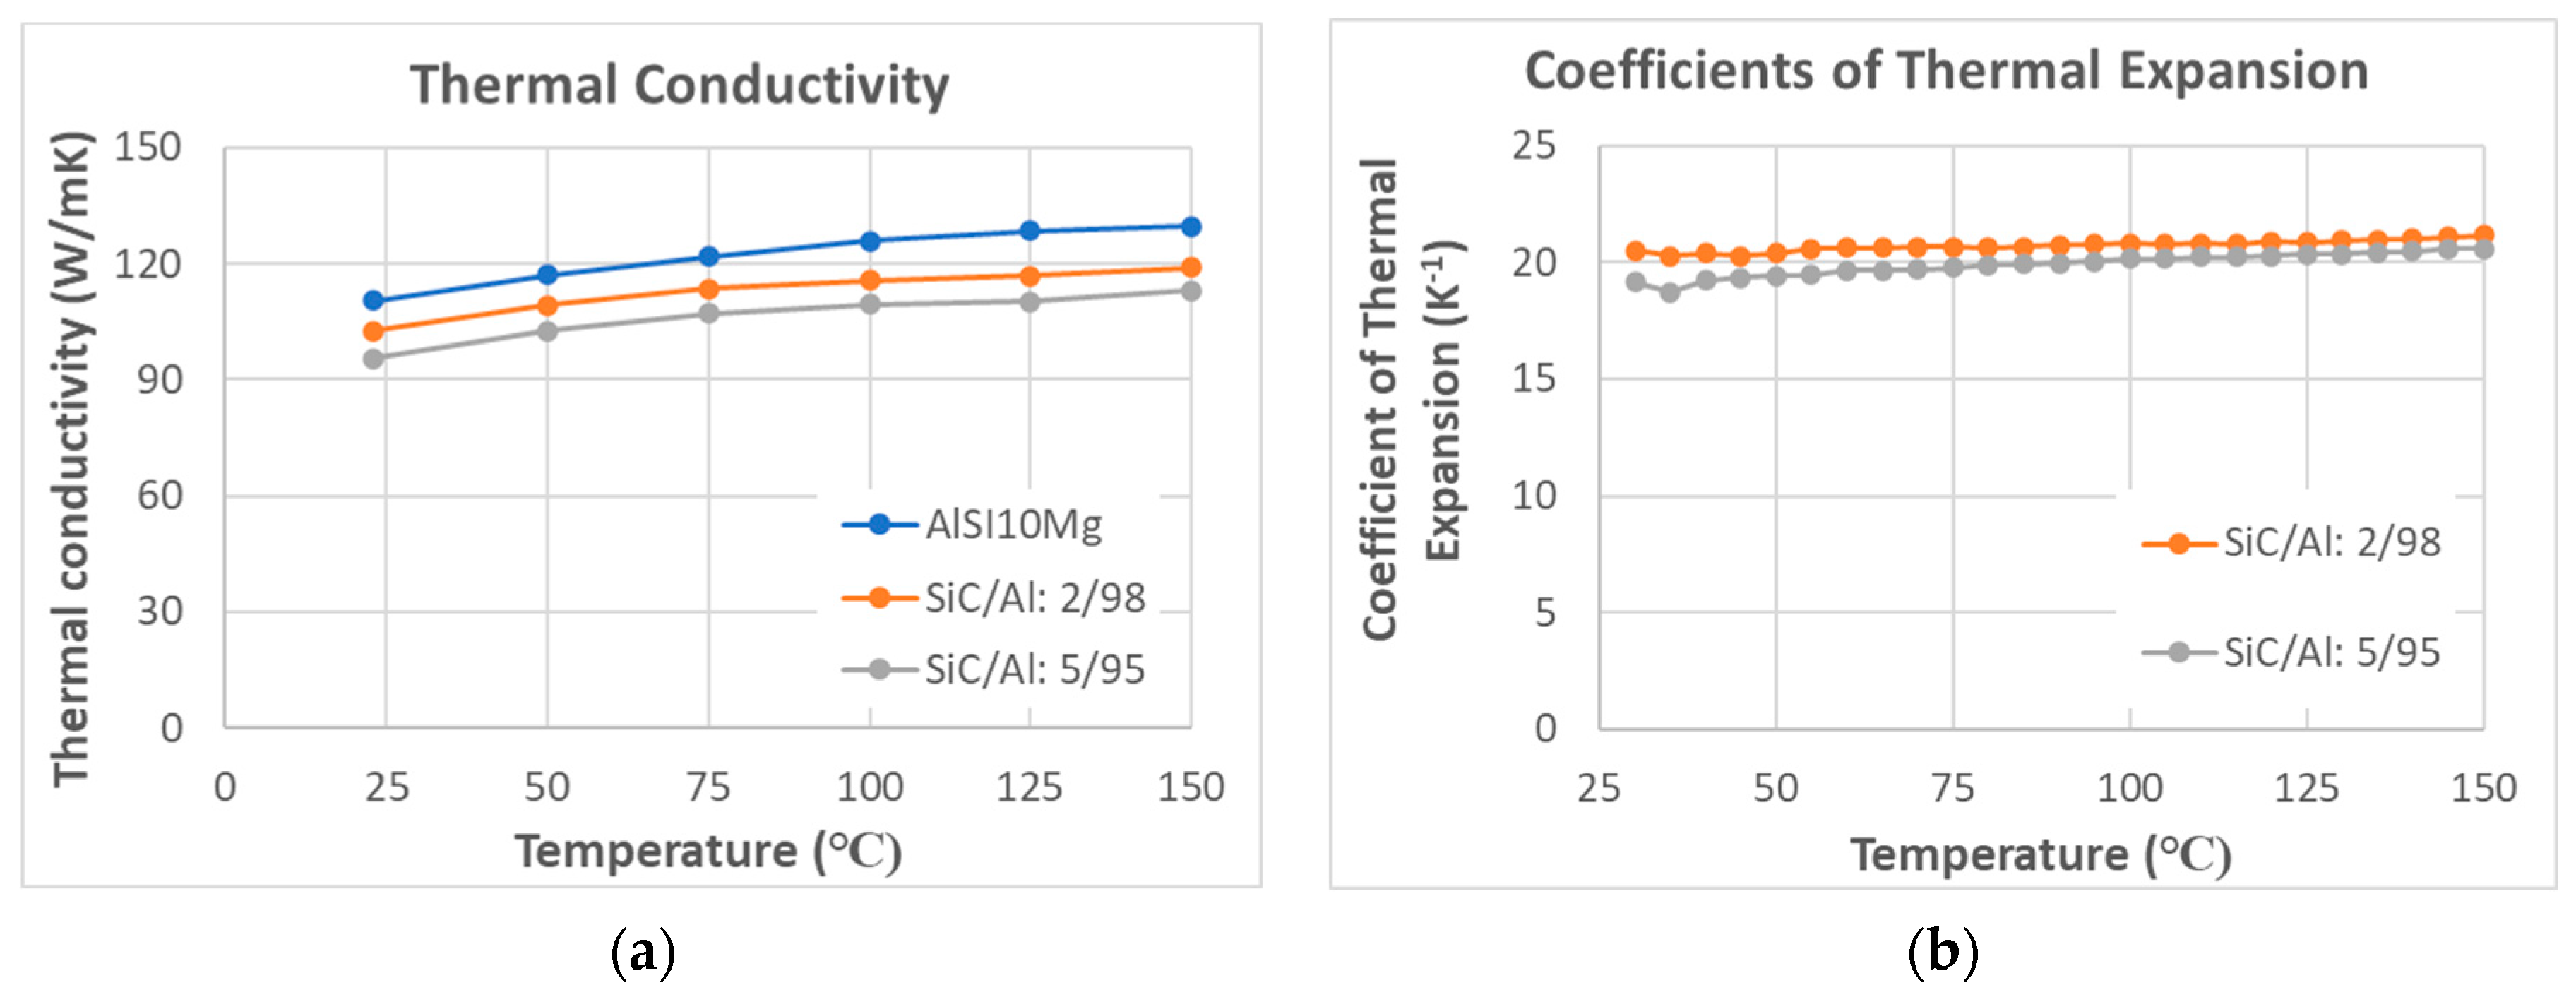
3.4. Test on Thermal Properties
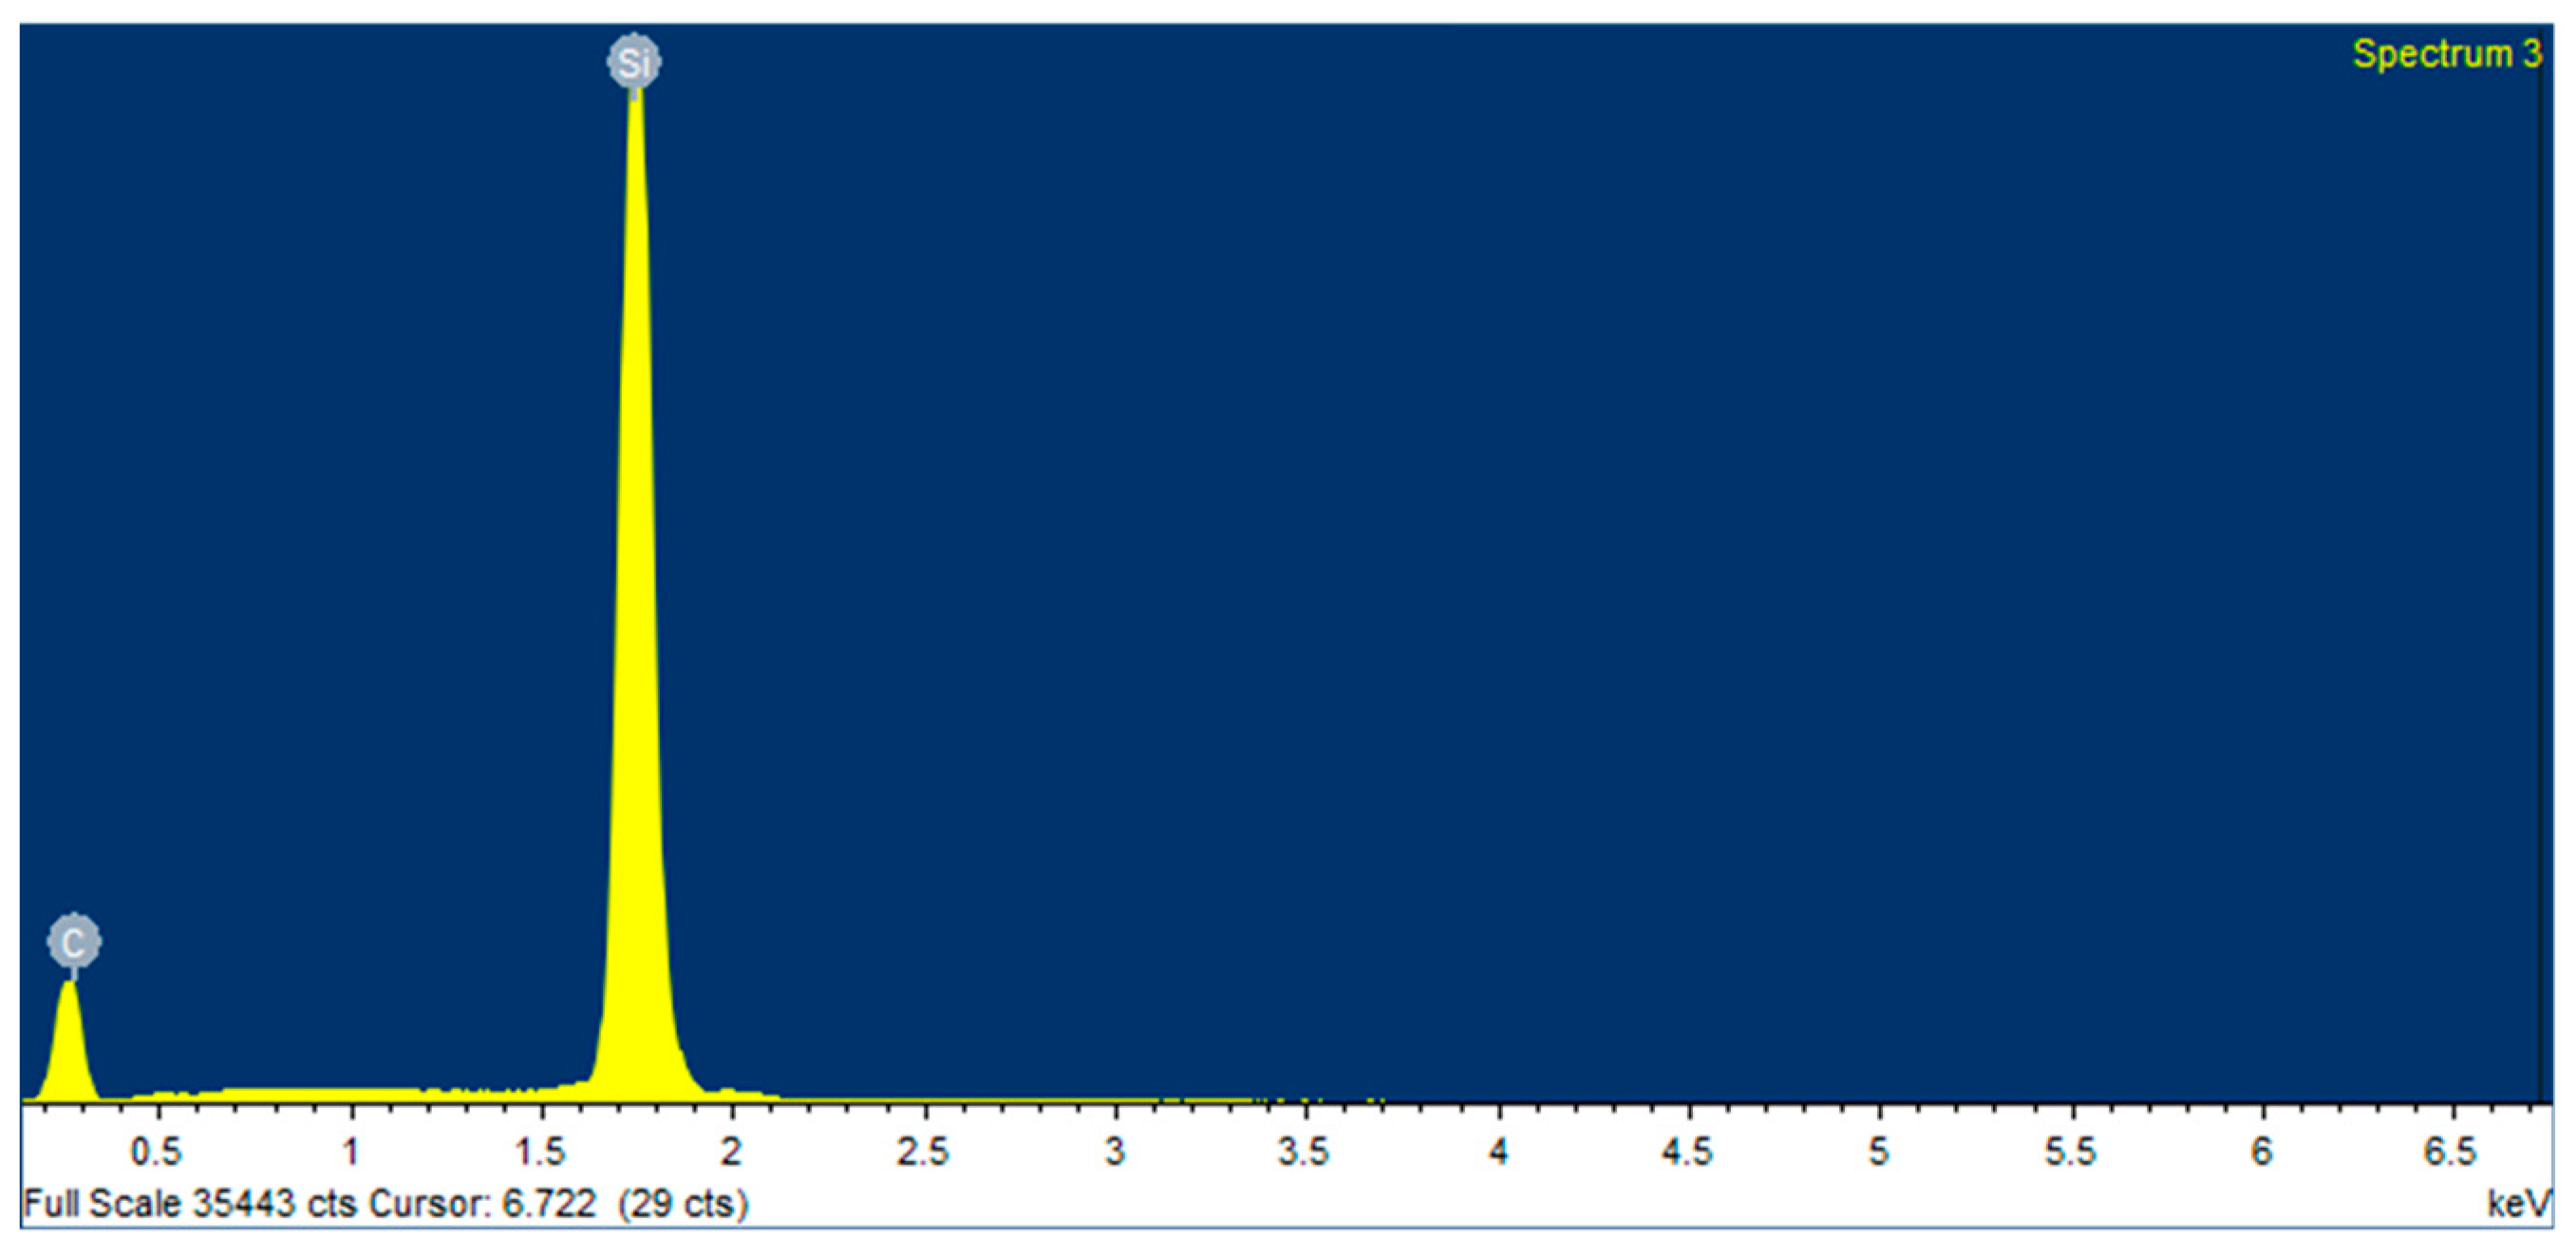
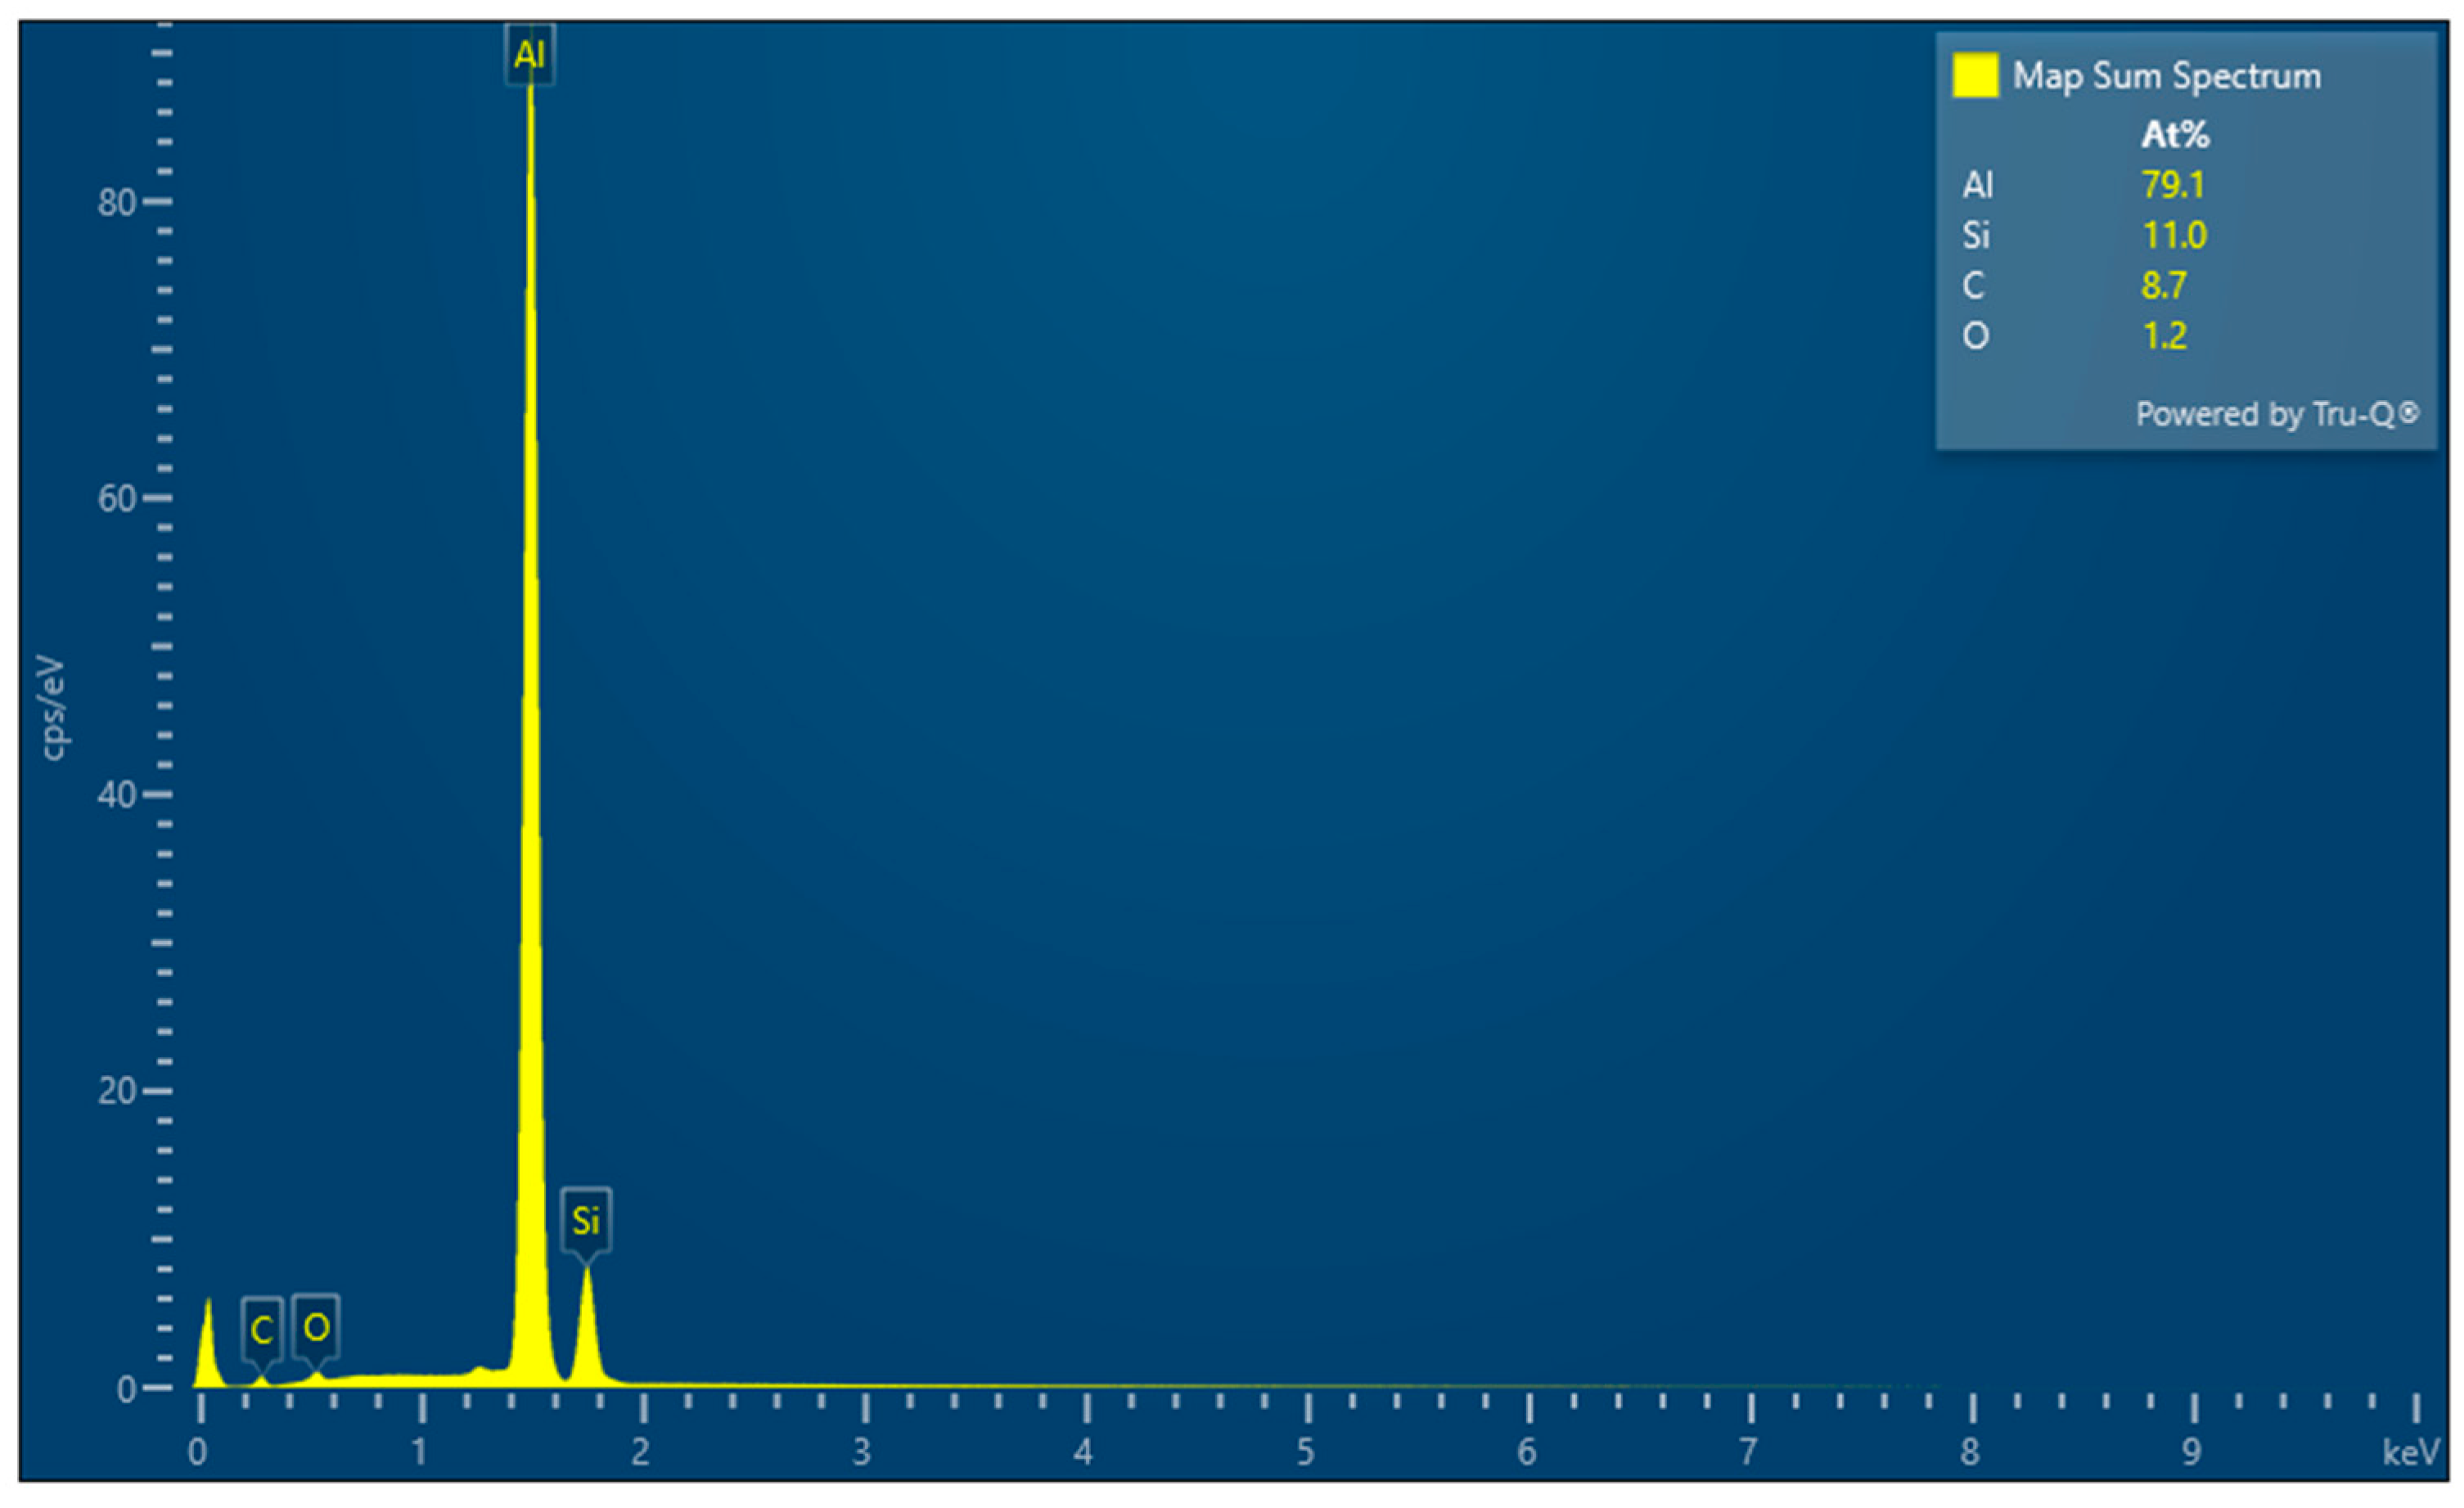
3.5. XRD/EDS/EBSD Analysis
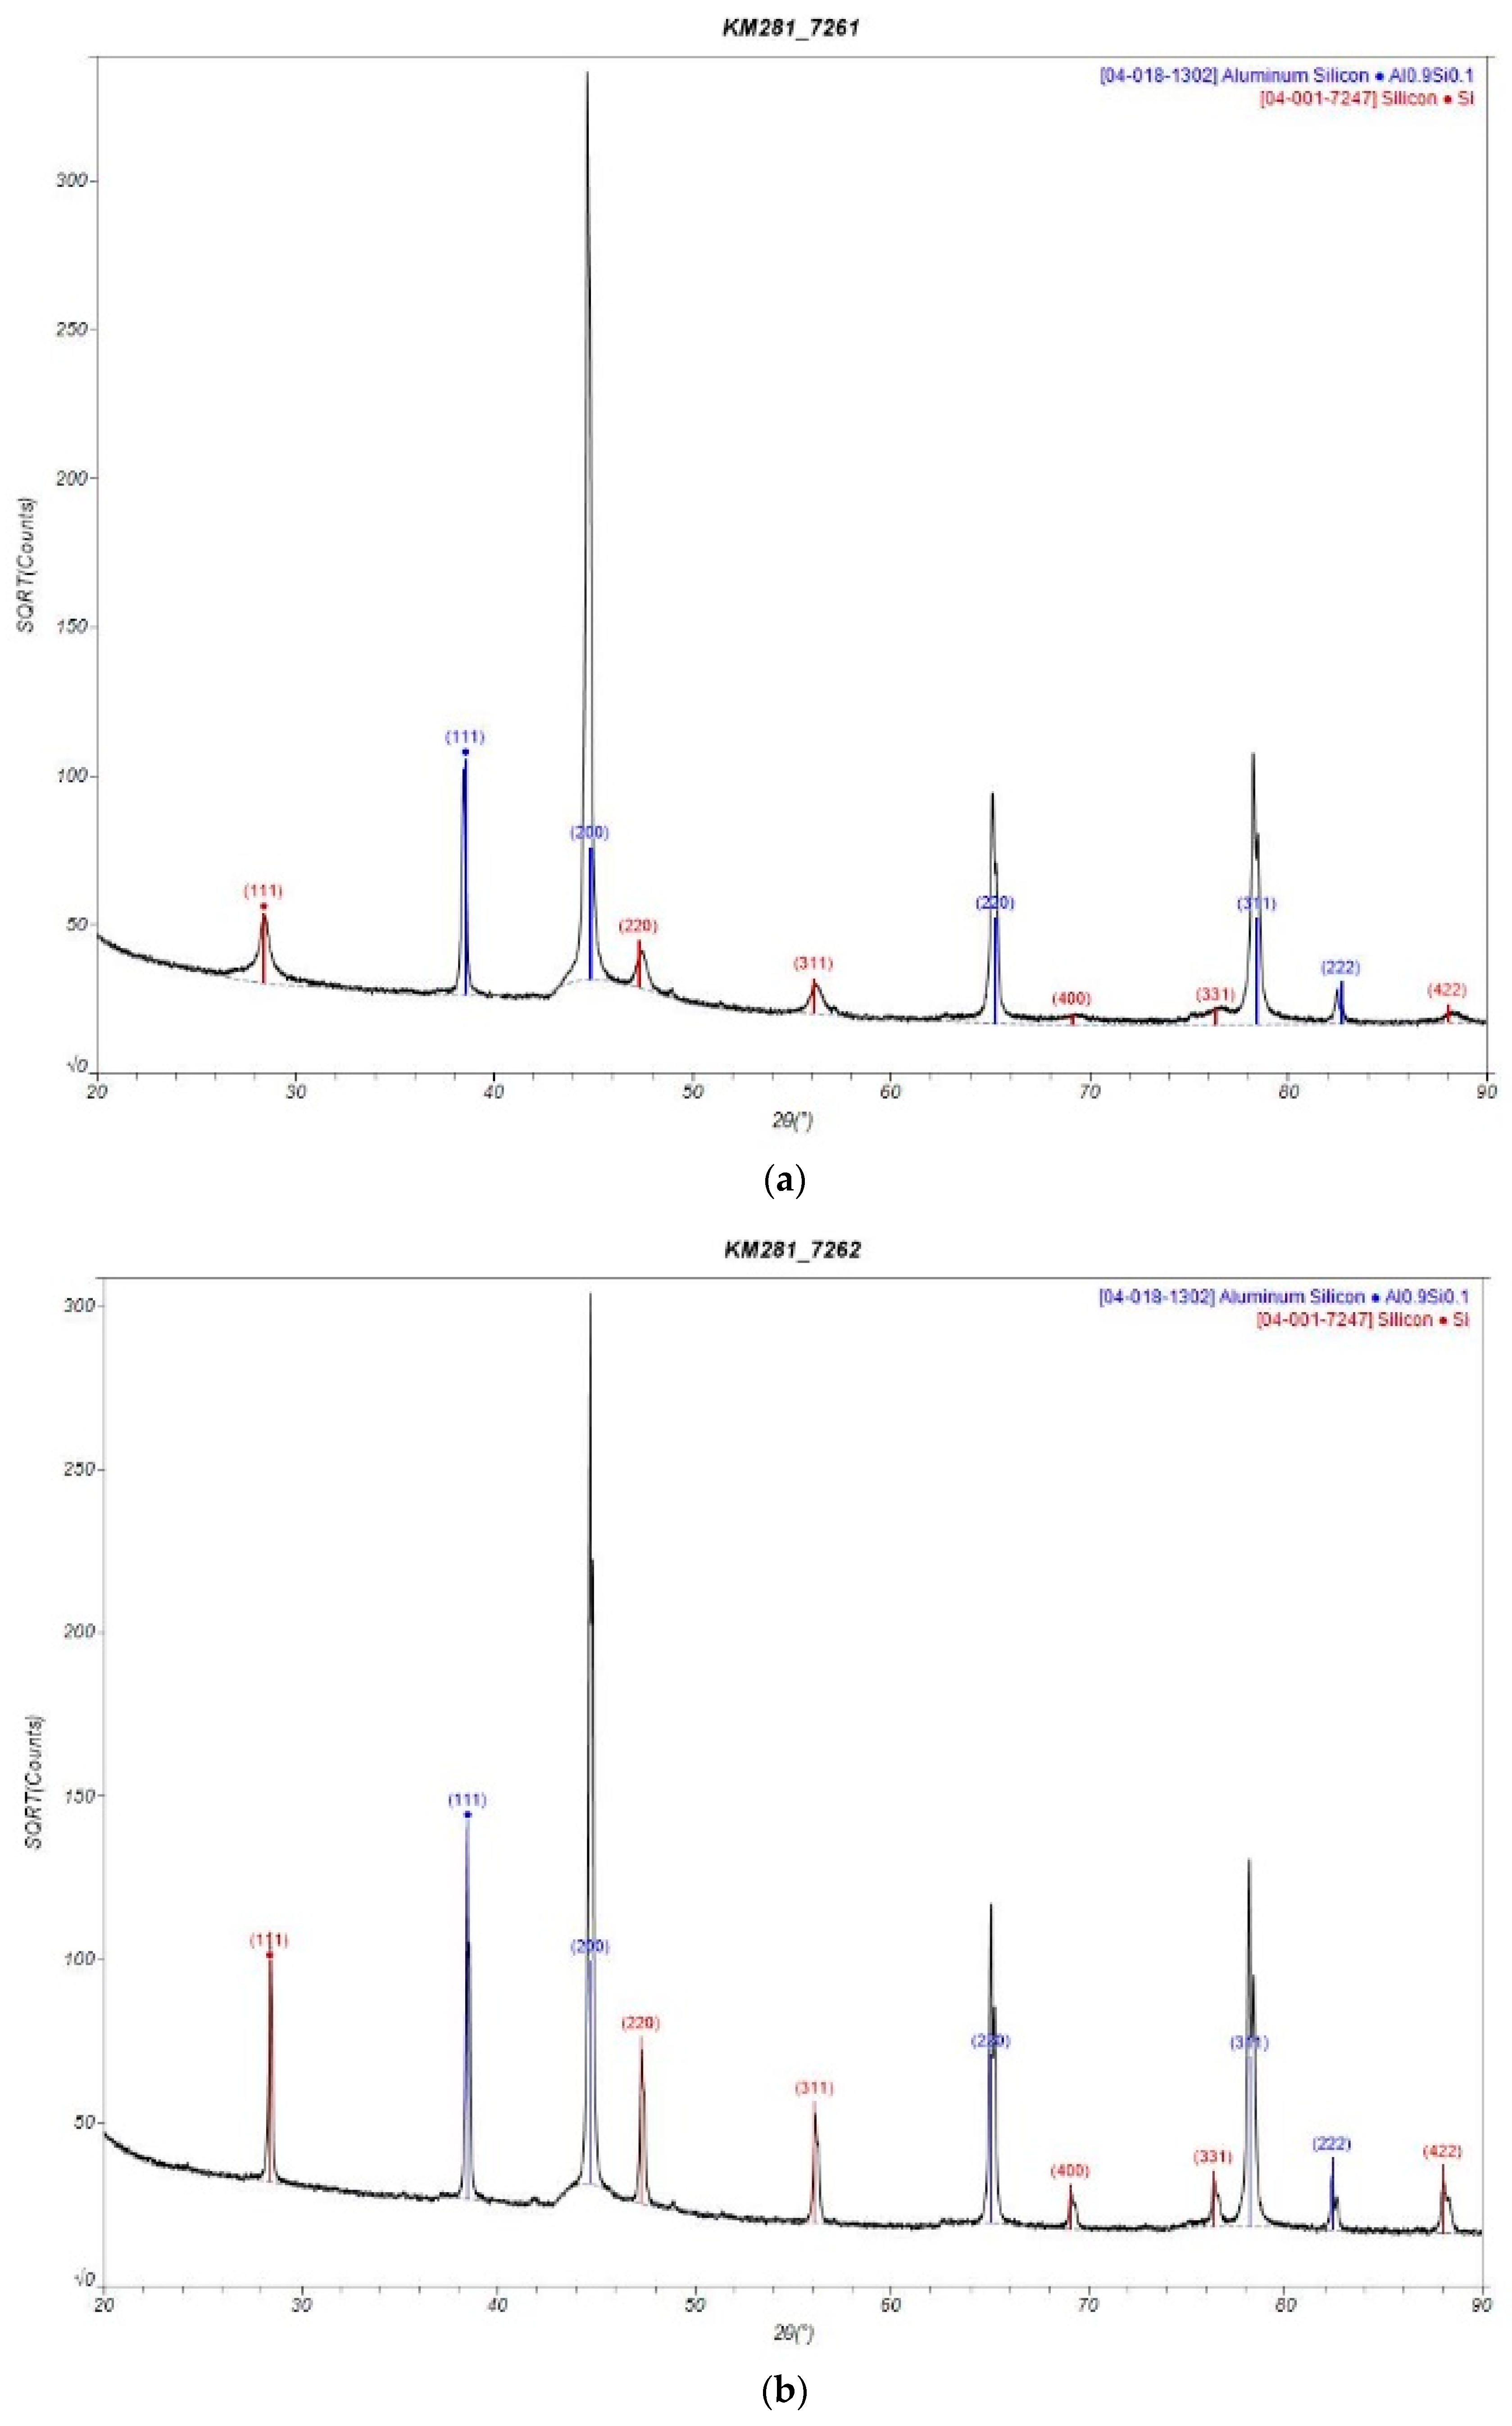
3.5.1. XRD Analysis
- A: AlSi10Mg
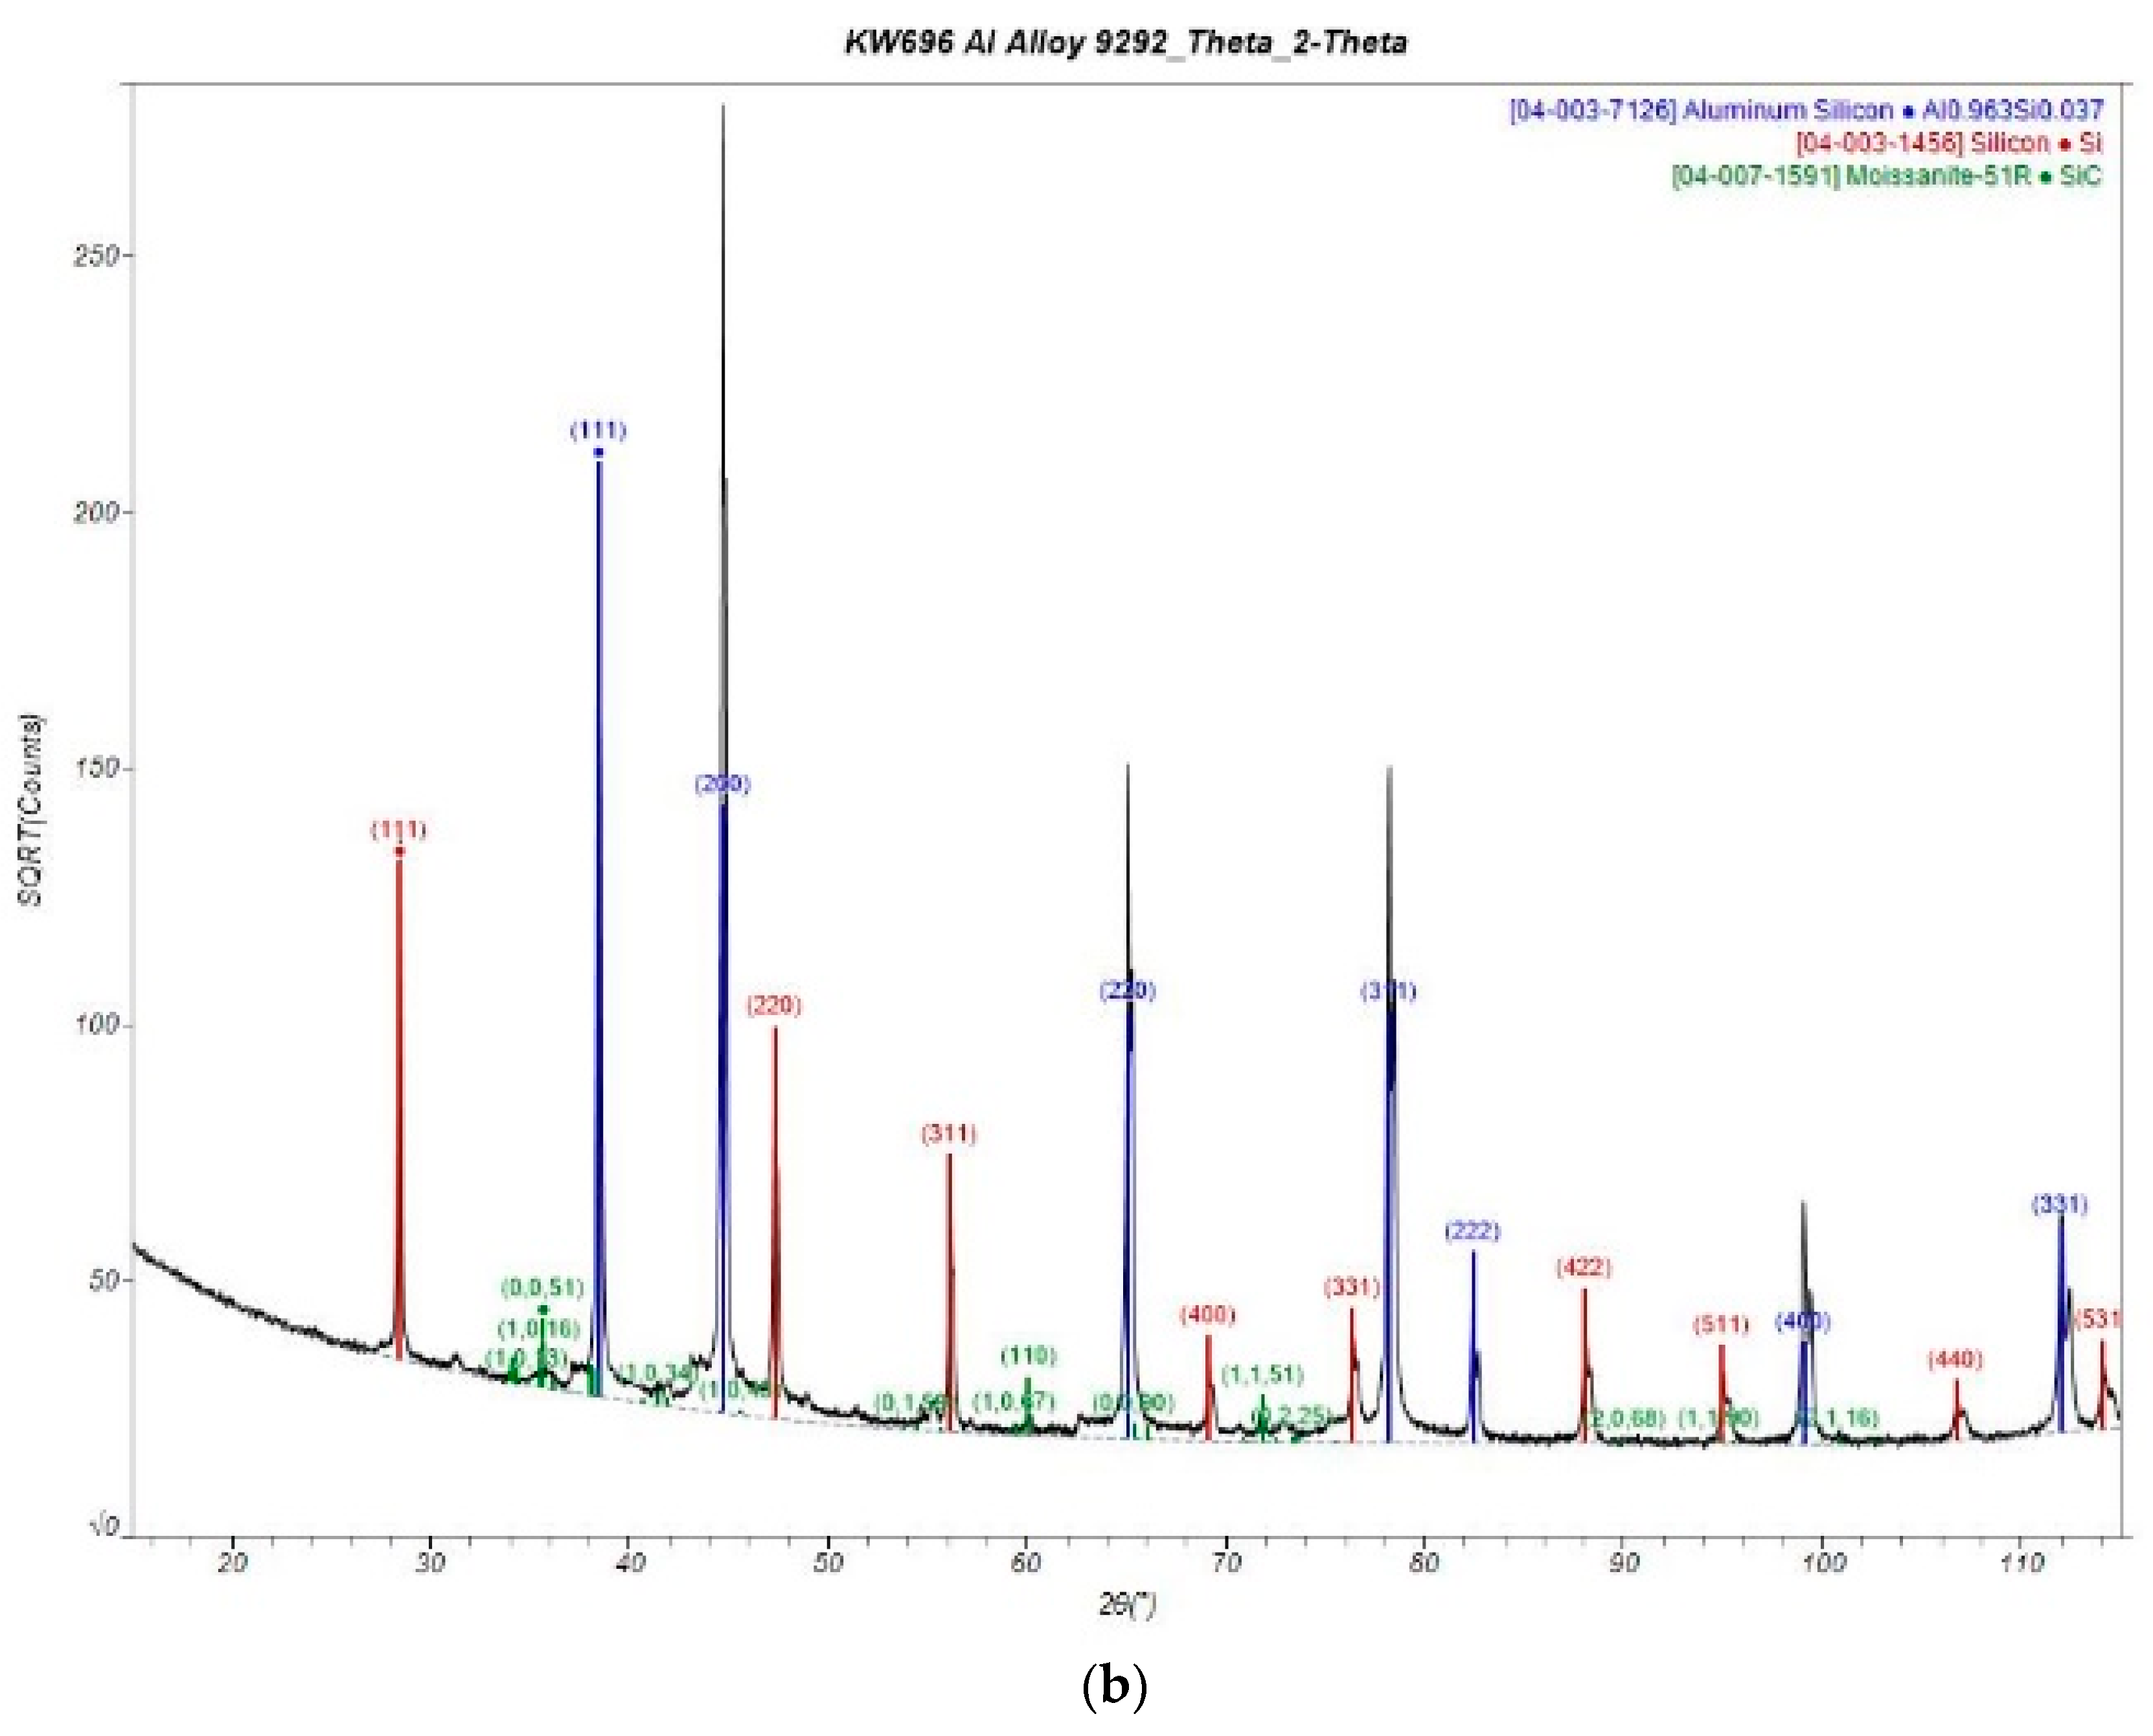
- B: SiC/Al: 2/98
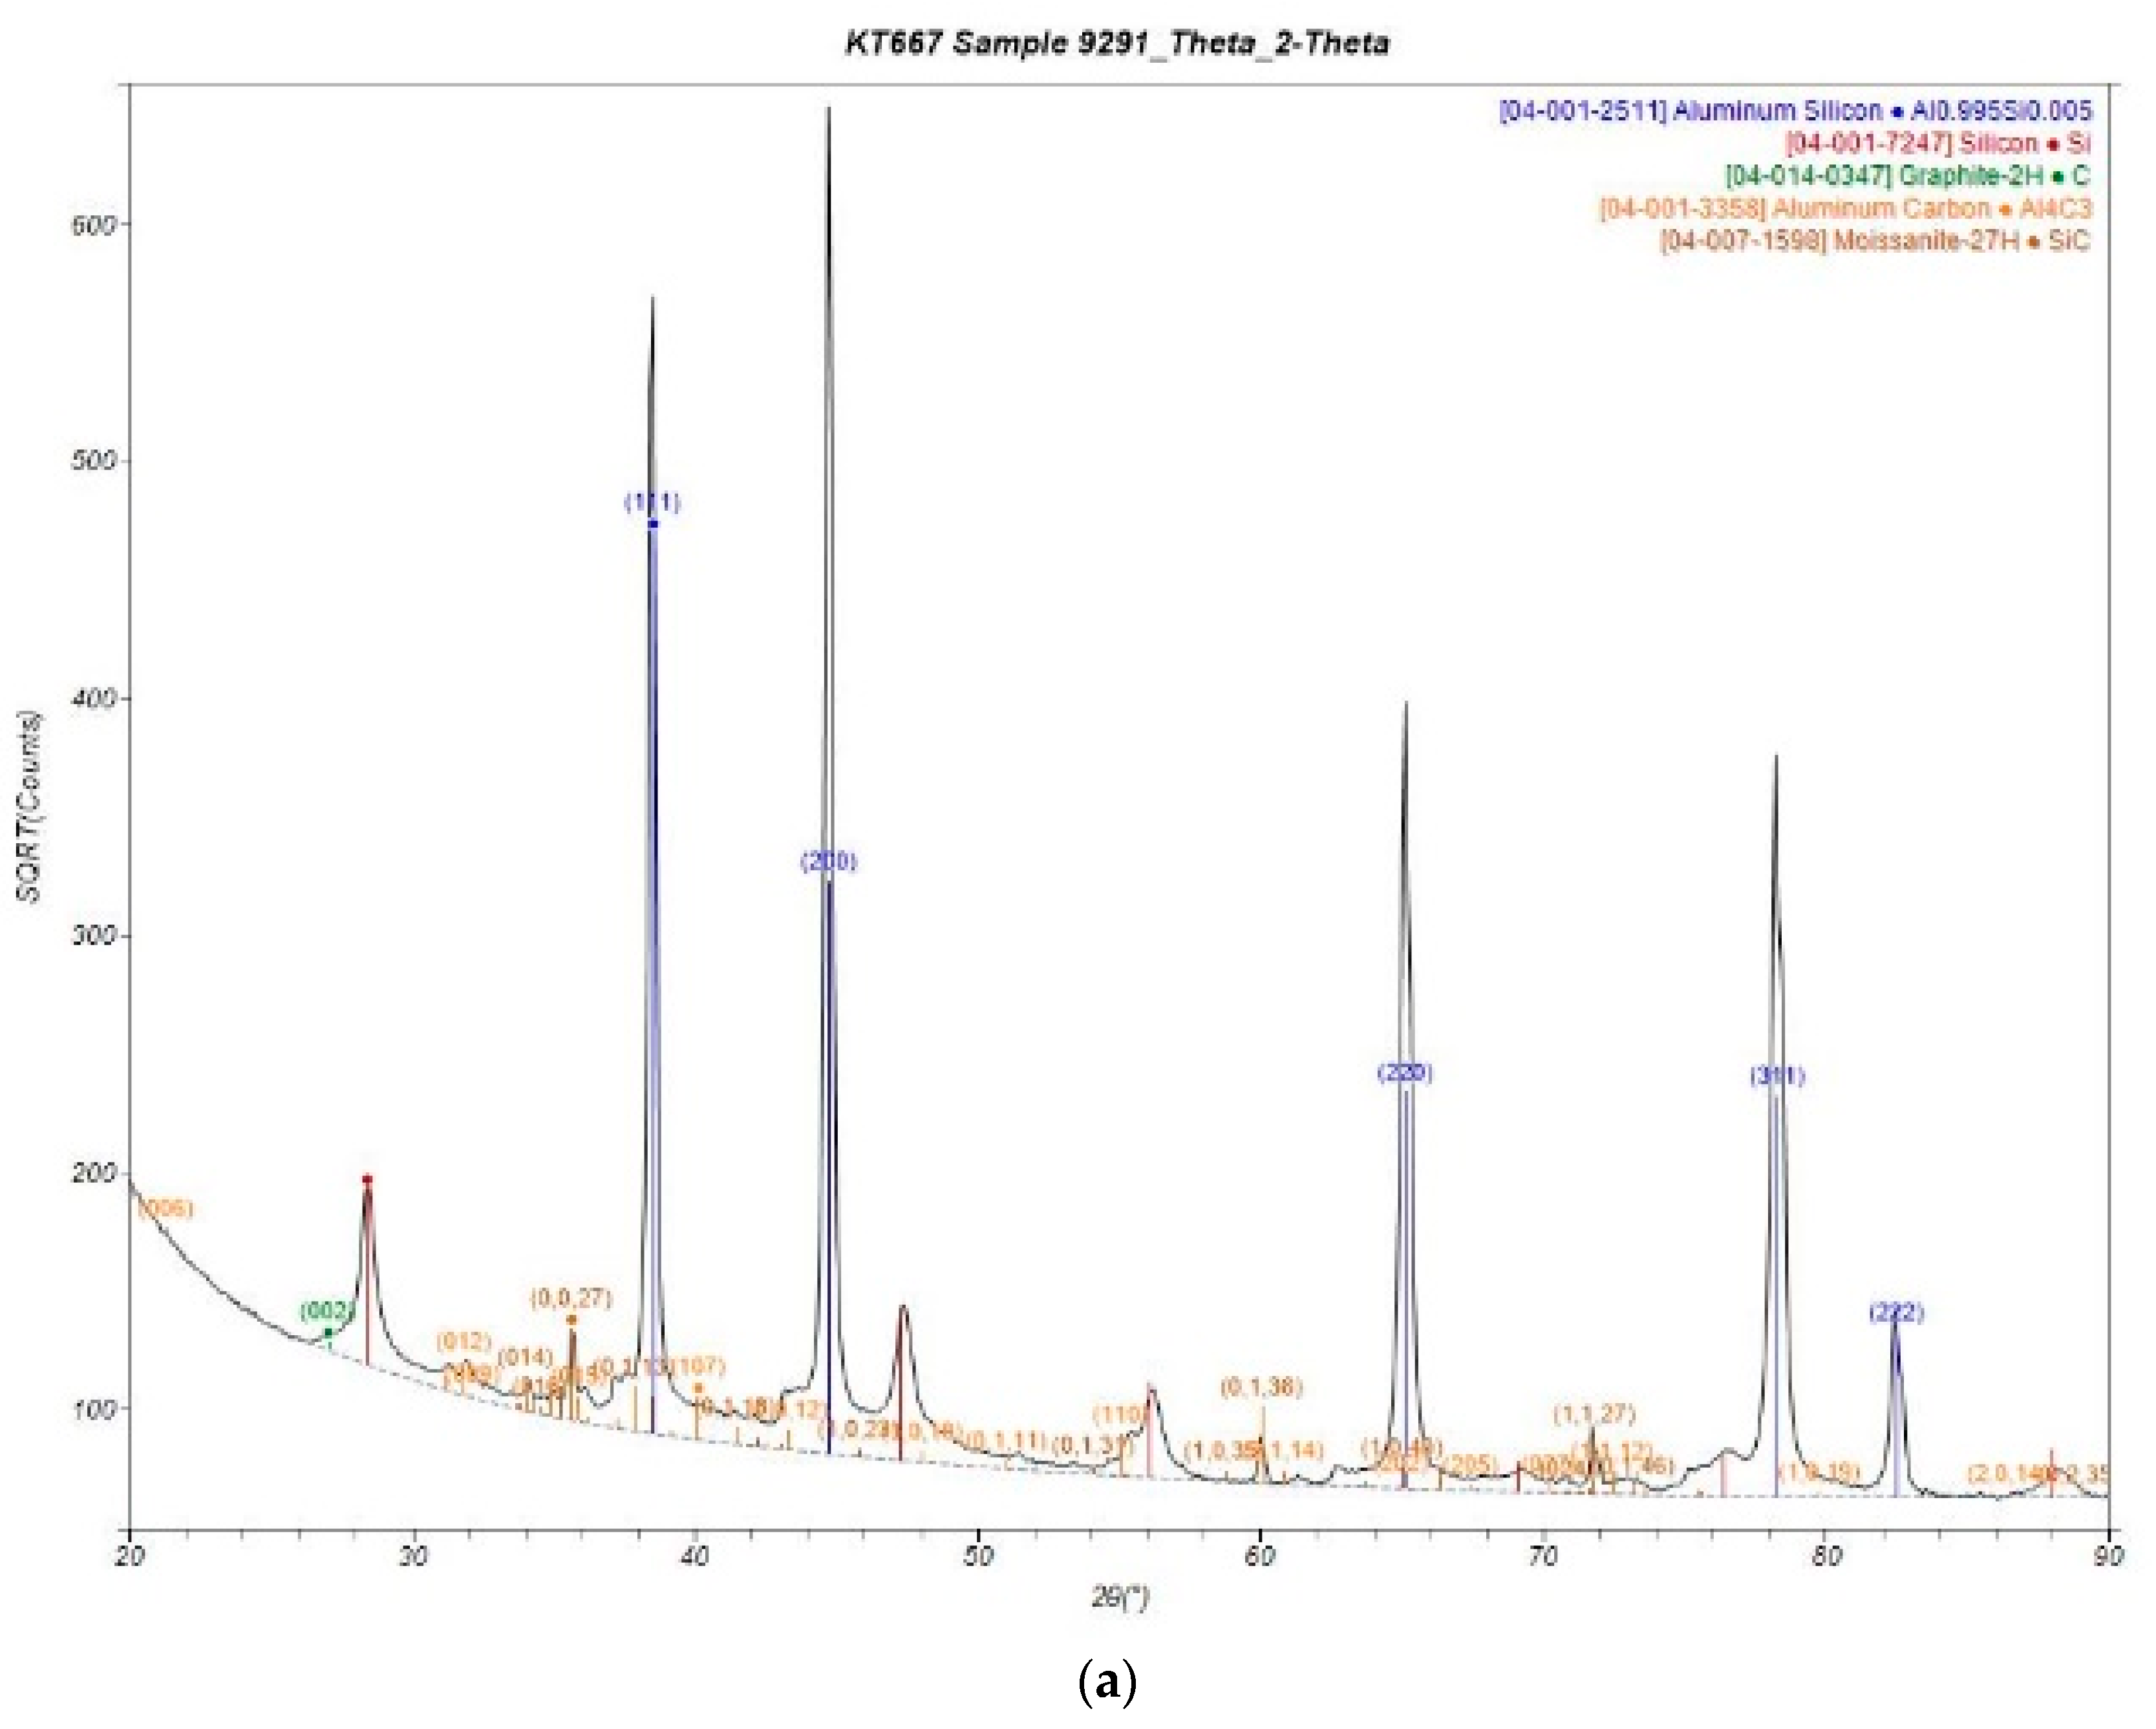
- C: SiC/Al 5/95
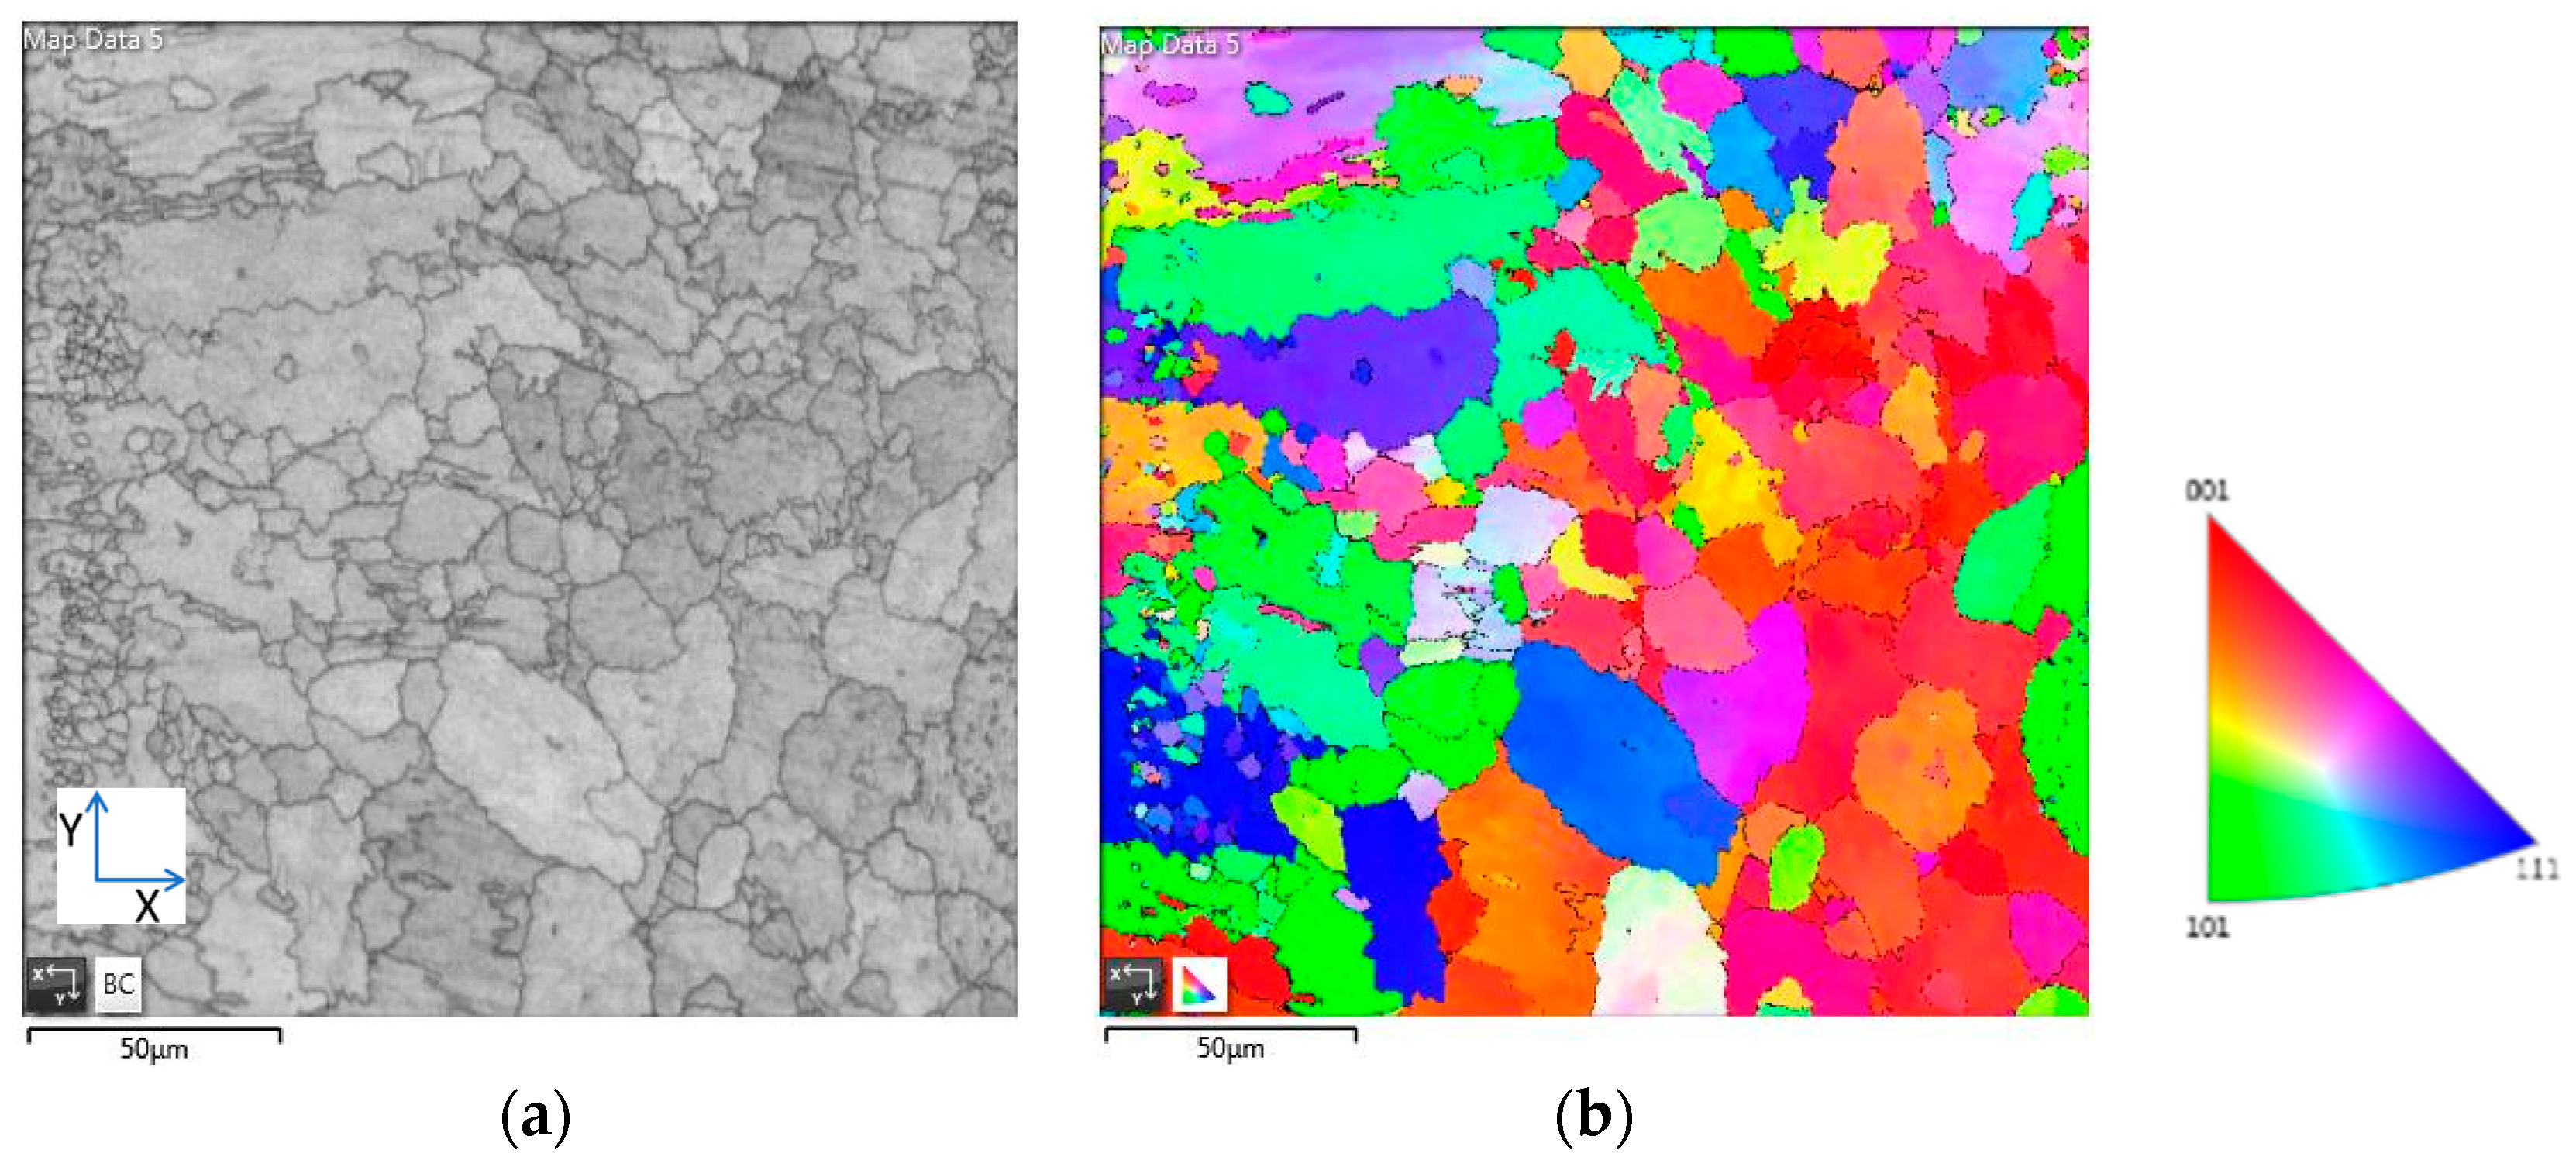
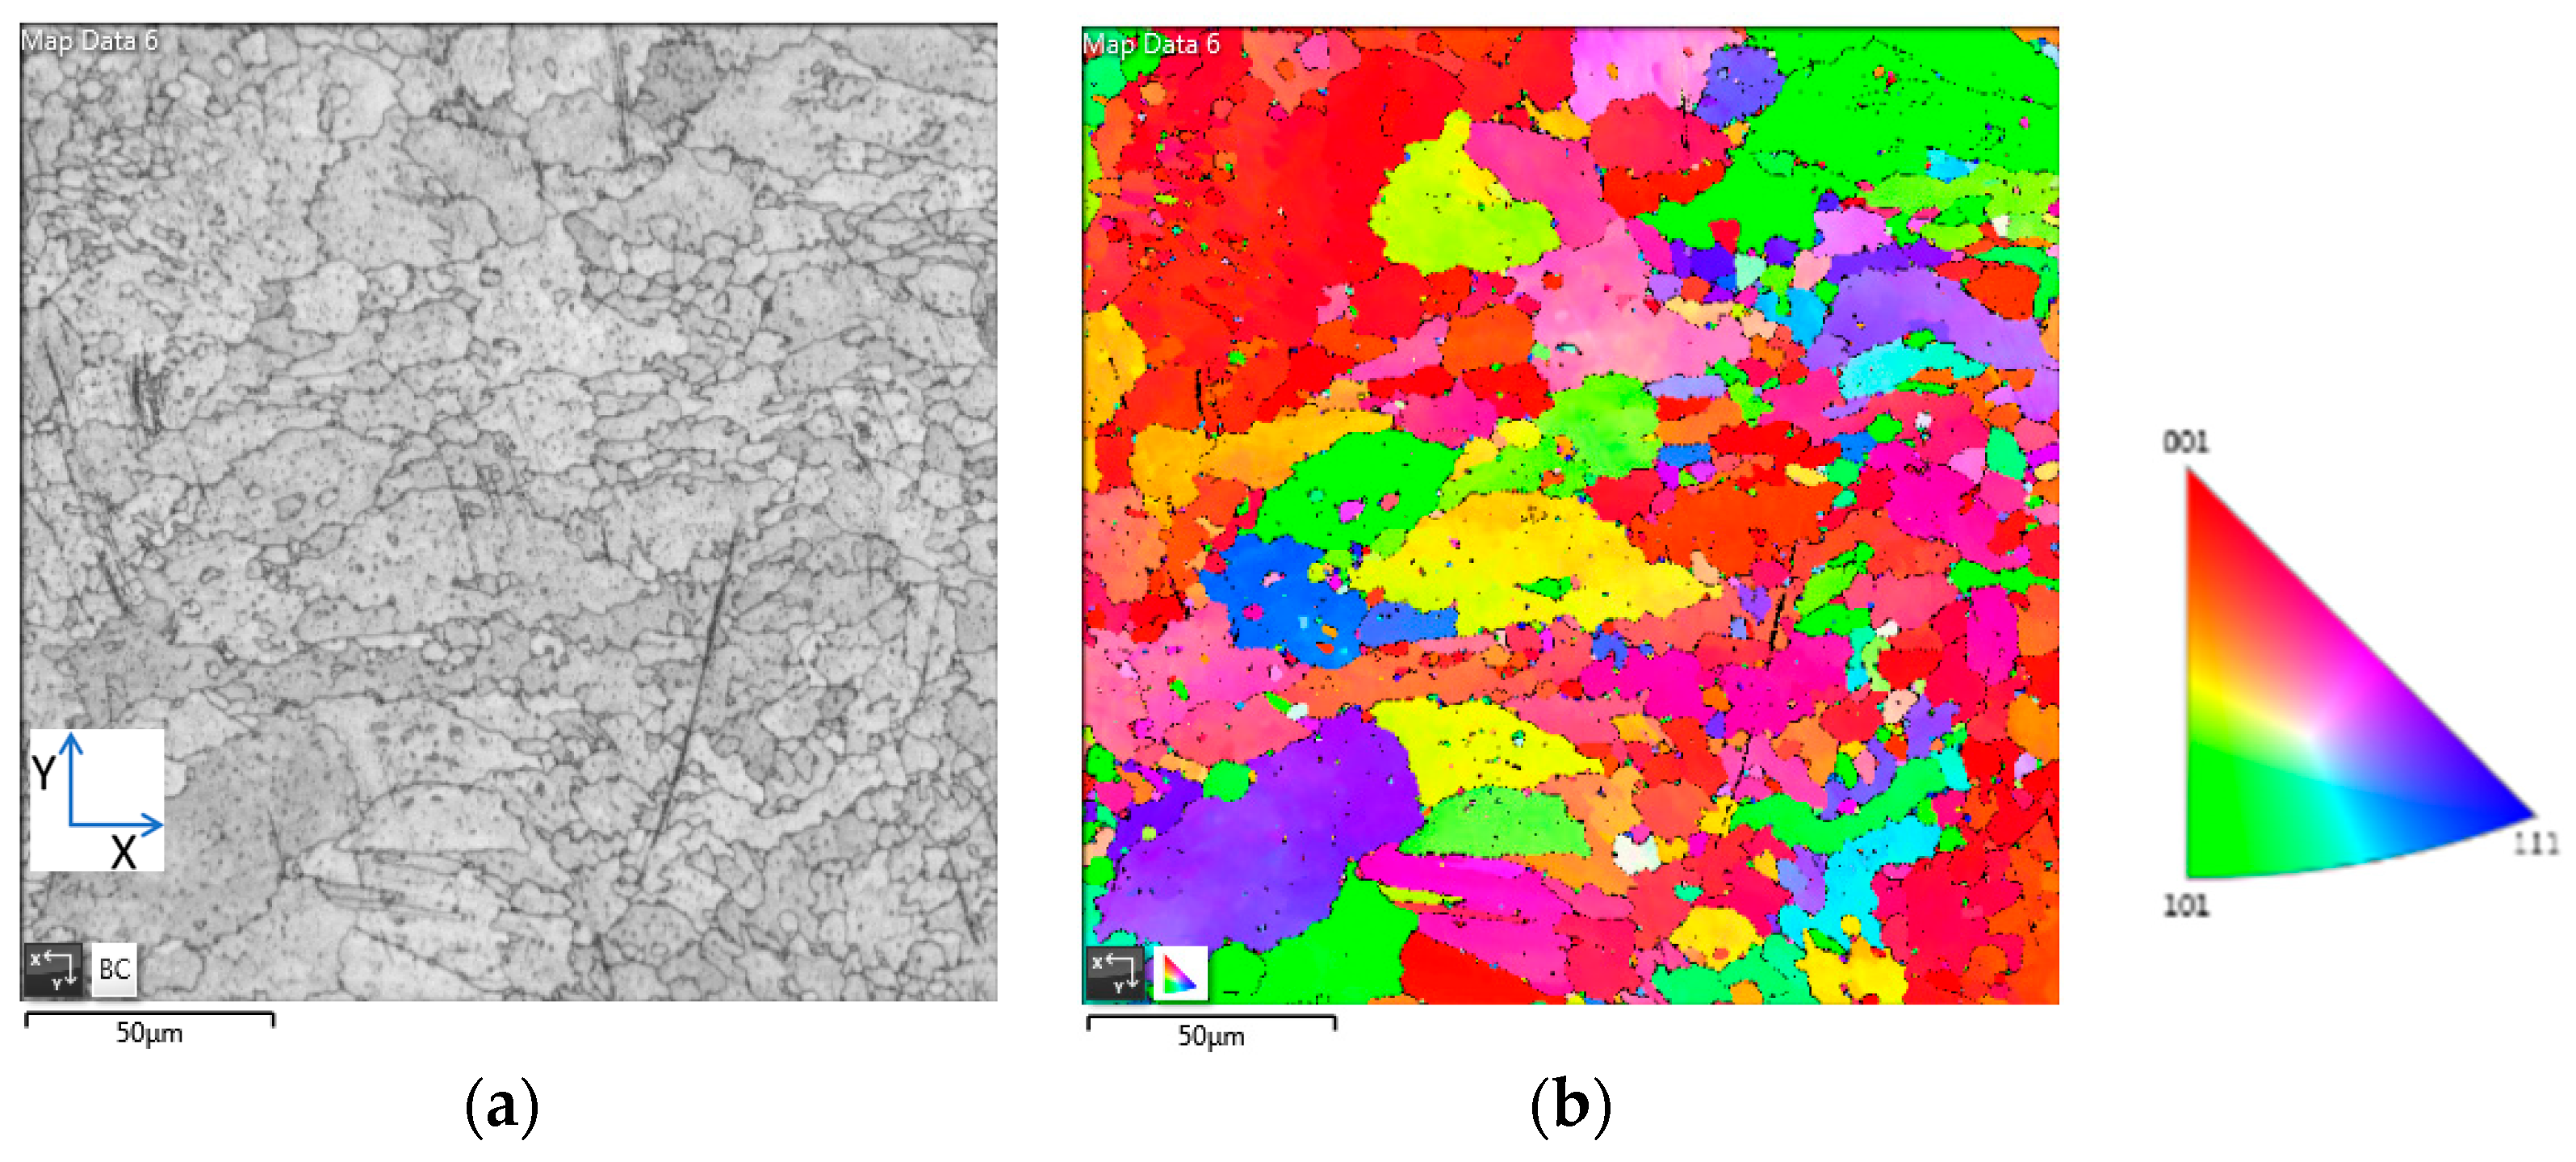
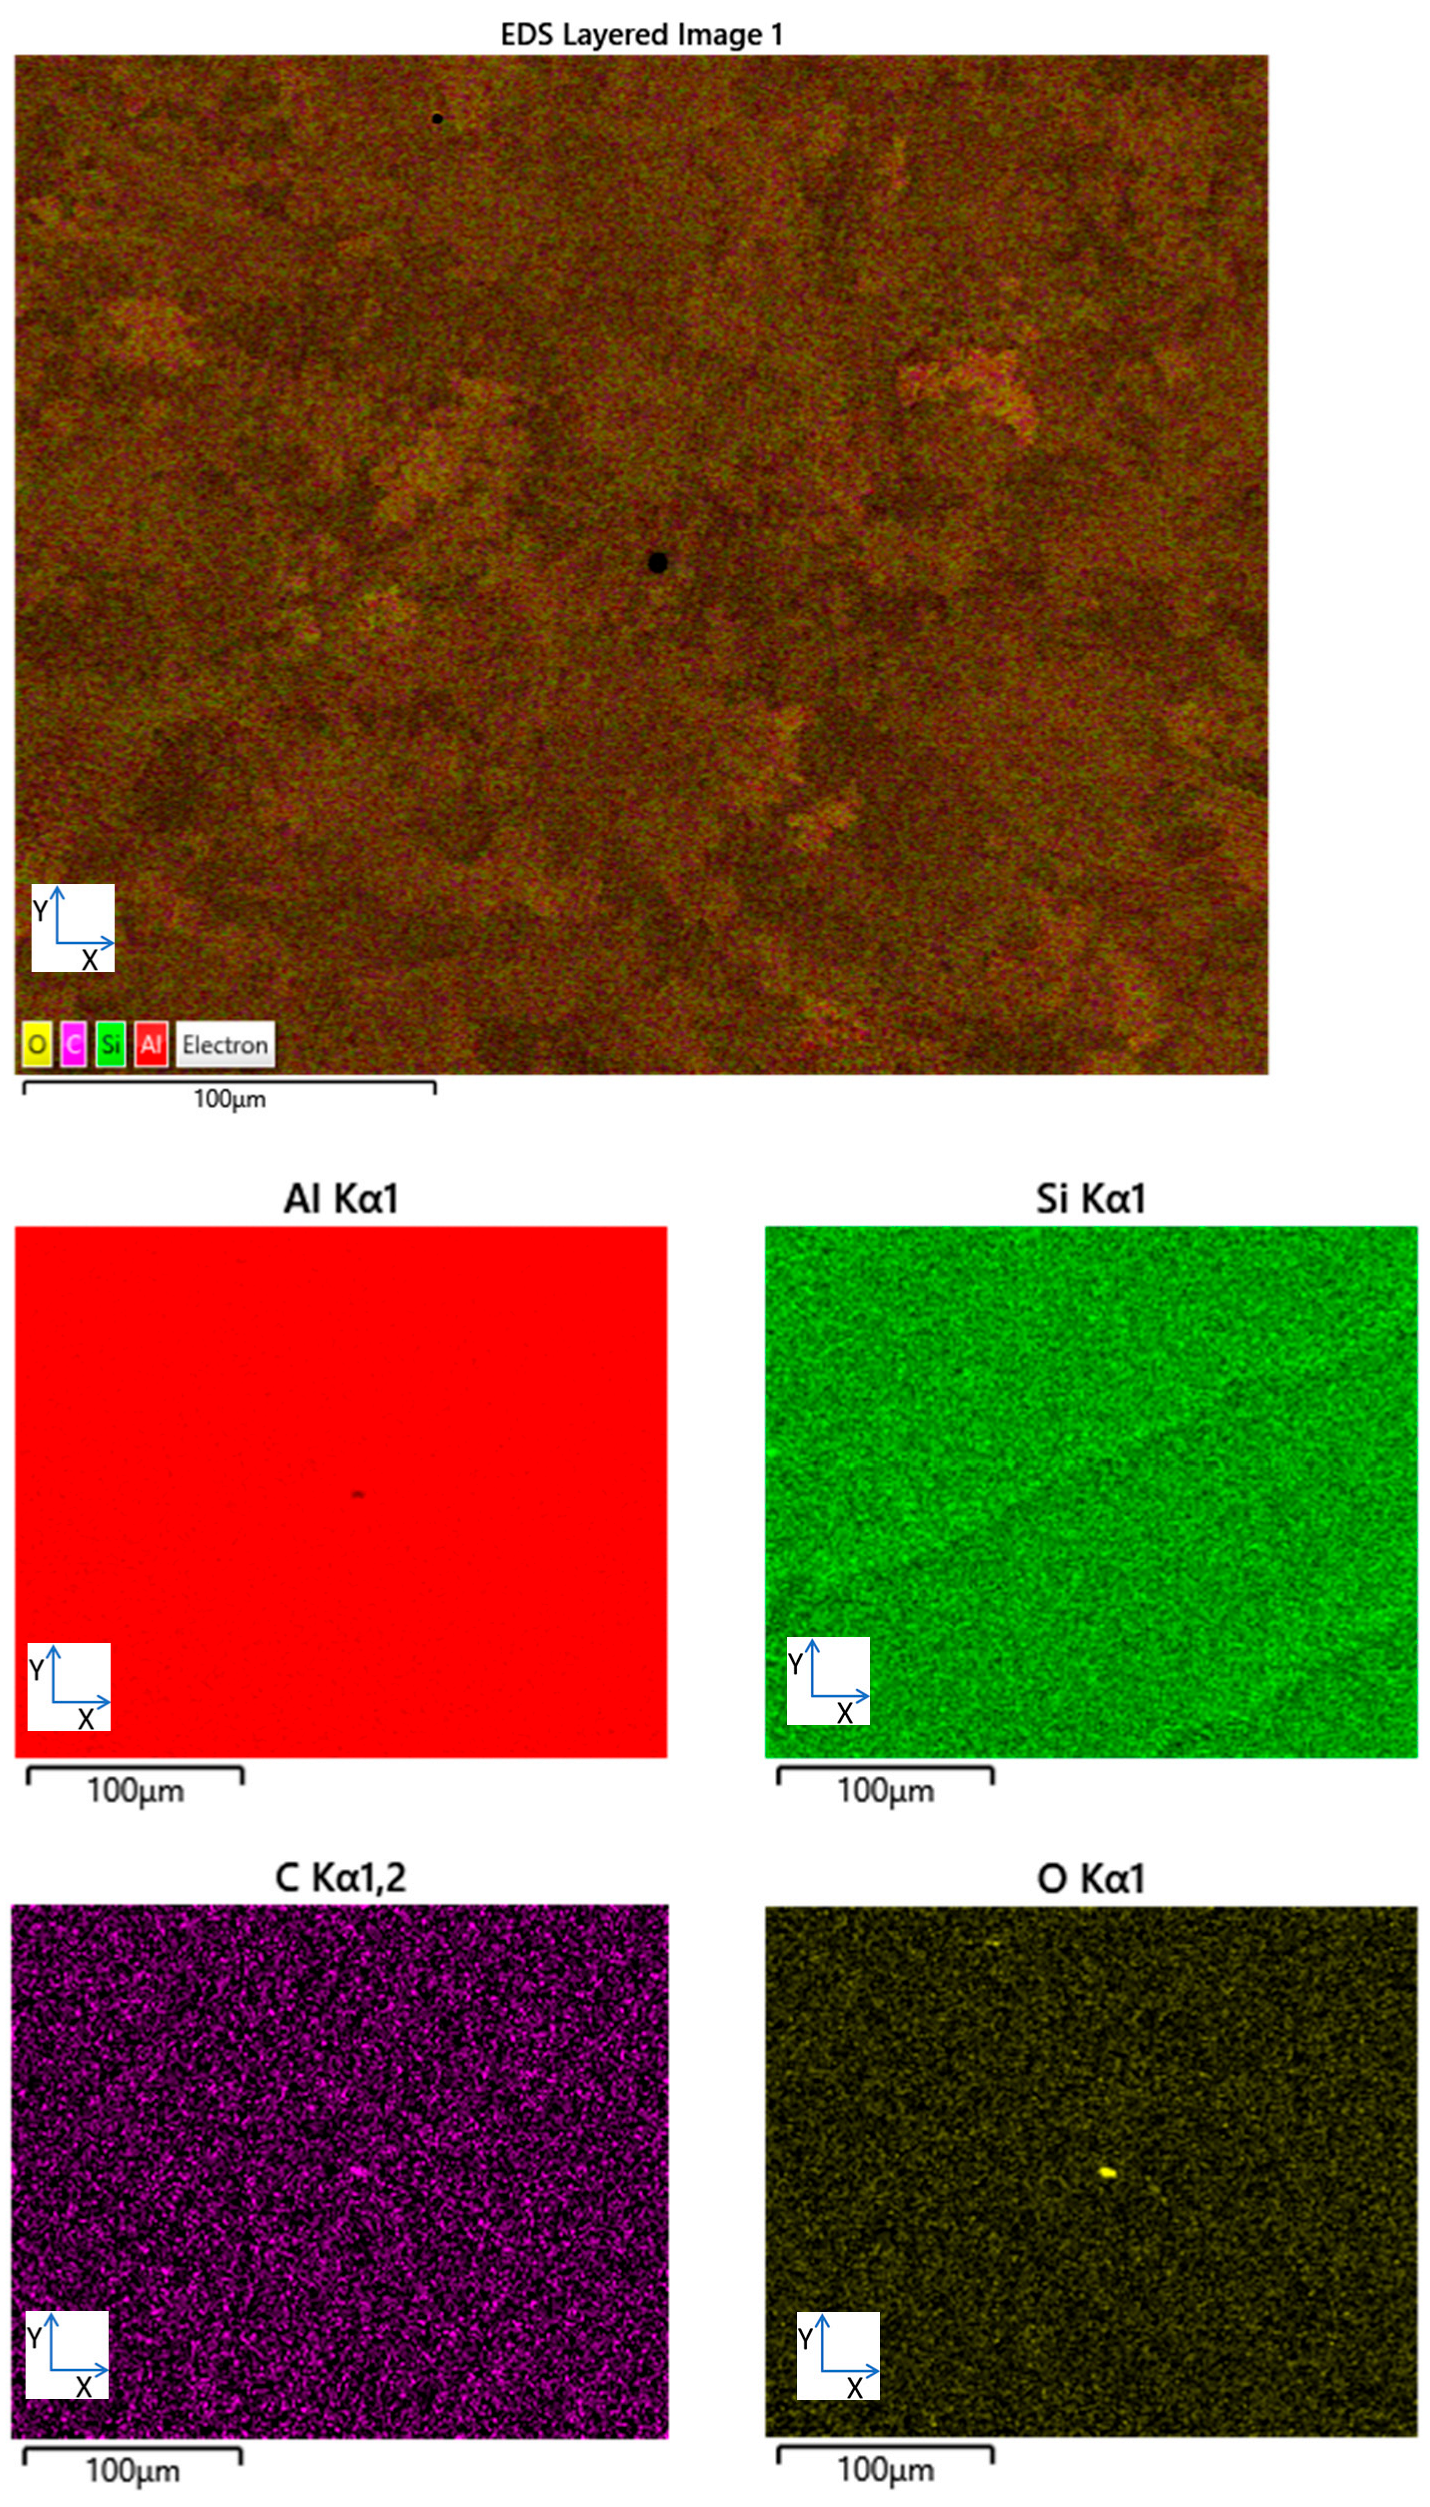
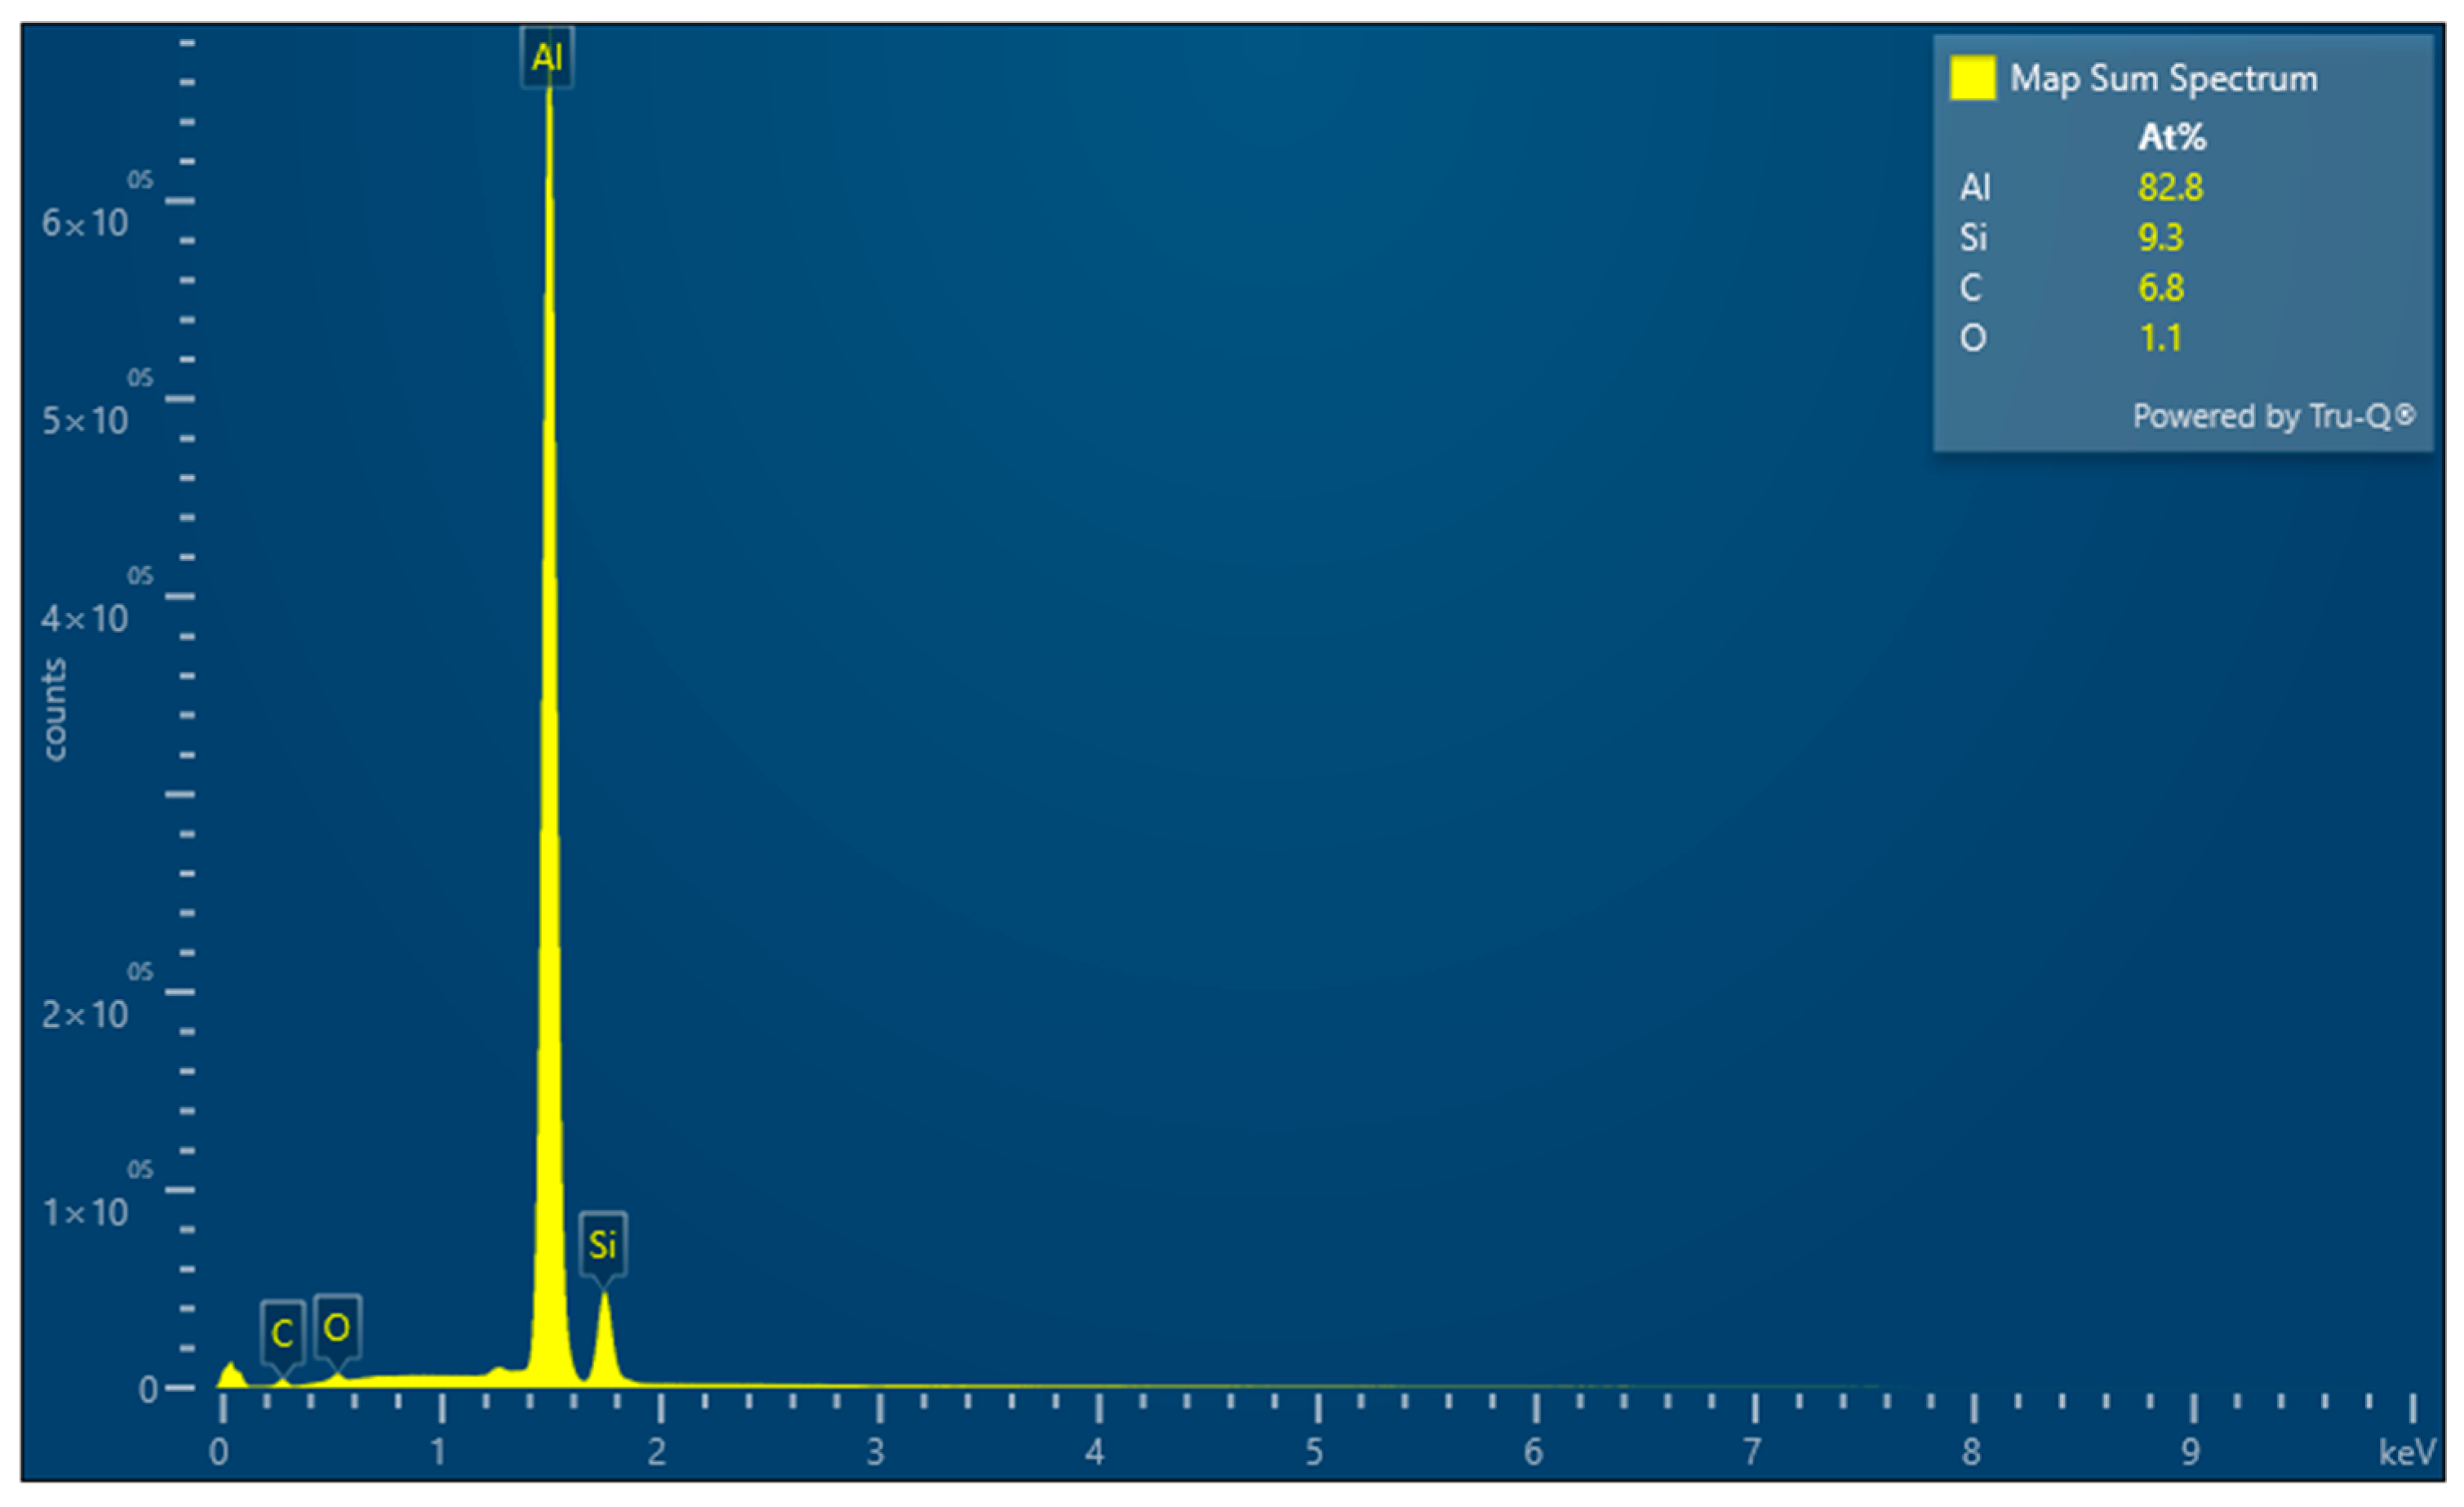
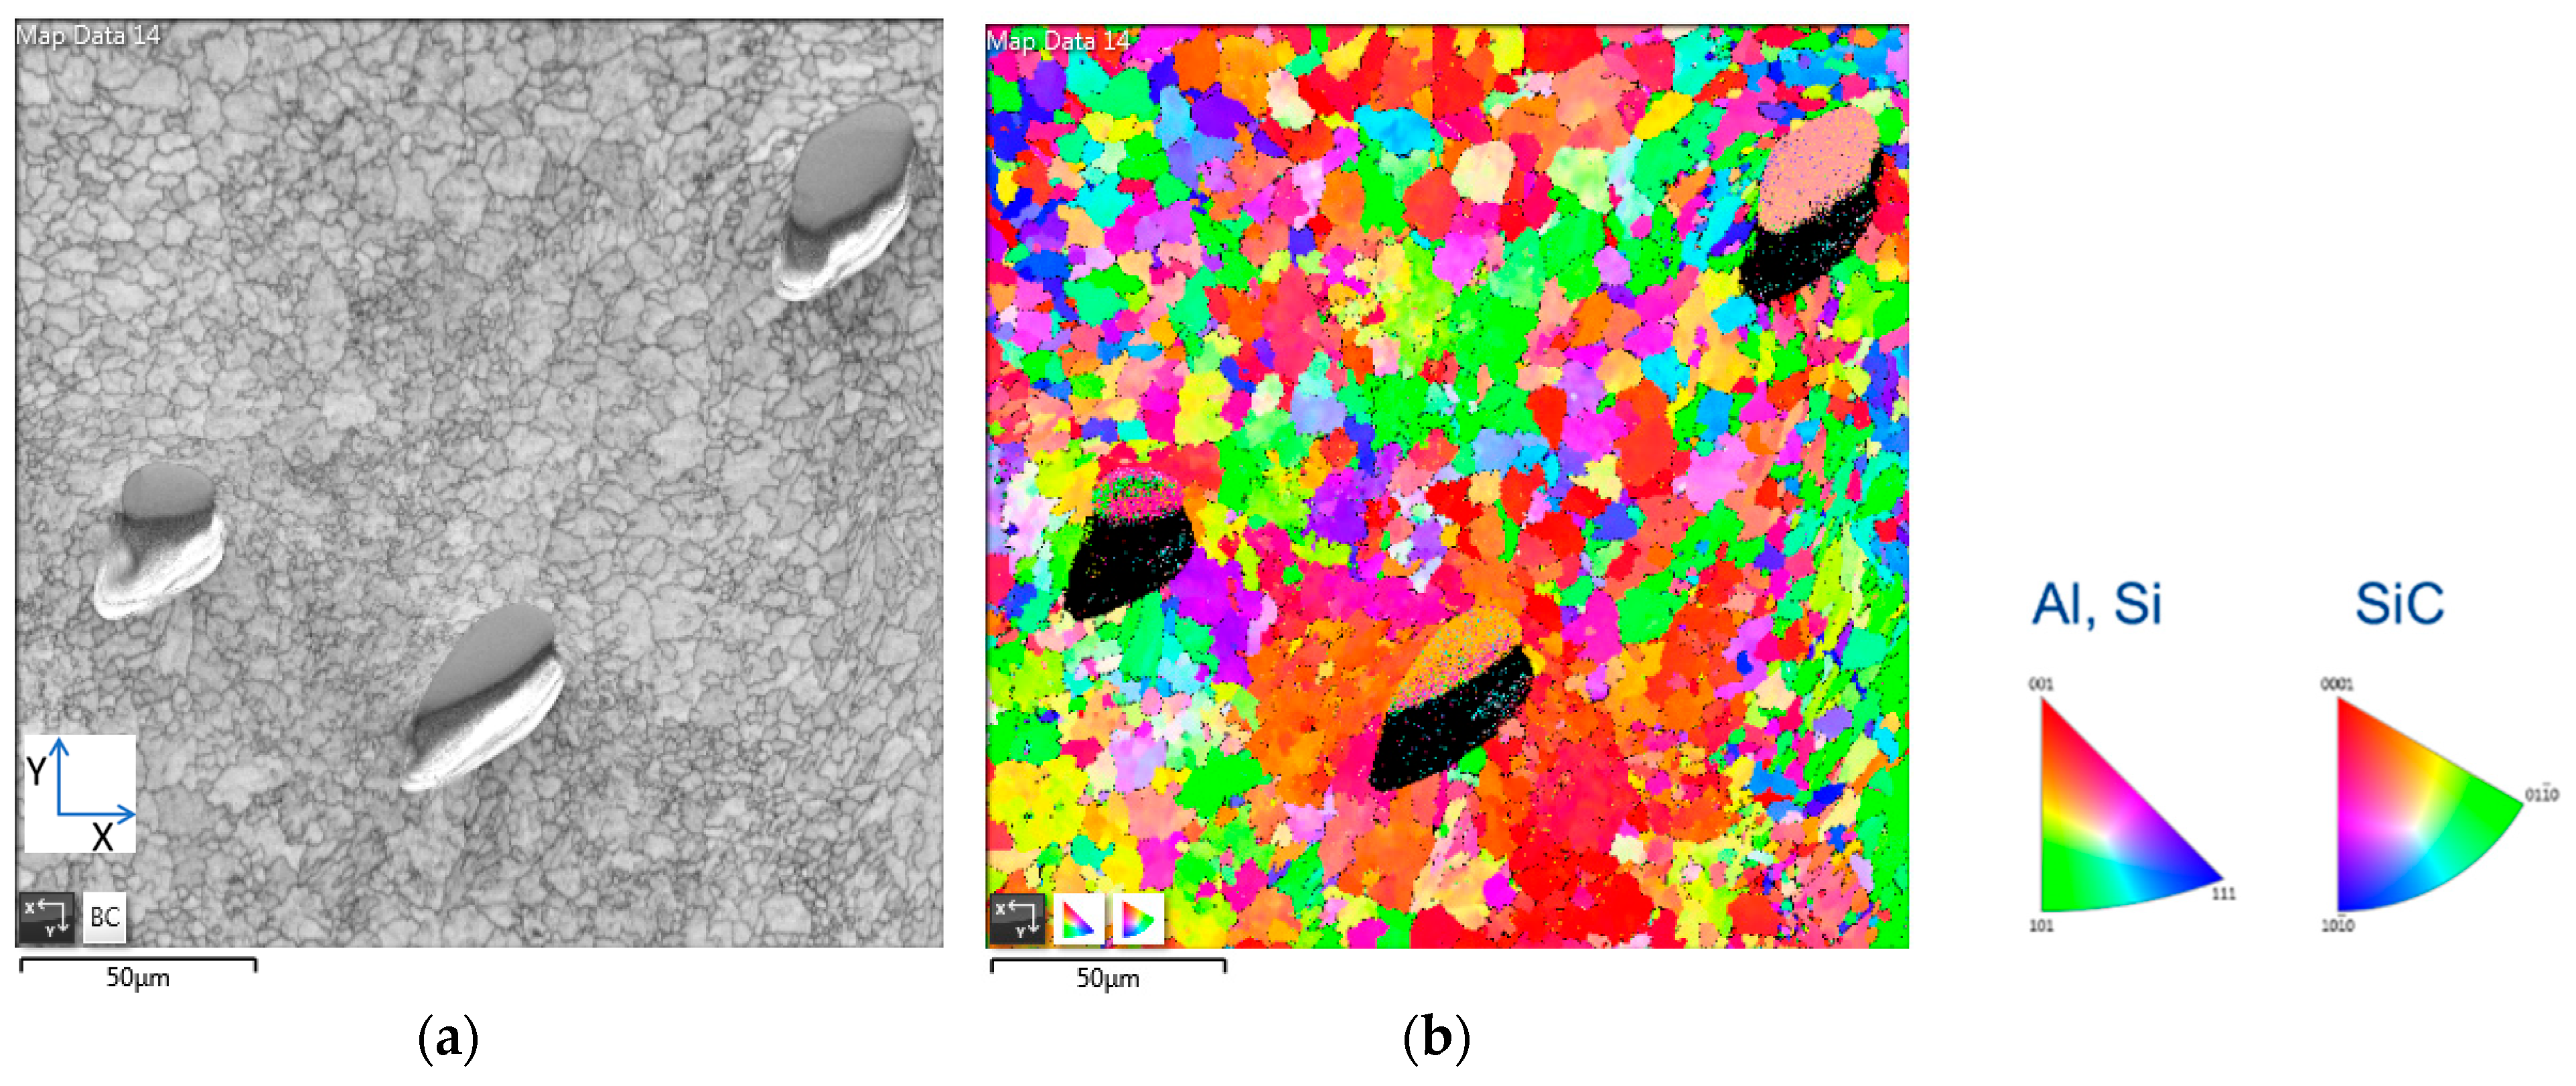
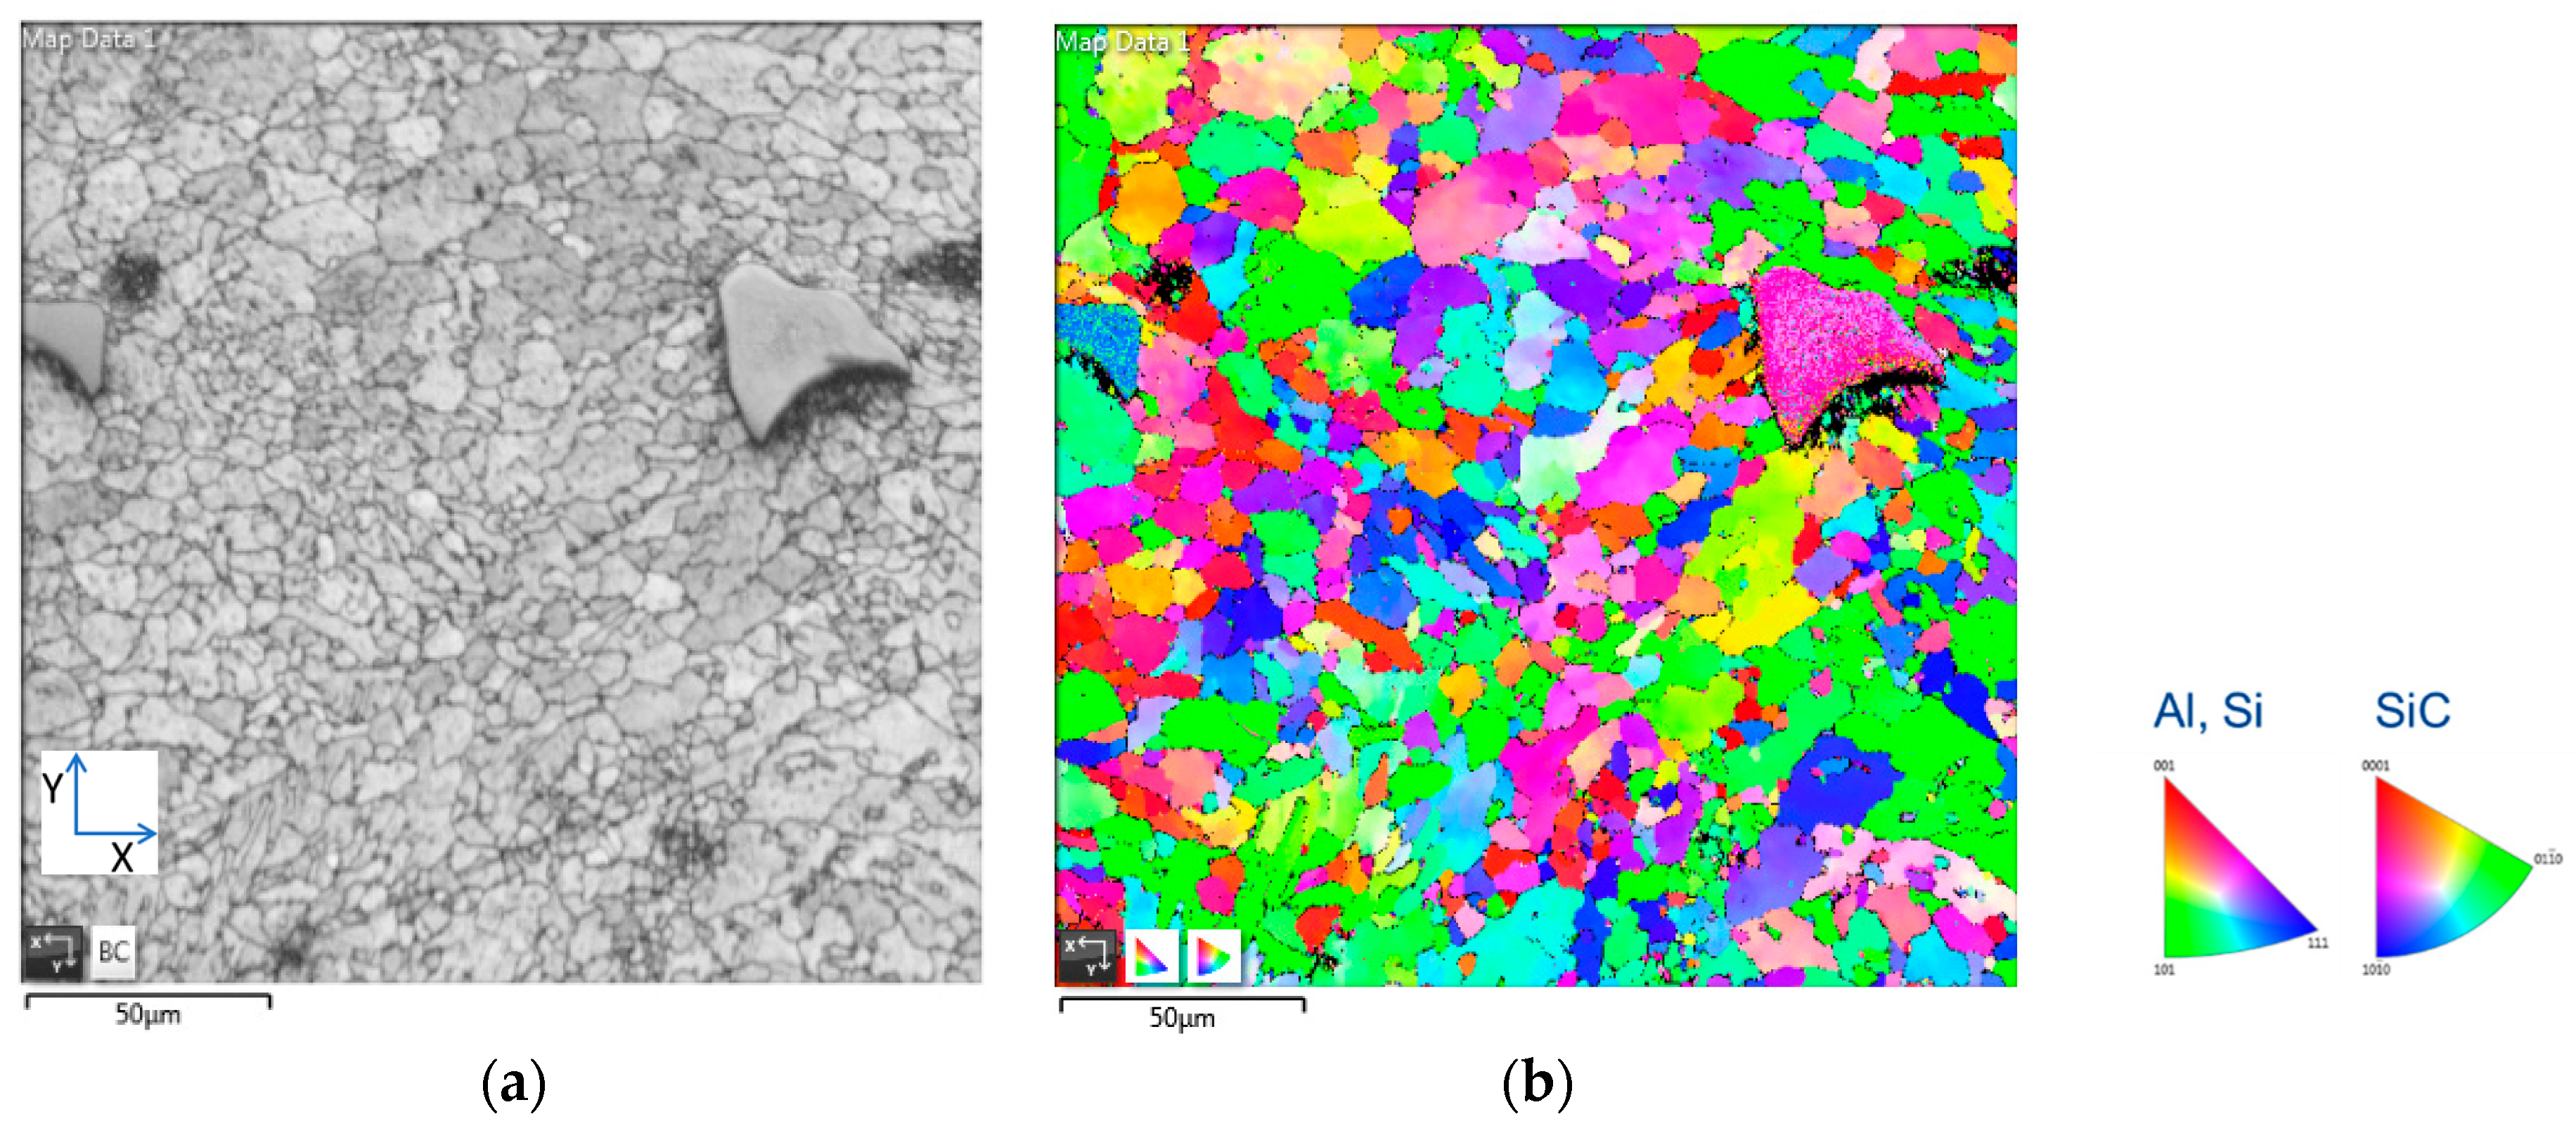
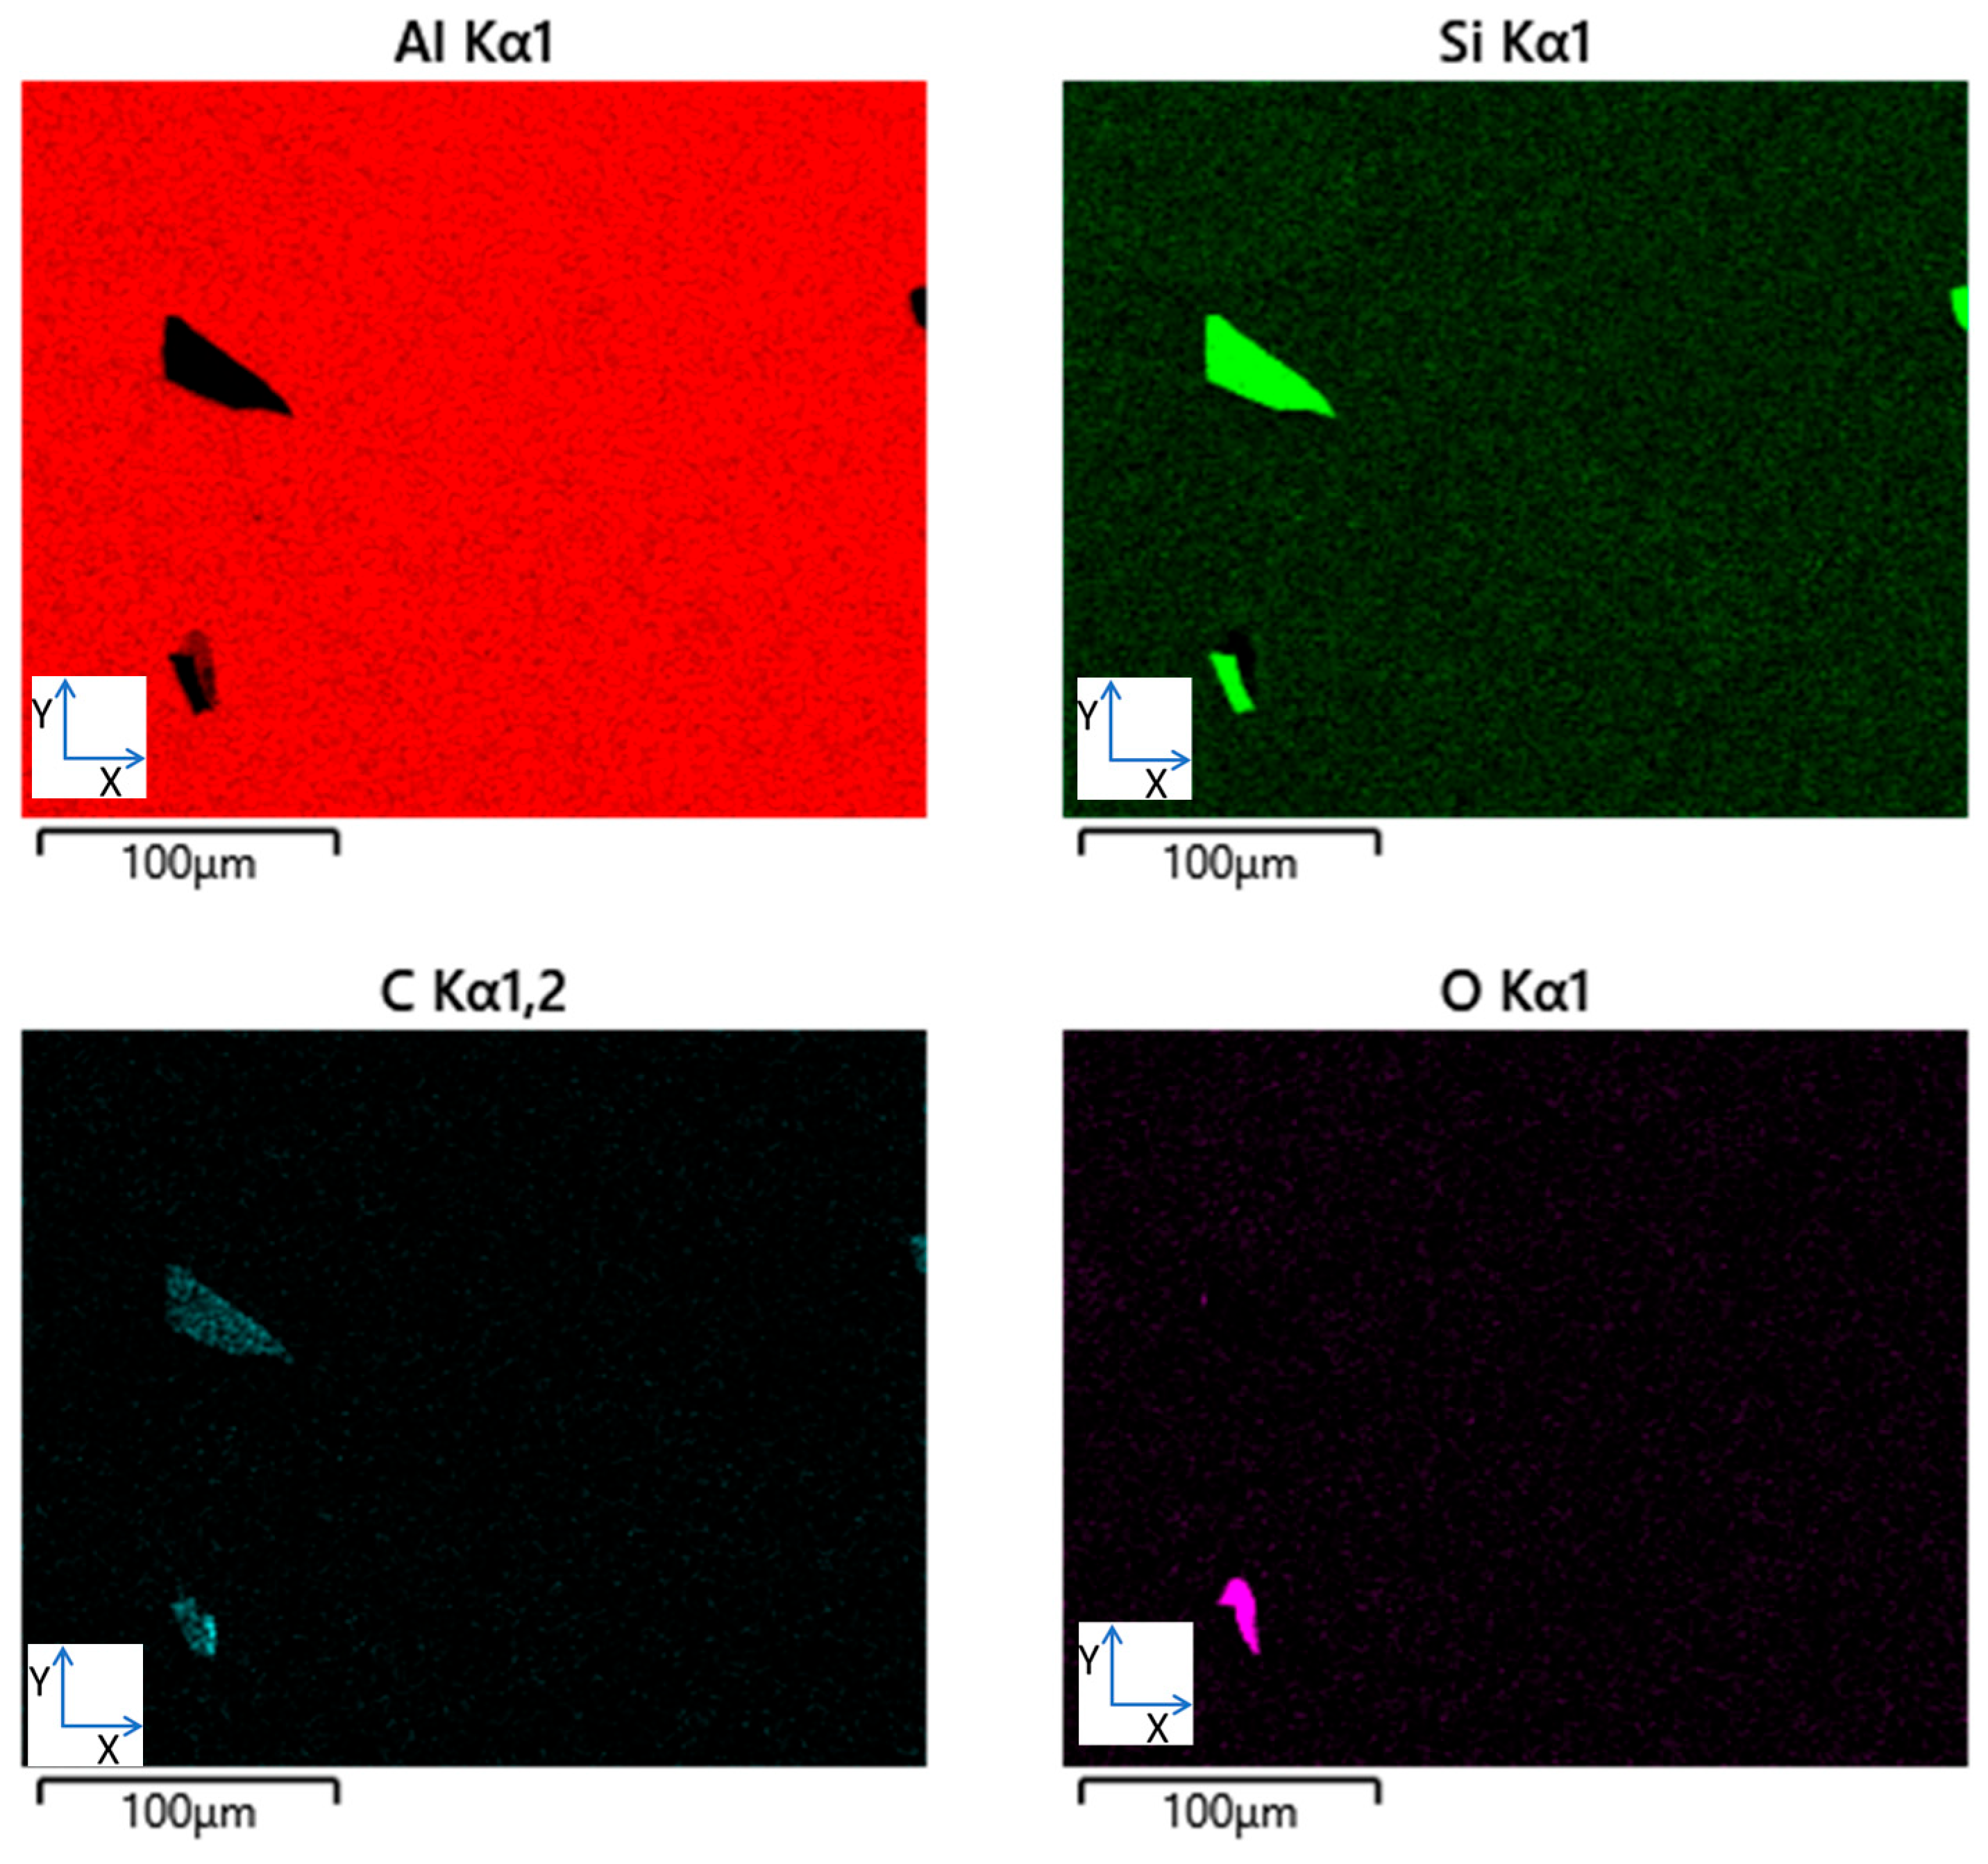
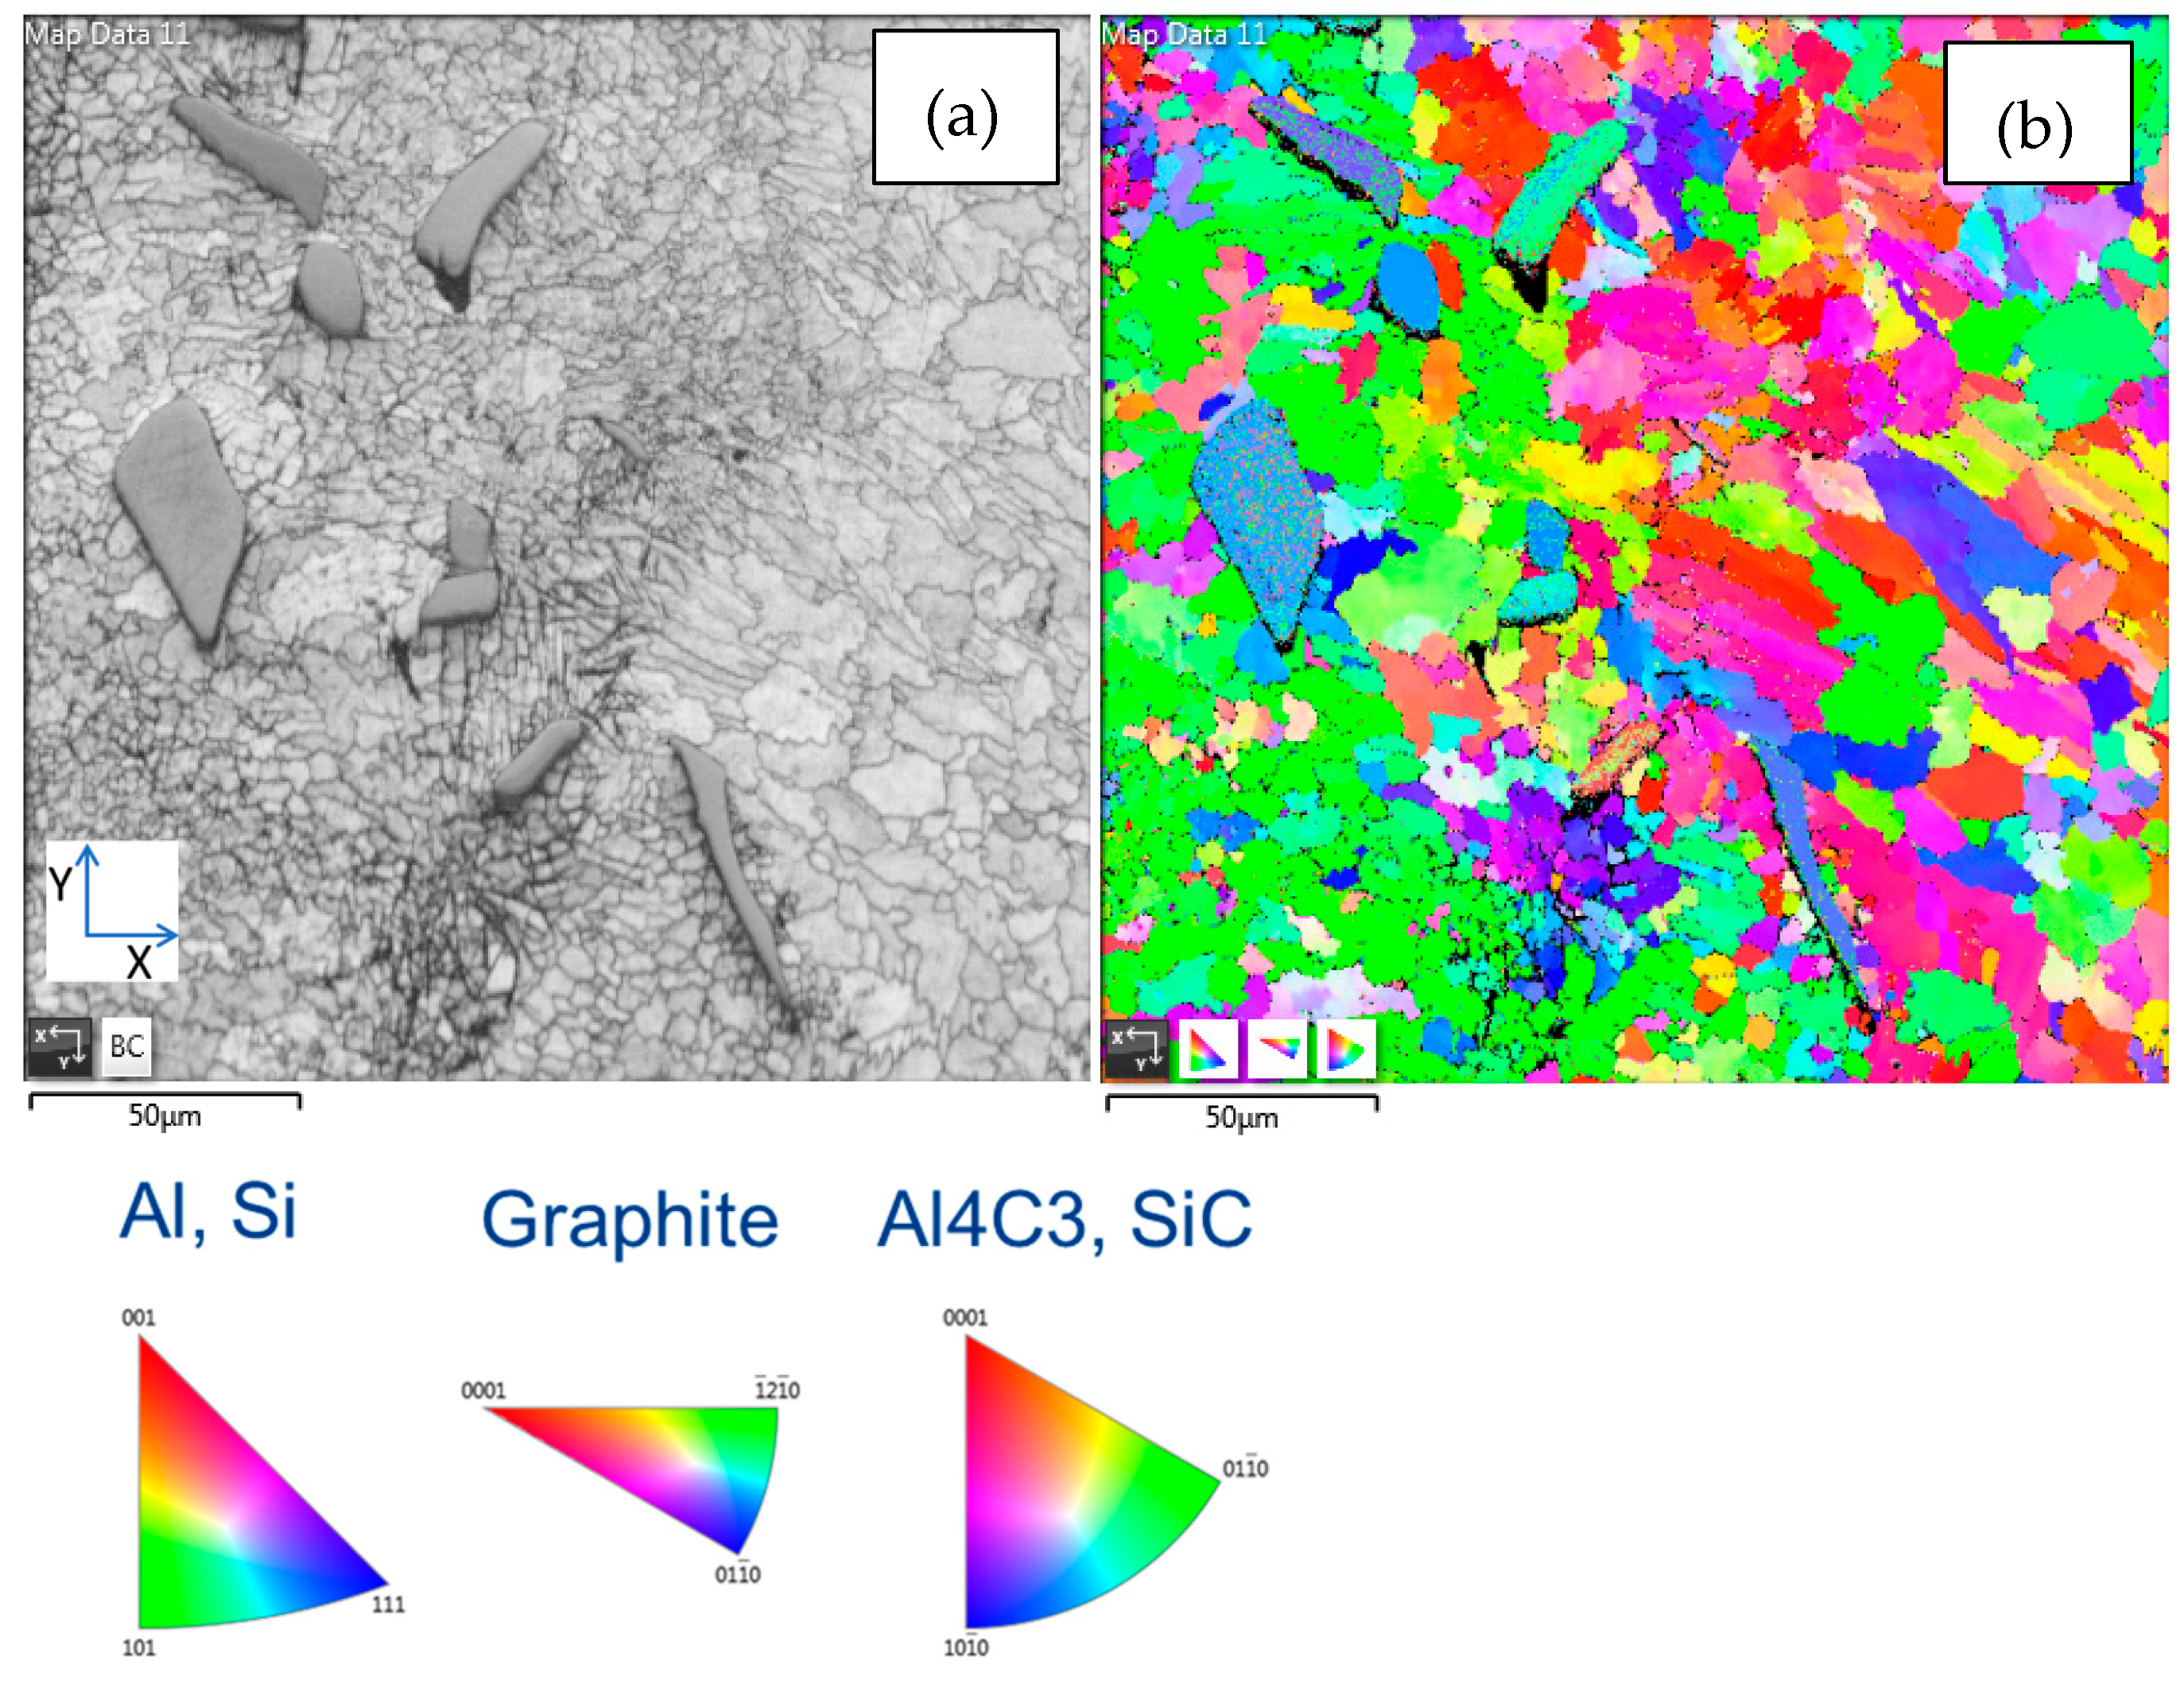
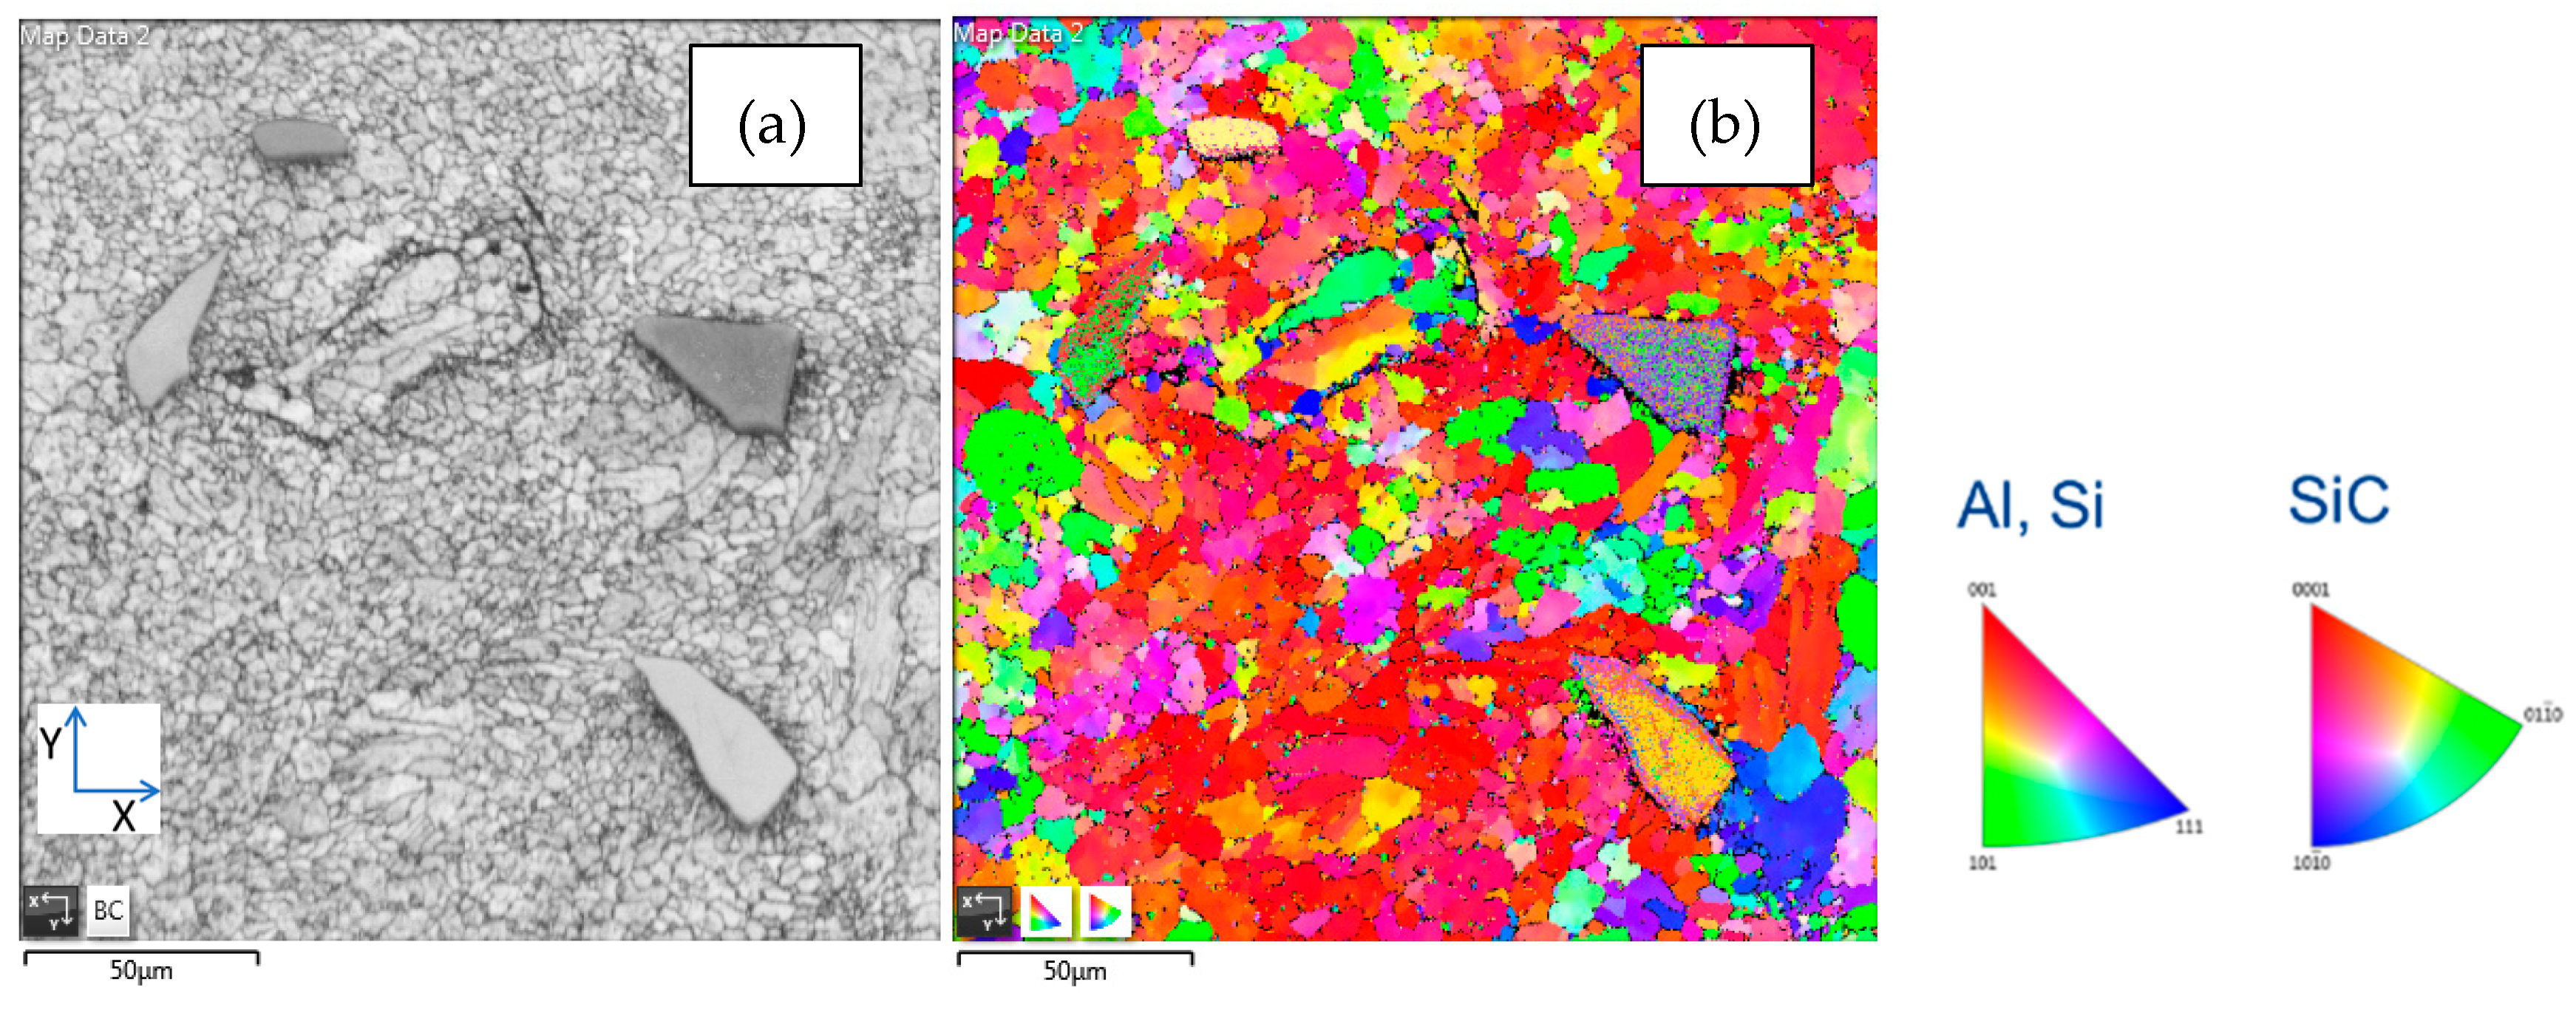
3.5.2. EBSD/EDS Analysis
- A: AlSi10Mg
- B: SiC/Al: 2/98
- C: SiC/Al: 5/95
3.6. Examples of MMC Components
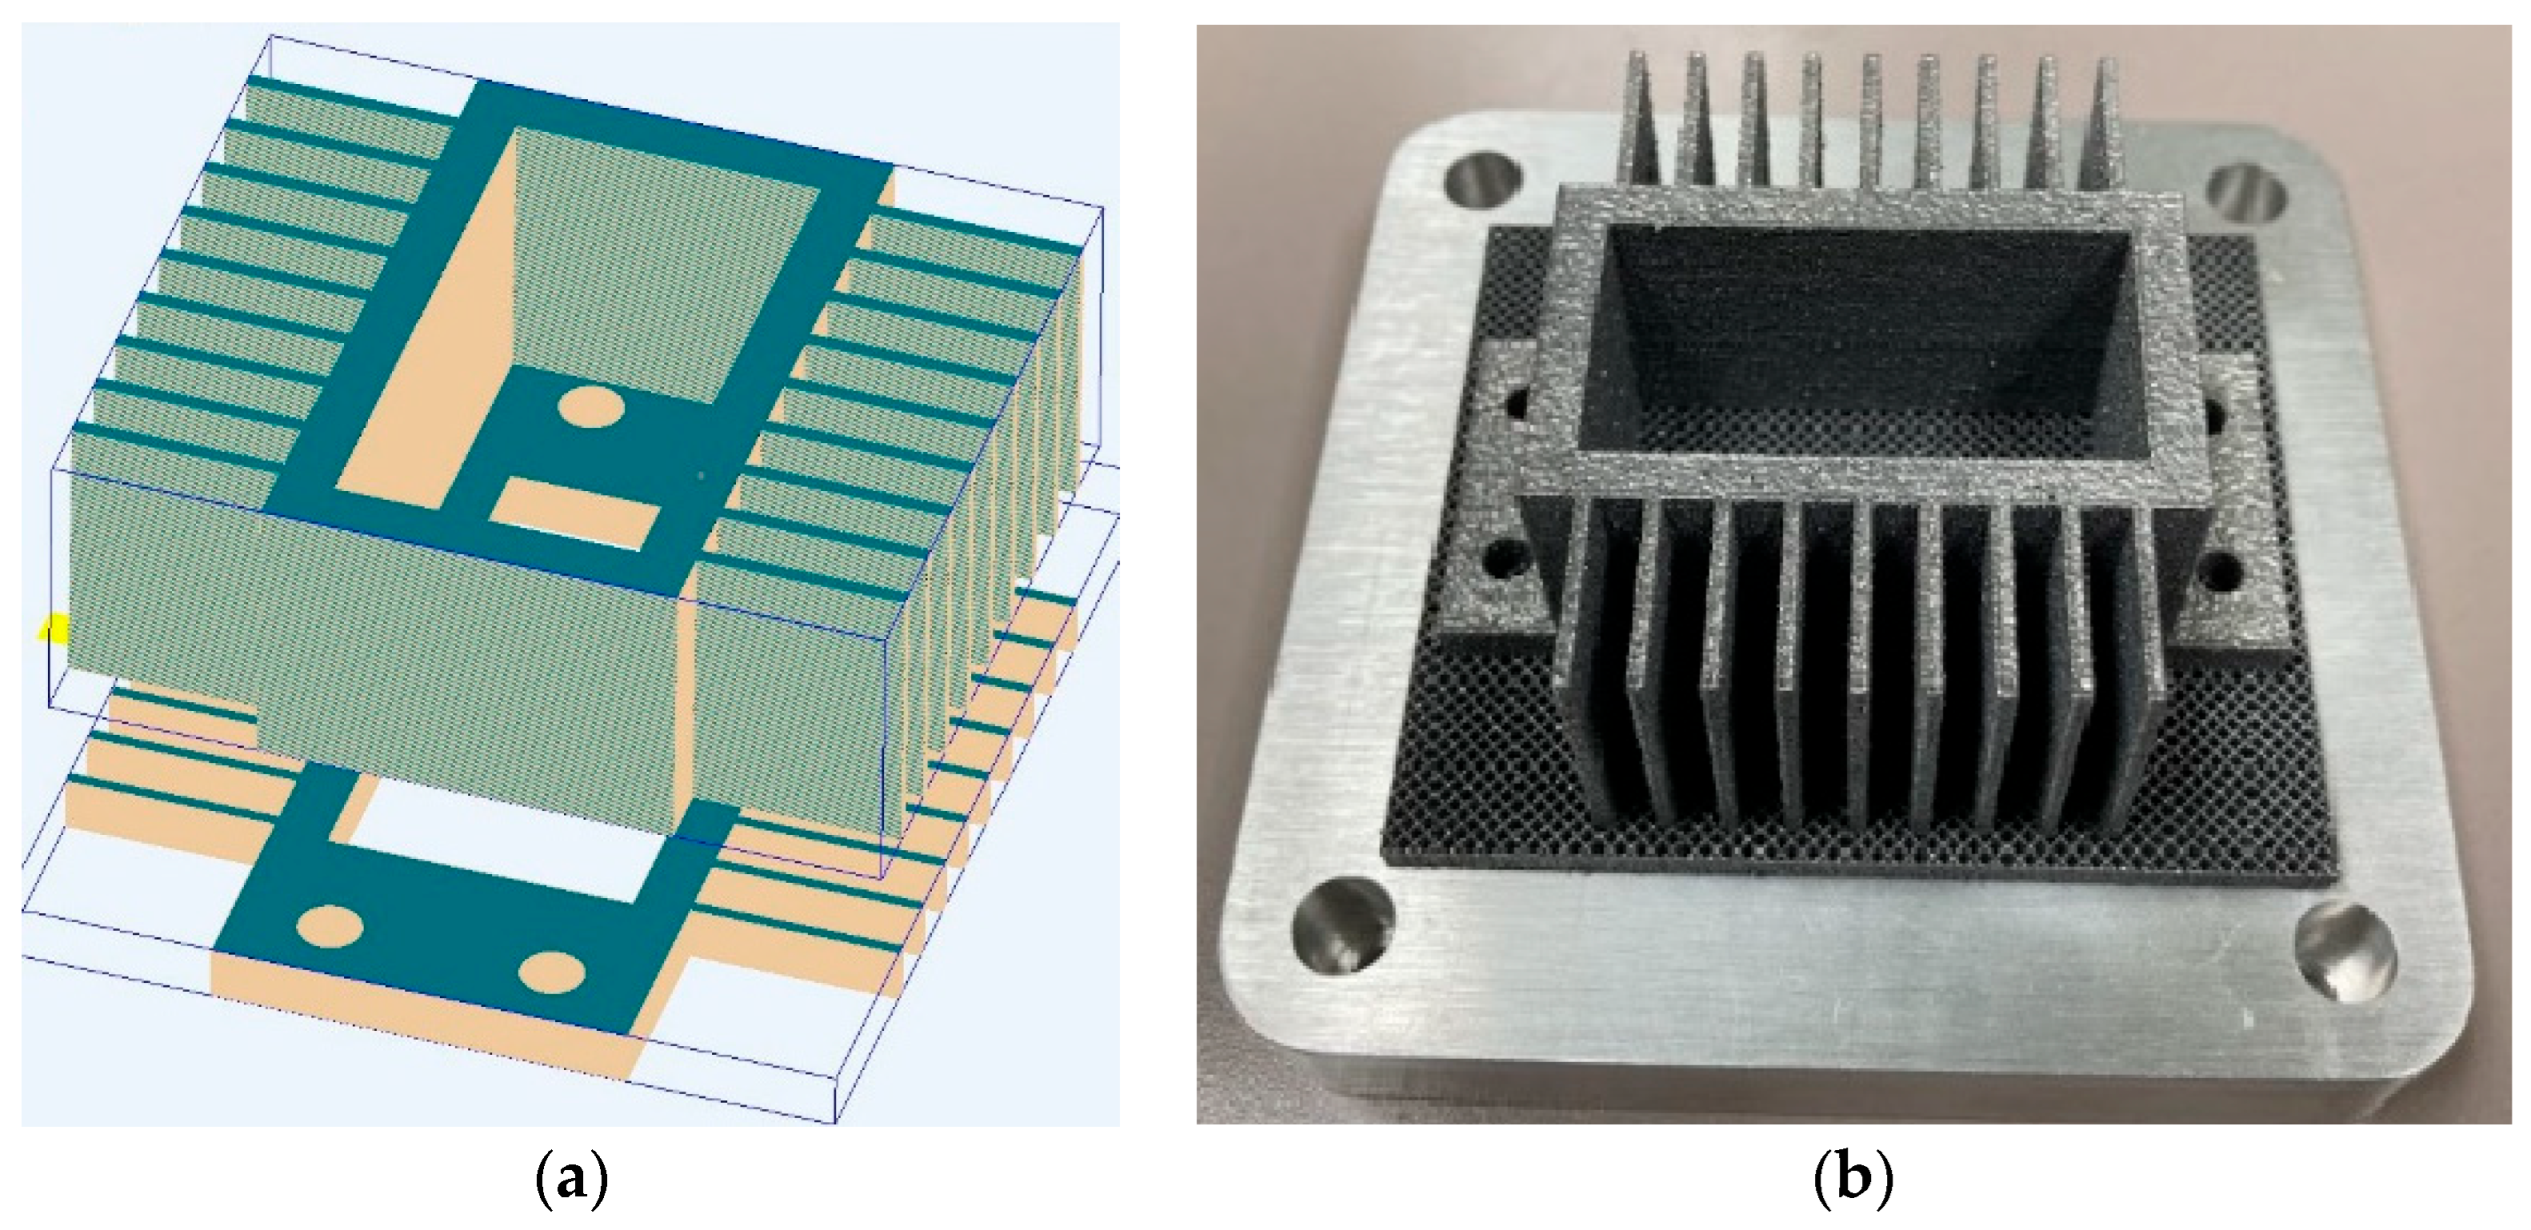
3.6.1. Graded Composition AM of Heat Sink
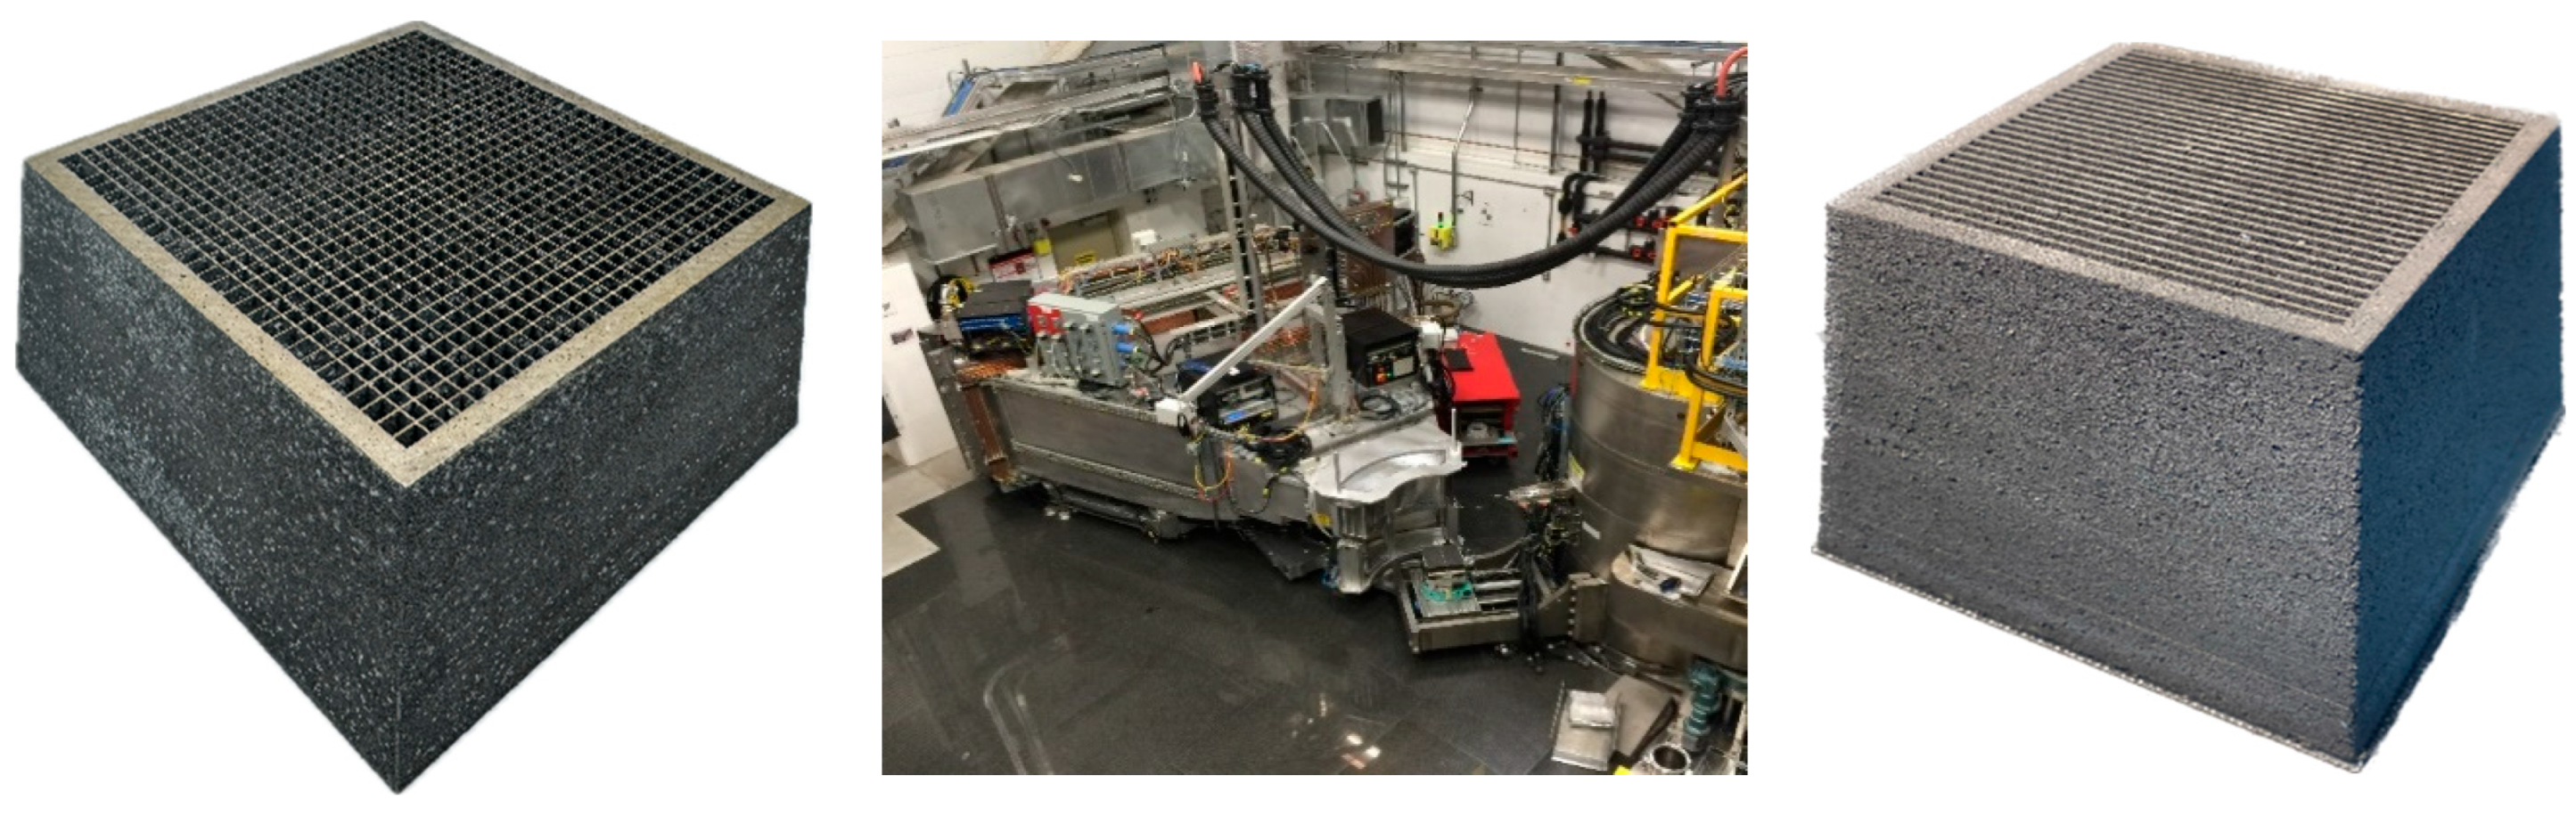
3.6.2. AM of MMC Neutron Radial Collimators and Components
4. Conclusions
- (a)
- High relative density (>99%) is achievable by optimizing AM process parameters.
- (b)
- Mechanical properties show anisotropic properties; however, HIP treatment helps improve the samples to be more isotropic.
- (c)
- SiC/Al: 2/98 obtained the highest strength and Young’s modulus.
- (d)
- Compound Al4C3 was observed for as-built SiC/Al:5/95 MMC samples.
- (e)
- Thermal conductivities close to AlSi10Mg were achieved for both SiC/Al: 2/98 and SiC/Al: 5/95 MMCs.
- (f)
- During the HIP process, it is predicted that the fine grains were finely decomposed along with their respective directions at 300 °C and 60 MPa, thereby releasing the residual stress caused by fast laser heating during printing. And then, as the temperature and pressure increased further to 475 °C and 100 MPa, their bonding strength became stronger, which made macro-level grain boundaries difficult to identify during the etching test.
Author Contributions
Funding
Institutional Review Board Statement
Informed Consent Statement
Data Availability Statement
Acknowledgments
Conflicts of Interest
References
- Sharma, D.K.; Mahant, D.; Upadhyay, G. Manufacturing of metal matrix composites: A state of review. Mater. Today Proc. 2020, 26 Pt 2, 506–519. [Google Scholar] [CrossRef]
- Krishna, M.G.; Kumar, K.P.; Swapna, M.N.; Rao, J.B.; Bhargava, N.R.M.R. Metal-metal Composites—An Innovative Way for Multiple Strengthening. Mater. Today Proc. 2018, 4, 8085–8095. [Google Scholar] [CrossRef]
- Volpp, J. Impact of process parameters on particle distribution and wear resistance during laser deep alloying processes. In Proceedings of the Laser Advanced Materials Processing (LAMP), Fukuoka, Japan, 26–29 May 2015. [Google Scholar]
- Megahed, M.; Saber, D.; Agwa, M.A. Modeling of Wear Behavior of Al-Si/Al2O3 Metal Matrix Composites. Phys. Met. Metallogr. 2019, 120, 981–988. [Google Scholar] [CrossRef]
- Bhatt, J.; Balachander, N.; Shekher, S.; Karthikeyan, R.; Peshwe, D.R.; Murty, B.S. Synthesis of nanostructured Al-Mg-SiO2 metal matrix composites using high-energy ball milling and spark plasma sintering. J. Alloys Compd. 2012, 536, S35–S40. [Google Scholar] [CrossRef]
- Park, B.G.; Crosky, A.G.; Hellier, A.K. Material characterization and mechanical properties of Al2O3-Al metal matrix composites. J. Mater. Sci. 2001, 36, 2417–2426. [Google Scholar] [CrossRef]
- Agrawal, P.; Sun, C.T. Fracture in metal–ceramic composites. Compos. Sci. Technol. 2004, 64, 1167–1178. [Google Scholar] [CrossRef]
- Nakao, W.; Abe, S. Enhancement of the self-healing ability in oxidation induced self-healing ceramic by modifying the healing agent. Smart Mater. Struct. 2012, 21, 025002. [Google Scholar] [CrossRef]
- Nakao, W.; Takahashi, K.; Ando, K. Threshold stress during crack healing treatment of structural ceramics having crack healing ability. Mater. Lett. 2007, 61, 2711–2713. [Google Scholar] [CrossRef]
- Osada, T.; Hara, T.; Mitome, M.; Ozaki, S.; Abe, T.; Kamoda, K.; Ohmura, T. Self-healing by design: Universal kinetic model of strength recovery in self-healing ceramics. Sci. Technol. Adv. Mater. 2020, 21, 593–608. [Google Scholar] [CrossRef]
- Woo, D.J.; Heer, F.C.; Brewer, L.N.; Hooper, J.P.; Osswald, S. Synthesis of nanodiamond-reinforced aluminum metal matrix composites using cold-spray deposition. Carbon 2015, 86, 15–25. [Google Scholar] [CrossRef]
- Wu, Y.; Kim, G.Y. Carbon nanotube reinforced aluminum composite fabricated by semi-solid powder processing. J. Mater. Process. Technol. 2011, 211, 1341–1347. [Google Scholar] [CrossRef]
- Wu, Y.; Kim, G.Y.; Anderson, I.E.; Lograsso, T.A. Fabrication of Al6061 composite with high SiC particle loading by semi-solid powder processing. Acta Mater. 2010, 58, 4398–4405. [Google Scholar] [CrossRef]
- Wu, Y.; Kim, G.Y. Compaction behavior of Al6061 and SiC binary powder mixture in the mushy state. J. Mater. Process. Technol. 2015, 216, 484–491. [Google Scholar] [CrossRef]
- Parsons, E.M.; Shaik, S.Z. Additive manufacturing of aluminum metal matrix composites: Mechanical alloying of composite powders and single track consolidation with laser powder bed fusion. Addit. Manuf. 2022, 50, 102450. [Google Scholar] [CrossRef]
- Behera, M.P.; Dougherty, T.; Singamneni, S. Conventional and Additive Manufacturing with Metal Matrix Composites: A Perspective. Procedia Manuf. 2019, 30, 159–166. [Google Scholar] [CrossRef]
- Xi, X.; Chen, B.; Tan, C.; Song, X.; Feng, J. Microstructure and mechanical properties of SiC reinforced AlSi10Mg composites fabricated by laser metal deposition. J. Manuf. Process. 2020, 58, 763–774. [Google Scholar] [CrossRef]
- Wang, M.; Song, B.; Wei, Q.; Shi, Y. Improved mechanical properties of AlSi7Mg/nano-SiCp composites fabricated by selective laser melting. J. Alloys Compd. 2019, 810, 151926. [Google Scholar] [CrossRef]
- Bai, S.; Lee, H.J.; Liu, J. 3D Printing with Mixed Powders of Boron Carbide and Al Alloy. Appl. Sci. 2020, 10, 3055. [Google Scholar] [CrossRef]
- Stone, M.B.; Kolesnikov, A.I.; Fanelli, V.R.; May, A.; Bai, S.; Liu, J. Characterization of aluminum and boron carbide based additive manufactured material for thermal neutron shielding. Mater. Des. 2023, 237, 112463. [Google Scholar] [CrossRef]
- Zeng, X.; Jing, Q.; Sun, J.; Zhang, J. Effect of Fractal Ceramic Structure on Mechanical Properties of Alumina Ceramic–Aluminum Composites. Materials 2023, 16, 2296. [Google Scholar] [CrossRef]
- Risse, J.H.; Trempa, M.; Huber, F.; Höppel, H.W.; Bartels, D.; Schmidt, M.; Reimann, C.; Friedrich, J. Microstructure and Mechanical Properties of Hypereutectic Al-High Si Alloys up to 70 wt.% Si-Content Produced from Pre-Alloyed and Blended Powder via Laser Powder Bed Fusion. Materials 2023, 16, 657. [Google Scholar] [CrossRef] [PubMed]
- Liu, J.; Cheng, D.; Oo, K.; McCrimmon, T.-L.; Bai, S. Design and Additive Manufacturing of TPMS Heat Exchanger. Appl. Sci. 2024, 14, 3970. [Google Scholar] [CrossRef]


| Powder | AlSi10Mg | SiC/Al: 2/98 | SiC/Al: 5/95 |
|---|---|---|---|
| Laser power (W) | 175 | 175 | 186 |
| Scan speed (mm/s) | 150 | 200 | 150 |
| Hatch spacing (mm) | 0.13 | 0.15 | 0.15 |
| Material | Printing Direction (°) | Sample ID | Yield Strength (MPa) | Ultimate Strength (MPa) | Young’s Modulus (GPa) | Elongation (%) | Relative Density (%) |
|---|---|---|---|---|---|---|---|
| AlSi10Mg (As-built) | 0 | 10141 | 183 | 388 | 30 | 9 | 100.00 |
| 45 | 10142 | 193 | 392 | 77 | 9 | 100.00 | |
| 90 | 10143 | 174 | 382 | 21 | 8 | 100.00 | |
| AlSi10Mg (HIP-treated) | 0 | 10151 | 80 | 170 | 48 | 23 | 100.00 |
| 45 | 10152 | 105 | 164 | 98 | 24 | 100.00 | |
| 90 | 10153 | 93 | 167 | 66 | 25 | 100.00 | |
| SiC/Al: 2/98 (As-built) | 0 | 10121 | 221 | 403 | 57 | 5 | 100.00 |
| 45 | 10122 | 243 | 397 | 119 | 4 | 100.00 | |
| 90 | 10123 | 216 | 382 | 77 | 3 | 100.00 | |
| SiC/Al: 2/98 (HIP-treated) | 0 | 10131 | 142 | 183 | 114 | 22 | 99.55 |
| 45 | 10132 | 70 | 184 | 102 | 19 | 99.92 | |
| 90 | 10133 | 141 | 181 | 108 | 19 | 100.00 | |
| SiC/Al: 5/95 (As-built) | 0 | 10071 | 199 | 382 | 32 | 3 | 99.21 |
| 45 | 10072 | 228 | 367 | 89 | 3 | 99.63 | |
| 90 | 10073 | 189 | 275 | 50 | 1 | 99.44 | |
| SiC/Al: 5/95 (HIP-treated) | 0 | 10081 | 176 | 196 | 97 | 11 | 99.89 |
| 45 | 10082 | 161 | 196 | 70 | 10 | 100.00 | |
| 90 | 10083 | 114 | 192 | 123 | 10 | 99.03 |
| Material | Weight Percent (wt%) | |||||
|---|---|---|---|---|---|---|
| AlSi10Mg (As-Built) | AlSi10Mg (HIP-Treated) | SiC/Al: 2/98 (As-Built) | SiC/Al: 2/98 (HIP-Treated) | SiC/Al: 5/95 (As-Built) | SiC/Al: 5/95 (HIP-Treated) | |
| Al | 62.1 | 63.9 | 91.5 | 85.2 | 81.9 | 81.3 |
| Si | 37.9 | 36.1 | 8.1 | 13.4 | 9.1 | 14.1 |
| SiC | - | - | 0.4 | 1.4 | 3.7 | 4.6 |
| C | - | - | - | - | 3.6 | - |
| Al4C3 | - | - | - | - | 1.7 | - |
| Powder | Thickness of Layer (mm) | The Number of Slicing Layers | Powder Thickness in Powder Bed (mm) |
|---|---|---|---|
| SiC/Al: 10/90 | 0.25 | 5 | 1.1 |
| SiC/Al: 5/95 | 0.15 | 3 | 0.66 |
| SiC/Al: 2/98 | 0.15 | 3 | 0.66 |
| AlSi10Mg | 3 | 60 | 13.2 |
Disclaimer/Publisher’s Note: The statements, opinions and data contained in all publications are solely those of the individual author(s) and contributor(s) and not of MDPI and/or the editor(s). MDPI and/or the editor(s) disclaim responsibility for any injury to people or property resulting from any ideas, methods, instructions or products referred to in the content. |
© 2024 by the authors. Licensee MDPI, Basel, Switzerland. This article is an open access article distributed under the terms and conditions of the Creative Commons Attribution (CC BY) license (https://creativecommons.org/licenses/by/4.0/).
Share and Cite
Bai, S.; Liu, J. Empirical Investigation of Properties for Additive Manufactured Aluminum Metal Matrix Composites. Appl. Mech. 2024, 5, 450-474. https://doi.org/10.3390/applmech5030026
Bai S, Liu J. Empirical Investigation of Properties for Additive Manufactured Aluminum Metal Matrix Composites. Applied Mechanics. 2024; 5(3):450-474. https://doi.org/10.3390/applmech5030026
Chicago/Turabian StyleBai, Shuang, and Jian Liu. 2024. "Empirical Investigation of Properties for Additive Manufactured Aluminum Metal Matrix Composites" Applied Mechanics 5, no. 3: 450-474. https://doi.org/10.3390/applmech5030026