Article

Body Surface Potential Mapping: Contemporary Applications and Future Perspectives

1
Department of Biomedical Engineering, University of Utah, Salt Lake City, UT 84112, USA
2
Scientific Computing and Imaging Institute, University of Utah, Salt Lake City, UT 84112, USA
3
Nora Eccles Harrison Cardiovascular Research and Training Institute, University of Utah, Salt Lake City, UT 84112, USA
4
School of Medicine, University of Utah, Salt Lake City, UT 84112, USA
*
Author to whom correspondence should be addressed.
Hearts 2021, 2(4), 514-542; https://doi.org/10.3390/hearts2040040
Submission received: 2 September 2021 / Revised: 29 September 2021 / Accepted: 5 October 2021 / Published: 5 November 2021
(This article belongs to the Special Issue The Application of Computer Techniques to ECG Interpretation)

Abstract

:
Body surface potential mapping (BSPM) is a noninvasive modality to assess cardiac bioelectric activity with a rich history of practical applications for both research and clinical investigation. BSPM provides comprehensive acquisition of bioelectric signals across the entire thorax, allowing for more complex and extensive analysis than the standard electrocardiogram (ECG). Despite its advantages, BSPM is not a common clinical tool. BSPM does, however, serve as a valuable research tool and as an input for other modes of analysis such as electrocardiographic imaging and, more recently, machine learning and artificial intelligence. In this report, we examine contemporary uses of BSPM, and provide an assessment of its future prospects in both clinical and research environments. We assess the state of the art of BSPM implementations and explore modern applications of advanced modeling and statistical analysis of BSPM data. We predict that BSPM will continue to be a valuable research tool, and will find clinical utility at the intersection of computational modeling approaches and artificial intelligence.

1. Background

Body surface potential mapping (BSPM) has a long and rich history as a noninvasive technique used to sample the heart’s electrical activity by sampling over the entire surface of the thorax. There are numerous reviews that cover the history and utility of BSPM [1,2,3,4,5,6,7]. BSPM differentiates from other forms of electrocardiograms (ECGs) by its comprehensive acquisition of bioelectric potentials with the goal of capturing all that is available from the body surface, at the cost of substantial redundancy in information. BSPM was first reported widely by Taccardi et al. as a tool to demonstrate the inadequacies of single-dipole source models to describe cardiac electric sources [8] and many other investigators have demonstrated its superior ability to reveal a wide range of pathologies [6]. Despite its advantages, BSPM is rarely available as part of routine clinical management. However, it remains a useful tool for both research studies and as the input for an imaging modality that seeks to reconstruct cardiac electrical activity noninvasively. In this report, we provide a contemporary view of BSPM and its value in exploring mechanisms of electrocardiography as well as its clinical potential in the setting of electrocardiographic imaging and emerging applications of machine learning.

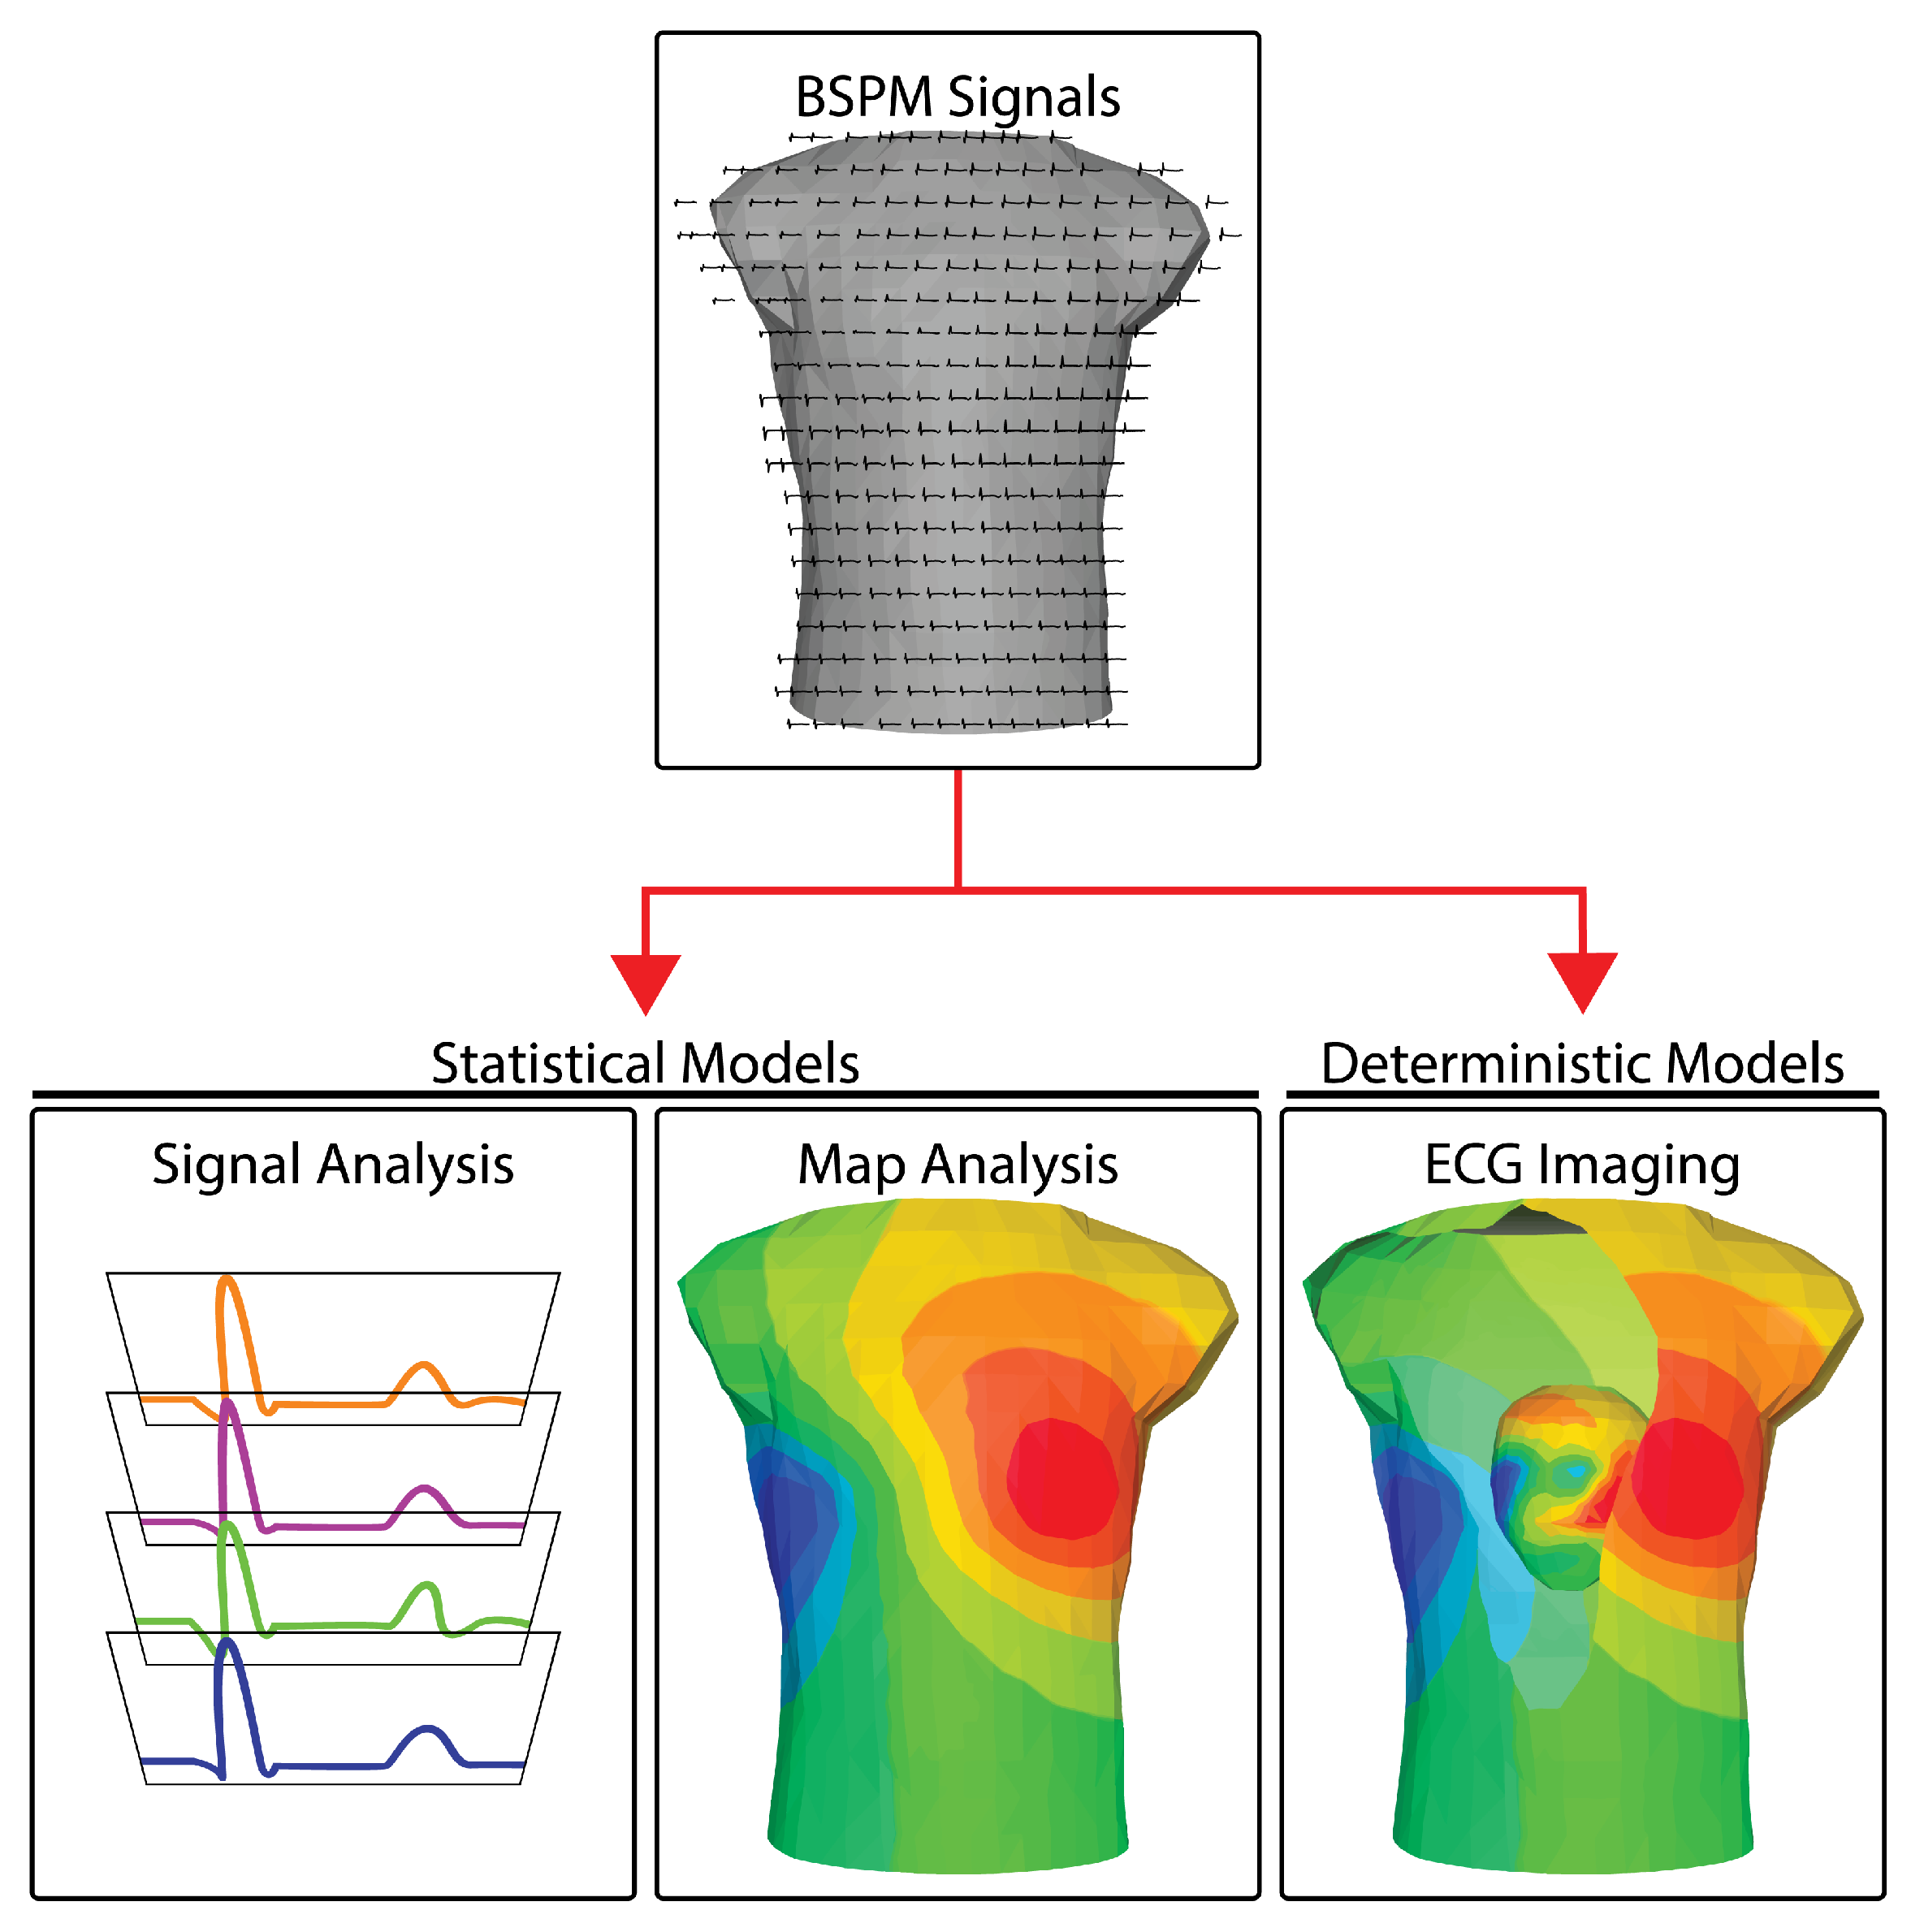
1.1. BSPM Analysis Approaches

Once the raw electrocardiograms are acquired (see Section 2), there are three main pathways of processing and interpreting BSPM measurements: (1) signal-based analyses, (2) mapping approaches, and (3) reconstructions of the cardiac sources. Figure 1 illustrates the three approaches. Signal-based analysis encompasses the same set of temporal analysis techniques used for standard ECG signals, applied to many more channels under the assumption that richer sampling will generate richer information. Even though there are multiple signals, each is typically analyzed separately—essentially a one-dimensional approach. The results of the analysis across leads are, of course, also combined to yield a diagnosis or interpretation of events. Mapping approaches are two-dimensional because they leverage both the temporal (signal) and explicitly the spatially dense sampling of BSPM to create maps of bioelectricity. The resulting mapping analysis approaches resemble other two-dimensional imaging modalities, e.g., X-rays or, even more accurately, fluoroscopic images that contain both space and time. Another similarity to medical imaging lies in the distortion intrinsic to these modalities. Medical images are smeared by tissues of differing densities and are captured as shadows of the objects of interest. BSPM signals and the maps constructed from them are also smeared and attenuated compared to potentials measured invasively from the heart, in this case because of the variable electrical resistance of the torso. The third approach in BSPM encompasses additional information in order to remove these distortions and reconstruct the underlying cardiac sources. A medical imaging parallel is computed tomography (CT), which encompasses multiple views and explicit knowledge of the projection direction of each view to reconstruct three-dimensional anatomy. Electrocardiographic reconstruction is known as ECG imaging (ECGI) and like CT, it removes the attenuating and distorting effects of interfering tissues by applying laws of physics, implemented with numerical methods in a computer, to estimate the desired sources or objects of interest.

1.1.1. Signal-Based Approaches

These methods generally focus on features embedded in the time signals, either single instants during the heartbeat, e.g., ST-segment deviations or peak values of the QRS or T wave, or signal shapes, e.g., P, QRS, or T-wave shapes, durations, and symmetry. Most such features are represented in any type of ECG and their use in BSPM assumes that enhanced spatial sampling will yield improved diagnostics, a hypothesis supported by many clinical applications [4,6,9,10,11,12,13]. Signal-based analysis can also be based on transformations of the time signals into the frequency domain, again similar to frequency domain approaches first reported in standard ECGs. The key feature of all these approaches is that there is no explicit attention to the spatial component of placement or organization of the electrodes, but rather to the signals and the parameters included in the signals. From the image analysis perspective, such approaches resemble using one or more single beams of ultrasound to estimate cardiac motion.

1.1.2. Mapping Approaches

Incorporating explicitly the spatial organization of BSPM measurement into the analysis approaches yields more value from BSPM at the same time as it presents challenges for clinical interpretation. Clinicians are well versed in signal-based approaches from their training and experience with standard ECG. However, there is very little training available to learn how to read the maps that BSPM yields. Maps can take the form of static images in which the body surface voltage distribution at a particular time instant is captured in the form of isovalues, often mapped to color for clarity (see the center panel of Figure 1). The isovalues can be raw electric potentials or parameters derived from the potentials, e.g., specific amplitudes or features from each individual ECG, integral values taken over durations such as the QRS complex, ST segment, or the T wave [6,14]. With the advent of computing and scientific visualization tools [15,16], interactive displays are now common and allow for time-evolving maps under interactive control. When geometric models of the torso surface are available, it is possible to localize the recording electrodes on the surface, even achieve a subject-specific rendering, and display BSPM data over the entire thorax. From this spatial perspective arise new metrics that have been used to identify features of cardiac bioelectricity and disease, both in normal subjects at rest [17,18] and during exercise [19] as well as pathophysiological states such as acute ischemia [7,10,20,21,22,23], infarction [24,25,26,27], coronary artery disease [28,29,30,31,32,33,34], sudden infant death [35], pre-excitation of the ventricles [36], vulnerability to ventricular arrhythmias [37,38,39,40], ventricular repolarization [41,42], or the effects of cardiac resynchronization therapy [43].

1.1.3. Reconstruction Approaches

As with all image-reconstruction processes, ECG imaging (ECGI) requires additional information to estimate the sources from remote measurements. Medical image reconstructions, e.g., CT, require multiple views from known directions as well as information about the X-ray opacity of tissues to estimate the anatomy of the hidden objects. ECGI takes raw BSPM signals and augments them with knowledge of the torso anatomy, the locations of the BSPM electrodes, and the electrical tissue conductivities within the thorax to estimate the bioelectric sources in the heart. All reconstruction approaches are based on physical laws; for ECGI, these laws come from electrostatics and lead to solutions to Laplace’s and Poisson’s equations [44,45,46]. While these equations are straightforward, solving them in ways that reveal bioelectric sources leads to ill-posed problems, which further results in ill-conditioned numerical problems [47,48,49]. Thus, every application of ECGI requires a series of related choices, including the bioelectric source model for the heart, the form of the thoracic geometric model and its passive conductivity values, the numerical techniques used to implement the underlying equations describing the electrostatics, and the approaches to deal with the ill-posed nature of the problem. We outline some of these choices in subsequent sections of this paper and refer to excellent reviews for details [45,47,48,50].
Despite the many required choices and challenges, ECGI has been applied to a wide range of clinical situations and is the only BSPM approach implemented commercially. Following a 20 year series of groundbreaking validation studies in animals [51,52,53,54,55,56,57,58] and then in humans [59,60], ECGI has been applied to explore ischemia and myocardial infarction [61], dispersion of repolarization [49], localization and characterization of ventricular [62,63,64,65] and atrial arrhythmias [66,67,68], and the effects of cardiac resynchronization therapy [69]. In addition to diagnostic and mechanistic insights, ECGI can also provide essential guidance for ablation therapies [70,71,72,73] and novel, noninvasive treatments of severe arrhythmias by means of radiation therapy [74,75].

1.2. Deterministic versus Statistical Models

A second perspective on the analysis of BSPM is based on the underlying assumptions about cardiac sources (and their reflection on the body surface) and the associated mathematical models. We can re-contextualize the modes of analysis explored above based on what type of model they rely on. The first model is statistical, based on the notion that robust relationships exist between features in the signals and associated aspects of cardiac function or dysfunction. These relationships have little physical basis or physiological origins but instead are gleaned from linking signal features—in time and space—to behaviors of the heart obtained by other means. Once such relationships are identified and verified, they can serve as diagnostic indicators or part of a clinical differential. These statistical models can be based on linear regression or other well-established correlation methods, or they may also derive from the rapidly emerging fields of machine learning and neural networks, in which the statistical model comes from the data. We will focus below on these machine learning approaches as they clearly have enormous potential for new insights that make maximal use of the rich data the BSPM provides.
The second family of models in BSPM analysis is deterministic and is based on physical laws and physiology. Each deterministic approach starts with an explicit model of the cardiac sources and then incorporates the effects of the volume conductor between the heart and body surface. The goal then becomes to manipulate this model in order to reconstruct the cardiac source(s) from the recorded BSPM signals. Deterministic models enable the reconstruction approaches described above and are most common in the setting of ECGI.
Because of their complementary nature, these two families of models are not exclusive, but can rather both be incorporated into a complete analysis technique. Both the signal-based and the mapping analyses rely heavily on the statistical model, while reconstruction-based analyses typically have a greater deterministic component associated to a small statistical one. However, crossover between models exists throughout, e.g., deterministic models assume quasi-static conditions [76], which dictates assumptions in the statistical models that use features of the ECG wave to diagnose disease states [10,11]. Similarly, statistical approaches guide many of the parameter choices required for ECGI, an approach based on deterministic assumptions [77,78,79].

2. Technical Requirements
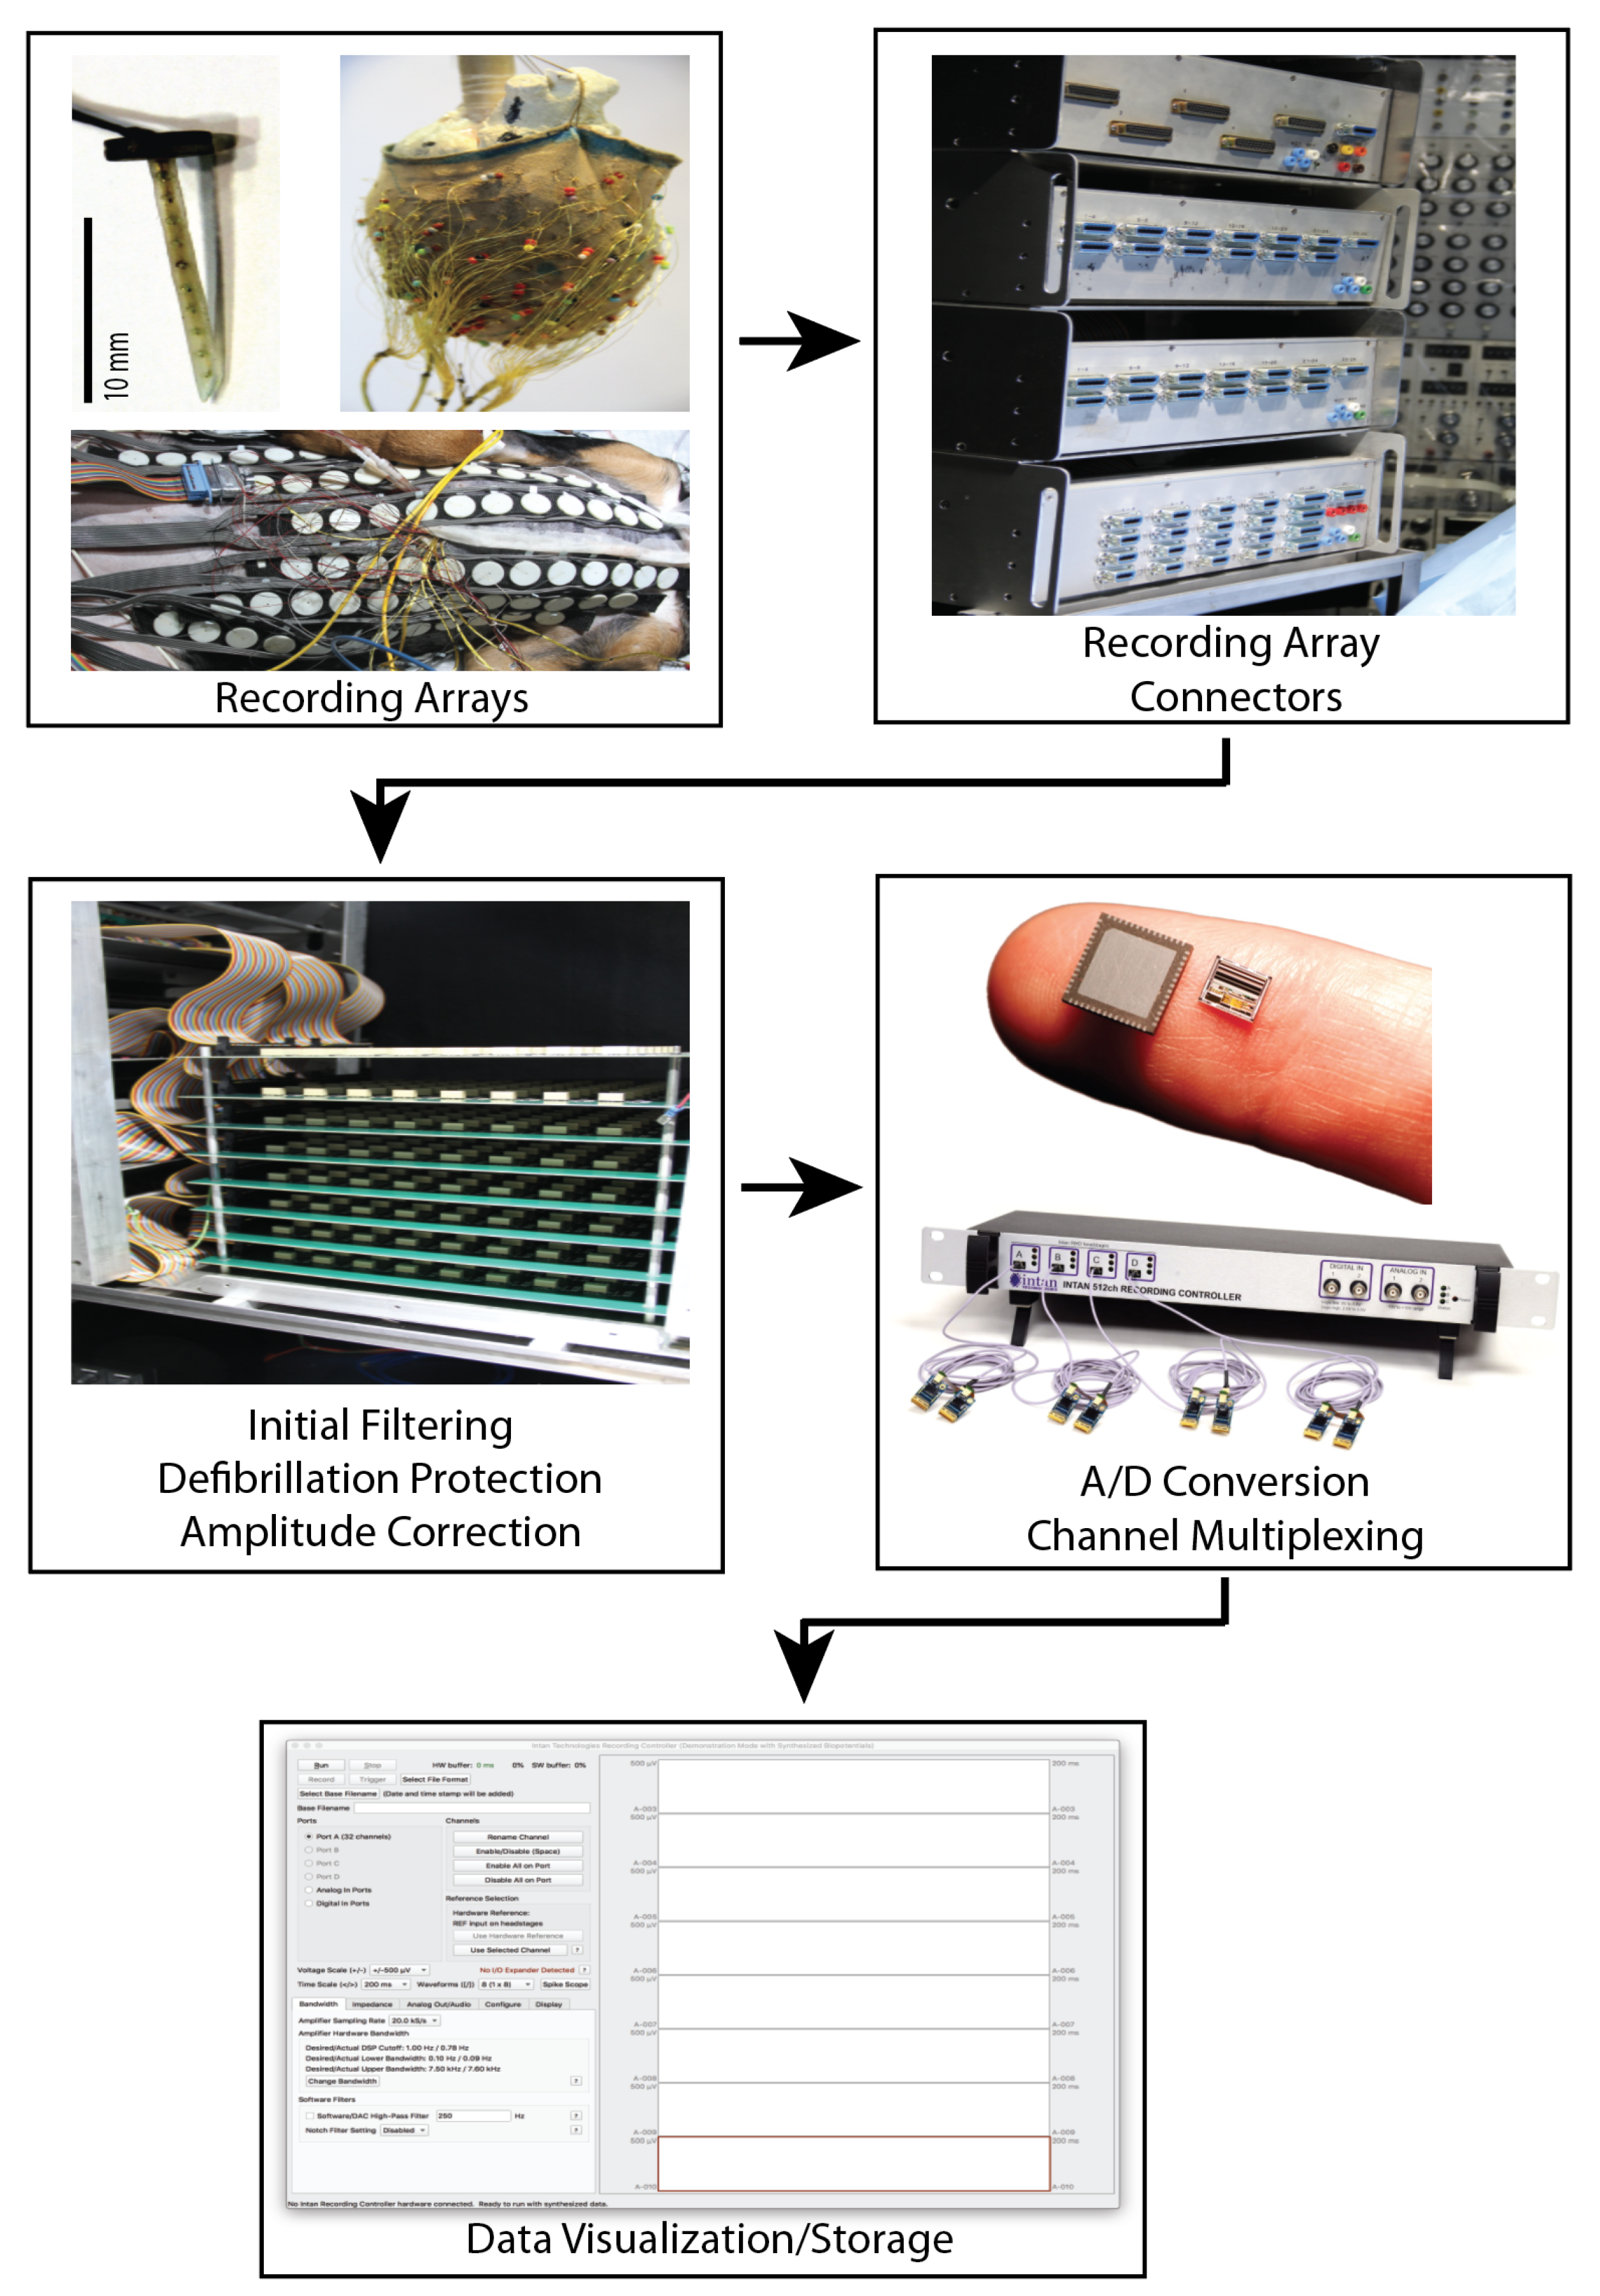
The recording, processing, storing, and visualizing of up to hundreds of individual body surface electrograms is a daunting task, with each step between body and computer representing years of progressive innovations and improvements in technology and methodology. In order to understand the contemporary applications and novel breakthroughs in BSPM, it is necessary to appreciate the workflow and technical requirements for acquiring, processing, and visualizing BSP maps. We first assess the added requirements BSPM introduces over standard clinical 12 lead ECG techniques. We then cover the technical requirements for leveraging the spatial information provided by BSPM.
BSPM requires increased sampling over standard 12 lead clinical ECG and many of technological advances have been directed to this goal. Researchers recorded some of the earliest body surface maps using custom silver or steel 5 mm diameter electrodes [8]. Researchers placed these electrodes three to five at a time at pre-determined locations across the entire torso, front and back, and displayed the electrogram traces on cathode ray tube oscilloscope screens. The researchers then took photographs of each set of ECG tracings in sequence and time aligned the resulting 200+ signals using a standard reference signal recorded concurrently. Visualization and evaluation of the resulting signals took place by projecting the films, selecting discrete timepoints across all of the signals, and hand drawing isopotential curves across a flattened map of the torso surface. To capture the time course of the BSP maps required overlaying the isopotential contours on photos of the subject’s torso for each time instant and concatenating the resulting frames to form a movie. This process was clearly laborious, with the initial recordings requiring an average of three hours [8], driving a crucial assumption of stability of signal morphology so that subsequent time alignment was possible. These initial BSP maps, with their sparse temporal sampling and laborious acquisition requirements, laid the foundation for decades of technical improvement and a growing understanding of the rich volume of information available. Modern BSPM systems have benefited from decades of advances in recording, storage, processing, and visualization techniques, but still follow roughly the same steps as they did in the 1960s.

2.1. Electrodes

Recording of BSPM differs from recordings of clinical 12 lead ECGs in large part due to the number and placement of electrodes. BSPM recordings usually utilize a leadset consisting of 64 to 300 electrodes spread across the torso surface. These hundreds of leads represent a marked increase from standard clinical ECG systems that commonly use ten physical electrodes (nine recording electrodes and one ground electrode). Modern electrodes are made of either silver, silver-silver chloride, or in some cases graphite and often utilize conductive gel to increase the skin-electrode conductivity, improving signal to noise ratio. For BSPM, these same electrodes can be stitched into strips or even entire vests to aid in rapid and reproducible electrode placement. There is a split in preference between single-use electrodes (higher per-use cost, but ease of manufacture and use) versus reusable electrodes (lower overall cost but more complex design and more constrained placement due to the arrangement of the electrodes and other medical equipment). A common problem is finding a reliable source of electrodes for use in both research and clinical settings. The standard clinical ECG systems utilize single-use electrodes that are often not suitable for BSPM applications due to the high costs and complexity of placement of all 100–300 leads individually. There is a unsolved need to produce high-quality torso surface electrodes for use in BSPM applications such that many institutions turn to internal production. Such custom electrode manufacturing across multiple institutions leads to heterogeneous—and often incompatible—electrode specifications, configurations, and interfaces.

2.2. Leadsets

The selection of lead numbers and locations varies across institutions and scenarios, and a common problem when working with BSPM is the conversion among different lead sets. These differences in number and placement are motivated by various concerns such as diverse philosophies of optimal lead placement, limited acquisition capacity, electrode packaging (individual, strips, or vests), and the need to integrate with other clinical or research equipment (Figure 2). Fortunately, there exist schemes to convert between lead sets and this enables comparisons across institutions [80,81]. Modern lead set placements depend heavily on the use case with a general rule that electrodes should be placed evenly across the thorax, with modifications to increase density in the precordial area [82]. Several studies have sought to identify reduced leadsets based on specific clinical targets [83,84] or reconstruction of full BSPM using linear predictions trained from a database of full-resolution recordings [85,86,87]. Leadsets such as the Medtronic “ECG Belt” or even the standard 12-lead ECG can drive estimation algorithms that either generate the full BSP maps numerically or may provide enough information for BSPM analysis approaches that are focused on specific diagnostic questions. Researchers developed these techniques to save time and storage space; however, computational resources and storage improvements have made the latter a less relevant concern. Overall, the number and placement of leads are primarily driven by the design of the electrodes themselves, and the use case for the BSP maps.

2.3. Analog Signal Processing

With the electrodes in place on the torso, the main concern becomes maintaining the quality of the recorded signals. Torso surface electrogram voltages are on the order of a few (1–3) millivolts therefor electrical noise is a constant challenge, due mainly to the long connecting wires and the noise generated by other nearby electrical equipment. Analog processing of the recorded signals usually consists of buffering, amplification by a factor of 100–1000, filtering to limit the bandwidth to the physiologically relevant range, e.g., 0.2–300 Hz, and optionally to remove power line noise [93,94]. This analog processing ideally occurs as close to the electrode-tissue interface as possible, with some systems using amplifier circuits built into electrode strips such as the “Active Electrodes” from BioSemi (https://www.biosemi.com/strip_electrode.htm (accessed date 29 October 2021)) [95]. Clinical ECG systems often use a bandpass filter with an upper cutoff as low as 200 Hz. However, BSPM systems have a higher cutoff frequency in the 200 to 1000 Hz region to capture more complex high-frequency components of the ECG signals [93,94]. The cost of higher cutoff frequencies is susceptibility to noise, often requiring special care during acquisition to limit noise at the source, e.g., proper grounding of recording equipment, electrical isolation of the subject, shielding of sensitive devices, and minimizing the use of other electrical equipment during BSP signal acquisition. A further requirement of this stage is subject safety, often requiring optical isolation to limit the maximum ground current to a few μ amps even in the face of defibrillation voltages of 600 V. Similarly, protective circuitry is also necessary to protect the recording equipment, including over-voltage protection, electrical isolation via optical coupling, and in some cases, manual disconnects between recording leads and the recording system.

2.4. Signal Acquisition and Digitization

Modern BSPM recording equipment captures the output of the analog stage and converts the signals to digital form to enable subsequent, processing, display and quantitative analysis. Such acquisition occurs with highly multiplexed systems that allow for simultaneous capture of up to 1000 channels at suitable temporal sampling, typically 1000–2000 samples/s. of recordings to be made at a high-temporal and -voltage resolution while also allowing for further digital processing of the signals to improve their quality and aid in analysis. Once digitized, the signals can be processed on a computer using techniques such as simple digital noise filters and complex algorithms to remove baseline drift and other noise sources as well as to segment recorded signals into single beats or other time periods of interest [96]. Ongoing studies comparing the resulting techniques and their impact on subsequent evaluation of BSPM findings suggest that even subtle variations in approaches and parameters can impact the results of BSPM analysis such as ECGI [79,97,98].

2.5. Map Construction

Once the digitized signals have been recorded and processed, the next step is to visualize the signals. Traditionally, recording systems visualize ECG leads as time signals, similar to a standard ECG, often by selecting groups of leads and displaying them in ways that provide either a comprehensive overview of the entire body surface or focused views covering limited areas. However, displaying more than a handful of time series signals becomes overly complex (see the top image in Figure 1). A more common approach is to create spatial maps of body-surface potential that incorporate spatial information from the lead placement into the display of the electrical information. The creation of such a body surface potential map requires a geometric representation of the torso, such that the recorded signals can be arranged relative to each other in space. Such a torso geometry can be generic or patient specific and can either be two-dimensional, based on some form of flattening or unwrapping of the torso surface, or truly three-dimensional such as those in Figure 2. Subject-specific torso geometries are derived from measurements of the electrode locations, typically using a 3D camera, CT or MRI imaging, or a mechanical digitizer. In each case, the electrode positions define a surface mesh, usually via triangulation of the points. Visualization software maps voltage values at the mesh nodes to color and then interpolates the colors over the triangular elements, resulting in a potential map that displays the potential (or other derived quantities) across space. By stepping through time instants, it is possible to create controlled, often interactive, animations of the temporal progression of the spatial patterns of cardiac bioelectricity. Individual timepoints of interest can then be highlighted as in Figure 3. A wide array of visualization options, such as scaling, cropping, or adjusting the color-mapping function provide a rich toolset to interpret the measured values [15,16,99,100,101].

2.6. Current State of Mapping Systems

Modern BSPM recording systems can be broken generally into the electrode configuration and the back-end recording hardware and software. This distinction highlights the ability of multiple electrode configurations to be used with a single acquisition system. However, the interface between any given electrode configuration and acquisition system depends heavily on the design of both components, and some electrode systems are custom built for their acquisition hardware. Contemporary electrode configurations typically consist of 100 to 300 electrodes spread across the torso surface. The CardioInsight commercial system, for example, utilizes 242 electrodes stitched into a wearable vest, allowing for rapid and reproducible electrode placement [102]. However, a challenge with such vest systems is ensuring inadequate fitting to different torso shapes and maintaining adequate contact between the electrodes and skin. Other systems such as that from EP Solutions utilize strips of electrodes placed around the thorax up to a maximum of 224 electrodes. The strips allow for more flexible placement at the expense of a more complicated procedural setup. Another innovation to improve signal quality is to include signal amplifiers for each electrode integrated into the strips, called ‘active electrodes’ by the authors [95]. Studies by other groups describe multiple strips consisting of between 4 and 12 electrodes each that connect to a variable interface system before analog processing [17,86,94,103,104]. An example recording system for experimental use is shown in Figure 4.
Signal acquisition hardware and software are based on either commercial products such as the Biosemi active two system (biosemi.com), or are custom-built systems with integrated analog processing, analog to digital conversion, digital processing, and acquisition [105,106,107]. While older systems were limited in their recording resolution (both in time and voltage level) and number of simultaneous recording electrodes, modern systems can often record up to a thousand or more inputs at a sampling frequency of over 1000 Hz and voltage resolution in the milli to micro volt range, which is more than sufficient for most BSPM applications. Zenger et al. described a hybrid system (Figure 4) based on custom-designed hardware to interface BSP electrode systems with a commercial recording system (intantech.com) initially designed for neural signals [94]. Such custom systems built for experimental use are designed to be flexible and can often record from electrode arrays on the heart surface or embedded within the cardiac tissue. Commercial systems such as Medtronic, CardioInsight, or EP Solutions use purpose-built hardware and software to process, record, save, and visualize the BSPM, and any post-processed outputs.
Processing pipelines pass the recorded BSP through a range of signal cleaning and visualization software. Rodenhauser et al. describes a software pipeline for filtering, baseline correcting, and segmenting the BSP signals [96]. Visualizing these time series signals as they are recorded is often a feature of the recording system software, allowing for live interrogation of individual or groups of leads. Reconstruction of the torso geometry is typically accomplished via computed tomography, magnetic resonance imaging, or mechanical digitizer. In some cases, a generic torso shape is assumed instead of a patient-specific geometry. In the experimental torso-tank system, the torso geometry is fixed and known ahead of time. The creation of the torso surface meshes is accomplished using segmentation and meshing software. Mapping the processed electrogram data onto the torso meshes to create BSPM is done either by proprietary software, custom algorithms, or open-source software such as map3d [16] and SCIRun [99]. Researchers or clinicians can construct the torso maps either during recording, or after all the recordings have been finished and processed. Since BSPM systems save the recorded signals, they can be reviewed later and post-processed using various tools and approaches to aid in interpretation.

3. Technical Extensions

Beyond their inherent information content, BSP maps can serve as inputs for further analysis. BSP maps can be challenging to interpret in their original form and post-processing and advanced analysis techniques are often necessary to leverage the abundance of information present to provide both clinical and research insights. A natural division among these modes of analysis is between deterministic models, based on physical systems of bioelectric sources and simulations, and data-driven statistical models, without rigid underlying assumptions of physical systems. We will explore here promising and insightful implementations of such analyses of BSP maps, beginning with their technical descriptions.

3.1. Deterministic Modeling: Electrocardiographic Imaging

The first step in a deterministic modeling approach is to devise a method to simulate the potentials on the body surface. In the context of cardiac bioelectricity and BSP mapping, this class of modeling and the associated problems are collectively known as the “forward problem” of electrocardiography. The forward problem relies on assuming an underlying model that expresses the activity of the cardiac bioelectric source (the source model) and a way to project that activity to the measurement location, the torso surface. Source models in cardiac bioelectric activity vary in complexity depending on the specific aspect of interest. For example, a single time-varying current dipole can approximate the bulk activation of the heart, the basis for the Einthoven lead system [108] and still a common source used for clinical interpretation [109]. At the other extreme are models that consider the cellular membrane potentials of each myocyte in the cardiac tissue [14,50]. Across this range of source models, there are specialized methods to project these cardiac source representations to the torso surface. This forward projection takes the geometries and electrical conductivities of the heart and torso along with the source model as inputs to predict the BSP signals. Different implementations cater to different source models, and can include additional details such as the geometries and conductivities of other organs in the torso. Each one of these forward methods implements a physics-based model of bioelectricity to accomplish the projection from cardiac source to BSP signal. The forward problem leads naturally to the more clinically relevant scenario where BSPM is an input to reconstruct the cardiac source itself, known as the “inverse problem” of electrocardiography or electrocardiographic imaging.
Electrocardiographic imaging (ECGI) is an approach that falls into a broad category of inverse problems which focus on reconstructing a source given distant measurements. Figure 5 shows an example ECGI implementation to estimate the cardiac source given BSP recordings via the inverse problem. Inverse problems are generically ill conditioned and ill posed, meaning there is rarely a single unique solution, and small perturbations in the input, such as noise, can have nonlinear effects on the output [48]. A technique known as regularization addresses these numerical instabilities by enforcing additional assumptions on the inverse reconstructions, thereby limiting the solution space to meaningful solutions [48,110]. The ECGI inverse problem takes the mathematical relationship established by the forward problem and applies numerical methods to achieve an estimate of the cardiac source that would give rise to the observed body surface potentials [48]. This reconstruction converts the BSPM into a form that has more direct clinical interpretations than the original BSPM, displaying clinically relevant aspects of the cardiac activity such as sites of early or abnormal activation, abnormal repolarization, re-entrant circuits, or regions of myocardial ischemia [50]. ECGI also enables researchers to noninvasively characterize the heart electrical activity under various experimental scenarios, providing a record of the response of the heart to stimuli without the need for invasive measurements. Such insights come at a cost, a set of additional constraints and considerations above what BSPM alone require.
The costs associated with ECGI are diverse and represent a set of compromises associated with each key aspect of the reconstruction process. The need for precise torso and cardiac geometries is often a complicated addition to a BSPM procedure. Imaging techniques such as CT or MRI usually provide this geometric relationship. However, these modalities bring additional procedural complexities and costs to the ECGI setup. Recent studies have investigated reconstructing the cardiac geometry location using only body surface recordings, which would allow for so-called “imageless ECGI” that does not rely on costly CT/MRI [89,112]. Such “imageless” techniques rely instead on iterative optimization frameworks that estimate cardiac position on a beat by beat basis. The selection of a source model and forward/inverse framework is an additional consideration that depends on the cardiac activity of interest. Extracellular potential source models can be susceptible to line-of-block artifacts in subsequent activation sequence estimations, whereas transmembrane potential source models can avoid this problem via smoothing of the reconstruction [113]. However, transmembrane potential source models require a more complex cardiac geometry and can be difficult to interpret, where as extracellular potential source models are readily interpretable. The regularization of the inverse problem remains one of the most challenging aspects of ECGI. A range of regularization techniques have been developed to enforce constraints on the inverse solution based on various assumptions about the cardiac source. Common regularization methods target features of the cardiac source such as its amplitude, spatial gradients, smoothness in space, and presence of edges. Assumptions about these features are formulated into constraints that for example enforce low amplitude (Tikhonov 0 order), enforce small spatial gradients (Tikhonov 1st order), enforce spatial smoothness (Tikhonov 2nd order), or preserve edges (Total Variation) which are all assumed characters of the cardiac source. Other regularization approaches leverage assumptions about the nature of the inverse problem to avoid unstable solutions such as truncated singular value decomposition which removes small singular value components of the forward matrix to avoid the exaggerated effects of noise in these singular vectors when the inverse solution is computed [110]. The amount of influence the regularization has on the inverse solution is determined by a weight associated with the regularization. This weight can be determined in a myriad of ways but always represents a trade off between an over-regularized solution (a solution biased by the assumptions of the regularization) and an under-regularized solution (a solution vulnerable to numerical instabilities of the inverse estimation). Techniques to develop novel regularization methods, implementations, weight selections, and even combination of regularization techniques are an area of active research. Commercial and open-source tools have been developed to address the need to integrate all of the many steps associated with ECGI and allow for extensive exploration of the underlying methods and parameters [50,114,115].

3.2. Uncertainty Quantification

Error and uncertainty are often inherent when identifying parameter values for cardiac simulations such as ECGI, and understanding how variation in the input parameters affects the model output is a field of study known as Uncertainty Quantification (UQ). Techniques for assessing model output uncertainty given variation in input parameters come with a range of complexity and computational cost. Modern UQ methods leverage sophisticated mathematical approaches such as polynomial chaos expansion (PCE), which leverages assumptions about the nature of the stochastic field or process to minimize the number of samples necessary for the computation of accurate statistics [116,117,118,119,120]. ECGI can benefit from such approaches as they allow for the robust exploration of parameter choices along every step of the ECGI pipeline. Previous studies have applied UQ to investigate the effects of organ and tissue conductivity, cardiac position, parameters of ion channel models, and cardiac fiber orientation on various aspects of cardiac electrophysiological models [121,122,123,124,125,126].
Most UQ studies focus on forward problems; however, there is a need to apply the same UQ techniques to the inverse problem more directly. By understanding how parameter variation affects inverse solutions, both clinicians can better understand the variability of ECGI solutions and researchers can explore which parameters are more or less important when designing new ECGI approaches. Application of UQ to the inverse problem is an area of active research, for example Tateet al. examined heart shape variability and its effect on ECGI inverse solutions [127].

3.3. Statistical Modeling: Machine Learning

In contrast to deterministic approaches such as ECGI, statistical approaches derive their output from features identified and learned in example data. Under these statistical models, the relationship between model input and output does not need to explicitly rely on an underlying physical model. BSPM analysis has benefited from statistical approaches, based either on linear regression approaches [83,128] or decomposition techniques [39,86,129,130,131,132]. Machine learning (ML) encompasses a related set of statistical approaches where the data provided to train the model dictates how the model converts the input into the output. These techniques tend to perform best on large datasets, which have become increasingly available in many domains. ML techniques are becoming a vital part of the research and clinical landscape of cardiac electrophysiology [133,134,135,136]. They have the advantage of providing concise and interpretable outputs using complex inputs such as BSPM, making them attractive in both clinical and research settings. Here, we will lay out some of the foundational principles of ML and how they may apply to the analysis of BSPMs.

3.3.1. Supervised Approaches

ML approaches can be used to simplify BSPM analysis by answering specific clinical and research questions such as absence or presence of a disease using BSPM as an input. The generation of such ML models occurs in a process called supervised learning, in which the parameters of the underlying ML model, often called ‘weights’, are generated via a data-driven mechanism termed ’training’, which optimizes values of these parameters to produce accurate label outputs on the training data. Training data consists of a set of inputs paired with desired outputs such as labels, quantities of interest, or transformations of the input. In the case of BSPM analysis, these target outputs could be any clinical or research value of interest, including presence of a disease, value of some physiological parameters, or location of a feature of cardiac activity or anatomy to name a few. After training, the resulting algorithm can then receive new BSPM recordings as inputs and output an estimate of the target variable, a process termed ‘inference’.
There is an enormous variety in the structure of supervised learning techniques, also called architectures, each with trade-offs regarding task performance, ability to detect relevant signal features, and computational cost. Many architectures were developed in the context of other problems, such as estimation on tabular data (where each column in the dataset represents some descriptive quantity or categorization about a phenomenon), computer vision, and natural language processing [137]. There is not yet a consensus on which architectures perform best in the context of BSPM; thus, it is crucial to consider how to use BSPMs as inputs to a variety of model architectures and to consider the trade-offs associated with these architectures.
Traditional machine learning models were designed for use with vector data, where each input is an n-dimensional vector of real numbers. These architectures include logistic regression, support vector machines, k-nearest neighbors, decision trees, and ensembled forests such as AdaBoost and XGBoost [133]. An intuitive way to apply these architectures to BSPM analysis would be to extract relevant features from the BSPMs (e.g., ST-segment potential, QRS amplitude, T wave integral) and use those features as inputs to the model, as shown in Figure 6. This deliberate feature extraction ensures that the algorithm uses only information that the designer of the architecture has already deemed relevant a priori. However, there is evidence that these architectures can perform well when the entire BSPM recordings are used rather than relying on extracted features [138]. Such an approach requires that the BSPM, which is typically represented as an n · m matrix of n electrodes by m time instances, is linearized into a single n · m · 1 vector (Figure 6). While this approach does not represent a traditional usage of these algorithms, it does allow traditional ML models to determine relevant signal features rather than relying exclusively on features already assumed to be relevant. Such traditional models usually have fewer parameters and thus require less computational resources at inference, increasing the feasibility of clinical deployment but perhaps limiting the scope of problems they can address. Additionally, these traditional model architectures neglect the availability of spatial information that BSPM provide in the form of relative electrode locations and spatial-potential maps.
One can also consider BSPM as images in the context of computer vision ML. Computer vision tasks focus on identifying features or labels given inputs that are images. Tensors represent these images with a shape c · w · h where c is the number of channels (usually three for RGB images), w and h are the image width and height, respectively. In the same way, a stack of BSPM leads could be structured as a c · m · n tensor where c is 1 (analogous to a single channel grayscale image), m is the number of leads, and n is the number of timepoints in each recording Figure 6. Convolutional neural networks (CNN) are a foundational family of architectures for computer vision that have promise for BSPM. These architectures help detect features with variable locations within an image, and utilize filters that span across all dimensions of the input images. Thus, CNN architectures can leverage the spatial information implied in the BSPM input via the ordering of the electrodes in tensor form. Such an approach, however, does not fully realize the available spatial information, as physical distances between electrodes are not explicitly embedded in the tensor ordering. Additionally, by ordering the BSP recordings into a BSPM tensor, there will inevitably be some electrodes that are physically distant but close to each other along the spatial dimension and other that are physically close but distant in the tensor. Despite this limitation, the incorporation of spatial information implied by tensor ordering can be facilitated with careful architecture design, particularly with respect to the shape and stride of the convolutional filters used. Application of CNNs to 12-lead ECG analysis is perhaps the most common supervised learning approach implemented successfully using these concepts [139], and for this reason, a CNN approach is likely to have success when applied to BSPM. Furthermore, the spatial information present in BSPM could be explicitly included in a CNN-based ML analysis via graph analysis. Graph analysis allows for the encoding of complex spatial relationships into a structured and regular sized input such as the tensors used as inputs for CNN. Dhamala et al. demonstrated such a graph-based approach to characterize spatially heterogeneous scar tissue in a 3D cardiac model via a CNN architecture [140]. Such a graph input could be constructed for the BSPM torso geometry in order to leverage all of the advantages provided by the spatial information encoded in BSPM recordings.
Other models, initially developed in natural language processing (NLP), might also be helpful for BSPM analysis. In NLP, the model input is often a series of embedded words in a space that stores relationships between words. A model then takes all the word as inputs and learns parameters that relate each word to the words before it. Popular architectures in this domain include recurrent neural networks (RNN), long short-term memory (LSTM), and transformers. BSPMs can be restructured for these models by splitting each BSPM recording into different subsets representing the word tokens of the signal. Each BSPM would take the shape of a w · m · s matrix, where w is the number chunks (words), m is the number of leads, and s is the number of timepoints per word (calculated as s = n / w where n is the number of timepoints per recording). It is worth noting that of the common architectures, transformers are generally the cheapest computationally and have become a favorite in many NLP applications [141,142]. Transformer networks have also been used with some success in 12-lead ECG analysis tasks, indicating that they may be suited for BSPM analysis as well [139]. NLP architectures carry many of the same benefits of image-based networks when the words are constructed as described above, by splitting the time domain. In this way, each input still carries the spatial relationship of the electrodes implied by their ordering in the inputs. A separate approach would be to break up the BSPM into words based on the electrode configuration across the torso, with similar positions grouped into words.
Finally, it is possible to combine these families of models. One example, the winner of the PhysioNet 2020 challenge using 12-lead ECGs as inputs, used CNN layers to embed ECG signal features which fed into a transformer architecture [143]. The final layer of this transformer then combined with the top-ranked extracted features as determined by a random forest model. There are many opportunities for creativity and innovation in architecture design and selection so that BSPM ML applications will likely grow. When selecting a model architecture or combination of architectures for a BSPM supervised learning task, it is likely easiest to start with simpler model architectures and increase complexity as needed.

3.3.2. Unsupervised ML Approaches

Machine learning can also simplify BSPM analysis by learning characteristics of a BSPM dataset without explicit labels. The goal of this form of ML is usually to reduce the dimensionality of BSPMs such that they are more easily interpretable in a clinical or research context. Because these algorithms explore relationships in the data without explicit labels related to a specific problem, this type of ML is described as unsupervised. The lower-dimensional BSPMs may be directly visualized or labeled as input to a supervised learning architecture predicting some target label. Some examples of unsupervised learning techniques have been used previously for BSPM and include principal component analysis (PCA) [129,131,132] spectral clustering, and k-means clustering [144,145,146]. In each case, the BSPM recordings can be restructured to fit the input requirements of the technique. While the lack of a requirement for explicit predefined labels lowers the requirement for use of unsupervised methods to only requiring the data to train on, the resulting lower dimensional outputs can be difficult to interpret. These outputs often require further processing such as in Good et al., where Laplacian eigenmaps was used detect myocardial ischemia [147]. Good et al. computed a secondary metric based on the lower dimensional representation of the electrogram data which they leveraged to detect myocardial ischemia. Additionally, unsupervised networks do not always have an explicit method for incorporating the spatial information that BSP maps provide. Unsupervised methods are often considered to be able to learn any necessary spatial relationships without direct enforcement.

4. Contemporary Applications of Body Surface Mapping

As outlined in Section 1, the interpretation of signals acquired at the body surface can be accomplished using various techniques with a wide range of complexity. These techniques include direct manual examination of the BSP signals and BSP maps, extraction of key features via signal processing, and applying models to convert the input BSP data to readily interpretable outputs such as reconstructions of the cardiac source or clinical variables such as presence or absence of a disease.

4.1. Direct Interpretation of BSP Signals

One goal of research applications of BSPM is on detecting and localizing ischemic cardiomyopathy through experimental models, cardiac stress testing, and acute MI events. Research from our group has focused on interpreting body surface potential changes during hyperacute episodes of ischemia [90,148,149]. Zenger et al. recorded electrical activity on the torso surface using a large-animal experimental model while simultaneously inducing partial occlusion of a coronary artery and applying cardiac stress to create controlled acute myocardial ischemia. We have used these experimental recordings to explain complex physiological differences between various types of cardiac stressors, e.g., pharmacological versus exercise cardiac stress [148]. Furthermore, we identified a complex epicardial shielding phenomenon of ischemic potentials visible within the heart that propagated only partially to the torso surface [149]. Other groups have focused on understanding and improving exercise stress test diagnosis of myocardial ischemia by leveraging BSPM. Kania et al. showed improved sensitivity and specificity of BSPM over 12-lead ECG, when used during an exercise stress test [150]. Specifically, they observed over 20% increase in sensitivity when using BSPM compared to standard 12-lead ECGs. Other groups have replicated these results [151,152]. The reason for the improved sensitivity and specificity is associated with an improved overall coverage of body surface potentials, allowing for capture and examination of ST-segment changes that may not appear initially within the region observed by 12-lead ECGs [152]. Others have validated these results across multiple patient groups, and with gold-standard SPECT imaging [152].
Another major focus for the research uses of BSPM has been the detection and localization of acute myocardial infarction (AMI). Despite many decades of research, detecting AMI from 12-lead ECGs has low sensitivity and specificity. Therefore, further development has targeted new avenues for analysis. Daly et al. showed that BSPM could significantly improve the detection of left main coronary artery stenosis and left circumflex stenosis [153,154]. They found that BSPM demonstrated 89% sensitivity at identifying left main coronary AMI compared to 49% using 12-lead ECG, which the authors attributed to increased coverage of the BSPM system. Other groups have replicated results across broader populations of patients treated at different tertiary care centers [23,155]. Wang et al. identified changes to the U-wave as seen on BSPMs, which correlated to specific locations of AMIs throughout the heart [156]. Finally, other groups have used BSPM to predict overall MI size and severity, and identified changes to the Q-wave on BSPM as moderately correlated with the overall AMI chronic scar formation [157].
Researchers have applied BSPM to examine both the diagnosis and mechanistic development of atrial fibrillation. Recent developments include examining BSPMs in AF patients to understand the role of the dominant frequency. The motivating hypothesis is that sites where AF electrical abnormalities anchor, or dominant frequency sites, could be a target for AF treatment with catheter ablation. Guillem et al. found that the highest dominant frequency sites on the torso showed a significant correlation with dominant frequencies found in the nearer atrium ( ρ = 0.96 for the right atrium and ρ = 0.92 for the left atrium) [158]. Other groups have targeted AF analysis using principal component analysis and wavelet transform on BSPM data to reduce the dimensionality of the signals and gather further insights into the mechanistic underpinnings of AF [159,160]. One study found maps of patients with atrial fibrillation had atrial activity that was dispersed around standard ECG leads and out of recording range, suggesting that noninvasive assessment of AF complexity by the standard 12-lead ECG is not adequate [160].
Ultra high frequency (UHF) has seen applications to ECG analysis that could also readily be transferred to BSP map analysis. UHF has been applied to assess a range of cardiac conditions such as dyssynchrony and myocardial ischemia [161,162,163]. Extensions of UHF analysis to BSPM could leverage the increased spatial sampling of BSP maps in combination with the increased temporal sampling incorporated into UHF.
BSPM analysis has also been applied in several other research settings that all target electrical changes during complex cardiac disease. These examinations include the development of ventricular fibrillation, ideal parameters and device design for cardiac resynchronization therapies, better understanding the nuances of Brugada syndrome, and investigations into heterogeneity of repolarization times [164,165,166,167,168,169,170].

4.2. BSPM Simplification and Interpretation Techniques

The contemporary application of BSPM to clinical needs is primarily focused on simplification. The overwhelming amount of spatial and temporal data available during body surface mapping makes meaningful clinical quantification difficult. Furthermore, in the rush of routine clinical care, a test result must be quickly and easily assessed with high sensitivity and specificity to be incorporated into a standard clinical workflow. Reviewing complex spatial and temporal data of BSPM is essentially impossible without years of training in addition to standard clinical experience. Therefore, advances in BSPM in the clinical setting have primarily targeted the analysis of BSPM data for interpretability.

4.2.1. Deterministic Approach: ECGI

Both the forward and inverse problems of electrocardiography have been used in BSP map analysis. Researchers have used simulation of BSP maps via the forward problem to investigate the presence of different ventricular ectopic activation on BSPM using simulation models to produce the cardiac source [171].
The emergence and development of ECGI as a deterministic tool for the interpretation of BSPM has driven several advances and innovations for BSPM recording and processing. ECGI researchers have developed a range of signal processing techniques to improve BSPM signal quality and address the ill-conditioned nature of the inverse problem [48,110]. These include techniques such as signal averaging across multiple heartbeats, baseline correction, and various noise filters and noise reduction algorithms. The ill-posed nature of the inverse problem has also driven the exploration of the optimal number, and placement of BSPM recording electrodes [83,85,86,172]. Studies by Dogrusoz et al. have investigated various interpolation techniques to reconstruct BSPM measurements lost due to either poor signal quality or obstruction of the leads by other equipment [98]. The notion of reconstructing an entire BSPM from a limited set of leads has been explored by Lux et al. to both reduce data size and enable BSPM to be more readily recorded [85]. ECGI also adds a requirement to measure the cardiac geometry in addition to the torso geometry. Thus, the emergence of ECGI has driven the development of BSPM procedures that include torso and cardiac imaging via CT or MRI. Recent studies by Bergquist et al. and others have investigated reconstructing the cardiac position using only BSPM, opening the avenue for “imageless ECGI” that does not require costly and complex MRI/CT imaging studies [173]. The output of an ECGI system represents the electrical activity of the heart as activation times or electrograms. These reconstructions can be projected onto the cardiac anatomy and allow physicians and researchers to interrogate activity occurring at the heart itself, rather than making inferences from body surface recordings.
ECGI has demonstrated clinical success in several scenarios, including premature ventricular contraction localization, cardiac resynchronization therapy, atrial fibrillation, and ventricular scar-related tachycardia. Contemporary results of these applications have shown success; however, there are still ample avenues for improvement [174,175,176]. PVC localization via ECGI has shown variable performance, with some approaches reporting 95% accuracy in correctly identifying the site of PVC origination within the AHA 17-segment anatomy [174]. Other studies have shown less promising results with localization accuracy [175,176]. These studies have explored the technical achievements and limitations of PVC localization by ECGI. However, the utility of ECGI through reduced procedure times and better patient outcomes has yet to be thoroughly validated. We hypothesize that as ECGI techniques continue to mature, this transition into meaningful clinical application and assessment of clinical importance will be an area of active research and development.
ECGI has also been used to explore and improve treatment methods of cardiac resynchronization therapy (CRT) [177,178,179]. Ghosh et al. utilized ECGI to characterize the activation and repolarization patterns of CRT patients [178]. Berger et al. utilized ECGI to explore endocardial and epicardial activation patterns in CRT patients. These authors suggest that ECGI can be used to guide CRT lead placement and pacing strategies [177]. Ploux et al. showed that analysis of ECGI reconstructions in CRT patients could better predict the therapeutic success of CRT than traditional ECG-based metrics [179]. In each of these studies, ECGI provided additional insight into the cardiac bioelectric behavior that allowed for better therapeutic planning or better mechanistic understanding than is possible with standard ECG.
Clinicians and researchers have used ECGI to visualize the electrical patterns of ventricular tachycardia (VT) that occur after significant regions of myocardial scar have formed through other disease processes such as myocardial infarction or ischemic cardiomyopathy [61,115,180,181,182]. Some studies have investigated VT formation in humans studies and reported accurate results in reconstructing epicardial circuits for re-entry [182] and location of the epicardial and endocardial circuits [183]. Others have used ECGI to detect regions of scar tissue within the myocardial wall and compared these ventricular scar patterns to the gold standard of MRI imaging [181]. Specifically, Horacek et al. examined an improved method for identifying intramural myocardial scar compared to epicardial only approaches [181]. This study showed good agreement to gold-standard MRI imaging with the intramural detection approach. Finally, Cuclich et al. demonstrated that ECGI could be used in a clinical workflow to aid in the identification of re-entrant tachycardic circuits and allow for more precise preoperative planning, reducing overall treatment time [61,115]. These studies demonstrate a promising clinical application of ECGI that has shown promise and progress in recent years. We theorize that the continued development of these techniques will allow clinicians to leverage BSPM via ECGI to improve their clinical workflows.
Atrial fibrillation has also become a focus of ECGI research efforts. ECGI allows for the noninvasive construction of dominant frequency maps on the atria, aiding in driver localization and ablation planning. ECGI has been used to identify regions of dominant frequency and assist physicians in targeting these regions for treatment. Recent studies in this domain have explored the use of ECGI to identify atrial fibrillation drivers using both simulated data and real-world clinical data [159,184,185,186]. While these methods are still in development, the results show promise for ECGI in the context of AF.
A handful of companies have developed commercial systems to translate ECGI into clinical workflows. The most long-standing of these systems is CardioInsight by Medtronic, primarily used to target ventricular and atrial arrhythmia mapping [71,72]. The Amycard 01c by EP Solutions is another ECGI system that targets both ventricular mapping approaches (CRT planning and ventricular arrhythmia mapping) as well as atrial mapping [187]. Finally, the Acorys system by Corify is a relatively new system that targets arrhythmia localization and pre-ablation/operative planning applications.

4.2.2. Statistical Approach: Machine Learning/Artificial Intelligence

There has been a steadily growing interest in machine learning application (ML) techniques to analyze cardiac bioelectric signals. To date, most AI/ML studies addressing electrocardiography data utilize 12-lead ECG recordings because of the large volume of data needed across large populations to create accurate and representative ML models. However, ML may provide new and unique insights into using BSPM data to significantly improve diagnostic accuracy without adding significant user training. Applications of ML tools in BSPM are primarily focused on easing interpretation by lowering the dimensionality of BSP maps or by training models to estimate specific clinical variables.
Dimensionality reduction in BSPM via ML represents the complex phenomena captured by the hundreds of body surface recordings in a more compact form. Good et al. demonstrated this by using Laplacian Eigenmaps, a method of unsupervised ML dimensionality reduction, to more quickly and accurately identify myocardial ischemia from recorded electrograms when compared to traditional metrics [147]. While this study primarily focused on electrogram data recorded at the heart surface, Good et al. also explored a limited use case with BSPM data [188]. The output of the Laplacian Eignemap model is a 3D representation of the electrogram time series recorded from hundreds of leads. While this method does compress the data into a smaller dimension, interpretation of the resulting Eigenmap manifold is not straightforward and requires custom metrics and modes of analysis. Interpretation of the output of an unsupervised ML method such as Laplacian Eigenmaps can often be an additional layer of complexity, making direct analysis unsuitable for clinical implementation. Supervised ML models, however, can be designed to output a clinical variable of interest directly.
Supervised ML models have been applied with increasing frequency to identify clinical variables using ECGs as an input. Many of these studies focus on 12-lead ECG data and are associated with competitions such as the Computing in Cardiology Physionet 2020 Challenge, which challenged contestants to detect 26 common cardiac pathologies using ML approaches [189]. Common deep learning architectures used include convolutional neural networks (CNN), long short-term memory models (LSTM), and transformer networks. However, there is some early evidence indicating that combinations of CNNs with Transformers or LSTMs seem to perform well on a variety of tasks [139,143]. Despite the differences in data, we hypothesize that many of the same architectures and innovations developed by these studies can be readily applied to BSPM data. We also predict that the additional information content provided by the increased spatial sample of BSPM data may provide additional benefits such as reduced model complexity, improved performance and allow for the investigation of more complex tasks. Brundage et al. applied both logistic regression (a simple ML architecture) and XGBoost (a low parameter decision tree-based architecture) models to detect myocardial ischemia using 96 lead BSPM animal data which was collected according to Zenger et al. [90]. These models demonstrate >0.95 and receiver operator area under the curve, indicating excellent model performance despite being less complex than the architectures commonly applied to 12-lead ECG classification problems [138].
Others have used ML as a personalization tool rather than strictly for increasing the ease of interpretation. Giffard et al. investigated the use of ML tools which take baseline BSPM recordings as input in predicting two critical parameters of a forward model of cardiac electrocardiography, that estimated the response of the heart to various pacing conditions [190]. Personalization-focused ML tools could be used clinically to tune CRT to patients and improve outcomes. The same group later demonstrated that after training an initial model from scratch on simulated data, including data accounting for various pacing and heart positions, this model could be fine-tuned on patient-specific torso geometries and used to predict the same key forward modeling parameters with greater accuracy and less compute at inference [191]. The significant decrease in computational time achieved by transfer learning on patient-specific geometries makes clinical deployment much more feasible. These results suggest that data from heterogeneous sources, including simulations and animal models, may help develop ML models that could be personalized on a subject-specific basis. Given the lack of large publicly available BSPM datasets for humans, an opportunity to use simulated and animal model data would ease the difficulty of data acquisition.

5. Conclusions and Prospective View

Body surface potential maps represent a wealth of information to serve both clinical and research goals that can be easily and safely acquired from any patient or subject. BSP maps provide increased sampling of cardiac electrical activity over the standard 12-lead ECG. This increased coverage and density have been exploited in a number of research applications to explore the effects of various pathophysiological process and develop diagnosis tools. Another advantage of BSPM is that the analysis of maps can follow a range of diverse pathways. The signals can be directly analyzed to assess cardiac bioelectric response under a variety of conditions, or used as inputs to computational models designed to identify key features of physiology including noninvasively reconstructing cardiac activity on or within the heart. No other ECG modality allows for such detailed examination while also remaining completely noninvasive.
Contemporary BSPM systems see the bulk of their use in research settings and only to a lesser extent in clinical practice, despite the existence of commercial ECGI devices. Research BSPM systems consist almost entirely of custom built acquisition hardware and software, coupled with custom built electrode systems. This heterogeneity between implementations makes comparisons between datasets difficult, but not insurmountable, another byproduct of the rich coverage and sampling density. One challenge that all mapping systems face is the shortage of sources of high-quality electrodes that can readily interface with a BSPM system. Most researchers turn to in-house production of electrodes, leading to further heterogeneity among BSPM datasets. We see the need for a consistent source of high-quality, reasonably priced body surface electrode arrays purpose built for body surface mapping as a major challenge preventing BSPM from being a common research tool.
Implementing BSPM in clinical practice is also hindered by the complexity of BSP map interpretation, the heterogeneity of acquisition and electrode systems, and the lack of established diagnostic tests and routines based on BSP maps. Most contemporary applications of BSPM approach some of these challenges by leveraging methods that take BSP maps as inputs to produce an output that is more readily interpretable than the raw signals. For example, ECG imaging (ECGI) transforms the BSP map, a representation of the cardiac bioelectric activity measured from distant sensors, into a direct representation of the bioelectric activity at the heart. Using ECGI, relevant clinical features such as paths of re-entry, sites of abnormal activation or conduction, and tissue heterogeneities can be directly observed rather than inferred. Acquiring the same information from direct measurements would require invasive procedures that carry significant extra risk and cost when compared to the relative ease of a BSPM measurement.
ECGI has been successfully integrated into some clinical workflows; however, it is far from a common, clinical procedure, despite the apparent advantages. This paucity of use is likely because ECGI still lacks a specific application or a use case that makes a dramatic improvement to clinical practice. Additionally, ECGI still suffers from a number of limitations and common difficulties that likely inhibits its uptake into common clinical workflows. The ill-posed nature of the ECGI inverse problem can lead to erroneous solutions even with sufficient regularization. These errors result in misleading features in reconstructed signals such as errant lines of conduction block. Contemporary research in the development of ECGI seeks to address such errors by a combination of approaches that include advances in pre-processing of BSP maps, improvements to regularization and ECGI implementations, and advances in post-processing of the resulting ECGI reconstructions [97,98,113,192]. Such methodologies have shown promise in resolving these difficulties in ECGI. We hypothesize that as ECGI is developed, honed, and applied to more pathologies in research settings, these improvements will result in a clinical ECGI system that is more fit for a common clinical workflow.
Machine learning models also present an opportunity to use BSP maps as an input to generate a clinically useful diagnostic output. The design and specific output of an ML model is more flexible than ECGI, as ML does not traditionally rely on specific underlying physical relationships but rather learns a highly nonlinear mapping between the inputs and desired outputs. This flexibility in design allows for the development of ML models to address very specific clinical questions, with model outputs such as presence or absence of a specific disease, or value of some relevant physiological measure that would assist in patient diagnosis and treatment planning. ML models can be tuned to answer a much larger set of specific questions than ECGI, so long as there is sufficient data available to train the model. ML present an opportunity to utilize BSPM for diagnosis of more than just cardiac-related pathophysiology. Clinical outcomes such as likelihood of an adverse cardiac event after a procedure may be predictable using ML with BSP maps as the input. While ML has yet to be extensively applied to BSPM data, based on successes of ML models in other biomedical fields and in 12-lead ECG analysis, we anticipate that ML applications leveraging BSPM data will open the door to a wide variety of clinical applications.
Across all instances of BSPM implementation and subsequent interpretation, there has been a common restriction based on the computational power and storage needed to acquire and manage BSP maps. Once a BSPM system is set up, recording additional heartbeats is relatively trivial except for the need for additional computational resources to store and process the additional signals. This restriction based on computational resources, which in early analyses constrained investigations to single heartbeat recordings or even sub-sections of single heartbeats, has rapidly become less of a limiting factor in BSP map analysis. Modern computational resources greatly facilitate the incorporation of entire BSP maps from multiple heartbeats due to dramatically increased storage capacity and processing power. This additional capacity allows for more comprehensive investigations into scenarios with highly dynamic cardiac behavior such as response to pharmaceuticals, acute disease progression, and response to exercise. Modes of analysis, whether traditional signal processing, ECGI, or AI, have the potential to leverage information from multiple heartbeats to better explore the utility of BSP maps and further develop our understanding of the underlying physiology of dynamic beat-to-beat change.
We have so far considered a division between models that are deterministic (e.g., ECGI) and models based on statistical data driven relationships (e.g., ML). However, such a distinction does not preclude the opportunity to combine aspects of each of these modeling approaches. For example, recent studies have demonstrated the ML techniques can account for geometric inaccuracies in the ECGI forward model. Additionally, physics informed neural networks (PINN), which incorporate physics-based deterministic models into ML neural network architectures, have emerged recently as a promising bridge between ML techniques and deterministic models. Machine learning based approaches are well suited for addressing complex nonlinear relationships in a form that can be less computationally taxing and easier to establish than a deterministic model of the same phenomena. However, ML approaches can often neglect physiologically relevant constraints, leading to models that produce non-meaningful outputs under certain circumstances. The combination of ML and deterministic models could offer the best of both worlds, allowing for both accurate and efficient models that are constrained in part by physiological and physical models. We suspect that this intersection between statistical and deterministic models will provide the most fertile ground for the development of future BSPM analysis methods and models.

Author Contributions

J.B. (Jake Bergquist): Conceptualization, Project Management, Primary Writing, Editing and Proofreading; L.R.: Conceptualization, Primary Writing, Editing and Proofreading; B.Z.: Conceptualization, Primary Writing, Editing and Proofreading; J.B. (James Brundage): Conceptualization, Primary Writing, Editing and Proofreading; A.B.: Conceptualization, Primary Writing, Editing and Proofreading; R.S.M.: Conceptualization, Primary Writing, Editing and Proofreading, Funding Acquistion. All authors have read and agreed to the published version of the manuscript.

Funding

This work was supported by NIH NHLBI grant no. F30HL149327; NIH NIGMS Center for Integrative Biomedical Computing (www.sci.utah.edu/cibc), NIH NIGMS grants P41GM103545 and R24 GM136986; the NSF GRFP; the Utah Graduate Research Fellowship; and the Nora Eccles Treadwell Foundation for Cardiovascular Research.

Institutional Review Board Statement

Not applicable.

Informed Consent Statement

Not applicable.

Data Availability Statement

Data used for example figures and visulizations can be found on the EDGAR (edgar.sci.utah.edu) (accessed date 29 October 2021).

Conflicts of Interest

The authors declare no conflict of interest.

References

  1. Taccardi, B.; Ambroggi, L.D.; Viganotti, C. Body-Saurface Mapping of Heart Potentials. In The Theoretical Basis of Electrocardiology; Nelson, C., Geselowitz, D., Eds.; Claredon Press: Oxford, UK, 1976; pp. 436–466. [Google Scholar]
  2. Taccardi, B. Future Prospects and Applications. In Body Surface Electrocardiographic Mapping; Mirvis, D., Ed.; Kluwer Academic Publishers: Boston, MA, USA; Dordrecht, The Netherlands; London, UK, 1988; pp. 193–200. [Google Scholar]
  3. Taccardi, B. Body surface mapping and the cardiac electric sources: A historical survey. J. Electrocardiol. 1990, 23, 150–154. [Google Scholar] [CrossRef]
  4. Flowers, N.; Horan, L. Body Surface Potential Mapping. In Cardiac Electrophysiology: From Cell to Bedside, 2nd ed.; Zipes, D., Jalife, J., Eds.; W.B. Saunders Company: Newberg, OR, USA, 1995; Volume 93, pp. 1049–1067. [Google Scholar]
  5. Taccardi, B.; Punske, B.; Lux, R.; MacLeod, R.; Ershler, P.; Dustman, T.; Vyhmeister, Y. Useful lessons from body surface potential mapping. J. Cardiovasc. Electrophysiol. 1998, 9, 773–786. [Google Scholar] [CrossRef] [PubMed]
  6. Ambroggi, L.D.; Musso, E.; Taccardi, B. Body Surface Potential Mapping. In Comprehensive Electrocardiology; Macfarlane, P., Veitch Lawrie, T., Eds.; Springer: Berlin/Heidelberg, Germany, 2005; Volume 32, pp. 1375–1413. [Google Scholar]
  7. Robinson, M.; Phil, D.; Curzen, N. Electrocardiographic Body Surface Mapping: Potential Tool for the Detection of Transient Myocardial Ischemia in the 21st Century? Ann. Noninvasive Electrocardiol. 2009, 14, 201–210. [Google Scholar] [CrossRef] [PubMed]
  8. Taccardi, B. Distribution of Heart Potentials on the Thoracic Surface of Normal Human Subjects. Circ. Res. 1963, 4, 341–351. [Google Scholar] [CrossRef] [PubMed] [Green Version]
  9. Sridharan, M.; Horan, L.; Hand, R.; Orander, P.; Killam, H.; Flowers, N. Use of body surface maps to identify vessel site of coronary occlusions. J. Electrocardiol. 1989, 22, 72–81. [Google Scholar] [CrossRef]
  10. Kornreich, F.; Montague, T.; Rautaharju, P. Location and magnitude of ST changes in acute myocardial infarction by analysis of body surface potential maps. J. Electrocardiol. 1992, 25, 15. [Google Scholar] [CrossRef]
  11. Kornreich, F.; Montague, T.; Rautaharju, P. Best ECG leads for diagnosing acute myocardial infarction by multivariate analysis of body surface potential maps. In Proceedings of the IEEE Computers in Cardiology, IEEE Computer Society, Durham, NC, USA, 11–14 October 1992; pp. 439–442. [Google Scholar]
  12. Kornreich, F.; MacLeod, R.; Dzavik, V.; Kornreich, A.; Stoupel, E.; de Almeida, J.; Walker, D.; Montague, T. Body surface potential mapping of QRST changes during and after percutanesous transluminal coronary angioplasty. J. Electrocardiol. 1994, 27, 113–117. [Google Scholar] [CrossRef]
  13. Kornreich, F.; Lux, R.; MacLeod, R. Map representation and diagnostic performance of the standard 12-lead ECG. J. Electrocardiol. 1995, 28, 121–123. [Google Scholar] [CrossRef]
  14. Lux, R. Mapping Techniques. In Comprehensive Electrocardiology; Macfarlane, P., Veitch Lawrie, T., Eds.; Pergamon Press: Oxford, UK, 1989; Volume 2, Chapter 26; pp. 1001–1014. [Google Scholar]
  15. MacLeod, R.; Johnson, C.; Matheson, M. Visualizing Bioelectric Fields. IEEE Comp. Graph. Applic. 1993, 13, 10–12. [Google Scholar] [CrossRef]
  16. MacLeod, R.; Johnson, C. Map3d: Interactive scientific visualization for bioengineering data. In Proceedings of the IEEE Engineering in Medicine and Biology Society 15th Annual International Conference, San Diego, CA, USA, 31 October 1993; pp. 30–31. [Google Scholar]
  17. Montague, T.; Smith, E.; Cameron, D.; Rautaharju, P.; Klassen, G.; Flemington, C.; Horacek, B. Isointegral Analysis of Body Surface Maps: Surface Distribution and Temporal Variability in Normal Subjects. Circulation 1981, 63, 1167–1172. [Google Scholar] [CrossRef] [Green Version]
  18. Green, L.; Lux, R.; Haws, C.; Williams, R.; Hunt, S.; Burgess, M. Effects of age, sex, and body habitus on QRS and ST-T potential maps of 1100 normal subjects. Circulation 1985, 71, 244–253. [Google Scholar] [CrossRef] [PubMed] [Green Version]
  19. McPherson, D.; Horacek, B.; Sutherland, D.; Armstrong, C.; Spencer, A.; Montague, T. Exercise Electrocardiographic Mapping in Normal Subjects. J. Electrocardiol. 1985, 18, 351–360. [Google Scholar] [CrossRef]
  20. Kornreich, F.; Montague, T.; Rautaharju, P. Body surface potential mapping of ST segment changes in acute myocardial infarction: Implications for ECG enrollment criteria for thrombolytic therapy. Circulation 1993, 87, 773. [Google Scholar] [CrossRef] [PubMed] [Green Version]
  21. McPherson, D.; Horacek, B.; Spencer, C.; Johnstone, D.; Lalonde, L.; Cousins, C.; Montague, T. Indirect Measurements of Infarct Size, Correlative Variability of Enzyme, Radionuclear, Angiographic and Body Surface Map Variables in 34 Patients during acute Phase of First Myocardial Infarction. Chest 1985, 8, 841–848. [Google Scholar] [CrossRef] [PubMed] [Green Version]
  22. Franks, M.; Lawson, L. Body surface mapping improves diagnosis of acute myocardial infarction in the emergency Department. Adv. Emerg. Nurs. J. 2012, 34, 32–40. [Google Scholar] [CrossRef] [PubMed]
  23. Ornato, J.P.; Menown, I.B.A.; Peberdy, M.A.; Kontos, M.C.; Riddell, J.W.; Higgins, G.L.; Maynard, S.J.; Adgey, J. Body surface mapping vs 12-lead electrocardiography to detect ST-elevation myocardial infarction. Am. J. Emerg. Med. 2009, 27, 779–784. [Google Scholar] [CrossRef]
  24. Montague, T.; Smith, E.; Johnstone, D.; Spencer, C.; Lalonde, L.; Bessoudo, R.; Gardner, M.; Anderson, R.; Horacek, B. Temporal Evaluation of Body Surface Mapping Patterns Following Acute Inferior Myocardial Infarction. J. Electrocardiol. 1984, 17, 319–328. [Google Scholar] [CrossRef]
  25. Montague, T.; Johnstone, D.; Spencer, A.; Lalonde, L.; Gardner, M.; O’Reilly, M.; Horacek, B. Non-Q-Wave Acute Myocardial Infarction: Body Surface Potential Map and Ventriculographic Patterns. Am. J. Cardiol. 1986, 58, 1173–1180. [Google Scholar] [CrossRef]
  26. McPherson, D.; Horacek, B.; Johnstone, D.; Lalonde, L.; Spencer, C.; Montague, T. Q-Wave Infarction: Pathophysiology of Body Surface Potential map and Ventriculographic Patterns in Anterior and Inferior Groups. Can. J. Cardiol. 1986, Suppl A, 91A–98A. [Google Scholar]
  27. Ambroggi, L.D.; Bertoni, T.; Breghi, M.; Marconi, M.; Mosca, M. Diagnostic value of body surface potential mapping in old anterior non-Q myocardial infarction. J. Electrocardiol. 1988, 21, 321–329. [Google Scholar] [CrossRef]
  28. Green, L.; Lux, R.; Haws, C. Detection and Localization of Coronary Artery Disease with Body Surface Mapping in Patients with Normal Electrocardiograms. Circulation 1987, 76, 1290–1297. [Google Scholar] [CrossRef] [Green Version]
  29. Montague, T.; Johnstone, D.; Apencer, A.; Miller, R.; MacKenzie, B.; Gardner, M.; Horacek, B. Quantitation of Myocardial Ischemia by Body Surface Potential Mapping: Exercise Maps in Patients with Isolated left Anterior Descending Coronary Artery Disease. Am. J. Cardiol. 1988, 61, 273–282. [Google Scholar]
  30. Montague, T.; Johnstone, D.; Miller, R.; MacKenzie, B.; Gardner, M.; Horacek, B. Quantitative Body Surface Mapping: Exercise Maps in Patients with Single and Multiple Coronary Artery Obstructions. In Canadian Cardiovascular Society Annual Meeting; Canadian Cardiovascular Society: Ottawa, ON, Canada, 1987. [Google Scholar]
  31. Montague, T.; Macdonald, R.; Henderson, M.; Miller, R.; Horacek, B. Quantitative Body Surface Mapping: Resting Maps Before and After Successful Angioplsty. In Canadian Cardiovascular Society Annual Meeting; Canadian Cardiovascular Society: Ottawa, ON, Canada, 1987. [Google Scholar]
  32. Montague, T.; Johnstone, D.; Spencer, A.; Miller, R.; MacKenzie, B.; Gardner, M.; Horacek, B. Body Surface Potential Maps with Low-Level Exercise in Isolated Left Anterior Descending Coronary Artery Disease. Am. J. Cardiol. 1988, 61, 273–282. [Google Scholar] [CrossRef]
  33. Montague, T.; Witkowski, F.X. The Clinical Utility of Body Surface Potential Mapping in Coronary Artery Disease. Am. J. Cardiol. 1989, 64, 378–383. [Google Scholar] [CrossRef]
  34. Montague, T.; Witkowski, F.; Miller, R.; Johnstone, D.; Mackenzie, R.; Spencer, C.; Horacek, B. Exercise Body Surface Potential mapping in single amd multiple coronary artery disease. Chest 1990, 97, 1333–1342. [Google Scholar] [CrossRef]
  35. Montague, T.; Finley, J.; Mukelabai, K.; Black, S.; Rigby, S.; Spencer, A.; Horacek, B. Cardiac Rhythm, Rate and Ventricular Repolarization Properties in Infants at Risk for Suddent Infant Death Syndrome: Comparison with Age- and Sex-Matched Control Infants. Am. J. Cardiol. 1984, 54, 301–307. [Google Scholar] [CrossRef]
  36. Ambroggi, L.D.; Taccardi, B.; Macchi, E. Body Surface Maps of Heart Potential: Tentative Localization of Preexcited Area of Forty-two Wolff-Parkinson-White patients. Circulation 1976, 54, 251. [Google Scholar] [CrossRef] [Green Version]
  37. Ambroggi, L.D.; Bertoni, T.; Locati, E.; Stramba-Badiale, M.; Schwartz, P. Mapping of body surface potentials in patients with the idiopathic long QT syndrome. Circulation 1986, 74, 1334–1345. [Google Scholar] [CrossRef] [PubMed] [Green Version]
  38. Gardner, M.; Montague, T.; Armstrong, C.; Horacek, M.; Smith, E. Vulnerability to ventricular arrhythmia: Assessment by mapping of body surface potential. Circulation 1986, 73, 684–692. [Google Scholar] [CrossRef] [Green Version]
  39. Hubley-Kozey, C.; Mitchell, B.; Gardner, M.; Warren, J.; Penney, C.; Smith, E.; Horáček, B. Spatial features in body surface potentials maps can identify patients with a history of sustained ventricular tachycardia. Circulation 1995, 92, 1825–1838. [Google Scholar] [CrossRef]
  40. Ambroggi, L.D.; Aime, E.; Ceriotti, C.; Rovida, M.; Negroni, S. Mapping of Ventricular Repolarization Potentials in Patients With Arrhythmogenic Right Ventricular Dysplasia: Principal Component Analysis of the ST-T Waves. Circulation 1997, 96, 4314–4318. [Google Scholar] [CrossRef]
  41. Lux, R.; Green, L.; MacLeod, R.; Taccardi, B. Assessment of spatial and temporal characteristics of ventricular repolarization. J. Electrocardiol. 1994, 27, 100–104. [Google Scholar] [CrossRef]
  42. Lux, R.; Fuller, M.; MacLeod, R.; Ershler, P.; Punske, B.; Taccardi, B. Noninvasive indices of repolarization and its dispersion. J. Electrocardiol. 1999, 32, 153–157. [Google Scholar] [CrossRef]
  43. Bank, A.; Gage, R.; Curtin, A.; Burns, K.; Gillberg, J.; Ghosh, S. Body surface activation mapping of electrical dyssynchrony in cardiac resynchronization therapy patients: Potential for optimization. J. Electrocardiol. 2018, 51, 534–541. [Google Scholar] [CrossRef] [PubMed]
  44. Gulrajani, R.; Savard, P.; Roberge, F. The Inverse Problem in Electrocardiography: Solutions in Terms of Equivalent Sources. Crit. Rev. Biomed. Eng. 1988, 16, 171–214. [Google Scholar]
  45. Gulrajani, R. Bioelectricity and Biomagnetism, 1st ed.; John Wiley & Sons: New York, NY, USA, 1998. [Google Scholar]
  46. MacLeod, R.; Buist, M. The Forward Problem of Electrocardiography. In Comprehensive Electrocardiology; Macfarlane, P., van Oosterom, A., Pahlm, O., Kligfield, P., Janse, M., Camm, J., Eds.; Springer: London, UK, 2010; pp. 247–298. [Google Scholar]
  47. Messinger-Rapport, B.; Rudy, Y. Regularization of the Inverse Problem in Electrocardiography: A Model Study. Math. Biosci. 1988, 89, 79–118. [Google Scholar] [CrossRef]
  48. Pullan, A.; Cheng, L.K.; Nash, M.; Brooks, D.; Ghodrati, A.; MacLeod, R. The Inverse Problem of Electrocardiography. In Comprehensive Electrocardiology; Macfarlane, P., van Oosterom, A., Pahlm, O., Kligfield, P., Janse, M., Camm, J., Eds.; Springer: London, UK, 2010; pp. 299–344. [Google Scholar]
  49. Ghanem, R.; Burnes, J.; Waldo, A.; Rudy, Y. Imaging dispersion of myocardial repolarization, II: Noninvasive reconstruction of epicardial measures. Circulation 2001, 104, 1306–1312. [Google Scholar] [CrossRef]
  50. Cluitmans, M.; Brooks, D.H.; MacLeod, R.; Dössel, O.; Guillem, M.S.; van Dam, P.M.; Svehlikova, J.; He, B.; Sapp, J.; Wang, L.; et al. Validation and opportunities of electrocardiographic imaging: From technical achievements to clinical applications. Front. Physiol. 2018, 9, 1305. [Google Scholar] [CrossRef]
  51. Franzone, P.C.; Gassaniga, G.; Guerri, L.; Taccardi, B.; Viganotti, C. Accuracy Evaluation in Direct and Inverse Electrocardiology. In Progress in Electrocardiography; Macfarlane, P., Ed.; Pitman Medical: London, UK, 1979; pp. 83–87. [Google Scholar]
  52. Oster, H.; Taccardi, B.; Lux, R.; Ershler, P.; Rudy, Y. Noninvasive electrocardiographic imaging: Reconstruction of epicardial potentials, electrograms, and isochrones and localization of single and multiple electrocardiac events. Circulation 1997, 96, 1012–1024. [Google Scholar] [CrossRef] [PubMed]
  53. Burnes, J.; Taccardi, B.; MacLeod, R.; Rudy, Y. Noninvasive electrocardiographic imaging of electrophysiologically abnormal substrates in infarcted hearts: A model study. Circulation 2000, 101, 533–540. [Google Scholar] [CrossRef] [Green Version]
  54. Burnes, J.; Taccardi, B.; Rudy, Y. A Noninvasive Imaging Modality for Cardiac Arrhythmias. Circulation 2000, 102, 2152–2158. [Google Scholar] [CrossRef]
  55. Jia, P.; Punske, B.; Taccardi, B.; Rudy, Y. Electrophysiologic endocardial mapping from a noncontact nonexpandable catheter: A validation study of a geometry-based concept. J. Cardiovasc. Electrophysiol. 2000, 11, 1238–1251. [Google Scholar] [CrossRef] [PubMed]
  56. Burnes, J.; Ghanem, R.; Waldo, A.; Rudy, Y. Imaging dispersion of myocardial repolarization, I: Comparison of. Circulation 2001, 104, 1299–1505. [Google Scholar] [CrossRef] [Green Version]
  57. Ramanathan, C.; Rudy, Y. Electrocardiographic Imaging: I. effect of torso inhomgeneities on body surface electrocardiographic potentials. J. Cardiovasc. Electrophysiol. 2001, 12, 229–240. [Google Scholar] [CrossRef] [PubMed]
  58. Cluitmans, M.; Bonizzi, P.; Karel, J.; Das, M.; Kietselaer, B.; de Jong, M.; Prinzen, F.; Peeters, R.; Westra, R.; Volders, P. In Vivo Validation of Electrocardiographic Imaging. JACC Clin. Electrophysiol. 2017, 3, 232–242. [Google Scholar] [CrossRef] [PubMed]
  59. Ramanathan, C.; Ghanem, R.; Jia, P.; Ryu, K.; Rudy, Y. Noninvasive electrocardiographic imaging for cardiac electrophysiology and arrhythmia. Nat. Med. 2004, 10, 422–428. [Google Scholar] [CrossRef]
  60. Ghanem, R.; Jia, P.; Ramanathan, C.; Ryu, K.; Markowitz, A.; Rudy, Y. Noninvasive electrocardiographic imaging (ECGI): Comparison to intraoperative mapping in patients. Heart Rhythm J. 2005, 2, 339–354. [Google Scholar] [CrossRef] [Green Version]
  61. Cuculich, P.; Zhang, J.; Wang, Y.; Desouza, K.; Vijayakumar, R.; Woodard, P.; Rudy, Y. The electrophysiological cardiac ventricular substrate in patients after myocardial infarction noninvasive characterization with electrocardiographic imaging. J. Am. Coll. Cardiol. 2011, 58, 1893–1902. [Google Scholar] [CrossRef] [Green Version]
  62. Intini, A.; Goldstein, R.; Jia, P.; Ramanathan, C.; Ryu, K.; Giannattasio, B.; Gilkeson, R.; Stambler, B.; Brugada, P.; Stevenson, W.; et al. Electrocardiographic imaging (ECGI), a novel diagnostic modality used for mapping of focal left ventricular tachycardia in a young athlete. Heart Rhythm J. 2005, 2, 1250–1252. [Google Scholar] [CrossRef] [Green Version]
  63. Cuculich, P.; Wang, Y.; Lindsay, B.; Vijayakumar, R.; Rudy, Y. Noninvasive real-time mapping of an incomplete pulmonary vein isolation using electrocardiographic imaging. Heart Rhythm J. 2010, 7, 1316–1317. [Google Scholar] [CrossRef] [Green Version]
  64. Vijayakumar, R.; Silva, J.; Desouza, K.; Abraham, R.; Strom, M.; Sacher, F.; Hare, G.V.; Haissaguerre, M.; Roden, D.; Rudy, Y. Electrophysiologic substrate in congenital Long QT syndrome: Noninvasive mapping with electrocardiographic imaging (ECGI). Circulation 2014, 130, 1936–1943. [Google Scholar] [CrossRef] [Green Version]
  65. Rudy, Y.; Lindsay, B. Electrocardiographic imaging of heart rhythm disorders: From bench to bedside. Card. Electrophysiol. Clin. 2015, 7, 17–35. [Google Scholar] [CrossRef] [PubMed] [Green Version]
  66. Wang, Y.; Schuessler, R.; Damiano, R.; Woodard, P.; Rudy, Y. Noninvasive electrocardiographic imaging (ECGI) of scar-related atypical atrial flutter. Heart Rhythm J. 2007, 4, 1565–1567. [Google Scholar] [CrossRef] [PubMed] [Green Version]
  67. Wang, Y.; Cuculich, P.; Zhang, J.; Desouza, K.; Vijayakumar, R.; Chen, J.; Faddis, M.; Lindsay, B.; Smith, T.; Rudy, Y. Noninvasive electroanatomic mapping of human ventricular arrhythmias with electrocardiographic imaging. Sci. Transl. Med. 2011, 3, 98ra84. [Google Scholar] [CrossRef] [PubMed] [Green Version]
  68. Cuculich, P.; Wang, Y.; Lindsay, B.; Faddis, M.; Schuessler, R.; RJ, J.D.; Li, L.; Rudy, Y. Noninvasive characterization of epicardial activation in humans with diverse atrial fibrillation patterns. Circulation 2010, 122, 1364–1372. [Google Scholar] [CrossRef] [Green Version]
  69. Jia, P.; Ramanathan, C.; Ghanem, R.; Ryu, K.; Varma, N.; Rudy, Y. Electrocardiographic imaging of cardiac resynchronization therapy in heart failure: Observation of variable electrophysiologic responses. Heart Rhythm J. 2006, 3, 296–310. [Google Scholar] [CrossRef] [PubMed] [Green Version]
  70. Latacha, M.; Memon, N.; Cuculich, P.; Hertel, J.; Wang, Y.; Rudy, Y.; Smith, T. Pathologic examination after epicardial ablation of ventricular tachycardia in cardiac sarcoidosis. Heart Rhythm J. 2010, 7, 705–707. [Google Scholar] [CrossRef] [Green Version]
  71. Haissaguerre, M.; Hocini, M.; Shah, A.; Derval, N.; Sacher, F.; Jais, P.; Dubois, R. Noninvasive panoramic mapping of human atrial fibrillation mechanisms: A feasibility report. J. Cardiovasc. Electrophysiol. 2013, 24, 711–717. [Google Scholar] [CrossRef]
  72. Cochet, H.; Dubois, R.; Sacher, F.; Derval, N.; Sermesant, M.; Hocini, M.; Montaudon, M.; Haissaguerre, M.; Laurent, F.; Jais, P. Cardiac arrythmias: Multimodal assessment integrating body surface ECG mapping into cardiac imaging. Radiology 2014, 271, 239–247. [Google Scholar] [CrossRef] [Green Version]
  73. Hocini, M.; Shah, A.; Neumann, T.; Kuniss, M.; Erkapic, D.; Chaumeil, A.; Copley, S.; Lim, P.; Kanagaratnam, P.; Denis, A.; et al. Focal Arrhythmia Ablation Determined by High Resolution Non-invasive Maps: Multicenter Feasibility Study. J. Cardiovasc. Electrophysiol. 2015, 26, 754–760. [Google Scholar] [CrossRef] [PubMed]
  74. Cuculich, P.; Schill, M.; Kashani, R.; Mutic, S.; Lang, A.; Cooper, D.; Faddis, M.; Gleva, M.; Noheria, A.; Smith, T.; et al. Noninvasive Cardiac Radiation for Ablation of Ventricular Tachycardia. N. Engl. J. Med. 2017, 377, 2325–2336. [Google Scholar] [CrossRef]
  75. Robinson, C.; Samson, P.; Moore, K.; Hugo, G.; Knutson, N.; Mutic, S.; Goddu, S.; Lang, A.; Cooper, D.; Faddis, M.; et al. Phase I/II Trial of Electrophysiology-Guided Noninvasive Cardiac Radioablation for Ventricular Tachycardia. Circulation 2019, 139, 313–321. [Google Scholar] [CrossRef] [PubMed]
  76. Plonsey, R. Bioelectric Phenomena; McGraw-Hill: New York, NY, USA, 1969. [Google Scholar]
  77. Ghodrati, A.; Brooks, D.; MacLeod, R. Methods of solving reduced lead systems for inverse electrocardiography. IEEE Trans. Biomed. Eng. 2007, 54, 339–343. [Google Scholar] [CrossRef]
  78. Figuera, C.; Suarez-Gutierrez, V.; Hernandez-Romero, I.; Rodrigo, M.; Liberos, A.; Atienza, F.; Guillem, M.; Barquero-Perez, O.; Climent, A.; Alonso-Atienza, F. Regularization Techniques for ECG Imaging during Atrial Fibrillation: A Computational Study. Front. Physiol. 2016, 7, 466. [Google Scholar] [PubMed] [Green Version]
  79. Dogrusoz, Y.; Bear, L.; Svehlikova, J.; Coll-Font, J.; Good, W.; Dubois, R.; van Dam, E.; MacLeod, R. Reduction of Effects of Noise on the Inverse Problem of Electrocardiography with Bayesian Estimation. IEEE Comput. Cardiol. 2018, 45, 1–4. [Google Scholar]
  80. MacLeod, R.; Lux, R.; Taccardi, B. Translation of body surface maps between different electrode configurations using a three-dimensional interpolation scheme. In Electrocardiology ’93: Proceedings of the International Congress on Electrocardiology, XXth Annual Meeting; MacFarlane, P., Ed.; World Scientific: Singapore, 1993; pp. 179–182. [Google Scholar]
  81. Hoekema, R.; Uijen, G.; Stili, D.; van Oosterom, A. Lead system transformation and body surface map data. J. Electrocardiol. 1998, 31, 71–82. [Google Scholar] [CrossRef]
  82. MacLeod, R.; Miller, R.; Gardner, M.; Horacek, B. Application of an electrocardiographic inverse solution to localize myocardial ischemia during percutaneous transluminal coronary angioplasty. J. Cardiovasc. Electrophysiol. 1995, 6, 2–18. [Google Scholar] [CrossRef]
  83. Kornreich, F.; Rautaharju, P.; Warren, J.; Montague, T.; Horacek, B. Identification of Best Electrocardiographic Leads for Diagnosing Myocardial Infarction by Statistical Analysis of Body Surface Potential Maps. Am. J. Cardiol. 1985, 56, 852–856. [Google Scholar] [CrossRef]
  84. Kornreich, F.; Montague, T.J.; Rautaharju, P.; Kavadias, M.; Horacek, B. Identification of Best Electrocardiographic Leads for Diagnosing Left Ventricular Hypertrophy by Statistical Analysis of Body Surface Potential Maps. Am. J. Cardiol. 1988, 62, 1285–1291. [Google Scholar] [CrossRef]
  85. Lux, R.; Smith, C.; Wyatt, R.; Abildskov, J. Limited lead selection for estimation of body surface potential maps in electrocardiography. IEEE Trans. Biomed. Eng. 1978, 25, 270–276. [Google Scholar] [CrossRef]
  86. Lux, R.; Burgess, M.; Wyatt, R.; Evans, A.; Vincent, G.; Abildskov, J. Clinically practical lead systems for improved electrocardiography: Comparison with precordial grids and conventional lead systems. Circulation 1979, 59, 356–363. [Google Scholar] [CrossRef] [Green Version]
  87. Lux, R.; Evans, K.; Burgess, M.; Wyatt, R.; Abildskov, J. Redundancy Reduction for Improved Display and Analysis of Body Surface Potential Maps: I. Spatial Compression. Circ. Res. 1981, 49, 186–196. [Google Scholar] [CrossRef] [Green Version]
  88. Bear, L.R.; Cheng, L.K.; LeGrice, I.J.; Sands, G.B.; Lever, N.A.; Paterson, D.J.; Smaill, B.H. Forward problem of electrocardiography: Is it solved? Circ. Arrhythmia Electrophysiol. 2015, 8, 677–684. [Google Scholar] [CrossRef] [PubMed]
  89. Bergquist, J.A.; Zenger, B.; Good, W.W.; Rupp, L.C.; Bear, L.R.; MacLeod, R.S. Novel Experimental Preparation to Assess Electrocardiographic Imaging Reconstruction Techniques. Comput. Cardiol. 2020, 1–4. [Google Scholar] [CrossRef]
  90. Zenger, B.; Good, W.W.; Bergquist, J.A.; Burton, B.M.; Tate, J.D.; Berkenbile, L.; Sharma, V.; MacLeod, R.S. Novel experimental model for studying the spatiotemporal electrical signature of acute myocardial ischemia: A translational platform. Physiol. Meas. 2020, 41, 15002. [Google Scholar] [CrossRef]
  91. Potyagaylo, D.; Chmelevsky, M.; van Dam, P.; Budanova, M.; Zubarev, S.; Treshkur, T.; Lebedev, D. ECG Adapted Fastest Route Algorithm to Localize the Ectopic Excitation Origin in CRT Patients. Front. Physiol. 2019, 10, 183. [Google Scholar] [CrossRef]
  92. Aras, K.; Good, W.; Tate, J.; Burton, B.; Brooks, D.; Coll-Font, J.; Doessel, O.; Schulze, W.; Patyogaylo, D.; Wang, L.; et al. Experimental Data and Geometric Analysis Repository: EDGAR. J. Electrocardiol. 2015, 48, 975–981. [Google Scholar] [CrossRef] [Green Version]
  93. Ershler, P.; Steadman, B.; Moore, K.; Lux, R. Systems for measuring and tracking electrophysiologic distributions. Proc. IEEE Eng. Med. Biol. Soc. Annu. Int. Conf. 1998, 17, 56–61. [Google Scholar] [CrossRef]
  94. Zenger, B.; Bergquist, J.A.; Good, W.W.; Rupp, L.C.; MacLeod, R.S. High-capacity cardiac signal acquisition system for flexible, simultaneous, multidomain acquisition. Comput. Cardiol. 2020, 1–4. [Google Scholar] [CrossRef]
  95. Dessel, P.V.; Hemel, N.M.V.; Bakker, J.M.D.; Linnenbank, A.C.; Potse, M.; Jessurun, E.R.; Sippensgroenewegen, A.; Wever, E.F. Relation Between Body Surface Mapping and Endocardial Spread of Ventricular Activation in Postinfarction Heart. J. Cardiovasc. Electrophysiol. 2001, 12, 1232–1241. [Google Scholar] [CrossRef] [PubMed] [Green Version]
  96. Rodenhauser, A.; Good, W.; Zenger, B.; Tate, J.; Aras, K.; Burton, B.; MacLeod, R. PFEIFER: Preprocessing Framework for Electrograms Intermittently Fiducialized from Experimental Recordings. J. Open Source Softw. 2018, 3, 472. [Google Scholar] [CrossRef]
  97. Bear, L.; Svehlikova, J.; Bergquist, J.; Good, W.; Rababah, A.; Coll-Font, J.; MacLeod, R.; van Dam, E.; Dubois, R. Impact of baseline drift removal on ECG beat classification and alignment. Comput. Cardiol. 2021, in press. [Google Scholar]
  98. Dogrusoz, Y.S.; Bear, L.R.; Bergquist, J.; Dubois, R.; Good, W.; MacLeod, R.S.; Rababah, A.; Stoks, J. Effects of Interpolation on the Inverse Problem of Electrocardiography. In Proceedings of the 2019 Computing in Cardiology (CinC), Singapore, 8–11 September 2019; pp. 1–4. [Google Scholar] [CrossRef]
  99. Parker, S.; Johnson, C. SCIRun: A scientific programming environment for computational steering. In Proceedings of the ACM IEEE Supercomputing Conference IEEE, San Diego, CA, USA, 8 December 1995; Volume 2, pp. 1419–1439. [Google Scholar]
  100. Hansen, C.; Johnson, C. The Visualization Handbook; Elsevier: Amsterdam, The Netherlands, 2005. [Google Scholar]
  101. Institute, S. SCIRun: A Scientific Computing Problem Solving Environment, Scientific Computing and Imaging Institute (SCI). 2015. Available online: http://www.scirun.org (accessed on 29 October 2021).
  102. Cheniti, G.; Puyo, S.; Martin, C.A.; Frontera, A.; Vlachos, K.; Takigawa, M.; Bourier, F.; Kitamura, T.; Lam, A.; Dumas-Pommier, C.; et al. Noninvasive Mapping and Electrocardiographic Imaging in Atrial and Ventricular Arrhythmias (CardioInsight). Card. Electrophysiol. Clin. 2019, 11, 459–471. [Google Scholar] [CrossRef] [PubMed]
  103. Essen, R.V.; Hinsen, R.; Louis, R.; Merx, W.; Silny, J.; Rau, G.; Effert, S. On-line monitoring of multiple precordial leads in high risk patients with coronary artery disease—A pilot study. Europ. Heart J. 1985, 5, 203–209. [Google Scholar] [CrossRef] [PubMed]
  104. SippensGroenewegen, A.; Spekhorst, H.; Hauer, R.; van Hemel, N.; Broekhuijsen, P.; Dunning, A. A Radiotransparent Carbon Electrode Array for Body Surface Mapping During Cardiac Catheterization. In Proceedings of the IEEE Engineering in Medicine and Biology Society 9th Annual International Conference, Boston, MA, USA, 13–16 November 1987; pp. 1782–1793. [Google Scholar]
  105. Ershler, P.; Lux, R.; Steadman, B. A 128 Lead online Intraoperative Mapping System. In Proceedings of the IEEE Engineering in Medicine and Biology Society 8th Annual International Conference, Fort Worth, TX, USA, 7 November 1986; pp. 1289–1291. [Google Scholar]
  106. Thomas, C.; Laurita, K.; Kavuru, M.; Vesselle, H.; Lee, D.; Sun, G.; Huebner, W. Biopotential Mapping System Description. Available online: https://bibbase.org/ (accessed on 29 October 2021).
  107. Martel, S.; Lafontaine, S.; Bullivant, D.; Hunter, I.; Hunter, P. A Hardware Object-Oriented Cardiac Mapping System. In Proceedings of the IEEE Engineering in Medicine and Biology Society 17th Annual International Conference, Montreal, QC, Canada, 20–23 September 1995; p. 1647. [Google Scholar]
  108. Einthoven, W. Le telecardiogramme. Arch. Int. Physiol. 1906, 4, 132–164. [Google Scholar]
  109. Wagner, G. Marriott’s Practical Electrocardiography, 11th ed.; Lippincott Williams & Wilkins: Philadelphia, PA, USA, 2008. [Google Scholar]
  110. Milanic, M.; Jazbinsek, V.; Macleod, R.; Brooks, D.; Hren, R. Assessment of regularization techniques for electrocardiographic imaging. J. Electrocardiol. 2014, 47, 20–28. [Google Scholar] [CrossRef] [PubMed] [Green Version]
  111. Bergquist, J.A.; Good, W.W.; Zenger, B.; Tate, J.D.; Rupp, L.C.; MacLeod, R.S. The electrocardiographic forward problem: A benchmark study. Comput. Biol. Med. 2021, 134, 104476. [Google Scholar] [CrossRef] [PubMed]
  112. Rodrigo, M.; Climent, A.M.; Liberos, A.; Hernandez-Romero, I.; Arenal, A.; Bermejo, J.; Fernandez-Aviles, F.; Atienza, F.; Guillem, M.S. Solving Inaccuracies in Anatomical Models for Electrocardiographic Inverse Problem Resolution by Maximizing Reconstruction Quality. IEEE Trans. Med. Imaging 2018, 37, 733–740. [Google Scholar] [CrossRef]
  113. Schuler, S.; Schaufelberger, M.; Bear, L.R.; Bergquist, J.A.; Cluitmans, M.J.M.; Coll-Font, J.; Önder, N.O.; Zenger, B.; Loewe, A.; MacLeod, R.S.; et al. Reducing Line-of-block Artifacts in Cardiac Activation Maps Estimated Using ECG Imaging: A Comparison of Source Models and Estimation Methods. arXiv 2021, arXiv:2108.06602. [Google Scholar]
  114. Burton, B.; Tate, J.; Erem, B.; Swenson, D.; Wang, D.; Brooks, D.; van Dam, P.; MacLeod, R. A Toolkit for Forward/Inverse Problems in Electrocardiography within the SCIRun Problem Solving Environment. In Proceedings of the 2011 Annual International Conference of the IEEE Engineering in Medicine and Biology Society, Boston, MA, USA, 30 August–3 September 2011; pp. 1–4. [Google Scholar]
  115. Cuculich, P.; Robinson, C. Noninvasive Ablation of Ventricular Tachycardia. N. Engl. J. Med. 2018, 378, 1651–1652. [Google Scholar]
  116. Xiu, D.; Karniadakis, G. The Wiener-Askey Polynomial Chaos for stochastic differential equations. SIAM J. Sci. Comput. 2002, 24, 619–644. [Google Scholar] [CrossRef]
  117. Xiu, D. Efficient collocational approach for parametric uncertainty analysis. Comm. Comput. Phys. 2007, 2, 293–309. [Google Scholar]
  118. Burk, K.M.; Narayan, A.; Orr, J.A. Efficient sampling for polynomial chaos-based uncertainty quantification and sensitivity analysis using weighted approximate Fekete points. Int. J. Numer. Methods Biomed. Eng. 2020, 36, e3395. [Google Scholar] [CrossRef] [PubMed]
  119. Rasmussen, C.E. Gaussian processes in machine learning. In Summer School on Machine Learning; Springer: Berlin/Heidelberg, Germany, 2003; pp. 63–71. [Google Scholar]
  120. Stein, M.L. Interpolation of Spatial Data: Some Theory for Kriging; Springer Science & Business Media: Berlin/Heidelberg, Germany, 2012. [Google Scholar]
  121. Xiu, D.; Karniadakis, G. Modeling uncertainty in steady state diffusion problems via generalized polynomial chaos. Comput. Methods Appl. Mech. Eng. 2002, 191, 4927–4948. [Google Scholar] [CrossRef]
  122. Geneser, S.; Xiu, D.; Kirby, R.; Sachse, F. Stochastic Markovian modeling of electrophysiology of ion channels: Reconstruction of standard deviations in macroscopic currents. J. Theor. Biol. 2007, 245, 627–637. [Google Scholar] [CrossRef] [PubMed] [Green Version]
  123. Geneser, S.; MacLeod, R.; Kirby, R. Application of Stochastic Finite Element Methods to Study the Sensitivity of ECG Forward Modeling to Organ Conductivity. IEEE Trans. Biomed. Eng. 2008, 55, 31–40. [Google Scholar] [CrossRef]
  124. Swenson, D.; Geneser, S.; Stinstra, J.; Kirby, R.; MacLeod, R. Cardiac Position Sensitivity Study in the Electrocardiographic Forward Problem Using Stochastic Collocation and BEM. Annal. Biomed. Eng. 2011, 30, 2900–2910. [Google Scholar] [CrossRef] [Green Version]
  125. Rupp, L.C.; Bergquist, J.A.; Zenger, B.; Gillette, K.; Narayan, A.; Plank, G.; MacLeod, R.S. The Role of Myocardial Fiber Direction in Epicardial Activation Patterns via Uncertainty Quantification. Comput. Cardiol. 2021, 1–4, in press. [Google Scholar]
  126. Bergquist, J.A.; Zenger, B.; Rupp, L.C.; Narayan, A.; MacLeod, R.S. Uncertainty Quantification in Simulations of Myocardial Ischemia. Comput. Cardiol. 2021, 1–4, in press. [Google Scholar]
  127. Tate, J.D.; Good, W.W.; Zemzemi, N.; Boonstra, M.; van Dam, P.; Brooks, D.H.; Narayan, A.; MacLeod, R.S. Uncertainty Quantification of the Effects of Segmentation Variability in ECGI. In Functional Imaging and Modeling of the Heart; Ennis, D.B., Perotti, L.E., Wang, V.Y., Eds.; Springer International Publishing: Cham, Switzerland, 2021; pp. 515–522. [Google Scholar]
  128. Kornreich, F.; Montague, T.; Kavadias, M.; Segers, J.; Rautaharju, P.; Horacek, B.; Taccardi, B. Qualitative and Quantitative Analysis of Characteristic Body Surface Potential Map Features in Anterior and Inferior Myocardial Infarction. Am. J. Cardiol. 1987, 60, 1230–1238. [Google Scholar] [CrossRef]
  129. Uijen, G.; Heringa, A.; von Oosterom, A. Data reduction of body surface potential maps by means of orthogonal expansions. IEEE Trans. Biomed. Eng. 1984, 31, 706–714. [Google Scholar] [CrossRef]
  130. Lux, R.; Green, L.; Abildskov, J. Statistical Representation and classification of electrocardiographic body surface potential maps. In Computers in Cardiology; IEEE Computer Society: Long Beach, CA, USA, 1984; pp. 251–254. [Google Scholar]
  131. Farr, B.; Vondenbusch, B.; Silny, J.; Rau, G.; Effert, S. Localization of Significant Coronary Arterial Narrowings Using Body Surface Potential Mapping During Exercise Stress Testing. Am. J. Cardiol. 1987, 5, 528–530. [Google Scholar] [CrossRef]
  132. Lux, R. Karhunen-Loeve Representation of ECG data. J. Electrocardiol. 1992, 25, 195. [Google Scholar] [CrossRef]
  133. Trayanova, N.A.; Popescu, D.M.; Shade, J.K. Machine Learning in Arrhythmia and Electrophysiology. Circ. Res. 2021, 128, 544–566. [Google Scholar] [CrossRef] [PubMed]
  134. Yao, X.; McCoy, R.G.; Friedman, P.A.; Shah, N.D.; Barry, B.A.; Behnken, E.M.; Inselman, J.W.; Attia, Z.I.; Noseworthy, P.A. ECG AI-Guided Screening for Low Ejection Fraction (EAGLE): Rationale and design of a pragmatic cluster randomized trial. Am. Heart J. 2020, 219, 31–36. [Google Scholar] [CrossRef]
  135. Feeny, A.K.; Chung, M.K.; Madabhushi, A.; Attia, Z.I.; Cikes, M.; Firouznia, M.; Friedman, P.A.; Kalscheur, M.M.; Kapa, S.; Narayan, S.M.; et al. Artificial Intelligence and Machine Learning in Arrhythmias and Cardiac Electrophysiology. Circ. Arrhythmia Electrophysiol. 2020, 13, 873–890. [Google Scholar] [CrossRef]
  136. Attia, Z.I.; Kapa, S.; Noseworthy, P.A.; Lopez-Jimenez, F.; Friedman, P.A. Artificial Intelligence ECG to Detect Left Ventricular Dysfunction in COVID-19: A Case Series. Mayo Clin. Proc. 2020, 95, 2464–2466. [Google Scholar] [CrossRef] [PubMed]
  137. LeCun, Y.; Bengio, Y.; Hinton, G. Deep learning. Nature 2015, 521, 436–444. [Google Scholar] [CrossRef] [PubMed]
  138. Brundage, J.N.; Suliafu, V.; Bergquist, J.A.; Zenger, B.; Rupp, L.C.; MacLeod, R.; Wang, B. Myocardial Ischemia Detection Using Body Surface ECG Recordings and Machine Shallow Learning. IEEE Comput. Cardiol. 2021, in press. [Google Scholar]
  139. Rim, B.; Sung, N.J.; Min, S.; Hong, M. Deep Learning in Physiological Signal Data: A Survey. Sensors 2020, 20, 969. [Google Scholar] [CrossRef] [Green Version]
  140. Dhamala, J.; Ghimire, S.; Sapp, J.L.; Horáček, B.M.; Wang, L. Bayesian Optimization on Large Graphs via a Graph Convolutional Generative Model: Application in Cardiac Model Personalization. In Medical Image Computing and Computer Assisted Intervention—MICCAI 2019; Shen, D., Liu, T., Peters, T.M., Staib, L.H., Essert, C., Zhou, S., Yap, P.T., Khan, A., Eds.; Springer International Publishing: Cham, Switzerland, 2019; pp. 458–467. [Google Scholar]
  141. Dosovitskiy, A.; Beyer, L.; Kolesnikov, A.; Weissenborn, D.; Zhai, X.; Unterthiner, T.; Dehghani, M.; Minderer, M.; Heigold, G.; Gelly, S.; et al. An Image is Worth 16x16 Words: Transformers for Image Recognition at Scale. arXiv 2020, arXiv:2010.11929. [Google Scholar]
  142. Vaswani, A.; Shazeer, N.; Parmar, N.; Uszkoreit, J.; Jones, L.; Gomez, A.N.; Kaiser, L.; Polosukhin, I. Attention Is All You Need. arXiv 2017, arXiv:1706.03762. [Google Scholar]
  143. Natarajan, A.; Chang, Y.; Mariani, S.; Rahman, A.; Boverman, G.; Vij, S.; Rubin, J. A Wide and Deep Transformer Neural Network for 12-Lead ECG Classification. In Proceedings of the IEEE Computers in Cardiology, Rimini, Italy, 13–16 September 2020. [Google Scholar]
  144. Merino, M.; Gómez, I.; Molina, A. Envelopment filter and K-means for the detection of QRS waveforms in electrocardiogram. Med. Eng. Phys. 2015, 37, 605–609. [Google Scholar] [CrossRef] [PubMed]
  145. Zhang, Y.; Yu, S. Single-lead noninvasive fetal ECG extraction by means of combining clustering and principal components analysis. Med. Biol. Eng. Comput. 2020, 58, 419–432. [Google Scholar] [CrossRef]
  146. Xia, Y.; Han, J.; Wang, K. Quick detection of QRS complexes and R-waves using a wavelet transform and K-means clustering. Biomed. Mater. Eng. 2015, 26, S1059–S1065. [Google Scholar] [CrossRef] [Green Version]
  147. Good, W.; Erem, B.; Zenger, B.; Coll-Font, J.; Bergquist, J.; Brooks, D.; MacLeod, R. Characterizing the transient electrocardiographic signature of ischemic stress using Laplacian Eigenmaps for dimensionality reduction. Comput. Biol. Med. 2020, 127, 104059. [Google Scholar] [CrossRef] [PubMed]
  148. Zenger, B.; Good, W.W.; Bergquist, J.A.; Rupp, L.C.; Perez, M.D.; Stoddard, G.J.; Sharma, V.; Macleod, R.S. Transient Recovery of Epicardial and Torso ST-Segment Ischemic Signals During Cardiac Stress Tests: A Possible Physiological Mechanism. J. Electrocardiol. 2021. [Google Scholar] [CrossRef]
  149. Zenger, B.; Good, W.W.; Bergquist, J.A.; Rupp, L.C.; Perez, M.D.; Stoddard, G.J.; Sharma, V.; Macleod, R.S. Pharmacological and Simulated Exercise Cardiac Stress Tests Produce Different Ischemic Signatures in High-Resolution Experimental Mapping Studies. J. Electrocardiol. 2021, 68, 56–64. [Google Scholar] [CrossRef] [PubMed]
  150. Kania, M.; Maniewski, R.; Kobylecka, M.; Zaczek, R.; Królicki, L.; Opolski, G.; Janusek, D. Prognostic value of the total cosine R to T measured in high resolution body surface potential mapping during exercise test. Biomed. Signal Process. Control 2015, 20, 135–141. [Google Scholar] [CrossRef]
  151. Bauernfeind, T.; Préda, I.; Szakolczai, K.; Szucs, E.; Kiss, R.G.; Simonyi, G.; Kerecsen, G.; Duray, G.; Medvegy, M. Diagnostic value of the left atrial electrical potentials detected by body surface potential mapping in the prediction of coronary artery disease. Int. J. Cardiol. 2011, 150, 315–318. [Google Scholar] [CrossRef] [PubMed]
  152. Kania, M.; Maniewski, R.; Zaczek, R.; Kobylecka, M.; Zbieć, A.; Królicki, L.; Opolski, G. High-Resolution Body Surface Potential Mapping in Exercise Assessment of Ischemic Heart Disease. Ann. Biomed. Eng. 2019, 47, 1300–1313. [Google Scholar] [CrossRef] [Green Version]
  153. Daly, M.J.; Scott, P.; Owens, C.G.; Tomlin, A.; Smith, B.; Adgey, J. Body Surface Potential Mapping improves diagnosis of acute myocardial infarction in those with significant left main coronary artery stenosis. Comput. Cardiol. 2010, 37, 269–272. [Google Scholar]
  154. Daly, M.J.; Scott, P.J.; Harbinson, M.T.; Adgey, J.A. Improving the Diagnosis of Culprit Left Circumflex Occlusion With Acute Myocardial Infarction in Patients With a Nondiagnostic 12-Lead ECG at Presentation: A Retrospective Cohort Study. J. Am. Heart Assoc. 2019, 8, 1–9. [Google Scholar] [CrossRef] [Green Version]
  155. Hoekstra, J.W.; O’Neill, B.J.; Pride, Y.B.; Lefebvre, C.; Diercks, D.B.; Peacock, W.F.; Fermann, G.J.; Gibson, C.M.; Pinto, D.; Giglio, J.; et al. Acute Detection of ST-Elevation Myocardial Infarction Missed on Standard 12-Lead ECG With a Novel 80-Lead Real-Time Digital Body Surface Map: Primary Results From the Multicenter OCCULT MI Trial. Ann. Emerg. Med. 2009, 54, 779–788.e1. [Google Scholar] [CrossRef] [PubMed]
  156. Wang, B.; Korhonen, P.; Tierala, I.; Hänninen, H.; Väänänen, H.; Toivonen, L. U wave features in body surface potential mapping in post-myocardial infarction patients. Ann. Noninvasive Electrocardiol. 2013, 18, 538–546. [Google Scholar] [CrossRef]
  157. Kylmälä, M.M.; Konttila, T.; Vesterinen, P.; Kivistö, S.M.; Lauerma, K.; Lindholm, M.; Väänänen, H.; Stenroos, M.; Nieminen, M.S.; Hänninen, H.; et al. Assessment of myocardial infarct size with body surface potential mapping: Validation against contrast-enhanced cardiac magnetic resonance imaging. Ann. Noninvasive Electrocardiol. 2015, 20, 240–252. [Google Scholar] [CrossRef] [PubMed]
  158. Guillem, M.S.; Climent, A.M.; Millet, J.; Arenal, Á.; Fernández-Avilés, F.; Jalife, J.; Atienza, F.; Berenfeld, O. Noninvasive localization of maximal frequency sites of atrial fibrillation by body surface potential mapping. Circ. Arrhythmia Electrophysiol. 2013, 6, 294–301. [Google Scholar] [CrossRef] [PubMed] [Green Version]
  159. Marques, V.G.; Rodrigo, M.; Guillem, M.S.; Salinet, J. A robust wavelet-based approach for dominant frequency analysis of atrial fibrillation in body surface signals. Physiol. Meas. 2020, 41, 075004. [Google Scholar] [CrossRef] [PubMed]
  160. Zeemering, S.; Lankveld, T.A.R.; Bonizzi, P.; Crijns, H.; Schotten, U. Principal component analysis of body surface potential mapping in atrial fibrillation patients suggests additional ECG lead locations. Comput. Cardiol. CCAL 2014, 41, 893–896. [Google Scholar]
  161. Jurak, P.; Halamek, J.; Leinveber, P.; Vondra, V.; Soukup, L.; Vesely, P.; Sumbera, J.; Zeman, K.; Martinakova, L.; Jurakova, T.; et al. Ultra-high-frequency ECG measurement. In Proceedings of the Computing in Cardiology 2013, Zaragoza, Spain, 22–25 September 2013; pp. 783–786. [Google Scholar]
  162. Jurak, P.; Matejkova, M.; Halamek, J.; Plesinger, F.; Viscor, I.; Vondra, V.; Lipoldova, J.; Novak, M.; Smisek, R.; Leinveber, P. Cardiac Resynchronization Guided by Ultra-High-Frequency ECG Maps. In Proceedings of the 2019 Computing in Cardiology (CinC), Singapore, 8–11 September 2019; pp. 1–4. [Google Scholar] [CrossRef]
  163. Curila, K.; Jurak, P.; Halamek, J.; Prinzen, F.; Waldauf, P.; Kach, J.; Stros, P.; Plesinger, F.; Mizner, J.; Susankova, M.; et al. Ventricular activation pattern assessment during right ventricular pacing: Ultrahigh-frequency ECG study. J. Cardiovasc. Electrophysiol. 2021, 32. [Google Scholar] [CrossRef] [PubMed]
  164. Postema, P.G.; van Dessel, P.F.H.M.; Kors, J.A.; Linnenbank, A.C.; van Herpen, G.; Ritsema van Eck, H.J.; van Geloven, N.; de Bakker, J.M.T.; Wilde, A.A.M.; Tan, H.L. Local Depolarization Abnormalities Are the Dominant Pathophysiologic Mechanism for Type 1 Electrocardiogram in Brugada Syndrome. J. Am. Coll. Cardiol. 2010, 55, 789–797. [Google Scholar] [CrossRef] [PubMed] [Green Version]
  165. Fonseca-Guzmán, A.; Climent, A.M.; Millet, J.; Berné, P.; Brugada, J.; Ramos, R.; Brugada, R.; Guillem, M.S. Fragmentation in body surface potential mapping recordings from patients with Brugada syndrome. Comput. Cardiol. 2011, 38, 637–640. [Google Scholar]
  166. Guillem, M.S.; Climent, A.M.; Millet, J.; Berné, P.; Ramos, R.; Brugada, J.; Brugada, R. Conduction abnormalities in the right ventricular outflow tract in Brugada syndrome detected body surface potential mapping. In Proceedings of the 2010 Annual International Conference of the IEEE Engineering in Medicine and Biology, Buenos Aires, Argentina, 31 August–4 September 2010; pp. 2537–2540. [Google Scholar] [CrossRef]
  167. Daly, M.J.; Finlay, D.D.; Scott, P.J.; Nugent, C.D.; Adgey, A.A.J.; Harbinson, M.T. Pre-hospital body surface potential mapping improves early diagnosis of acute coronary artery occlusion in patients with ventricular fibrillation and cardiac arrest. Resuscitation 2013, 84, 37–41. [Google Scholar] [CrossRef] [Green Version]
  168. Meo, M.; Denis, A.; Sacher, F.; Duchâteau, J.; Cheniti, G.; Puyo, S.; Bear, L.; Jaïs, P.; Hocini, M.; Haïssaguerre, M.; et al. Insights Into the Spatiotemporal Patterns of Complexity of Ventricular Fibrillation by Multilead Analysis of Body Surface Potential Maps. Front. Physiol. 2020, 11, 1–15. [Google Scholar] [CrossRef]
  169. Douglas, R.A.G.; Samesima, N.; Filho, M.M.; Pedrosa, A.A.; Nishioka, S.A.D.; Pastore, C.A. Global and regional ventricular repolarization study by body surface potential mapping in patients with left bundle-branch block and heart failure undergoing cardiac resynchronization therapy. Ann. Noninvasive Electrocardiol. 2012, 17, 123–129. [Google Scholar] [CrossRef] [PubMed]
  170. Meo, M.; Bonizzi, P.; Bear, L.R.; Cluitmans, M.; Abell, E.; Haïssaguerre, M.; Bernus, O.; Dubois, R. Body Surface Mapping of Ventricular Repolarization Heterogeneity: An Ex-vivo Multiparameter Study. Front. Physiol. 2020, 11, 933. [Google Scholar] [CrossRef]
  171. Hren, R.; Horacek, B. Value of simulated body surface potential maps as templates in localizing sites of ectopic activation for radiofrequency ablation. Physiol. Meas. 1997, 18, 373. [Google Scholar] [CrossRef]
  172. Barr, R.; Spach, M.; Herman-Giddens, G. Selection of the number and position of measuring locations for electrocardiography. IEEE Trans. Biomed. Eng. 1971, 18, 125–138. [Google Scholar] [CrossRef] [PubMed]
  173. Bergquist, J.A.; Coll-Font, J.; Zenger, B.; Rupp, L.C.; Good, W.W.; Brooks, D.H.; MacLeod, R.S. Improving Localization of Cardiac Geometry Using ECGI. In Proceedings of the 2020 Computing in Cardiology, Rimini, Italy, 13–16 September 2020; pp. 1–4. [Google Scholar] [CrossRef]
  174. Wissner, E.; Revishvili, A.; Metzner, A.; Tsyganov, A.; Kalinin, V.; Lemes, C.; Saguner, A.M.; Maurer, T.; Deiss, S.; Sopov, O.; et al. Noninvasive epicardial and endocardial mapping of premature ventricular contractions. Europace 2017, 19, 843–849. [Google Scholar] [CrossRef] [Green Version]
  175. Erkapic, D.; Neumann, T. Ablation of premature ventricular complexes exclusively guided by three-dimensional noninvasive mapping. Card Electrophysiol. Clin. 2015, 7, 109–115. [Google Scholar] [CrossRef]
  176. Potyagaylo, D.; Segel, M.; Schulze, W.H.W.; Dössel, O. Noninvasive Localization of Ectopic Foci: A New Optimization Approach for Simultaneous Reconstruction of Transmembrane Voltages and Epicardial Potentials BT. In Functional Imaging and Modeling of the Heart; Ourselin, S., Rueckert, D., Smith, N., Eds.; Springer: Berlin/Heidelberg, Germany, 2013; pp. 166–173. [Google Scholar]
  177. Berger, T.; Pfeifer, B.; Hanser, F.F.; Hintringer, F.; Fischer, G.; Netzer, M.; Trieb, T.; Stuehlinger, M.; Dichtl, W.; Baumgartner, C.; et al. Single-Beat Noninvasive Imaging of Ventricular Endocardial and Epicardial Activation in Patients Undergoing CRT. PLoS ONE 2011, 6, e16255. [Google Scholar] [CrossRef] [PubMed]
  178. Ghosh, S.; Silva, J.N.A.; Canham, R.M.; Bowman, T.M.; Zhang, J.; Rhee, E.K.; Woodard, P.K.; Rudy, Y. Electrophysiologic substrate and intraventricular left ventricular dyssynchrony in nonischemic heart failure patients undergoing cardiac resynchronization therapy. Heart Rhythm 2011, 8, 692–699. [Google Scholar] [CrossRef] [Green Version]
  179. Ploux, S.; Lumens, J.; Whinnett, Z.; Montaudon, M.; Strom, M.; Ramanathan, C.; Derval, N.; Zemmoura, A.; Denis, A.; De Guillebon, M.; et al. Noninvasive Electrocardiographic Mapping to Improve Patient Selection for Cardiac Resynchronization Therapy. J. Am. Coll. Cardiol. 2013, 61, 2435–2443. [Google Scholar] [CrossRef] [Green Version]
  180. Wan, Y.; Lewis, A.; Colasanto, M.; van Langeveld, M.; Kardon, G.; Hansen, C. A practical workflow for making anatomical atlases for biological research. IEEE Comput. Graph. Appl. 2012, 32, 70–80. [Google Scholar] [CrossRef] [Green Version]
  181. Horáček, B.M.; Wang, L.; Dawoud, F.; Xu, J.; Sapp, J.L. Noninvasive electrocardiographic imaging of chronic myocardial infarct scar. J. Electrocardiol. 2015, 48, 952–958. [Google Scholar] [CrossRef] [Green Version]
  182. Sapp, J.L.; Dawoud, F.; Clements, J.C.; Horáček, B.M. Inverse solution mapping of epicardial potentials: Quantitative comparison with epicardial contact mapping. Circ. Arrythmia Electrophysiol. 2012, 5, 1001–1009. [Google Scholar] [CrossRef] [PubMed] [Green Version]
  183. Wang, L.; Gharbia, O.A.; Horáček, B.M.; Sapp, J.L. Noninvasive epicardial and endocardial electrocardiographic imaging of scar-related ventricular tachycardia. J. Electrocardiol. 2016, 49, 887–893. [Google Scholar] [CrossRef] [Green Version]
  184. Parreira, L.; Carmo, P.; Adragao, P.; Nunes, S.; Soares, A.; Marinheiro, R.; Budanova, M.; Zubarev, S.; Chmelevsky, M.; Pinho, J.; et al. Electrocardiographic imaging (ECGI): What is the minimal number of leads needed to obtain a good spatial resolution? J. Electrocardiol. 2020, 62, 86–93. [Google Scholar] [CrossRef] [PubMed]
  185. Cámara-Vázquez, M.Á.; Hernández-Romero, I.; Rodrigo, M.; Alonso-Atienza, F.; Figuera, C.; Morgado-Reyes, E.; Atienza, F.; Guillem, M.S.; Climent, A.M.; Barquero-Pérez, Ó. Electrocardiographic imaging including intracardiac information to achieve accurate global mapping during atrial fibrillation. Biomed. Signal Process. Control 2021, 64, 102354. [Google Scholar] [CrossRef]
  186. Marques, V.G.; Rodrigo, M.; de la Salud Guillem, M.; Salinet, J. Characterization of atrial arrhythmias in body surface potential mapping: A computational study. Comput. Biol. Med. 2020, 127. [Google Scholar] [CrossRef] [PubMed]
  187. Bokeriia, L.; Revishvili, A.; Kalinin, A.; Kalinin, V.; Liadzhina, O.; Fetisova, E. Hardware-software system for noninvasive electrocardiographic examination of heart based on inverse problem of electrocardiography. Biomed. Eng. 2008, 42, 273–279. [Google Scholar] [CrossRef]
  188. Good, W.; Erem, B.; Coll-Font, J.; Zenger, B.; Horacek, B.; Brooks, D.; MacLeod, R. Novel Metric Using Laplacian Eigenmaps to Evaluate Ischemic Stress on the Torso Surface. IEEE Comput. Cardiol. 2018, 45, 1–4. [Google Scholar]
  189. Alday, E.A.P.; Gu, A.; Shah, A.J.; Robichaux, C.; Wong, A.K.I.; Liu, C.; Liu, F.; Rad, A.B.; Elola, A.; Seyedi, S.; et al. Classification of 12-lead ECGs: The PhysioNet/Computing in Cardiology Challenge 2020. Physiol. Meas. 2020, 41. [Google Scholar] [CrossRef]
  190. Giffard-Roisin, S.; Jackson, T.; Fovargue, L.; Lee, J.; Delingette, H.; Razavi, R.; Ayache, N.; Sermesant, M. Noninvasive Personalization of a Cardiac Electrophysiology Model from Body Surface Potential Mapping. IEEE Trans. Biomed. Eng. 2017, 64, 2206–2218. [Google Scholar] [CrossRef] [PubMed] [Green Version]
  191. Giffard-Roisin, S.; Delingette, H.; Jackson, T.; Webb, J.; Fovargue, L.; Lee, J.; Rinaldi, C.A.; Razavi, R.; Ayache, N.; Sermesant, M. Transfer learning from simulations on a reference anatomy for ECGI in personalized cardiac resynchronization therapy. IEEE Trans. Biomed. Eng. 2018, 66, 343–353. [Google Scholar] [CrossRef] [Green Version]
  192. Rababah, A.S.; Bear, L.R.; Dogrusoz, Y.S.; Good, W.; Bergquist, J.; Stoks, J.; MacLeod, R.; Rjoob, K.; Jennings, M.; Mclaughlin, J.; et al. The effect of interpolating low amplitude leads on the inverse reconstruction of cardiac electrical activity. Comput. Biol. Med. 2021, 136, 104666. [Google Scholar] [CrossRef] [PubMed]
Figure 1. BSPM analysis approaches. BSPM signals are analyzed using one of three different pathways and using two types of mathematical models. Signal analysis methods generally operate on the BSP signals isolated from their geometry. Map analysis extends signal analysis by including the geometry of the torso from which the BSP are recorded. Both signal analysis and map analysis usually rely predominately on statistical models. ECG imaging is based predominately on a deterministic model to reconstructing the cardiac activity at the heart (see the cutaway in the last panel) using the BSP signals and the geometry of the thorax.
Hearts 02 00040 g001
Figure 2. Body surface mapping lead arrangements and torso geometry examples. Bordeaux Torso Tank array (A) [88]. Utah Torso Tank array (B) [89]. Utah Large Animal Body Surface Map (C) [90]. Maastricht Dog Torso Map (D) [58]. EP Solutions patient 24 (E) [91]. KIT 20 PVC torso (F) Karlsruhe Institute of Technology. Nijmegen Human Torso 2004-12-09 (G) University of Nijmegen. Dalhausi Human Torso (H) ([82]). These geometries and associated body surface data (except C) can be found on EDGAR, a cardiac electrophysiology open database (edgar.sci.utah.edu) (accessed date 29 October 2021) [92].
Hearts 02 00040 g002
Figure 3. An example BSP map with timepoint of interest visualized. The signal shown is from a stimulated ventricular activation from the anterior left ventricle. The time singnal (bottom) is the RMS of the torso surface signals. The time instances shown are the peak of the RMS QRS, the end of the QRS, and the peak of the T-wave.
Hearts 02 00040 g003
Figure 4. Custom signal acquisition system described by Zenger et al. [90]. This system includes custom electrode arrays, a front-end interface for connecting various electrode array configurations, analog processing, analog to digital conversion by a commercial intan recording system, and data visualization and saving software. The ADC and display software are designed by Intan Technologies (intantech.com) (accessed date 29 October 2021).
Hearts 02 00040 g004
Figure 5. Example ECGI implementation. Recorded body surface potentials (left) are combined with a geometric model and a source model. The geometric model is made up of the relative positions of the cardiac geometry and torso geometry. The source model in this case is extracelular potentials, and the relationship used for the forward model is the boundary element method. The resulting inverse estimation is extracellular potentials on the cardiac surface. The final column shows a comparison between the inverse solution and the measured extracellular potentials on a flattened version of the cardiac geometry. The cardiac and torso geometries were generated as described in Bergquist et al. [111] where the cardiac geometry is a 256 electrode pericardiac cage array and the torso geometry is a 192 electrode torso tank. Tikhonov 2nd order regularization with L curve was used. The peak of the RMS of the QRS was visualized in all steps.
Hearts 02 00040 g005
Figure 6. Transformation of BSP maps into inputs for various types of machine learning. BSPM signals are first preprocessed, which varies depending on the type of ML model. For feature-based models, characteristics of the BSP signals (QRS integral, T wave peak, activation time, etc.) are calculated and provided as the input signals. For simple linear neural networks and other vector-based ML models the BSP signals are linearized, concatenating the signal form each electrodes into a single vector. For image- and natural language-based ML models, the BSP signals are arranged into a matrix of m leads by n electrodes, which can then be spilt into s length words. For graph-based ML models, the torso geometry is used to create a computational graph that relates the BSP signals to each other based on their spatial relationships.
Hearts 02 00040 g006
Publisher’s Note: MDPI stays neutral with regard to jurisdictional claims in published maps and institutional affiliations.

