1. Introduction
It is widely known that the polymers are useful for the growth of state-of-the-art economical devices. Researcher’s growing interest in polymers in electronics is widely defensible by notable advantages in manufacturing of electro-optic devices, such as photovoltaic cells, polymeric field effect transistors, and polymeric light emitting diodes [
1,
2,
3].
The poly (N-vinyl carbazole) (PVK) is a well-known hole transport polymer; therefore, this material is suitable for clarifying the effect of the injected holes on the breakdown process in polymer thin film [
4]. The PVK has outstanding physicochemical properties such as high refractive index, photo-refractive, photoconductive, etc. Thus, PVK-based materials are applicable for several applications (e.g., photovoltaic cell and holograms photocopies) [
5,
6,
7]. It was also reported that the nanocomposites consisting of inorganic nanoparticles and organic polymers (PVK) often exhibit far superior properties (mechanical, electrical, optical, and magnetic) than that of PVK [
8,
9]. Tang et al. studied the properties of PVK and proposed that PVK can be applicable as a high-potential organic polymer cathode for dual-intercalation Na-ion batteries [
10]. Electrochemical, optical, and morphological properties of PVK prepared by electrochemical polymerization were studied by Bouriche et al. [
11]. Studies on electroluminescence properties of pure PVK were recommended that the PVK is an excellent host material for phosphorescent polymer light-emitting diodes [
12,
13,
14]. Frequency-dependent dielectric breakdown in the PVK thin films was also studied by several researchers [
15,
16].
Knowledge of dielectric behavior of the PVK materials is important because it throws light on several inside activities, for example—movement of dipoles, losses of energy, segmental motion, latent heat, conduction mechanism, etc. For device applications, the effect of injected carriers owing to the accumulation of electronic or ionic charges would become much more important. These charges significantly affect electrical conduction and breakdown.
In this work, dielectric properties of pure PVK and ferrocene doped PVK thin films are studied. The isothermal solution casting technique is employed for the preparation of thin films. Dielectric properties of grown thin films are measured and analyzed in order to optimize the ferrocene doping concentration.
2. Materials and Methods
Thin films of pure PVK and ferrocene doped were grown by the isothermal solution casting technique. The pure and ferrocene-doped PVK is soluble in chloroform, dichloromethane, dioxan, Dichlorobenzene, and pyridine. The solvent for synthesis of thin film was prepared using chloroform (AR-Grade) (Merck, New York, NY, USA). The concentration of solution is strongly affected the film thickness. Initially, 100 mg of PVK was dissolved in 2 mL chemically pure chloroform. The solution was placed in glass beaker and was continuously stirred for 30 min with magnetic stirrer at room temperature. After that, the solution was heated up to 40 °C in order to find a uniform solution. For maximum dispersion, solution was stirred at a constant temperature approximately for 2–3 h. The substrate (optically flat glass plate) was carefully cleaned using hot water and acetone. The PVK solution was poured uniformly on the substrate and. The substrate was placed in a mercury pool to achieve perfect and uniform film thickness [
17]. Later, the samples were heated at constant temperature of 40 °C in dust free chamber. The samples were subjected to dry for 12 h at constant 40 °C temperature. The samples were left at room temperature for another 12 h to remove traces of solvent. Synthesis process of PVK thin film are demonstrated by schematic diagram In
Figure 1.
In order to obtain pinhole free and smooth film, precaution was taken to reduce the rate of vaporization, because solvent chloroform has high rate of vaporization. Therefore, whole assembly (tray filled with mercury and solution poured glass plate) was partially covered with another glass plate. This resulted in slow vaporization rate of chloroform solvent and after some time a smooth pinhole free uniform thin film was obtained. Finally, the film was removed from glass plate. It was cut into small pieces of suitable size, which were washed with ethyl alcohol to remove the surface impurities and the dried films were ready for different studies.
The dielectric constant (ε′), dielectric loss (ε″), loss tangent (), Capacity (C), ac-conductivity () of grown thin films were measured as a function of frequency and temperature using a computer-controlled LCR Hi-Tester (HIOKI 3520, HIOKI E.E. corporation, Nagano, Japan). The instrument can perform measurement in two modes, first one is measurements of impedance (Z) and phase angle (δ), while the second one is capacitance (C) and loss factor (D). The temperature of the samples was varied at the uniform rate of 10 °C/min. The temperature was measured with thermocouple (J-type, Thermo Sensors Co., Nagpur, India). To measure dielectric parameters, the silver paste was applied on both the flat surfaces of thin films. After that, the samples were heated at 100 °C for 3 h to remove moisture.
3. Results and Discussion
3.1. Relative Permittivity
Figure 2a–c demonstrates the relative permittivity–frequency curves of pure, 1%, and 2% ferrocene doped PVK samples in the frequency range 1 Hz–1 MHz and at different temperatures (313–413 K). It is observed that the
values are decreased sharply, as the frequency increases. An intermediate plateau is observed between lower and higher frequencies in case of PVK and 1% ferrocene doped PVK samples. All curves show similar exponentially decreasing trends at different temperatures as a function of the logarithm of angular frequency. The same behavior is obtained for pure and doped samples of PVK.
The observed behavior of
can be ascribed to the fact that the dipoles orient in the direction of the applied field at low frequencies. At higher frequencies, the dipoles are unable to rotate swiftly. As a result, the oscillations of dipoles lag behind as compared to the field. The dipoles are completely unable to follow the field at more higher frequencies. Thus, all slow polarizations are ended, and the
archives constant value due to the interfacial polarization only [
18]. Another reason for the decrease in
values could be the decreased polarization ascribed to charge accumulation. The theory of Dissado and Hill also explains this behavior, that a single cluster dipole moment relaxation takes place at high frequency [
19]. The Jonscher’s power law (
, where
) can also explain the behavior of
at higher frequencies [
20].
In doped samples, the free charge carriers are generated at sample interfaces and contributed to the ionic conductivity enhancement. The amount of accumulated charge enhances due to the polarization of the polymer/metal interfaces. The polarization sums up an extra role to the charge quantity. Therefore, the
values of the doped samples (1% ferrocene doped) are higher than the pure polymer [
21]. This explanation is proven by the experimental results of the present study.
Figure 2d shows the
variation as a function of frequency for pure and doped PVK thin films at temperature of 413 K. It is observed that the
value increases with ferrocene doping concentration up to 1%. However,
value decreases for higher ferrocene doping concentration (2%). It can be concluded that the 1% ferrocene doping in PVK is critical doping concentration. The change in the tendency of curve from 1% doped PVK to 2% ferrocene doped PVK is definitely not due to any major structural phase transformation, as the ferrocene has a good thermal stability up to 400 °C [
22]. In addition, the electropolymerization in PVK may result cross-linked polycarbazole units, and it can be implemented as both hole injection layer and hole transport layer [
23,
24]. Moreover, the cyclopentadienyl ring in ferrocene is partially negatively charged and is susceptible to electrophilic substitution reaction [
25]. Therefore, it is easy to introduce a donor group to ferrocene. This indicates that there is a possibility of formation of network-like structure by the crosslinking of ferrocene and PVK. With the increase in ferrocene percentage in PVK, the number of free dipole units at the interfacial region decreases due to polymerization. Thus, the interfacial contribution at low frequency range minimal resulting a different trend in permittivity curve.
Figure 3a–c exhibits the temperature dependence (313–413 K) of
at different frequencies for pure, 1%, and 2% ferrocene doped PVK, respectively. It is seen that the
increases as the temperature increases at lower frequencies and decreases at higher frequencies. The comparative
variation as a function of temperature for pure and doped PVK at frequency 100 kHz is shown in
Figure 3d. It is observed that the
value increases with doping concentration as a function of temperature. The temperature dependence of
, representing the decreasing trends initially for all samples at low temperature 313 to 353 K, maybe due to the existence of water molecules in the samples. At high temperatures 353 to 413 K,
sharply increases. The decrease in
with temperature can be attributed to the fact that dipoles in polar are unable to orient themselves at lower temperatures. However, the orientation of dipoles is facilitated as the temperature is raised. Thus, orientational polarization increases and contributes to the increase in
.
3.2. Dielectric Loss
Figure 4a–c represents the loss factor versus log frequency for pure, 1%, and 2% ferrocene doped PVK samples at different temperatures (313–413 K). The behavior of
values are typical of polymeric materials. The dispersion is widespread and broader than that expected by the Debye theory with a distribution of relaxation times. The second high-frequency region reveals the polarization of numerous dipoles. The figures depict the relation between
(
) and
.
It is observed that the
decreases exponentially with the frequency upsurge for all studied temperatures. It can be seen from figures that the
values are larger at higher temperatures in the low frequency region. However, the
values at different temperatures are almost similar in the high frequency region. These figures are also representing frequency dominant relaxation.
Figure 4d shows that the comparison between
values of PVK and ferrocene doped PVK thin films.
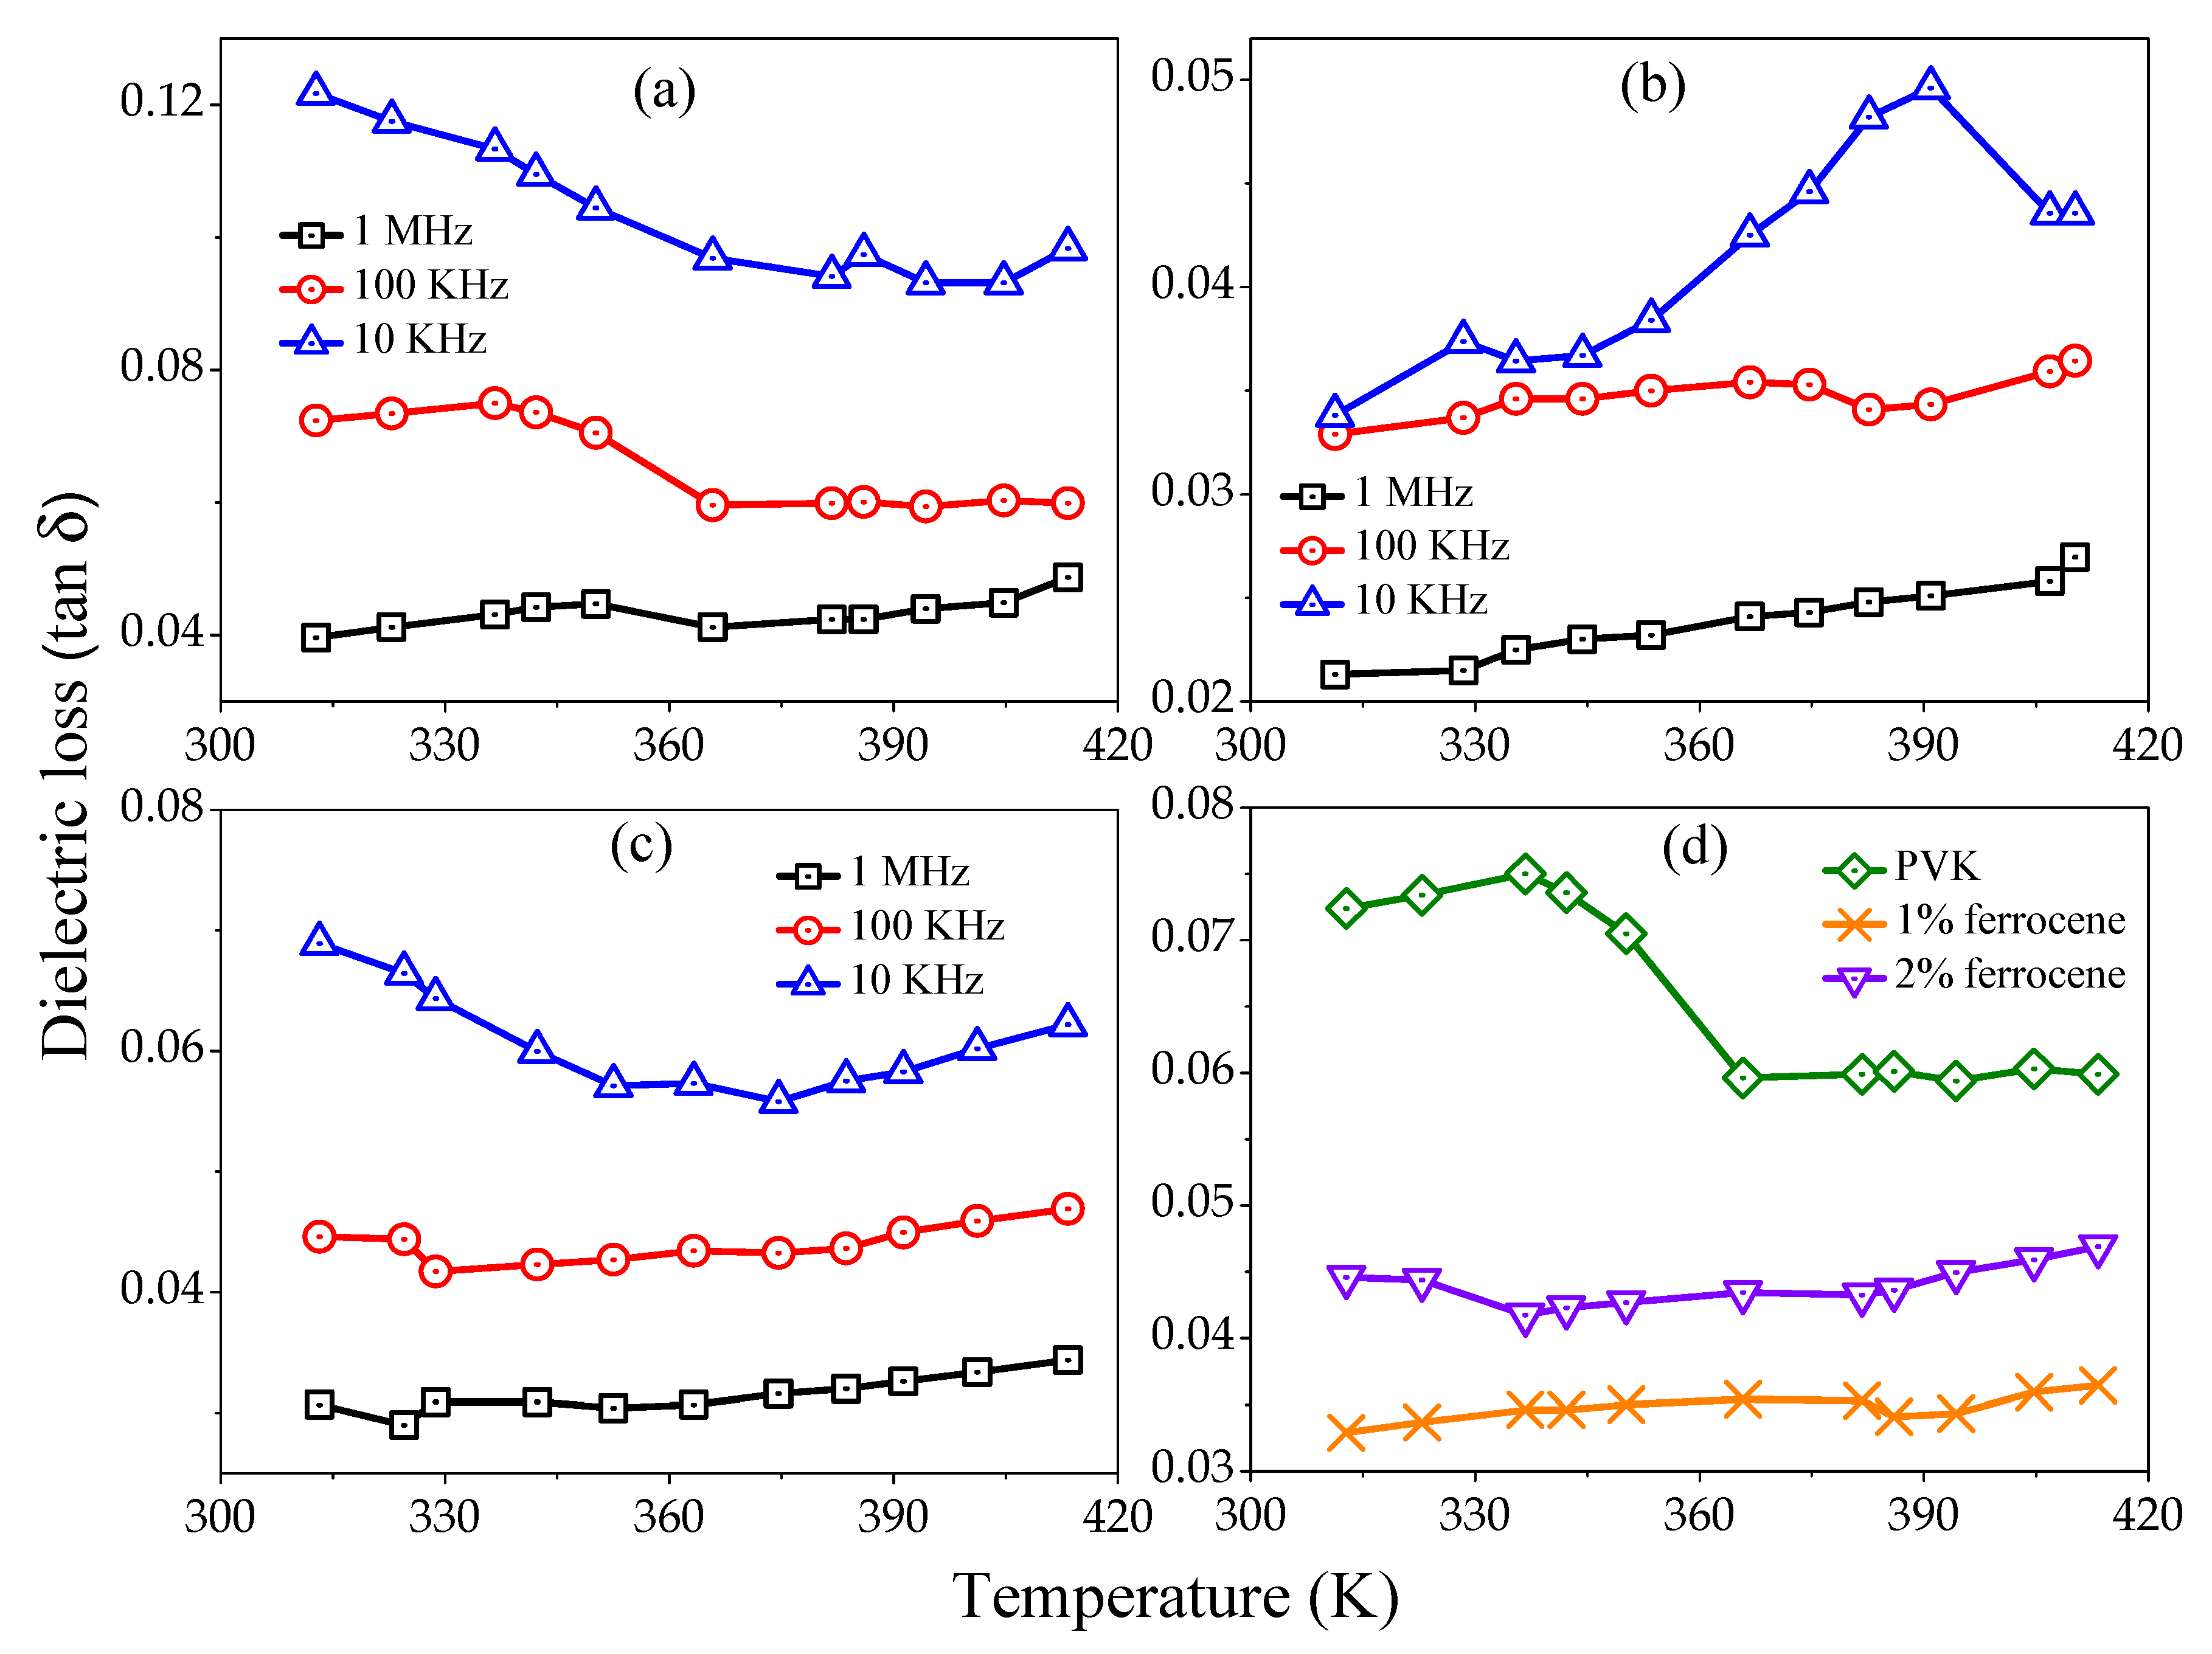
Figure 5a–c represents the tangent loss variation versus temperature for pure, 1% and 2% ferrocene doped PVK samples at several frequencies (1 MHz, 100 kHz, and 10 kHz). All curves show, increase in loss tangent with temperature but record decrease with increasing frequencies.
Figure 5d shows a comparative loss tangent as a function of temperature for pure and ferrocene doped PVK at 100 kHz frequency. The decreased
values with frequency show the reduced number of charges and delay in dipoles settling due to very short time availability (one-half cycle of alternating voltage). The other probability may be the interfacial polarization of injected and included charges at the crystalline-amorphous interface. The polymers usually have loss factors of less than 0.1 at temperatures well below glass transition temperature (
) [
26].
3.3. AC-Conductivity
Figure 6a–c shows the relationship between ac conductivity (
) and of frequency at different temperatures (313 to 413 K) for pure, 1%, and 2% ferrocene doped PVK, respectively. It is found that conductivity increases as frequency increases at fixed temperatures and pronounced dispersion has been observed at lower frequencies. All curves of
versus
show approximately similar nature of increasing trends.
Figure 6d shows the comparative variation of
as a function of frequency for pure and doped PVK samples at temperature of 413 K. The
value increases with increasing ferrocene concentration. It is presumed that an electrically conducting path and network could be molded in the doped samples by increasing fillers’ concentration [
22]. An AC field of sufficiently high frequency may cause a net out of phase polarization. This results in an increase in conductivity at a higher frequency.
The frequency dependent conductivity behavior at constant temperature is investigated on the basis of on the power relation proposed by Jonscher [
20].
where
is the total conductivity,
the frequency-independent conductivity, i.e.,
, and
depends on temperature. In the lower frequency region, the exponent
rises with the increase in temperature. The value of
varies in the range 1.5 to 2 and in the range 0.1 and 0.5 for lower and higher frequency regions, respectively. The value of
increases with the
n the ferrocene doping may be ascribed to the surface morphology and consistent dispersion of the ferrocene in the PVK matrix, which improves charge conduction at the polymer-ferrocene interface.
Figure 7a–c shows the variation of
with the temperature at various fixed frequencies (1 MHz, 100 kHz, and 10 kHz) for pure, 1% and 2% ferrocene doped PVK. It is observed that the
values for all samples are larger at higher frequencies.
Figure 7d shows the variation of
as a function of temperature for pure and ferrocene doped PVK samples at fixed frequency 100 kHz. It is also clear from figures that magnitude of
increases as temperature increase from 313 K to 413 K. However, the effect of frequency on
is significantly less at higher temperatures. It can be concluded that the conductivity of studied samples is bulk limited or field-dependent, mostly at lower temperature regions.
The increase in
may be associated with the increase in relative permittivity for the ferrocene doped PVK thin films. In doped samples, occurrence of newer complexes may be ascribed to the enhanced
ε′ as well as
. The introduction of localized states can be responsible for increased conductivity on ferrocene doping. The ferrocene molecules can diffuse strongly in the polymer structure due to the smaller molecular size. Moreover, it is claimed that the ferrocene addition creates extra hopping sites for the charge carriers and henceforth upsurge the conductivity (
Figure 7d).
4. Conclusions
In summary, pure and ferrocene doped PVK thin films are successfully prepared using the isothermal solution casting technique. The dielectric parameter exhibits frequency dispersion behavior, which suggests all types of polarization present in the lower frequency range. It is observed that the ε′ is maximum, is minimum, and is minimum for 1% ferrocene doped PVK than that of pure PVK and 2% ferrocene doped PVK thin films. Hence, it can be concluded that the ~1% ferrocene is the critical doping point for PVK. The influence of temperature on the ε′, , and is not very significant over the investigated temperature range (313 to 413 K). The temperature effect is more pronounced in the low-frequency region. The conductivity of PVK is increased as the ferrocene dopant concentration of increases up to 2%. The higher conductivity is related to the additional hopping sites for the charge carriers.
Author Contributions
Conceptualization, H.C.N. and S.R.; methodology, H.C.N., S.S.P. and R.P.K.; validation, H.C.N., S.S.P. and R.P.K.; formal analysis, H.C.N. and S.R.; investigation, H.C.N., S.S.P. and R.P.K.; resources, H.C.N., S.S.P. and R.P.K.; data curation, H.C.N., S.S.P. and R.P.K.; writing—original draft preparation, H.C.N. and S.S.P.; writing—review and editing, S.R.; supervision, project administration, and funding acquisition, H.C.N. and S.R. All authors have read and agreed to the published version of the manuscript.
Funding
This research received no external funding.
Institutional Review Board Statement
Not applicable.
Informed Consent Statement
Not applicable.
Data Availability Statement
The data presented in this study are available on request from the corresponding author.
Conflicts of Interest
The authors declare no conflict of interest.
References
- Mbarek, M.; Sagaama, L.; Alimi, K. New copolymer involving PVK and F8BT for organic solar cells applications: Design, synthesis, characterization and theoretical studies. Opt. Mater. 2019, 91, 447–454. [Google Scholar] [CrossRef]
- Gustafsson, G.; Cao, Y.; Treacy, G.M.; Klavetter, F.; Colaneri, N.; Heeger, A.J. Flexible light-emitting diodes made from soluble conducting polymers. Nature 1992, 357, 477–479. [Google Scholar] [CrossRef]
- Mbarek, M.; Almoneef, M.M.; ben Saleh, Y.; Alimi, K. Organic optoelectronic copolymer involving PVK and F8T2: Synthesis and characterization. Spectrochim. Acta A Mol. Biomol. Spectrosc. 2021, 252, 119509. [Google Scholar] [CrossRef] [PubMed]
- Nakagawa, K.; Ishida, Y. Dielectric relaxations and molecular motions in poly (vinylidene fluoride) with crystal form II. J. Polym. Sci. Polym. Phys. Ed. 1973, 11, 1503–1533. [Google Scholar] [CrossRef]
- Jamal, M.; Sarac, A.S.; Magner, E. Conductive copolymer-modified carbon fibre microelectrodes: Electrode characterisation and electrochemical detection of p-aminophenol. Sens. Actuators B Chem. 2004, 97, 59–66. [Google Scholar] [CrossRef]
- Li, T.; Fukuyama, H.; Yamagata, Y.; Lan, H.L.; Kido, J. Organic electroluminescent devices using europium complex-doped poly (N-vinylcarbazole). Polym. Adv. Technol. 2004, 15, 302–305. [Google Scholar] [CrossRef]
- Li, B.Z.; Tamada, M.; Koshikawa, H.; Kimura, Y.; Suwa, T.; Seguchi, T. Radiation polymerization of N-vinylcarbazole and electroluminescent behavior of poly (N-vinylcarbazole). Polymer 2000, 41, 7043–7049. [Google Scholar] [CrossRef]
- Kumari, S.; Kushwah, K.K.; Dubey, S.; Ramrakhiani, M. Studies on CdSe/PVK nanocomposites films for electroluminescent display applications. Opt. Mater. 2019, 97, 109319. [Google Scholar] [CrossRef]
- Wang, S.; Yang, S.; Yang, C.; Li, Z.; Wang, J.; Ge, W. Poly (N-vinylcarbazole)(PVK) photoconductivity enhancement induced by doping with CdS nanocrystals through chemical hybridization. J. Phys. Chem. B 2000, 104, 11853–11858. [Google Scholar] [CrossRef]
- Tang, W.; He, H.; Shi, J.; Cao, B.; Yang, C.; Fan, C. Poly (N-vinylcarbazole)(PVK) as a high-potential organic polymer cathode for dual-intercalation Na-ion batteries. Org. Electron. 2019, 75, 105386. [Google Scholar] [CrossRef]
- Bouriche, O.; Bouzerafa, B.; Kouadri, H. Electrochemical, optical and morphological properties of poly (N-vinylcarbazole/TiO2) and (N-vinylcarbazole/aniline)/TiO2 copolymer prepared by electrochemical polymerization. e-Polymers 2018, 18, 111–122. [Google Scholar] [CrossRef]
- Ye, T.; Chen, J.; Ma, D. Electroluminescence of poly (N-vinylcarbazole) films: Fluorescence, phosphorescence and electromers. Phys. Chem. Chem. Phys. 2010, 12, 15410–15413. [Google Scholar] [CrossRef] [PubMed]
- Song, M.; Park, J.S.; Kim, C.H.; Im, M.J.; Kim, J.S.; Gal, Y.S.; Kang, J.W.; Lee, J.W.; Jin, S.H. High efficiency, solution-processed, red phosphorescent organic light-emitting diodes from a polymer doped with iridium complexes. Org. Electron. 2009, 10, 1412–1415. [Google Scholar] [CrossRef]
- Qian, L.; Bera, D.; Holloway, P.H. Effects of ultraviolet light irradiation on poly (vinlycarbazole). Appl. Phys. Lett. 2008, 92, 31. [Google Scholar] [CrossRef]
- Miyairi, K. Frequency-dependent dielectric breakdown in thin polyvinylcarbazole films. Jpn. J. Appl. Phys. 2003, 42, 5153. [Google Scholar] [CrossRef]
- Clergereaux, R.; Seguy, I.; Jolinat, P.; Farenc, J.; Destruel, P. Electronic conduction in electropolymerized carbazole thin films. J. Phys. D Appl. Phys. 2000, 33, 1947. [Google Scholar] [CrossRef]
- Shah, S.; Singh, D.; Qureshi, A.; Singh, N.L.; Singh, K.P.; Shrinet, V. Dielectric properties and surface morphology of proton irradiated ferric oxalate dispersed PVC films. Indian J. Pure Appl. Phys. 2008, 46, 439–442. [Google Scholar]
- Saha, S.; Sinha, T.P. Dielectric relaxation in SrFe1/2Nb1/2O3. J. Appl. Phys. 2006, 99, 014109. [Google Scholar] [CrossRef]
- Dissado, L.A.; Hill, R.M. Anomalous low-frequency dispersion. Near direct current conductivity in disordered low-dimensional materials. J. Chem. Soc. Faraday Trans. 2 Mol. Chem. Phys. 1984, 80, 291–319. [Google Scholar] [CrossRef]
- Ngai, K.L.; Jonscher, A.K.; White, C.T. On the origin of the universal dielectric response in condensed matter. Nature 1979, 277, 185–189. [Google Scholar] [CrossRef]
- Dweck, J.; Andrade, B.; Monteiro, E.; Fischer, R. Thermal characterization of polymeric plaster composites. J. Therm. Anal. Calorim. 2002, 67, 321–326. [Google Scholar] [CrossRef]
- Didier, A. Why is Ferrocene so Exceptional? Eur. J. Inorg. Chem. 2017, 2017, 6–29. [Google Scholar]
- Jegadesan, S.; Advincula, R.C.; Valiyaveettil, S. Nanolithographic electropolymerization of a precursor polymer film to form conducting nanopatterns. Adv. Mater. 2005, 17, 1282–1285. [Google Scholar] [CrossRef]
- Baba, A.; Onishi, K.; Knoll, W.; Advincula, R.C. Investigating Work Function Tunable Hole-Injection/Transport Layers of Electrodeposited Polycarbazole Network Thin Films. J. Phys. Chem. B 2004, 108, 18949–18955. [Google Scholar] [CrossRef]
- Dai, L.X.; Tu, T.; You, S.L.; Deng, W.P.; Hou, X.L. Asymmetric Catalysis with Chiral Ferrocene Ligands. Acc. Chem. Res. 2003, 36, 659–667. [Google Scholar] [CrossRef]
- Dang, Z.M.; Zhang, Y.H.; Tjong, S.C. Dependence of dielectric behavior on the physical property of fillers in the polymer-matrix composites. Synth. Met. 2004, 146, 79–84. [Google Scholar] [CrossRef]
| Publisher’s Note: MDPI stays neutral with regard to jurisdictional claims in published maps and institutional affiliations. |
© 2022 by the authors. Licensee MDPI, Basel, Switzerland. This article is an open access article distributed under the terms and conditions of the Creative Commons Attribution (CC BY) license (https://creativecommons.org/licenses/by/4.0/).


