Abstract
Making the Internet of Things “green” has become a major research focus in recent years. The anticipated massive increase in the numbers of sensor and communication devices makes this endeavor even more important, resulting in various solution approaches ranging from energy harvesting to energy efficient routing schemes. In this work, we propose a system that can perform some of the main tasks of the Internet of Things, namely identification and sensing of an indoor moving object, by the means of visible light sensing in combination with off-the-shelf retroreflective foils, without the necessity to place any actively powered components on the object itself. By utilizing the supervised machine learning approach of random forest, we show that these two tasks can be fulfilled with up to 99.96% accuracy. Based on our previous findings in this regard, we propose some advancements and improvements of the overall system, yielding better results in parallel with an increased complexity of the system. Furthermore, we expand the number of performable tasks toward additional movement direction determination. The achieved results demonstrate the applicability of visible light sensing and its potentials for a “green” Internet of Things.
1. Introduction
With the inconvenience of a predicted energy demand of 46 TWh caused by Internet of Things (IoT) devices in 2025 [1], the research activities into methods and solutions to make these devices more “green”, also referred to as Green IoT, have significantly increased in the recent years. The proposed methods range from energy harvesting [2] carried out by the IoT devices to energy-efficient routing schemes in order to allow for longer runtimes of the utilized batteries and accumulators necessary to operate these devices. Nevertheless, although such optimizations reduce the amount of energy usage or, in the best case, can power the device solely by energy harvesting, the problem of e-waste [3] with regard to the utilized batteries and accumulators, but also with the devices themselves, still remains. In [4], three main strategies for turning the world of IoT into a “green” one are described. Namely, the first one, ambient green energy harvesting, is related to the already bespoken usage of different methods (e.g., mechanical, and piezoelectric) to generate the necessary energy. The second strategy, green energy wireless charging, describes the approach of charging the IoT device(s) wirelessly by establishing charging points that solely provide energy produced by sustainable energy production (e.g., wind energy or solar panels). When the IoT device(s) are near such a “green” charging point, they can be wirelessly charged. The third proposed strategy, called green energy balancing, extends the approach of wireless charging in a way that also the devices themselves can charge each other. This leads to the opportunity that, for example, a device that receives “green” energy from one of the charging points can retransmit this energy to devices that are out of the reach of such a charging point. The fact that wireless charging suffers from a low charging efficiency is an important issue in such an approach since, although the energy is produced by sustainable energy sources, a huge portion of this energy is lost due to the inefficient charging process.
In this work, we propose and demonstrate a different strategy, which, by utilizing the technology of backscattered visible light sensing (VLS), can perform some of the main tasks of an IoT, namely the identification and sensing of an indoor moving object in a passive way. Passive in this regard means that no actively powered components (such as Wi-Fi transmitters or sensors) need to be placed on the object under investigation. This relieves the problem of e-waste as well as the anticipated bandwidth limitations of the RF spectrum [5] as a consequence of the predicted massive increase in communicating IoT devices in the future. Furthermore, the possibility to perform these tasks by means of VLS, whilst the parallel operation of the light source for room lighting remains unaffected, can be seen as another efficiency gain.
In recent years, based on the rapid developments in the fields of light-emitting diodes (LEDs), photosensitive devices and associated electronic components, a highly active research field has evolved that utilizes visible light to perform various tasks beyond illumination. Visible light communication (VLC) [6], also known under the abbreviation Li-Fi, is probably the most advanced one among these new applications utilizing the lighting infrastructure. Applications that focus on inferring the position of a user or an object by means of analyzing the impinging light on a photosensitive device are summarized under the term of visible light positioning (VLP). VLP systems can be categorized into active and passive ones [7]. Active means that the user or the object carries a VLP receiver unit, usually consisting of a photosensitive device (e.g., photodiode (PD)), associated electronic circuits (e.g., transimpedance amplifiers) and a processing unit. Passive means that the VLP receiver unit is placed in the infrastructure, e.g., the walls [8], and the floor [9], or it is integrated into the luminaire itself. Approaches where the receiver is collocated next to the light source are also called backscattering systems or non-line-of-sight systems [7].
The line-of-sight in this regard is understood as the straight line between the light source(s) (transmitter) and the photosensitive device(s) (receiver) [7,10]; therefore, non-line-of-sight systems are considered systems in which the light emitted from the light source is not received at the photosensitive device without being reflected at least once.
When the application goes beyond positioning, the more general term of visible light sensing (VLS) is used for the latter arrangement. VLS in its most general specification refers to a technology that performs various tasks, such as pose detection [11] or gesture recognition [12], by analyzing the intensity and/or the spectral composition of the impinging light on the photosensitive device. VLS can be broken down into two main categories: the categories of line-of-sight systems and non-line-of-sight systems [13]. The term “Backscattered VLS” is also often used for non-line-of-sight scenarios. Identical to the descriptions given in the field of VLP, also in the literature regarding VLS, the line of sight is understood as a straight line between the light source(s) and the receiving element(s), and therefore, in non-line-of-sight systems, the emitted light must be at least reflected (or backscattered) once in order to reach the receiving element [13]. In this work, we focus on such a backscattering approach, which again can be divided into two subcategories. These two subcategories are distinguishable by means of whether the object or the person is intentionally equipped with purposive materials (codes) to reflect the light with a distinct intensity and/or spectral composition, or if the object or person remains unmodified (is not equipped with target-oriented codes). The latter consequently means that the reflections are solely based on the geometrical shapes and the “natural” compositions of the object or person’s surfaces themselves. From the viewpoint of comfort, this second subcategory, that leaves the object or person´s surfaces unmodified, is the more favorable one, but has some limitations when different objects that have similar shapes and surface compositions have to be distinguished. Therefore, in our work, we focus on the first of these subcategories in which we place so-called “markers” on the object. For the realization of these markers, we chose off-the-shelf retroreflective foils in distinct size configurations, which are cheap and easy to handle and apply. Consequently, we can argue that the utilization of these markers also causes only minimal effort and cost.
This work is an extension and continuation of our previous studies presented in [14,15]. In these studies, we showed that the identification and speed estimation of an indoor moving object can be performed successfully and accurately by means of visible light sensing in a backscattering VLS setup by utilizing the bespoken off-the-shelf retroreflective foils. The main concept of our previous studies and also of this study is that light emitted from the light source impinges on the retroreflective foils and is consequently reflected toward the utilized photosensitive device, collocated in close vicinity to the light source, with no direct line of sight between the light source and the photosensitive device, but with the implication that there is no obstruction present in the path from the light source toward the retroreflective foils, as well as in the path from the retroreflective foil toward the photosensitive element. In [14], we introduced the concept of VLS in combination with retroreflective foils mounted on a moving object, based on an algorithm that computes the Euclidean distance between the stored reference curves and current acquired data in order to perform the tasks of identification and speed estimation. As we describe later in Section 2, we refer to this also as classification since the class to be determined incorporates the applied foil in the applied size configuration (identification) and the inferred speed of the moving object in the respective class name. The moving object is an adapted Lego platform. Basically, a Lego train moves on tracks under a sender/receiver unit that we call the VLS unit. Details of the components and the setup are given in Section 2. Although the algorithm utilized in [14] excelled by its high classification accuracy, it required some complex calculations and was demanding in terms of the necessary memory requirements. In order to reduce the computational complexity and memory demand, we investigated possibilities for the application of machine learning approaches in order to perform the classification. With the results presented in [15], we were able to show that the supervised machine learning (ML) approach of random forest fulfills these requirements and can be used for reducing the computational complexity and memory requirements.
The present manuscript aims on advancing the approach introduced in [15] in order to improve the already good classification accuracy and to simplify the experimental setup by overcoming the necessity to place a light barrier for triggering purposes into the infrastructure (alongside the train tracks). In addition, the movement direction of the train was limited to one direction in our previous work. Here, we expand the number of tasks to be performed by adding also the task of movement direction determination. Furthermore, in the following, we also increase the distance between the VLS unit and the moving object (train) and investigate the achievable classification accuracy when additional ambient light is present. Based on the results of this work, we show that backscattered VLS can be an optimal technology to make battery-powered communication components and sensors on a moving object obsolete, at least for some certain tasks, thus realizing a “green” approach for performing identification and sensing tasks.
Since this manuscript is a follow-up work of [14,15], we already discussed and compared our solution to other related works in the field there.
In ref. [10], it is shown how humans can be detected by means of backscattered visible light sensing, without the necessity of placing markers or distinct materials on the persons. In the presented non-line-of-sight scenarios, the authors investigated not only the effects of different clothing materials and colors, but also showed in a so-called pass-by experiment in a corridor that the task of presence detection can be very well performed by VLS utilizing only a single photodiode as the receiving element. The threshold-based algorithm utilized by the authors is a straightforward solution for performing presence detection with highest accuracy, although different persons performed the experiments. In comparison to this, in our work, in which we place distinct markers on the moving object, we can realize and fulfill the more complex tasks of additional identification, speed estimation, and movement direction determination, while, as described later, by the here-discussed advancements of our system, we can also perform presence detection implicitly. Nevertheless, ref. [10] outlines an interesting future research direction, where the materials and maybe shapes of objects are used to perform in-depth sensing tasks, without the need of distinct markers.
Ref. [16] presents an approach to combine the technologies of VLC and VLS in parallel. By utilizing a low frames per second (FPS) camera, the authors show the feasibility of this combination by using light strobes for sensing and LED on-phases for communication. Based on simulations of such an environment, they outline a method for strobing light-based vibration sensing. The work shows that in future, the borders between VLC, VLP and VLS will deteriorate and that visible light technologies can perform two or more tasks at the same time without negatively affecting one another.
In another study [17], the current authors also demonstrated how the functionalities of VLC and VLS can be applied in parallel. Concretely, we successfully demonstrated the rotation direction determination of a robotic arm by VLS utilizing the same retroreflective foils of the vendors 3M and Orafol, as in this work. In particular, the suggested, and experimentally verified, successful VLC-VLS combination based on time multiplexing between the tasks of VLC and VLS allows to conclude that the combination of VLC and VLS is possible without any mutual interferences between VLC and VLS.
That the general concept of sensing based on backscattered signals is of high interest also for technologies using other ranges of the electromagnetic spectrum, e.g., Wi-Fi, is shown in [18]. In that work, a gesture recognition system is presented, that, based on the channel state information of the Wi-Fi communication procedure, allows to determine the movement of a human hand. In the experimental setup of that study, the hand gesture was performed at a 50 cm to 60 cm distance to a sender–receiver setup, which had a distance of 1 m between the sender and receiver. In comparison to the results presented in that work, with our approach, we can handle also more complex tasks over a larger distance. Furthermore, we would like to argue that in a common setup, Wi-Fi sender and receiver components are not placed in such close vicinity to each other, whilst our setup follows the common placement of light sources, which is parallel to the floor with the light being emitted downward. In contrast to [18], we also verify the applicability of our solution approach in the presence of additional radiation of the same kind, in our case, ambient light.
This article is divided into the following sections. In Section 2, Materials and Methods, we firstly describe the motivation of this work, the used materials and the experimental setup, which largely remained unmodified compared to [15]. In the subsections of Section 2, we subsequently describe in detail the implemented solution approaches for advancing and improving the system. In Section 3, the results of the experiments for movement direction determination as well as for the tasks of identification and sensing the speed are presented for the scenarios without and with additional ambient room lighting being present. In Section 4, we discuss the results and outline future research directions. Section 5 finally summarizes this manuscript.
2. Materials and Methods
As already outlined, this work reports on advancements of the work presented in [15], dealing with the VLS-based classification of retroreflective foils attached on an indoor moving object. The structure of this section is as follows. First, we give a problem formulation to outline the motivation of this work. Then, we describe the “parts” of the solution approach and experimental setup that remained the same in regard to our previous work in Section 2.2. Then, in the separate Section 2.3, Section 2.4, Section 2.5, Section 2.6, we describe in detail the constraints and limitations identified in our previous works and the corresponding solution approaches that were undertaken in this regard for the present study.
2.1. Motivation and Problem Formation
This work follows the clear vision of enabling the fulfillment of tasks, such as identification and sensing parameters of a moving object solely by backscattered visible light, without the necessity of placing wireless sensor nodes on the object itself. We were able to show that the tasks of identification and speed estimation can be achieved in such a way, by utilizing retroreflective foils on the moving object, as shown in [14,15]. In the course of advancing our proposed backscattered VLS approach, we were able to show in [15] that the highly accurate but computationally demanding algorithm utilized in [14] can be replaced by the supervised ML method of random forest. Nevertheless, motivated by our vision, we identified certain issues and limitations in our previous works that need to be addressed in order to take a step further toward applications in which these tasks, that otherwise would require battery- or accumulator-powered devices for communication and sensing, can be achieved in a backscattered “green” way. In this section, we describe the identified problems, which are then addressed in detail in Section 2.3, Section 2.4, Section 2.5 and Section 2.6.
As described in Section 1, our backscattered VLS approach is based on a setup in which the light sources and the photosensitive devices are placed in close vicinity to each other, thus enabling the integration of these components into a compact module, like a luminaire. This approach has the advantage that the installation effort can be reduced since only the existing light source needs to be replaced with a luminaire that integrates also the photosensitive devices. This advantage was weakened to a certain extent in [15] by the necessity of an actively powered light barrier alongside the train tracks in the experimental setup. Overcoming this necessity is the first goal of this work, formulated as follows:
- No additional active powered components are placed in the infrastructure of the setup (alongside the tracks).
- In [15], we restricted the movement direction of the utilized moving object (Lego train) to be always in the same direction. Therefore, extending the sensing capabilities to be able to distinguish between two moving directions is the second goal of this work. Extend the sensing capabilities to determine the moving direction of the train.
- Although we were able to achieve a classification accuracy of 98.8% in [15], one shortcoming was that 86.66% of the misclassifications was caused by the two different red foils out of the, in total, used 8 retroreflective foils. This issue led to the third main motivation of this work. Improve the classification accuracy, especially in regard to the utilized red foils.
In combination with the defined goal of improving the classification accuracy, we can formulate the fourth goal, that this improvement of classification accuracy should be achieved over a larger distance between the moving object and the VLS unit, whilst not extensively increasing the energy demand of the system.
- 4.
- Increase the distance between the moving object and the VLS unit, whilst improving the overall classification accuracy.
- 5.
- Last but not least, the fifth goal of the work presented in this manuscript is to extend the application scenario and investigate the achievable classification accuracy in a use case where additional ambient light, besides the light source on the VLS unit itself, is present. Investigate the effects of additional ambient light and outline a method to distinguish between these use cases.
To summarize, the motivation of this work is to extend the sensing tasks to be performed to achieve a higher classification accuracy over a larger distance, without an extensive increase in energy demand of the system, and to simplify the experimental setup in order to reduce the installation effort.
2.2. Parameters, Materials and Hardware
Retroreflective foils are nowadays widely used, for example, on traffic signs. These foils reflect the impinging light back to its source with only minimal scattering. As in our previous works, we utilized the same off-the-shelf foils from the vendors 3M (production family 4000 [19]) and Orafol (VC170 family [20]). In the case of the 3M family, we use 5 different colors, whilst for the Orafol one, we applied 3 different colors. Table 1 summarizes the utilized foils with the respective vendor name, the color and the production code.

Table 1.
Summary of the utilized retroreflective foils.
Light-guiding microstructures are the basis of both types of foils to achieve the retroreflective characteristics. In addition, unaltered with respect to our previous work, we placed these retroreflective foils in different size configurations on the moving object.
The moving object is the same adapted Lego train (60197 Lego City) that is formed by a black cuboid, which is 22.3 cm in length, 4.7 cm in width and 8 cm in height. The control block, the motor and the wheels with its connected platform were kept in their original state. In order to allow for longer runtimes, we changed the power supply to a rechargeable accumulator with a DC/DC converter.
In the center of the platform, on top of the cuboid, the retroreflective foils were placed in the same way as in [14,15]. The applied size configurations and the corresponding naming were not altered. Table 2 summarizes the size configurations and their corresponding names.
Table 2.
Summary of the size configurations and the name of the size configurations.
In order to be able to directly compare the results of the previous work with the results discussed later in this manuscript, we also used the same speed levels with their corresponding names as given in Table 3.
Table 3.
Applied speed levels and the average velocities of these speed levels.
The applied speed levels largely coincide with the maximum speed levels of robotic platforms used in factory settings [21] or healthcare [22], which highlights the applicability of our work for future applications in regard to moving objects in the context of the IoT.
By utilizing the same foils with the same size configurations and applying the same speed levels of the train, we can furthermore use the same naming conventions as in our previous works. To recapitulate, we defined a scenario as a distinct setup of the train in combination with the applied speed setting. The naming scheme always starts with the vendor of the respective foils at the beginning, 3M or Orafol. Concerning Orafol foils, we only use the abbreviation “O”. The vendor is followed by the color of the respective foil. Then, the size configuration, according to Table 2, is given, which is followed by the applied speed settings of the train; see Table 3. To explain the applied naming scheme with an example, we use the scenario that is called “O red Area 4 Speed 4”. This means that the red Orafol foil in the size of 2.8 cm × 4.7 cm was placed on the train and that the train was moving at an average velocity of ~1.06 m/s.
Concerning the utilized hardware, we reused our self-developed VLS unit as described in [14,15], with the one exception that we changed the light source from a CREE MC-E white LED to a CREE MC-E RGBW LED [23]. Since the footprint on the PCB for the new light source is identical to the previously used LED, this adaption was doable without any major effort. The change of the light source and consequently the change in the spectral power distribution of the emitted light is one of the main solution approaches in order to enhance the number of correct classification results of the different retroreflective foils, especially in regard to the two red foils (3M red and Orafol red), which showed to be the most problematic ones in our previous work. We discuss this in detail in Section 2.6 in this manuscript. We supplied each of the dies of the new CREE MC-E RGBW LED separately with 3.1 V and 150 mA, using a laboratory power supply.
Concerning the sensing device, a Kingbright KPS-5130PD7C [24] RGB sensitive photodiode, the VLS unit remained unaltered. This photodiode has a common cathode and three anodes, which correspond to the different spectral ranges of red, green and blue. We hereafter refer to them as the red channel, green channel and blue channel. Each of these channels is interfaced with a separate transimpedance amplifier (TIA) that converts the photocurrent of the channel into a voltage signal, which consequently can be easily sampled by an analog-to-digital converter (ADC). Please note that due to the internal buildup of the photodiode and the TIAs, a lower voltage signal at the TIA output corresponds to a higher amount of impinging light in the respective spectral range. Consequently, a voltage value of zero at the output of a TIA correlates to a saturation of the respective channel of the photodiode. Furthermore, also the utilized reflectors over the LED (Ledil—CA10928_BOOM) as well as over the photodiode (Ledil—C11347_REGINA) were kept the same as in our previous works. Additionally, we utilized the same Keysight DSOS404A Digital Storage Oscilloscope, where each of the outputs of the three TIAs were connected to a separate channel of the oscilloscope for data acquisition. In order to be comparable with our previous results, we kept the internal sample rate of the oscilloscope at 5 Ms/s and performed a resampling step in GNU/Octave to emulate a lower sampling frequency of 100 kHz. The overall workflow of data acquisition, signal processing, feature generation and the final classification were done identically to [15]. When the triggering event (see later in Section 2.3) is initiated, the oscilloscope stores the acquired data 1 s before the triggering event and 1 s after the triggering event. This results in 10,000,000 samples for all three color channels, which are stored in a binary file format to form the respective dataset. In the following, these separate binary files are named as runs. An inbuilt function of the Keysight oscilloscope was used for the storing of the dataset to a file. These samples correspond in total to a time period of 2 s. The binary file format was chosen for easy import into the GNU/Octave program. Following the workflow described in Section 3, once all the defined files are generated and stored, they are transferred to a standard laptop for further processing. After import in GNU/Octave, the samples of the three color channels are immediately resampled, which reduces the data to 200,000 samples per color channel. After resampling, also the signal processing and feature generation can be performed in GNU/Octave. Finally, the implemented GNU/Octave script generates a CSV file storing the respective features. Identical to [15], we subsequently utilized the Orange Machine Learning Tool developed by the Bioinformatics Lab at the University of Ljubljana, Slovenia [25], for the generation and testing of the random forest model.
In the following, we discuss in detail the constraints and limitations identified based on our previous works and describe the solution approach applied to advance our system.
2.3. Advancing the Experimental Setup
The experimental setup in our previous work consisted of the aforementioned VLS unit, incorporating the LED as the transmitter and the RGB photodiode as the receiver. The moving object, the Lego train, equipped with the retroreflective foils moves on the train tracks that resemble the shape of the number zero with the straight parts of this track layout, being 115 cm in length. The VLS unit is placed on a metallic bar facing downward toward the rails over one of the straight parts. The VLS unit is aligned with the tracks in a way that the LED and PD are over the center width of the rails. Identical to our previous work, we used the same flooring material under the experimental setup. Figure 1 shows a sketch of the new experimental setup, with the improvements of an increased distance between the VLS unit and the rails, which was 68 cm in our previous work, of 1.1 m, and that no light barrier alongside the track is necessary for triggering purposes, which is discussed in detail in this subsection. Furthermore, also the movement directions applied for the later discussed (see Section 2.4) movement direction determination are included in Figure 1.
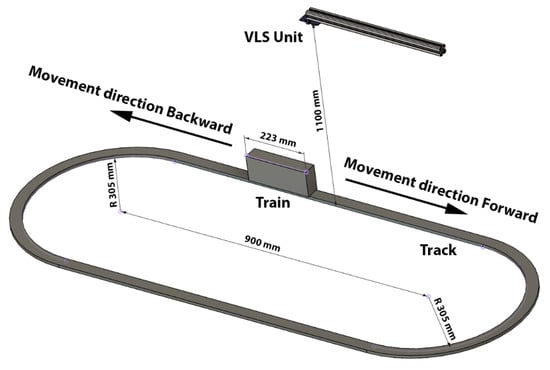
Figure 1.
Sketch of the improved experimental setup.
As mentioned earlier, we changed the LED type in our VLS unit to a CREE MC-E RGBW LED. With this modified experimental setup (different LED type, increased distance) and with the described applied power supply setting, this now results in an illuminance of ~500 lux at the surface of the reflective foils on the train. Figure 2 shows the spectral power distribution of the impinging light on the surface of the train on the base of the applied LED. The spectral power distribution as well as the lux value were measured with a handheld MK350S PREMIUM spectrometer.

Figure 2.
Spectral power distribution of the light impinging on the surface of the train (only the LED of the VLS unit as a light source).
In our previous experimental setup, a self-developed, so-called light barrier, consisting of an infrared LED and an associated infrared sensitive photodiode, was placed alongside the train tracks in order to trigger the data acquisition when the train moves through the light barrier. Although this light barrier is a straightforward and simple way to detect the triggering event, it also bears a certain drawback since additional components have to be placed in the infrastructure, in this case, alongside the track. In this work, we realized a solution approach to detect the triggering event without this light barrier, thus overcoming the issue of additional infrastructural effort.
In order to establish a precise and unique triggering mechanism, we devised the following approach. The retroreflective foils placed on the train affect certain reflectivity parameters and, therefore, “cause” very different output values of the three color channels. Triggering the data acquisition utilizing the reflections of the foils is not a feasible solution since, for example, the green foil “causes” a precise and detectable peak value in the green channel, whilst, for example, the red foil does not cause such a peak value in the green channel. Therefore, according to this example, the triggering event might be detectable in the green channel for the green foils but not for the red foils. This already demonstrates that in order to establish a unique and generally applicable triggering mechanism, we have to use a different approach. Furthermore, the triggering event must not affect the acquisition of the reflected light of the foils. Following these two requirements for performing a unique and generally applicable triggering event that does not affect the foil determination, we devised a solution approach for which we incorporated a specular reflective element on the train. The most straightforward way to establish such an element is to use a mirror. In this work, we used a commercially available plastic mirror, consisting of a plastic body covered with a specular reflective foil, which was cut to the same size configuration as it is defined for Area 1, 0.7 cm × 4.7 cm (see Table 2). This mirror element, which in the following is abbreviated as ME, was then placed at one edge of the train platform. Figure 3 shows the train equipped with the ME and a 3M green foil in the size configuration of Area 4.
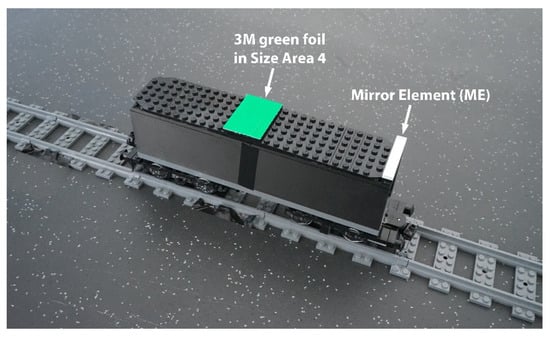
Figure 3.
Lego train equipped with the mirror element and a 3M green foil of size Area 4.
By utilizing the specular reflecting ME, we can anticipate two characteristics, which will fulfill two requirements. First, since the ME will reflect the complete spectrum of the impinging light, in contrast to the colored foils, the resulting reflections will be measurable for all three color channels, and since the reflectivity of a mirror is usually between 80% and 99%, the intensity of the reflected light will also be unique compared to the intensities of the individual colored foils. Second, as the ME is specular reflecting, we can also anticipate that only when the ME is close or directly under the VLS unit, the ME will reflect light back toward the photodiode. This will furthermore result in clear and steep flanks in the acquired data of the color channels over a short time interval. Figure 4a,b shows an exemplary zoomed-in view of the acquired outputs of the three color channels (depicted with their respective channel colors, y-axis) over time, given as sample numbers (x-axis) when the train passes under the VLS unit with the speed setting of Speed 3. Please note that in these figures, the data from the oscilloscope were already resampled, as described before, to emulate a sampling rate of 100 kHz. For these exemplary measurements, the shades of the laboratory room in which the setup was assembled were closed, blocking the sunlight, and also the ambient room lighting was turned off, leaving the LED of the VLS unit as the only active light source during these experiments. In order to make sure that there were no reflections from the utilized colored foils, we only placed the ME on the train (at the position shown in Figure 3). Figure 4a shows the output values for the movement direction Forward and Figure 4b for the movement direction Backward (see Figure 1).
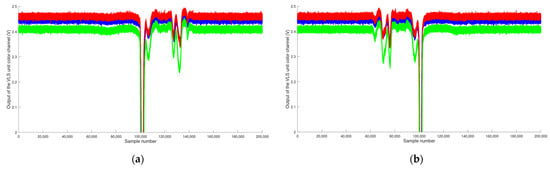
Figure 4.
Outputs of the color channels (V) of the VLS unit. (a) Train with only the ME attached, moving in the Forward direction with Speed 3. (b) Train with only the ME attached, moving in the Backward direction with Speed 3.
From the run of the curves shown in Figure 4, we can clearly observe that our anticipations regarding the utilized ME are correct since the expected clear and steep flanks for all three color channels are clearly deductible. Furthermore, also our second requirement, that the ME will not interfere with the reflections of the foils, is fulfilled, as we discuss in the following. As mentioned before, the train was only equipped with the ME and there were no retroreflective foils placed on the train. When the train is moving in the Forward direction (see Figure 4a), the course of events is as follows. At the beginning of the curve shown in Figure 4a, from sample number 0 to around sample number 80,000, the train is not under or close to the VLS unit; therefore, only the stable reflections from the surroundings are acquired. At sample number 100,000, the Lego train has entered the detection area of the VLS unit and the anticipated clear and steep flanks, due to the ME, can be seen. It is important to point out that, as verified by the measurements and intended in our solution approach, for a triggering mechanism without the need of placing the light barrier in the infrastructure, the flanks are present in all of the three color channels. Thus, we can perform the triggering for the acquisition based on a falling flank detection. As the train moves along with the given speed, a second clear and steep flank occurs (at sample number ~102,000), when the ME moves out of the VLS unit. Since in the moving direction “Forward”, the train platform (black plastic material) reflects most of the light back to the VLS unit, we can observe a period (sample number 102,000 to around 110,000), where the impinging light on the RGB photodiode is a mixture of the reflections from the ME as it almost moved out from the detection area of the VLS unit and the black plastic material. This is followed by the almost stable reflections from the black material when the “main body” of the Lego platform is under the VLS unit (see sample numbers 110,000 to 125,000). Please note that no retroreflective foils were placed on the train, but, as we show later, in this “region”, the reflections from the retroreflective foils are acquired once they are attached. From sample number 125,000 to 150,000, when the train has moved out of the detection area of the VLS unit, we can see an effect caused by the mechanical and materials related setup of the train. In this “region” two effects take place. First, as the train moves out of the detection area, the “main body” of the train no longer contributes to the acquired reflections, and the coupler, which is usually used to connect another wagon to the train, enters the detection area of the VLS unit. This coupler has a different surface structure than most parts of the train, where the surface is structured with the known connection knobs typical for Lego. This is clearly observable with the bare eyes as shown in Figure 5.
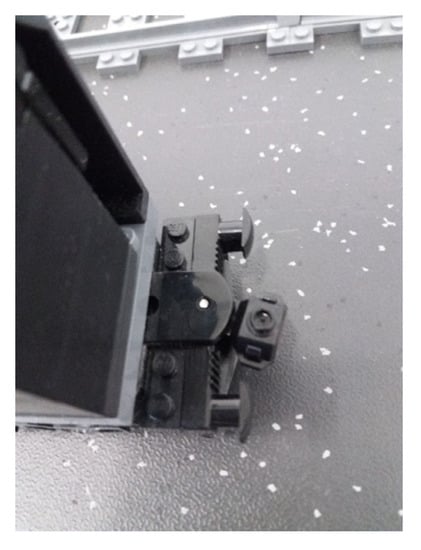
Figure 5.
Train coupler element.
This completely different surface structure leads to the effect that, in comparison to the “main body” of the train, an increased portion of light is reflected back to the RGB photodiode. The reason why this coupler now has a bigger impact is the changed spectral power distribution (see Figure 2). In our previous work, where a white LED was used, the reflections from this coupler were negligibly low. It is clear that this effect depends on our chosen experimental setup and the moving object used. In this work, the approach was chosen such that these reflections are not filtered or mitigated but accepted as an unavoidable fact. This approach follows the argument that in every possible application of retroreflective foils in combination with VLS, the form and material of the moving object (for example, robotic automated vehicles) will have some influence on the reflections but can be, to a certain extent, accepted as is, as long as these reflections are not overwhelmingly strong.
When comparing Figure 4a,b, we can also see that the ME provides clear and steep flanks, independent of the moving directions of the train. Additionally, it can be clearly observed that the acquired outputs of the three color channels are also very similar in regard to the voltage signals, but that they are basically mirrored in regard to the time-axis. This is, of course, a consequence of the opposite movement direction, where in the Backward direction, first the mentioned coupler enters the detection area of the VLS unit, then the “main body” and then the ME. This symmetry is, in the following, exploited for the movement direction determination, described in Section 2.4, and for the feature generation, described in Section 2.5 of this manuscript.
In order to show that, as our second requirement, utilizing the ME does not interfere with the determination of the retroreflective foils, we want to exemplarily show the acquired outputs of the three color channels (in their respective colors, y-axis) over time, given as sample numbers (x-axis) in Figure 6, for the case that the train is additionally equipped with the retroreflective foils. For this example, we chose the setup as shown in Figure 3, where the 3M green foil in the size configuration of Area 4 is placed on the train. The speed of the train was again set to Speed 3, and the movement direction was Forward.
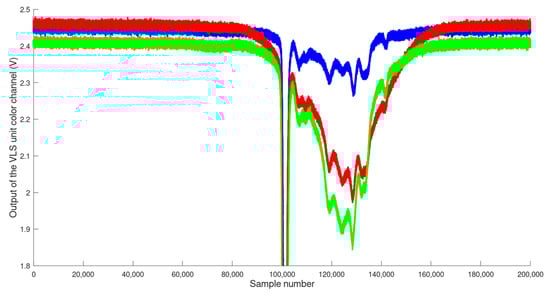
Figure 6.
Output of the VLS unit color channels (V) in the scenario of 3M green Area 4 Speed 3 moving in the Forward direction.
From Figure 6, we can clearly observe that also our second requirement, that the ME does not interfere with the reflections from the foils, is fulfilled. Furthermore, we can also see that the described effects at the front parts of the train (see sample number 100,000 to around 110,000) are still present. Nevertheless, the effect of the coupler at the end of the train is not that pronounced anymore since the reflections from the 3M green foil overlap the reflections from the coupler to a large extent.
To summarize this section, by incorporating a specular reflective element on the train, which consists of a plastic body covered with a specular reflective foil, we can overcome the necessity to place an additional light barrier into the infrastructure of the setup (alongside the tracks). Furthermore, we showed that this ME provides a clear steep triggering signal and that it does not interfere with the acquisition of the reflections from the retroreflective foils.
2.4. Determination of the Movement Direction
In our previous work, we did not include the determination of the movement direction of the train into our system; thus the train was always moving in the same direction. In the here-discussed advanced system, we show that also the movement direction determination can be realized as an additional task by the means of VLS. As already indicated in Figure 1, the moving object can now have two moving directions, Forward and Backward.
In order to realize a direction determination procedure of low complexity, we devised the solution approach to exploit the reflections from the ME in combination with the given overall train setup. As shown in Figure 4a,b, the acquired reflections from the ME are unambiguously clearly observable in the acquired output values of the three color channels. Furthermore, we can also see that the acquired outputs of the color channels are almost symmetrical. This symmetry is the main starting point for our solution approach. Depending on the movement direction, we can observe that there is a transition phase for the example when the train is moving Forward, where first only the reflections from the environment are acquired, followed by the clear and steep flanks from the ME element and then the reflections from the main body of the train. As shown in Figure 6, this effect is also clearly present, independent of the circumstance of whether there is a retroreflective foil placed on the train or not. When the train is moving Backward, the described sequence is exactly the other way around, first reflections from the main body, then the ME element followed by the reflections from the environment, since the train has left the detection area of the VLS unit.
In order to exploit this fact, we implemented a movement direction determination process. At first, a self-developed algorithm determines the positions in terms of sample numbers of the two flanks “caused” by the ME. In the following, we name them Flank 1 and Flank 2. Flank 1 (falling flank) occurs when the ME enters the main detection area of the VLS unit and Flank 2 when the ME leaves it. The algorithm is based on building the difference from one sample (sample number n) to the sample with the sample number n + 50. A negative difference yields a falling flank and a positive difference value a rising flank. From this simple algorithm, we follow that the lowest negative difference indicates the steepest part of the falling flank, and the highest positive difference value indicates the steepest part of the rising flank. Once these minimum and maximum values are found, the corresponding sample numbers are consequently defined as the positions of Flank 1 and Flank 2. From the positions of these two flanks, we now calculate the mean values of the red color channel of 10,000 samples before Flank 1 and 10,000 samples after Flank 2. These two mean values are hereafter referred to as Mean_Flank1 and Mean_Flank2. For a simpler graphic explanation, please see Figure 7, where we show Flank 1 and Flank 2 (dotted black lines) as well as the periods for the calculations of Mean_Flank1 and Mean_Flank2 (labeled greyish areas) for the red channel of the data used for Figure 4a, in a zoomed-in view.

Figure 7.
Zoomed-in view of the red channel of the VLS unit with the labeling for the flanks and the periods for the calculation of Mean_Flank1 and Mean_Flank2.
With the calculated values of Mean_Flank1 and Mean_Flank2, and a simple if statement, the direction can be determined. If the value Mean_Flank1 is larger than Mean_Flank2 (as depicted in Figure 7), the train is moving in the Forward direction. If Mean_Flank2 is larger than Mean_Flank1, then the movement direction is Backward. This simple method of determining the movement direction could be applied for all three color channels, but in order to reduce the computational effort, we only perform the flank determination and the calculation of Mean_Flank1 and Mean_Flank2 for the red channel.
2.5. Random Forest Model and Feature Generation
Since the results presented in [15] showed that the supervised machine learning approach of random forest is a good candidate for our application at hand, we also use this method in the present study. In supervised learning, the common approach is that a set of features, describing a class, is presented to the algorithm during the training phase. The output of the training phase is a model that extracts regularities of the features that subsequently can be used in the online phase to predict the class of an unknown feature set.
Among the manifold of approaches in supervised learning, the random forest algorithm is a popular approach that has been shown to provide stable results with high accuracy and ease of use. A random forest model is based on the combination of multiple decision tree classifiers, as the name already suggests. A decision tree classifier can be explained as a set of hierarchical nested if–else statements, where the if–else statements applied to the features represent the branches of a tree and the classification result corresponds to a leaf on the specific branch. Therefore, in order to reach a classification result with a decision tree classifier, one can imagine that, based on the given features, the established decision tree model is passed through from the trunk of the tree until a class (leaf at the end of a branch) is reached. This class is then represented as the classification result of this decision tree. Since the random forest approach is based on a multitude of such established decision trees, the classification result is reached by a majority vote amongst the separate trees. The class that has the most votes among the trees of the forest is presented as the final classification result.
In order to generate the random forest model, we have to define the classes to be determined as well as the features used for describing the class. In this work, we used the described scenarios as the classes to be determined. Since the scenario (class) incorporates the vendor of the foil, the color of the foil, the applied size configuration and the speed of the train, the classification implicitly fulfills the task of identification and speed estimation.
In terms of the classes (scenarios) to be determined, we generated our random forest model with 128 different classes since we utilized 8 different foils, with each foil in 4 different size configurations at 4 different speeds. In order to exemplify the 16 different (4 sizes at 4 speeds) classes generated for a single foil, please see Table 4, where, exemplarily, the 16 classes generated for the Orafol red foil are given.
Table 4.
Example of the different classes generated for the Orafol red foil.
Table 4 shows the generated classes for one foil. Since we utilized 8 foils, this matrix, given the generated classes, basically can be built 8 times in total, with the difference of the utilized foils (left upper corner), thus, resulting in the classes of, for example, 3M green Area 1 Speed 1, 3M green Area 1 Speed 2 and so forth.
As described in the previous Section 2.4, we improved our system in order to also be able to determine the movement direction of the train, meaning that the train is either moving Forward or Backward. For the random forest model generation, this leads to the fact that, when the train is moving Backward, the time period in which the reflections from the foils are acquired is not equal to that time period in which the train is moving Forward. In order to resolve this issue, we devised the solution approach to exploit the symmetry of the acquired reflections (as can be seen by comparing Figure 4a,b). In principle, this means that when the comparison of Mean_Flank1 and Mean_Flank2 states that the train was moving Backward, we basically take the data for the feature generation from before the triggering event. This has to be done because in the Backward moving direction, the reflections from the foils are acquired before the triggering event, whilst in the Forward moving direction, the reflections occur after the triggering event. For this, we reuse the determined positions of Flank 1 and Flank 2. To illustrate this graphically in the case of Figure 4a, we use the acquired output values to the right from the position of the rising flank (Flank 2) along the x-axis, whilst in Figure 4b, we use the data starting from the falling flank (Flank 1) to the left along the x-axis. In this work, we used 50,000 samples, corresponding to 500 ms, either starting from the position of Flank 2 onward or for 50,000 samples before the position of Flank 1. Please note that, as described before, the 50,000 samples were selected based on the determined movement direction of the train. To give an example, let us assume that the position of Flank 1 is determined at sample number 100,000 (out of the total 200,000 samples) and that Flank 2 is determined at sample number 102,000. If the movement determination yields that the train was moving Forward, the features are created from the data with the sample numbers from 102,000 until 152,000, for the corresponding color channel. In the case that the movement is determined as Backward, the samples numbered 50,000 until 100,000 are used for the feature generation. In the following, we would like to introduce the term of sample number range, which, based on the movement direction determination, as described, ranges as 50,000 samples before the position of Flank 1 or 50,000 samples after the position of Flank 2. By applying this approach, we do not have to incorporate additional features or classes in our random forest model to deal with the different movement directions. Nevertheless, this approach makes a correct movement direction determination the decisive factor for the feature generation process and consequently the achievable classification accuracy. This is based on the fact that a wrongly determined movement direction would give reason for features created from a sample number range determined when only the reflections from the environment are present.
In terms of features, describing a scenario (class), in our previous work [15], we used the following 9 calculated features: Min_Green, Mean_Green, Min_Index_Green, Min_Red, Mean_Red, Min_Index_Red, Min_Blue, Mean_Blue and Min_Index_Blue. The features of Min_Green, Min_Red and Min_Blue for the respective color channels are the respective minimum values, determined in the sample number range defined by the movement direction determination. These minimum values are strongly dependent on the used foils and the size configurations of the foils and, therefore, are a good measure of the foil (relation of the three color channels to each other) and the size configuration of the foil that was used (value of the minimum). The second set of features, identical to [15], that we use in this work are Mean_Green, Mean_Red, and Mean_Blue. These features are formed by calculating the mean value for every color channel in the defined sample number range. In contrast to [15], we do not use the features of Min_Index_Green, Min_Index_Red and Min_Index_Blue in this work. In our previous work, these three features were mainly responsible for determining the speed level of the train but were also influenced, of course, by the size configuration of the foil.
In this work, we have the possibility to generate a feature that, independent of the utilized foil and its size configuration, renders a good measure for the velocity of the train. This feature is generated once again from the reflections “caused” by the ME. Since we know the sample numbers of Flank 1 and Flank 2, the difference of these two values strongly depends on the velocity of the train, since it is obvious that when the train moves slower, the time period (and consequently, the number of samples) during which the ME reflects the light back toward the VLS unit is longer than in the case when the train moves faster. This feature hereafter is called Diff_Flanks, and replaces Min_Index_Green, Min_Index_Red and Min_Index_Blue. Applied to the aforementioned example, the value for Diff_Flanks is 2000. In comparison to our previous work, this replacement reduces the number of features from 9 to 7. Please note, since the flanks are only determined for the red channel, also the feature Diff_Flanks is solely computed based on the data from the red color channel. A summary and a brief description of the defined seven features are given in Table 5.
Table 5.
Summary of the features used in the random forest model generation.
These 7 features are generated for every run of a scenario and stored in a csv file including the name of the corresponding scenario of the class. These csv files are then imported into the Orange Machine Learning Tool, where the random forest model generation and online test are performed.
2.6. Improving the Number of Correct Classification Results
In [15], we were able to show that 98.8% percent of the performed classifications were correct. Nevertheless, we also observed that scenarios utilizing the 3M red and Orafol red foils were responsible for 86.66% of the misclassifications, causing a strong limitation of our classification accuracy. In order to overcome this limitation, we devised the solution approach to change the spectral power distribution of the light emitted from the LED by replacing the before-used white CREE MC-E LED by a CREE MC-E RGBW LED, which provides a much larger spectral contribution in the red spectral range (see Figure 2). This was done in anticipation of the effect that this increase in the red spectral range will consequently lead to better distinguishability between 3M red and Orafol red foils. Besides this simple and easy to perform exchange of the light source, no further actions were executed in order to improve the classification accuracy.
3. Results
In this section, we present the achieved results concerning the tasks of movement direction determination and classification accuracy. Please note that a correct classification of an unknown feature set implicitly goes hand in hand with a correct identification and a correct speed estimation, as described in Section 2. For the first experiments, the overall condition were chosen in a way that the LED of the light source was the only active light source in the laboratory room and that the shades of the windows were completely closed in order to block any sunlight, identical to the experiments performed in [15].
In order to determine the data for the results generation, the following workflow was executed after the initial powering up of the VLS unit. As the first step, the chosen foil (for example, 3M green) is placed on the train at the defined position in the chosen size configuration (exemplarily shown in Figure 3). Please note that the ME was placed on the train at the discussed position and remained unchanged throughout all the performed experiments. Then, in the second step, the train is set to the desired speed setting and the desired movement direction and the movement along the given tracks is initiated. As the train moves through the detection area of the VLS unit, the oscilloscope detects the triggering event from the ME and stores the acquired output values of the VLS unit with the aforementioned resolution in a binary file. After completing a round, the train triggers the acquisition of the oscilloscope again, resulting in the next binary file and so forth. As explained earlier, each of these binary files is considered as one run. For each of the chosen foils, size configurations, speed settings and movement directions, 20 runs were performed. Please note that we also stored the metadata for each run, giving the “ground truth” necessary for determining the correct classifications of the scenarios and movement direction determinations. After finishing the 20 runs, we started over with the first step until all the runs for all the defined combinations of foils, size configurations, speed settings and movement directions were completed. In total, since we performed 20 runs for each of the 8 different foils in 4 different size configurations, performed in 2 different movement directions, this yielded 5120 binary files that were used for the feature generation and online testing. Identical to [15], we split the available data in half, resulting in 2560 binary files used for the model generation and the other half for the online test of the generated random forest.
The subsequent processing and feature generation steps in GNU/Octave were applied to all of the binary files, regardless of whether they were later on used for training or for online testing. After importing the binary file, the data for all the three channels were immediately resampled to emulate the sampling rate of 100 kHz. Then, a moving average over 50 samples was used for data smoothing. In the next step, the positions of the two flanks “caused” by the ME were determined. Then, the described Mean_Flank1 and Mean_Flank2 values were calculated. Based on these values, the movement direction determination was performed. Please note that in order to be able to give the later presented numbers of correct movement direction determinations, we also compared the determined movement directions to the given movement directions from the metadata associated with the respective files. Based on the determined directions, the sample number range for the feature generation was deduced. By adapting the sample number ranges, the resulting features become independent of the already determined movement directions and consequently are only labeled by the scenario name as the class. As explained in Section 2.5, we generated 7 features (Min_Green, Min_Red, Min_Blue, Mean_Green, Mean_Red, Mean_Blue and Diff_Flanks) and labeled these runs of the feature sets with the corresponding scenarios (e.g., O red Area 4 Speed 4). After performing these steps for all the 5120 binary files, this gives reason for 20 runs of the 7 features for every scenario for the training and 20 runs for the online test. As already described, in total, this renders 2560 runs of the feature sets for training and 2560 runs for testing the classification accuracy.
The runs of the feature set are then stored in two separate csv files, one for the model generation (training) and one for the test. Basically, the columns of these csv files hold the features, whilst the rows are the runs. After the import of these csv files in the Orange Machine Learning tool, the model generation and online test, yielding the classification accuracy, can be directly performed.
3.1. Movement Direction Determination
First, we would like to present the achieved numbers in terms of correct determinations of the moving directions. Based on our approach described in Section 2.4, the direction of the train was determined correctly for all the determinations. This demonstrates that our solution approach utilizing the ME element in combination with the given reflections from the train is a robust and straightforward method to fulfill this task. As mentioned earlier, an incorrect determination of the direction would lead to the consequence that the features for this particular run of the scenario are unusable since they would be generated based on wrong underlying data.
3.2. Classification Accuracy—Identification and Speed Estimation Performance
Before the achieved results are presented, the applied parameters for the model generation of the random forest are summarized in Table 6.
Table 6.
Applied parameters for the random forest generation.
In Table 7, the achieved classification accuracies in terms of total applied test scenarios, the total amount of correct classifications, the total number of misclassifications and the percentage of correct classifications are presented.
Table 7.
Classification results for the generated random forest.
These results show that our solution approach improved the number of correct classification results as intended. In our previous work, the total number of misclassifications was 15, whilst in our advanced system, only a single misclassification occurred. Please note that these 15 misclassifications occurred for only the half number of test scenarios (1280). Based on this fact, we can argue that our advanced system shows a much higher robustness in terms of identifying the correct foil in the correct size configuration and the speed level of the train. Furthermore, we would like to point out that these almost perfect results were achieved with an experimental setup, where the distance between the moving object and the VLS unit was increased, the overall impinging light in terms of lux was decreased and, most importantly, without the necessity to place additional components (light barrier) alongside the train tracks.
In order to give more insight into the achieved results, we present the analysis of how distinctly the classification was reached, based on the votes from the 10 separate decision trees in our random forest. This means that, for example, if out of the 10 classification results, 7 trees rendered the correct classification result, we can conclude that this classification was achieved with 70% agreement amongst the separate decision tree classifiers and can be considered as a stable and reliable result. Table 8 shows the tabulation of the 2560 test scenarios subdivided into 3 groups. Every classification that was reached with an agreement amongst the trees in a range between 100% and 70% is assigned to Group 1. Group 2 holds the classifications that were achieved with an agreement between 60% and 50%. A classification result that was reached with an agreement below 50% is assigned to Group 3.
Table 8.
Tabulation of the achieved agreement percentages amongst the decision trees in order to reach the final decision.
These results show that 98% of the classifications are based on very stable majority votes amongst the trees. The decisions in Group 2 are still reached by a stable majority, but already showing some disagreement in the classification process. The test scenarios assigned to Group 3 must be considered as unstable classification results, since the 3 correct classifications (out of the 4 test scenarios in this Group) were only achieved because no other class got more votes than the correct class. In the case of the occurring misclassification, where a 3M red Area 1 Speed 3 was misclassified as an O red Area 4 Speed 3, the votes were allotted in the following way. The correct class of 3M red Area 1 Speed 3 has 2 votes (out of the 10) and the incorrect class of O red Area 4 Speed 3 received 4 votes. The remaining 4 votes were given to 3M red Area 1 Speed2, 3M red Area 2 Speed4, O red Area 4 Speed2 and O yellow Area 1 Speed2. Each of these 4 classes received 1 vote.
Nevertheless, the fact that the speed estimation still was performed correctly can be seen as an advantage that is effected by utilizing the ME element and consequently the newly introduced feature of Diff_Flanks, which gives a good measure for the speed level of the train, regardless of the utilized retroreflective foils in the scenario.
3.3. Classification Accuracy under the Influence of Ambient Light
In order to evaluate the classification accuracy of our system in the case that additional ambient light is present, we identically reran the experiments following the described workflow, including the training and testing. The additional ambient light was introduced by additionally switching on the installed fluorescent tubes in the utilized laboratory room (the window shades remained closed). The resulting spectrum, which is a combination of the spectrum from the LED of the VLS unit and the fluorescent tubes, is shown in Figure 8 (measured with the handheld MK350S PREMIUM spectrometer at the top of the train).

Figure 8.
Spectral power distribution of the light impinging on the surface of the train with the ambient room lighting turned on.
Comparing the spectral power distribution given in Figure 8 with that of Figure 2, we can observe that the spectrum has changed quite strongly, caused by the additional light from the fluorescent tubes.
Table 9 shows the achieved results of our system under the presence of this additional ambient light.
Table 9.
Classification results for the generated random forest.
The results in Table 9 outline that the additional ambient light has some negative effect, but nevertheless still shows a good classification accuracy of 99.41%. In Table 10, a summary of the occurring misclassifications is presented, where in the left column, the real (correct) class of the test scenario is given and in the right column, the predicted class of our generated random forest model is shown.
Table 10.
Summary of the misclassifications.
The 15 misclassifications can be broken down as follows. Of the 15 misclassifications, 7 are related to the 3M green foil in the size configurations of Area 1 and Area 2, which were misclassified (with one exemption) as 3M blue foils. Furthermore, not only were the foil and size configurations misclassified, but also the estimated speed setting was wrong. The next three misclassifications are related to the Orafol red foil in the size of Area 2. In these three cases, the identification was performed correctly, but the speed estimation failed. The same error also occurred for two runs of the scenario O yellow Area 1 Speed 1. The last three misclassifications are related to two Orafol yellow scenarios and one run of Orafol red, where, again, both the identification and speed estimation failed.
These results show that the effect of the ambient light is twofold. On the one hand, due to the changed spectrum, the reflections of the green foil in the smallest size configurations are very similar in terms of the acquired features compared to the 3M blue foil. On the other hand, the ambient light also deteriorates the uniqueness of the Diff_Flanks feature, which is based on the clear and steep flanks originating from the ME. Nevertheless, with an overall classification accuracy of 99.41%, we can argue that our system still renders high robustness for the identification and speed estimation tasks. Additionally, the task of determining the movement direction was still performed with 100% correct results. Possible countermeasures to further improve the classification accuracy also under the presence of ambient light are discussed in Section 4.
3.4. Determining the Applicable Generated Random Forest Model
In our work, we showed that in both experimental settings (firstly, the LED of the VLS unit is the only active light source and, secondly, in addition, also the room lighting is switched on), our general approach to utilize retroreflective foils in combination with a specular reflecting mirror element yields a high number of correct results. The movement direction was determined with 100% correctness in both settings; for the tasks of identification and speed estimation, the accuracies were 99.96% and 99.41% in terms of correct classifications. This raises the question of whether our system can also determine which generated random forest model has to be applied for the classification: either the one trained when only the LED was active, or the model trained when additional ambient light was present. For determining the correct model to be applied, we can reuse the data from the movement direction determination task (see Section 2.4). Since we can determine the movement direction of the train with 100% correct results, this gives us the opportunity to know when no meaningful reflections from the train were acquired. For example, we know that when the train was moving in the Forward direction, the reflections from the train occur after Flank 2 (see Figure 7) and consequently, before Flank 1 only reflections of the environment are present. For a Backward moving train, this fact, of course, is the other way round. Therefore, we can calculate a parameter that yields us the presence or absence of ambient light. To illustrate the validity of this approach, please see Figure 9 that shows a scatter plot of calculated mean values for the green channel in the two settings, when it is known that only the reflections from the environment are present. The two settings are named “only LED” (blue scatter points) and “Ambient” (red scatter points) given on the y-axis and the calculated mean values, called mean_value_empty, over 100 samples on the x-axis.

Figure 9.
Scatter plot of the calculated mean values during the known absence of the train.
This scatter plot shows the clear distinguishability of the two settings. This consequently proves that by calculating the mean value during the known absence of the train can be used to determine whether only the LED was on or if, additionally, the ambient room lighting also was switched on. As a consequence of this clear distinguishability, we can also infer, based on this parameter, the applicable model of the random forest and generally that our system is also able to perform the task of ambient light determination.
4. Discussion
In this study, we present a system that, based on the method of visible light sensing in combination with retroreflective foils, can perform the task of identification and speed estimation of a moving object without the need to place any actively powered components on the object itself. Basically, these tasks are fulfilled by means of acquiring the reflections caused by the differently colored foils in different size configurations and calculating features to be used in the supervised machine learning approach of random forest. In this work, we not only showed an advancement of the classification accuracy, compared to our previous work, on the base of a solution approach for which the spectral power distribution of the emitted light of the utilized LED was modified, but also that this advancement can be achieved for a larger distance between the light source and the object as it was applied in our previous work. Furthermore, we also expanded the number of the tasks to be fulfilled by our system by adding the task of determining the movement direction of the object itself, which was achieved with 100% correct results. Last, but not least, we also showed that the necessity of placing additional components (light barrier) alongside the tracks, as it was done in our previous work, can be overcome, which consequently simplifies the experimental setup. This simplification was achieved by placing an additional specular reflecting element on the train, which provides a clear trigger and additionally provides a possibility to reduce the number of features used in the random forest. Finally, we also expanded the scope of our experimental setup and demonstrated the classification accuracy under the presence of ambient light.
With the help of a distinctive accentuation of the red spectral range in the spectral power distribution of the light emitted from the LED by a simple exchange of the LED from a white LED to an RGBW LED with the same PCB footprint, we were able to improve the classification accuracy from 98.8% in our previous work to 99.96% correct classifications with the same setting (only LED) and 99.41% in the setting when also additional ambient light is present. It is clear that in real application scenarios, additional ambient light is inevitable, but as we showed with the results, even in the presence of ambient light (fluorescent tubes), we can achieve a higher classification accuracy than in our previous work where no ambient light was present.
As already described, these improvements were achieved for a larger distance between the light source and the moving object, with an experimental setup that requires lower effort in its installation and with fewer features used in the random forest. Especially in regard to the increased distance between the light source and the moving object, we would like to point out that we did not follow the solution to increase the output power of the light source in order to generate the same illuminance on the reflective area of the moving object. In contrast, we were able to show that a better allocation of the emitted light spectrum improves the classification accuracy, whilst having a lower illuminance of 500 lux, compared to the 690 lux in our previous work.
Nevertheless, as shown, there are some slight deteriorations in correct classifications when additional ambient light is introduced. First, it has to be pointed out that the applied ambient light, which is generated by a completely different type of light source (fluorescent tubes) provides a very challenging environment. The resulting spectrum impinging on the train consequently deteriorates the difference in the acquired reflections from the foils to a certain extent. The spikes in the spectrum (see Figure 8), especially in the green and blue spectral ranges, are therefore responsible for the observed misclassifications because the utilized RGB photodiode has some overlapping regions with respect to the sensitivity of the three color channels, especially between the blue and green channels; please see [24] for further details. In order to resolve this issue, the most straightforward approach would be to adjust the output spectrum of the utilized LED by a variation of the applied current to the different dies of the LED to make the reflections from the 3M green foil more distinct again. In combination with our previous work of [15], we can, based on the achieved results, deduct some combinations of light sources with retroreflective foils that can be expected to render good results and combinations that are problematic. As described in [15], when the light source is a white LED, with only limited accentuation of the red spectral range, all types of retroreflective foils yield good results, with the exemption of the two utilized red foils. Therefore, we can follow that when the dominant light spectrum corresponds to a white LED with low accentuation of the red spectral range, only a single red foil should be used. In applications for which the spectral power distribution accentuates the red spectral range (as shown in this work), also the differentiation between different red foils can be achieved. Finally, from the results shown in this work, when the RGBW LED light is combined with the light from fluorescent tubes (at least for fluorescent tubes having spectral power distributions similar to that used in this study), we can deduce the strategy to either exclude the green foil or the blue foil.
We also noticed that the ambient light has some effect on the reflections from the utilized mirror element, resulting in a deterioration of the uniqueness of the feature derived from the ME. Therefore, as a countermeasure, we will in the future investigate different geometrical buildups of the ME that better suit the application under ambient light. Nevertheless, we can argue that the 99.41% correct classifications still demonstrate the applicability of the present system in the case that ambient light in the utilized laboratory room is present. The results achieved under the presence of additional ambient light give reason for two conclusions. On the one hand, the spectral composition of the impinging light on the foils has an impact on the achievable classification results. Therefore, in an envisioned application, for example, in a factory, the ambient lighting conditions have to be taken into consideration and adapted if necessary. On the other hand, our work also shows that when the spectral composition of the light is known, the utilizable foils can be selected properly so that foils that tend to cause misclassifications under the known lighting conditions can be excluded.
In order to perform the classification without and with ambient light, we generated two different models of the random forest. We chose this approach to illustrate that the random forest models can be successfully created and applied, even though the lighting conditions changed largely. Additionally, we also pointed out how our system can be used to determine which of the models should be applied preferably, based on performing the ambient light determination from the data for which it is known that the train does not cause meaningful reflections toward the VLS unit. In this work, we devised the approach to train two separate models, one for the setting when only the LED of the VLS unit is on and the second in case that the LED and the ambient light (fluorescent tubes) of the laboratory room are switched on. In Section 3.4, we showed that these two settings can be clearly distinguished from each other and that, consequently, the correct model can be chosen to perform the classification. This approach is in contrast to our previous work in [17], where we used the model trained when only the LED was on to perform also the classification when the ambient light of the fluorescent tubes was present. Whilst for the application in [17] this approach was applicable, in this work, dealing with a completely different movement type and a largely increased complexity of the classification (foil, size of foil and speed of the train), it is not practicable without further advancements. In future work, we will investigate this issue to devise methods that can mitigate the effect of ambient light in the calculated features in order to be able to have a single trained model, regardless of whether ambient light is present or not.
One of the limitations of our approach, utilizing a Lego train moving on given rails, is that the movement direction is limited to either Forward or Backward. To a certain extent, this movement on a given path (rails) can be compared to current real-world applications, where also autonomous mobile platforms in factories or warehouses do move on given paths, thus limiting the movement possibilities. For enabling also varying paths through the detection area, we will investigate an extension of our utilized system to incorporate multiple receivers, in order to overcome the limitations of the number of movement directions. Still, we would like to point out that in settings such as high rack warehouses or corridors, the possible movement directions are also quite limited.
In the process of movement direction determination, especially in the algorithm that determines the positions of the two flanks, we had to define the parameter for building the difference between the samples. Of course, a lower or higher speed of the train would lead to the necessity of adjusting this parameter in order to perform the flank position determination. In this work, we set this parameter to 50 since this value renders good results for all the applied speed settings. As already described, an increased or decreased speed of the moving object without the adjustment of this parameter would lead to incorrect flank determination and consequently to false movement direction determination. The same issue consequently also rises with respect to the feature generation process. The utilized speed settings in this work are nevertheless very well comparable to the maximum speeds of mobile robots used in factory settings or healthcare and therefore, give reason to argue that the envisioned applications of identification, speed estimation and movement direction determination of such devices are realizable on the base of the presented approach.
Our utilized hardware, where the light source and the receiving RGB photodiode are placed in close vicinity to each other, on the one hand, has the big advantage that this approach allows for integrating the light source and the receiving element into one compact module. In comparison to systems where the light source and the receiving elements are separated from each other, we can argue that this approach requires lower installation effort. On the other hand, this integration of the light source and photosensitive device in the same module also imposes some requirements regarding the applicable reflecting materials. In an application where the light source and the receiving element are placed further away from each other, it is clear that our retroreflective foils and the mirror element in the current setup (horizontally aligned) are not generally applicable. In such applications, it is necessary to investigate geometric models in combination with other reflecting materials as given in [26], where the authors showed the localization of a toy car by the means of visible light by placing reflective materials (mirrors or aluminum) in a certain geometric shape on the toy car. The same is also true for a largely parallel alignment of the light source and the surface on which the foils are mounted. Still, for the envisioned application scenarios, robotic platforms used in factory settings or healthcare, it is expected that such an alignment can be executed and can be largely retained during operation (robot movement).
Finally, we also want to discuss the possibilities and limitations that are imposed by the geometrical implications and materials used on the train, as shown in the context of the coupler of the Lego platform (see Figure 5). In this work, we approved this circumstance as it is and did not exploit it or counteract it in any way. On the one hand, such reflections from the object itself are problematic, especially when they impose a certain magnitude of reflected light and, therefore, interfere with the reflections from the applied foils but also impose a certain opportunity on the other hand. In an envisioned application where the object itself is made from highly reflecting materials, we can outline the solution approach that the tasks of identification and sensing are not performed by an analysis of the reflections, but by analyzing the absence of reflections “caused” by placing certain non-reflective foils or materials on the moving object. In this case, we do believe that our shown algorithmic approach by random forest is a good candidate to perform these classifications.
Therefore, in future applications, a thorough inspection of the influence of such parts (for example, polished metal parts on the object) will be necessary to prevent an interference with the determination of the reflective foils. On the other hand, exploiting these reflections from the material or shape of the object itself would be an interesting research direction in order to perform different sensing tasks without the use of retroreflective foils.
5. Conclusions
In this work, we were able to show a further improvement of our approach to utilize visible light sensing for the identification and speed estimation of an indoor moving object by utilizing cheap and easy-to-apply off-the-shelf retroreflective foils on the object. Furthermore, by utilizing an additional specular reflecting element on the train, the task of movement direction determination can be achieved, the necessity of placing a light barrier into the environment can be resolved, and the number of features used in the applied random forest model can be decreased. We also showed the applicability of our system under the presence of ambient light and outlined a simple method for distinguishing between the settings in which the ambient light was off or on. Therewith, the discussed and experimentally verified improvements are a step further toward applications in which tasks that usually require battery- or accumulator-powered devices for communication with and sensing of an indoor moving object can be performed in a backscattered “green” way, whilst the obligatory room lighting is provided without any deterioration. Furthermore, the fact that, as discussed in the introduction, some new developments allow to perform VLS in parallel with the task of visible light communication opens the possibility to expand backscattering [27,28] and joint communication and sensing tasks [29], which are anticipated to be main strategies of the 6G era, to the visible spectral range. Similar to the hybrid RF/VLC(LiFi) networks [30] discussed nowadays to exploit a broader range of the electromagnetic spectrum for communication, the currently discussed backscattering and joint communication and sensing approaches could be fused with their visible light analogs in the future to exploit the advantages provided by the different ranges of the electromagnetic spectrum.
Author Contributions
Conceptualization, A.P.W. and F.P.W.; methodology, A.P.W. and F.P.W.; software, A.P.W.; validation, A.P.W. and F.P.W.; writing—original draft preparation, A.P.W.; writing—review and editing, F.P.W.; visualization, A.P.W. All authors have read and agreed to the published version of the manuscript.
Funding
The authors gratefully acknowledge the financial support by the Austrian Bundesministerium für Klimaschutz, Umwelt, Energie, Mobilität, Innovation und Technologie (BMK), project “HIGH-Light”.
Acknowledgments
We would like to acknowledge the support of DI Andreas Kröpfl in the build-up of the experiment.
Conflicts of Interest
The authors declare no conflict of interest.
References
- Kyburz, R. Energy Efficiency of the Internet of Things, Technology and Energy Assessment Report Prepared for IEA 4E EDNA, July 2016; iHomeLab: Horw, Switzerland, 2016. [Google Scholar]
- Elahi, H.; Munir, K.; Eugeni, M.; Atek, S.; Gaudenzi, P. Energy Harvesting towards Self-Powered IoT Devices. Energies 2020, 13, 5528. [Google Scholar] [CrossRef]
- Nizetic, S.; Šolić, P.; González-de-Artaza, D.; Patrono, L. Internet of Things (IoT): Opportunities, issues and challenges towards a smart and sustainable future. J. Clean. Prod. 2020, 274, 122877. [Google Scholar] [CrossRef] [PubMed]
- Liu, X.; Ansari, N. Toward Green IoT: Energy Solutions and Key Challenges. IEEE Commun. Mag. 2019, 57, 104–110. [Google Scholar] [CrossRef]
- Farhan, L.; Kharel, R.; Kaiwartya, O.; Quiroz-Castellanos, M.; Alissa, A.; Abdulsalam, M. A Concise Review on Internet of Things (IoT)-Problems, Challenges and Opportunities. In Proceedings of the 2018 11th International Symposium on Communication Systems, Networks & Digital Signal Processing (CSNDSP), Budapest, Hungary, 18–20 July 2018; pp. 1–6. [Google Scholar]
- Matheus, L.E.M.; Vieira, A.B.; Vieira, L.F.M.; Vieira, M.A.M.; Gnawali, O. Visible Light Communication: Concepts, Applications and Challenges. IEEE Commun. Surv. Tutor. 2019, 21, 3204–3237. [Google Scholar] [CrossRef]
- Singh, J.; Raza, U. Passive visible light positioning systems: An overview. In Proceedings of the Workshop on Light Up the IoT (LIOT ‘20), London, UK, 21 September 2020; Association for Computing Machinery: New York, NY, USA, 2020; pp. 48–53. [Google Scholar] [CrossRef]
- Faulkner, N.; Alam, F.; Legg, M.; Demidenko, S. Watchers on the Wall: Passive Visible Light-Based Positioning and Tracking With Embedded Light-Sensors on the Wall. IEEE Trans. Instrum. Meas. 2020, 69, 2522–2532. [Google Scholar] [CrossRef]
- Mestiraihi, M.A.; Abuella, H.; Ekin, S. Indoor Occupancy Estimation Using Visible Light Sensing (VLS) System. In Proceedings of the 2018 IEEE 88th Vehicular Technology Conference (VTC-Fall), Chicago, IL, USA, 27–30 August 2018; pp. 1–5. [Google Scholar] [CrossRef]
- Deprez, K.; Bastiaens, S.; Martens, L.; Joseph, W.; Plets, D. Passive Visible Light Detection of Humans. Sensors 2020, 20, 1902. [Google Scholar] [CrossRef] [PubMed] [Green Version]
- Weiss, A.P.; Rad, S.Z.; Wenzl, F.P. Pose detection with backscattered visible light sensing utilizing a single RGB photodiode: A model based feasibility study. In Proceedings of the 2020 International Wireless Communications and Mobile Computing (IWCMC), Limassol, Cyprus, 15–19 June 2020; pp. 137–142. [Google Scholar]
- Weiss, A.P.; Fragner, C.; Wenzl, F.P. A novel Approach for Human-System Interaction by Visible Light Sensing based Wrist Posture and Rotation Determination. In Proceedings of the 2021 14th International Conference on Human System Interaction (HSI), Gdańsk, Poland, 8–10 July 2021; pp. 1–6. [Google Scholar] [CrossRef]
- Wang, Q.; Zuniga, M. Passive visible light networks: Taxonomy and opportunities. In Proceedings of the Workshop on Light Up the IoT (LIOT ‘20), London, UK, 21 September 2020; Association for Computing Machinery: New York, NY, USA; pp. 42–47. [Google Scholar] [CrossRef]
- Weiss, A.P.; Wenzl, F.P. Identification and Speed Estimation of a Moving Object in an Indoor Application Based on Visible Light Sensing of Retroreflective Foils. Micromachines 2021, 12, 439. [Google Scholar] [CrossRef] [PubMed]
- Weiss, A.P.; Madane, K.; Wenzl, F.P.; Leitgeb, E. Random forest based classification of retroreflective foils for visible light sensing of an indoor moving object. In Proceedings of the 2021 16th International Conference on Telecommunications (ConTEL), Zagreb, Croatia, 30 June–2 July 2021; pp. 78–84. [Google Scholar] [CrossRef]
- Amjad, M.S.; Dressler, F. Using Visible Light for Joint Communications and Vibration Sensing in Industrial IoT Applications. In Proceedings of the ICC 2021—IEEE International Conference on Communications, Montreal, QC, Canada, 14–23 June 2021; pp. 1–6. [Google Scholar] [CrossRef]
- Madane, K.; Weiss, A.P.; Schantl, S.; Leitgeb, E.; Wenzl, F.P. Machine Learning Assisted Visible Light Sensing of the Rotation of a Robotic Arm. IEEE Access 2021, 9, 130721–130736. [Google Scholar] [CrossRef]
- Han, Z.; Lu, Z.; Wen, X.; Zheng, W.; Zhao, J.; Guo, L. CentiTrack: Towards Centimeter-Level Passive Gesture Tracking with Commodity WiFi. arXiv 2020, arXiv:2011.06896. [Google Scholar]
- 3M. 3M™ Diamond Grade™ DG3 Reflective Sheeting Series 4000 Product Bulletin 4000, January 2020; 3M: Saint Paul, MN, USA, 2020. [Google Scholar]
- Orafol. ORALITE® VC 170 Universal Film, Technical Datasheet 2016/31; Orafol: Oranienburg, Germany, 2016. [Google Scholar]
- Movexx International, B.V. Movexx AGV-Basic PARTS & OPTIONS 2020, Product Datasheet, 2020; Movexx International B.V.: Veenendaal, The Netherlands, 2020. [Google Scholar]
- SoftBank Robotics. Pepper Datasheet 1.8a, Version 1.8a P.2; SoftBank Robotics: Tokyo, Japan, 2017. [Google Scholar]
- Cree Inc. “Cree® XLamp® MC-E LED”, MCE4WT-A2-0000-000M01 Datasheet, Nov 2018; Cree Inc.: Durham, NC, USA, 2018. [Google Scholar]
- Kingbright. “RGB Color Sensor”, KPS-5130PD7C Datasheet, April 2013; Kingbright: New Taipei City, Taiwan, 2013. [Google Scholar]
- Demsar, J.; Curk, T.; Erjavec, A.; Gorup, C.; Hocevar, T.; Milutinovic, M.; Mozina, M.; Polajnar, M.; Toplak, M.; Staric, A.; et al. Orange: Data Mining Toolbox in Python. J. Mach. Learn. Res. 2013, 14, 2349–2353. [Google Scholar]
- Wang, W.; Wang, Q.; Zhang, J.; Zuniga, M. PassiveVLP: Leveraging Smart Lights for Passive Positioning. ACM Trans. Internet Things 2020, 1, 3. [Google Scholar] [CrossRef] [Green Version]
- Nawaz, S.J.; Sharma, S.K.; Mansoor, B.; Patwary, M.N.; Khan, M.N. Non-Coherent and Backscatter Communications: Enabling Ultra-Massive Connectivity in 6G Wireless Networks. IEEE Access 2021, 9, 38144–38186. [Google Scholar] [CrossRef]
- Toro, U.S.; Wu, K.; Leung, V.C.M. Backscatter Wireless Communications and Sensing in Green Internet of Things. IEEE Trans. Green Commun. Netw. 2021. early access. [Google Scholar] [CrossRef]
- Barneto, C.B.; Liyanaarachchi, S.D.; Heino, M.; Riihonen, T.; Valkama, M. Full Duplex Radio/Radar Technology: The Enabler for Advanced Joint Communication and Sensing. IEEE Wirel. Commun. 2021, 28, 82–88. [Google Scholar] [CrossRef]
- Wu, X.; Soltani, M.D.; Zhou, L.; Safari, M.; Haas, H. Hybrid LiFi and WiFi Networks: A Survey. IEEE Commun. Surv. Tutor. 2021, 23, 1398–1420. [Google Scholar] [CrossRef]
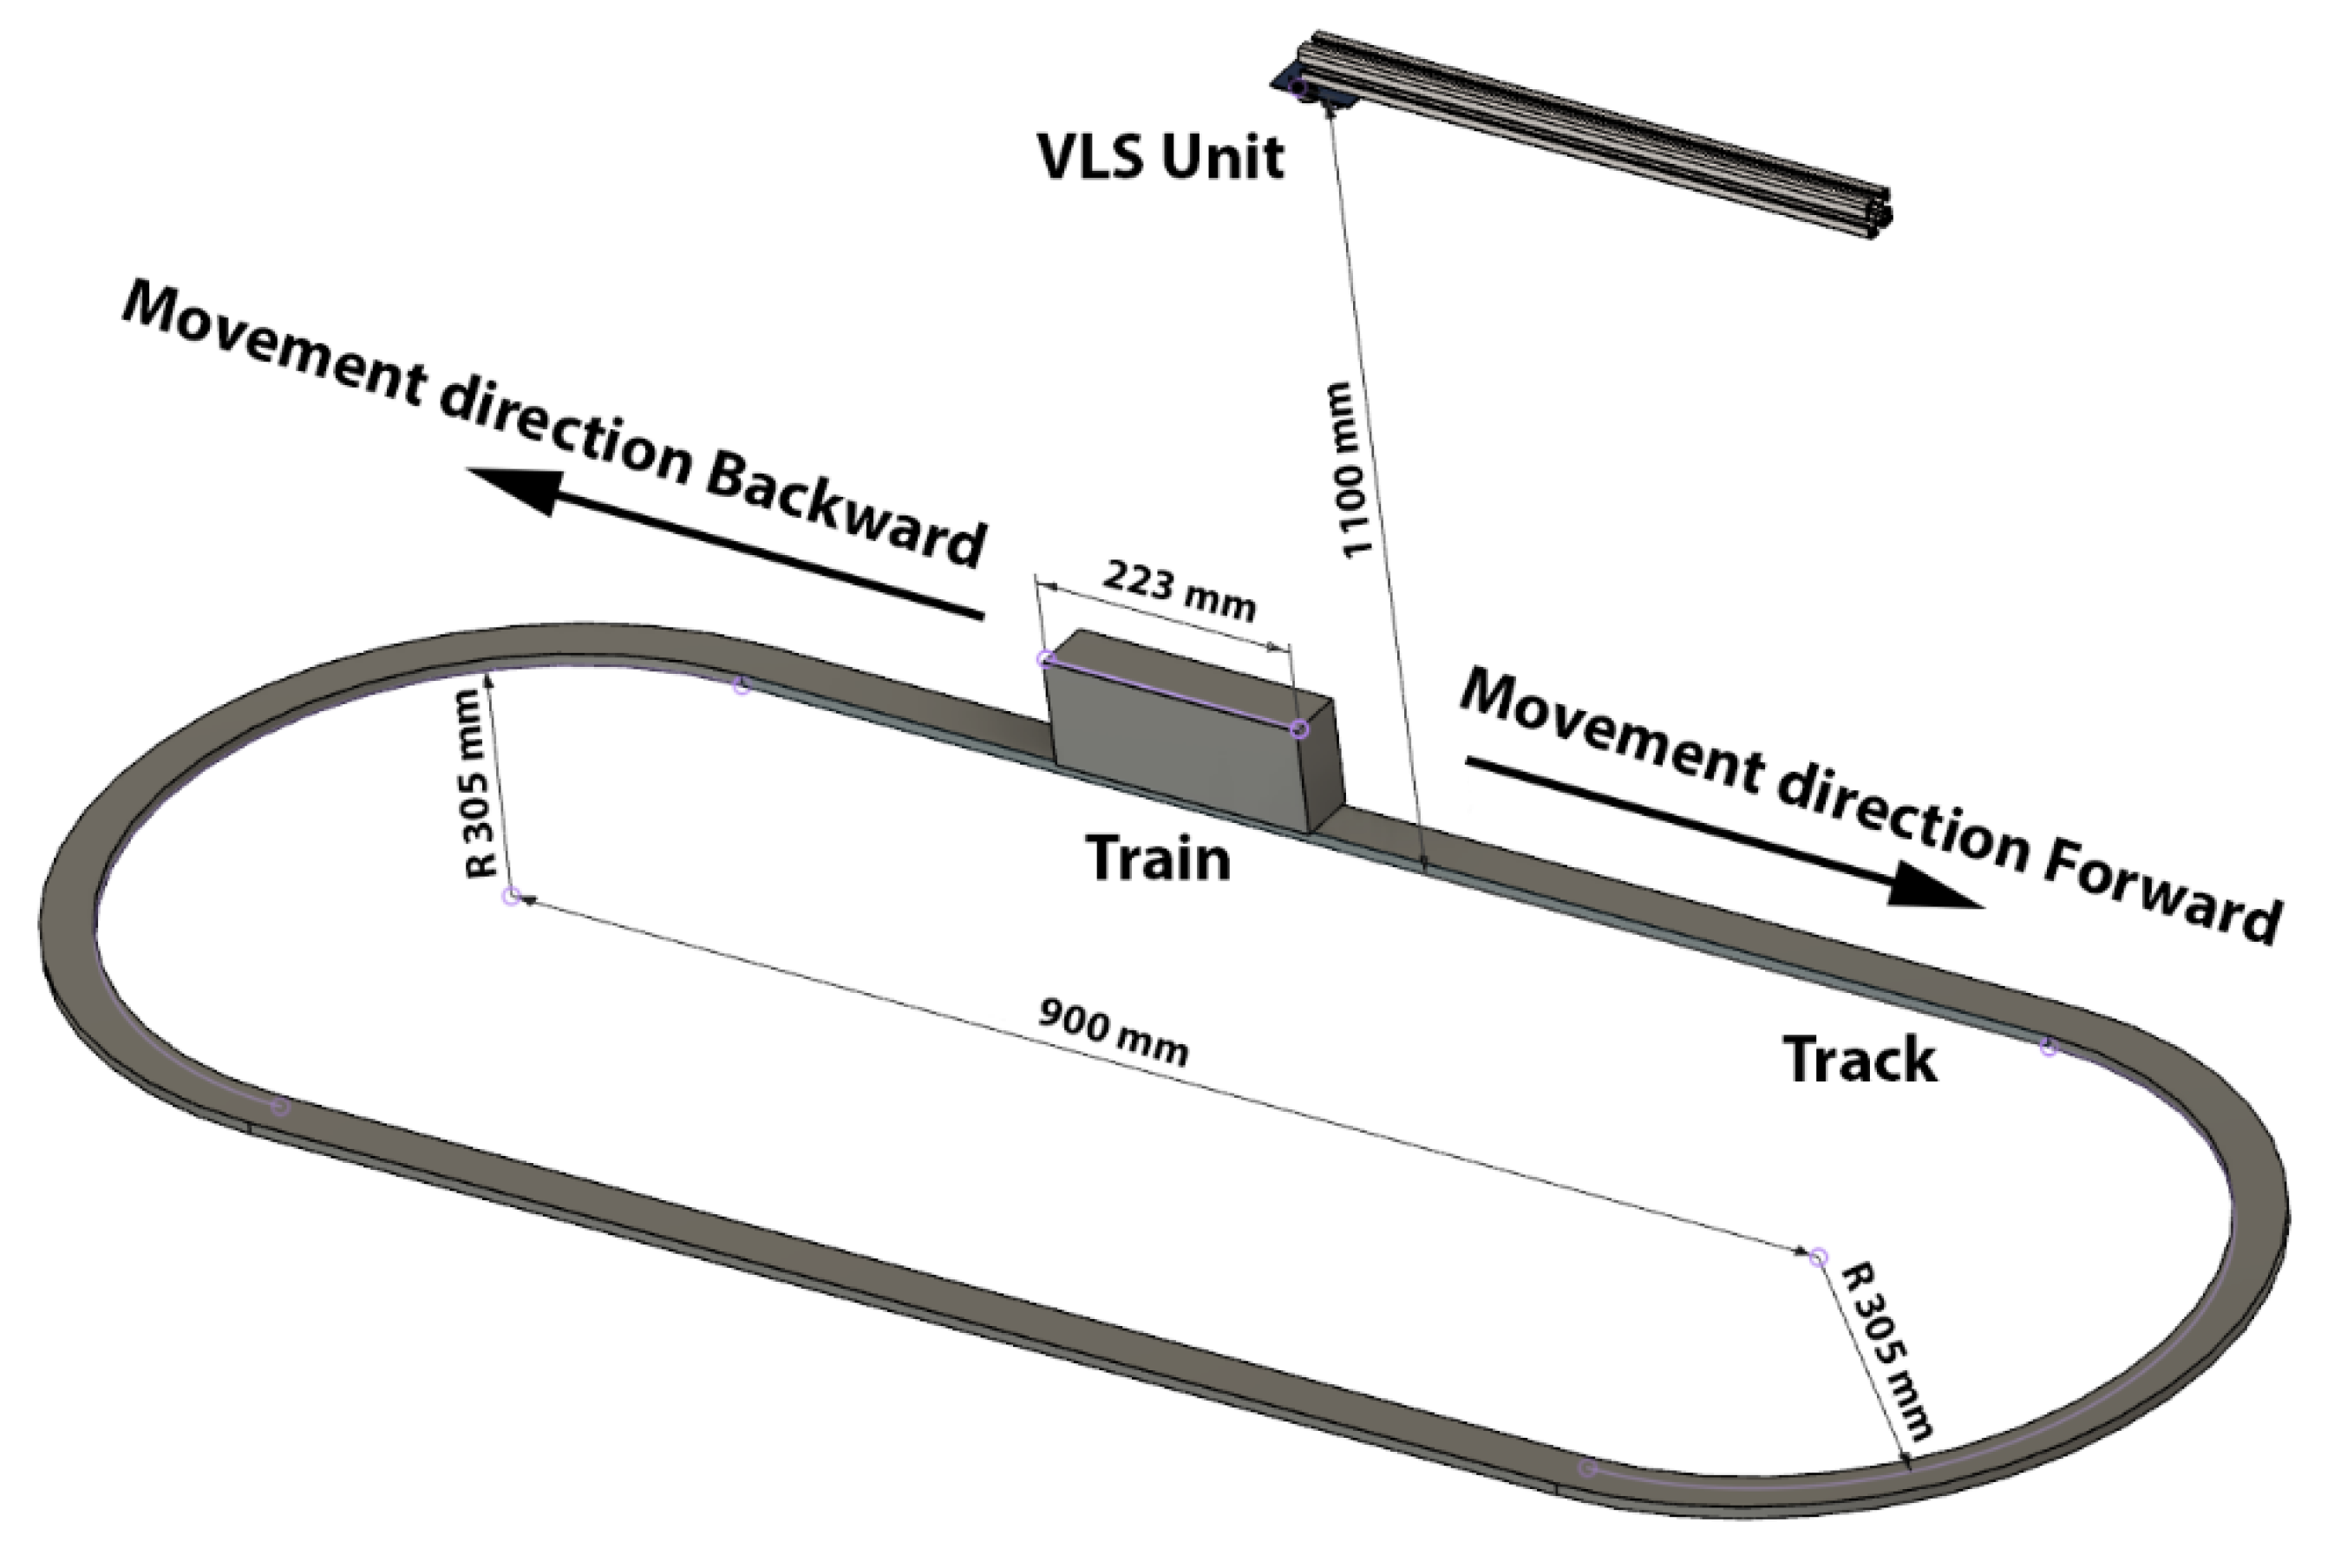
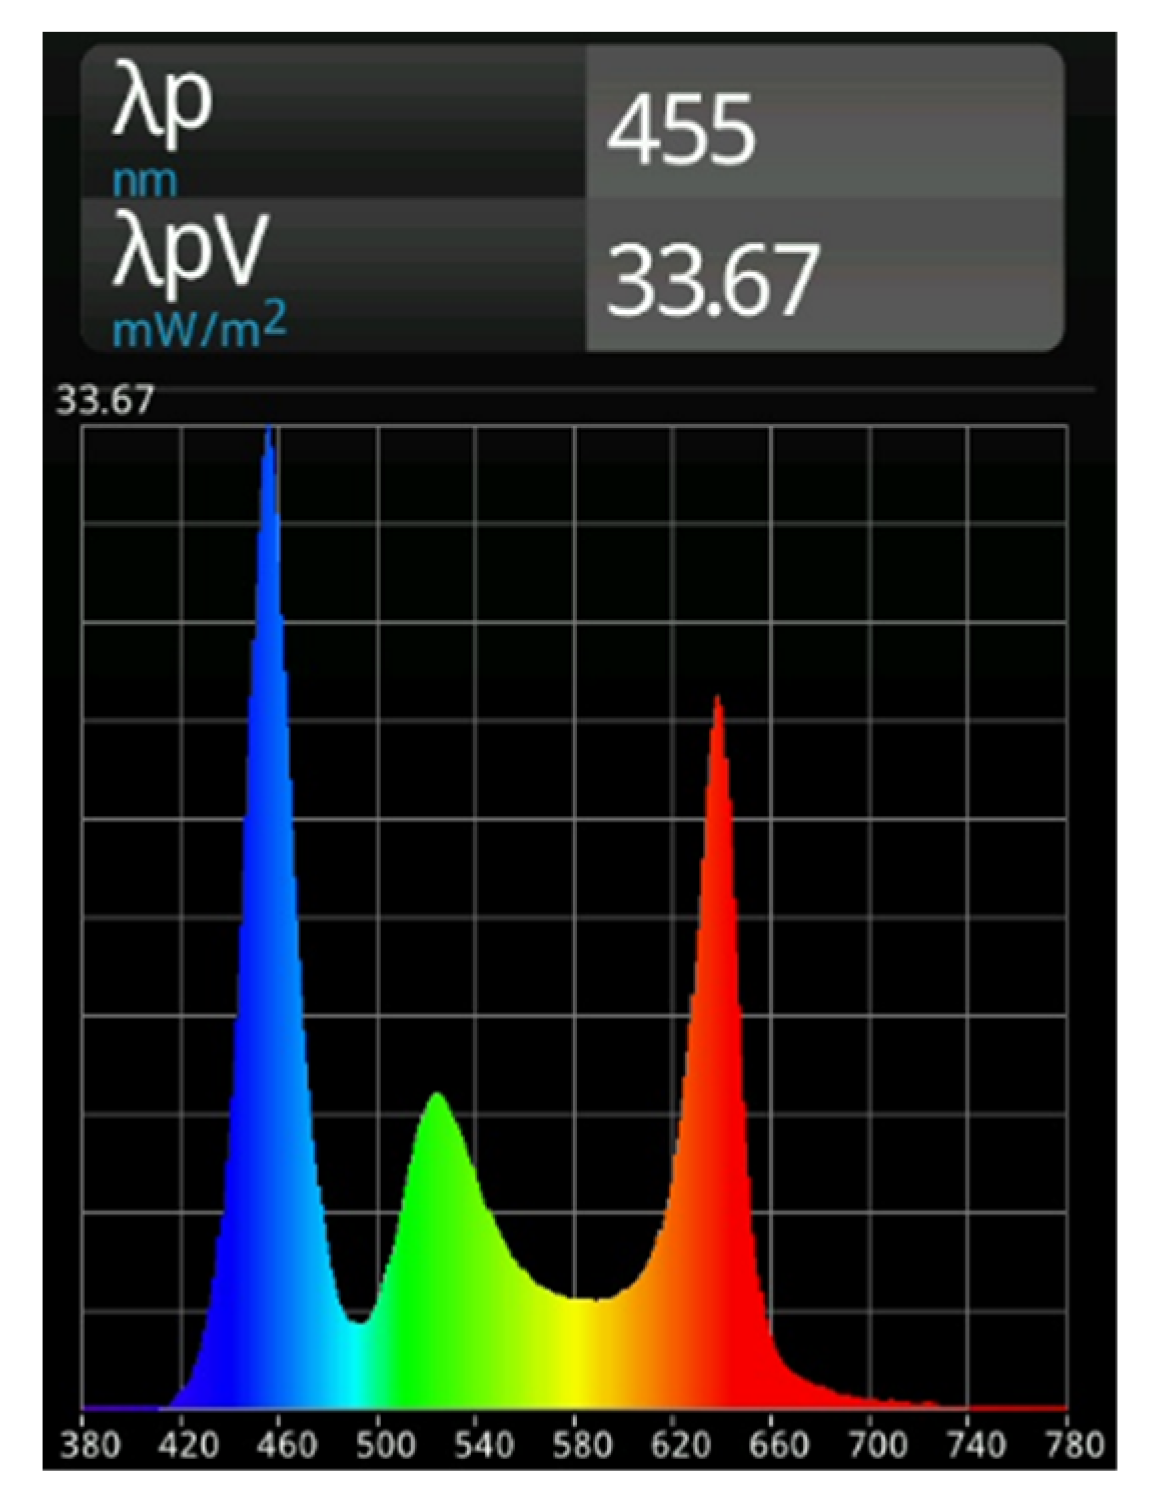
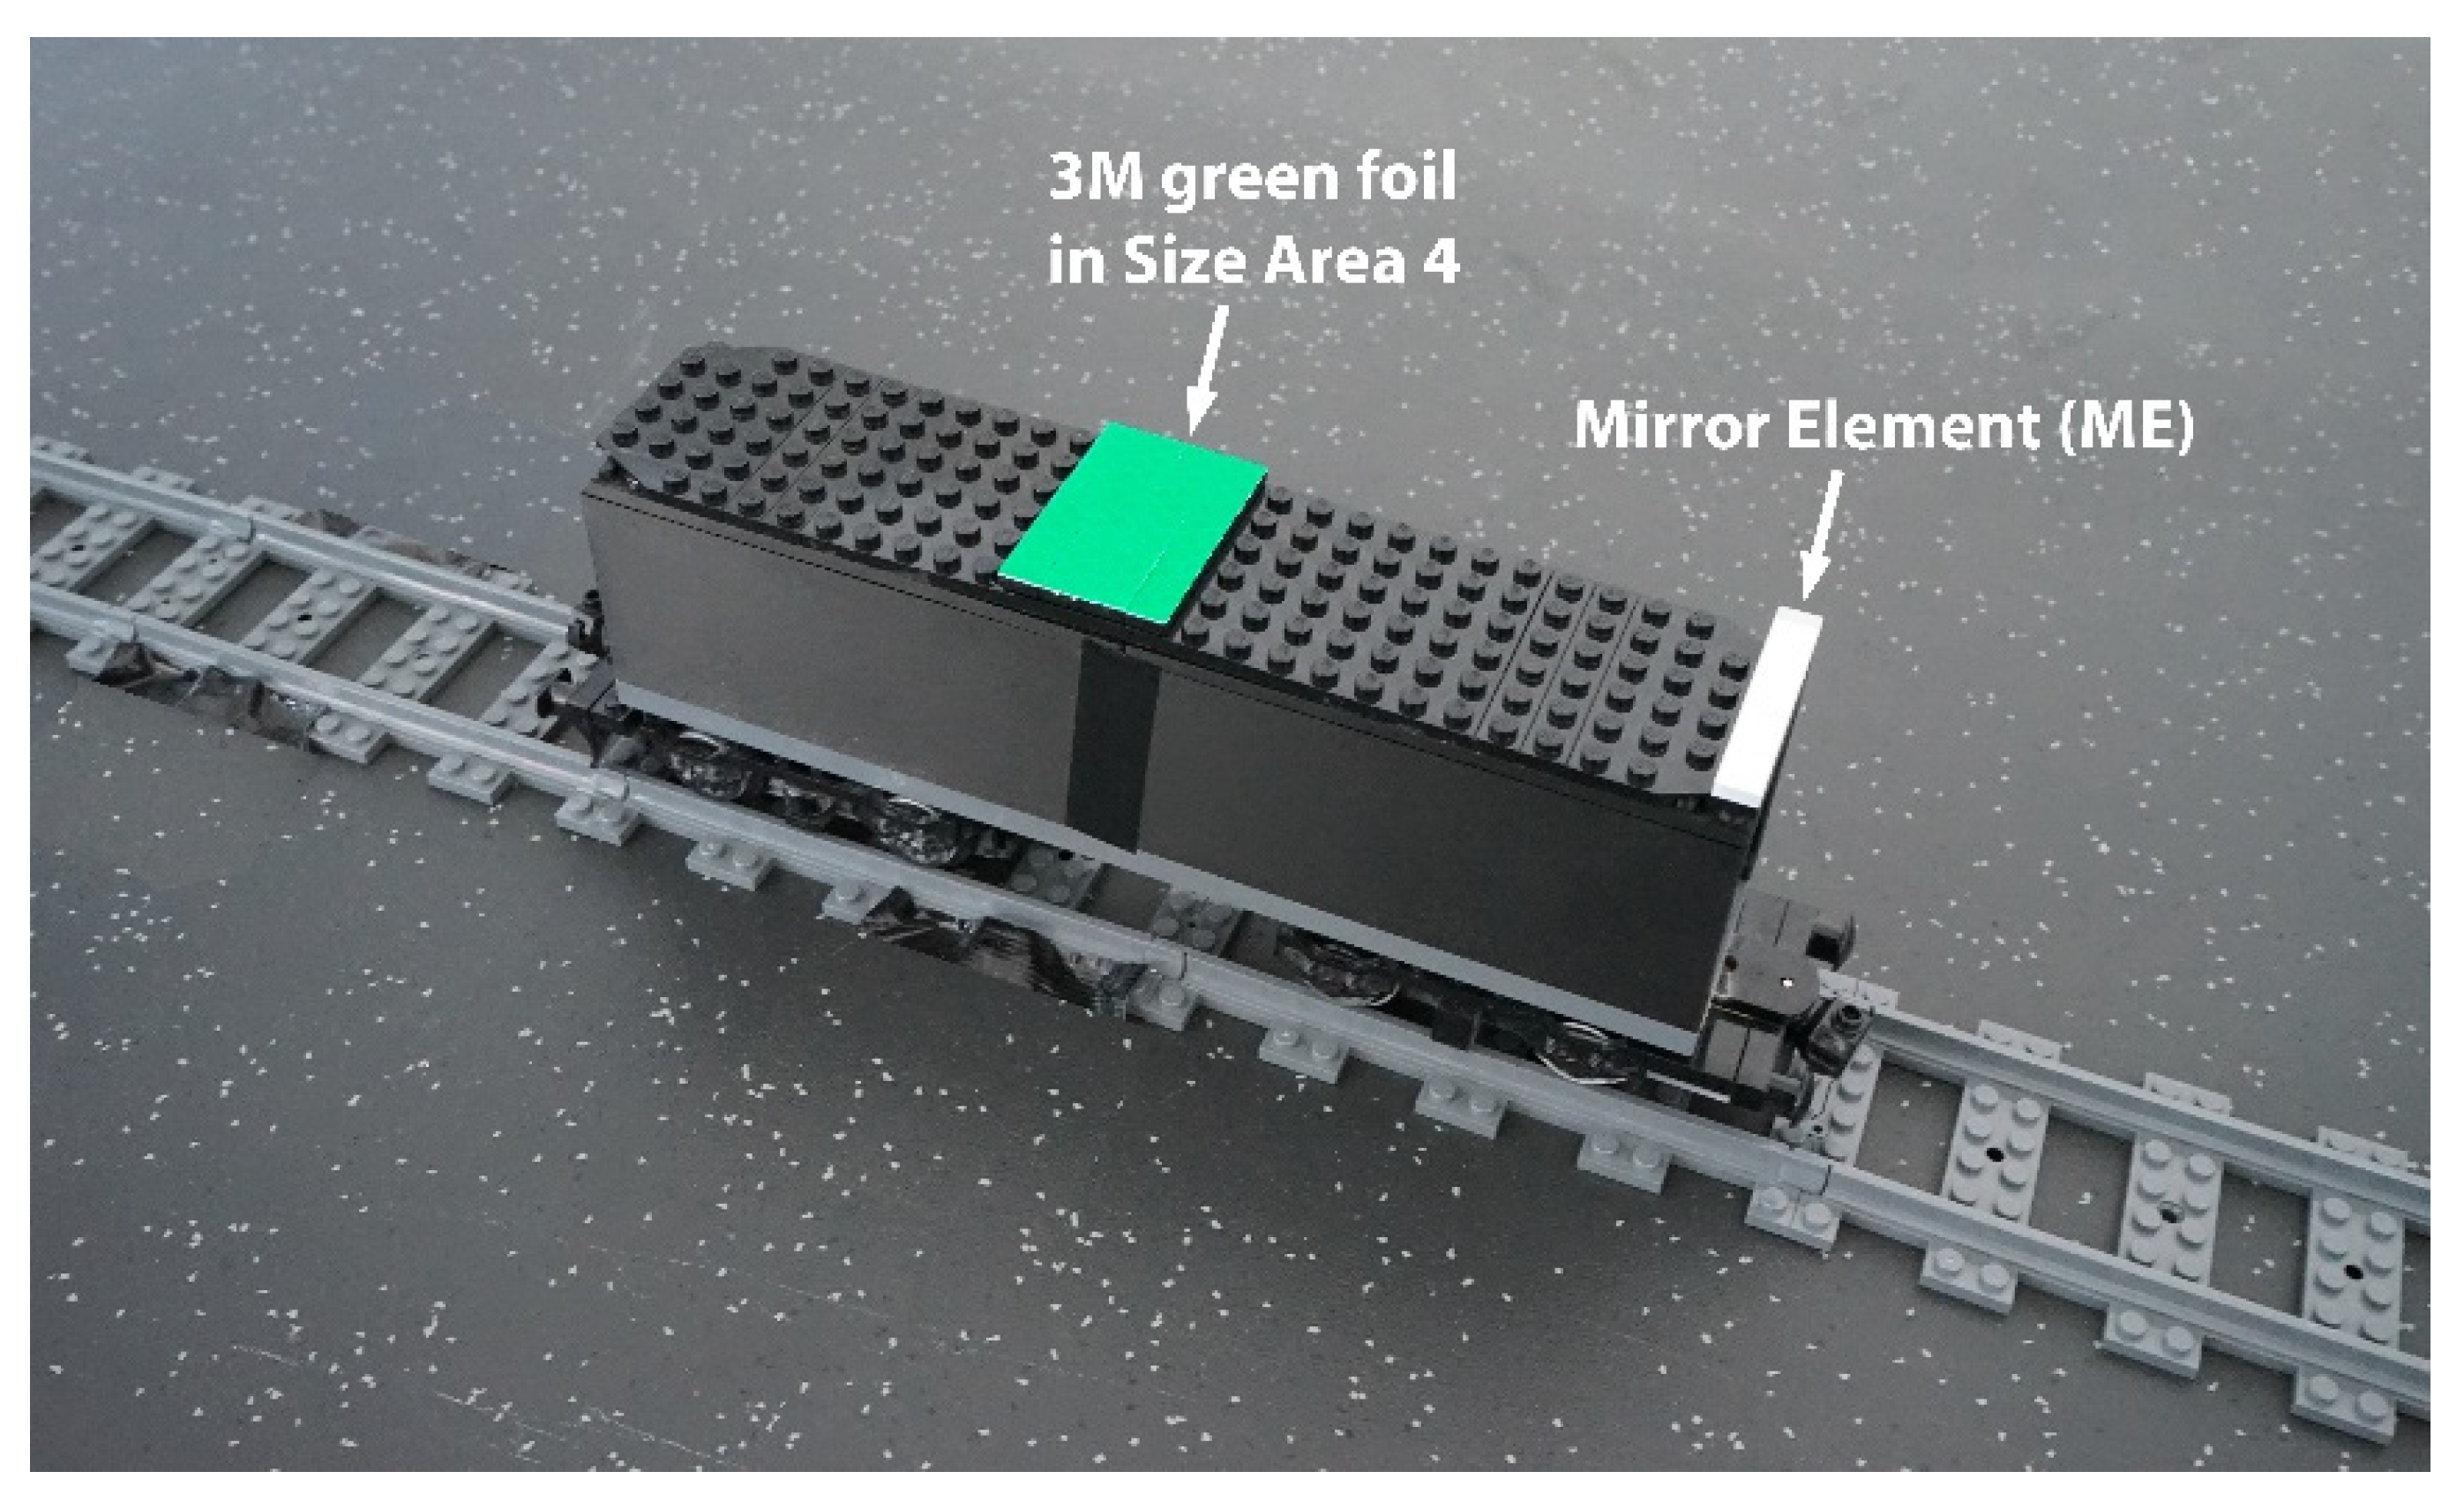
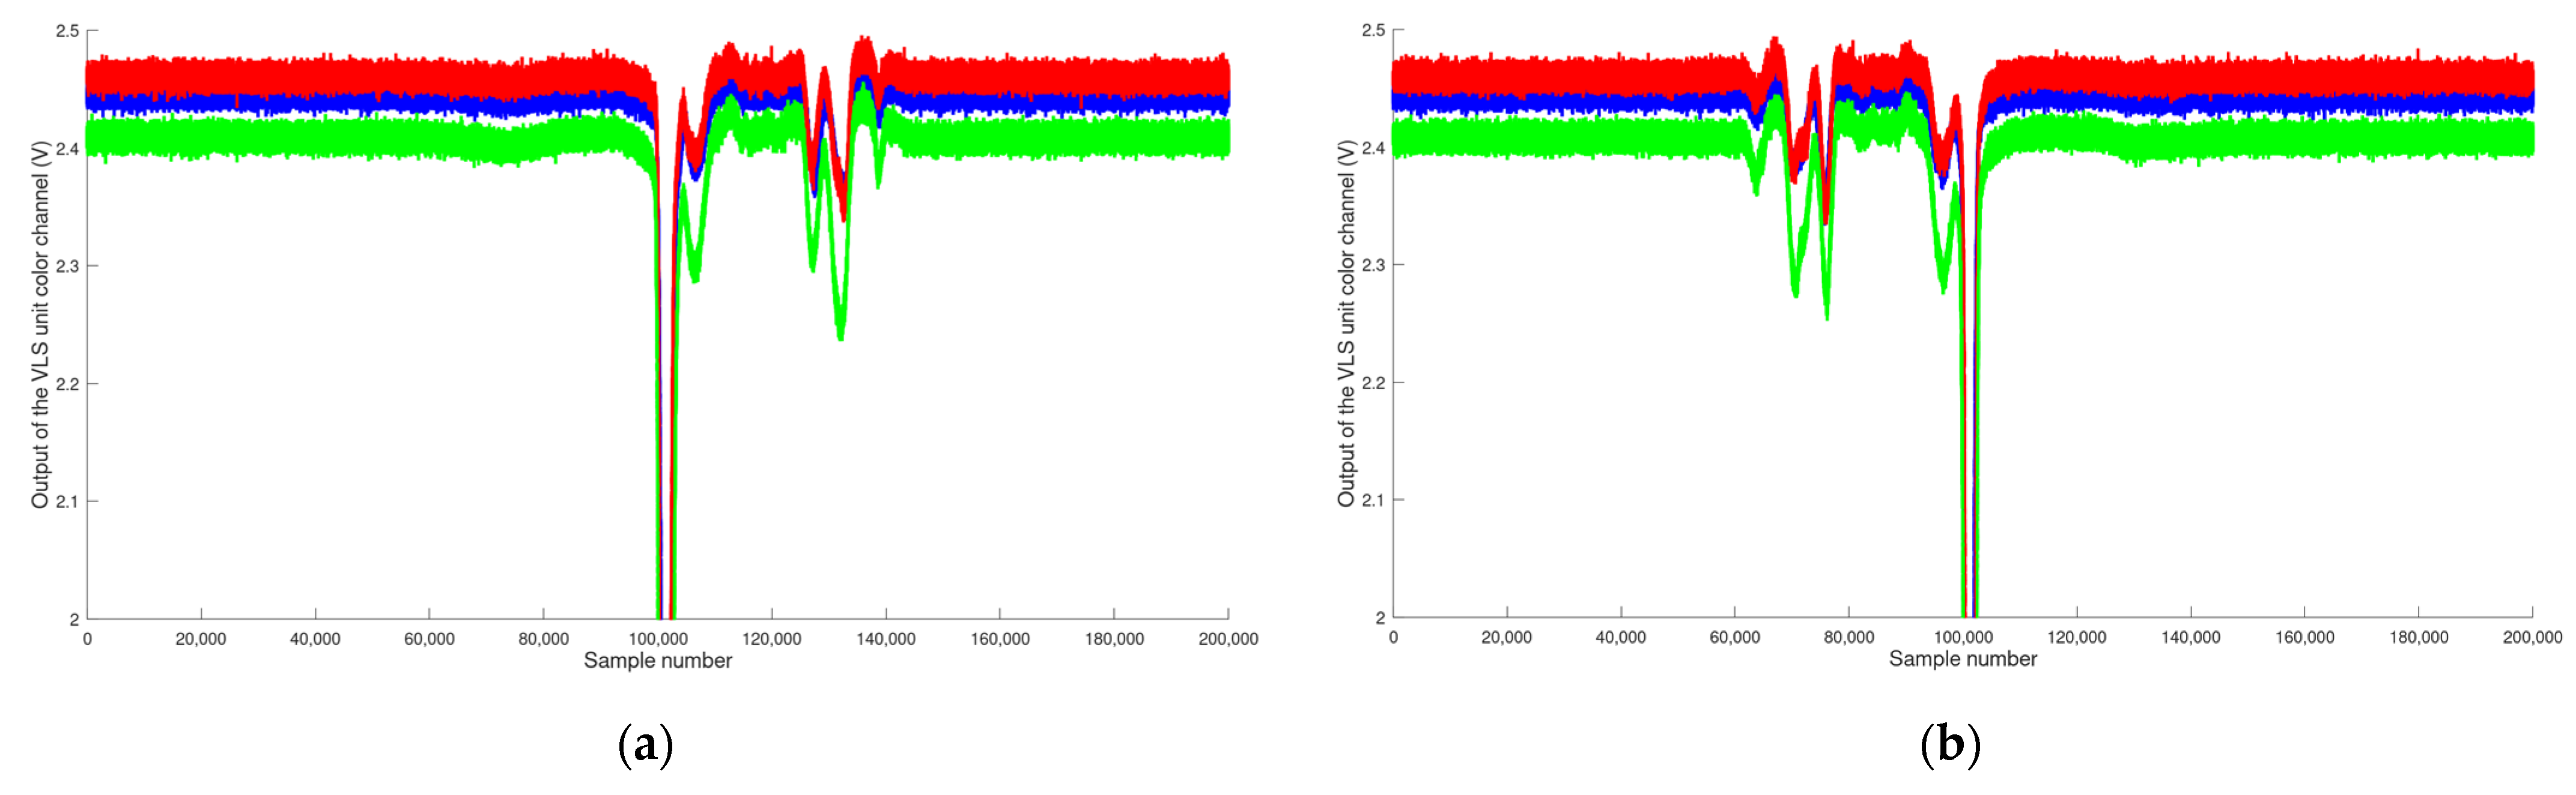
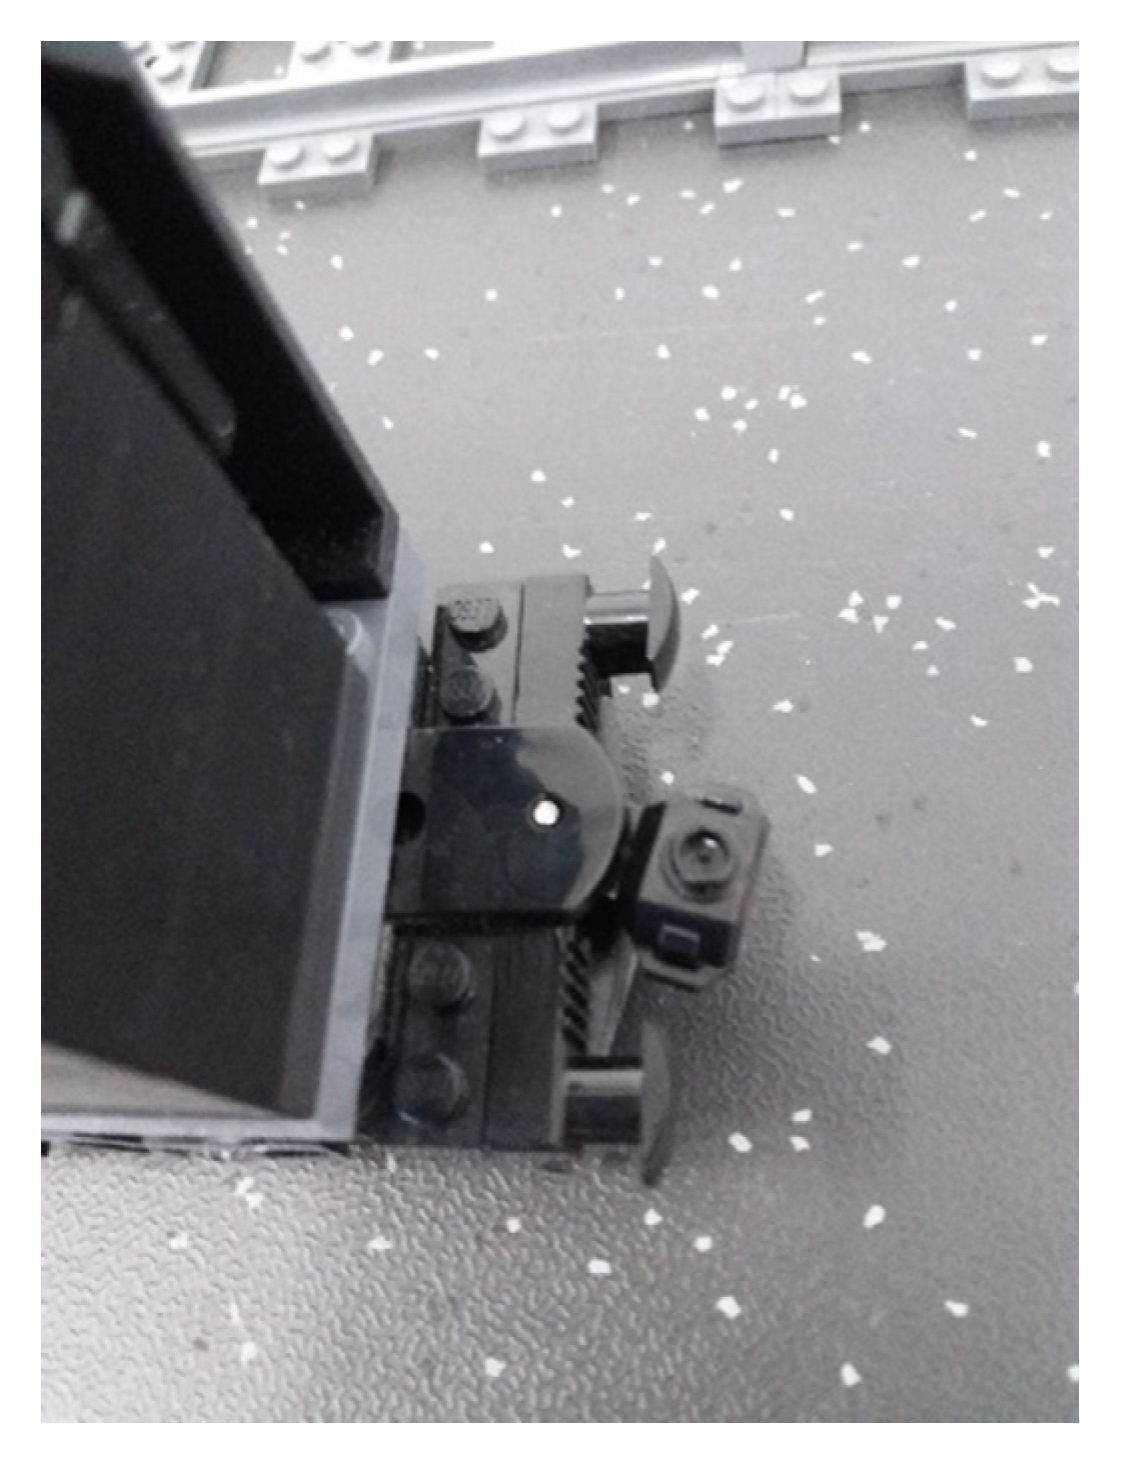
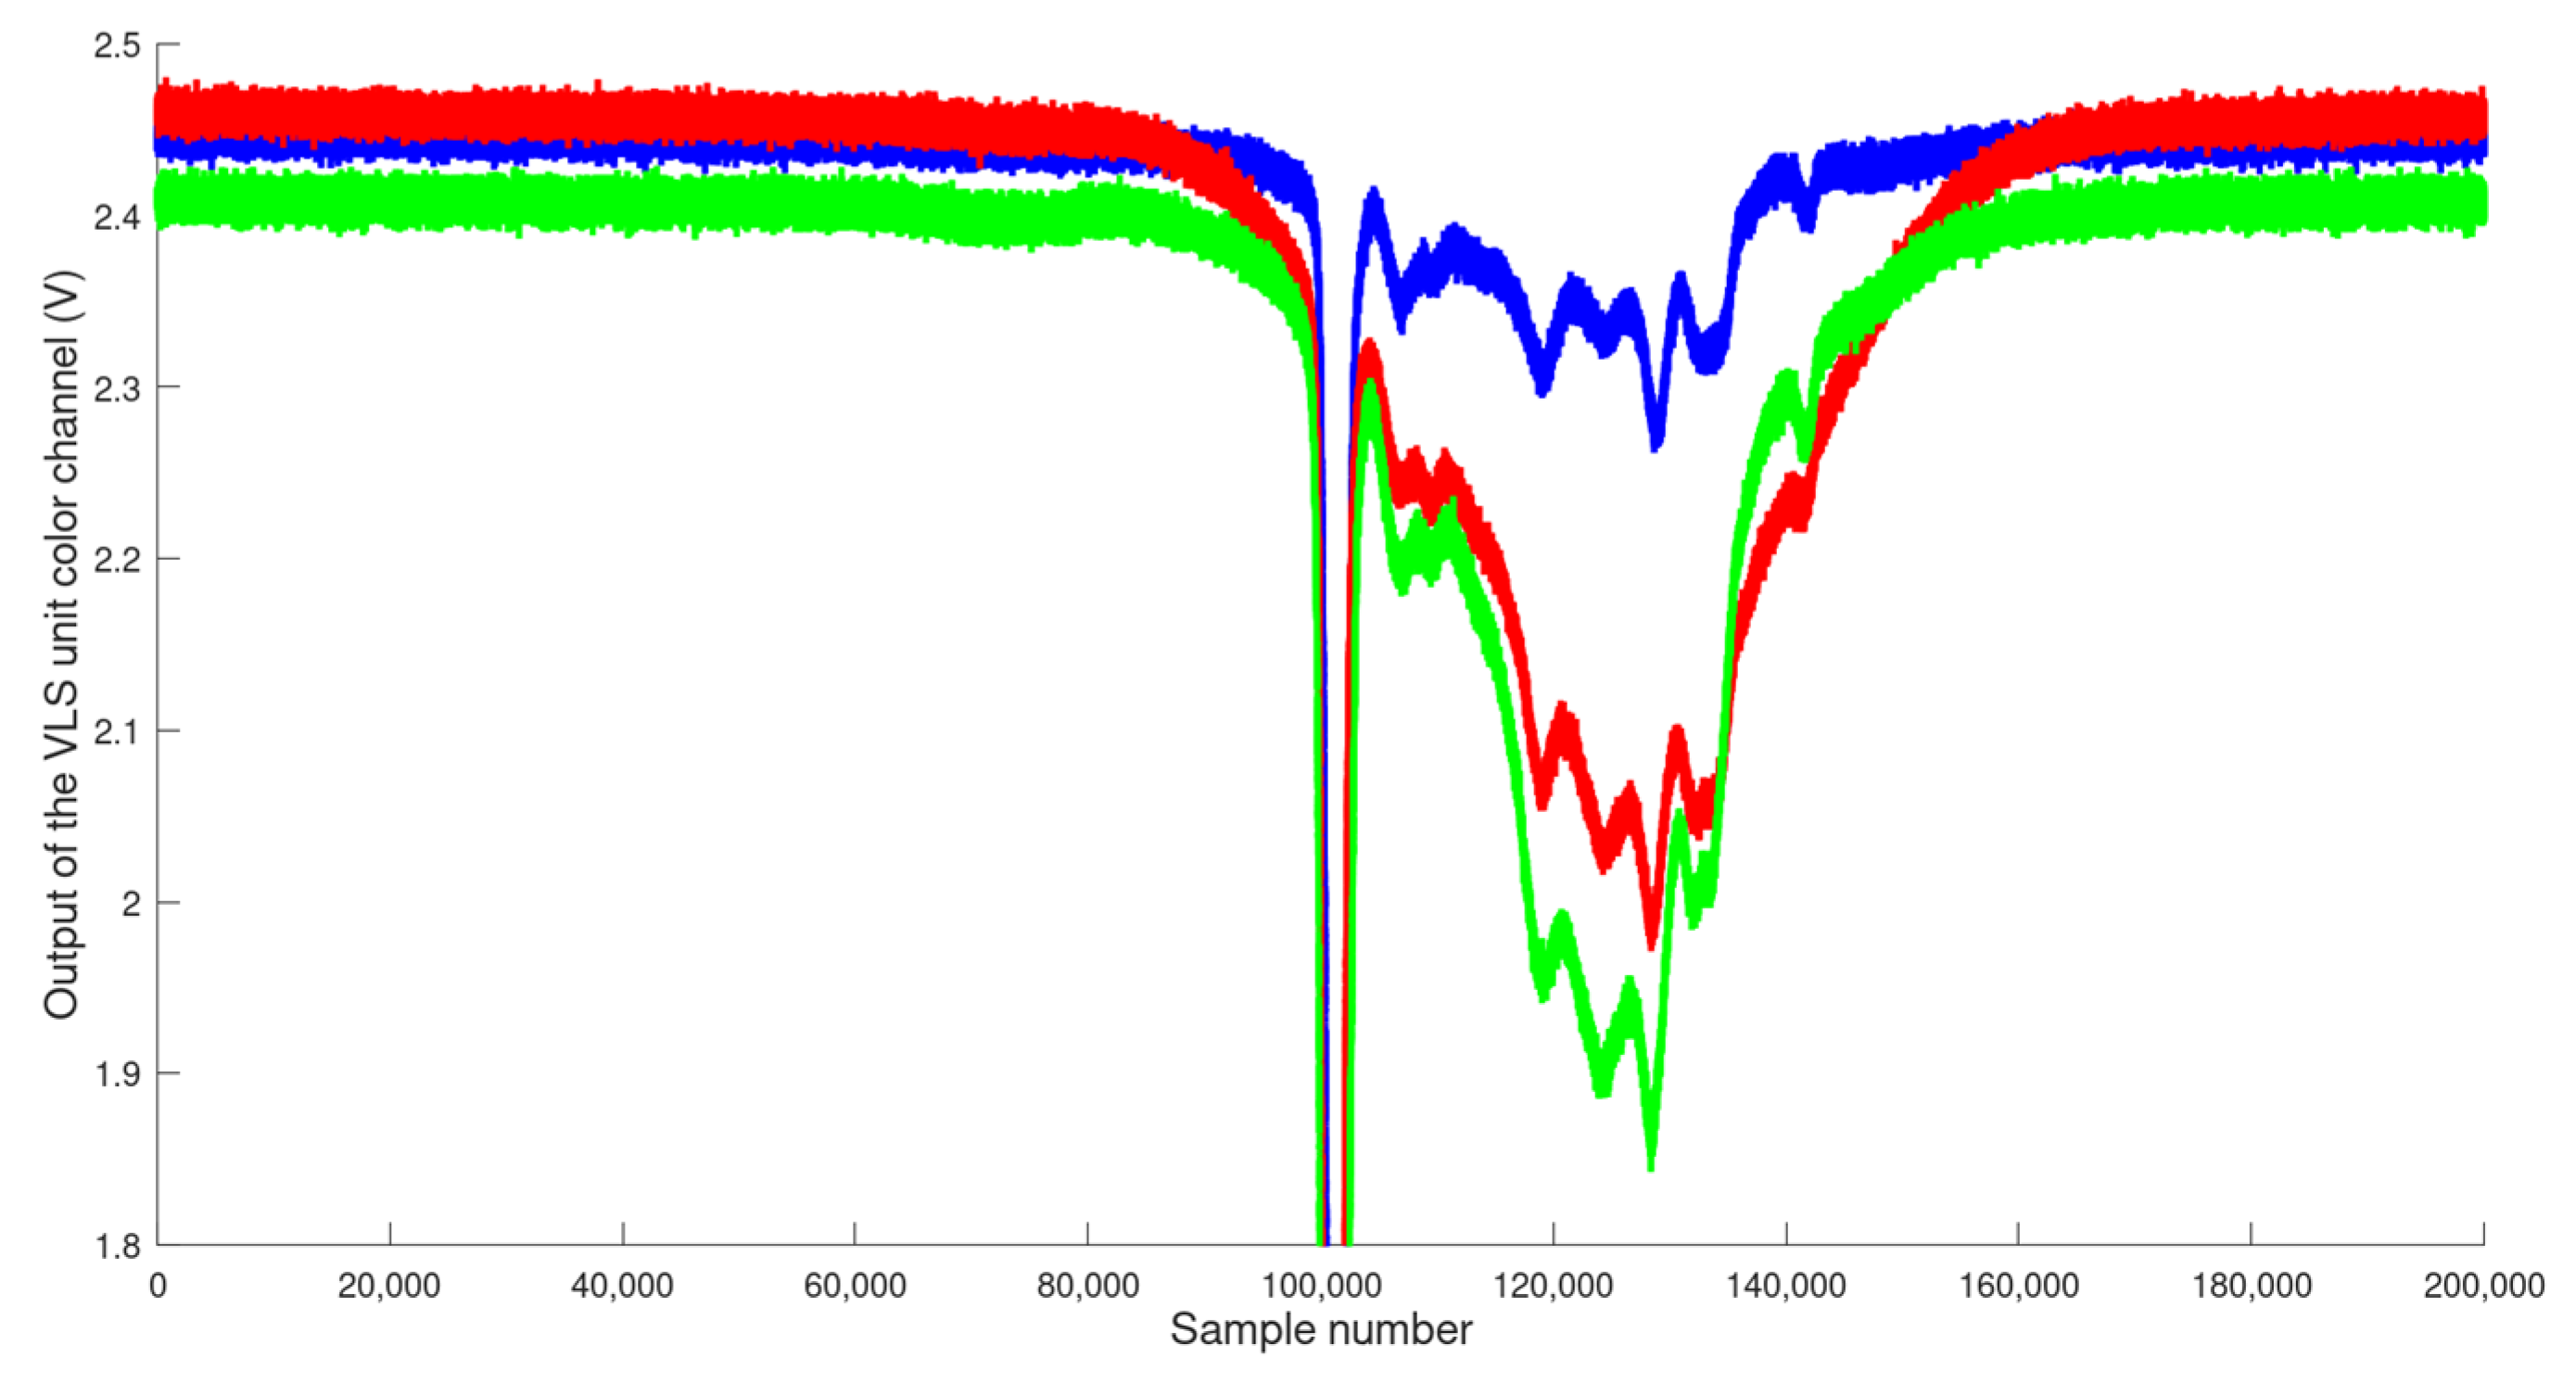
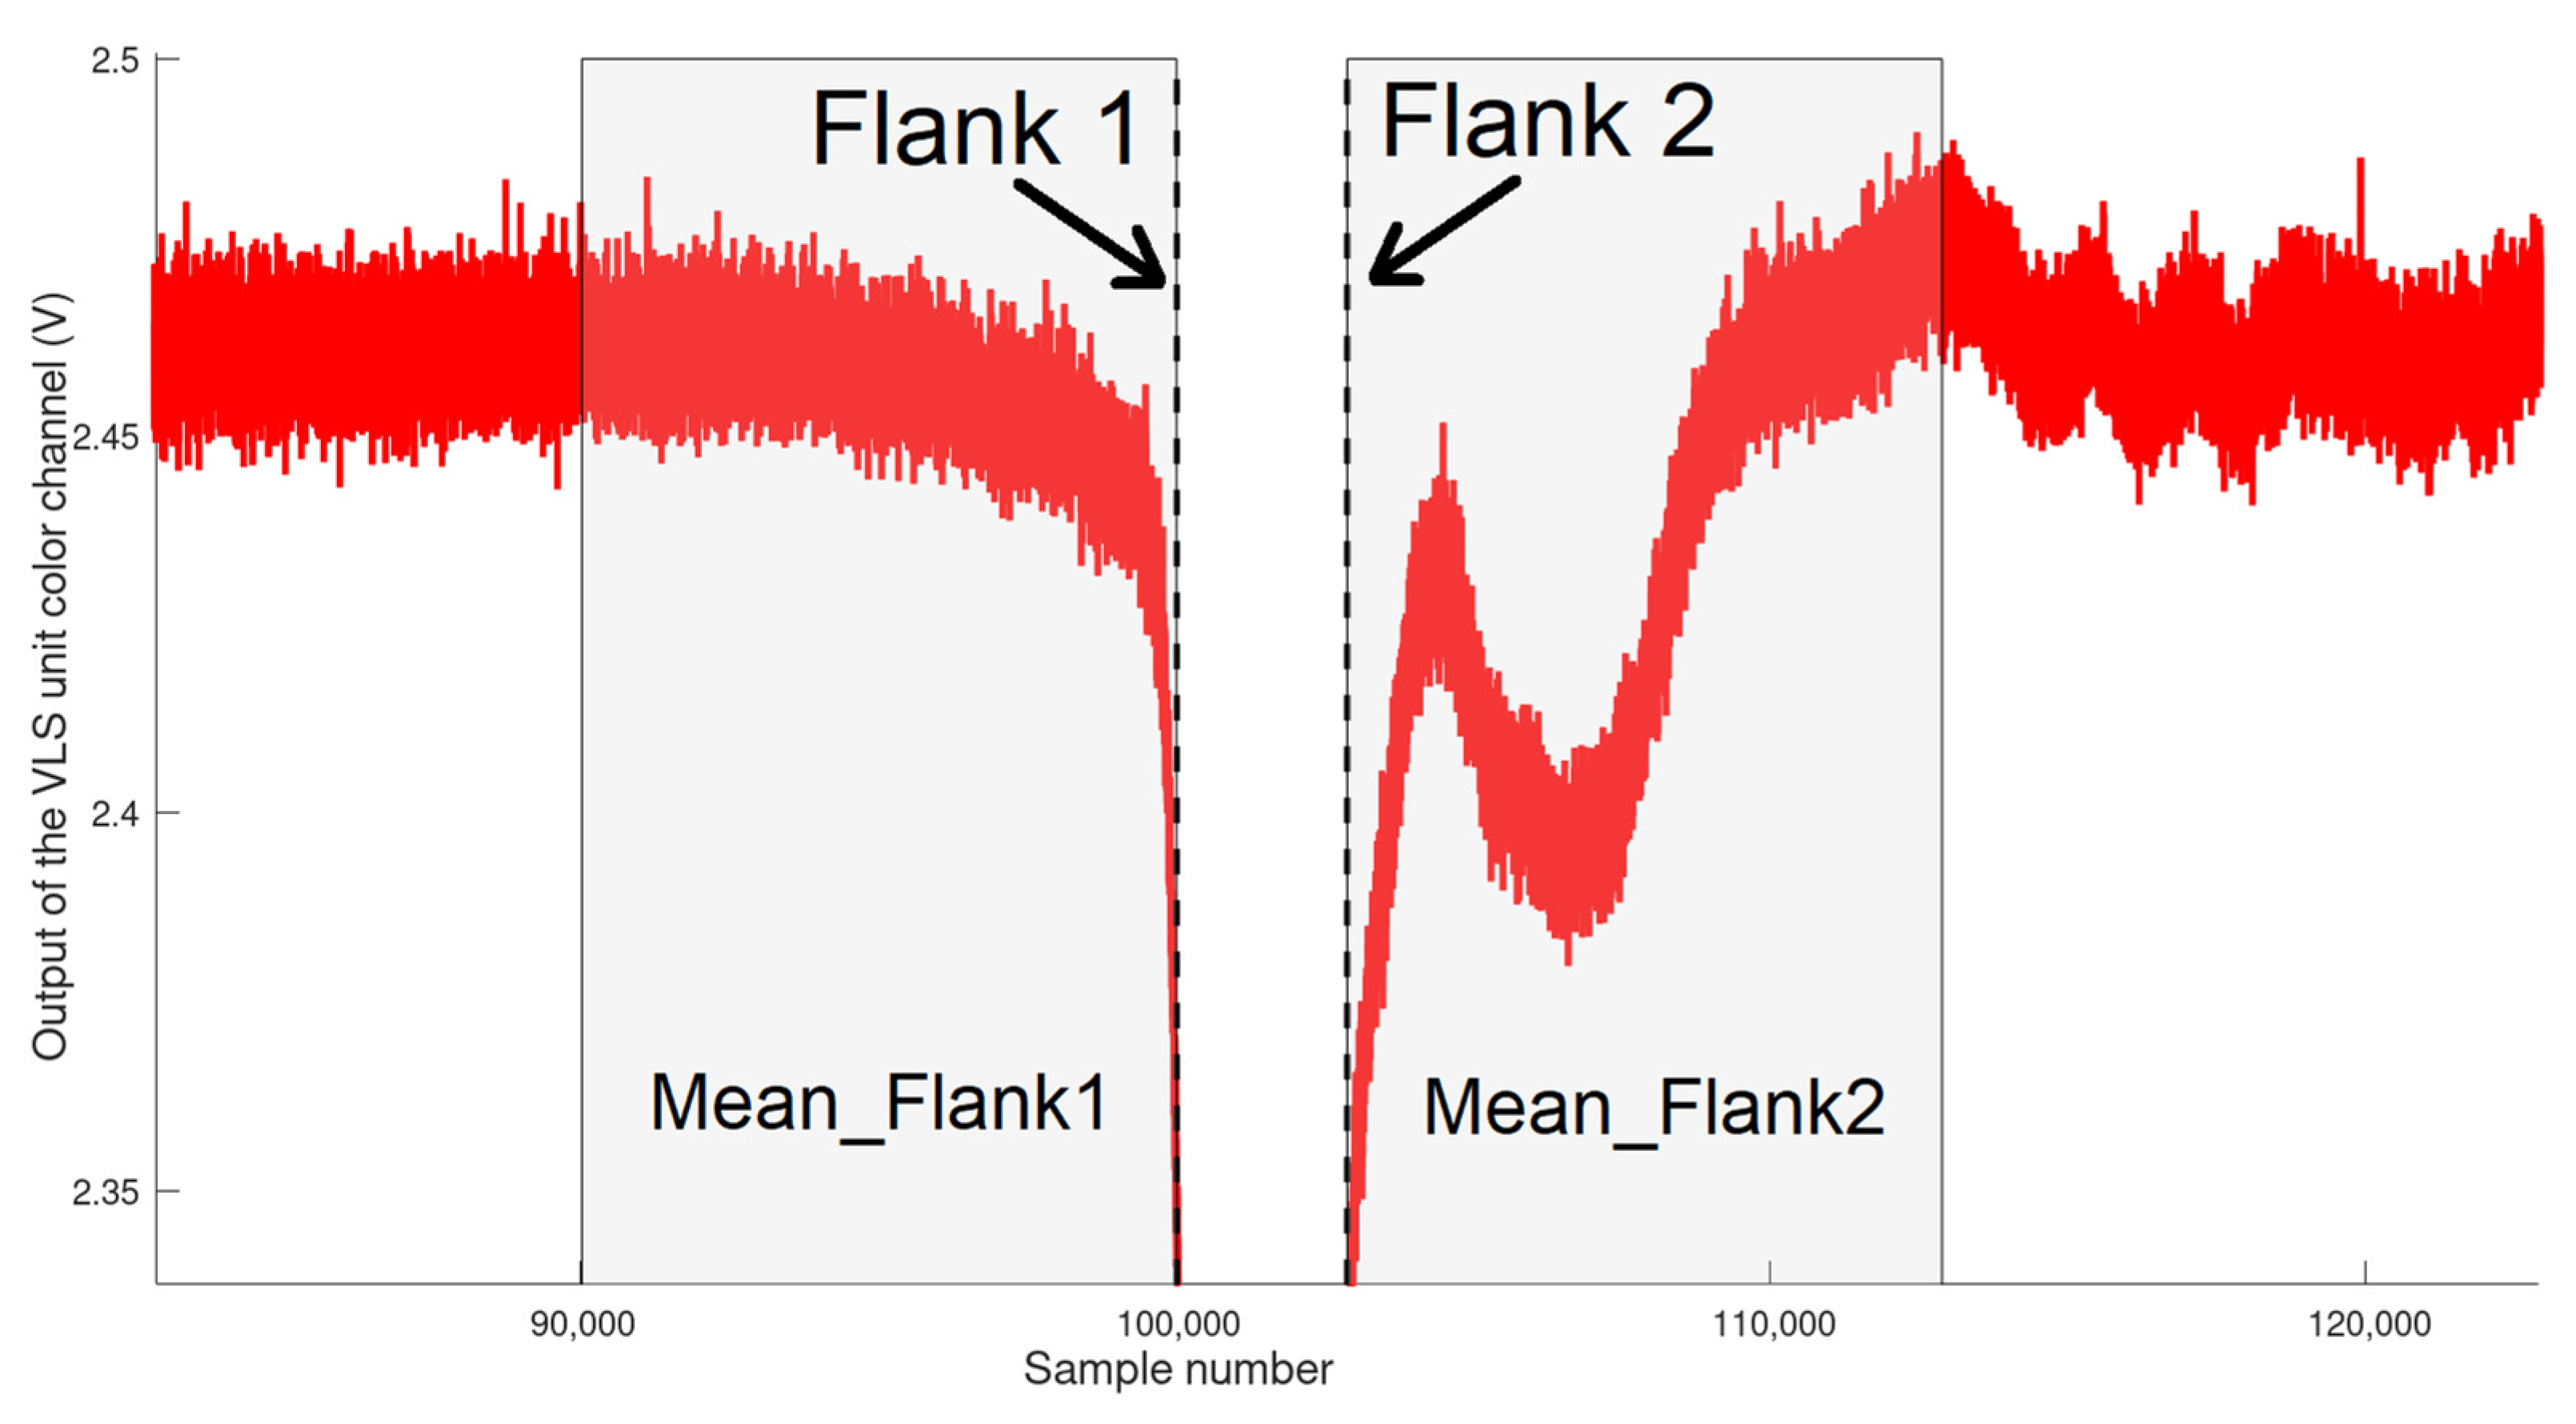
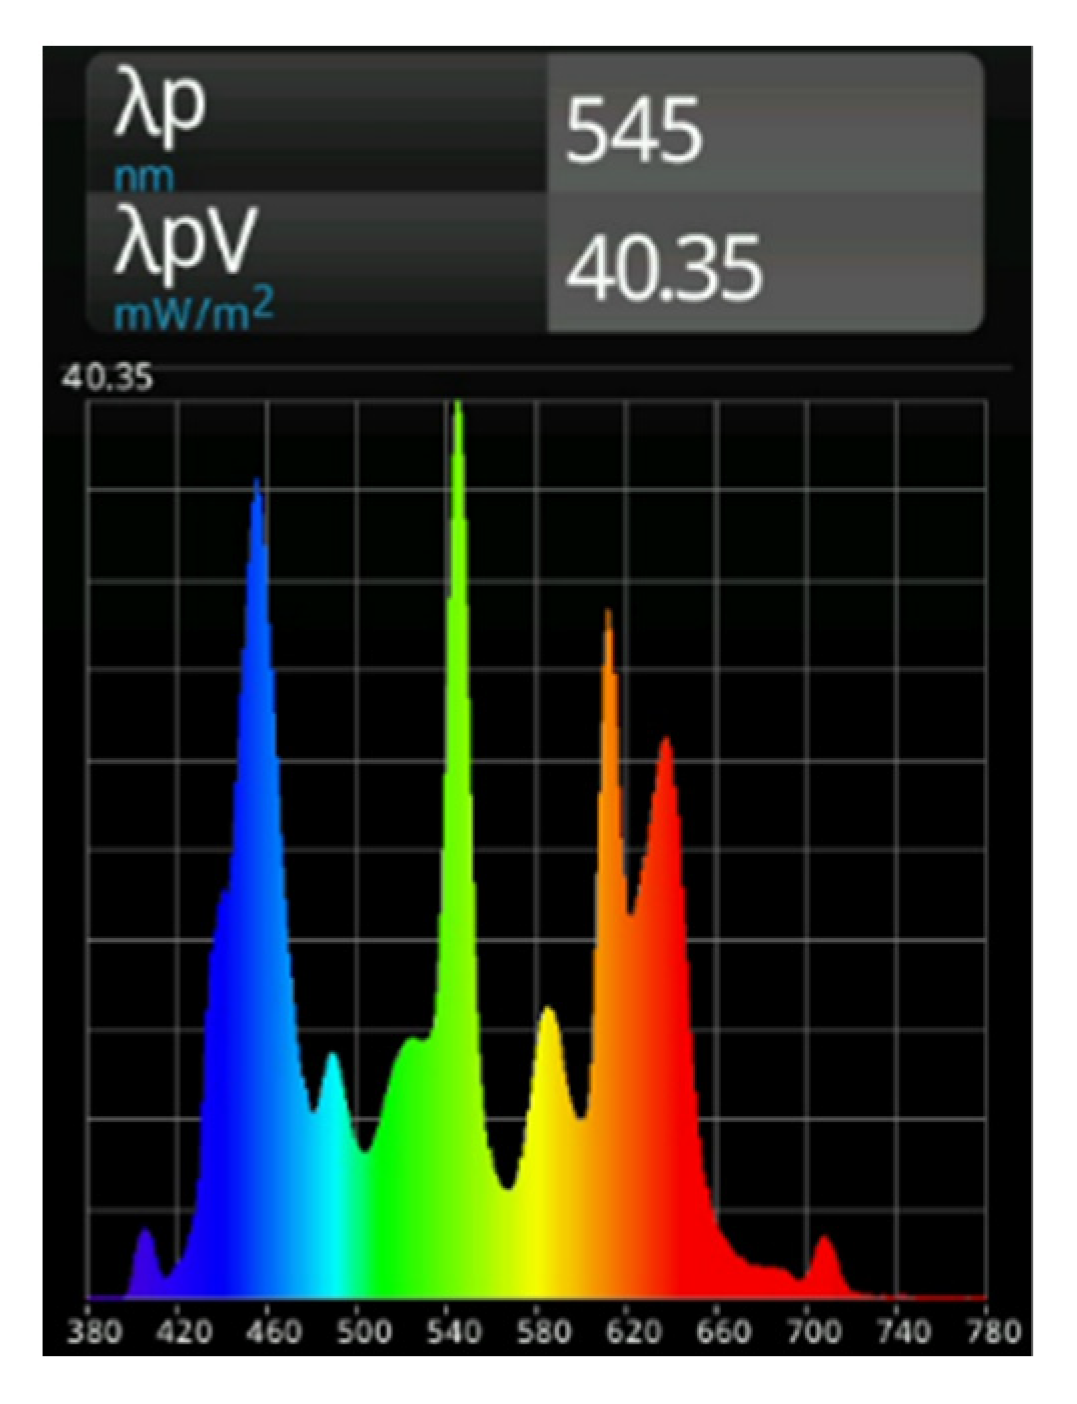
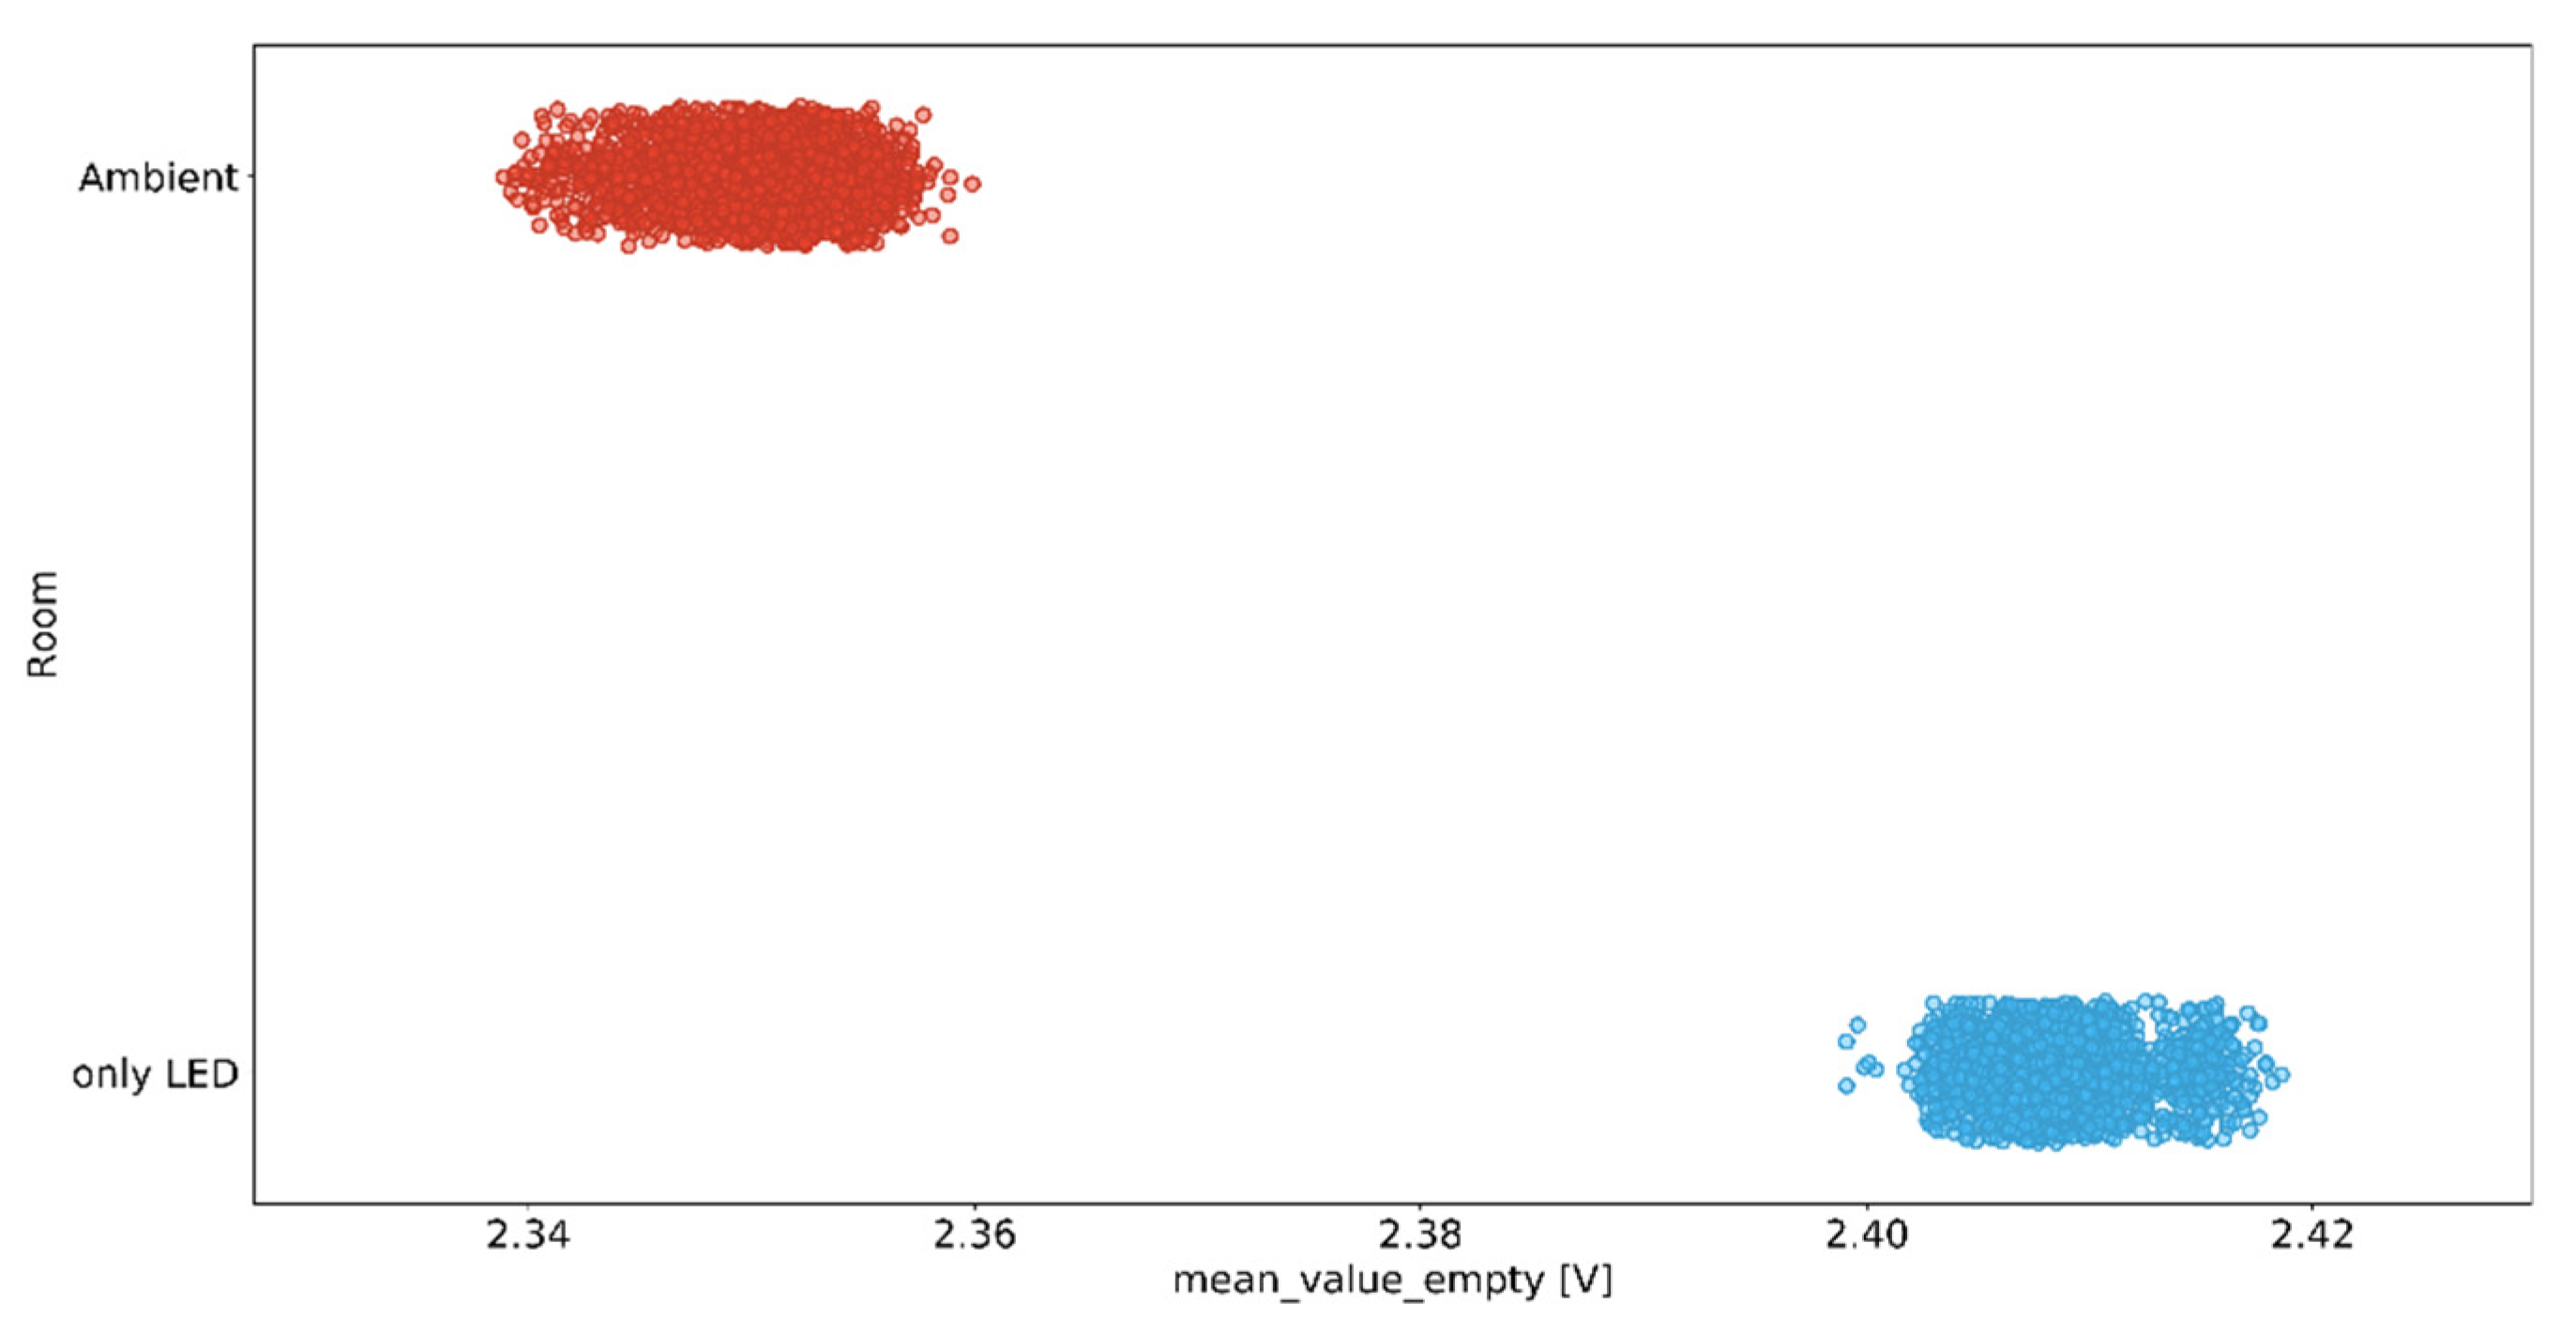
Publisher’s Note: MDPI stays neutral with regard to jurisdictional claims in published maps and institutional affiliations. |
© 2021 by the authors. Licensee MDPI, Basel, Switzerland. This article is an open access article distributed under the terms and conditions of the Creative Commons Attribution (CC BY) license (https://creativecommons.org/licenses/by/4.0/).