
An Emergency Message Routing Protocol for Improved Congestion Management in Hybrid RF/VLC VANETs


Abstract
:1. Introduction
1.1. Background
1.2. Paper Outline and Contributions
- The VLC helps in offloading some traffic from the RF spectrum, thereby avoiding the need for additional RF access points in places where the LOS dominates.
- Multi-hop relaying avoids the need for universal RF coverage, leading to infrastructure cost reduction.
- The location privacy afforded by the VLC could reduce the costs of more complex identity/tracing systems on the RF side.
- Propose a zone-based resource optimization and topology mapping method enabling congestion-aware protocols.
- Develop an emergency broadcasting mechanism leveraging dynamic resource assignments for reliable multicasting under disruption.
- Introduce a vehicle consensus-based predictive response integrated with adaptive signaling for coordinating relief across network divisions.
2. Related Work
- Prior work focuses on general connectivity but does not fully develop the coordination protocols required to ensure reliable message dissemination even when direct links are intermittent or disrupted.
- Existing approaches lack dynamic adaptation to changing traffic flows and topologies, limiting their responsiveness under real-world congestion.
- Bottlenecks at intersections where incidents are most critical are not comprehensively addressed. Scalable solutions optimized for these dense merge areas are needed.
- Proactive mitigation of emergent jams through predictive clearance strategies coordinated across network partitions has seen little attention.
- Reliability of emergency alert dissemination: We investigate techniques like coordinated VLC/RF retransmissions and aerial-assisted routing to maximize reliability under high congestion/disruption conditions not fully addressed before.
- Responsiveness to dynamic traffic environments: The dynamic mapping of topology via real-time beaconing allows our system to adapt broadcasts/routing based on varying loads/topologies, improving emergency response time compared to static schemes.
- Resilience against intermittent link interruptions: Leveraging both short-range localized VLC and longer-range multi-hop RF routing provides redundancy that enhances dissemination even when direct connections are blocked.
- Scalability for dense intersection scenarios: Prior clustering/position-based methods may struggle in dense merging areas, but we propose a VLC/RF/aerial solution specifically optimized for these critical emergency zones.
3. System Model
3.1. Description
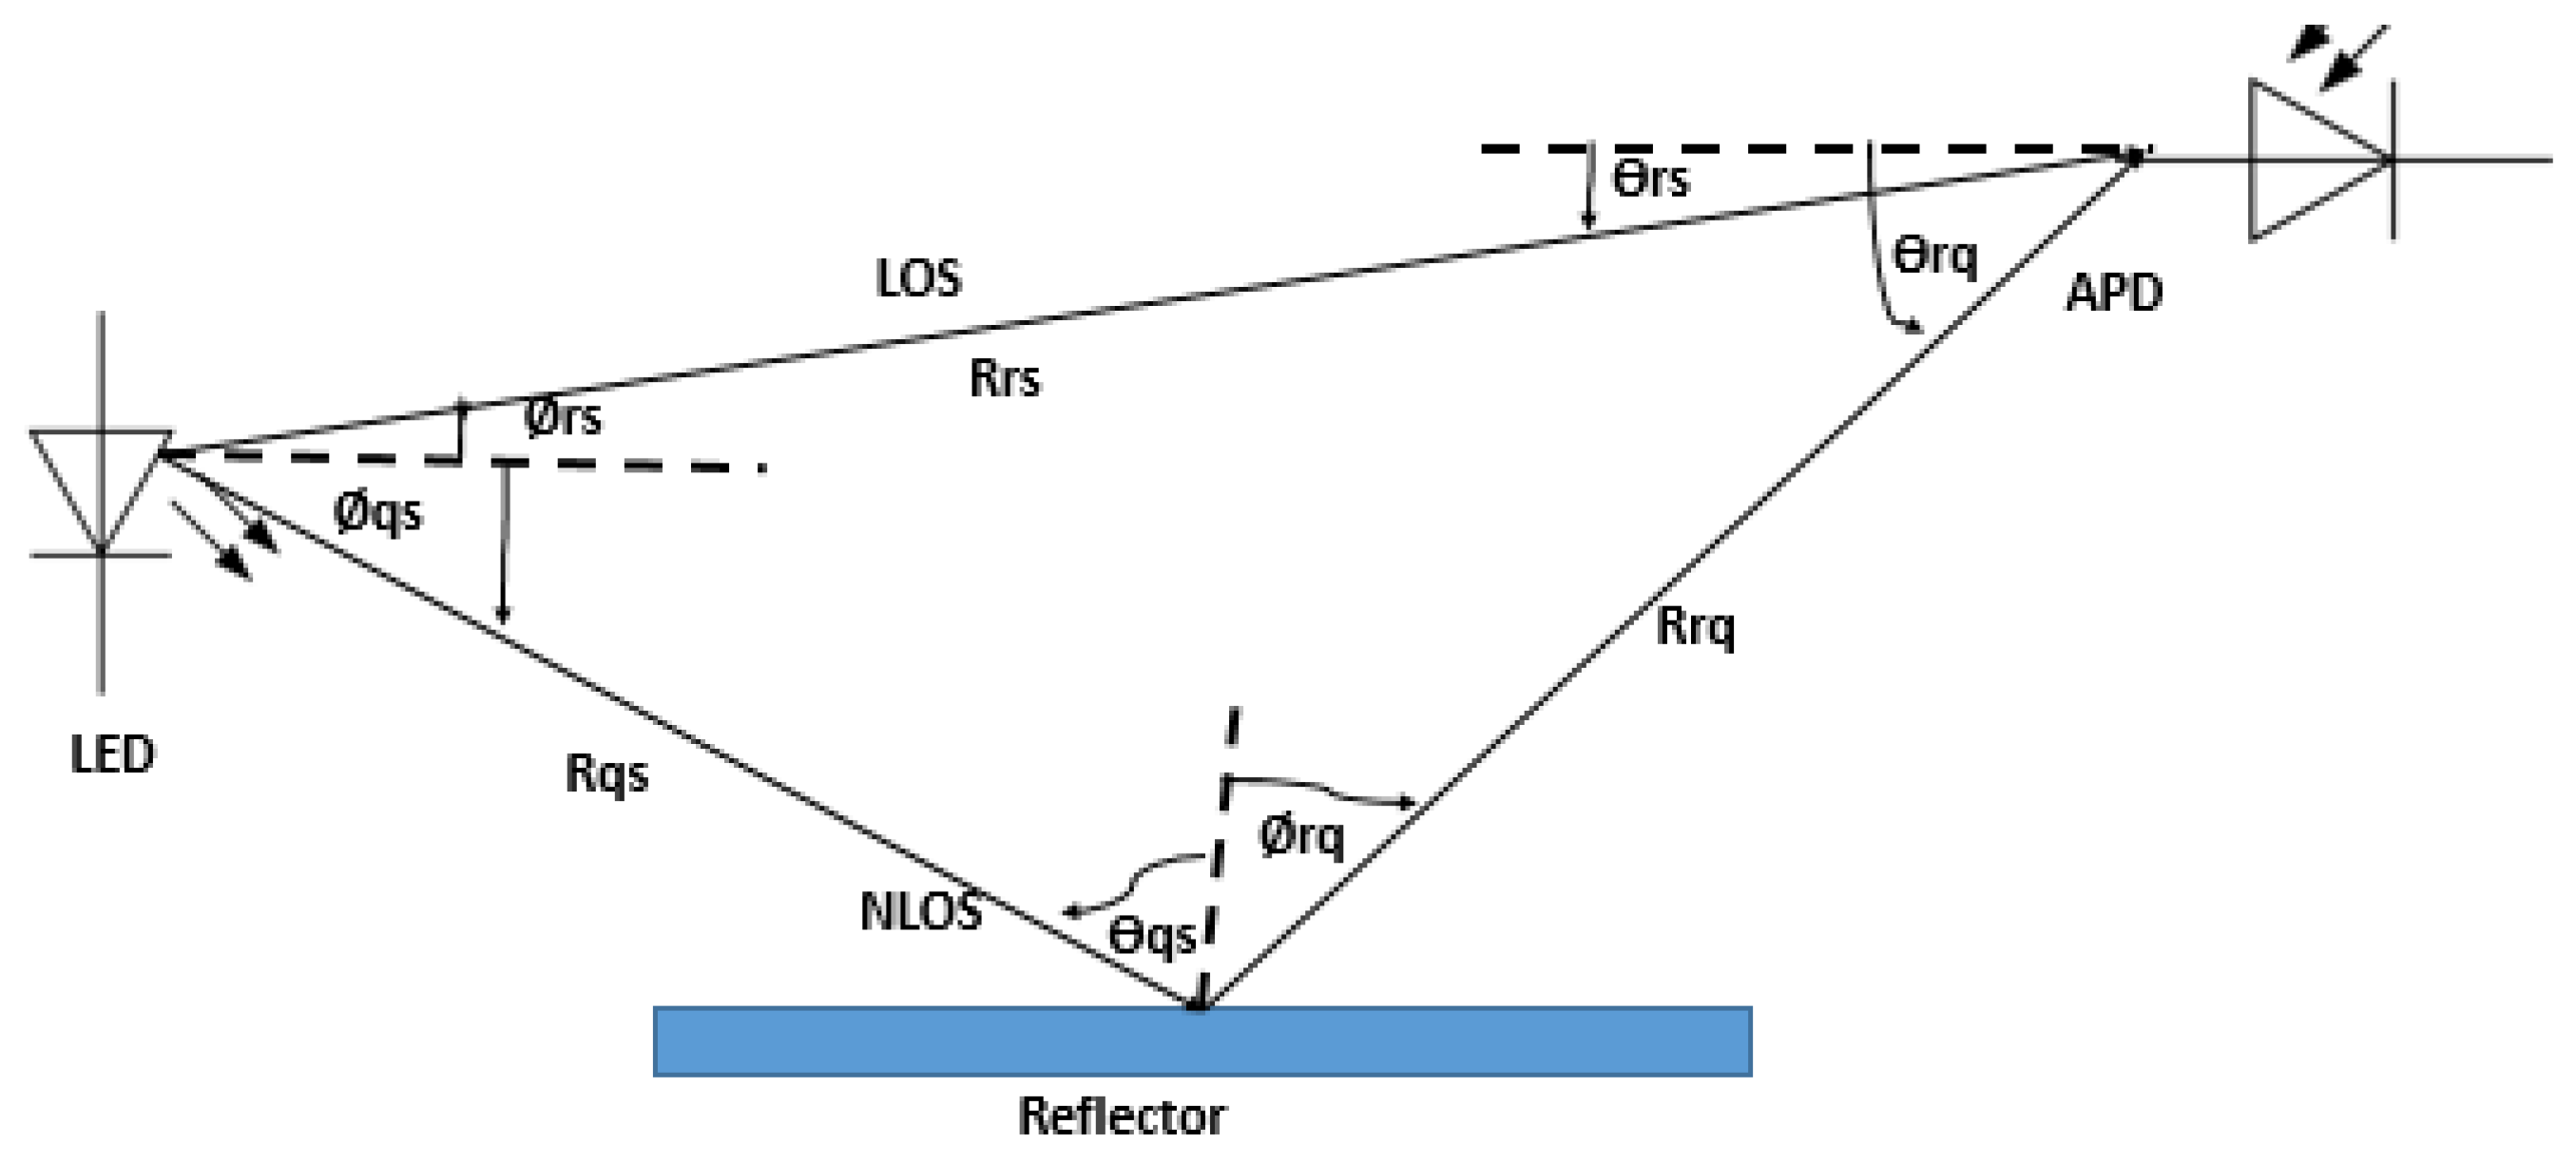
3.2. Modeling the Channel for VLC and RF Links and the Multi-Hop Propagation
4. Algorithm Description
4.1. Initial Messages
4.2. Considered Scenarios
4.3. Congestion Management Algorithm
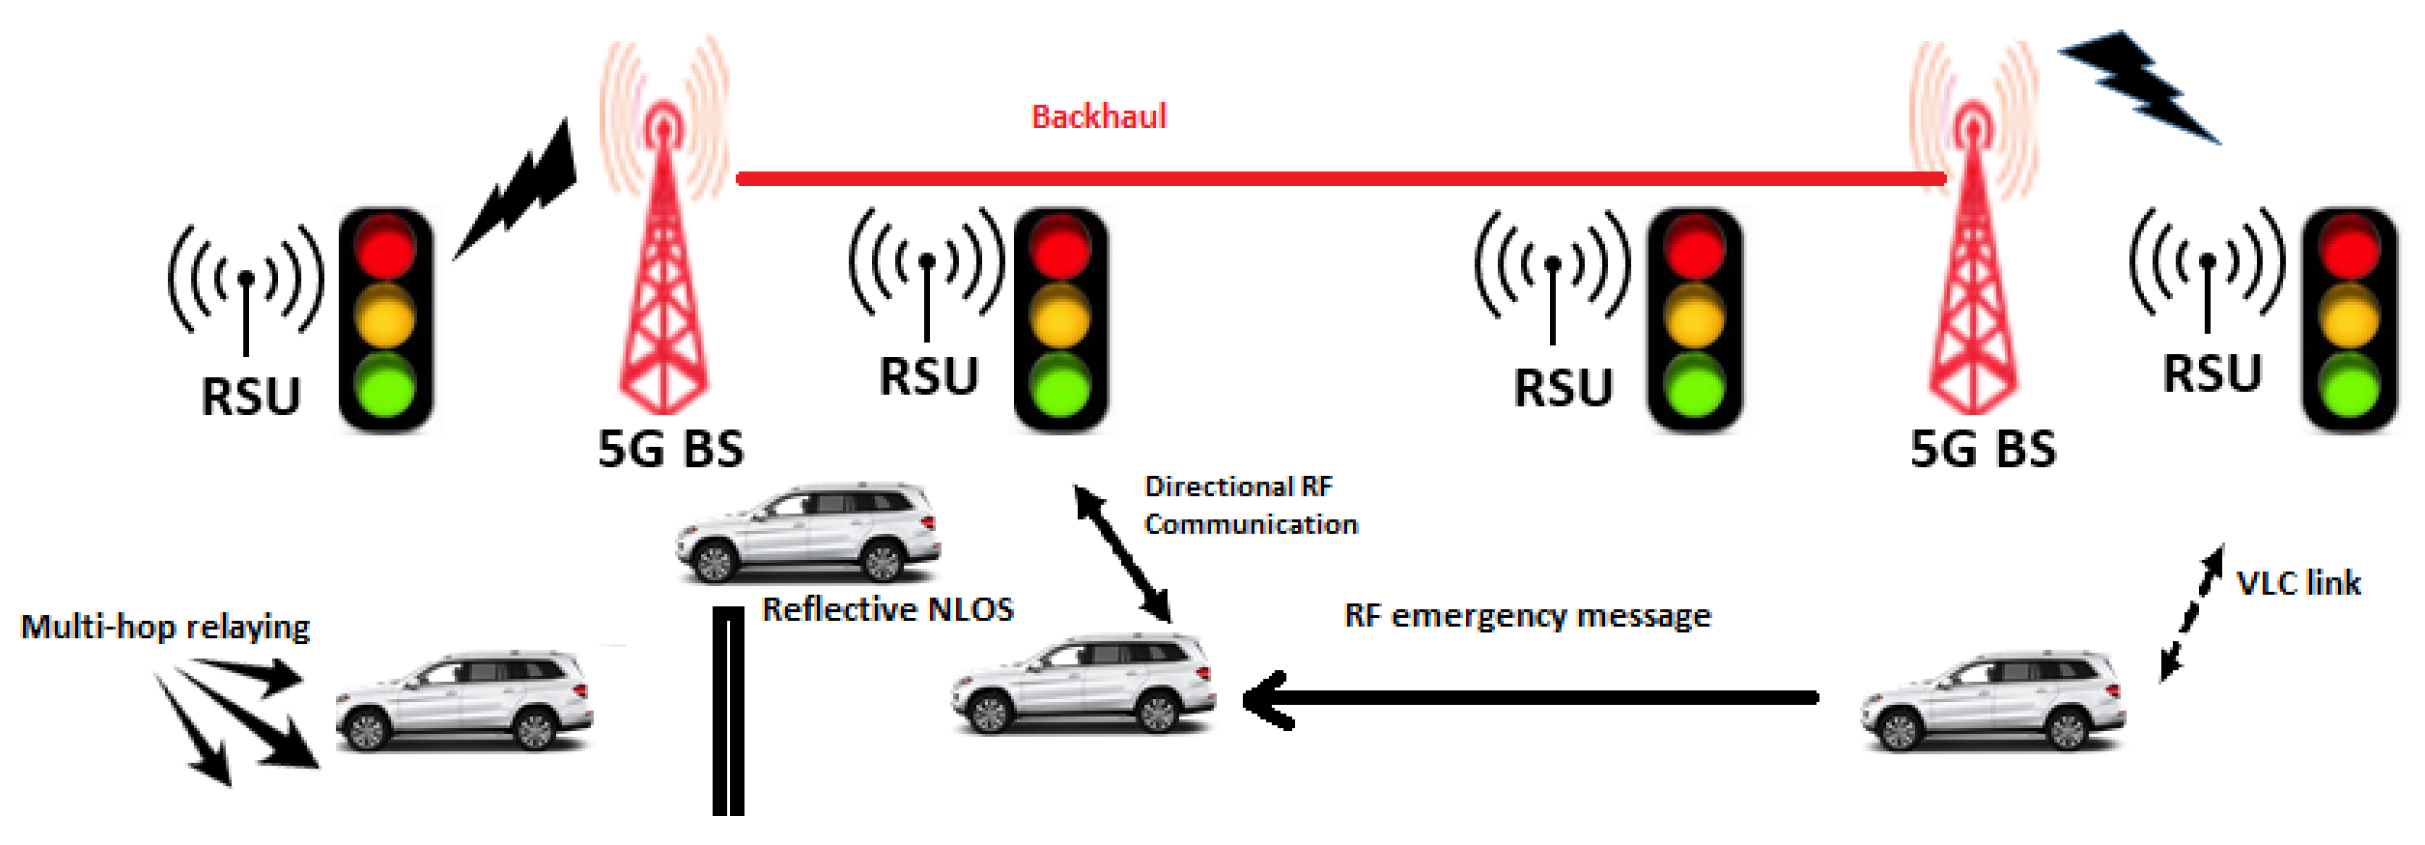
- It leverages a hybrid RF/VLC system to collect real-time vehicular trajectory and traffic flow data. Specifically, RF signals are used to broadcast alerts and collect decentralized probe vehicle updates, while VLC is used for localized vehicle-to-infrastructure data sharing at intersections and congested spots.
- By fusing data from both the RF and VLC systems, the scheme is able to detect congestion in a more accurate, robust, and timely manner compared to conventional methods. The RF data provides a macro view of traffic flows over a wide area, while the localized VLC data at intersections provides micro-level visibility into vehicle interactions and queue formations.
- Safety: This is estimated using metrics such as the speed differentials which correlate to the crash risk perceptions.
- Delay: This is measured as the differences from the free-flow travel times since longer delays do lower satisfaction.
- Predictability: This is captured by the variability or uncertainty in the travel times, as higher predictability increases satisfaction.
4.4. Proposed Routing Protocol
| Algorithm 1 Proposed Routing Protocol |
| Input: Traffic data T, interference maps I at each RSU Output: Optimal channel/beam assignments
|
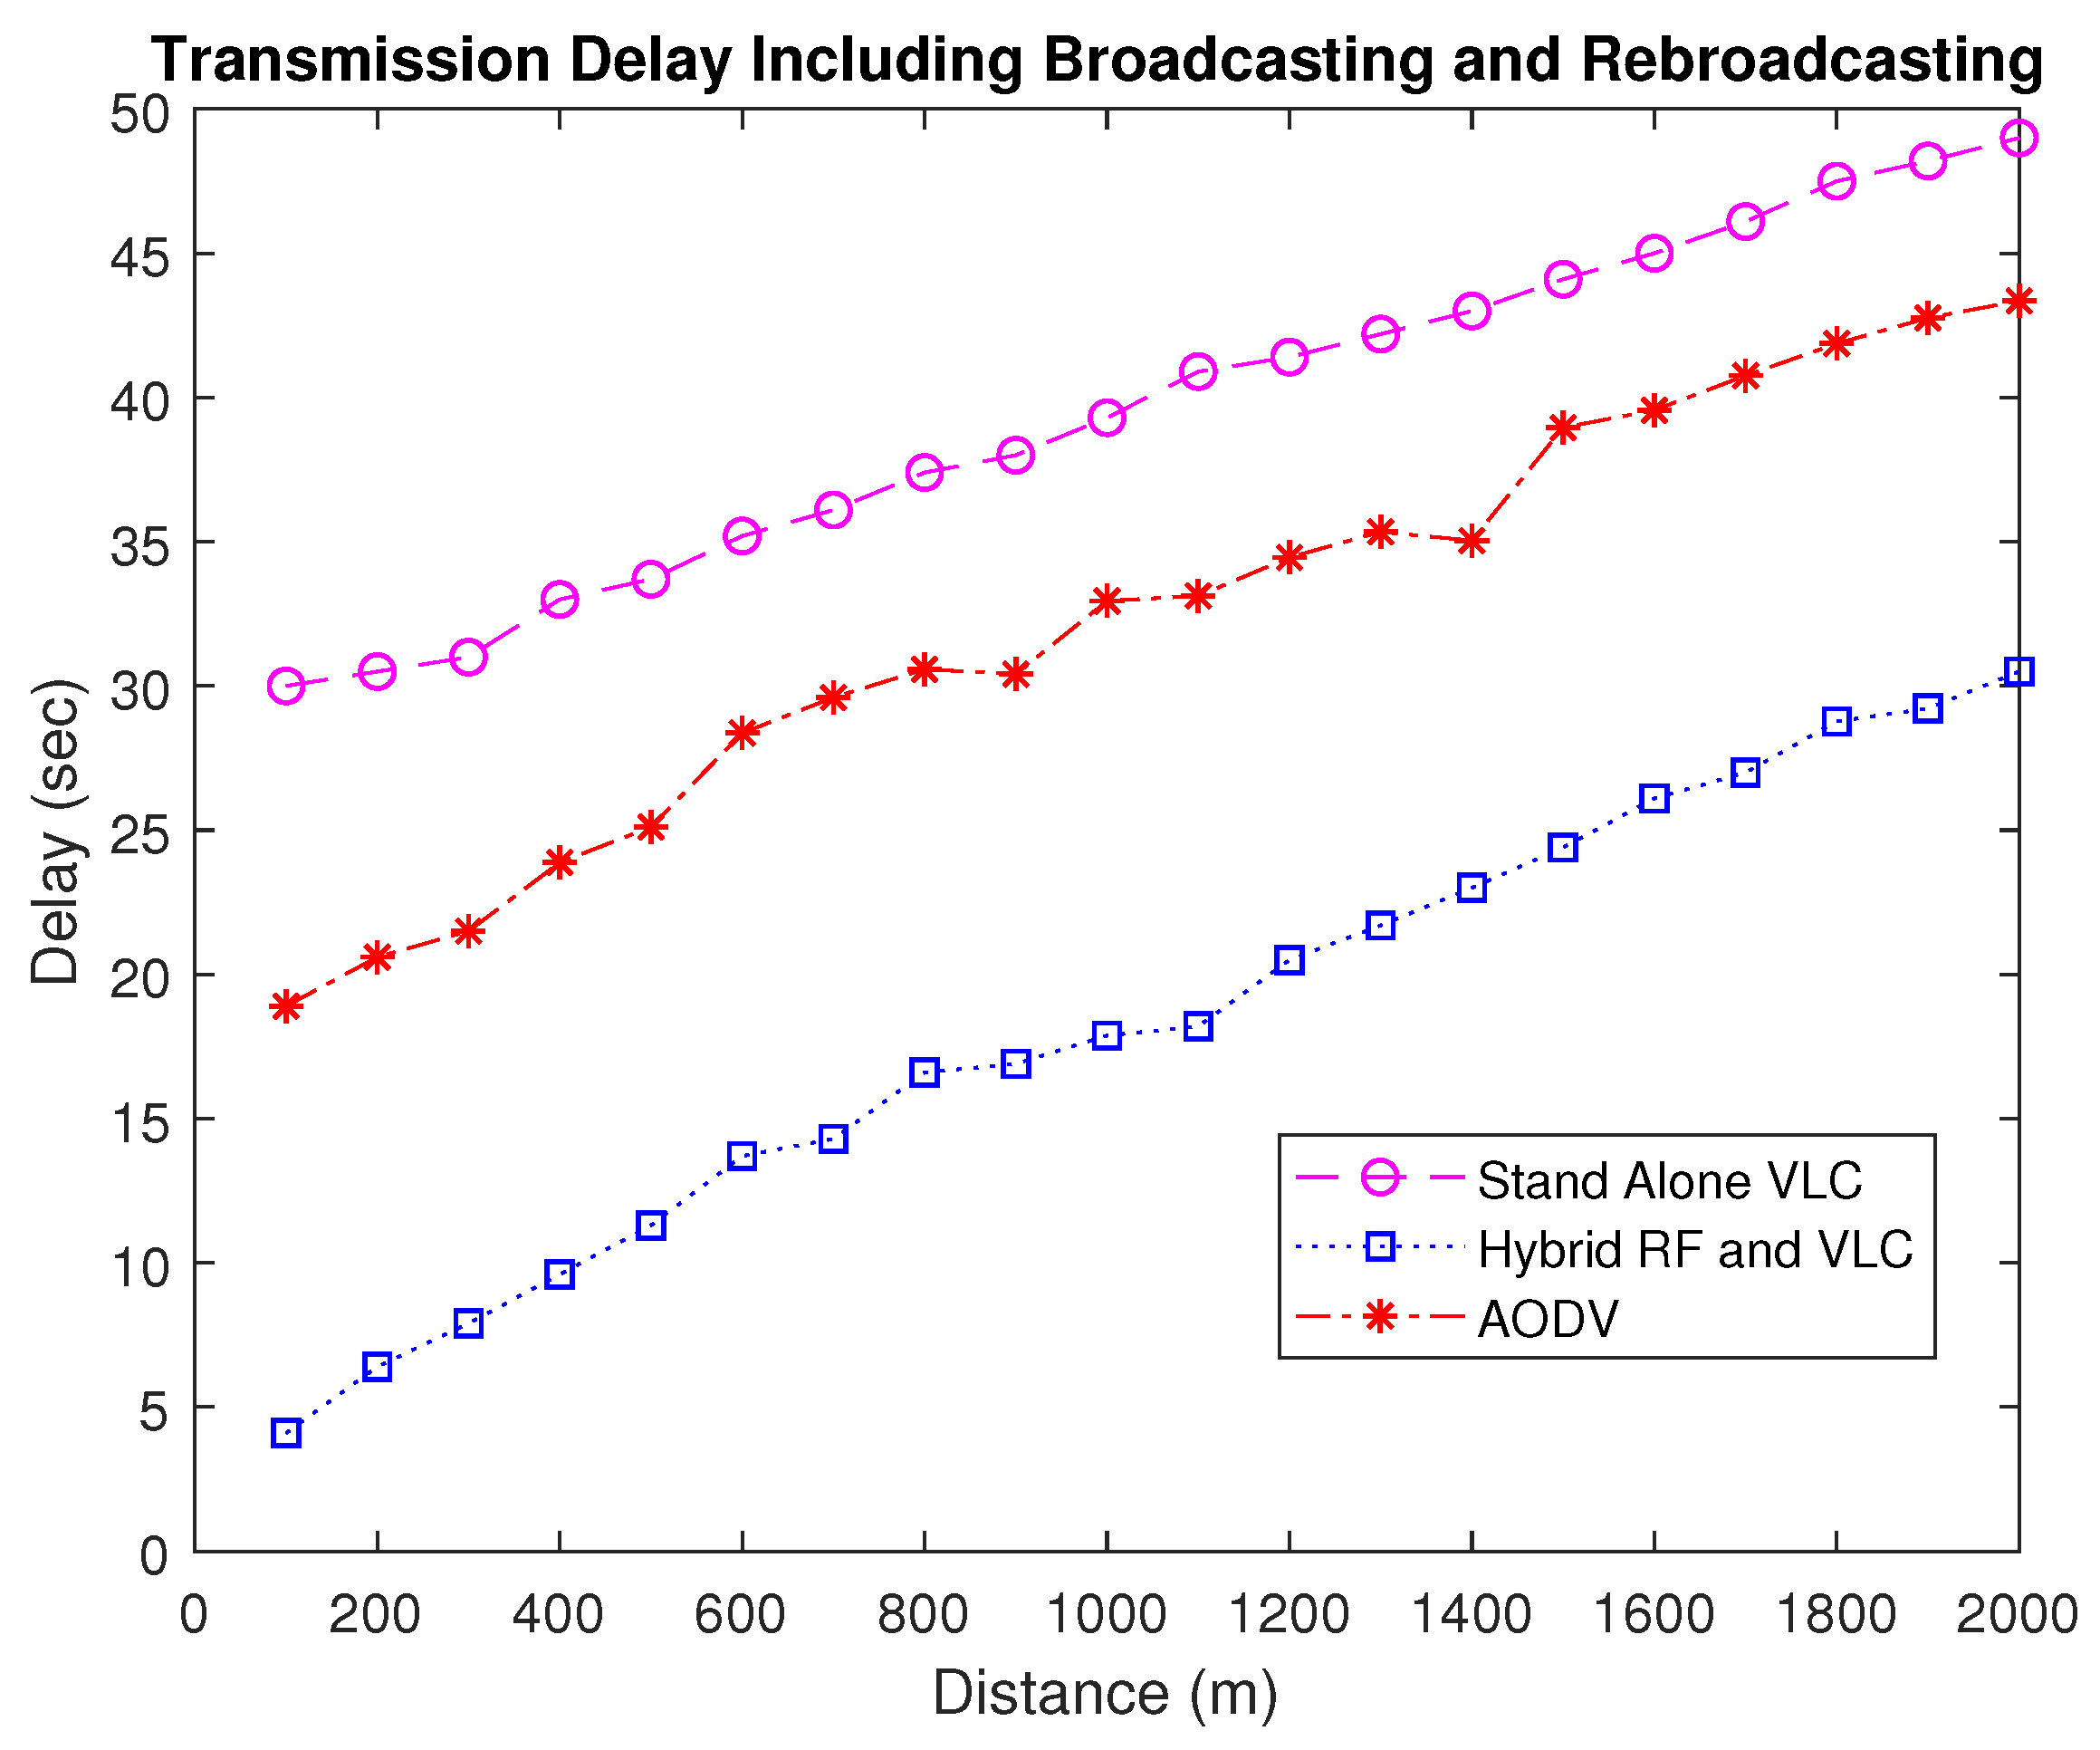
5. Simulation and Performance Analysis
6. Conclusions
Author Contributions
Funding
Data Availability Statement
Acknowledgments
Conflicts of Interest
Abbreviations
| VANET | Vehicular Ad-hoc Network |
| MANET | Mobile Ad-Hoc Network |
| RF | Radio Frequency |
| VLC | Visible Light Communication |
| LoS | Line of Sight |
| NLoS | Non Line of Sight |
| OBU | Onboard Unit |
| DSRC | Dedicated Short Range Communications |
| SRC | safety Related Critical |
| ITS | Intelligent Transport Systems |
| V2V | Vehicle-to-Vehicle |
| RSU | Roadside Unit |
| V2I | Vehicle-to-Infrastructure |
| WSM | WAVE Short Message |
| LED | Light Emitting Diode |
| UMBP | Urban Multi-hop Broadcast Protocol |
| CRB | Cluster-Based Recursive Broadcast |
| CH | Cluster Head |
| CDSF | ConnectedDominating Set-based Forwarding |
| VP-CAST | Velocity and Position-based Broadcast Suppression |
| TBGR | Trust-Based Geographical Routing |
| APD | Avalanche Photo Diode |
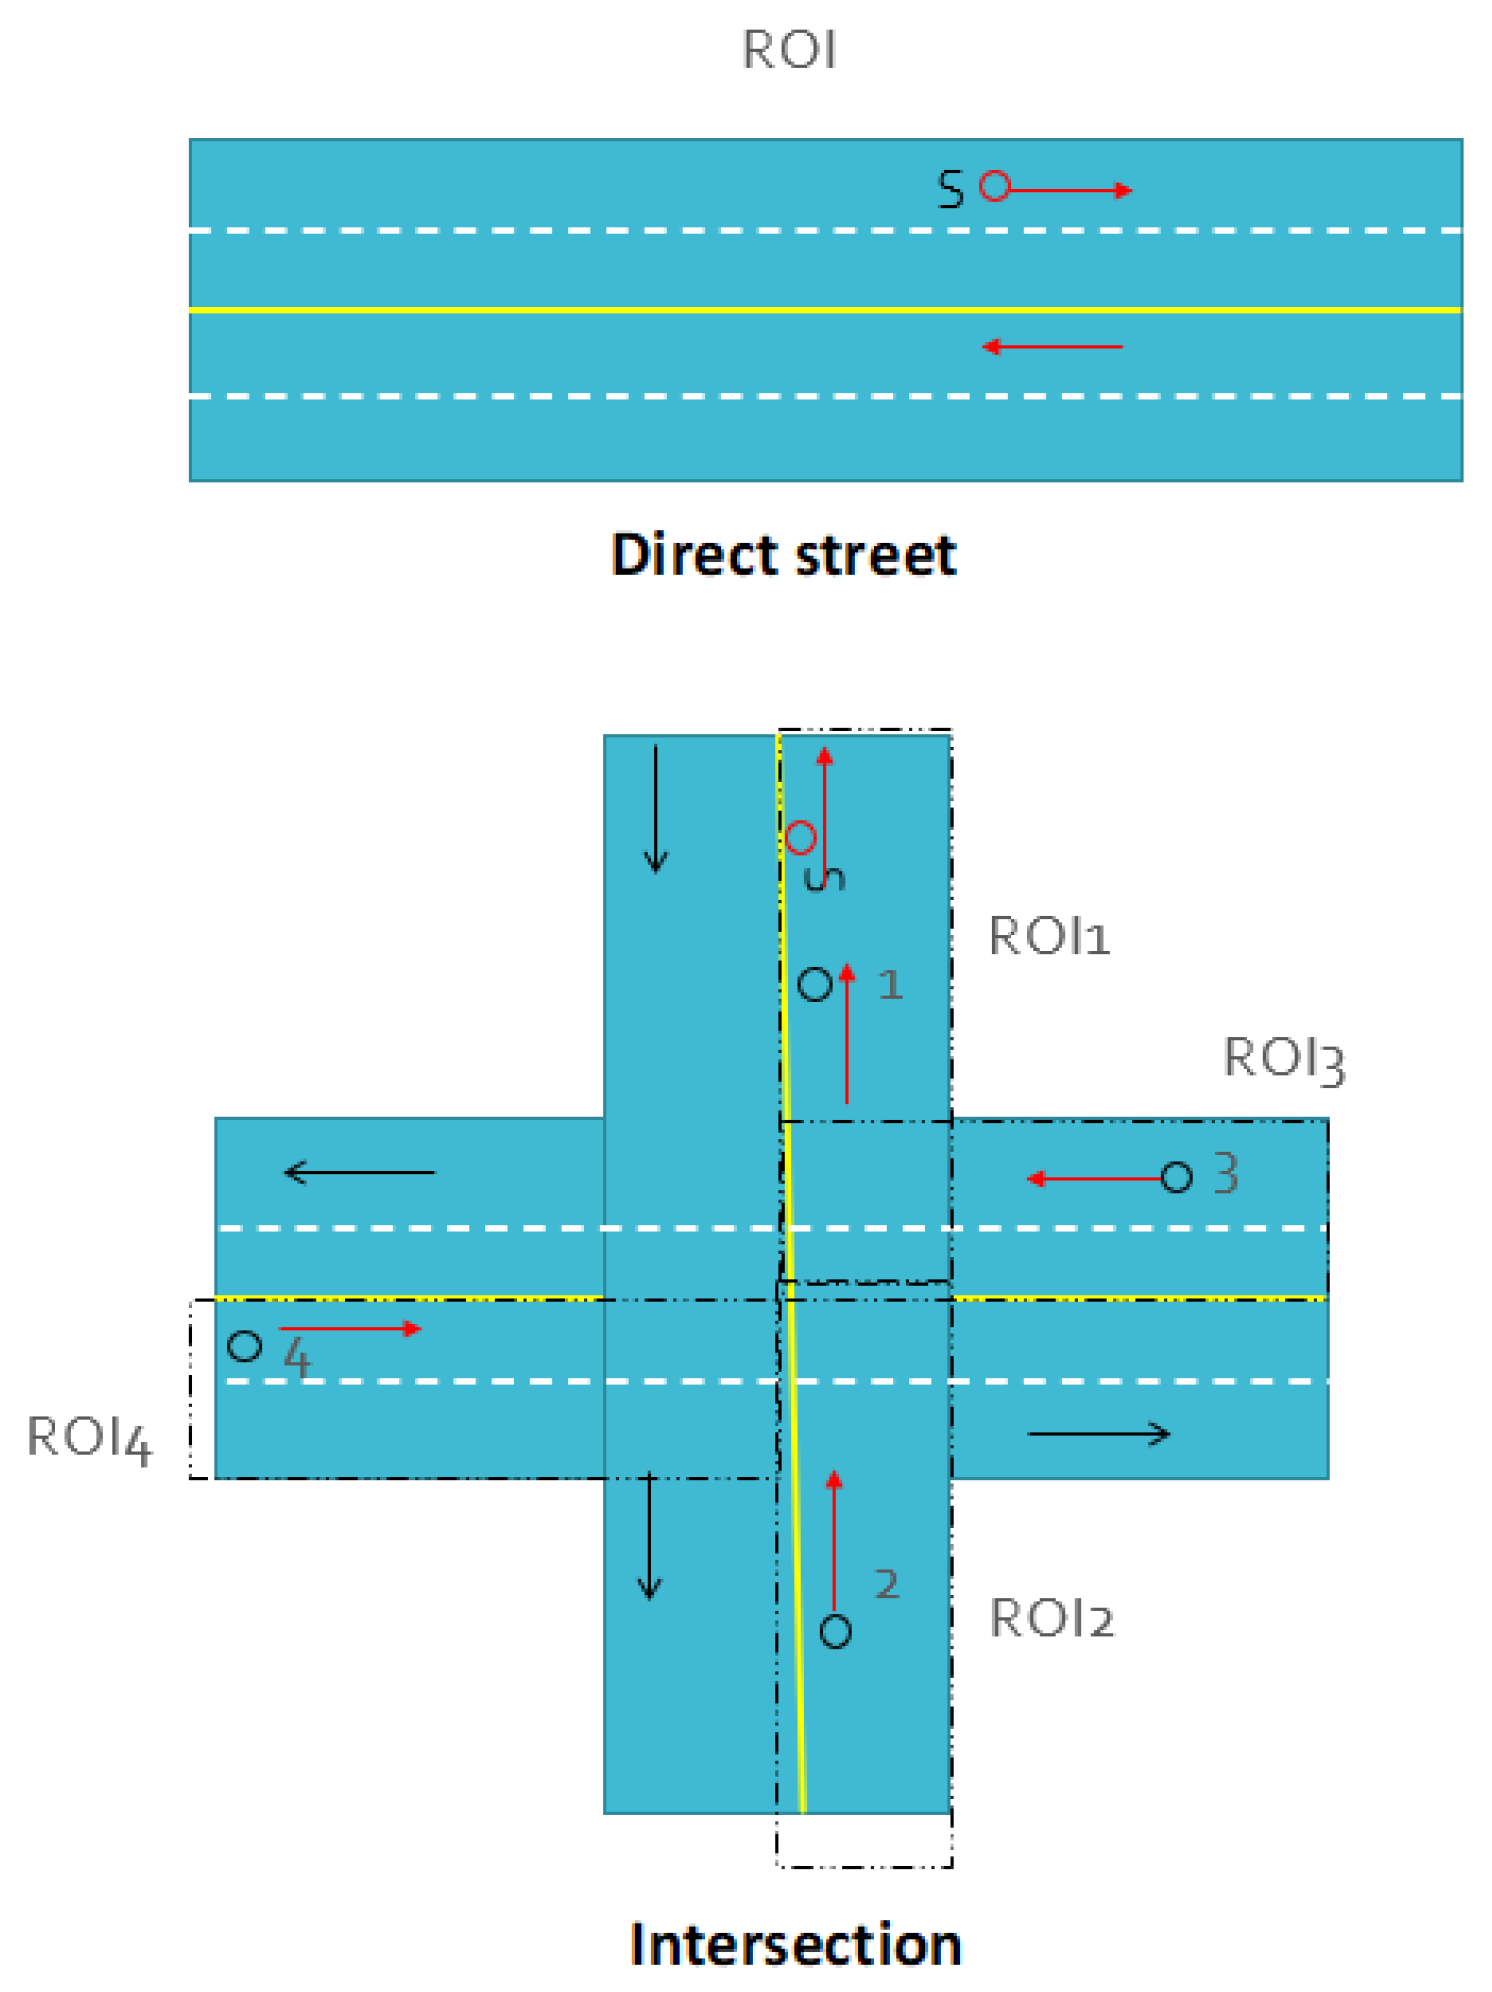
| ROI | Region of Interest |
| CIR | Channel Impulse Response |
| UDP | User Datagram Protocol |
| LWR | Lighthill-Whitham-Richards |
| RSSI | Received Signal Strength Indication |
| C-V2X | Cellular Vehicular-to-Everything |
| V2X | Vehicular-to-Everything |
References
- Abdelkader, G.; Elgazzar, K.; Khamis, A. Connected Vehicles: Technology Review, State of the Art, Challenges and Opportunities. Sensors 2021, 21, 7712. [Google Scholar] [CrossRef] [PubMed]
- Mahi, M.J.N.; Chaki, S.; Ahmed, S.; Biswas, M.; Kaiser, M.S.; Islam, M.S.; Sookhak, M.; Barros, A.; Whaiduzzaman, M. A review on VANET research: Perspective of recent emerging technologies. IEEE Access 2022, 10, 65760–65783. [Google Scholar] [CrossRef]
- Bedford, M.D.; Kennedy, G.A.; Foster, P.J. Radio transmission characteristics in tunnel environments. Min. Technol. 2017, 126, 77–87. [Google Scholar] [CrossRef]
- Hussein, N.H.; Yaw, C.T.; Koh, S.P.; Tiong, S.K.; Chong, K.H. A Comprehensive Survey on Vehicular Networking: Communications, Applications, Challenges, and Upcoming Research Directions. IEEE Access 2022, 10, 86127–86180. [Google Scholar] [CrossRef]
- Patil, A.; Muthuchidambaranathan, P.; Shet, N.S.V. Congestion control mechanisms in vehicular networks: A perspective on Internet of vehicles (IoV). In Autonomous and Connected Heavy Vehicle Technology; Elsevier: Amsterdam, The Netherlands, 2022; pp. 211–224. [Google Scholar]
- Balzano, W.; Lanuto, A.; Mascia, C.; Stranieri, S. Hierarchical VANET: A Traffic Congestion Management Approach Based on Critical Points. In Proceedings of the International Conference on P2P, Parallel, Grid, Cloud and Internet Computing, Tirana, Albania, 27–29 October 2022; Springer: Berlin/Heidelberg, Germany, 2022; pp. 192–202. [Google Scholar]
- Subramaniam, M.; Rambabu, C.; Chandrasekaran, G.; Kumar, N.S. A traffic density-based congestion control method for VANETs. Wirel. Commun. Mob. Comput. 2022, 2022, 7551535. [Google Scholar] [CrossRef]
- Mohammed, N.; Kadhim, R.A. Congestion Control in VANETs based on Message Rate Adaptation by the Exponential Function. In Proceedings of the 2022 5th International Seminar on Research of Information Technology and Intelligent Systems (ISRITI), Online, 8–9 December 2022; IEEE: Piscataway, NJ, USA, 2022; pp. 24–28. [Google Scholar]
- Sudhamani, C.; Roslee, M.; Tiang, J.; Rehman, A. A Survey on 5G Coverage Improvement Techniques: Issues and Future Challenges. Sensors 2023, 23, 2356. [Google Scholar] [CrossRef] [PubMed]
- Fung, C.C.; Yogarayan, S.; Razak, S.F.A.; Azman, A. A Review Study of IEEE 802.11 p On-Board Unit for V2X Deployment. In Proceedings of the 2023 11th International Conference on Information and Communication Technology (ICoICT), Melaka, Malaysia, 23–24 August 2023; IEEE: Piscataway, NJ, USA, 2023; pp. 165–171. [Google Scholar]
- Cruz, L.E.P. Visible Light Communication Control in a Platoon Vehicle Environment. Ph.D. Thesis, Université Paris-Saclay, Paris, France, 2022. [Google Scholar]
- Banani, S.; Gordon, S.; Thiemjarus, S.; Kittipiyakul, S. Verifying Safety Messages Using Relative-Time and Zone Priority in Vehicular Ad Hoc Networks. Sensors 2018, 18, 1195. [Google Scholar] [CrossRef]
- Muzahid, A.J.M.; Kamarulzaman, S.F.; Rahman, M.A.; Murad, S.A.; Kamal, M.A.S.; Alenezi, A.H. Multiple vehicle cooperation and collision avoidance in automated vehicles: Survey and an AI-enabled conceptual framework. Sci. Rep. 2023, 13, 603. [Google Scholar] [CrossRef]
- Shabir, B.; Khan, M.A.; Rahman, A.U.; Malik, A.W.; Wahid, A. Congestion Avoidance in Vehicular Networks: A Contemporary Survey. IEEE Access 2019, 7, 173196–173215. [Google Scholar] [CrossRef]
- Malik, S.; Sahu, P. A comparative study on routing protocols for VANETs. Heliyon 2019, 5, e02340. [Google Scholar] [CrossRef]
- Wahid, I.; Ikram, A.A.; Ahmad, M.; Ali, S.; Ali, A. State of the art routing protocols in VANETs: A review. Procedia Comput. Sci. 2018, 130, 689–694. [Google Scholar] [CrossRef]
- Shaaban, K.; Shamim, M.H.M.; Abdur-Rouf, K. Visible light communication for intelligent transportation systems: A review of the latest technologies. J. Traffic Transp. Eng. 2021, 8, 483–492. [Google Scholar] [CrossRef]
- Yin, R.R.; Cui, X.; Liu, S.; Song, X.; Zhu, H.H.; Ma, X. An intelligent clustering algorithm based on hybrid RF/VLC communication model for VANET. In Proceedings of the 2022 13th International Symposium on Communication Systems, Networks and Digital Signal Processing (CSNDSP), Porto, Portugal, 20–22 July 2022; IEEE: Piscataway, NJ, USA, 2022; pp. 76–81. [Google Scholar]
- Obeed, M.; Salhab, A.M.; Alouini, M.S.; Zummo, S.A. On Optimizing VLC Networks for Downlink Multi-User Transmission: A Survey. IEEE Commun. Surv. Tutor. 2019, 21, 2947–2976. [Google Scholar] [CrossRef]
- Patil, P. A Survey on Emergency Message Transmission Protocol in VANET with Message Type Recognition: A Modified Neural Network Architecture. In Proceedings of the 2019 IEEE International Conference on Electrical, Computer and Communication Technologies (ICECCT), Coimbatore, India, 20–22 February 2019; IEEE: Piscataway, NJ, USA, 2019; pp. 1–5. [Google Scholar]
- Abuella, H.; Elamassie, M.; Uysal, M.; Xu, Z.; Serpedin, E.; Qaraqe, K.A.; Ekin, S. Hybrid RF/VLC Systems: A Comprehensive Survey on Network Topologies, Performance Analyses, Applications, and Future Directions. IEEE Access 2021, 9, 160402–160436. [Google Scholar] [CrossRef]
- Bi, Y.; Shan, H.; Shen, X.S.; Wang, N.; Zhao, H. A multi-hop broadcast protocol for emergency message dissemination in urban vehicular ad hoc networks. IEEE Trans. Intell. Transp. Syst. 2015, 17, 736–750. [Google Scholar] [CrossRef]
- Dong, W.; Lin, F.; Zhang, H.; Yin, Y. A cluster-based recursive broadcast routing algorithm to propagate emergency messages in city VANETs. In Proceedings of the 2017 IEEE 9th International Conference on Communication Software and Networks (ICCSN), Guangzhou, China, 6–8 May 2017; IEEE: Piscataway, NJ, USA, 2017; pp. 187–190. [Google Scholar]
- Boucetta, S.I.; Johanyák, Z.C. Optimized ad hoc multi-hop broadcast protocol for emergency message dissemination in vehicular ad hoc networks. Acta Polytech. Hung. 2022, 19, 23–42. [Google Scholar] [CrossRef]
- Tian, D.; Liu, C.; Duan, X.; Sheng, Z.; Ni, Q.; Chen, M.; Leung, V.C. A distributed position-based protocol for emergency messages broadcasting in vehicular ad hoc networks. IEEE Internet Things J. 2018, 5, 1218–1227. [Google Scholar] [CrossRef]
- Karpagalakshmi, R.C.; Vijayalakshmi, P.; Gowsic, K.; Rathi, R. An Effective Traffic Management System Using Connected Dominating Set Forwarding (CDSF) Framework for Reducing Traffic Congestion in High Density VANETs. Wirel. Pers. Commun. 2021, 119, 2725–2754. [Google Scholar] [CrossRef]
- Khan, A.; Siddiqui, A.A.; Ullah, F.; Bilal, M.; Piran, M.J.; Song, H. VP-CAST: Velocity and position-based broadcast suppression for VANETs. IEEE Trans. Intell. Transp. Syst. 2022, 23, 18512–18525. [Google Scholar] [CrossRef]
- Ramya Devi, M.; Jasmine Selvakumari Jeya, I.; Lokesh, S. Adaptive scheduled partitioning technique for reliable emergency message broadcasting in VANET for intelligent transportation systems. Automatika 2023, 64, 341–354. [Google Scholar] [CrossRef]
- Su, B.; Tong, L. Transmission Protocol of Emergency Messages in VANET Based on the Trust Level of Nodes. IEEE Access 2023, 11, 68243–68256. [Google Scholar] [CrossRef]
- Momen, M.M.A.; Fayed, H.A.; Aly, M.H.; Ismail, N.E.; Mokhtar, A. An efficient hybrid visible light communication/radio frequency system for vehicular applications. Opt. Quantum Electron. 2019, 51, 364. [Google Scholar] [CrossRef]
- Farahneh, H.; Mekhiel, C.; Khalifeh, A.; Farjow, W.; Fernando, X. Shadowing effects on visible light communication channels. In Proceedings of the 2016 IEEE Canadian Conference on Electrical and Computer Engineering (CCECE), Vancouver, BC, Canada, 15–18 May 2016; IEEE: Piscataway, NJ, USA, 2016; pp. 1–5. [Google Scholar]
- Farahneh, H.; Hussain, F.; Fernando, X. Performance analysis of adaptive OFDM modulation scheme in VLC vehicular communication network in realistic noise environment. EURASIP J. Wirel. Commun. Netw. 2018, 2018, 243. [Google Scholar] [CrossRef]
- Fernando, X.; Farahneh, H. Visible Light Communications; IOP Publishing: Bristol, UK, 2019; pp. 2053–2563. [Google Scholar] [CrossRef]
- Schulze, H. Frequency-domain simulation of the indoor wireless optical communication channel. IEEE Trans. Commun. 2016, 64, 2551–2562. [Google Scholar] [CrossRef]
- Hlawatsch, F.; Matz, G. Wireless Communications over Rapidly Time-Varying Channels; Academic Press: Cambridge, MA, USA, 2011. [Google Scholar]
- Klozar, L.; Prokopec, J. Propagation path loss models for mobile communication. In Proceedings of the 21st International Conference Radioelektronika 2011, Brno, Czech Republic, 19–20 April 2011; IEEE: Piscataway, NJ, USA, 2011; pp. 1–4. [Google Scholar]
- Council, N.S. Type of Crash. 2021. [Google Scholar]
- Nadeem, T.; Dashtinezhad, S.; Liao, C.; Iftode, L. TrafficView: Traffic data dissemination using car-to-car communication. ACM SIGMOBILE Mob. Comput. Commun. Rev. 2004, 8, 6–19. [Google Scholar] [CrossRef]
- Mazaré, P.E.; Dehwah, A.H.; Claudel, C.G.; Bayen, A.M. Analytical and grid-free solutions to the Lighthill–Whitham–Richards traffic flow model. Transp. Res. Part B Methodol. 2011, 45, 1727–1748. [Google Scholar] [CrossRef]
- Qiu, S.; Abdelaziz, M.; Abdellatif, F.; Claudel, C.G. Exact and grid-free solutions to the Lighthill–Whitham–Richards traffic flow model with bounded acceleration for a class of fundamental diagrams. Transp. Res. Part B Methodol. 2013, 55, 282–306. [Google Scholar] [CrossRef]
- Ley-Bosch, C.; Medina-Sosa, R.; Alonso-González, I.; Sánchez-Rodríguez, D. Implementing an IEEE802. 15.7 physical layer simulation model with OMNET++. In Proceedings of the Distributed Computing and Artificial Intelligence, 12th International Conference, Salamanca, Spain, 3–5 June 2015; Springer: Berlin/Heidelberg, Germany, 2015; pp. 251–258. [Google Scholar]
- Liu, S.; Yang, Y.; Wang, W. Research of AODV routing protocol for ad hoc networks1. AASRI Procedia 2013, 5, 21–31. [Google Scholar] [CrossRef]
- Royer, E.M.; Perkins, C.E. An implementation study of the AODV routing protocol. In Proceedings of the 2000 IEEE Wireless Communications and Networking Conference, Conference Record (Cat. No. 00TH8540), Chicago, IL, USA, 23–28 September 2000; IEEE: Piscataway, NJ, USA, 2000; Volume 3, pp. 1003–1008. [Google Scholar]


| Parameter | Accident | Congestion |
|---|---|---|
| Mean Clearance Time | 16.54 min | 21.026 min |
| Clearance Time Variance | 18,563.745 min | 7386.239 min |
| Effect of the Number of Vehicles on Clearance Time | 33.5% | 43.2% |
| Effect of the Number of Blocked Lanes on Clearance Time | 20.1% | 27.5% |
| Effect of the Type of Blocked Lanes on Clearance Time | 12.3% | 11.7% |
| Effect of the Traffic Flow Conditions on Clearance Time | 17.5% | 9.3% |
| Effect of the Accident Location on Clearance Time | 16.6% | 8.3% |
| RF Parameter | Value |
|---|---|
| Vehicle speed limit | 60 km/h |
| Vehicle distribution type | Clustered |
| Congestion Simulation time | ≈100 s |
| Bit rate | 18 Mbps |
| RF MAC protocol | IEEE 802.11P |
| Physical layer model | Shadowing propagation model |
| Path loss scenario | Urban Macrocell |
| RF Carrier Frequency | 5.89 GHz |
| Packet size | 256 bytes |
| VLC Parameter | Value |
| VLC Modulation type | OOK |
| VLC Model | Empirical light model |
| Head light Max Tx Angle | 45° |
| Tail light Max Tx Angle | 60° |
| Carrier Frequency | 666,000 GHz |
| Bandwidth | 1.0 MHz |
| Packet Byte Length | 1024 bytes |
| Beaconing Frequency | 1 Hz |
| Optical transmitted power | 72 W |
| VLC Transmitted and received angles | 5–45° |
| APD model | S8664-1010 (Si) Hamamatsu |
| Responsivity of PD | 0.54 A/W |
| Gain of the optical concentrator g | 5 |
| Visible light wavelength | 350 to 750 nm |
| APD gain (M) | 50 |
Disclaimer/Publisher’s Note: The statements, opinions and data contained in all publications are solely those of the individual author(s) and contributor(s) and not of MDPI and/or the editor(s). MDPI and/or the editor(s) disclaim responsibility for any injury to people or property resulting from any ideas, methods, instructions or products referred to in the content. |
© 2023 by the authors. Licensee MDPI, Basel, Switzerland. This article is an open access article distributed under the terms and conditions of the Creative Commons Attribution (CC BY) license (https://creativecommons.org/licenses/by/4.0/).
Share and Cite
Hassan, N.; Fernando, X.; Woungang, I. An Emergency Message Routing Protocol for Improved Congestion Management in Hybrid RF/VLC VANETs. Telecom 2024, 5, 21-47. https://doi.org/10.3390/telecom5010002
Hassan N, Fernando X, Woungang I. An Emergency Message Routing Protocol for Improved Congestion Management in Hybrid RF/VLC VANETs. Telecom. 2024; 5(1):21-47. https://doi.org/10.3390/telecom5010002
Chicago/Turabian StyleHassan, Noha, Xavier Fernando, and Isaac Woungang. 2024. "An Emergency Message Routing Protocol for Improved Congestion Management in Hybrid RF/VLC VANETs" Telecom 5, no. 1: 21-47. https://doi.org/10.3390/telecom5010002
APA StyleHassan, N., Fernando, X., & Woungang, I. (2024). An Emergency Message Routing Protocol for Improved Congestion Management in Hybrid RF/VLC VANETs. Telecom, 5(1), 21-47. https://doi.org/10.3390/telecom5010002