Article

Underlay Loosely Coupled Model for Public Safety Networks Based on Device-to-Device Communication

1
Laboratoire d’Informatique Signal et Image de la Côte d’Opale (LISIC), Université du Littoral Côte d’Opale, UR 4491, F-62228 Calais, France
2
ReDCAD Laboratory, National School of Engineers of Sfax, University of Sfax, Sfax 3029, Tunisia
Telecom 2024, 5(1), 122-144; https://doi.org/10.3390/telecom5010007
Submission received: 16 November 2023 / Revised: 20 December 2023 / Accepted: 17 January 2024 / Published: 1 February 2024
(This article belongs to the Special Issue Joint Application of Telecom and Internet Services)

Abstract

:
In several emergency situations, during natural or human-caused disasters, frontline responders need to be able to communicate and collaborate to properly carry out relief missions. Some countries build their national Public Safety Mobile Broadband based on cellular LTE technology to provide fast, safe, and secure emergency services. However, in several emergency situations, cellular antennas can be overloaded or partially damaged in a manner that affects group communication services. In the last few years, direct device-to-device (D2D) communications have been proposed by the 3GPP as an underlay of long-term evolution (LTE) networks based on proximity, reuse, and hop gains. This paper focuses on a loosely coupled model based on direct D2D communication in a public safety context. Many scenarios related to user membership and network management are detailed. Both the “less cost” and “optimized tree” approaches are proposed and implemented, and their performance is evaluated in terms of the network update number and the resulting average Channel Quality Indicator (CQI). Other optimization approaches, with different CQI thresholds and optimization interval parameters, are simulated to compare their performance with the “optimized tree” approach. By conducting simulations that combine a CQI threshold = 1 and optimization interval = 2 s, it becomes possible to keep an average CQI level close to the “optimized tree” approach, while the costs related to network updates significantly decrease by almost 35%. Other simulations are also carried out to measure the bandwidth required by the control messages between the server and active users. It was found that both inbound and outbound traffic on the server side can be well supported with LTE and 5G networks.

1. Introduction

Natural or human-caused disasters like earthquakes, avalanches, floods, tsunamis, fires, massive pileups, or building collapses occur frequently in many places around the world. The need for communication services becomes very high during and after such events. In many cases, a disaster scenario requires a rescue crew (firefighters, paramedics, police officers, etc.) to remotely interact with witnesses as well as with disaster survivors to coordinate the rescue mission together. In several emergency situations, cellular antennas can be overloaded or partially damaged in a manner that prevents rescue teams from communicating.
The most famous Land Mobile Radio (LMR) technology has been extensively deployed in public safety contexts to date [1]. With data rates of around several hundreds of Kbps, LMR networks show limitations when it comes to supporting bandwidth-intensive applications. Thus, LMR technology is adapted to support Push-to-Talk (more commonly known as Talkie-Walkie service) in addition to some tracking services for vehicle and terminal localization. Moreover, LMR networks assign a separate frequency range for each type of response team. As a result, firefighters will never be able to communicate with paramedics, for example. Therefore, attention is paid to the use of cellular long-term evolution (LTE) technology and beyond as access network support for public safety. Such a solution is known as Public Safety Mobile Broadband (PSMB), like FirstNet in the United States, the Emergency Service Network (ESN) in the United Kingdom, or SafeNet in South Korea [2]. The operating principle of PSMB is to allocate a wide and low-frequency band (in the 700 MHz range) that will be reserved exclusively for emergency situations. However, in many disaster scenarios, the proposed frequency band can be saturated, or the affected area might not be covered by 4G/5G networks. Moreover, deploying such solutions is restricted to only registered professional first responders, and there is no means for victims or disaster witnesses to take part or to collaborate by identifying survivors and their location, for example. With the aim to provide extended LTE coverage to a large geographic area, some PSMB solutions, like FirstNet, deploy aerostats from 300 m height that can cover roughly 360 km2. However, the slowness of aerostats’ movement speed (10 km/h) to enter the disaster area, combined with their sensitivity to wind, means their deployment is not usually obvious. Some complementary PSMB mobile-vehicle-based solutions might also be deployed directly in the disaster area to create/extend coverage or even to increase existing network capacity using drones, light trucks, or minivans that can carry equipment based on both LTE and Satellite. However, most emergency situations require urgent action for rapid communication establishment between responders. The proposed solutions are not usually easy to deploy since heavy logistics tasks are required and a considerable availability of qualified human resources is necessary to drive or command land/air vehicles. Moreover, the quantity and the diversity of the deployed equipment, as well as the complexity of offering a new LTE-based network based on another LTE Cell (or Satellite), make the use of such a solution very expensive to deploy, especially in countries with large territories and limited resources.
On the other hand, in the last few years, the Third Generation Partnership Project (3GPP) has introduced device-to-device (D2D) technology [1,2], which enables a direct connection where the data plane can be handled by User Equipment (UE) without crossing the cellular network infrastructure. This D2D technology can be coupled with a Proximity-based Service (ProSe) [3] that provides many functions, including discovery, communication, and the relay mode. ProSe technology allows UE in proximity to discover itself and establish direct communication channels as soon as cellular operators enable the public safety mode. D2D technology enables out-of-coverage UE to join the network through another UE that plays the role of a relay. Compared with the proposed PSMB solutions, the deployment of D2D in a public safety context offers several benefits:
  • Benefits from proximity, with higher throughput, lower delays, and optimized power consumption.
  • Avoids overloading the central cellular antenna by dispatching media streams directly between participants.
  • Extends the cell range using an in-band D2D relay function to connect out-of-range devices.
This paper explores underlay network models based on D2D by focusing on loosely coupled topology. User membership and network management are studied, and simulations are conducted to analyze the effects of user density and group connectivity as well as assess the optimization effect in terms of the CQI and the number of link updates. In addition to carrying out simulations using the “less cost” and “optimized tree” approaches, it was possible to obtain relevant results by modifying the CQI threshold and the optimization interval. The combination of these two parameters made it possible to reduce the number of updates while keeping an average CQI close to the results obtained with the “optimized tree” approach.
The remainder of this paper is organized as follows: Section 1 provides a survey of some existing solutions for the public safety context; Section 2 presents an overview of the underlay D2D network based on ProSe service; Section 3 focuses on the loosely coupled model; Section 4 includes the material and methods used for simulations; and Section 5 presents the simulation results and comments followed by concluding remarks.

2. Related Works

To minimize the impact of possible cellular network overload, or coverage limitation, the research community and the industry have recently considered the deployment of Unmanned Aerial Vehicles (UAVs) during a rescue mission. UAVs can play a fundamental role in supporting new value-added services and applications. Among these, we can mention remote sensing in surveillance operations [4], collaborative search and rescue [5,6], building aerial sensor networks that aid disaster management [7], and supporting backbone communications to mobile ground stations [1].
Instead of using UAVs, the author in [8] proposes the deployment of a vehicle-mounted mobile base station to provide services like file distribution among group communications over heterogeneous architecture with the aid of a group Application Server and Proximity Service links, as illustrated in Figure 1. In this solution, a vehicle-mounted mobile base station is placed close to the disaster area and works in a cell-breathing manner to expand or shrink the cell coverage periodically to support group communications. Even though the proposed solutions can provide effective support to extend/minimize the overload of the cellular network, the deployment of land and air vehicles is limited to accessible disaster areas, and their commissioning may take additional delay not usually suited for emergency situations.
In [9], the author uses the multi-hop function, where the device can play the role of the relay to connect out-of-range devices using a D2D connection. This device-based solution can extend networks using multi-level relay functionality. However, this does not resolve the overload problem since the deployed relays will only connect the out-of-coverage device to the access point.
In [10], the author creates a virtual mesh networking using multi-hop D2D, where routing and packet forwarding are split into two separate mechanisms in the control plane and the user plane, respectively. In this solution, base stations collect links and topology information from terminals and then form a virtual mesh network among terminals accordingly. On the other hand, the terminal should establish and maintain a direct connection with its neighbors. This can prove very costly in terms of device autonomy. Moreover, the terminal does not participate in the decision to choose its neighbors, which complicates the task for the central server.
It is possible to build an optimized underlay communication model that allows each participant to maintain a minimal number of links with its neighbors and to assist the central server during link management. ProSe technology allows UEs in proximity to discover themselves and even have direct communication as soon as telecom operators enable the public safety mode. Direct links are then created between UEs rather than having their radio data (user plane) travel through the base station (BS) or over the core network. D2D communications can effectively improve overall throughput and minimize packet latency/jitter as well as optimize radio spectrum utilization and even energy consumption. The next section explores how to use D2D and ProSe technology to build underlay networks.

3. Underlay D2D Network Based on ProSe Service

3.1. Introduction

During the first generations of cellular networks, only one air interface was defined and used to connect UE to the network infrastructure by supporting uplink and downlink operations. With the 3GPP release 12 [11], a sidelink has been introduced, allowing UE to connect directly with other UEs. This sidelink defines a set of physical, transport, and logical channels that can be deployed for synchronization, discovery, and direct communication operations within a D2D communication underlying cellular system. The newly defined physical layer channels are as follows:
  • PSBCH: Physical SL broadcast channel, which carries system information and synchronization signals.
  • PSCCH: Physical SL control channel, carries UE-to-UE control plane data.
  • PSDCH: Physical SL discovery channel, which supports UE direct discovery transmissions.
  • PSSCH: Physical SL shared channel, which is used for user plane data transmission.

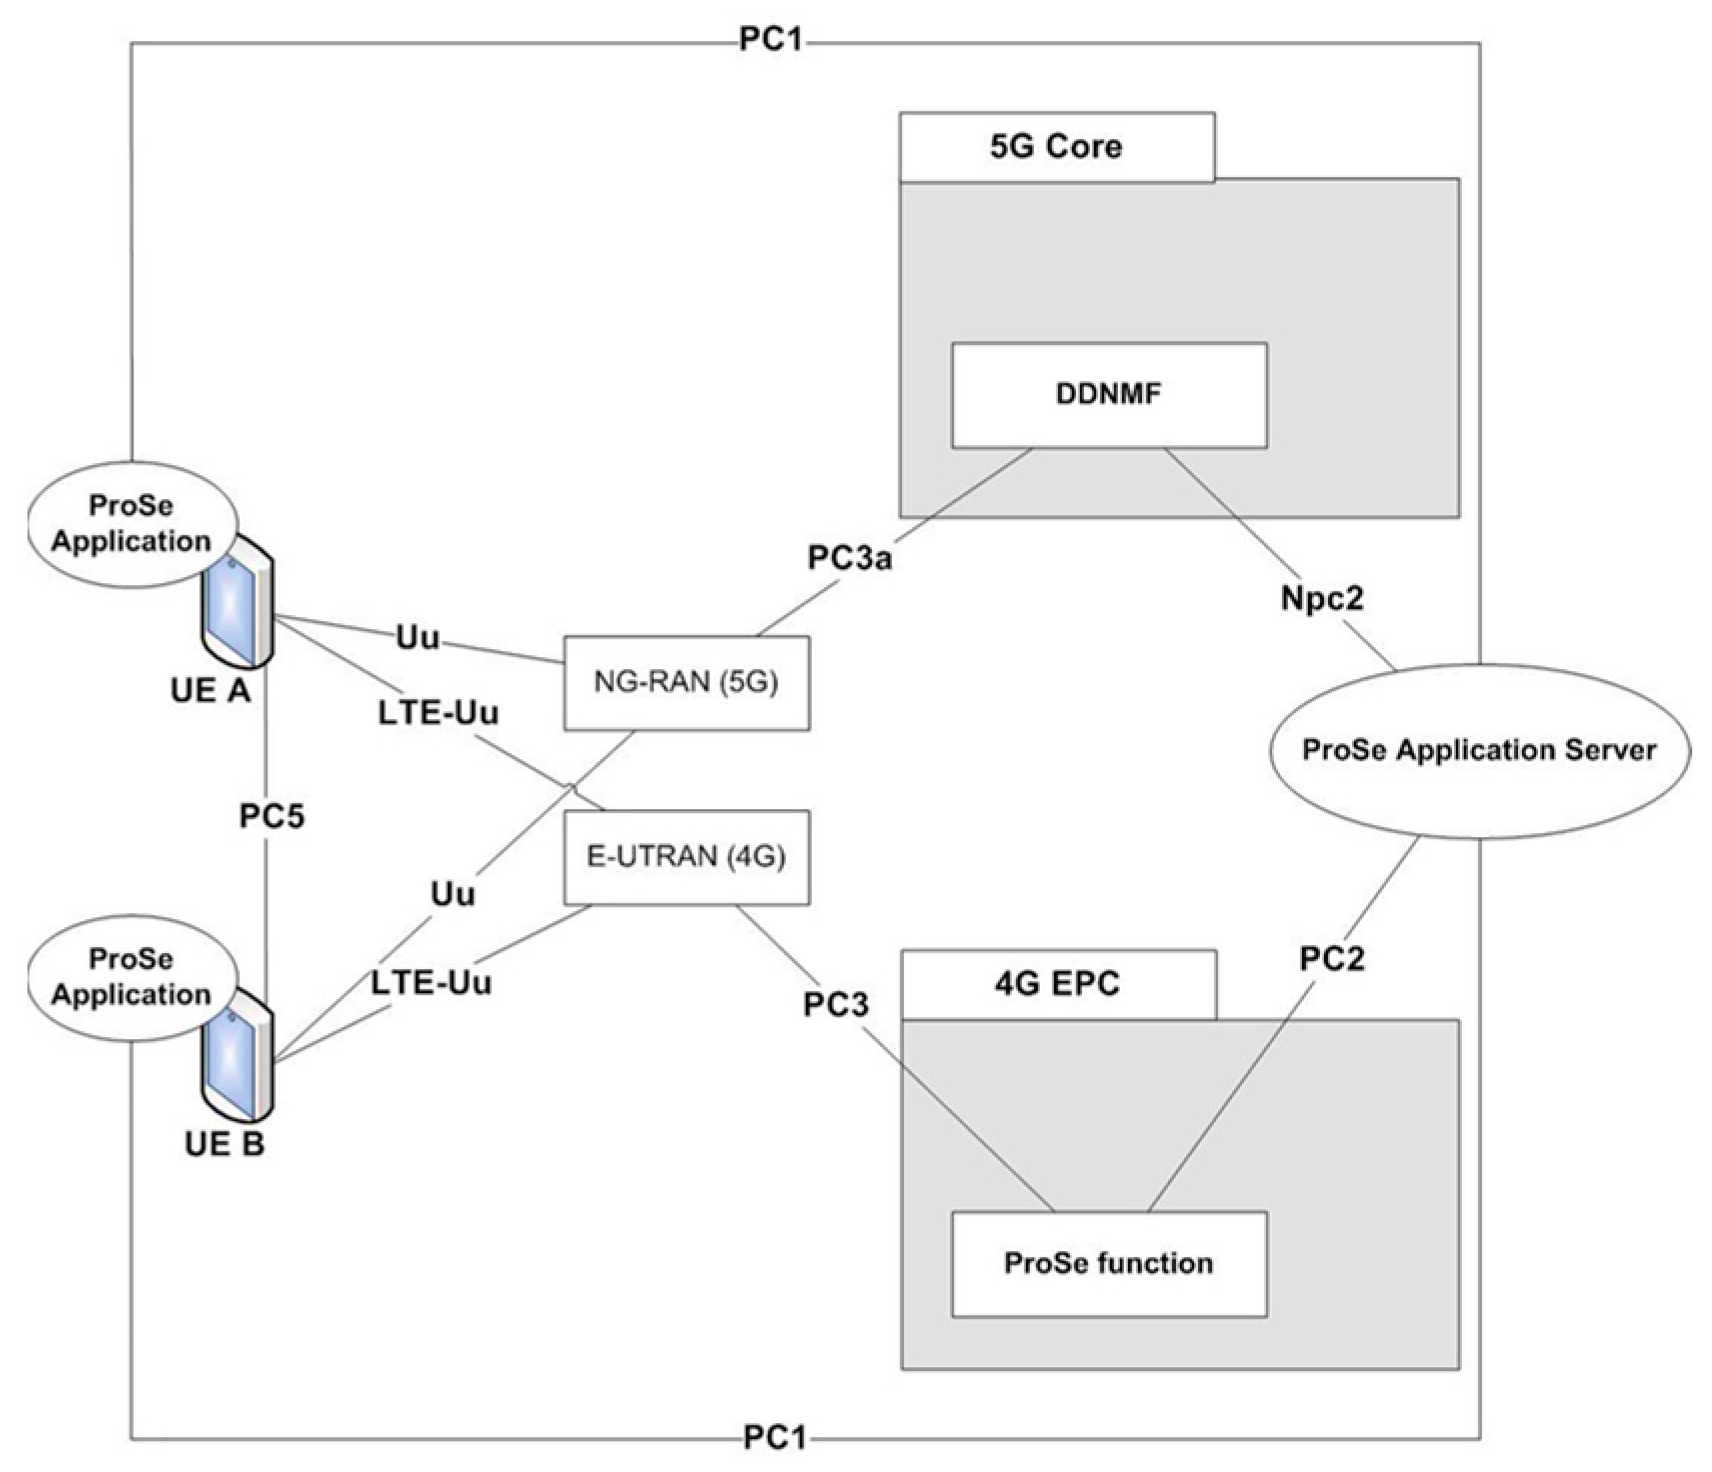
3.2. Reference ProSe Architecture

The Third Generation Partnership Project has also defined a Proximity Service (ProSe) in both 4G [3] and 5G [12]. From Figure 2, some main components can be identified:
  • The ProSe App Server serves as a public safety answering point and can directly communicate with an application defined in UE.
  • The ProSe UE App is an application installed on the UE side that uses ProSe capabilities.
  • A ProSe function/DDNFM acts as the reference point for the ProSe App Server and UEs. This function is responsible for the verification, authorization, and configuration of UE. It also allows network core-level discovery for direct communication scenarios between devices.
In addition to PC5, several other interfaces have been defined by 3GPP to allow interaction between the various ProSe components and network core functions. We can mention the PC1 interface that enables applications installed on the UE to exchange data with the ProSe Server, while the PC2 is used by ProSe functions to obtain updates from the server and to support all functionalities used for direct D2D communication. On the other side, the UE can use the PC3 interface for D2D discovery and communication.
The architecture presented in Figure 2 shows a basic case of two UEs belonging to the same public land mobile network (PLMN) supporting 4G and 5G networks. However, it is possible that UEs register to different PLMNs or even belong to different radio access networks (RANs) such as LTE-A and WiFi. Some other interfaces not mentioned in this paper can be used for roaming scenarios to keep the home ProSe function/DDNFM reachable for both the roaming UE as well as the visiting ProSe function.

3.3. ProSe Functions and Communication Scenarios in Public Safety Networks

In a public safety context and following any eventual damage caused by a disaster, three situations can result: (1) cellular antennae continue to operate normally, (2) part of the antennae is available while others are paralyzed, and (3) the entire access network is paralyzed. To support these cases, D2D communication can be divided according to the following three scenarios, as shown in Figure 3:
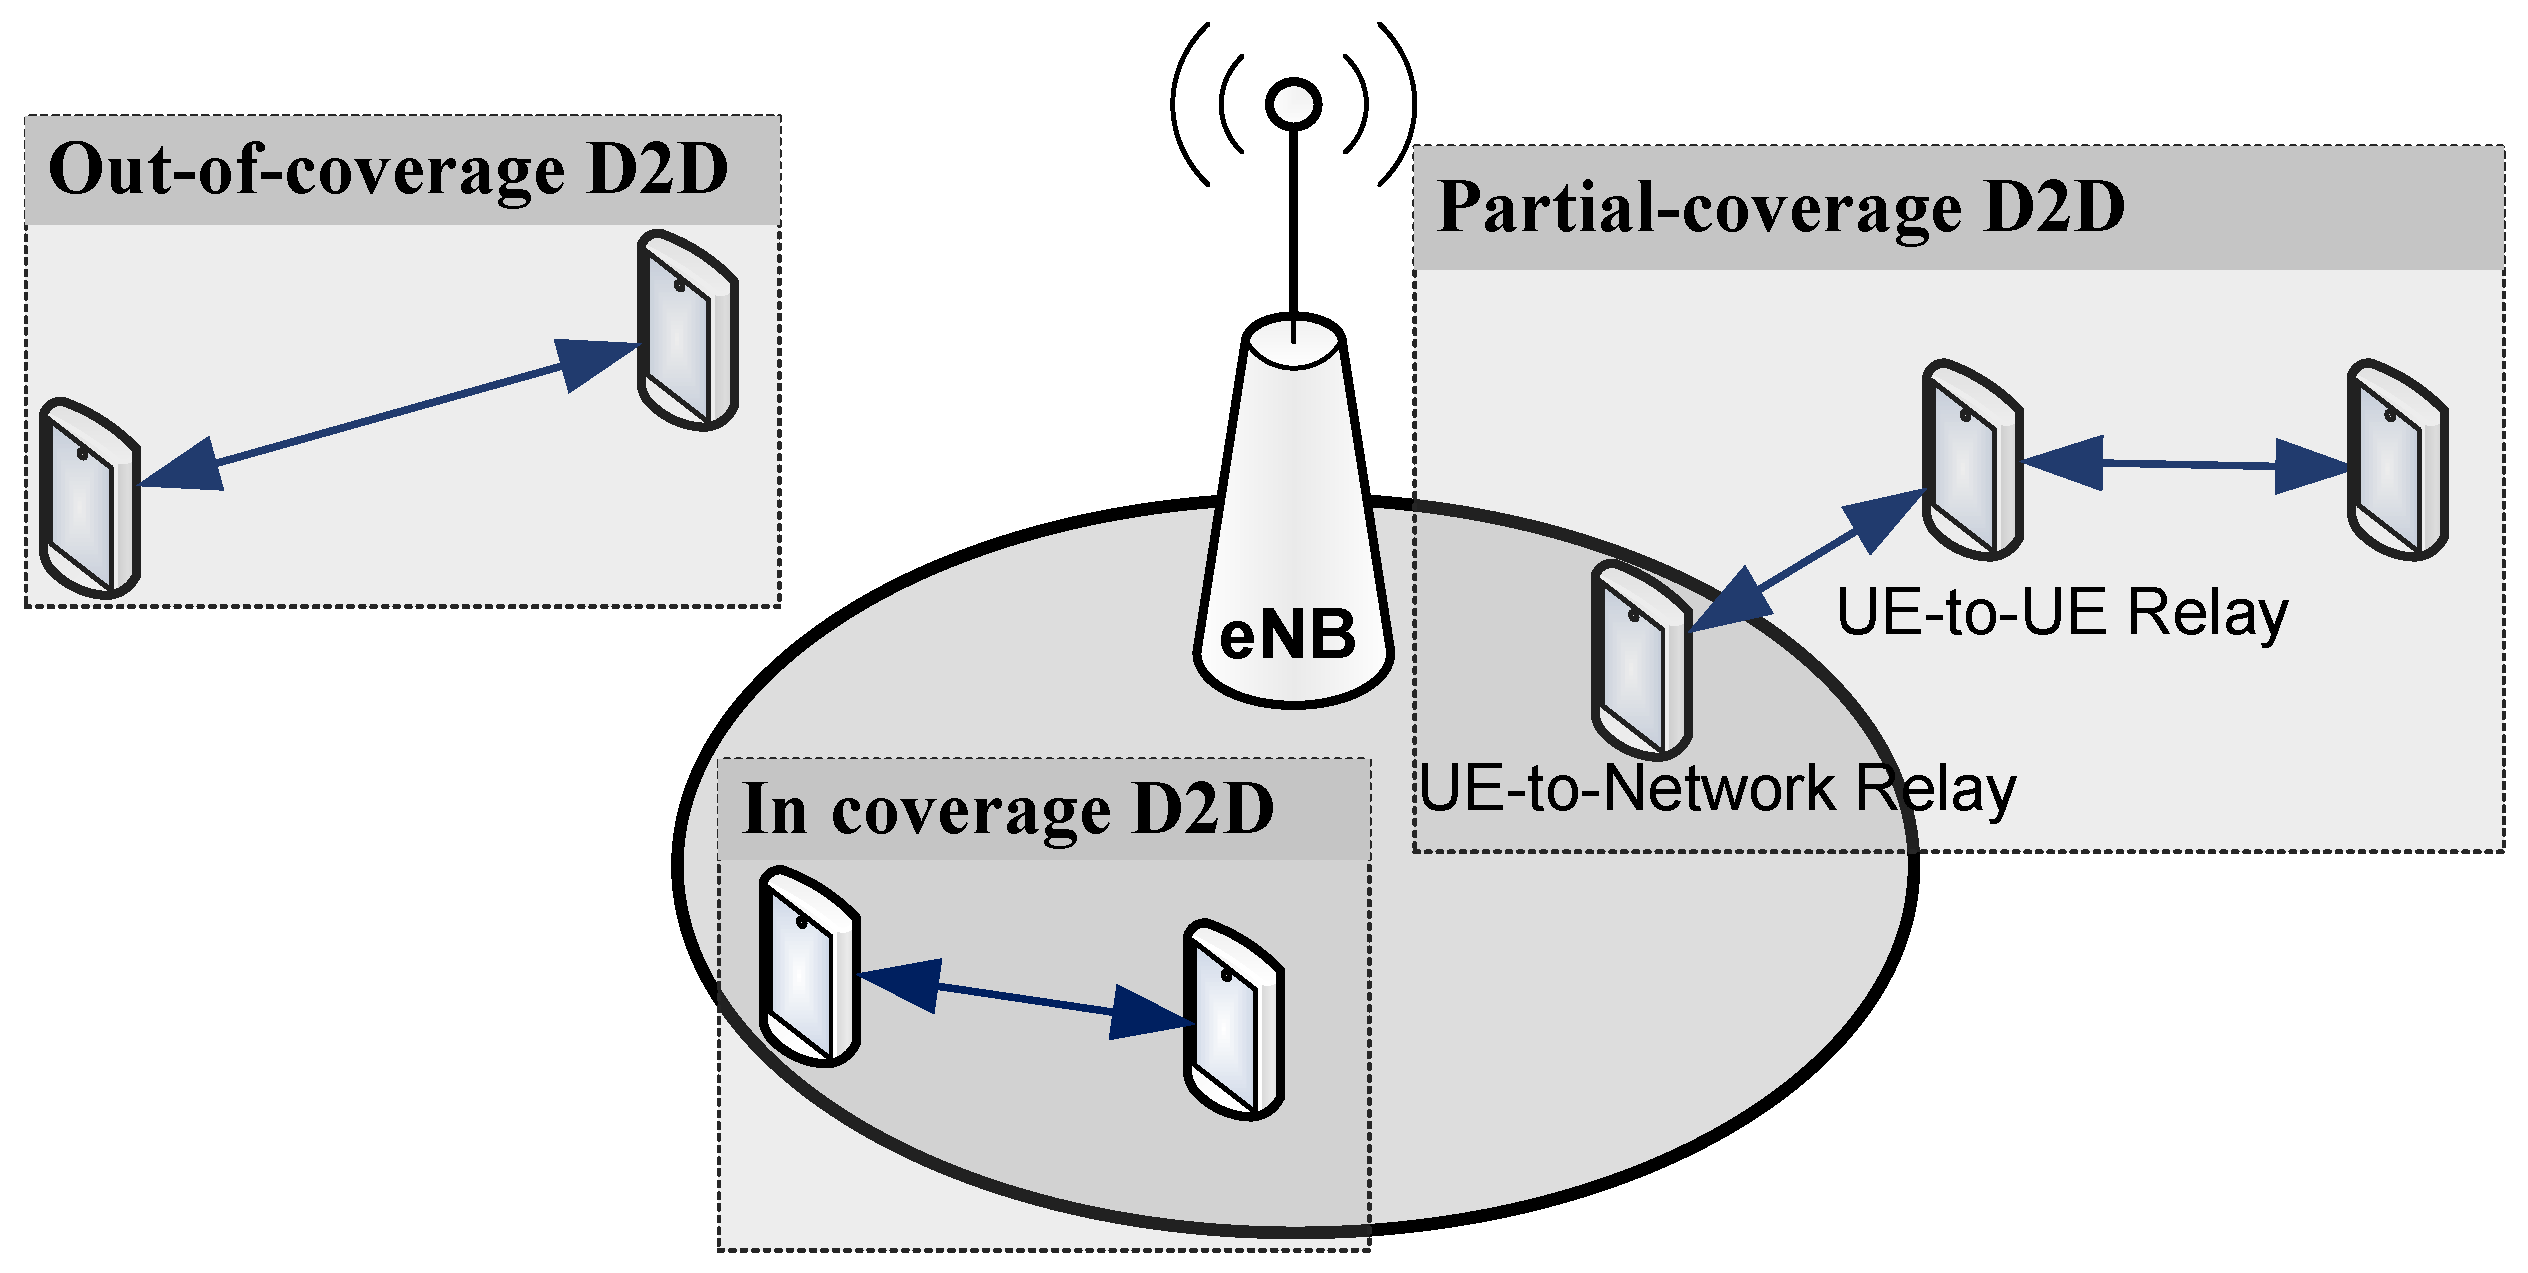
  • In-coverage: when all UEs are within the coverage of the eNB(s).
  • Partial-coverage: when at least one in-coverage participant acts as a UE-to-Network relay, while other UE-to-UE relays can provide network access to distant users.
  • Out-of-coverage: when all participants are out of the eNB.
Figure 4 illustrates all supported ProSe functions and scenarios for both commercial and public safety use cases. While only ProSe discovery operations are supported in a commercial context, public safety can benefit from all available ProSe functions including direct and relay-based communication through the PC5 interface. We note that WLAN integration is defined only in ProSe based on LTE, while the UE-to-UE relay function is defined only in ProSe based on a 5G network.

3.4. D2D Synchronization Procedure

The synchronization procedure is a precondition for direct communication and direct proximity discovery services. This procedure defines physical resources in time and frequency that carry D2D control and traffic data. The Primary Sidelink Synchronization Signal (PSSS) is deployed in the synchronization of the initial timing and frame boundary estimation. PSSS signals are designed to simplify the detection of synchronization sources. It can be broadcasted by a cellular antenna for in-coverage UEs or even by an independent UE for partial and out-of-coverage scenarios. The synchronization procedure happens naturally as long as UEs are in coverage of the same eNB or scattered over synchronized neighboring eNBs. For UE located in the coverage of an eNB that supports sidelink operations, a resource pool with a preconfigured list of transmission and reception parameters will be provided to configure the D2D direct communication.

3.5. Infrastructure vs. D2D-Based Communication

Despite all efforts to execute load balancing between cells, the fully centralized approach based on eNBs is not usually suited for public safety situations where a large number of subscribers are grouped in the same area and share a large amount of data. To avoid an eNB overload situation, D2D direct communication can be considered as an alternative solution that creates an underlay network supported and maintained by participant UEs, as illustrated in Figure 5. All the traffic should then be spread among the involved devices through direct communication links. Moreover, partial-coverage D2D communications can be deployed to overcome the lack of coverage issues.

3.6. Underlay D2D Topology Models

ProSe direct D2D communication can be established using one-to-one or one-to-many methods [11]. Users in coverage receive authorization and radio parameters from the PLMN, while out-of-coverage users use their preconfigured data. The one-to-many communication method is based on a multicast method to enable subscribed users having the same Group ID to receive a copy of a message. In D2D communications, link quality is evaluated according to the Channel Quality Indicator (CQI) by attributing a value between 1 and 15 [13]. These values indicate the level of modulation and coding the UE could operate. The value 15 is assigned to the channel having the best quality. In this work, we define some D2D models according to the following topologies, as illustrated in Figure 6:
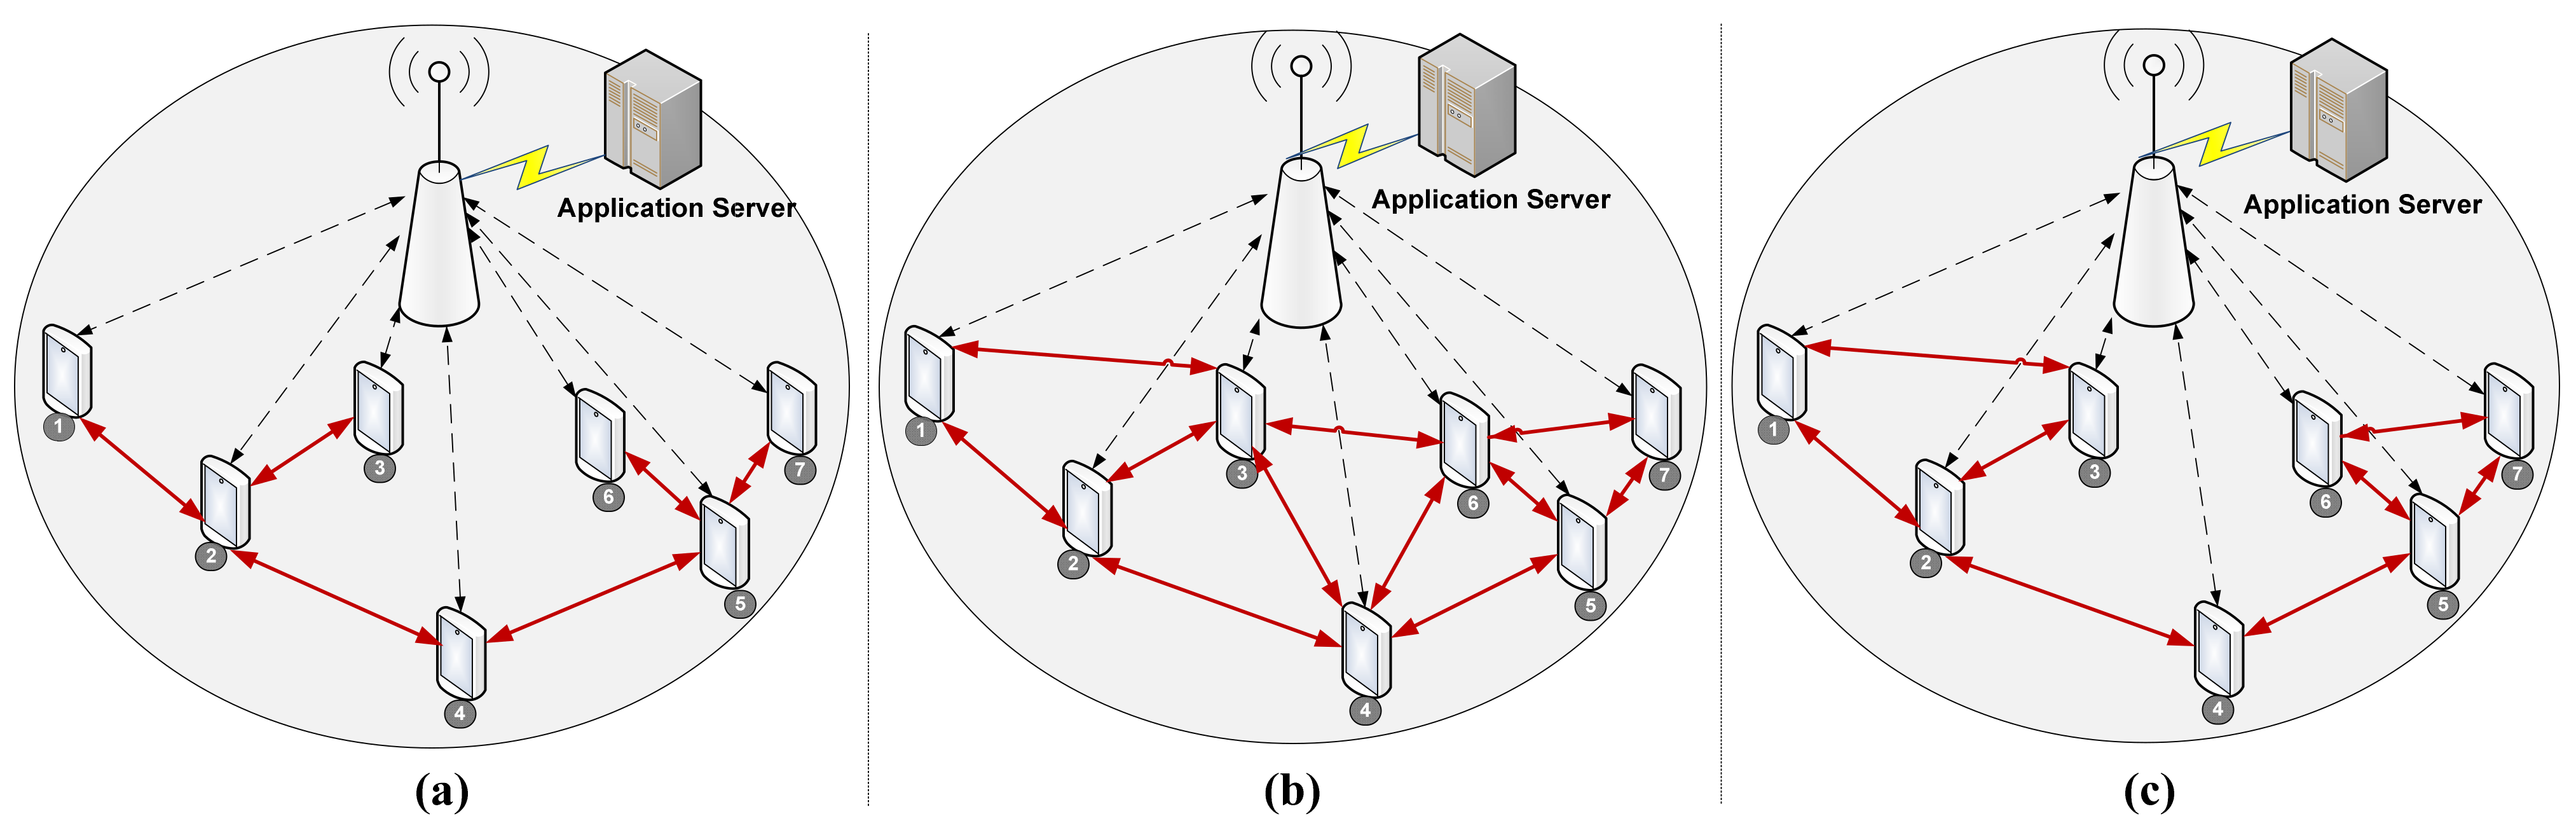
  • Loosely coupled: In this model, illustrated in Figure 6a, a minimum number of links should be created and maintained within the D2D group using the one-to-one communication method.
  • Fully coupled: In this model, illustrated in Figure 6b, each UE should connect with all neighbors in its range. This approach can be achieved using a multicast one-to-many communication method.
  • Tightly coupled: In this approach, illustrated in Figure 6c, starting from the loosely coupled model, new additional selected links can be added between UEs according to one of these strategies: (1) based on the CQI by maintaining only links with a certain minimum CQI level, (2) based on the maximum number of links per user, where connections are made with a neighbor having a lower number of connections instead of the neighbor with the highest CQI, and (3) based on a combination of the two previously mentioned strategies, where the additional links are both limited by their number and also by the minimum level of the CQI.

4. The D2D Loosely Coupled Model

In the context of wireless communication based on handheld devices with limited autonomy, it is important to minimize the number of connections that should be handled by each pair. The computing power and energy consumption could then be optimized. Furthermore, when several paths are possible between group members, participant devices can receive many copies of the same packet. This requires an additional effort for packet cancellation, while D2D links can also be overloaded. Therefore, among the models proposed previously, the loosely coupled seems to be the most suitable by creating the minimum number of direct connections between participants.

4.1. Neighbor Classification

To facilitate the management of the network, each selected user (SU) will detect neighbors in his coverage and classify them according to two possible group types: The first single group, named Gnc (Group of not connected), which includes all the neighbors who have no path connecting them. The second group type is named Gc (Group of connected). Depending on the topology, some Gc groups can be created to include all the SU neighbors who already have a path that connects them. If many groups are created, they will be named Gc1, Gc2, Gc3, etc. We mention that the path that connects two neighbors can allow either a direct link or indirect link between them by crossing other UEs that are not necessarily neighbors of the SU. In the example illustrated in Figure 7, the SU should create the following groups: Gnc = {3, 6}, Gc1 = {1, 2}, and Gc2 = {5, 7, 8}.

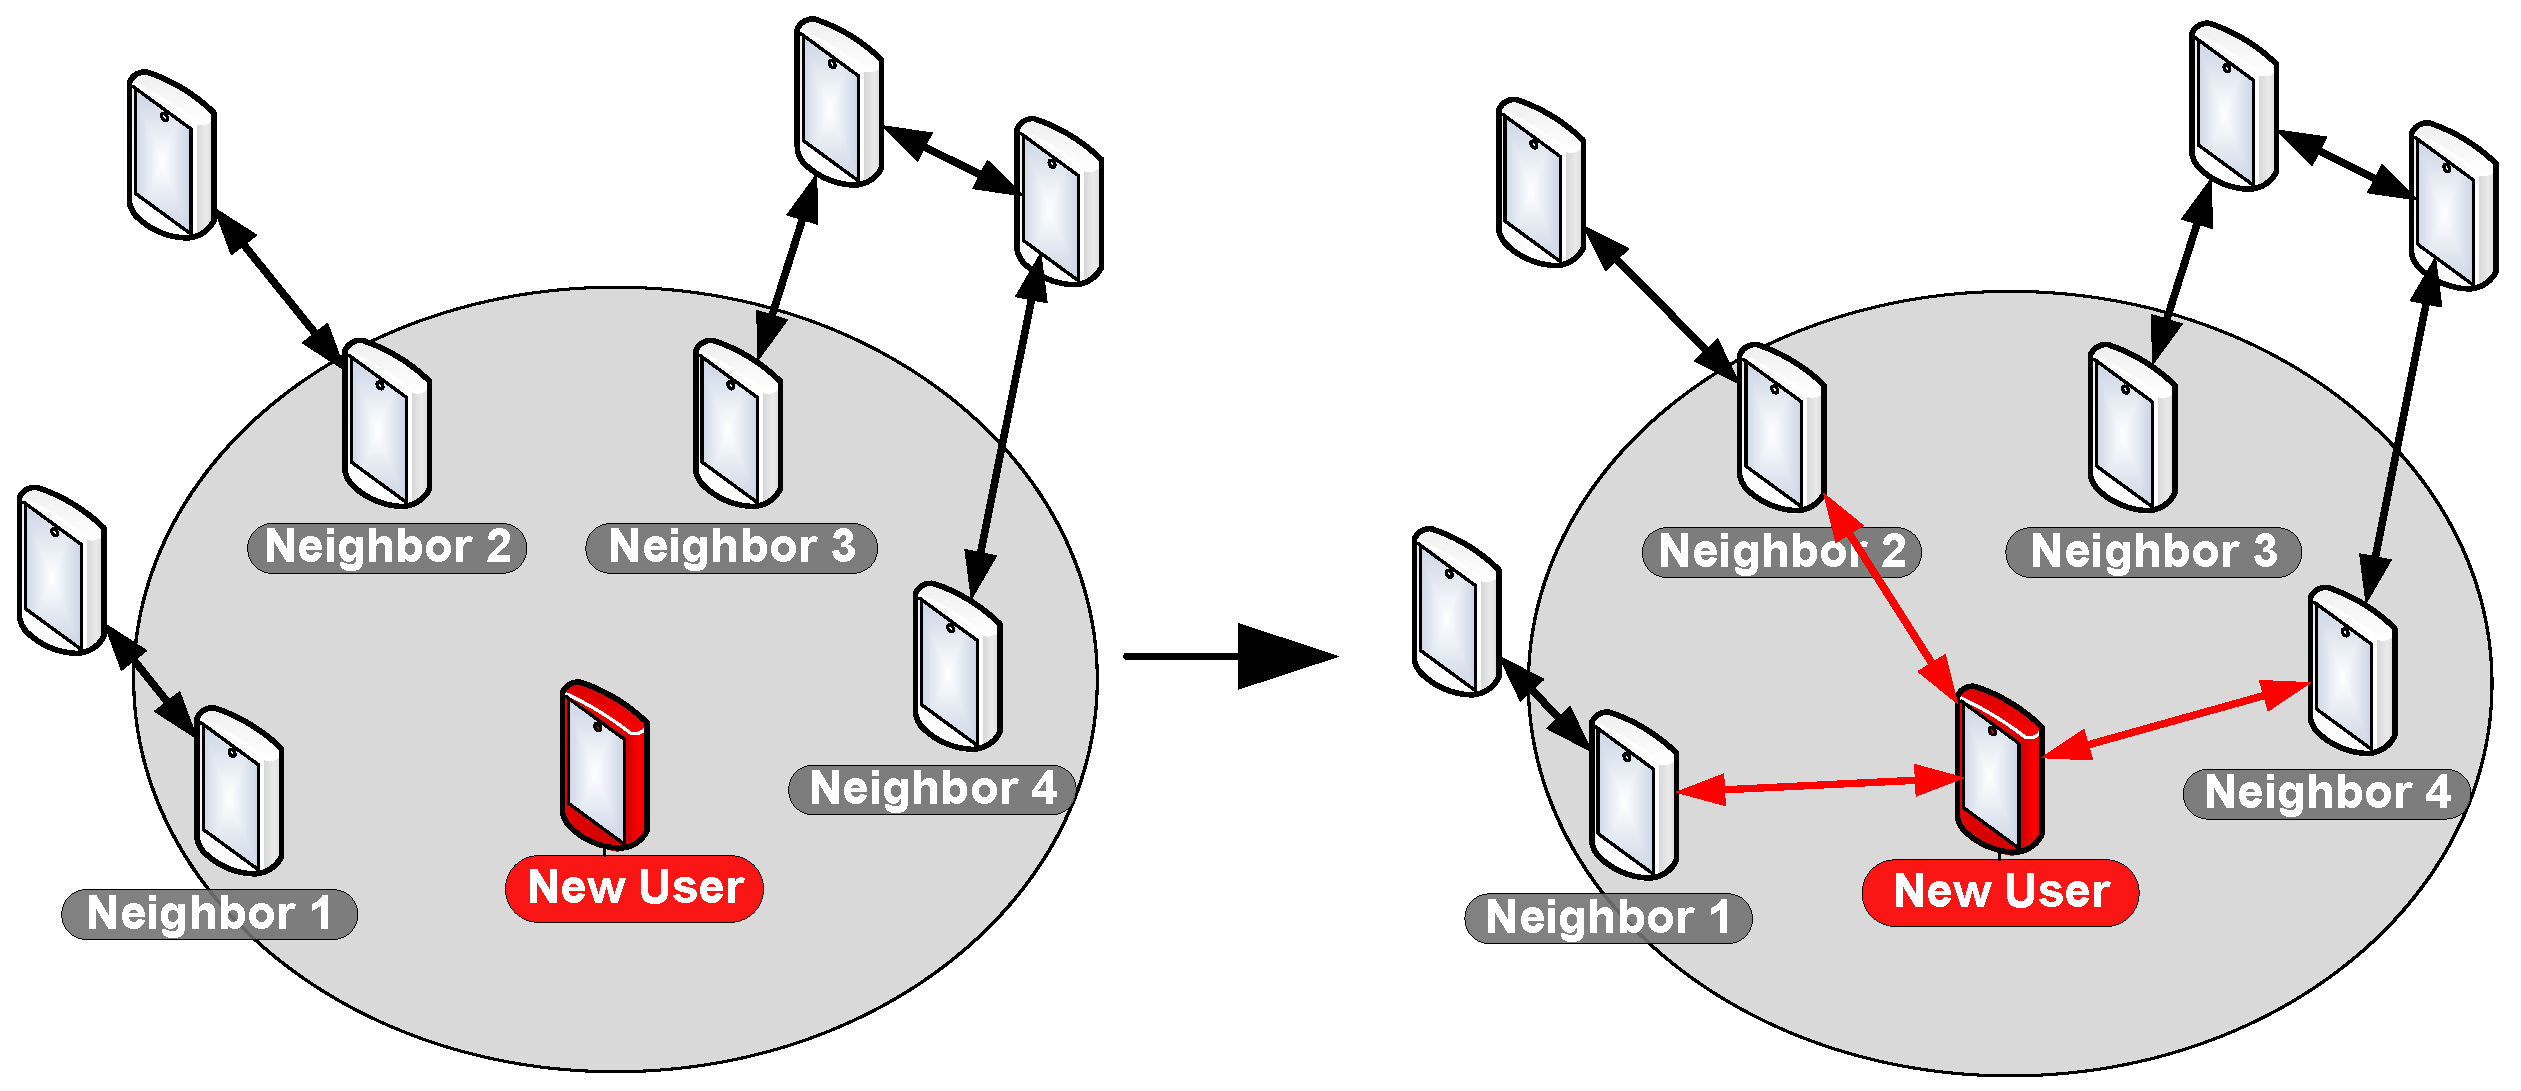
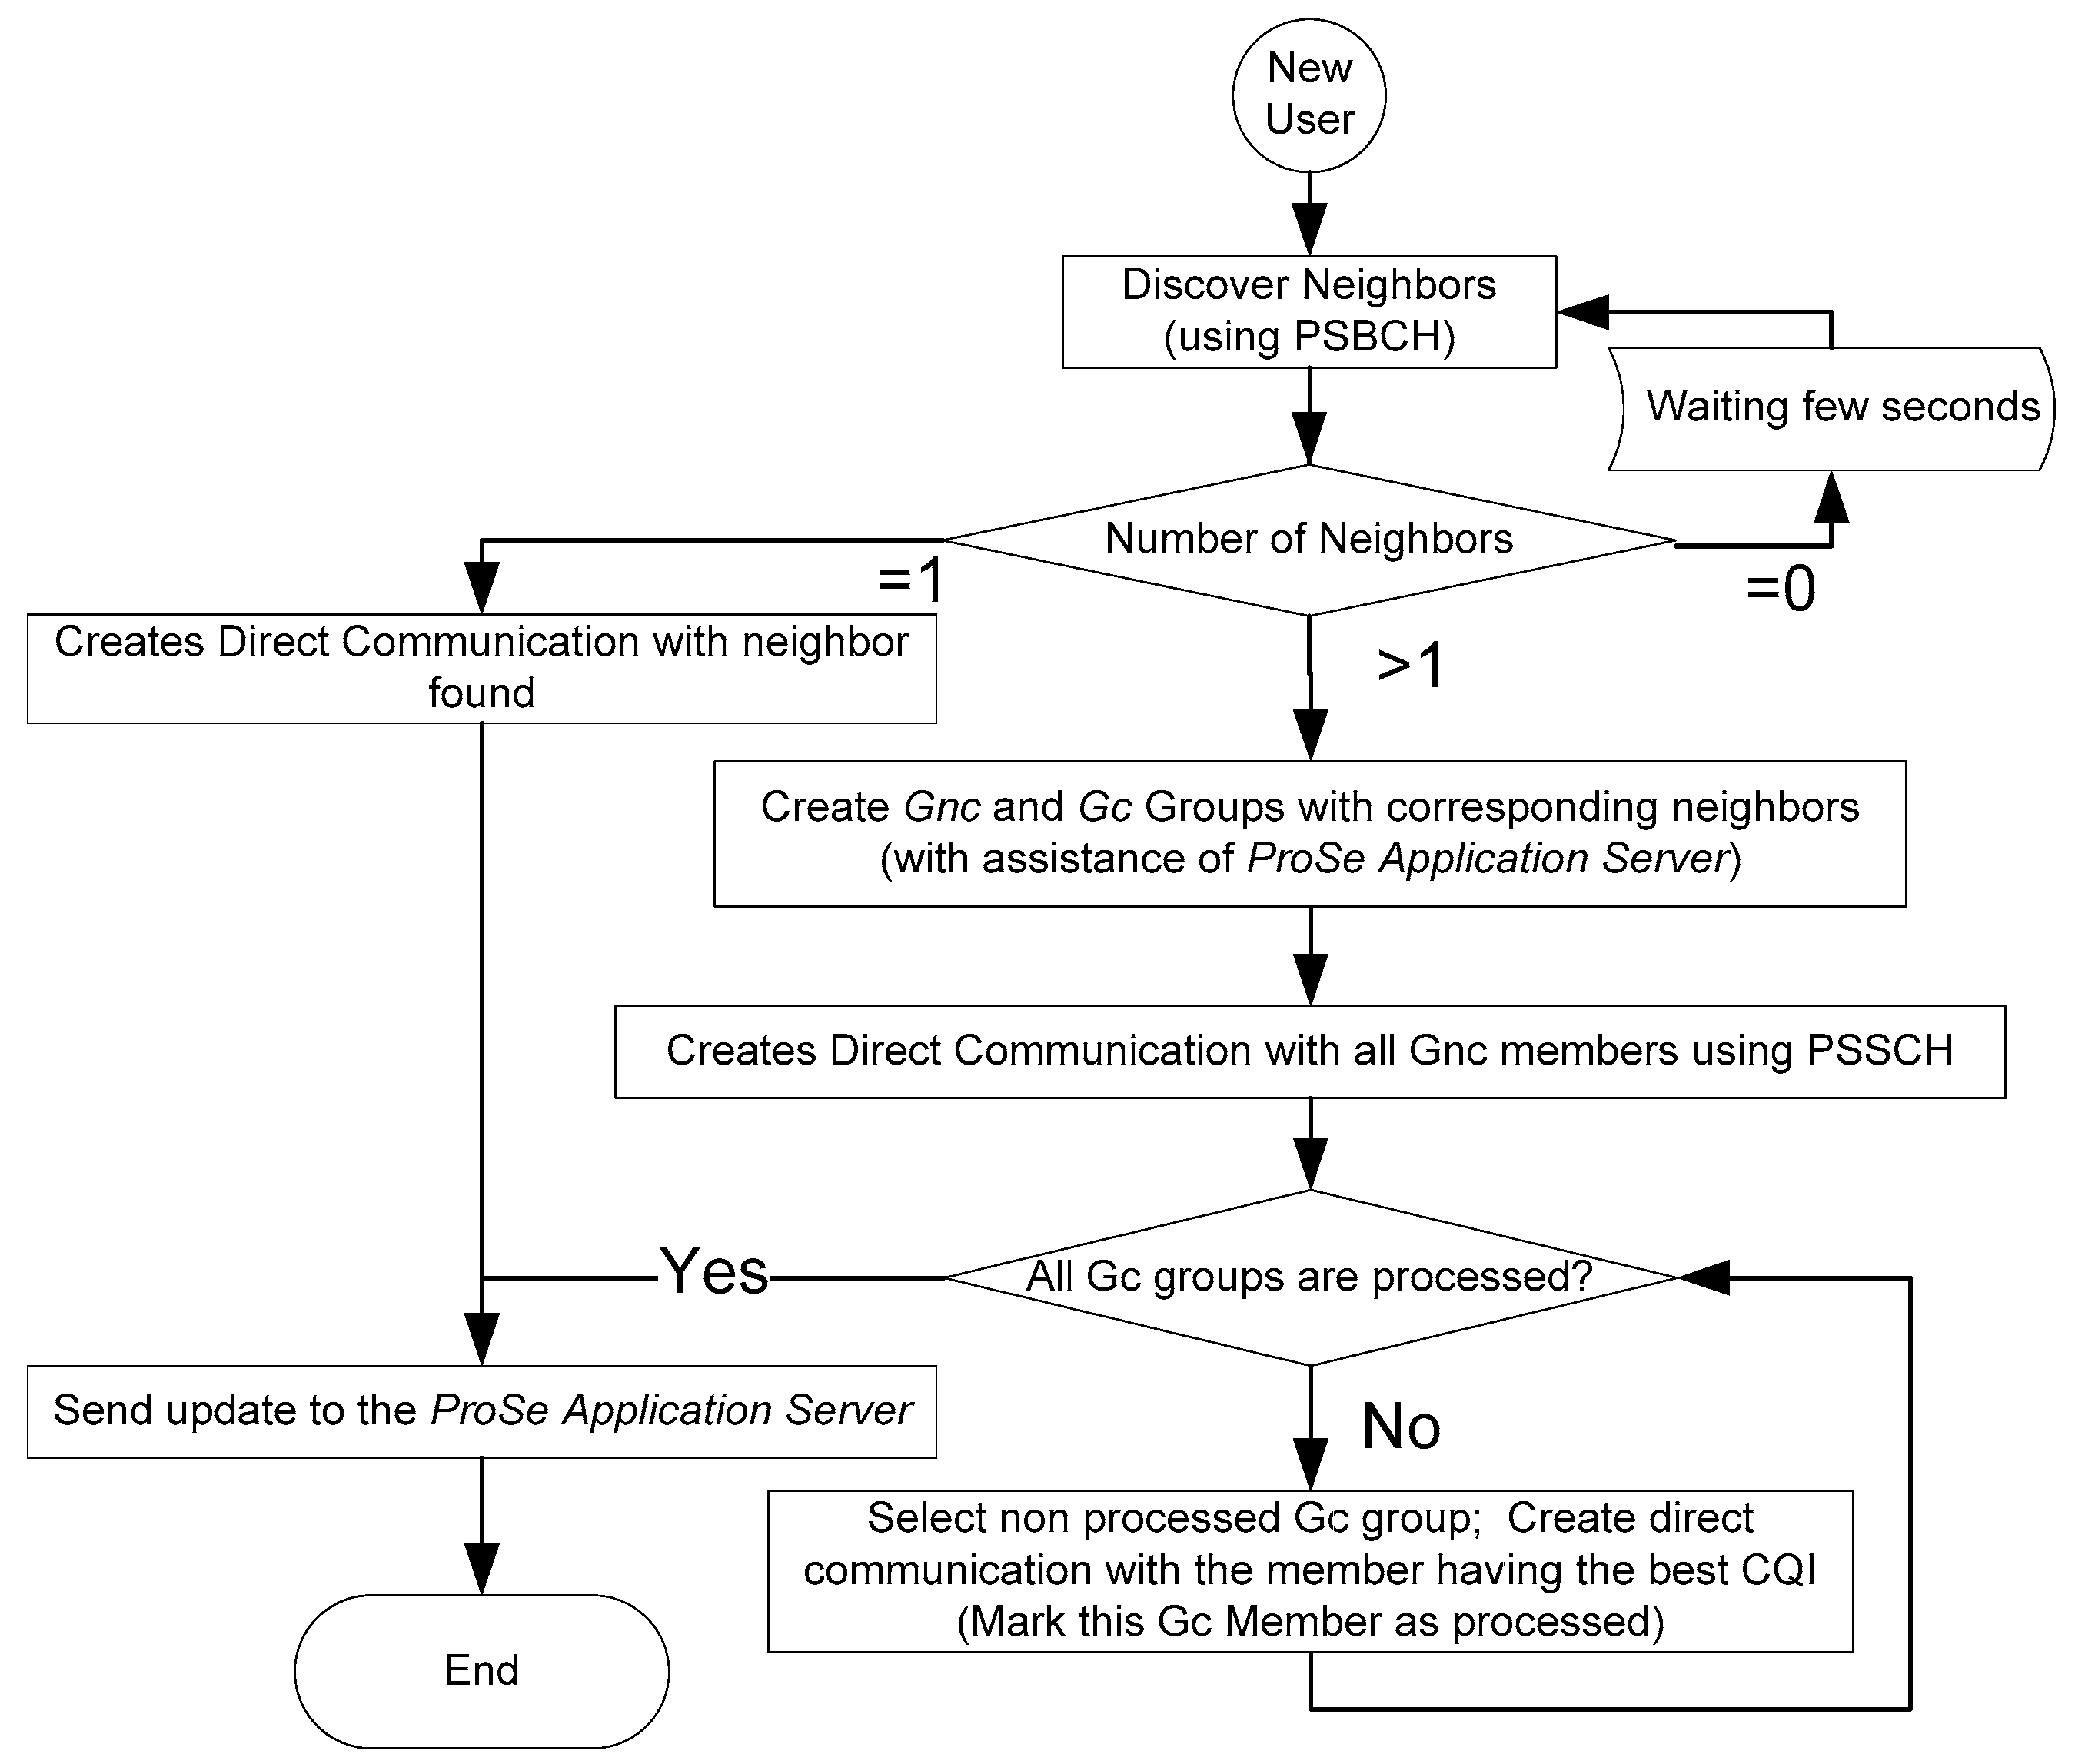
4.2. Adding a User to the Network

To join a D2D network, a new user (NU) starts by sending a PSCCH message to discover his neighborhood. Based on the PC1 interface, the ProSe Application Server should provide the NU with a global description of the participating UE including an identification of interconnection links. Based on this information, the NU should be able to create Gnc and Gc groups to classify discovered users in the neighborhood. As a next step, as illustrated in Figure 8 and Figure 9, the NU should create direct communication using PSSCH with all neighbors in the Gnc group. Afterward, direct communication should be established by the NU with the user having the best CQI in each Gc group.

4.3. Network Update Management

The geographic mobility of UEs, combined with different obstacles and external sources, can significantly affect the power and quality of the signal. In this context of a permanent change in CQI, it is important to conduct periodic updates to ensure the connectivity of the group. Two strategies are proposed: (1) The “Less cost” approach tends to retain the links between UEs as long as they exist. However, as soon as a link from a member of the Gc group is lost, a new link with a UE from the same Gc group will be created. (2) The “Optimized tree” approach is a little more expensive, but it has the advantage of guaranteeing a network with optimal links. As soon as a variation in the link with a member of one of the Gc groups is detected, the procedure is triggered to check if a better link is possible within the same group. The two approaches are illustrated in the flowchart in Figure 10.

4.4. UE Departure or Disconnection

UE disconnection from the D2D network can be performed according to three different scenarios:
  • Alert before leaving: An alert can be generated by the UE before leaving the D2D network. This can happen when the battery reaches a critical level, as soon as the CQI level drops continuously and tends toward zero, or if the user sends a disconnection request before closing the application.
  • Suddenly without alerting: This situation is not very frequent, and it is due to the voluntary closure of the terminal connection or signal interference. Otherwise, it could be caused by an obstacle that suddenly blocks the radio transmission.
  • General disconnection from the network: When the rescue mission ends, the PLMN terminates the public safety network mode. In this case, the UE is no longer authorized to use direct D2D communication functions.
Depending on the position on the topology, if the UE was a “Leaf node” (holding only one connection), in this case, no damage to the network tree can be caused by this departure. In other cases, a D2D network using the loosely coupled approach will be affected, and the recovery procedure should then be launched in the proactive or reactive mode to find alternatives. Fixing the CQI threshold close to a value of 1 or 2 can, in many cases, resolve the departure problem by proactively changing the network topology in a manner that places the leaving UE as a leaf node.

4.5. Network Control Management

The proposed solution assumes that each node is capable of deciding which links to establish with its neighbors depending on membership in the Gnc and Gc groups. This neighborhood classification is not obvious for a participating node to determine autonomously. Two solutions are possible:
  • Based on the server: the nodes send updates if there are changes in the topology and the Application Server maintains the global topology map of the entire network and transmits a notification (in broadcast message) to all participants.
  • Based on peers: the directly connected nodes exchange the member list of their groups.
We found the server-based approach to be more robust since it allows newly connected users to receive existing topology maps in a direct and transparent manner. Also, the idea of keeping a single copy of the topology on the server side allows for better network management while avoiding overloading the bandwidth of the D2D links. As illustrated in Figure 11, when a new user joins the network, a Topology Map Notification Message is broadcast to all users (using messages 1, 2, and 3). If User_B and User_C are in range, a direct connection will be created (initiated by one of the two). In this case, the user who initiated the link establishment is responsible for sending the Topology Map Update Message to the Application Server (using message 4). A notification message will subsequently be broadcast to all participants including User_A, who will therefore be notified about the topology update. Thus, server notifications are sent during two scenarios: when a new UE connects or when a modification of the topology is reported by one of the UEs.

5. Material and Methods

5.1. Simulation Environment and Parameters

We developed our own Java-based simulator [14] with a graphic interface using MG2D API [15]. The loosely coupled model was implemented to support both the “Less cost” and “optimized tree” algorithms, as illustrated in Figure 12. A summary of the parameters used in the simulation experiments is presented in Table 1.

5.2. Adding Users to the Simulation Area

Several nodes representing UEs can then be placed randomly on a preconfigured square/rectangle area. Once the total number of nodes in the simulation is defined, it is possible to add all the nodes either during the simulation launch or gradually according to preconfigured time intervals. In our simulations, we opted for the second method and added a new UE every 100 s, as illustrated in Figure 13. This strategy of linearly adding users seems to well suit the reality of the disaster scenario where rescue teams should join the disaster area gradually. This allows us to better observe the evolution of the group as well as the many parameters related to the connectivity levels, the average CQI, and the number of topology updates.

5.3. UE Movement Model

The RDM (Random Direction Mobility) model [16] is used to simulate rescue team movements during the disaster situation, as illustrated in Figure 14. Compared with other models, RDM avoids the high probability of any node selecting a new destination located around the center of the simulation area, or a destination that requires a path of the node through the center area. In our simulation, a node starts its motion by selecting a direction 0, 2 × π with speed Vmax generated randomly from 0 to 4 m/s. According to [17], 1 m/s represents slow human walking, while a fast walking speed ranges between 1.50 and 2.14 m/s. Higher speed values were used to simulate cases where rescue members must run or move using light equipment.
As soon as the node reaches the limit of the simulation zone, it waits for a random pause time from 0 to 60 s. Subsequently, the node chooses a new direction from 0 to π while keeping its initial speed. This process continues until the simulation ends.

5.4. UE Transmission/Reception Range and CQI Calculation

Even if the direct LTE max transmission range can reach 500 m [18], realistic values are generally located between 100 and 200 m [19] depending on the area topology and taking into consideration all sources that can affect signal strength/noise. The determined CQI values are listed in Table 2, which shows a corresponding modulation/coding scheme with the minimum transmission rate expressed in kbps.
The uplink CQI is determined proportionally to the distance d between two UEs by considering the maximum transmission range R of each user, as illustrated in Algorithm 1.
Algorithm 1. CQI calculation.
if d > R
CQI ← 0
else if d = = 0
CQI ← 15
else
CQI ← 16–d/(R/15)     //CQI is defined as an Integer

5.5. Network Update Based on the CQI Threshold

While the “optimized tree” approach substitutes links as soon as others with a better CQI are found, the “less cost” approach, on the other hand, keeps links as long as the CQI value is positive. A new approach based on a CQI threshold can be used to minimize the number of network updates, as described in Algorithm 2. If a neighbor in the same Gc group offers a better CQI, we should check if this CQI is at least higher than a certain CQI threshold before executing the handover and generating a new network topology update. The CQI threshold-based approach could certainly reduce the number of substitution operations and therefore network updates. However, simulations must be carried out to assess the impact of such an approach on the average CQI.
Algorithm 2. Network update according to the CQI threshold.
For each Gc group of UEi do
if CQI_Value(New_neighbor) - CQI_Value(Old_neighbor) <= CQI_threshold then
keep Connection with Old_neighbor
else
Connect with New_neighbor
Disconnect from Old_neighbor
Report the modification to the ProSe Application Server
number_of_updates ++
end
end

5.6. Network Update Based on the Optimization Interval

In the “optimized tree” approach, link optimization, based on a CQI comparison, takes place every second. However, it is possible to customize this optimization interval by choosing different interval values. As explained in Algorithm 3, with the defined optimization interval i, this approach will be executed intermittently using either CQI threshold = 15 (corresponding to the “less cost” approach) or a predefined CQI threshold.
Algorithm 3. Network update function according to the optimization interval.
Set optimization_interval to i
if sim_Step % optimization_interval = 0 then
execute network update function with defined CQI_threshold
else
execute network update function with CQI_threshold = 15
end

5.7. Traffic Generated by Control Message Flow

During the user authentication and registration procedure, a new ID is generated and attributed by the server to the UE. The ID size can be represented in 8 characters (8 bytes). Two message types are used for network control and topology map management, i.e., update and notification messages:
  • Update message: this message is sent by UE to the Application Server when direct links are added or deleted. The message contains the updated list of directly connected users having direct links with the UE. The message size is variable and depends on the UE-managed links.
  • Notification message: this message is sent in broadcast mode to all connected users and contains the topology map of the entire network. The IDs of the N active UEs are included, making the message size around N × 8 bytes.
Algorithm 4 illustrates the usage scenarios of update and notification messages.
Algorithm 4. Usage scenarios of update and notification messages.
       // User side
For each UE do
if new link is added or link removed then
Send update message to server with containing connected IDs
end
// Server side
if new user is connected or update message received then
Send notification to all UEs with updated topology map
end

6. Simulation Results

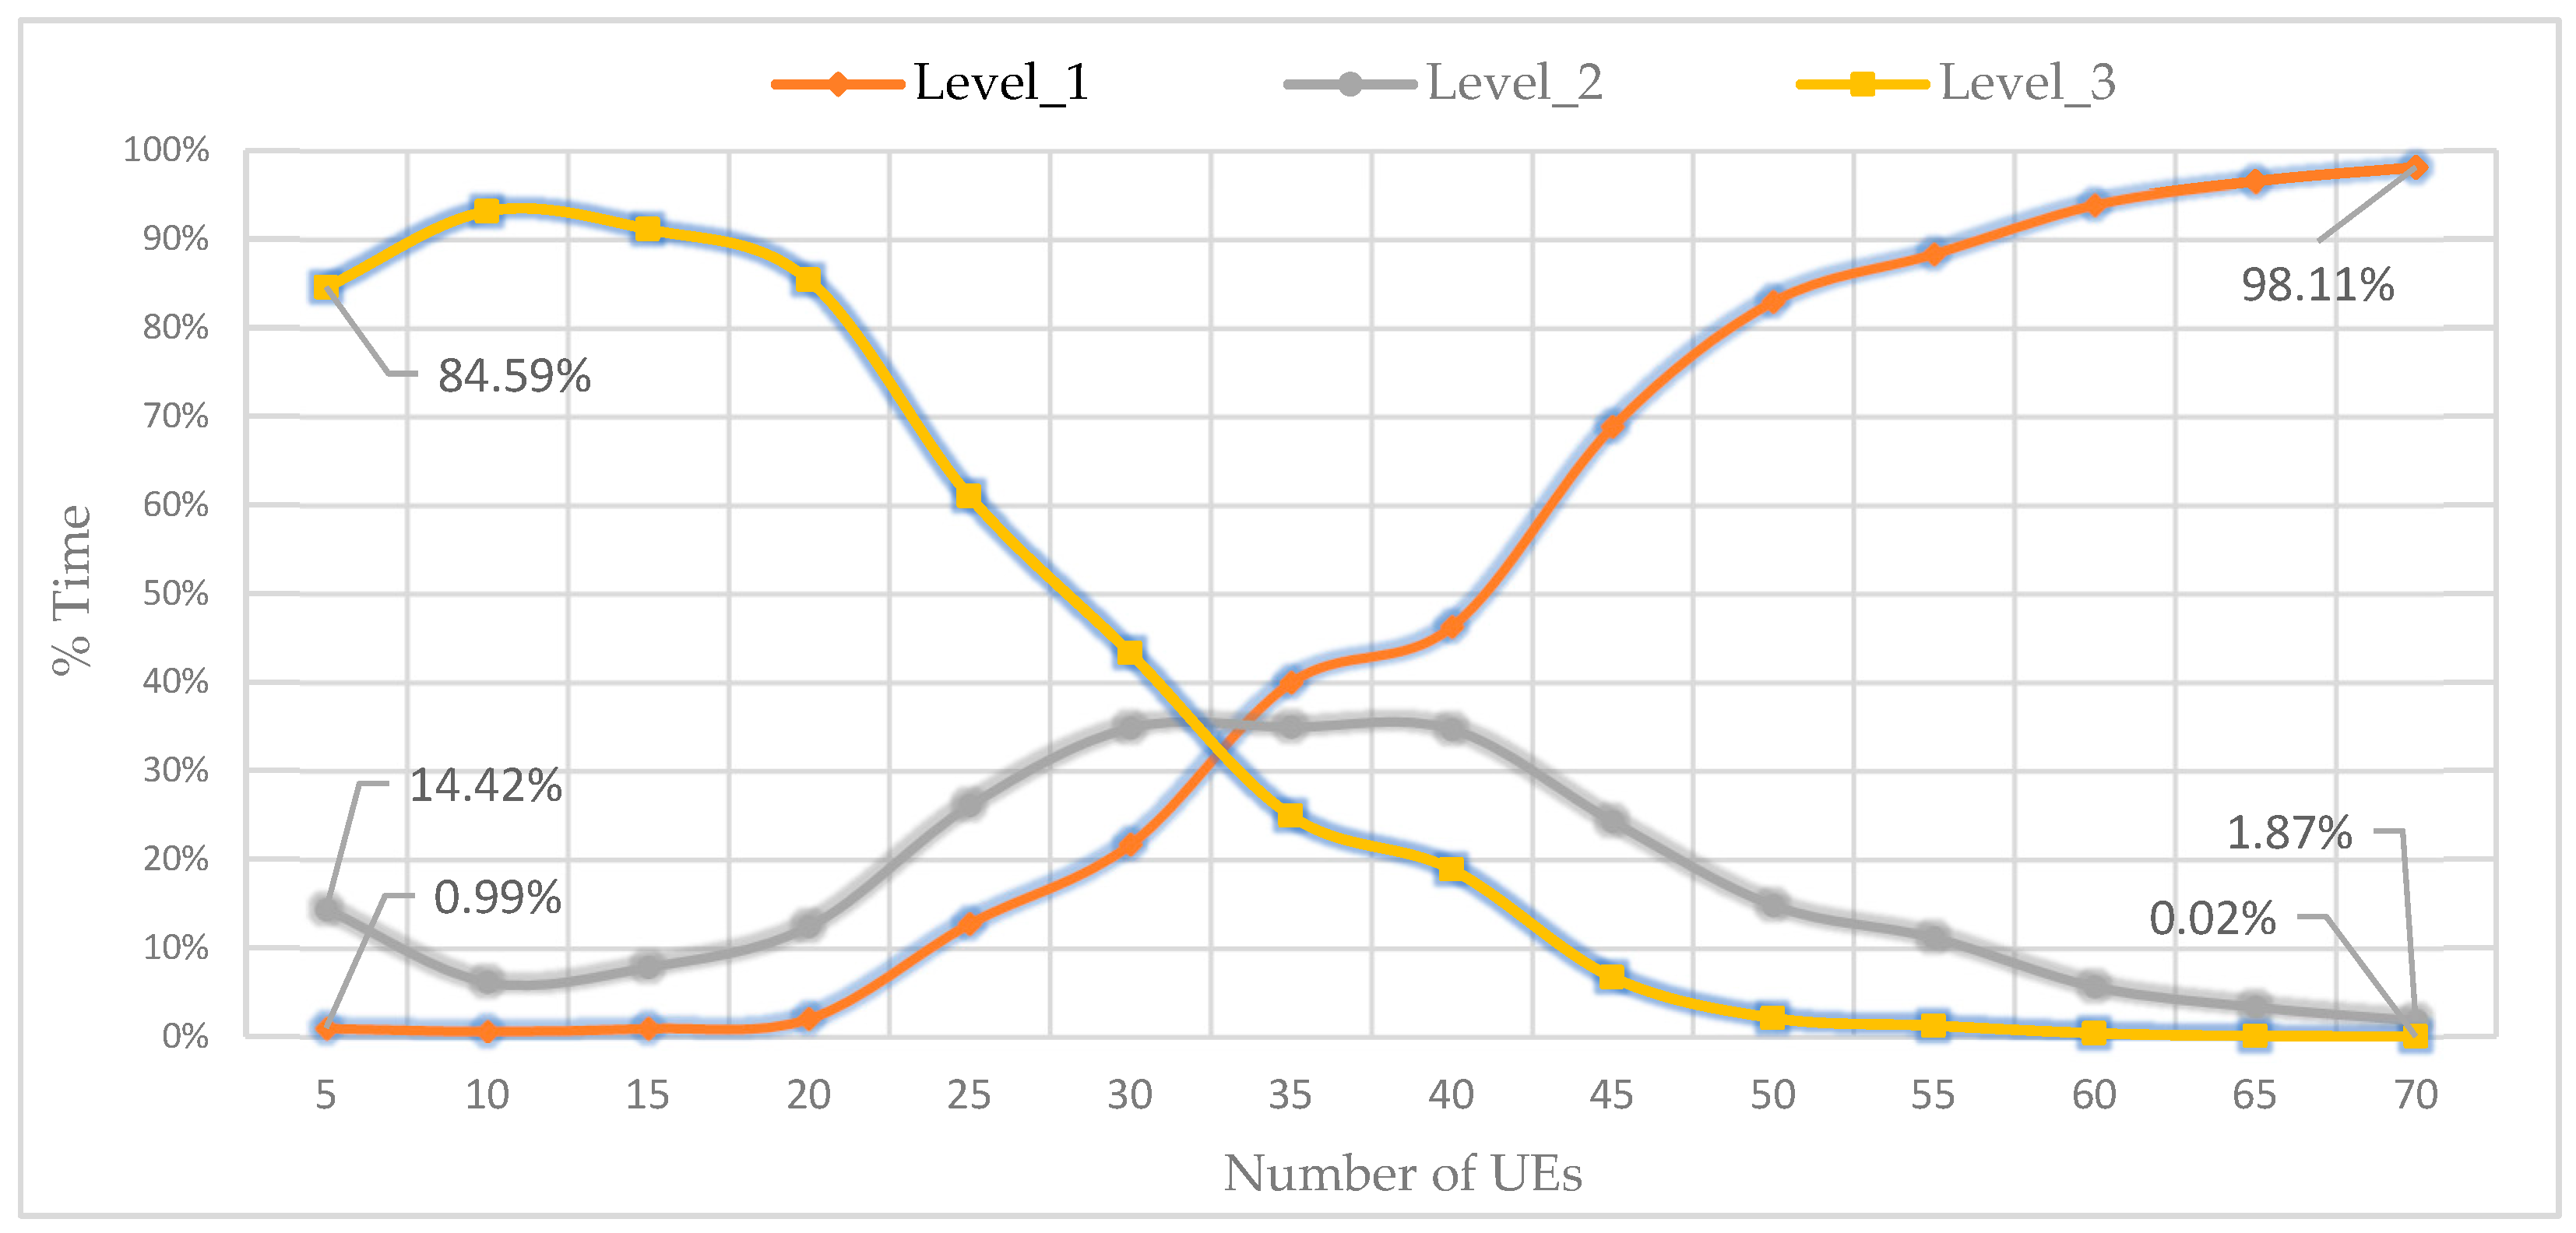
6.1. Effects of Density and Group Connectivity

In public safety situations, the aim is to guarantee reachability between participating users during the rescue mission. Group connectivity is defined as the capacity of all group users to continue to be inter-connected and reachable by other members of the same group. However, the consistency of group connectivity is not usually guaranteed, especially when a limited number of users are dispersed in large areas with different rescue missions and should move in opposite directions. We define three levels of group connectivity: level_1, when all users participating in the mission are reachable by forming a single group; level_2, when two groups of users are formed; and level_3, when three groups or more are formed. Figure 14 depicts the progression of the three levels of connectivity according to the number of UEs using the simulation parameters presented in Table 1. For each selected value of UE, from 5 to 70, placed on a square area of 500 m2, with a random speed that varies from 1 to 4 m/s, we calculate the average value of 10 simulations of 7200 s (2 h).
During these simulations, a verification is processed every second to count the time duration corresponding to every formed group’s connectivity type. For better presentation, we express the resulting time as a percentage of the total simulation time duration. From Figure 15, it is possible to conclude that with fewer than 20 UEs (80 UEs/km2), the probability of having a single group (or even two) is very low. With 50 UEs (200 UEs/km2), the probability of having level_3 becomes very minimal. As soon as 70 users (280 users/km2) are reached, the uniqueness (level_1) of the group is confirmed, and the decomposition of this group occurs for less than 2% of the total time, i.e., up to 2 to 3 min every 2 h.

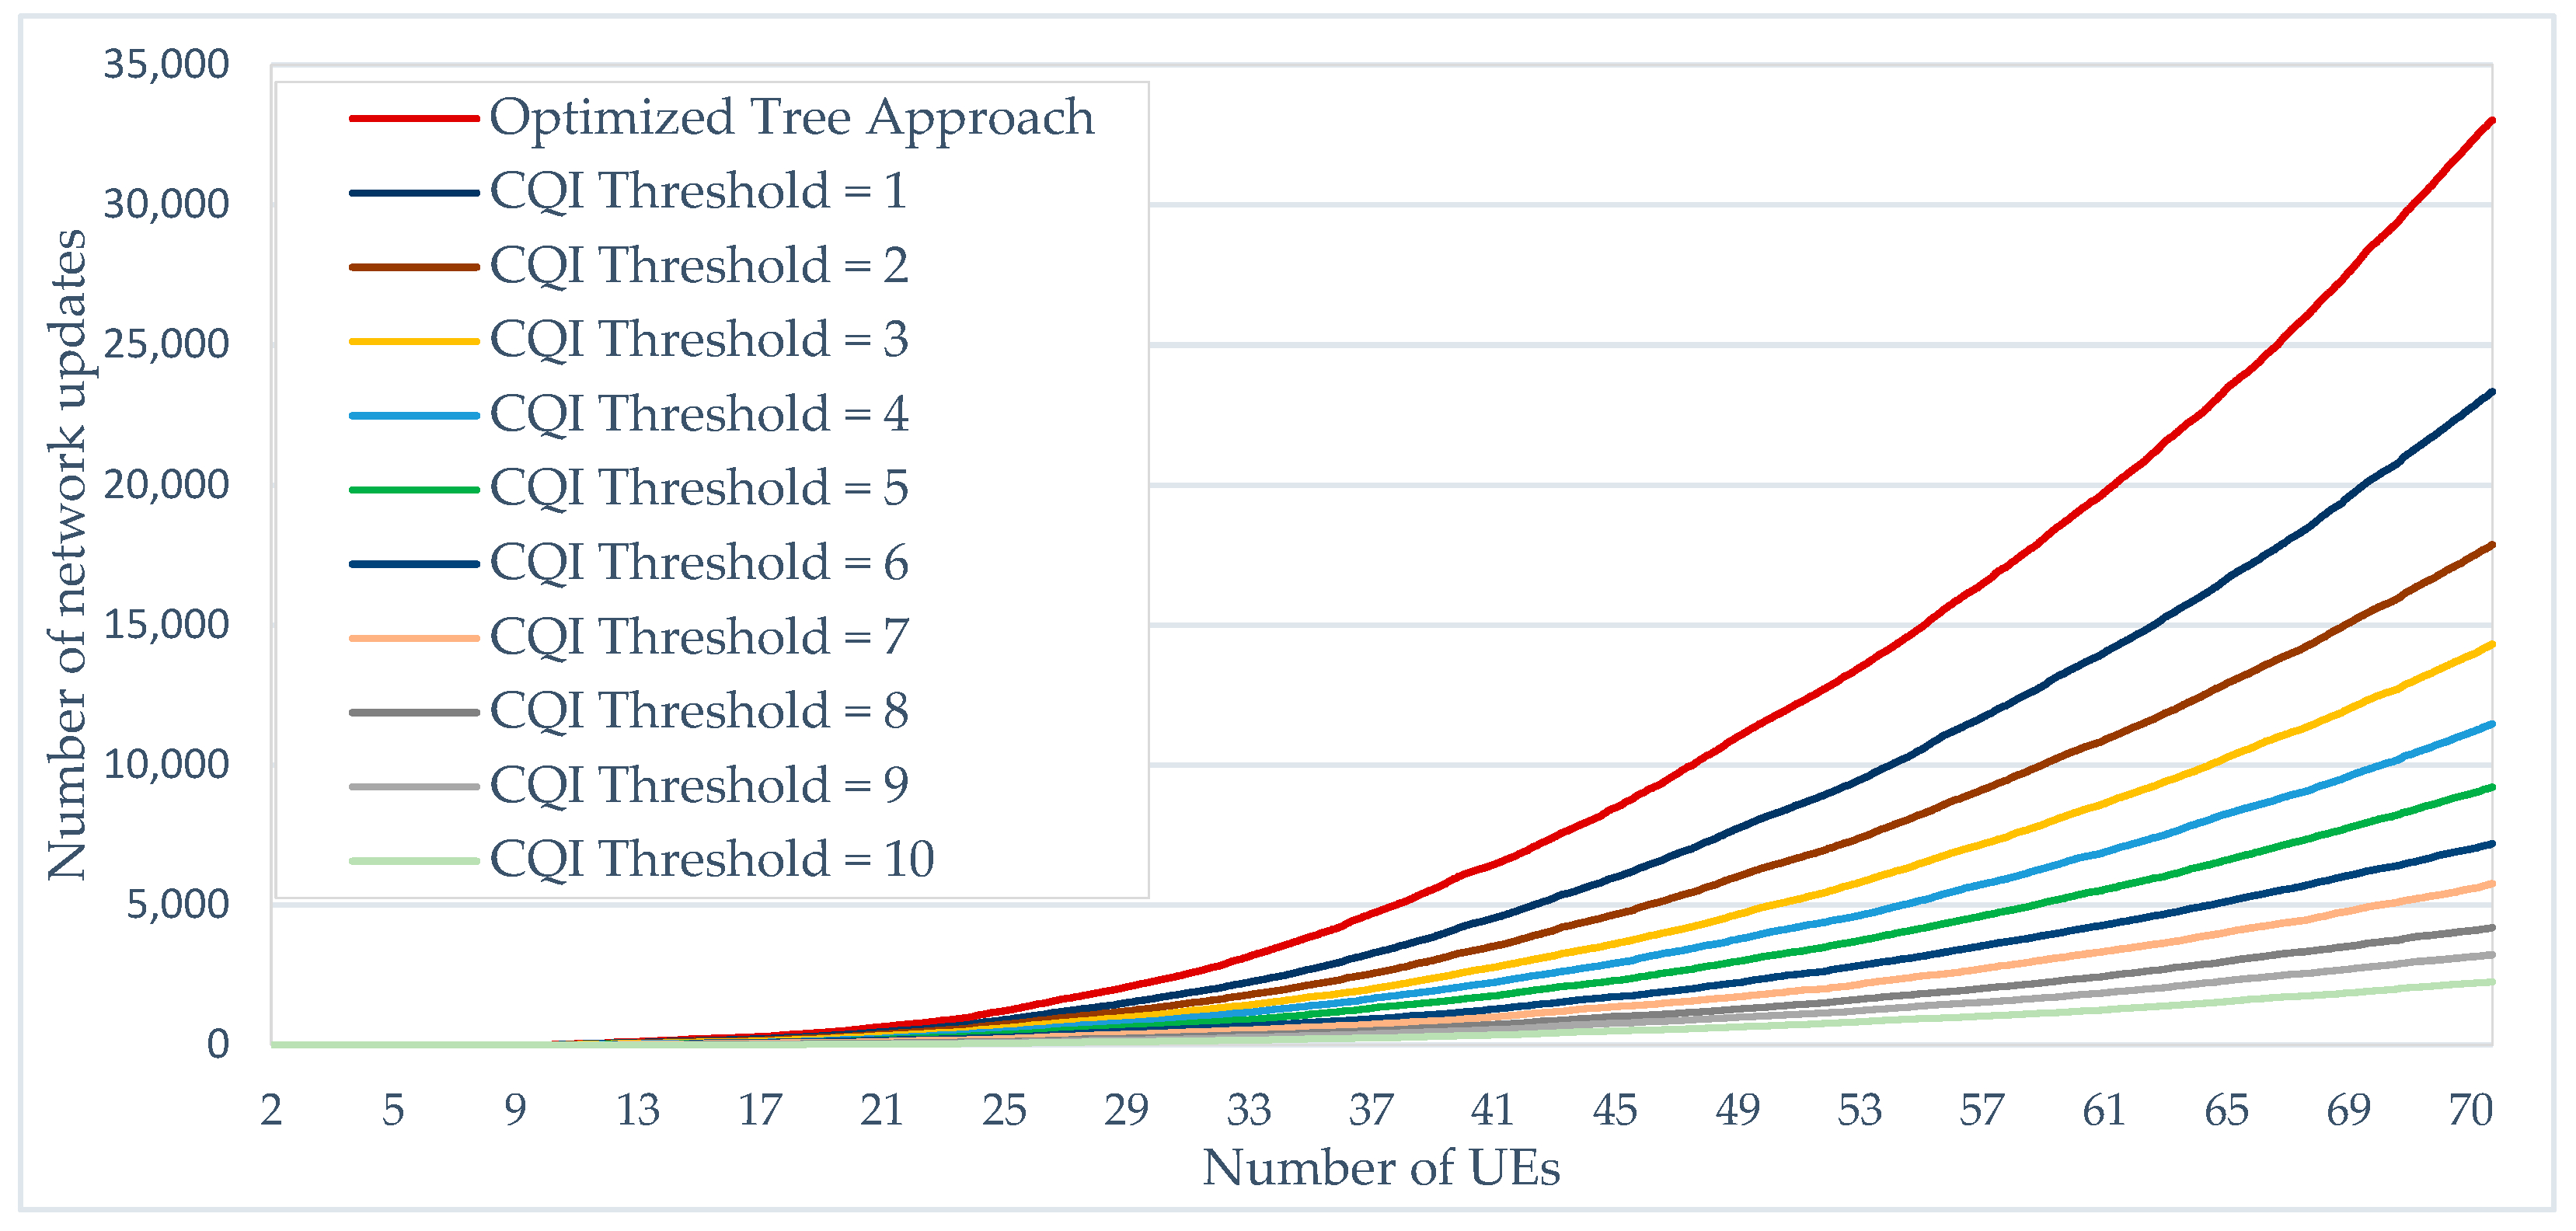
6.2. “Less Cost” vs. “Optimized Tree” Approaches

Using the simulation values presented in Table 1, the “Less cost” and “optimized tree” approaches are implemented, as explained in Section 4. While the “less cost” approach focuses on keeping minimum change in the network structure, the “optimized tree” approach allows each node to check in its neighbors for a better CQI. Simulations are conducted to estimate how costly keeping an optimized topology could be in terms of link substitutions. Figure 16 illustrates the gap between the two approaches, which becomes more considerable once the number of users reaches 20. Starting at 30 users, the gap begins to stabilize around 2 to 3 points on the CQI scale. The CQI value represents the average value of all established direct communication links in the network. To the same graph, the total incremental number of updates (divided by 2000 for better visibility) as well as the periodic number of updates per second were added. We notice that their value increases exponentially while the number of added users is in a linear progression. With 70 UEs, it takes up to 25 operations per second to keep the network optimized. During 2 h of simulation, more than 32,000 substitution operations were performed.

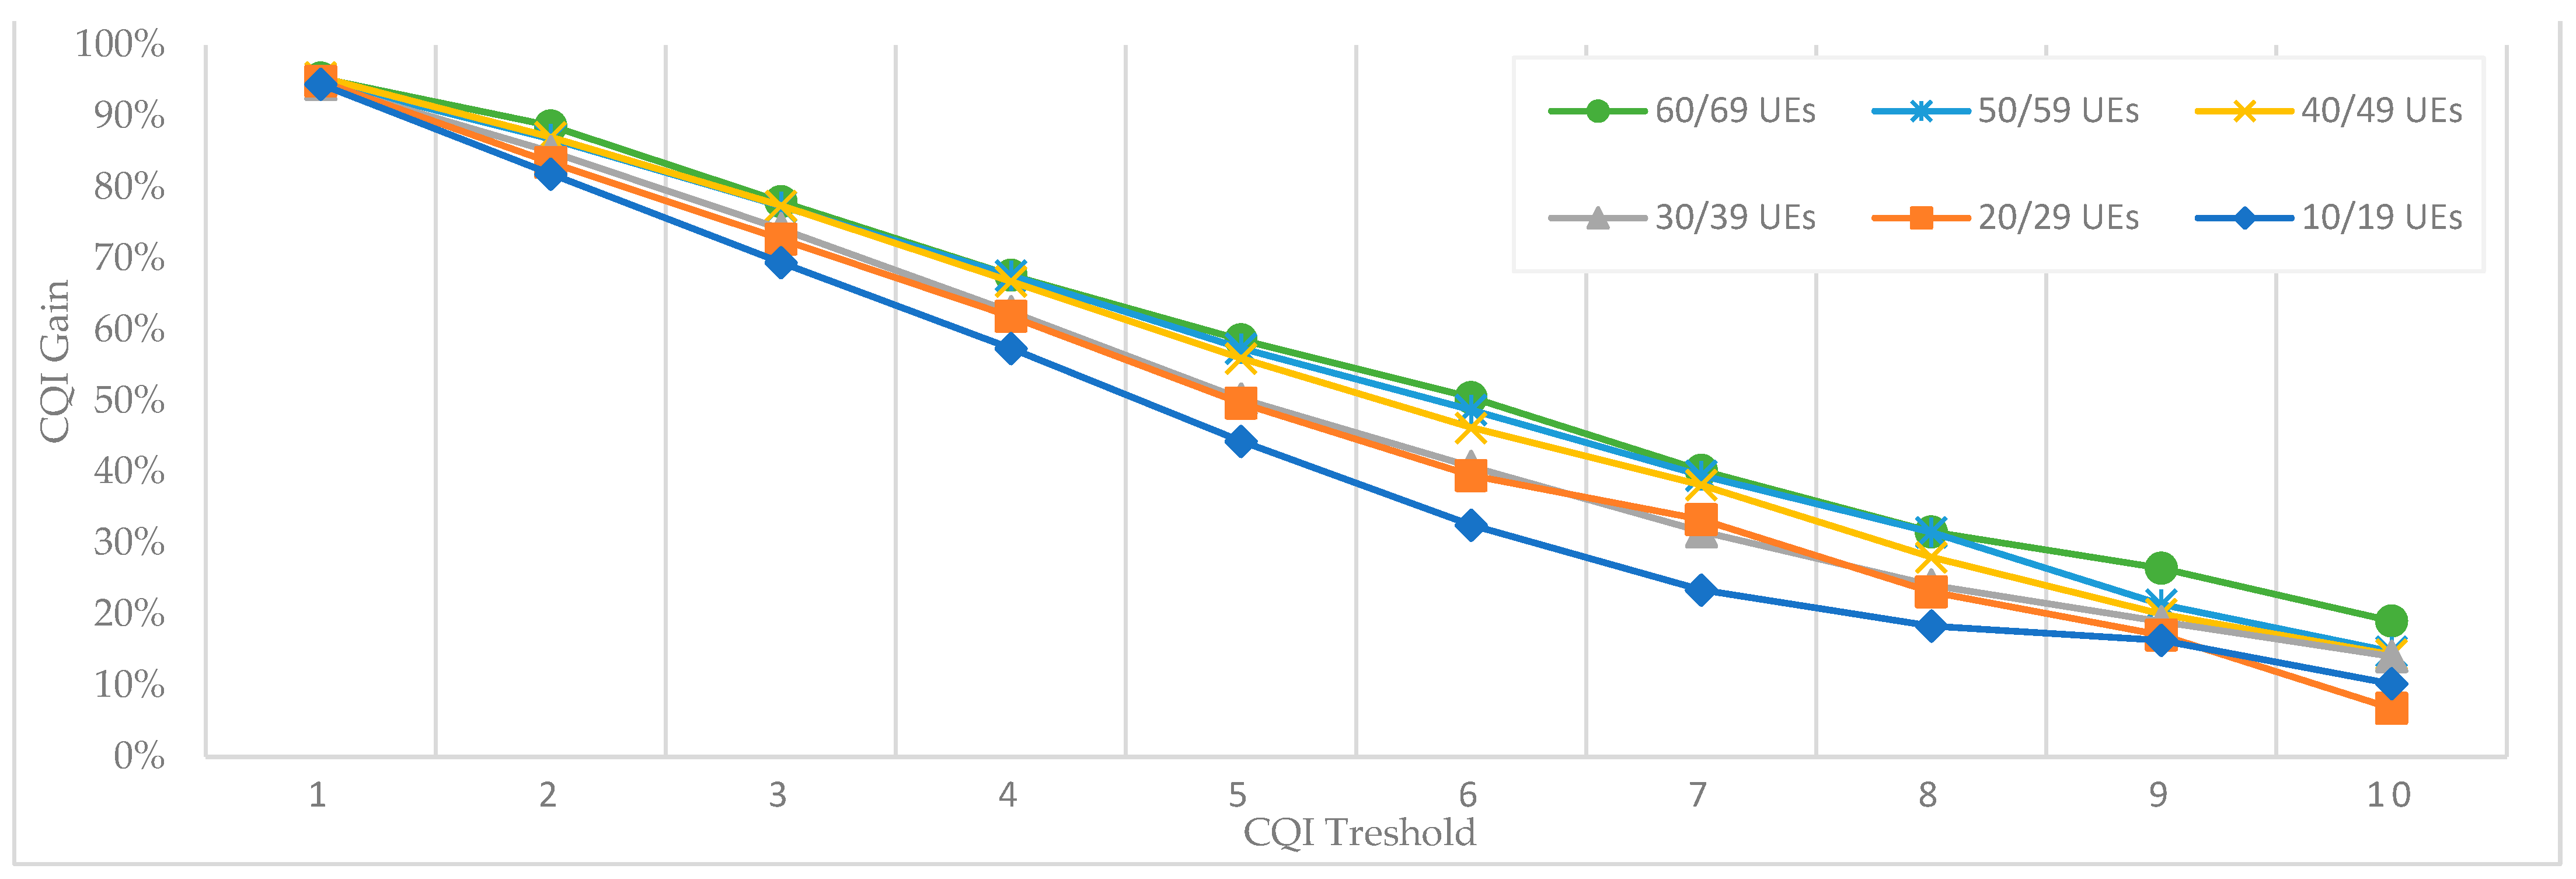
6.3. Effect of CQI Threshold-Based Approaches on Network Updates and the Average CQI of the Group

To reduce the number of network updates generated by the “optimized tree” approach, we introduce a CQI threshold, which should be verified before performing the update. Figure 17 shows the progression of the generated updates using different CQI threshold values. Compared with the “Optimized tree” approach (CQI = 0), we can notice a gain of almost 30% in network updates when the CQI threshold is equal to 1. This gain continues to progress less significantly with increasing CQI threshold values.
A set of simulations was carried out to verify the effect that the variation in the CQI threshold can have on the average CQI of the network. Several CQI thresholds were used during the simulations, ranging from 0 (for the optimized approach, as illustrated in Figure 18) to 10. For a better visual comparison, Figure 19 includes the CQI average chart for each CQI threshold value, while the line chart of the two reference approaches, i.e., “optimized tree” and “less cost”, are maintained for better comparison.
While the CQI threshold varies from 1 to 10, we notice that the resulting average CQI represents a loss compared with the “optimized tree” approach but also a gain compared with the “less cost” approach. For each number of users grouped into a set of 10, we calculate the gain generated by the average CQI according to simulated CQI threshold values. As a reference, the gain of 100% is obtained with the “optimized tree” method. Figure 18 and Figure 19 show excellent results when the CQI threshold is equal to 1 with a 95% gain. When the CQI is equal to 2, the gain becomes slightly less stable depending on the number of users and varies from 88% for 60/69 UEs to 82% for 10/19 UEs. In these simulations, the results when the number of users is less than 10 are not represented since the resulting average CQI is extremely unstable.

6.4. Effect of Increasing Optimization Intervals on Network Updates and the Average CQI of the Group

To reduce the number of network updates, a set of simulations is achieved by increasing the optimization interval while the CQI threshold is fixed at 0. Instead of performing the optimization every second, different values of the optimization interval (2, 4, 6, 8, 10, and 20 s) were simulated. Compared with the “optimized tree”, where optimization is carried out every second, we note from Figure 20, that using an interval of 2 s can reduce the number of network updates by almost 10% when the number of UEs is equal to 70. We also note that, with the variation in the optimization interval, the gap between network updates becomes significant starting at 40 UEs. Moreover, as the number of UEs increases, the reduction in network updates becomes more important.
Using the same values of the optimization interval, a set of simulations was carried out to verify the effect on the average CQI of the network. In Figure 21, different graphs corresponding to each selected optimization interval value are presented. We notice that the shape of the graph lines in the upper part is almost close to those of the “optimized network” approach. However, the difference widens in the lower values of the graph, and we notice that the values of the average CQI drop once the optimization interval increases.

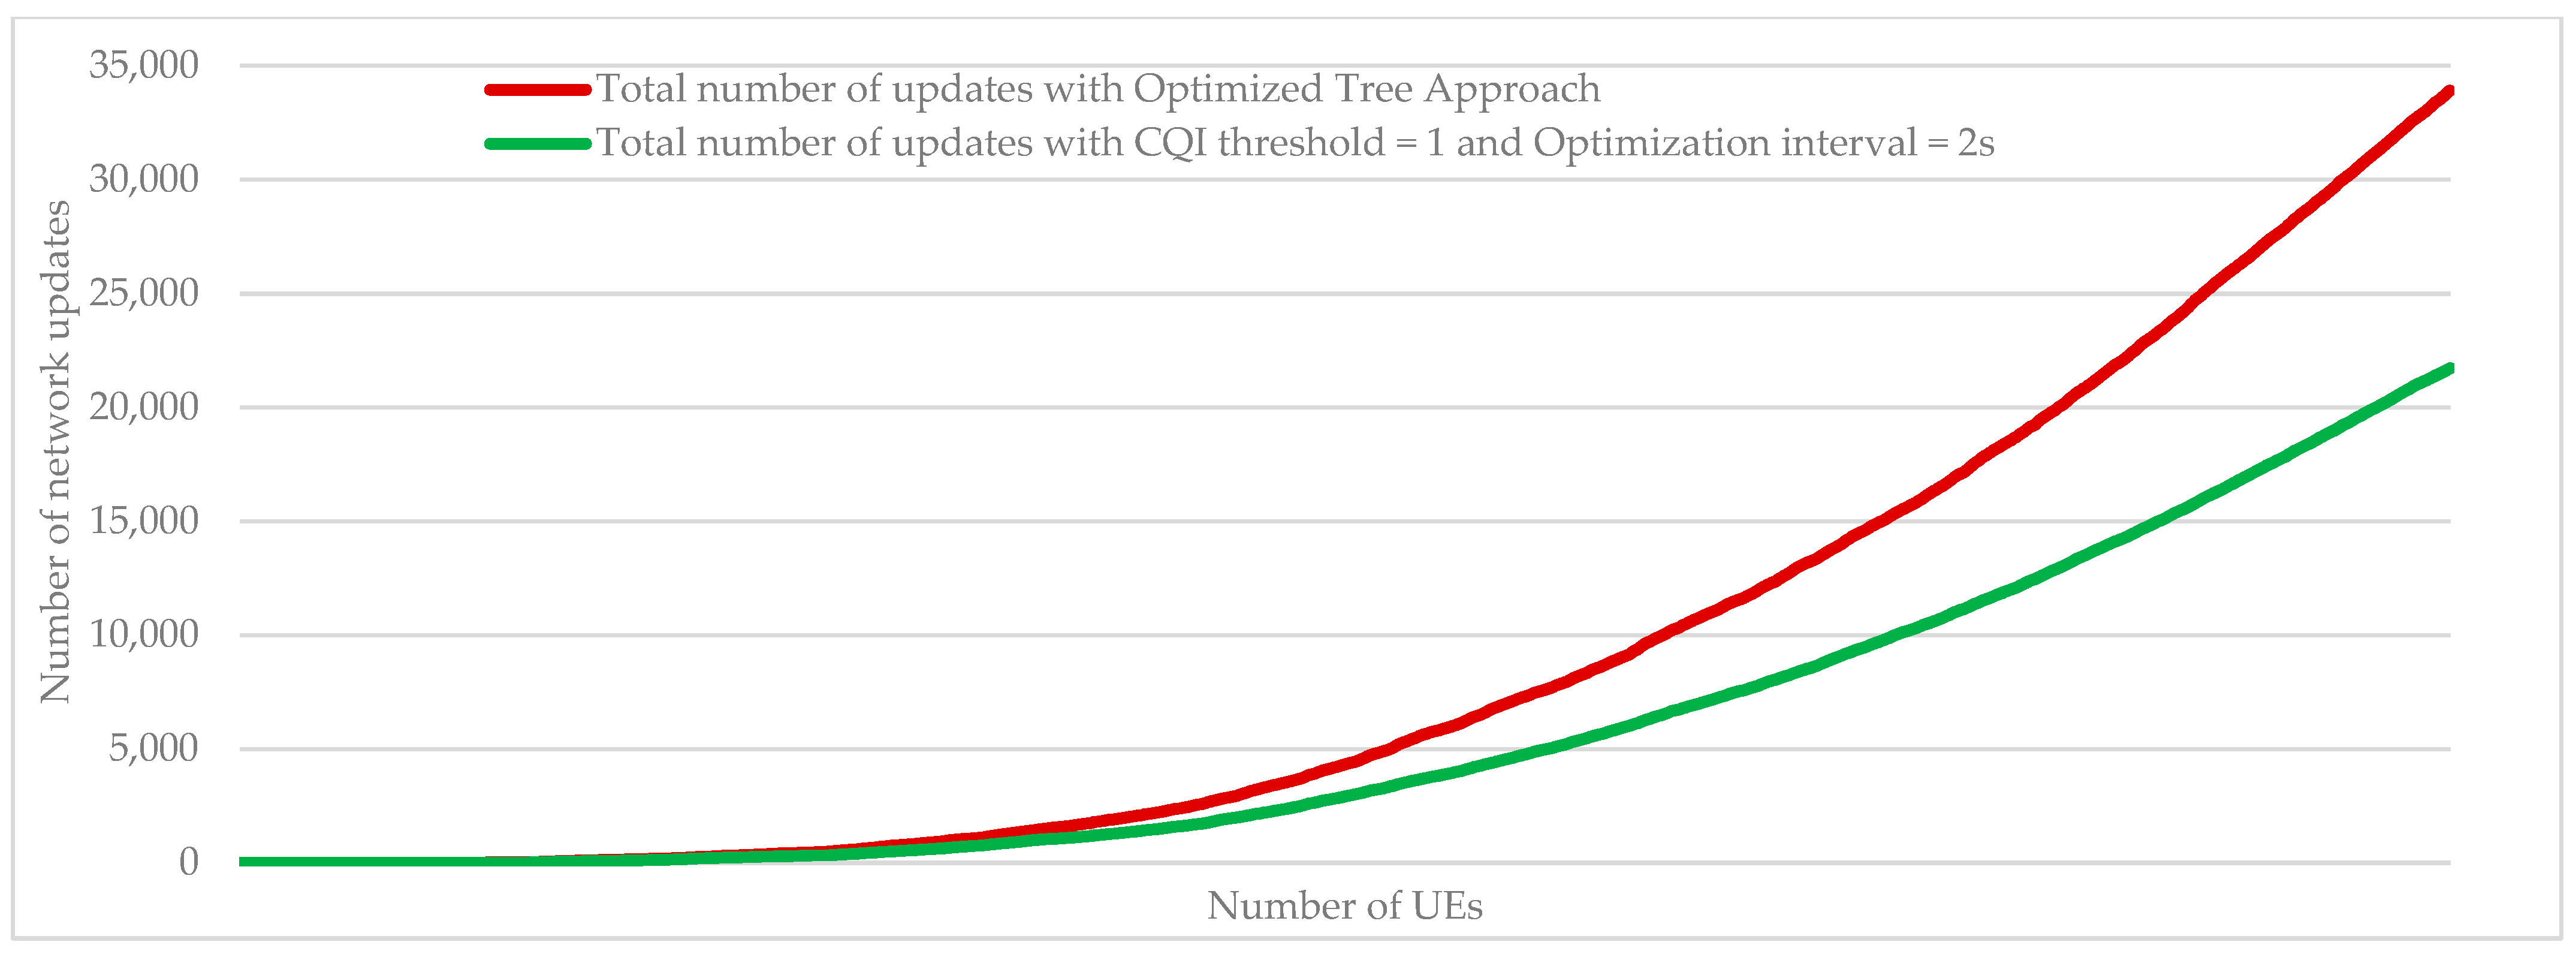
6.5. Effect of the Combination of the CQI Threshold and the Optimization Interval Compared with the “Optimized Tree” Approach

In the series of simulations previously presented, it was possible to note that the use of a CQI threshold equal to 1 or an optimization interval of 2 s made it possible to reduce the number of network updates without significantly affecting the CQI average. Therefore, new simulations were carried out using a new approach that combines the two following parameters: CQI threshold = 1 and optimization interval = 2 s. From the results presented in Figure 22 and Figure 23, we can notice a considerable drop in the number of updates, while the average CQI is slightly degraded. The generated average values, when the number of UEs = 70, are presented in Table 3 and compared with other approaches, i.e., “optimized tree”, “less cost”, CQI threshold = 1, and optimized interval = 2 s. The results are also shown as a percentage compared with the optimal values of the “optimized tree” approach.

6.6. Control Traffic Simulation

Simulations were carried out to measure the traffic generated by network control messages exchanged between UEs and the Application Server by keeping the same parameters used in the simulation experiments presented in Table 1. Figure 24 illustrates the traffic generated by notification messages sent by UEs to the server. The resulting outbound traffic increases rapidly and non-linearly with the progression of active UEs. However, the consumed bandwidth from the server side remains relatively very low (less than 45 Kb/s for 70 UEs) compared with the data rates offered by cellular technologies (LTE and 5G), which are generally measured in tens or even hundreds of Mb/s. At the same time, we notice slight repetitive peaks in the curves, which are due to the notification messages sent by the server when a new user is added. The inbound traffic supported by the server is generated by update messages sent from UEs, as illustrated in Figure 25. We note that this traffic is almost proportional to the number of UEs, and it remains relatively very low (less than 1.3 Kb/s for 70 UEs); therefore, we can conclude that it will be easily supported by the server.

7. Conclusions

D2D is a promising technology that opens the doors for different use cases mainly during emergency situations, where direct communication is enabled by telecom operators. Using simulations, it was possible to define the required UE density level that guarantees global connectivity for all participating users. Both the “optimized tree” and “less cost” approaches were evaluated in terms of the number of network updates and the level of the average CQI. It was concluded that the use of a CQI threshold equal to 1 combined with an optimization interval equal to 2 s can considerably reduce the number of optimization updates (by 35%) while the average CQI is kept close to the optimal values. The deployed approaches in this work are exclusively based on the CQI of the links between the participants. However, in an “energy-aware” context, a device with limited remaining autonomy should be placed as a leaf node by handling a minimal number of connections with its neighbors. Further work should therefore be conducted to create a more customized topology that takes into consideration user preferences and terminal capabilities.
The traffic generated by the control messages was measured with simulations. The proactive approach was used to transmit notification messages from the server to all participants as soon as a topology update was reported. However, it might be possible to reduce this control traffic by opting for a reactive approach where the transmission of notification messages is carried out, on demand, by responding to a user’s request. At the same time, update message traffic generated by users could be optimized by reducing the volume of the payload message. The partial update method can be used by describing changes in user neighborhoods (additions and removals) instead of sending the total description structure of all directly connected users.

Funding

This research received no external funding.

Data Availability Statement

The source code of the simulator program used in this paper is openly available at: https://github.com/wajdielleuch/D2D_SIM (accessed on 1 November 2023). Upon execution, the simulation results are then generated in text format.

Conflicts of Interest

The author declares no conflicts of interest.

References

  1. Alnoman, A.; Anpalagan, A. On D2D communications for public safety applications. In Proceedings of the 2017 IEEE Canada International Humanitarian Technology Conference (IHTC), Toronto, ON, Canada, 21–22 July 2017; pp. 124–127. [Google Scholar] [CrossRef]
  2. Chen, Y.; Ma, C. Overview of D2D Communication Technology under 5G Cellular Network Coverage. In Proceedings of the 2020 IEEE 6th International Conference on Computer and Communications (ICCC), Chengdu, China, 11–14 December 2020; pp. 1297–1301. [Google Scholar] [CrossRef]
  3. 3GPP Technical Specification Group Services and System Aspects. Proximity-Based Services (Prose); Stage 2, TS 23.303 (Release 17); ETSI: Sophia Antipolis, France, 2023. [Google Scholar]
  4. Zahinos, R.; Abaunza, H.; Murillo, J.I.; Trujillo, M.A.; Viguria, A. Cooperative Multi-UAV System for Surveillance and Search&Rescue Operations Over a Mobile 5G Node. In Proceedings of the 2022 International Conference on Unmanned Aircraft Systems (ICUAS), Dubrovnik, Croatia, 21–24 June 2022; pp. 1016–1024. [Google Scholar] [CrossRef]
  5. Liu, Z.; Chen, H.; Wen, Y.; Xiao, C.; Chen, Y.; Sui, Z. Mode Design and Experiment of Unmanned Aerial Vehicle Search and Rescue in Inland Waters. In Proceedings of the 2021 6th International Conference on Transportation Information and Safety (ICTIS), Wuhan, China, 22–24 October 2021; pp. 917–922. [Google Scholar] [CrossRef]
  6. Naidoo, Y.; Stopforth, R.; Bright, G. Development of an UAV for search & rescue applications. In Proceedings of the IEEE Africon ’11, Victoria Falls, Zambia, 13–15 September 2011; pp. 1–6. [Google Scholar] [CrossRef]
  7. Ray, P.P.; Mukherjee, M.; Shu, L. Internet of Things for Disaster Management: State-of-the-Art and Prospects. IEEE Access 2017, 5, 18818–18835. [Google Scholar] [CrossRef]
  8. Sou, S.I.; Li, M.R.; Wang, S.H.; Tsai, M.H. File distribution via proximity group communications in LTE-advanced public safety networks. Comput. Netw. 2018, 149, 93–101. [Google Scholar] [CrossRef]
  9. Babun, L.; Yürekli, A.İ.; Güvenç, İ. Multi-hop and D2D communications for extending coverage in public safety scenarios. In Proceedings of the 2015 IEEE 40th Local Computer Networks Conference Workshops (LCN Workshops), Clearwater Beach, FL, USA, 26–29 October 2015; pp. 912–919. [Google Scholar] [CrossRef]
  10. Huang, C.; Zhai, B.; Tang, A.; Wang, X. Virtual mesh networking for achieving multi-hop D2D communications in 5G networks. Ad Hoc Netw. 2019, 94, 101936. [Google Scholar] [CrossRef]
  11. 3GPP Technical Specification Group Radio Access Network. Evolved Universal Terrestrial Radio Access (E-UTRA), Radio Resource Control (RRC), Protocol specification, TS 36.331 (Release 17); ETSI: Sophia Antipolis, France, 2023. [Google Scholar]
  12. 3GPP Technical Specification Group Core Network and Terminals. Proximity-Services (ProSe) in 5G System (5GS) Protocol Aspects, TS 24.554 (Release 18); ETSI: Sophia Antipolis, France, 2023. [Google Scholar]
  13. Lai, L.; Feng, D.; Zheng, F.-C.; Wang, X.; Yang, H.H.; Quek, T.Q.S. CQI-Based Interference Detection and Resource Allocation with QoS Provision in LTE-U Systems. IEEE Trans. Veh. Technol. 2021, 70, 1421–1433. [Google Scholar] [CrossRef]
  14. Elleuch, W. D2D Simulator for Loosely Coupled Network). ULCO. November 2023. Available online: https://github.com/wajdielleuch/D2D_SIM (accessed on 16 November 2023).
  15. Synave, R.; Desitter, A.; Dubrunfaut, N.; Langa, M.; Langa, G. MG2D (2D Graphics Engine). ULCO, Calais. 13 January 2020. Available online: https://iut.univ-littoral.fr/gitlab/synave/MG2D (accessed on 15 September 2023).
  16. Kumar, C. Evaluation of MANET Performance in Presence of Obstacles. Int. J. Ad Hoc Sens. Ubiquitous Comput. 2012, 3, 37–46. [Google Scholar] [CrossRef]
  17. Wang, X.; Liu, Z.; Wang, J.; Loughney, S.; Yang, Z.; Gao, X. Experimental study on individual walking speed during emergency evacuation with the influence of ship motion. Phys. A Stat. Mech. Its Appl. 2021, 562, 125369. [Google Scholar] [CrossRef]
  18. Lin, X.; Andrews, J.G.; Ghosh, A.; Ratasuk, R. An overview of 3GPP device-to-device proximity services. IEEE Commun. Mag. 2014, 52, 40–48. [Google Scholar] [CrossRef]
  19. Lim, D.-W.; Chun, C.-J.; Kang, J.-M. Transmit Power Adaptation for D2D Communications Underlaying SWIPT-Based IoT Cellular Networks. IEEE Internet Things J. 2022, 10, 987–1000. [Google Scholar] [CrossRef]
Figure 1. Overview of some solutions for extending cellular coverage.
Telecom 05 00007 g001
Figure 2. Non-roaming reference ProSe architecture for 4G/5G networks.
Telecom 05 00007 g002
Figure 3. D2D communication scenarios.
Telecom 05 00007 g003
Figure 4. Overview of ProSe functions.
Telecom 05 00007 g004
Figure 5. Infrastructure vs. D2D-based communication in cellular networks. (a) Underlay network in a cellular network. (b) Underlay network in D2D.
Telecom 05 00007 g005
Figure 6. Overview of some D2D underlay network topology models: (a) loosely coupled, (b) fully coupled, and (c) tightly coupled.
Telecom 05 00007 g006
Figure 7. Creation of Gnc and Gc groups for users in coverage of the selected user.
Telecom 05 00007 g007
Figure 8. Creating links with Gnc and Gc group members.
Telecom 05 00007 g008
Figure 9. Flowchart showing the process of adding new users in the loosely coupled approach.
Telecom 05 00007 g009
Figure 10. Flowchart of the network update procedure.
Telecom 05 00007 g010
Figure 11. Example of a sequence diagram for topology map control messages between users and the Application Server.
Telecom 05 00007 g011
Figure 12. Overview of D2D direct communication in loosely coupled topology implementing: (a) “less cost” and (b) “optimized tree”.
Telecom 05 00007 g012
Figure 13. Adding UEs to the simulation area over time.
Telecom 05 00007 g013
Figure 14. UE movement in the Random Direction Mobility model.
Telecom 05 00007 g014
Figure 15. Progression of the three group connectivity levels according to the number of UEs and the corresponding time duration in percentage.
Telecom 05 00007 g015
Figure 16. Comparison of “less cost” vs. “optimized tree” approaches in terms of the average CQI with the progression of both the number of updates per second and the total number of updates while the number of users increases.
Telecom 05 00007 g016
Figure 17. Number of network updates generated according to different CQI thresholds.
Telecom 05 00007 g017
Figure 18. Resulting average CQI for each CQI threshold value (from 1 to 10).
Telecom 05 00007 g018aTelecom 05 00007 g018b
Figure 19. Average CQI gains according to the number of UEs and CQI threshold values.
Telecom 05 00007 g019
Figure 20. Number of network updates generated according to different optimization intervals.
Telecom 05 00007 g020
Figure 21. Average CQI for each optimization frequency.
Telecom 05 00007 g021
Figure 22. Comparison of the average CQI between the optimized tree approach and the customized approach (CQI threshold = 1 and optimized interval = 2 s).
Telecom 05 00007 g022
Figure 23. Comparison of the number of network updates between the “optimized tree” approach and the customized approach (CQI threshold = 1 and optimized interval = 2 s).
Telecom 05 00007 g023
Figure 24. Outbound traffic generated by notification messages sent by the Application Server.
Telecom 05 00007 g024
Figure 25. Inbound traffic generated by update messages sent to the Application Server.
Telecom 05 00007 g025
Table 1. Summary of the Parameters used in the simulation experiments.
Simulation ParametersValue
Transmitter rangeRandomly from 100 to 200 m
CQI1 to 15 (0 for unreachable UE)
Simulation time7200 s (2 h)
Node pause time when boundary is reachedRandomly 0 to 60 s
Topology size500 m × 500 m
Number of nodesFrom 2 to 70 (new added node every 100 s)
Node speed (Vmax)0 to 4 m/s
Table 2. CQI-MCS mapping for D2D direct communication.
CQIModulation and Coding SchemeMin. Rate D2D (kbps)
1QPSK28.00
2QPSK37.33
3QPSK56.00
4QPSK112.00
5QPSK168.00
6QPSK201.60
716-QAM224.00
816-QAM336.00
916-QAM403.20
1064-QAM504.00
1164-QAM504.00
1264-QAM604.80
1364-QAM756.00
1464-QAM840.00
1564-QAM924.00
Table 3. Summary of the average results generated using the customized approach (CQI threshold = 1 and optimized interval = 2 s) and compared with some selected other approaches when the number of UEs = 70.
Optimized Tree ApproachLess Cost
Approach
CQI Threshold = 1Optimization
Interval = 2 s
CQI Threshold = 1 and Optimization Interval = 2 s
Number of network updates33,0360
(−100%)
24,338
(−27%)
29,403
(−11%)
21,700
(−35%)
Average CQI12.039.25
(−23.11%)
11.89
(−1.16%)
11.77
(−2.16%)
11.6
(−3.57%)
Disclaimer/Publisher’s Note: The statements, opinions and data contained in all publications are solely those of the individual author(s) and contributor(s) and not of MDPI and/or the editor(s). MDPI and/or the editor(s) disclaim responsibility for any injury to people or property resulting from any ideas, methods, instructions or products referred to in the content.

