Abstract
Free space optics (FSOs) is an emerging technology offering solutions for secure and high data rate transmission in dense urban areas, back haul link in telecommunication networks, and last mile access applications. It is important to investigate the performance of the FSO link as a result of aggregate attenuation caused by different weather conditions in a region. In the present work, empirical models have been derived in terms of visibility, considering fog, haze, and cloud conditions of diverse geographical regions of Delhi, Washington, London, and Cape Town. Mean square error (MSE) and goodness of fit (R squared) have been employed as measures for estimating model performance. The dual polarization-quadrature phase shift keying (DP-QPSK) modulation technique has been employed with hybrid mode and the wave division multiplexing (MDM-WDM) scheme for analyzing the performance of the FSO link with two Laguerre Gaussian modes (LG00 and LG 01) at 5 different wavelengths from 1550 nm to 1554 nm. The performance of the system has been analyzed in terms of received power and signal to noise ratio with respect to the transmission range of the link. Minimum received power and SNR values of −52 dBm and −33 dB have been obtained over the observed transmission range as a result of multiple impairments. Random forest (RF), k-nearest neighbors (KNN), multi-layer perceptron (MLP), gradient boosting (GB), and machine learning (ML) techniques have also been employed for estimating the SNR of the received signal. The maximum R squared (0.99) and minimum MSE (0.11), MAE (0.25), and RMSE (0.33) values have been reported in the case of the GB model, compared to other ML techniques, resulting in the best fit model.
Keywords:
attenuation model; clouds; DP-QPSK; free space optics (FSOs); fog; haze; LG modes; MDM-WDM; wireless communication 1. Introduction
In today’s era, there is an enormous demand for fast data rates, bandwidth, and capacity for live streaming, social networking, and video conferencing [1]. Radio frequency technology has been widely used for terrestrial communication, but it has limited bandwidth and suffers from interference that decreases the capacity and security. Radio frequency links offer lower data rates, need large antennas, and are highly susceptible to multipath fading. Free space optics (FSOs) is considered a strong candidate to complement and integrate with next generation technologies and is currently considered as one of the key technologies for solving the last mile access problem resulting from the backbone of optical fibers to user terminals. It may offer high-speed broadband access in regions where fiber optic cabling may be impractical or costly. There is a challenge of getting high speed, stable, and secure communication service from core network infrastructure (e.g., central office, local exchange) to remote sites (e.g., businesses, offices, individual homes, hilly areas, or other end-user locations) [2]. Unrestricted spectrum access, low latency, the absence of interference to radio frequency and electromagnetic induction, and the possibility of quick and easy installation are some of the main features of this technology.
As FSOs use air as a transmission medium to transfer the laser pulses, there is no need to dig up the ground, as in the case of optical fiber [3,4]. Thus, utilizing this technology for last mile communication or difficult terrain can significantly contribute to the connectivity between remote rural areas and cities. It also finds applications in the interconnection of high-rise buildings in urban areas and office blocks or structures on both sides of highways or railways as well as banks of rivers that are difficult to bridge.
Technology faces many challenges, like scintillation, turbulence, geometric losses, and attenuation, due to different weather conditions. Random variations in temperature and pressure cause the refractive index of air to deviate, causing atmospheric turbulence. Scintillation may result in rapid fluctuations in the phase and intensity of light as it propagates through the atmosphere [5]. Geometric losses spread the optical beam due to misalignment of the transmitter and receiver, which causes diffraction of the signal during propagation through the atmosphere. Performance estimation could be useful for applications, including FSO link beam tracking and localization. The losses impact the received signal strength and may be considered as constant factors for a fixed link configuration [6]. Weather conditions, like fog, haze, and clouds, may heavily attenuate the signal by absorbing and scattering the information-carrying photons, affecting link availability [7].
Dual polarization comprises two distinct, orthogonally polarized optical signals at the same wavelength. The transmission of signals may require half the data rate by splitting the data across the two polarizations. Channels can be spaced closer together by utilizing dual polarization quadrature phase shift keying (DP-QPSK) as the modulation technique, thus reducing the amount of bandwidth needed to transmit the optical signal [8].
In WDM, different wavelength signals share the same transmission medium, thus improving the capacity of the transmission. Information rates and spectral efficiency can be increased by employing MDM with parallel transmission of information through different modes within the same frequency band [9]. Further capacity enhancement is achieved by incorporating MDM along with WDM in a FSO system by utilizing both spatial modes and multiple wavelengths for free-space channels [10,11]. DP-QPSK combined with WDM and MDM enables the simultaneous transmission of numerous independent data streams at different wavelengths, polarizations, and modes. This may enable a very high data rate throughput and capacity enhancement of optical networks.
In the literature, several techniques have been proposed to improve spectral efficiency, OSNR, capacity, and the data rate of the FSO link [12,13,14,15,16,17]. The authors of [12] modeled the cloud induced attenuation of Tokyo and Sendai regions of Japan by deriving its probability distribution function using curve-fitting techniques. The experimental evaluation of fog and haze climate conditions of a FSO link have been carried out under controlled conditions employing the Kim, Kruse, and Alnaboulsi prediction models in [13]. The simulation results have been compared with experimental data, exhibiting the same trend of decrease in the received voltage levels with the increase in the intensity of fog or haze conditions. The authors of [2] analyzed the attenuation as a result of fog weather conditions in hilly regions of India. The PSK modulation technique results in better performance of the FSO link at a data rate and transmission wavelength of 40 Gbps and 1550 nm, respectively.
A bidirectional WDM-FSO link has been investigated employing 16 quadrature amplitude modulation (QAM), orthogonal frequency division multiplexing (OFDM), and on–off keying (OOK) modulation formats, considering the gamma-gamma channel model in [14]. A data rate of 320 Gbps has been achieved over a transmission range of 1000 m for possible data center applications. A 16 × 10 Gbps FSO communication link has been analyzed for fog-induced attenuation in diverse regions by employing WDM with the OFDM technique [15]. A digital signal processing (DSP) module has been incorporated to mitigate channel-induced limitations, achieving a link range up to 10.75 km while maintaining a bit error rate of 10−9.
The authors of [16] estimated the prediction accuracy of received signal strength indicators (RSSI) on the receiver side of a FSO link by considering real time, non-linear atmospheric conditions in a maritime environment. Different models proposed in the literature predict the attenuation of the link based on the specific weather conditions of a region. Multi-impairments (fog, clouds, and haze) are time varying and depend on atmospheric and environmental variables.
Regions with diverse meteorological conditions should be considered for analysis with an aim to evaluate the performance of the FSO link at high data rates under multi-impairment conditions Delhi, Washington, Cape Town, and London are meteorological regions and metropolitan cities with higher population densities and serve as hubs of information technology. The regions need better means of communication with higher achievable data rates under different impairments. Network planners must calculate the link length between the transmitter and receiver, link availability, outage probability, network dependability, and other factors based on the power margin/loss budget. It is important to investigate the performance of the link as a result of aggregate attenuation caused by different weather conditions.
In the present work, data on fog, haze, and cloud climate conditions of four distinct geographical regions have been analyzed to derive a unified empirical model for the prediction of attenuation at optical wavelengths caused by multi-impairments in any region. These regions have greater population density and are hubs of information technology. The DP-QPSK modulation technique with Laguerre Gaussian (LG 00 and LG 01) modes has been employed to investigate the performance of the WDM-MDM-based FSO link under fog, haze, and cloud weather conditions. Accurate attenuation predictions may help determine the required transmitter power, antenna alignment receiver sensitivity, and other system parameters to achieve reliable communication. Further, performance estimation of the system has been achieved by employing random forest (RF), k-nearest neighbors (KNN), multi-layer perceptron (MLP), and gradient boosting (GB) machine learning (ML) techniques. The rest of the paper is organized as follows: Section 2 defines the different attenuation prediction models. The empirical model and its performance evaluation have been described in Section 3. Section 4 details the system design, and the results of analysis have been included in Section 5.
2. Attenuation Prediction Models
Fog, clouds, and haze are the main challenges in the implementation of a FSO link. Atmospheric attenuation caused by different environmental factors are mainly dominated by fog as the particle size in this case is comparable to the wavelengths of interest. The fog (1–20 μm) and clouds (3–6 μm) consist of very fine droplets of water, which may cause absorption and scattering of transmitted optical signals. Due to their small refractive index and particle size, ice crystals do not contribute much to attenuation due to absorption [18]. Thus, absorption can generally be neglected at the wavelength of interest for free space communication [19].
Haze (0.01–1 μm) consists of small aerosol particles suspended in the air, dust, pollutants, etc. As the size of particles is comparable to the wavelengths in visible and IR bands, it may cause attenuation at FSO wavelengths. In order to estimate the attenuation, visibility statistics and the relationship between visibility and propagation loss has to be known. For characterization of fog and haze attenuation, the term “specific attenuation” is used, which represents attenuation in dB/km and is expressed as [20]:
where Po and Pr represent the transmitted and received optical power at distance R, respectively. R and γ(λ) represent the link length and attenuation coefficient of the atmosphere, respectively. λ represents the wavelength. Mie scattering theory can be applied to predict attenuation, which involves complex computations requiring details of fog parameters. Using empirical models and taking 550 nm as the visibility reference wavelength, specific attenuation due to fog and haze may be expressed as:
where v and λ define the visibility range in km and operating wavelength in nm, respectively. m is defined as the scattering distribution coefficient and its value can be specified by the Kim and Kruse model. The Kruse model was originally proposed for haze particles and is one of the widely used models for defining the scattering distribution coefficient [21]:
The model has uncertainty about visibility less than 1 km and estimates less attenuation for longer wavelengths. Kim suggested a modified model based on theoretical assumptions and indicates wavelength independent of attenuation for v < 0.5 km. m values as per the Kim model are defined as:
Clouds are formed when water condenses or deposits above the surface of the earth and are characterized by their properties, like cloud height, thickness, water content, phase, droplet sizes, horizontal extent, and variability. Attenuation due to clouds can be as high as several tens of decibels with water droplets ranging from 1 to 30 μm. The visibility in this case may be expressed as [22]:
where L (g/m3) and Nc (cm−3) represent the average cloud liquid water content (CLWC) and cloud droplet number concentration, respectively. Nc may be further expressed as:
where r (μm) and (1 g/cm3) represent the mean of the cloud droplet radius and density of liquid water, respectively. r is 3.33, 4.7, and 6.0 (μm) in the case of stratus, nimbostratus, and cumulus clouds, respectively [22]. Cloud attenuation from observed visibility values may be predicted by an empirical model estimating the optical extinction coefficient due to scattering, as given in Equation (2).
3. Proposed Model and Its Performance Evaluation
To develop a unified empirical model for the prediction of global attenuation, real weather data from meteorological sites [23] have been collected for the metropolitan areas of New Delhi (India), Washington DC (USA), London (England), and Cape Town (South Africa) for the months of December 2022 to February 2023. The data set of 450 values comprised of daily meteorological records of visibility calculated for different weather conditions has been utilized for analysis. First, visibility data for each day has been collected for fog, haze, and cloud weather conditions, and the average value of visibility for three months has been calculated.
Next, the average attenuation of each region has been analyzed as a result of different climatic conditions. The average visibility for three months and the corresponding attenuation calculated by employing Kim’s model for New Delhi region is tabulated in Table 1.

Table 1.
Visibility and attenuation: New Delhi region.
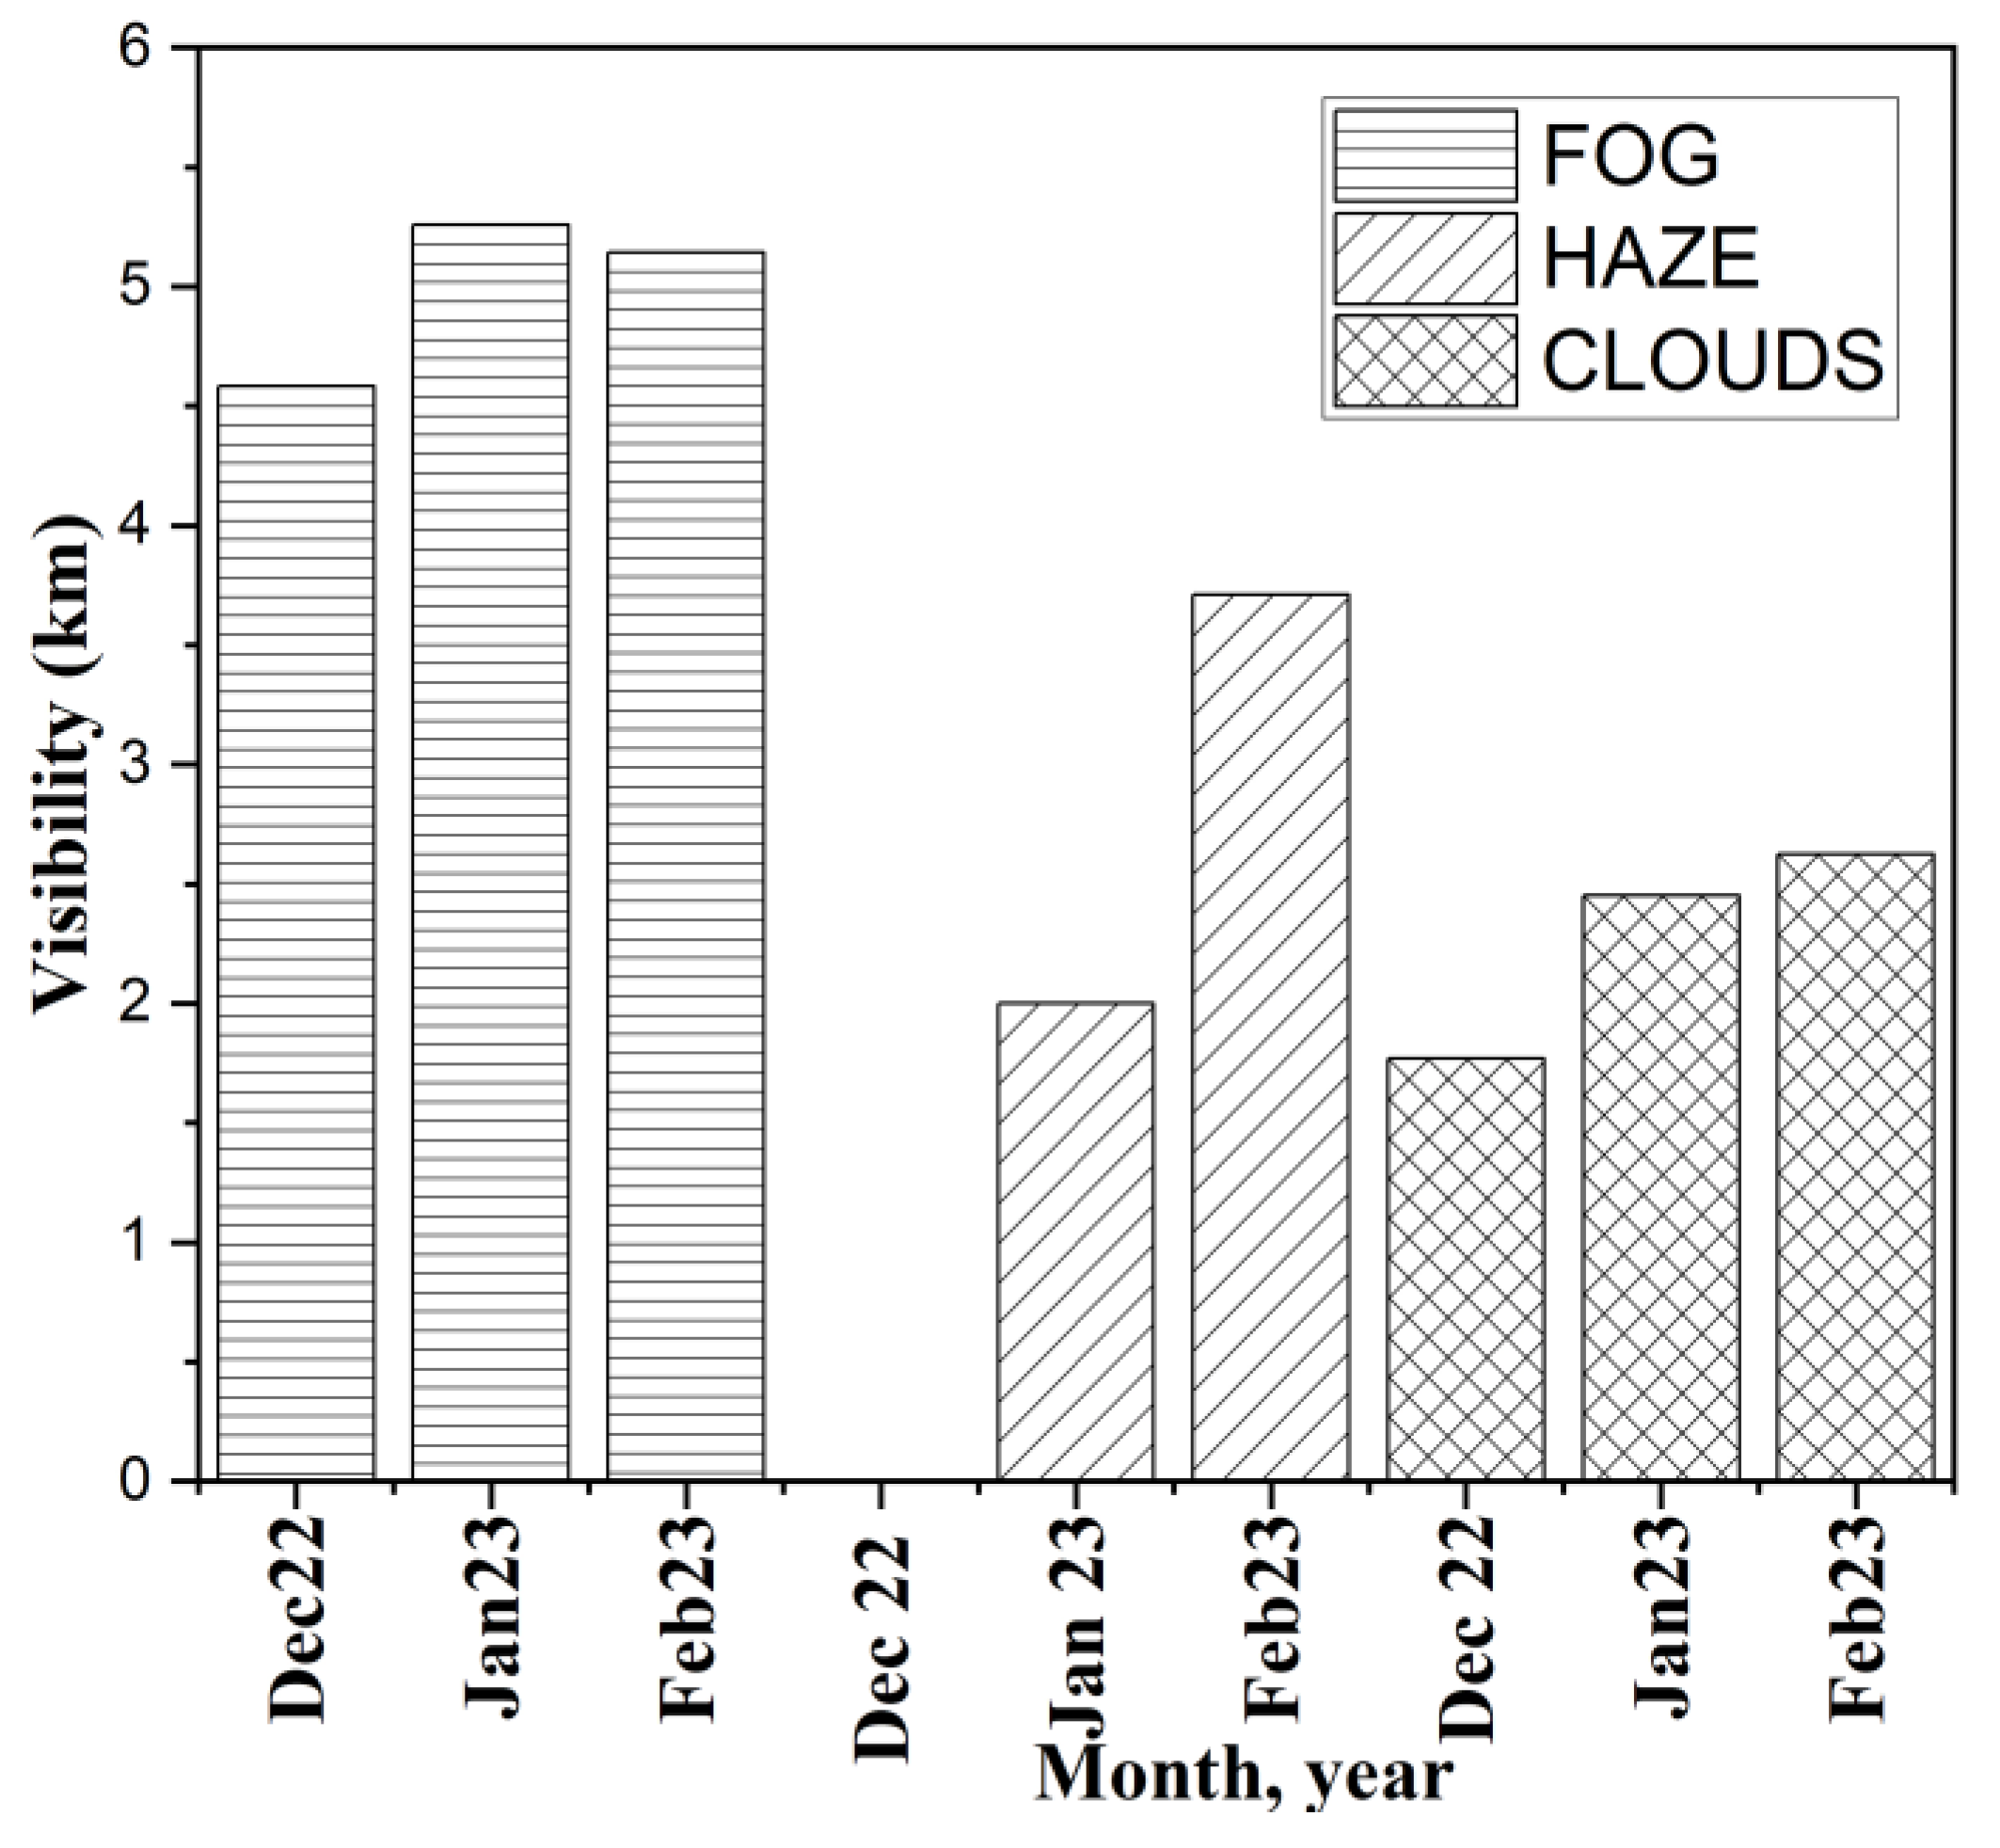
Figure 1 shows the plot of the average visibility for different months considering three weather conditions in the New Delhi region. The region has maximum and minimum visibilities of 5.25 km and 1.77 km in the months of January 2023 and December 2022 attributed to fog and cloud weather conditions, respectively.
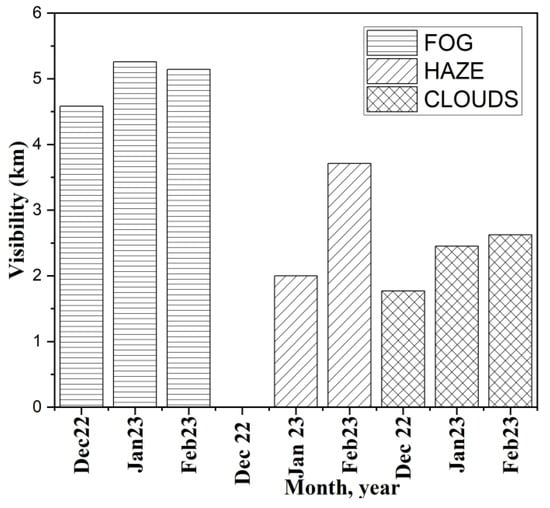
Figure 1.
Visibility: New Delhi region.
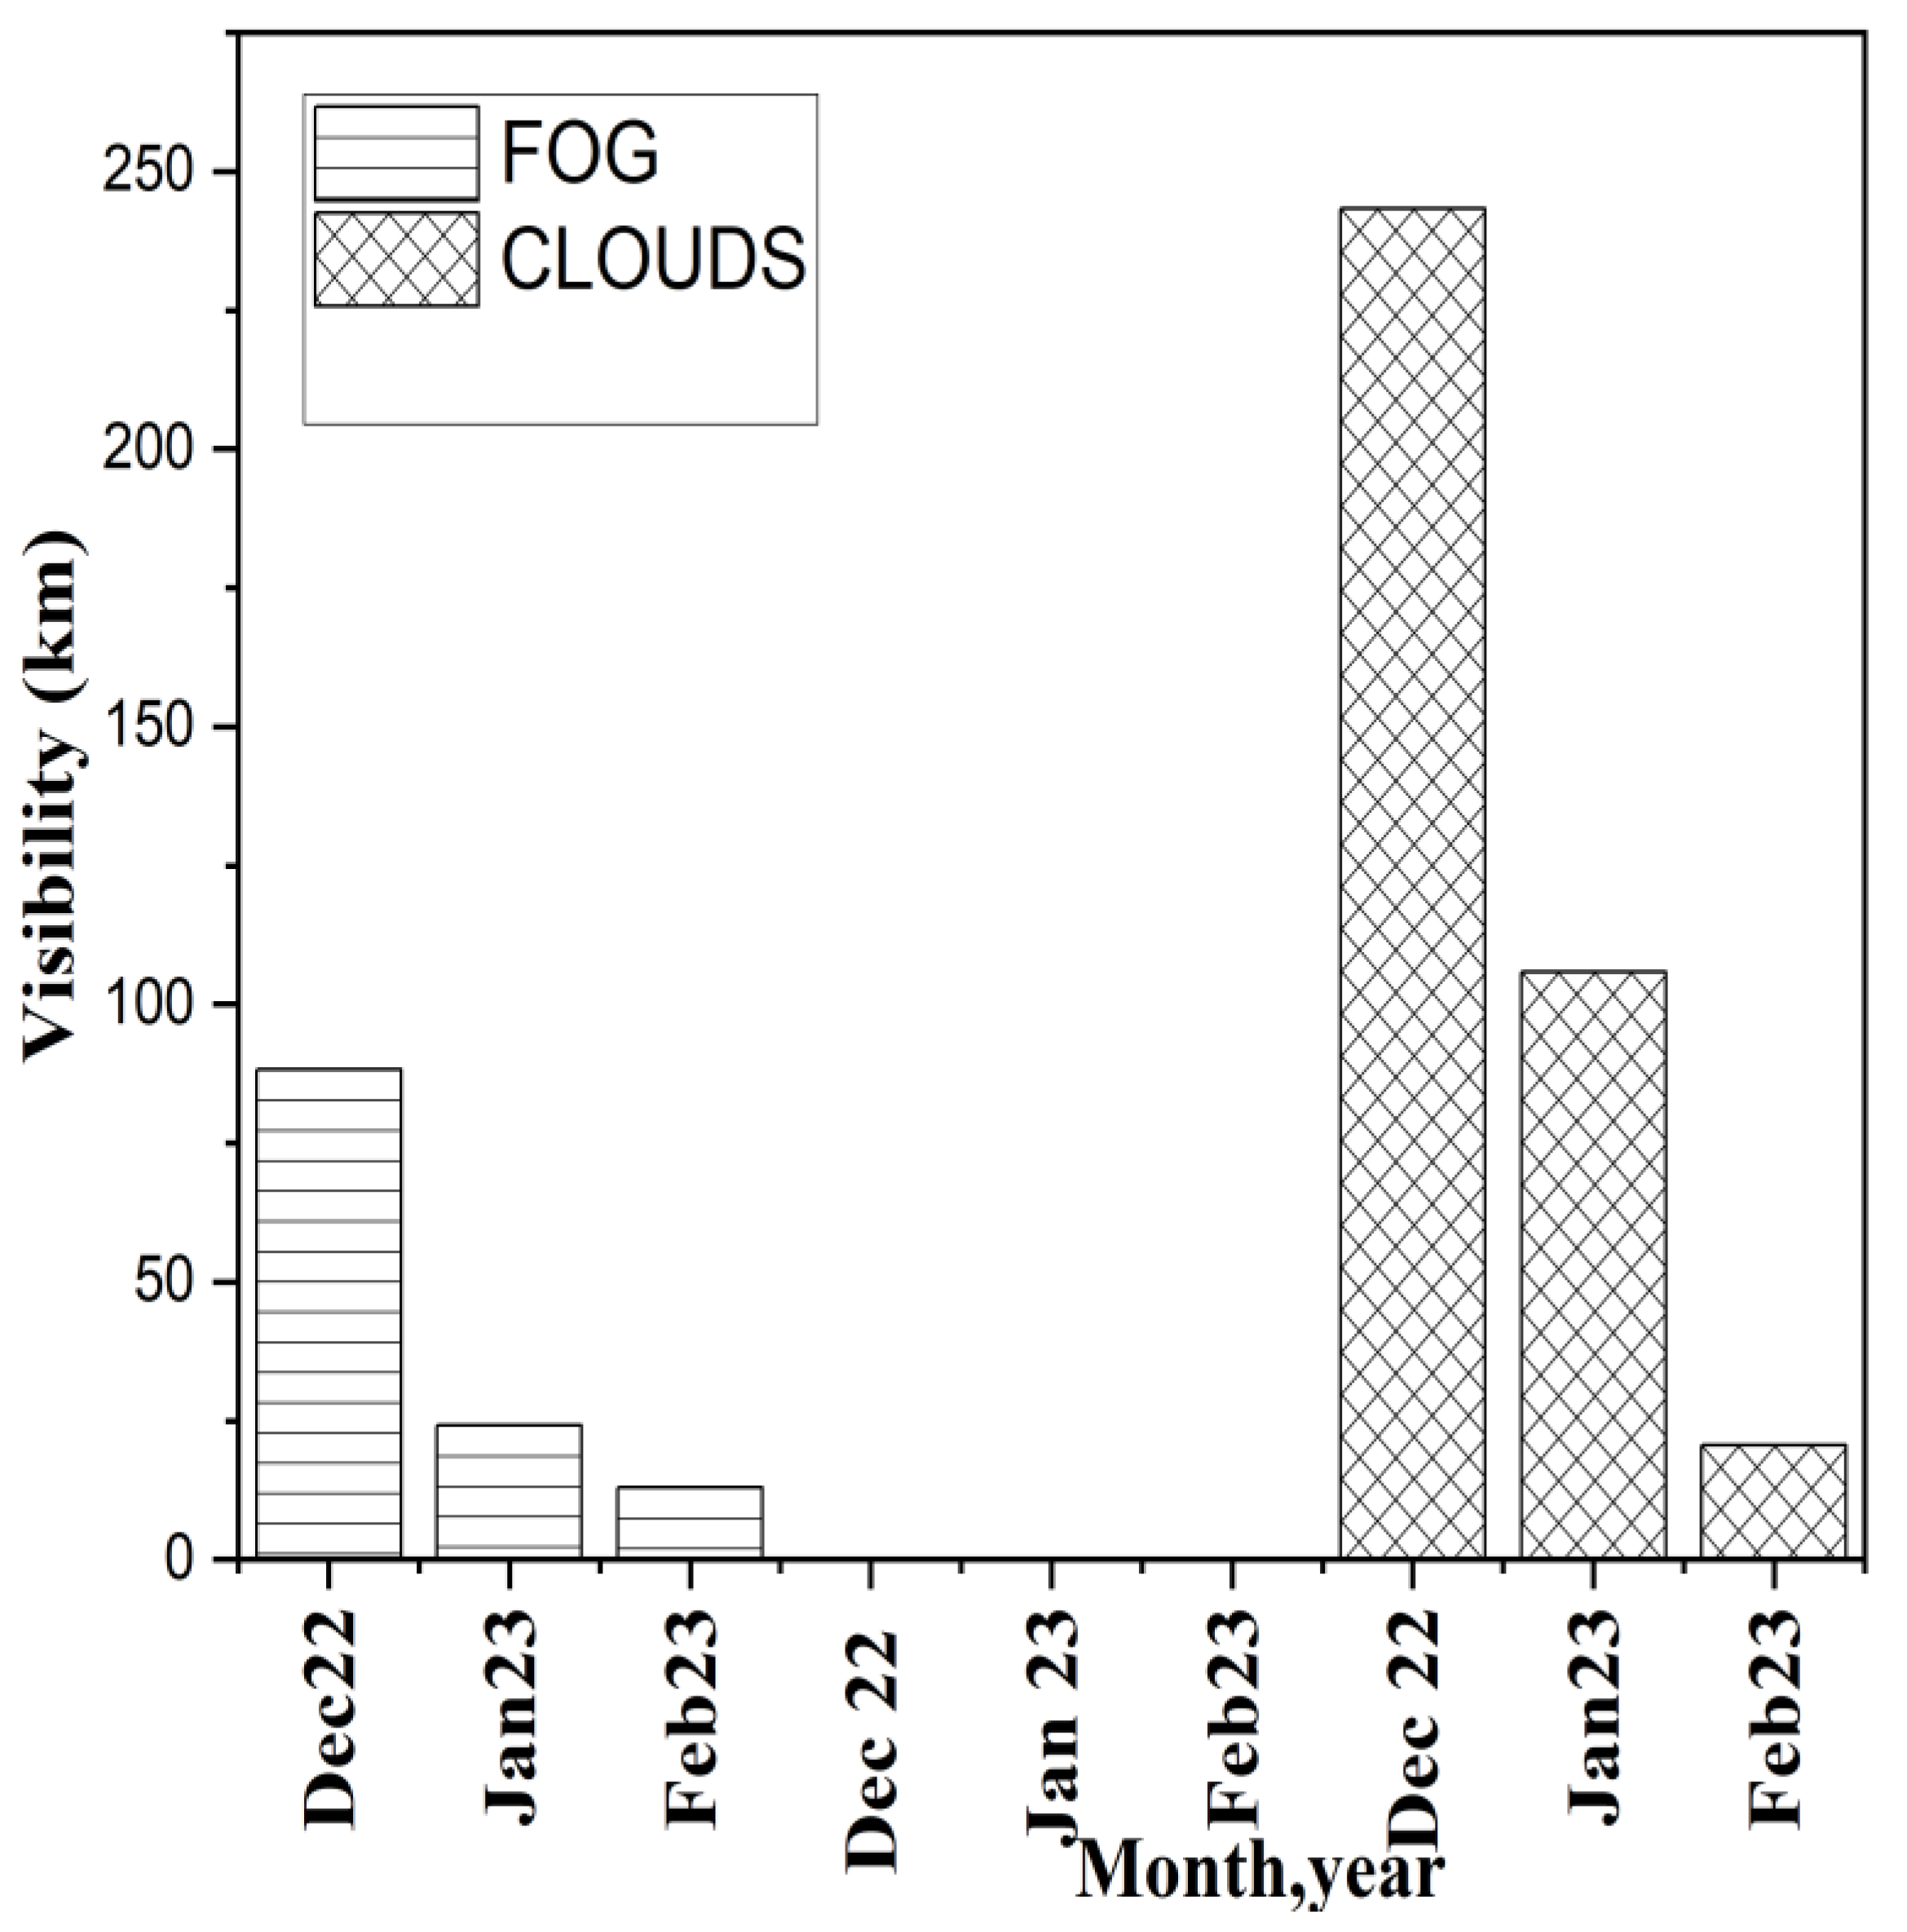
Table 2 depicts the average visibility and resultant attenuation for three months in the case of the Washington region. It records a minimum visibility and maximum attenuation of 13 km and 0.680 dB/km, respectively, in the month of February 2023 as a result of the fog weather condition. Figure 2 illustrates that an acceptable visibility and reduced attenuation is observed in the region in the case of cloud weather conditions.
Table 2.
Visibility and attenuation: Washington region.

Figure 2.
Visibility: Washington region.
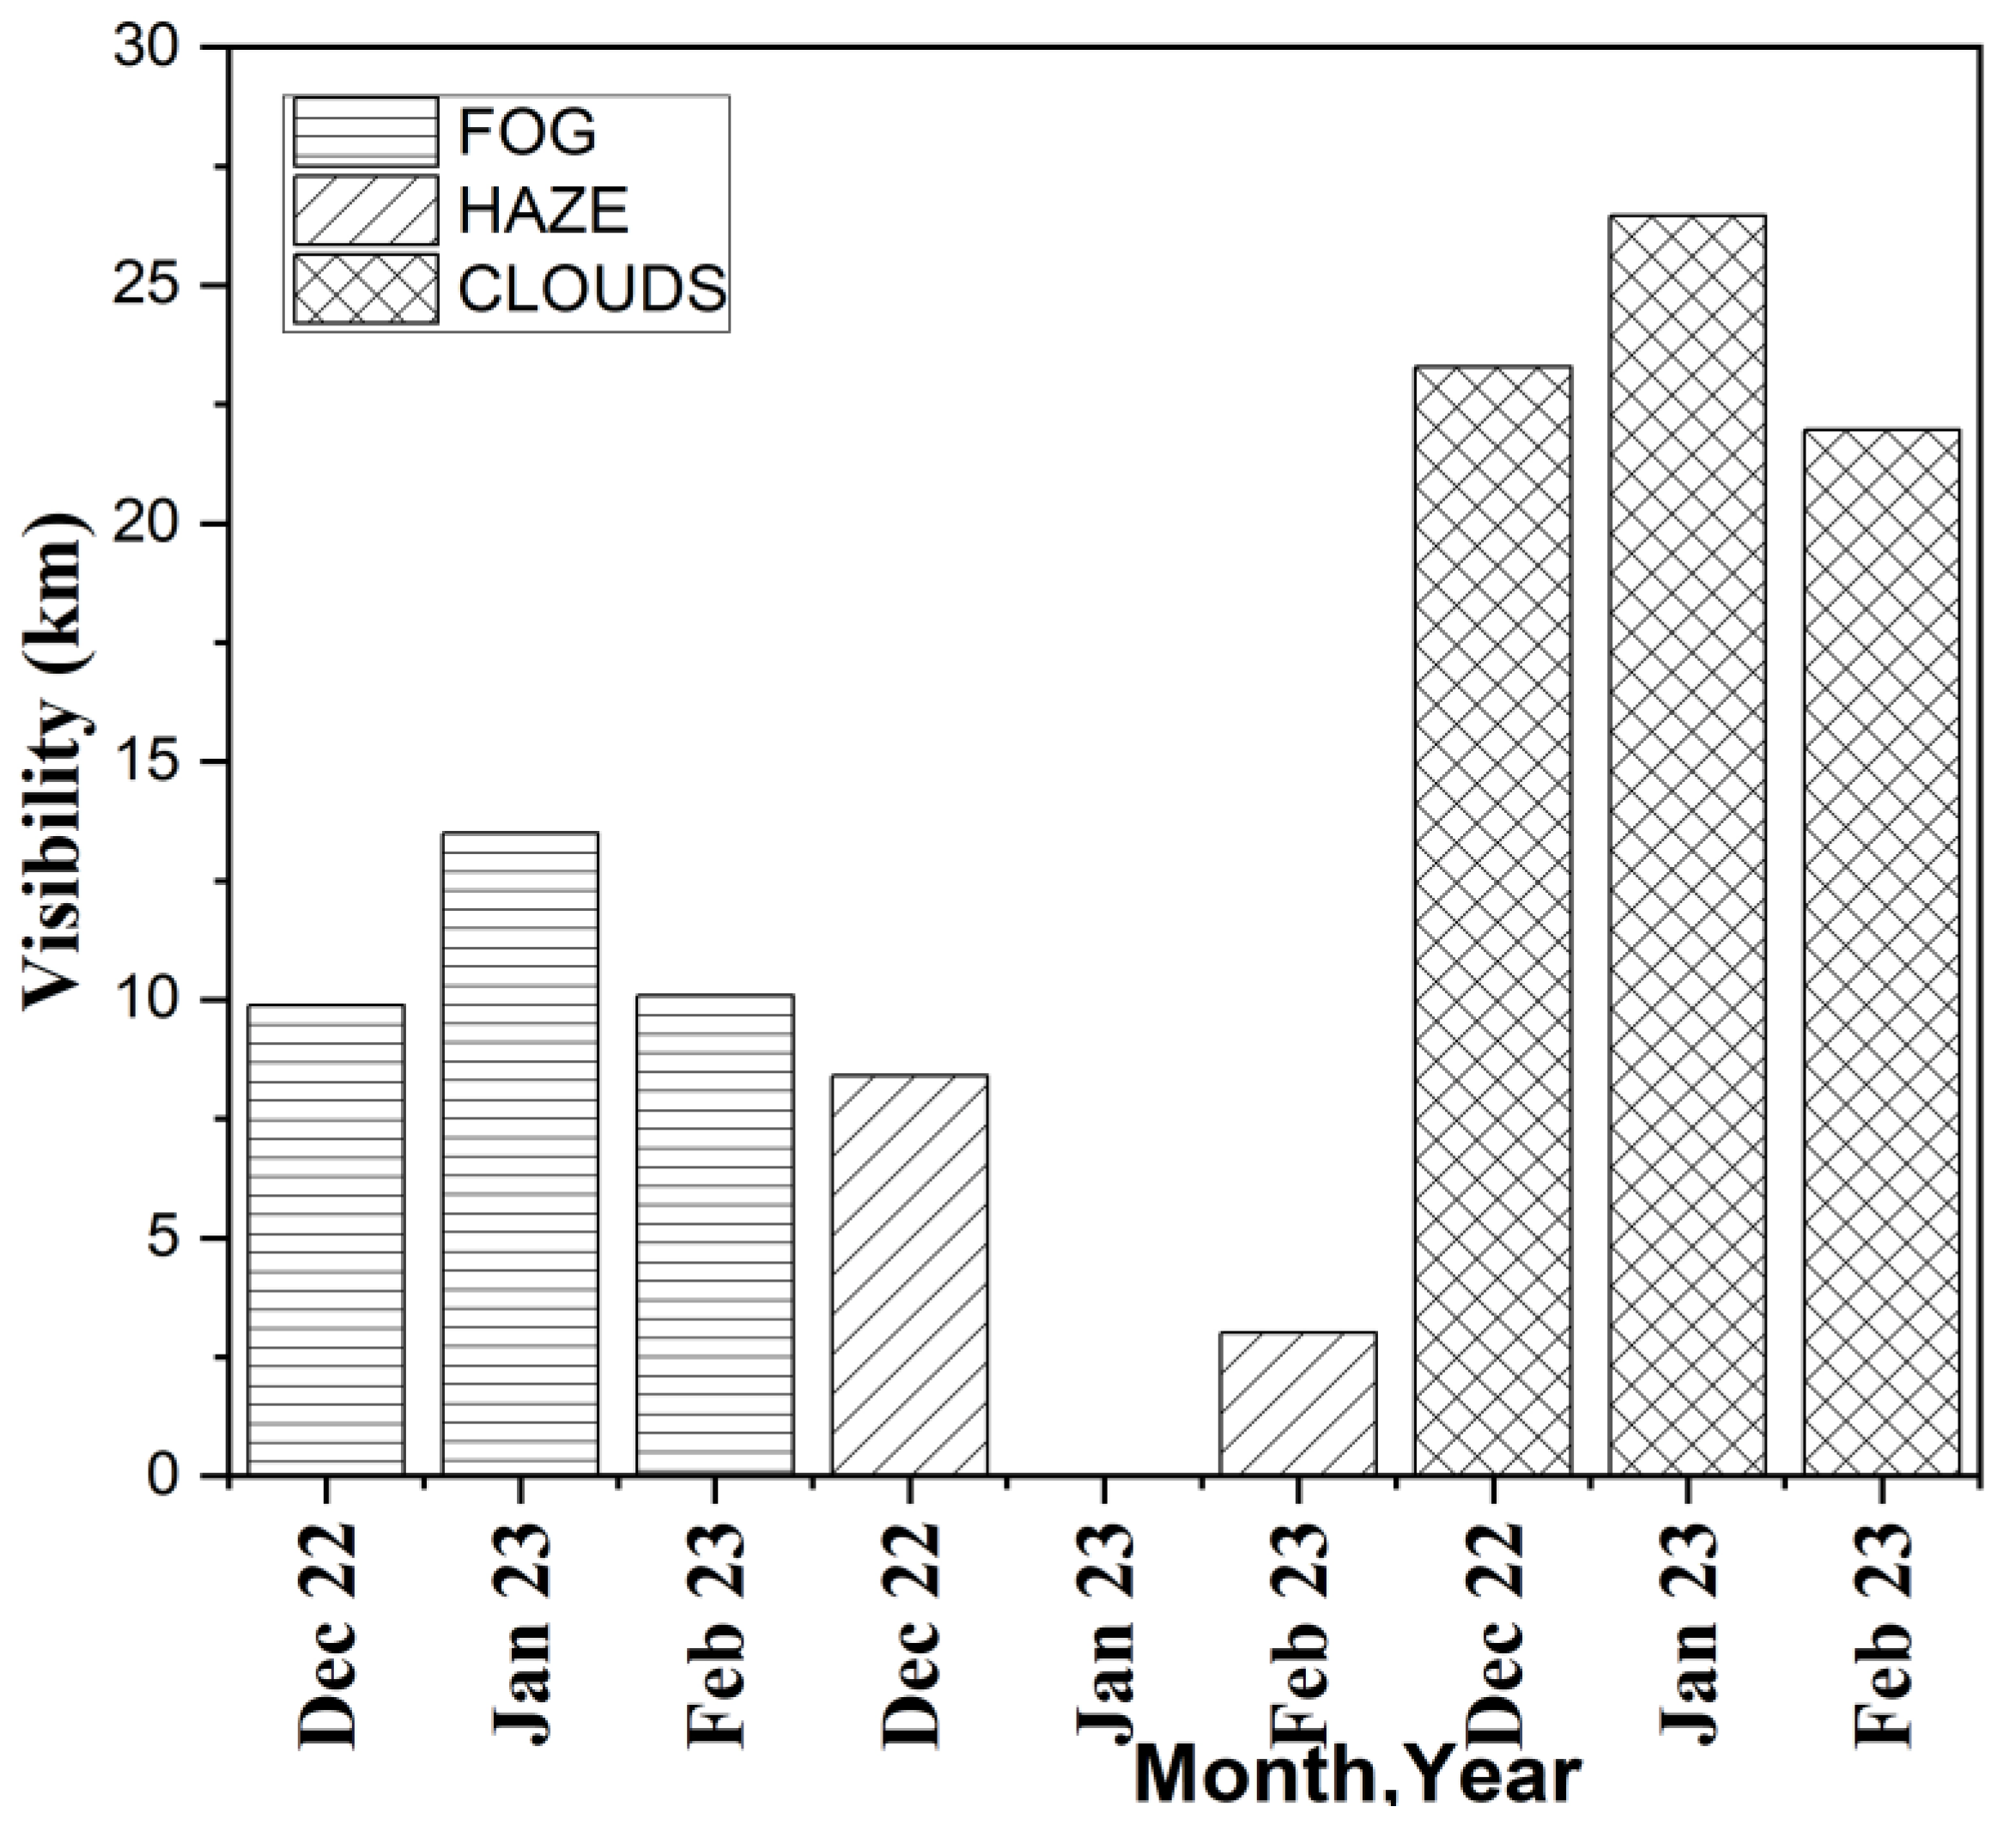
Table 3 and Figure 3 depict the observed visibility and average attenuation of the London region for the three months. It has been observed from Table 3 that the London region witnesses a minimum and maximum attenuation of 0.334 dB/km and 4.843 dB/km due to clouds and haze in the months of January 2023 and February 2023, respectively.
Table 3.
Visibility and attenuation: London region.
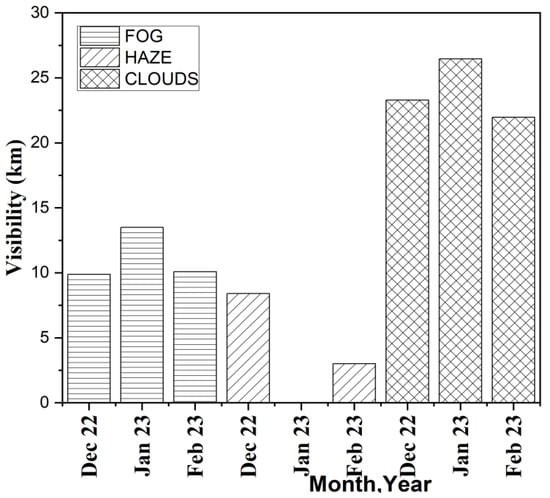
Figure 3.
Visibility: London region.
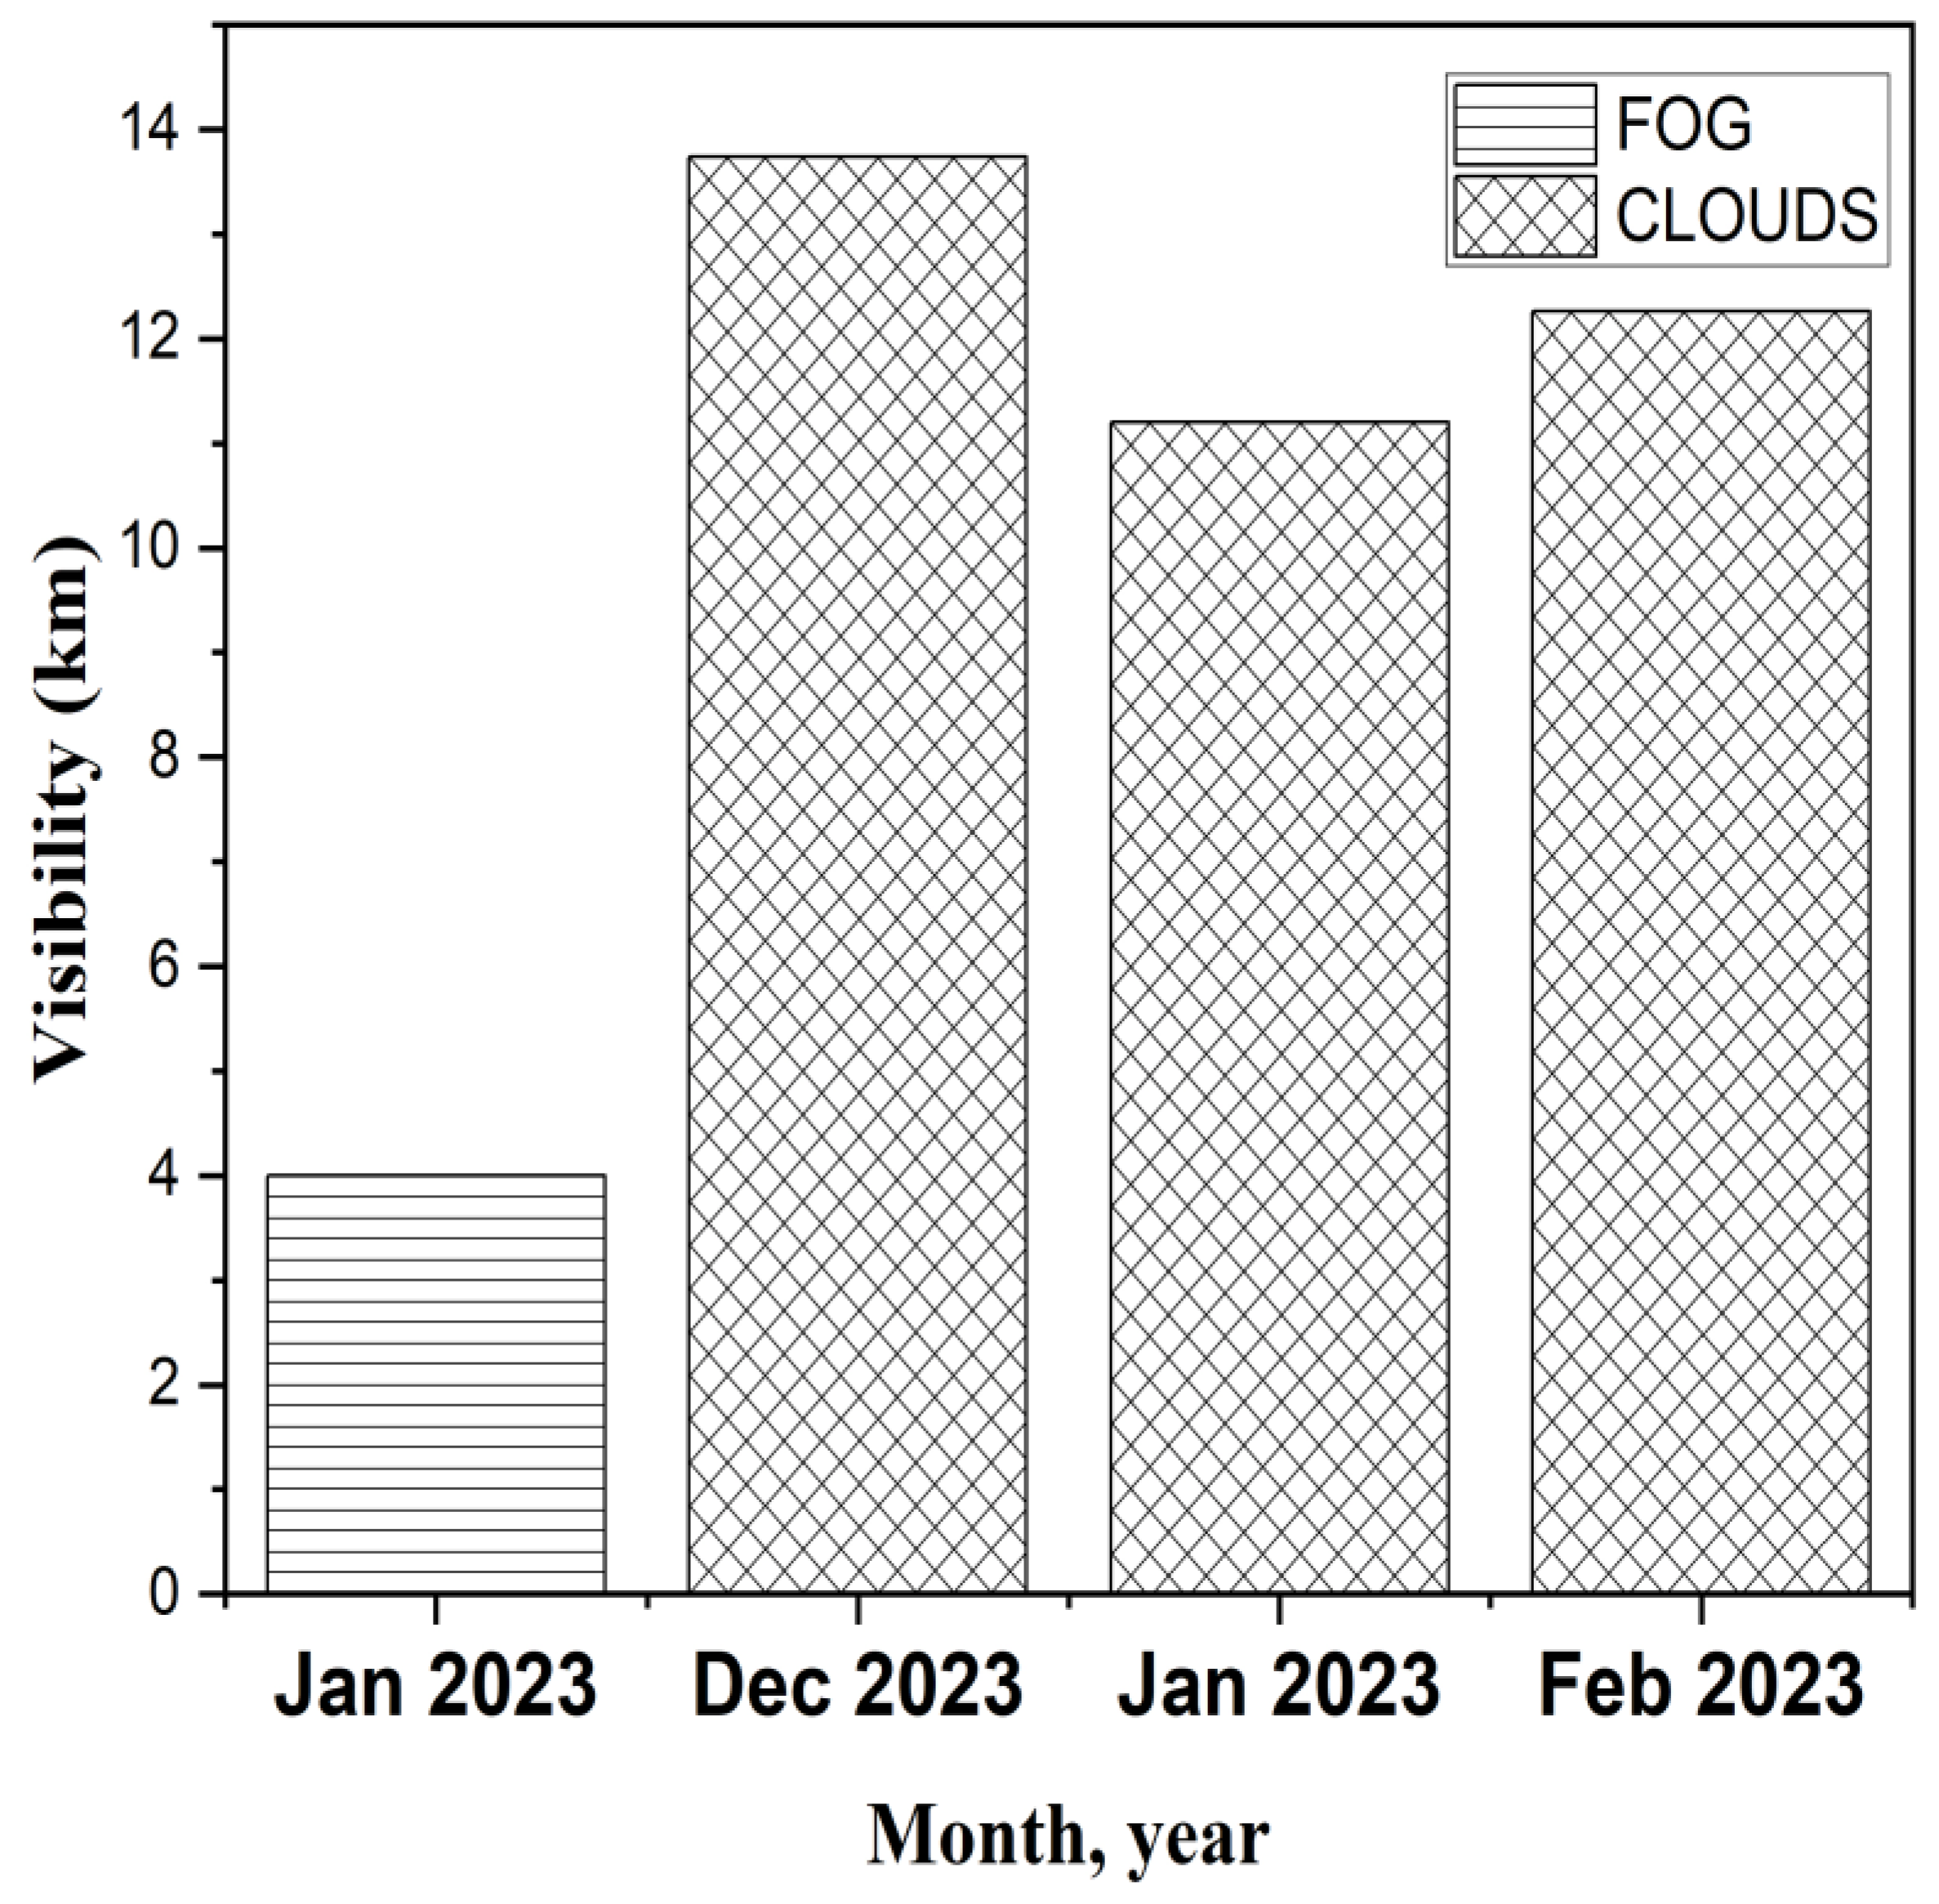
Figure 4 and Table 4 present the values of visibility and attenuation for the three months in the case of the Cape Town region. The maximum and minimum visibility has been observed in the case of cloud and fog weather conditions with corresponding attenuations of 0.643 and 3.077 dB/km, respectively.
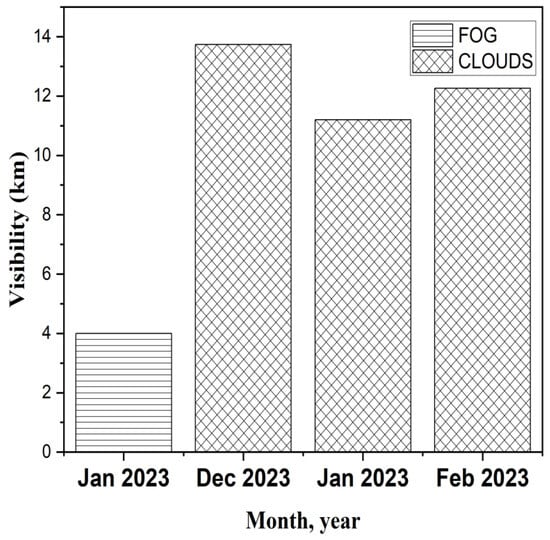
Figure 4.
Visibility: Cape Town region.
Table 4.
Attenuation and visibility: Cape Town region.
4. Proposed System Design
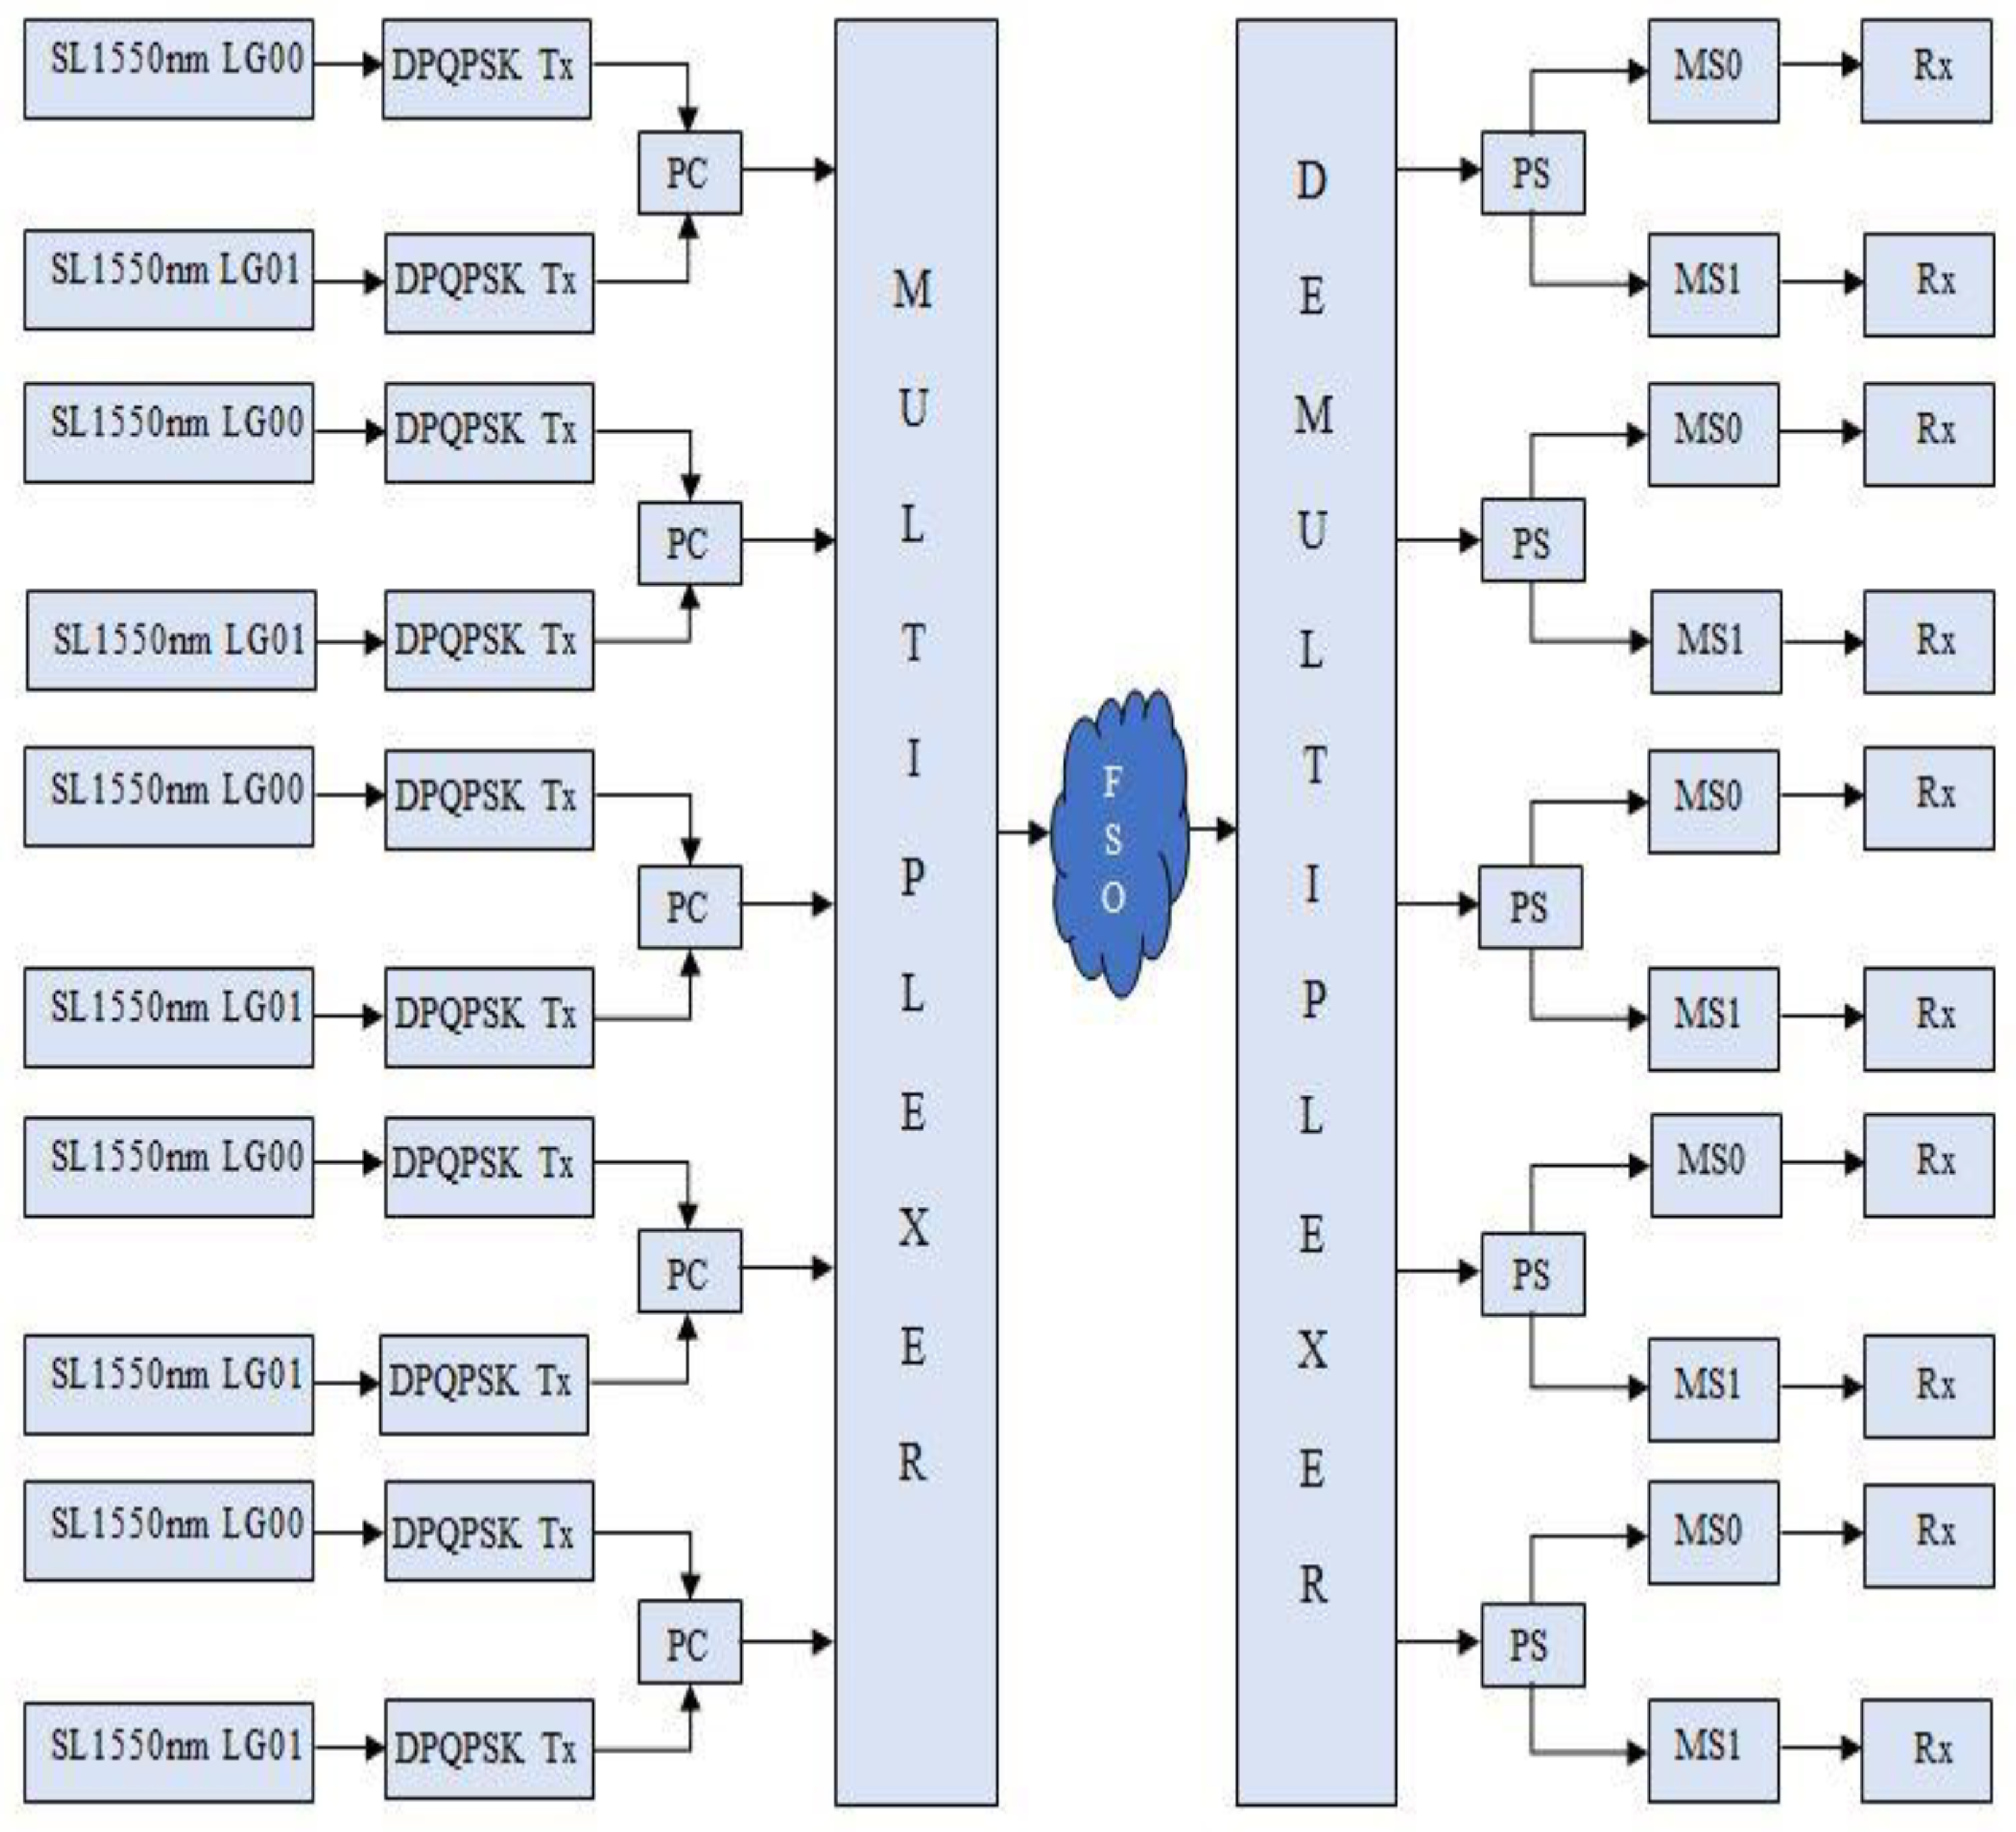
A schematic of the 10-channel (Ch) DP-QPSK-based FSO link with hybrid MDM-WDM multiplexing is shown in Figure 5. Ten spatial lasers (SL) have been employed, generating LG00 or LG 01 mode with an input power of 0 dBm at wavelengths of 1550, 1551, 1552, 1553, and 1554 nm. The transverse spatial profile of LG mode in the source plane, z = 0, is described as [24]:
where r = (x2 + y2))1/2 is the radius of the curvature, w is the beamwidth of fundamental Gaussian mode, θ = tan − 1(y/x), is the associated Laguerre polynomial, and n and m represent azimuthal and radial mode numbers.
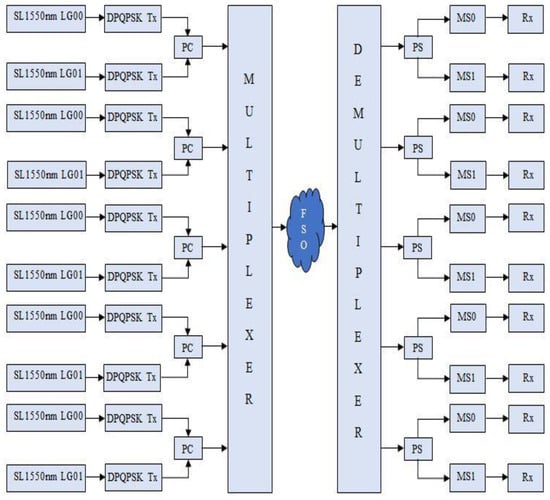
Figure 5.
Schematic diagram of the DP-QPSK-based FSO link with hybrid MDM-WDM multiplexing.
The SL outputs are fed to DP-QPSK transmitters, and power combiners (PCs) combine the output of two different modes at the same wavelength. Power combiner outputs representing 10 transmission channels have been multiplexed, and the resultant signal propagates through the FSO link impaired with fog, haze, or cloud weather conditions. A 1 × 5 demultiplexer at the receiving end splits the different channels, and power splitters (PSs) direct the corresponding channels to the mode selector (MS) switches to select LG00 or LG01 mode at the receiver.
The detailed schematics of the DP-QPSK transmitter and receiver are shown in Figure 6 and Figure 7, respectively. The light emitted by the laser splits into two components for horizontal polarization and two components for vertical polarization. Each light beam is modulated by Mach–Zehnder modulator (MZM), which converts the data into a sequence of light pulses. Within each polarization, the П/2 phase shifter is used to generate the quadrature component. The polarization rotator (PR) rotates the incoming signal with respect to another, and the resultant signals are combined by the beam combiner (BC) to generate the 100 Gbps DP-QPSK signal, as shown in Figure 6.
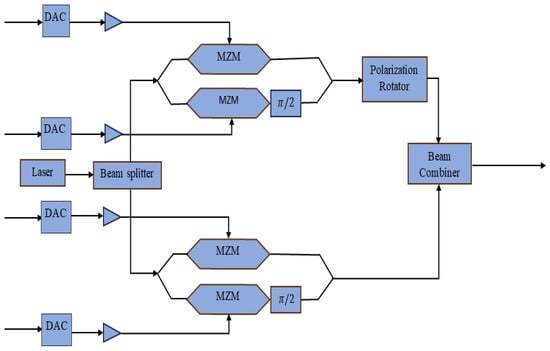
Figure 6.
Schematic diagram of DPQPSK transmitter.
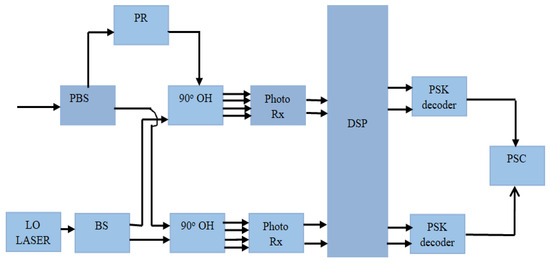
Figure 7.
Schematic diagram of DP-QPSK receiver.
The DP-QPSK signal may be described by using Jacobi–Anger expansion as [25]:
where E(t) = Ecexp(jwct) represents the continuous wave laser output signal with Ec and wm representing the amplitude of light beam and the angular frequency, respectively. mx = πVmx/2Vx and my = πVmx/2Vy represent the modulation indexes of MZMx and MZMy, respectively. Vax = πVbiasX1/Vπ, Vbx = πVbiasX2/Vπ, Vcx= πVbiasX3/Vπ, Vay= πVbiasy1/Vπ, Vby = πVbiasy2 /Vπ, and Vcy = πVbiasy3 /Vπ represent the rf amplitudes of MZMx and MZMy, respectively.
The power received at the receiver side is given as [21]:
where dT and dR are aperture diameters of transmitting and receiving antenna, respectively. θ, R, and a represent the beam divergence, propagation range, and attenuation coefficient, respectively.
Local oscillator (LO) and polarization beam splitter (PBS) are deployed for coherent detection that improves the signal to noise ratio. PBS splits the received signal into two orthogonally polarized beams for coherent detection. Both I and Q signals have been passed through a 90° optical hybrid (OH) followed by an array of photo diodes to detect the information signal. The DSP module has been employed to overcome the channel distortion and compensation of carrier phase noise. Parallel to the serial converter (PSC) gives the resultant demodulated signal. After the detection and decoding of the signal, the BER test set has been employed for direct-error counting.
5. Results and Discussion
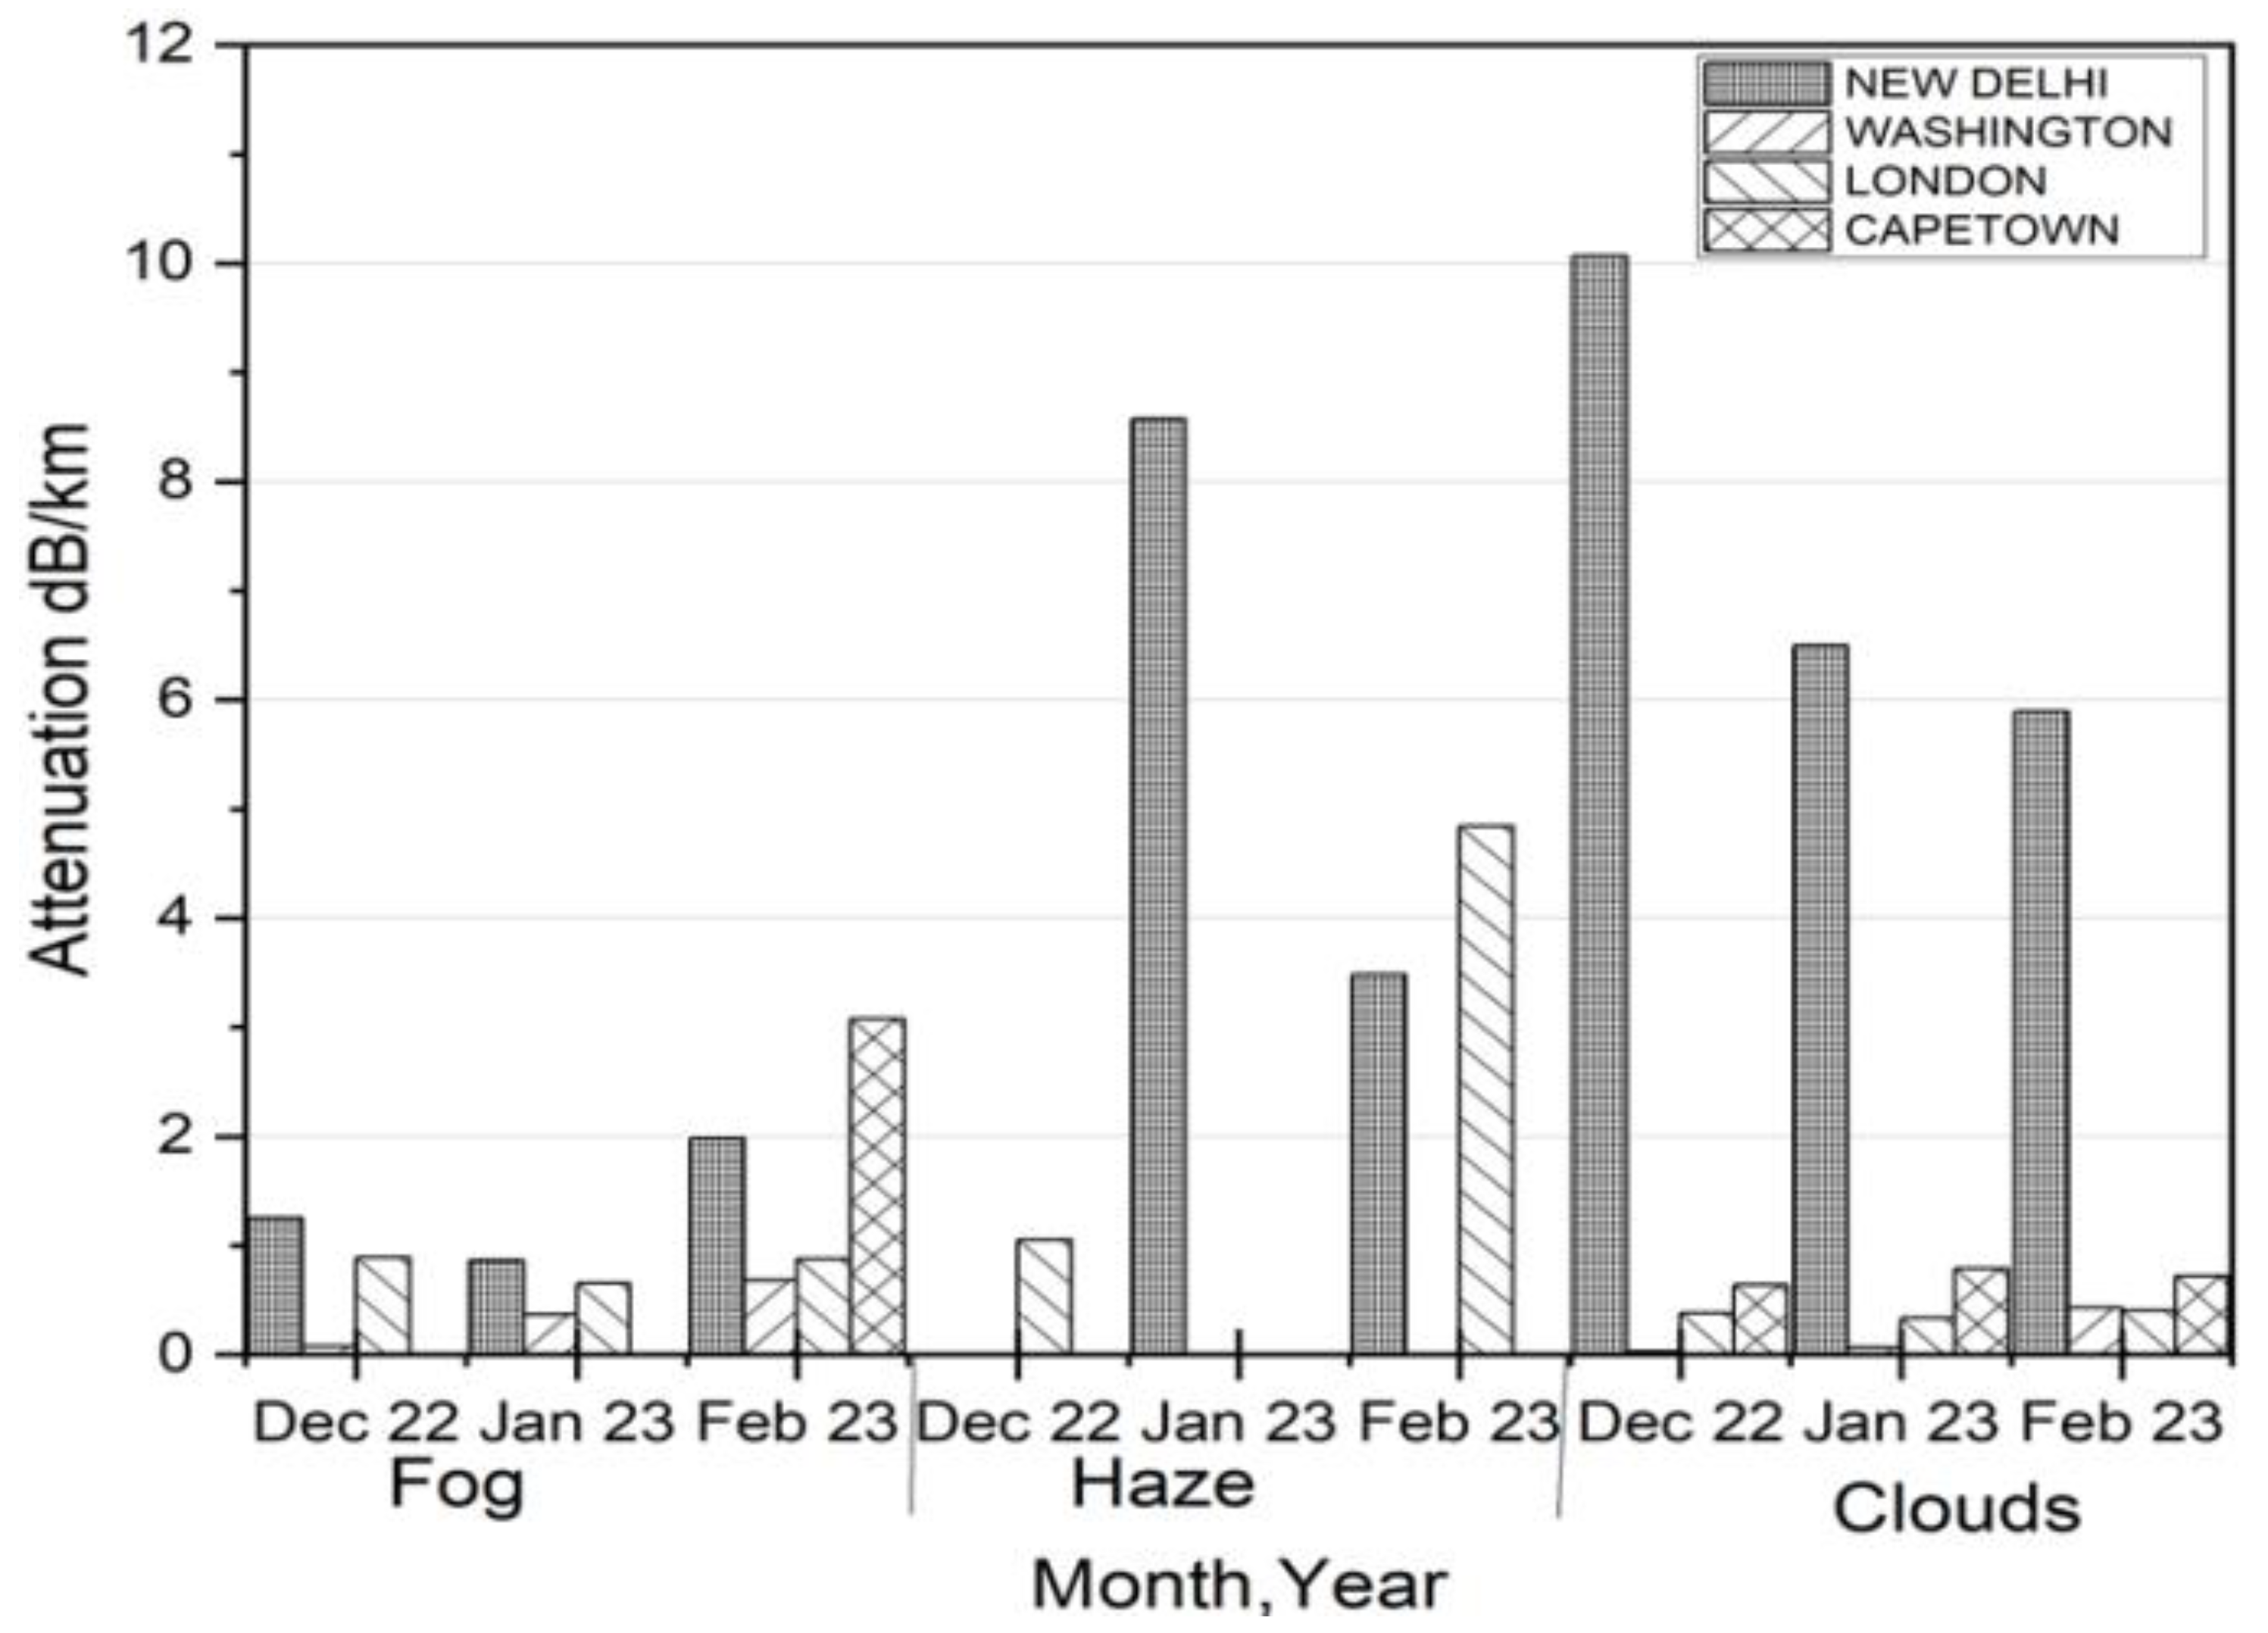
In this section, the results of the proposed MDM-WDM FSO link have been investigated by employing DP-QPSK modulation under real weather conditions. The signal to noise ratio (SNR) of the received signal has been analyzed and compared as a function of transmission range considering diverse geographical regions for different channels. Next, the received power has been obtained as a function of the propagation range for the four regions, and ML techniques have been employed for SNR estimation of the received signal. Figure 8 depicts the comparative analysis of attenuation due to different weather conditions in the four regions. It can be observed that clouds and haze cause a maximum attenuation of 10.06 and 4.84 dB/km in the case of New Delhi and London regions, respectively. Fog is the main contributing factor affecting visibility in Washington and Cape Town regions. Maximum attenuation has been reported in the New Delhi region due to cloud and haze weather conditions in December, February, and January months, respectively.

Figure 8.
Comparative analysis of attenuation of four regions in different months.
Next, a unified empirical model has been developed for the prediction of overall attenuation of a region due to different weather conditions at 1550 nm. To describe the relationship between a set of visibility values and average attenuation, a least squares method has been utilized. The performance of the model has been measured using R squared and mean square error (MSE) as performance metrics.
R squared measures the percentage of variance of the dependent variable that can be predicted based on the independent variable. It indicates the goodness of fit of the regression model and is defined as [18]:
Mean square error is the ratio of the square of difference between the predicted and mean values compared to the number of observations. MSE measures the variance of the fitted curve and is given as [18]:
Table 5 depicts the regression models for predicting attenuation (dB/km) as a function of visibility for different regions along with corresponding R squared and MSE values as performance metrics. Values of R squared fall between 0 and 1. The higher the value better fit the model. MSE is best suited for regression problems, as with large deviations, they are penalized severely by squaring errors, which raises the penalty for large errors. The maximum and minimum attenuation have been predicted for Delhi and Washington regions, respectively. In the case of the Delhi region, there is a better correlation between visibility values for the data set with different weather conditions. A moderate value of R squared prevents over-fitting of the model so that it performs better on unseen values of visibility. MSE is a measure of the quality of the estimation. Performance metrics and generalization of empirical models may be further improved by increasing the values in the data set and by incorporating more regions. The minimum mean square error and maximum coefficient of determination have been reported in the case of models developed for the Washington and Delhi regions, respectively. Table 6 and Table 7 depict the simulation parameters using the OptiSystem 20.0 software and transmission wavelengths of different channels, respectively.
Table 5.
Regression models of attenuation of different regions.
Table 6.
Simulation parameters.
Table 7.
Wavelength and mode values of different channels.
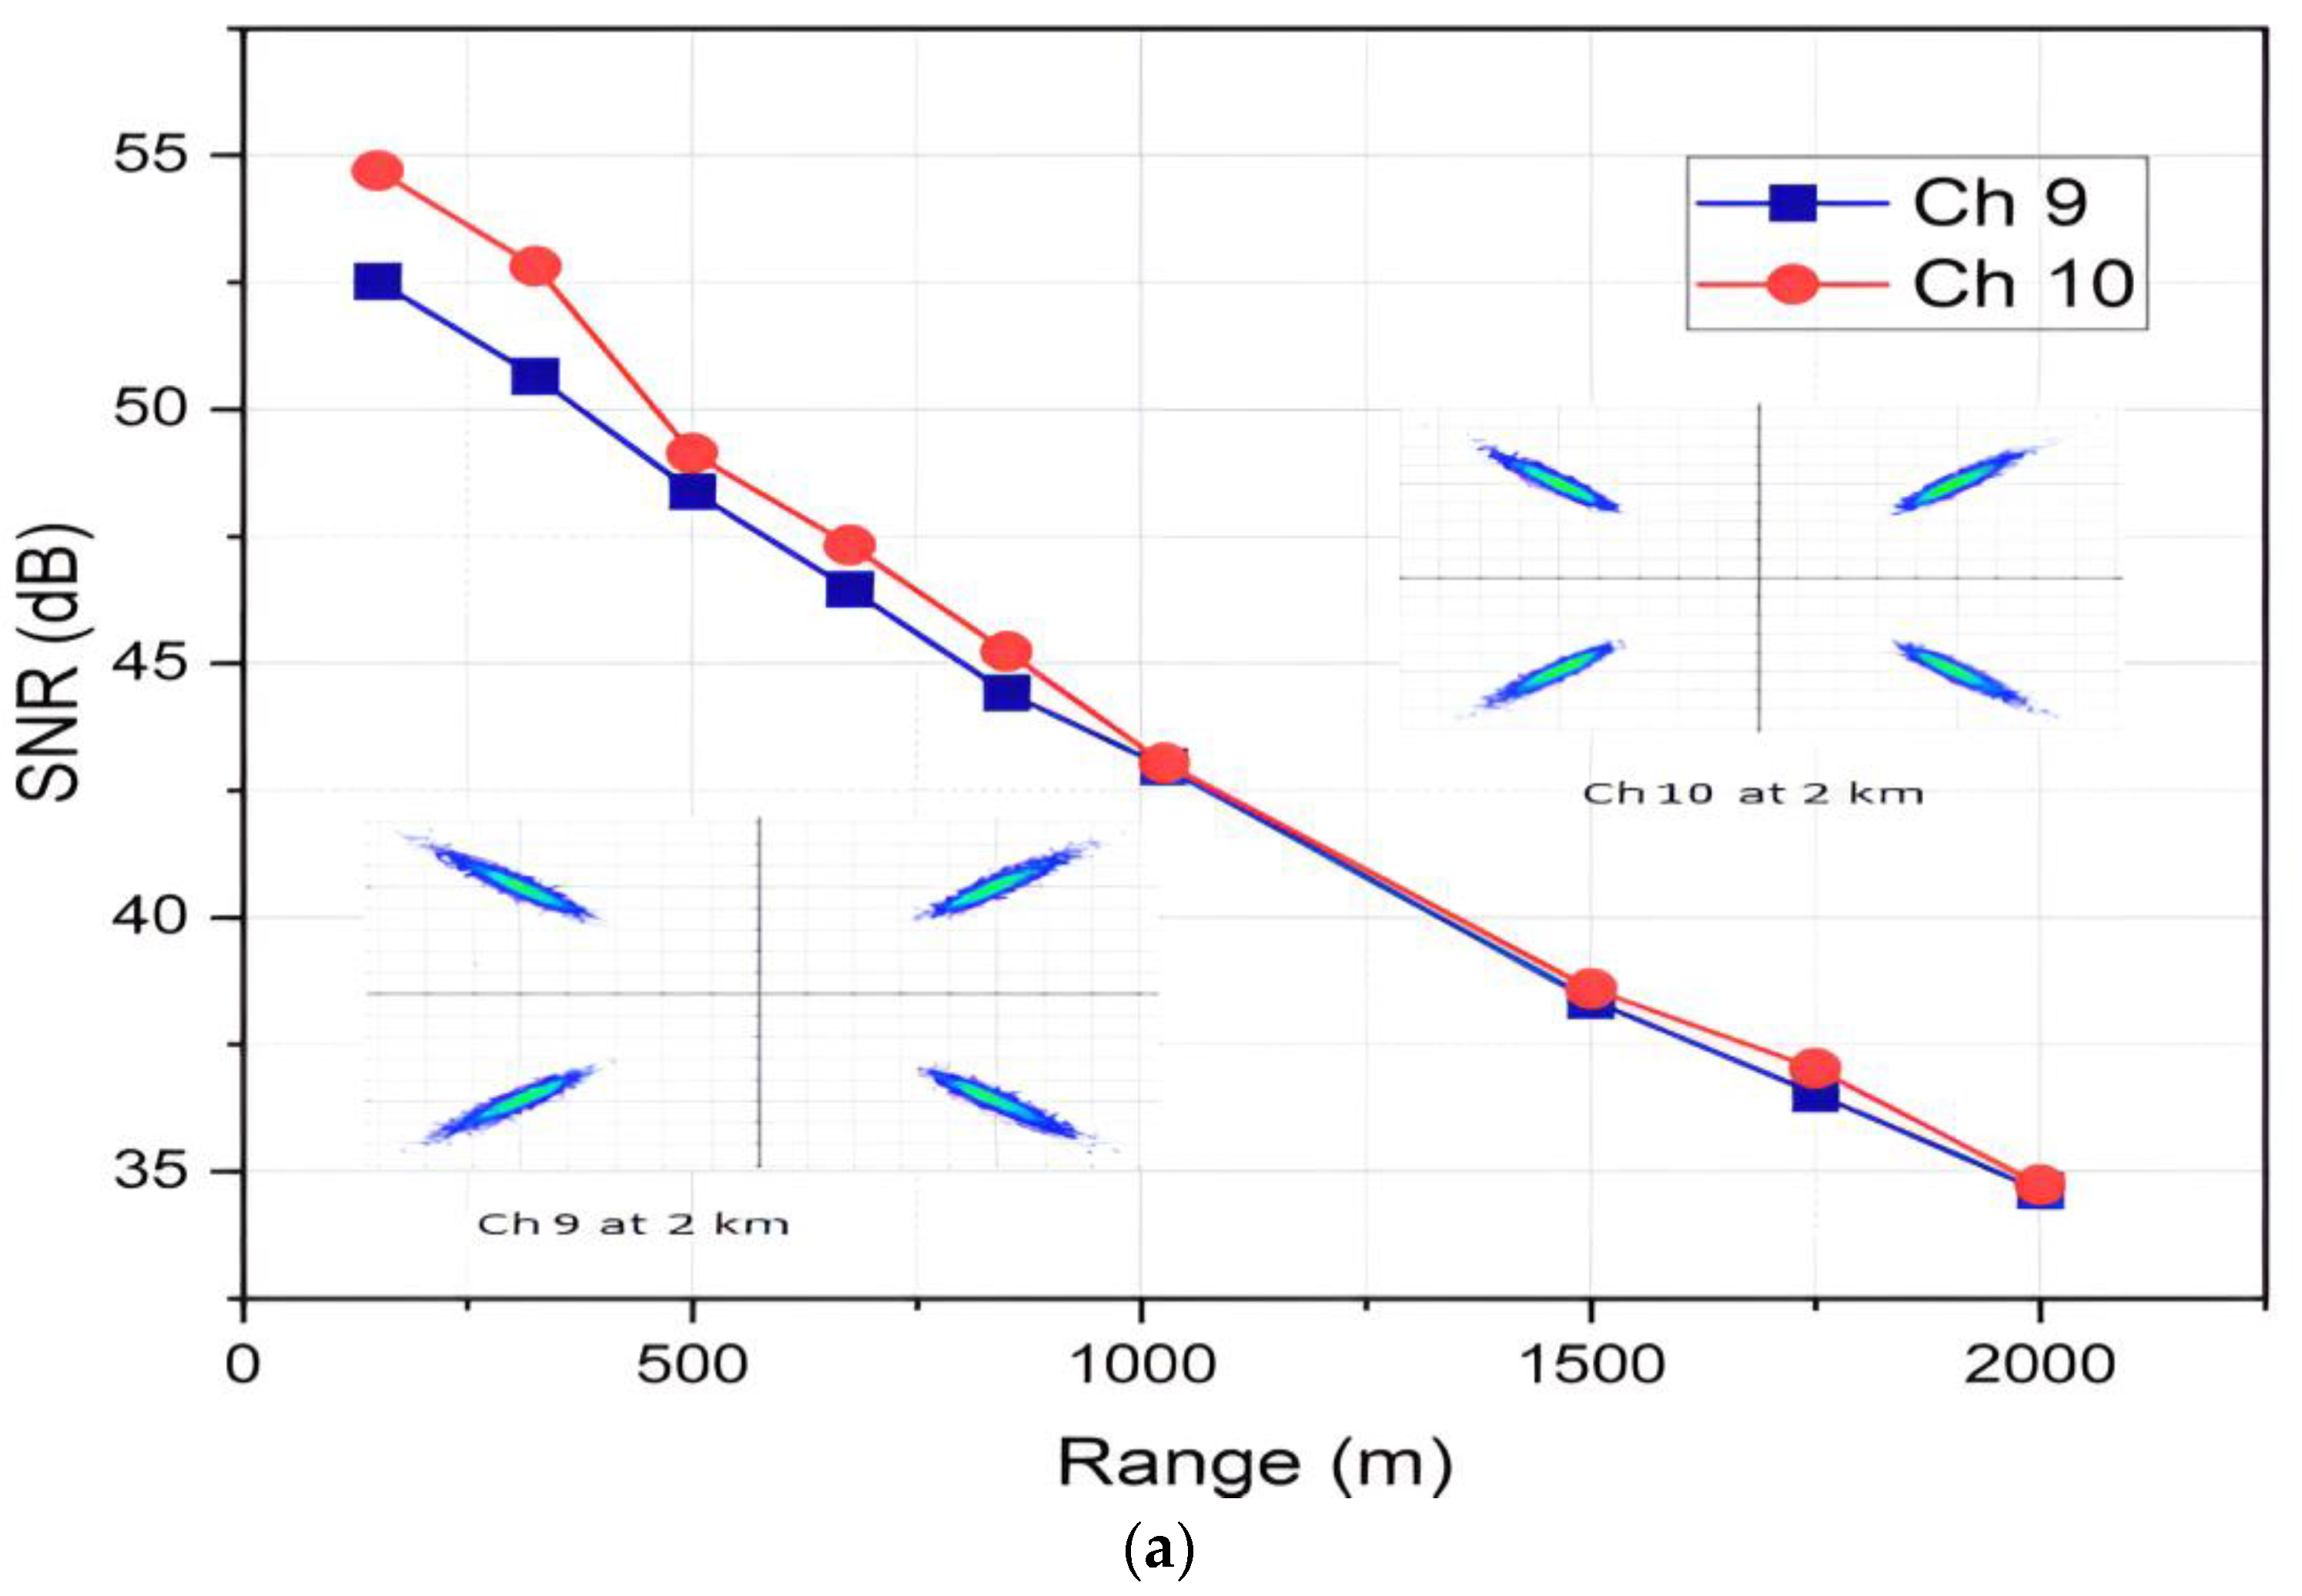
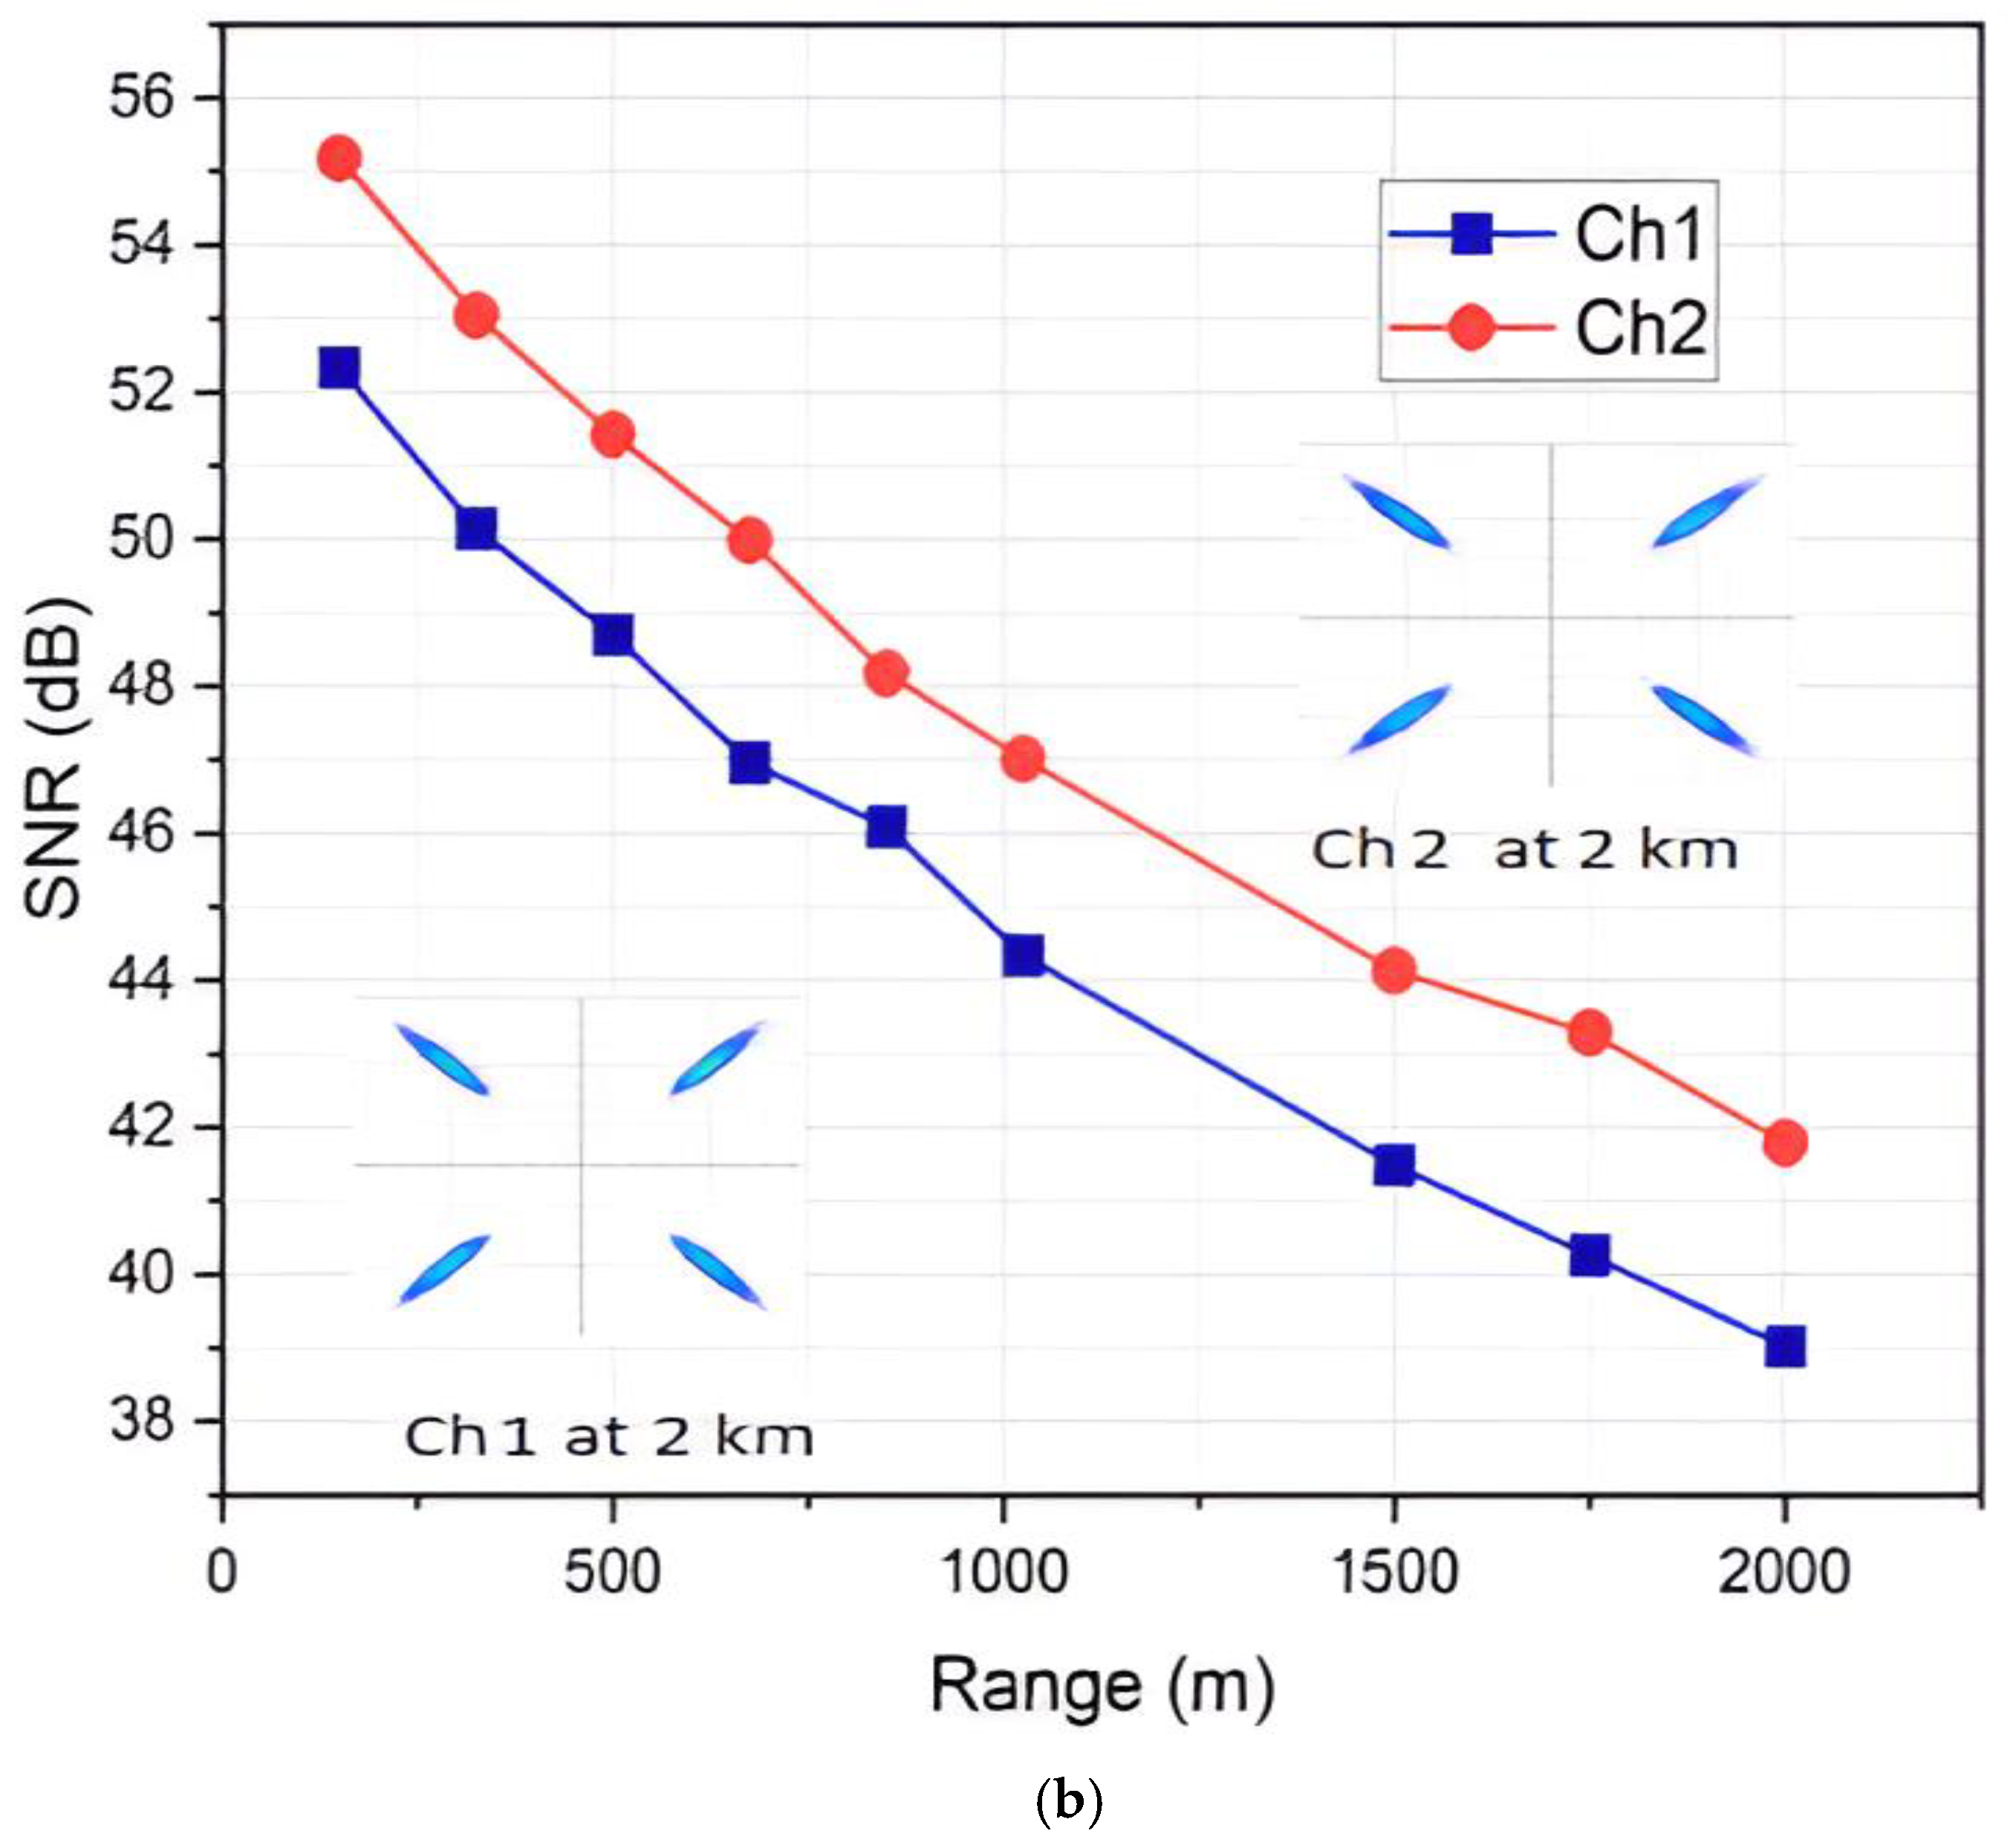
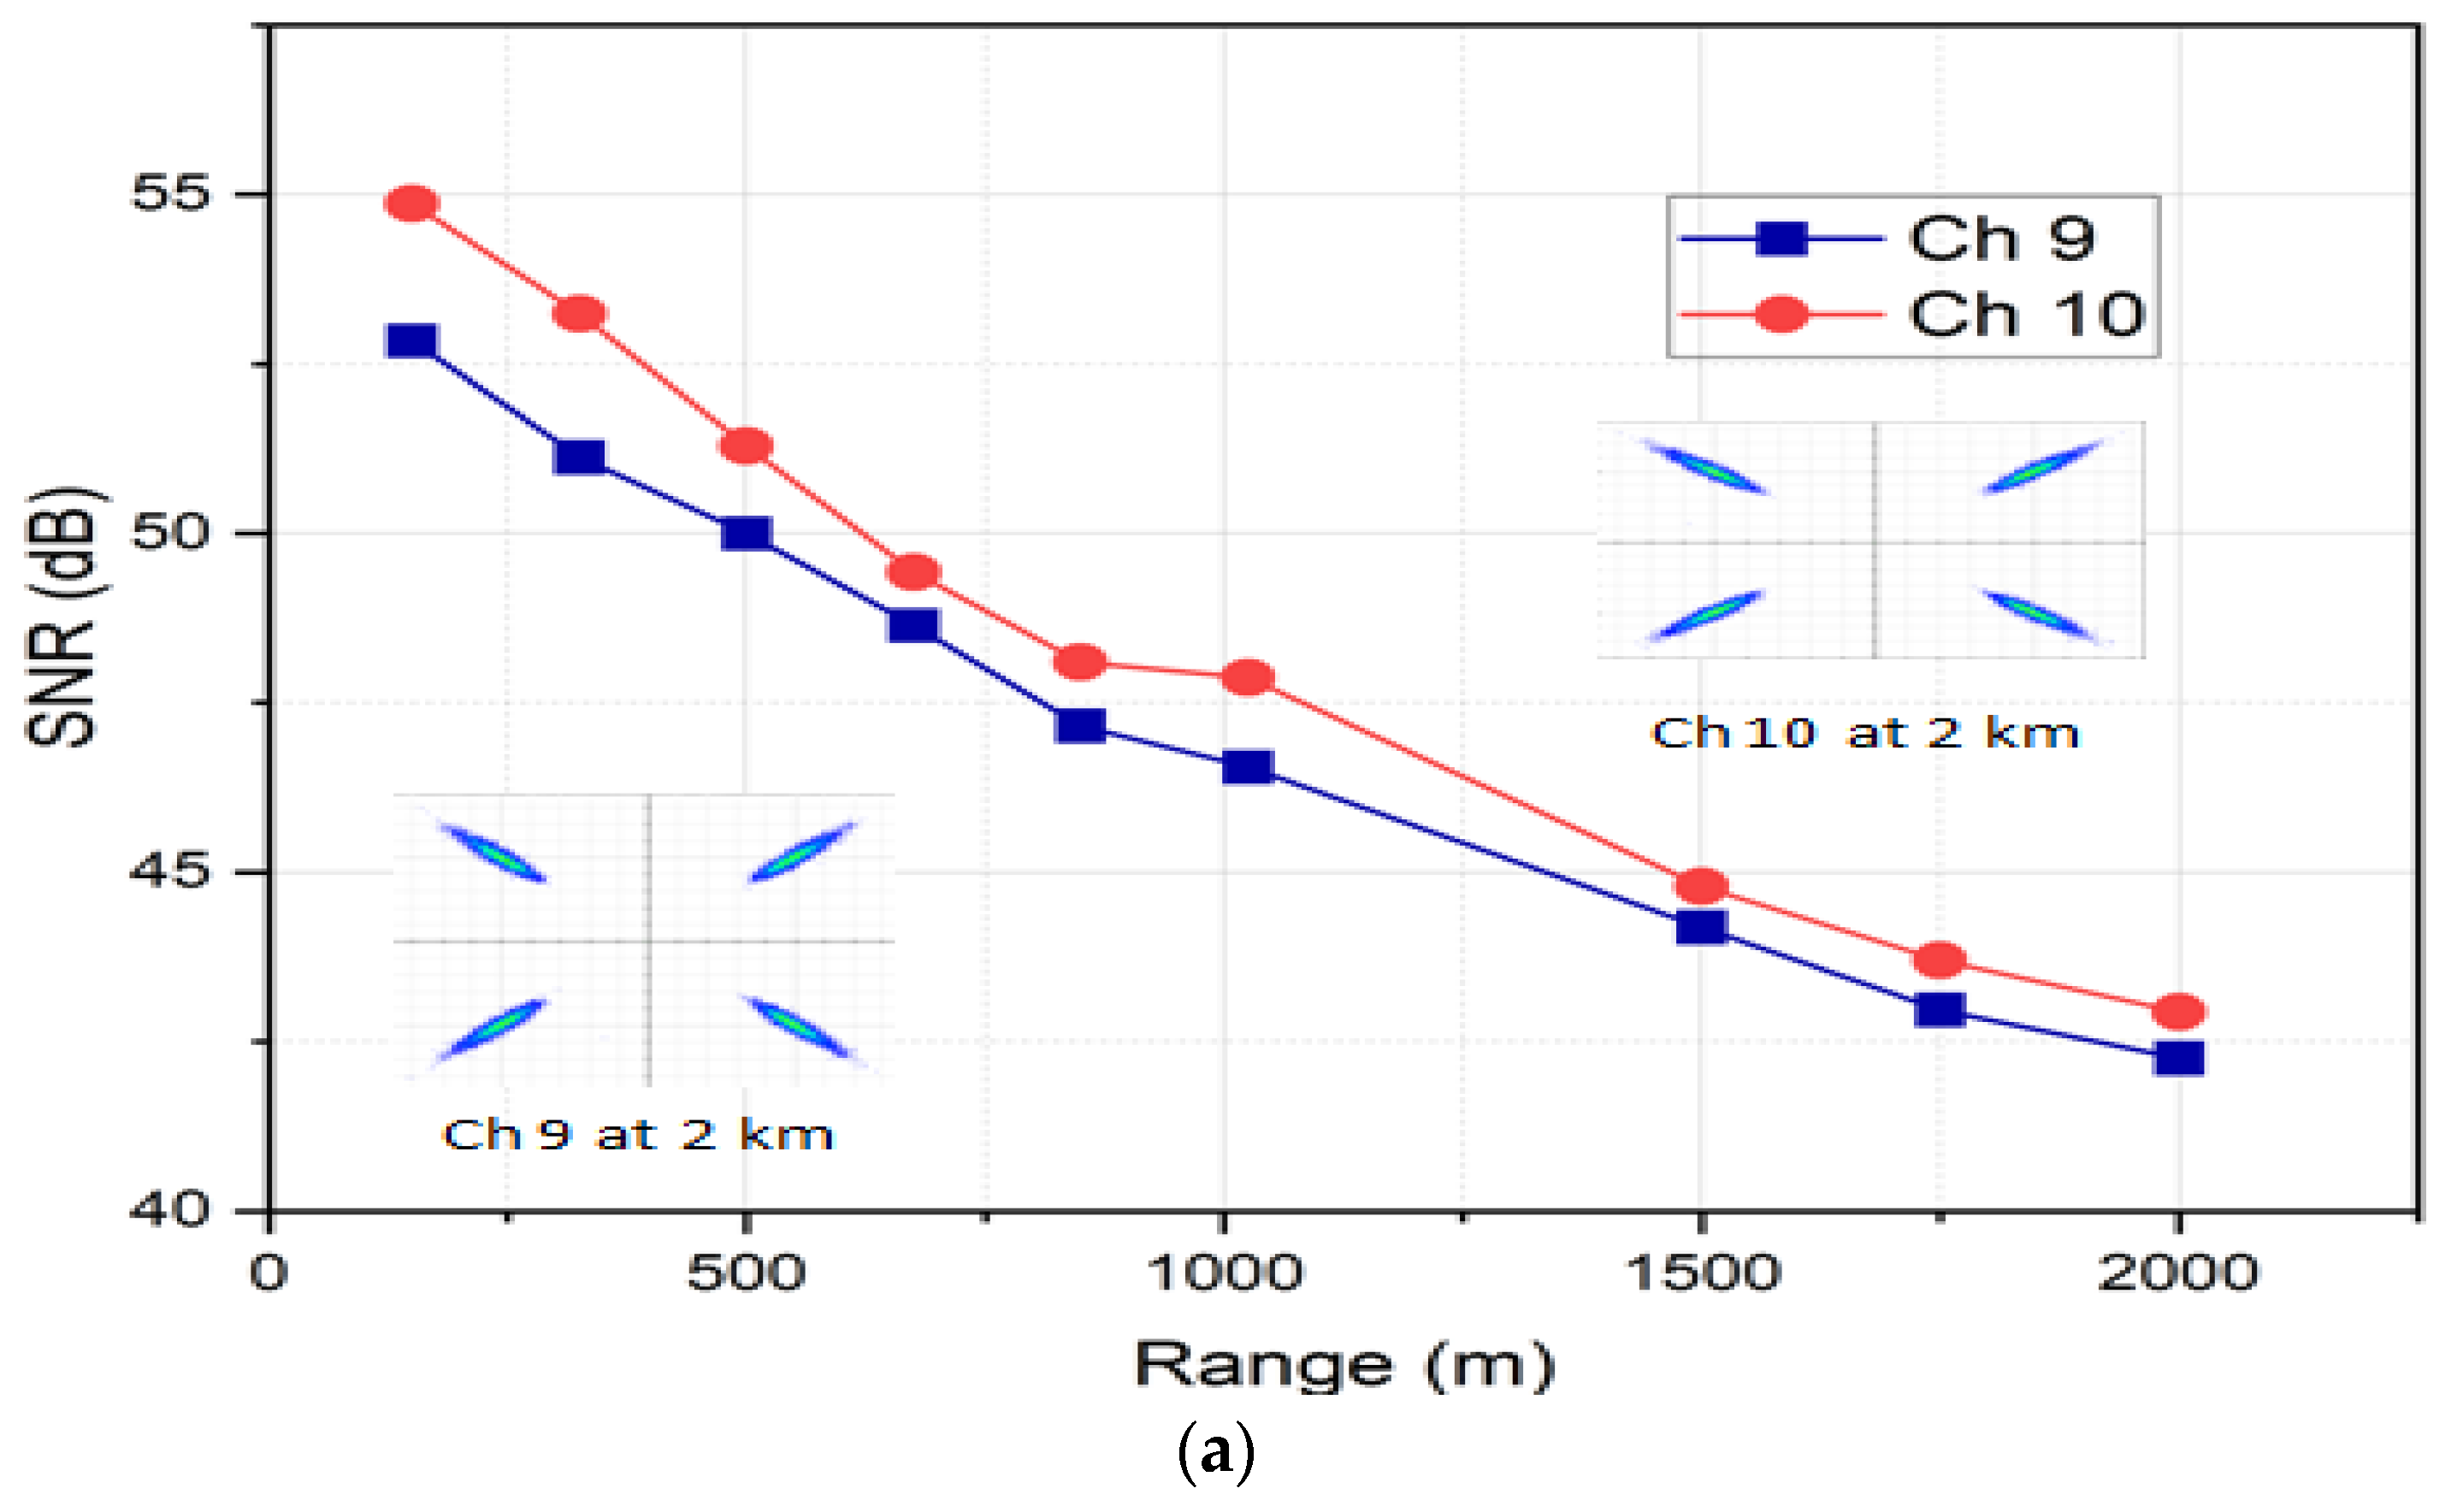
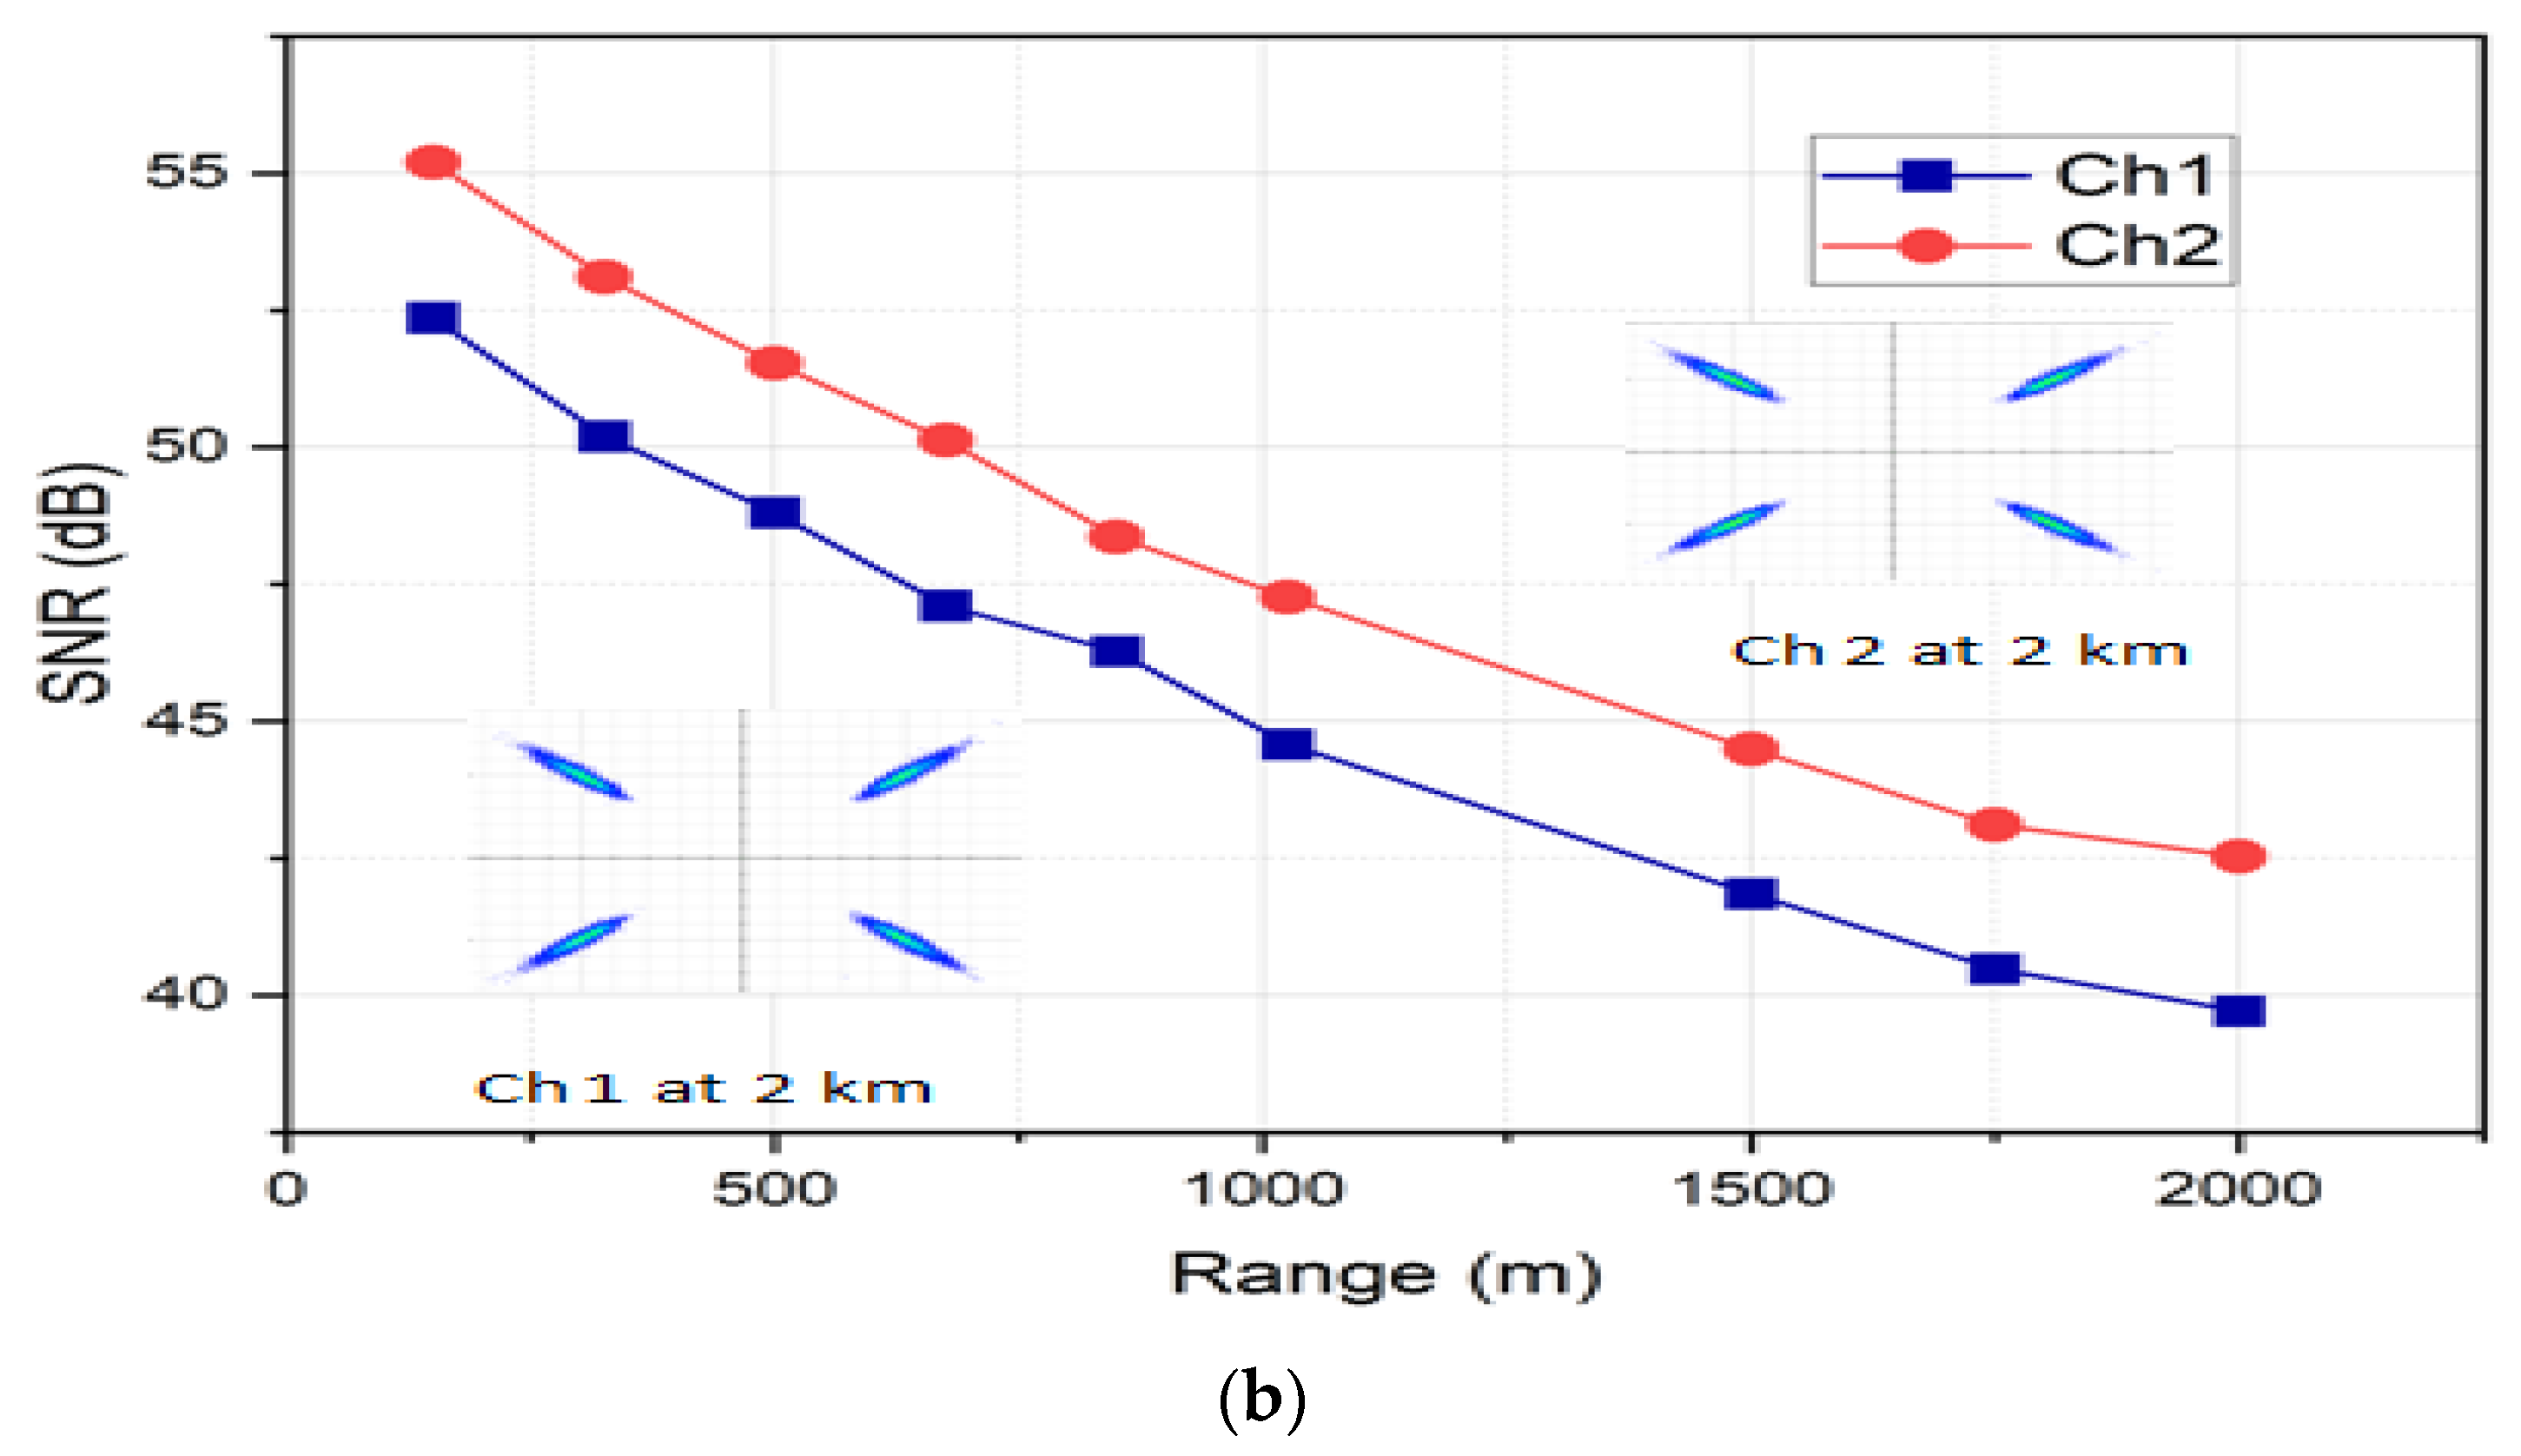
Figure 9a displays the SNR versus range for the New Delhi region with the constellation diagram obtained at a transmission range of 2 km considering channel 9 and channel 10. It can be observed from the graphs that SNR varies from 54.7 dB to 34.73 dB and 52.52 dB to 34.62 dB for Ch 10 and Ch 9, respectively. Figure 9b displays the SNR values for the Cape Town region depicting channel 1 and channel 2 along with the constellation diagrams observed at a transmission range of 2 km. A 3 dB higher value for SNR has been achieved in the case of the LG 01 mode at a wavelength of 1550 nm.
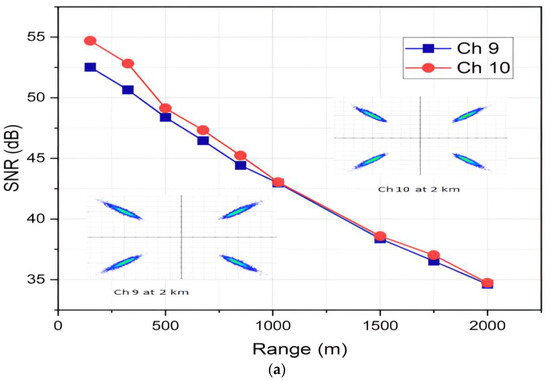
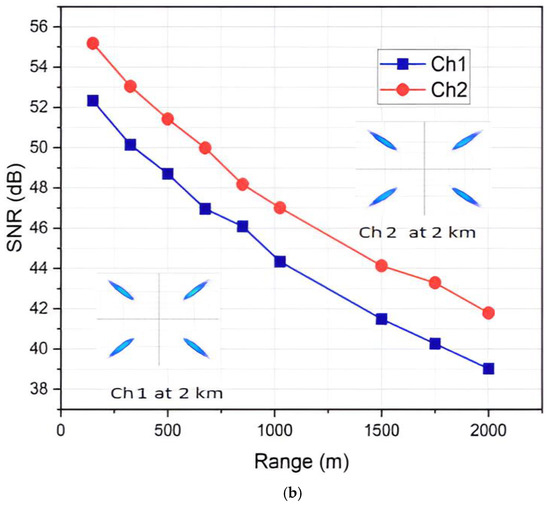
Figure 9.
SNR as a function of transmission range: (a) New Delhi region; (b) Cape Town region.
Figure 10a displays the SNR range for the Washington region with the constellation diagram obtained at a transmission range of 2 km considering channel 9 and channel 10. It can be observed from the graphs that SNR varies from 52.84 dBm to 42.26 dBm and 54.86 dBm to 42.94 dBm for Ch 9 and Ch 10, respectively. Figure 10b displays the SNR values for the London region depicting channel 1 and channel 2 along with the constellation diagrams observed at a transmission range of 2 km. A 3 dB higher value for SNR has been achieved in the case of the LG 01 mode at a wavelength of 1550 nm. As the range increases, the signal to noise ratio decreases due to geometric absorption and scattering losses.
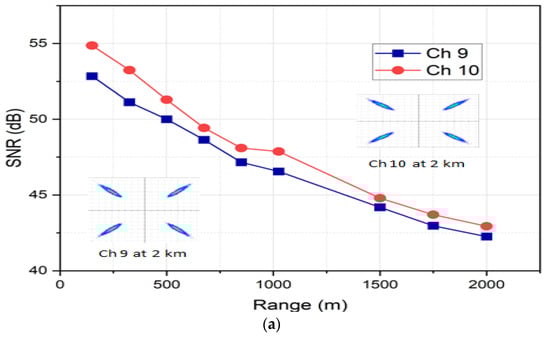
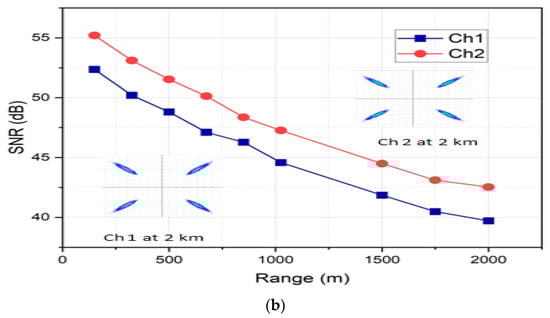
Figure 10.
SNR as a function of the transmission range: (a) Washington region; (b) London region.
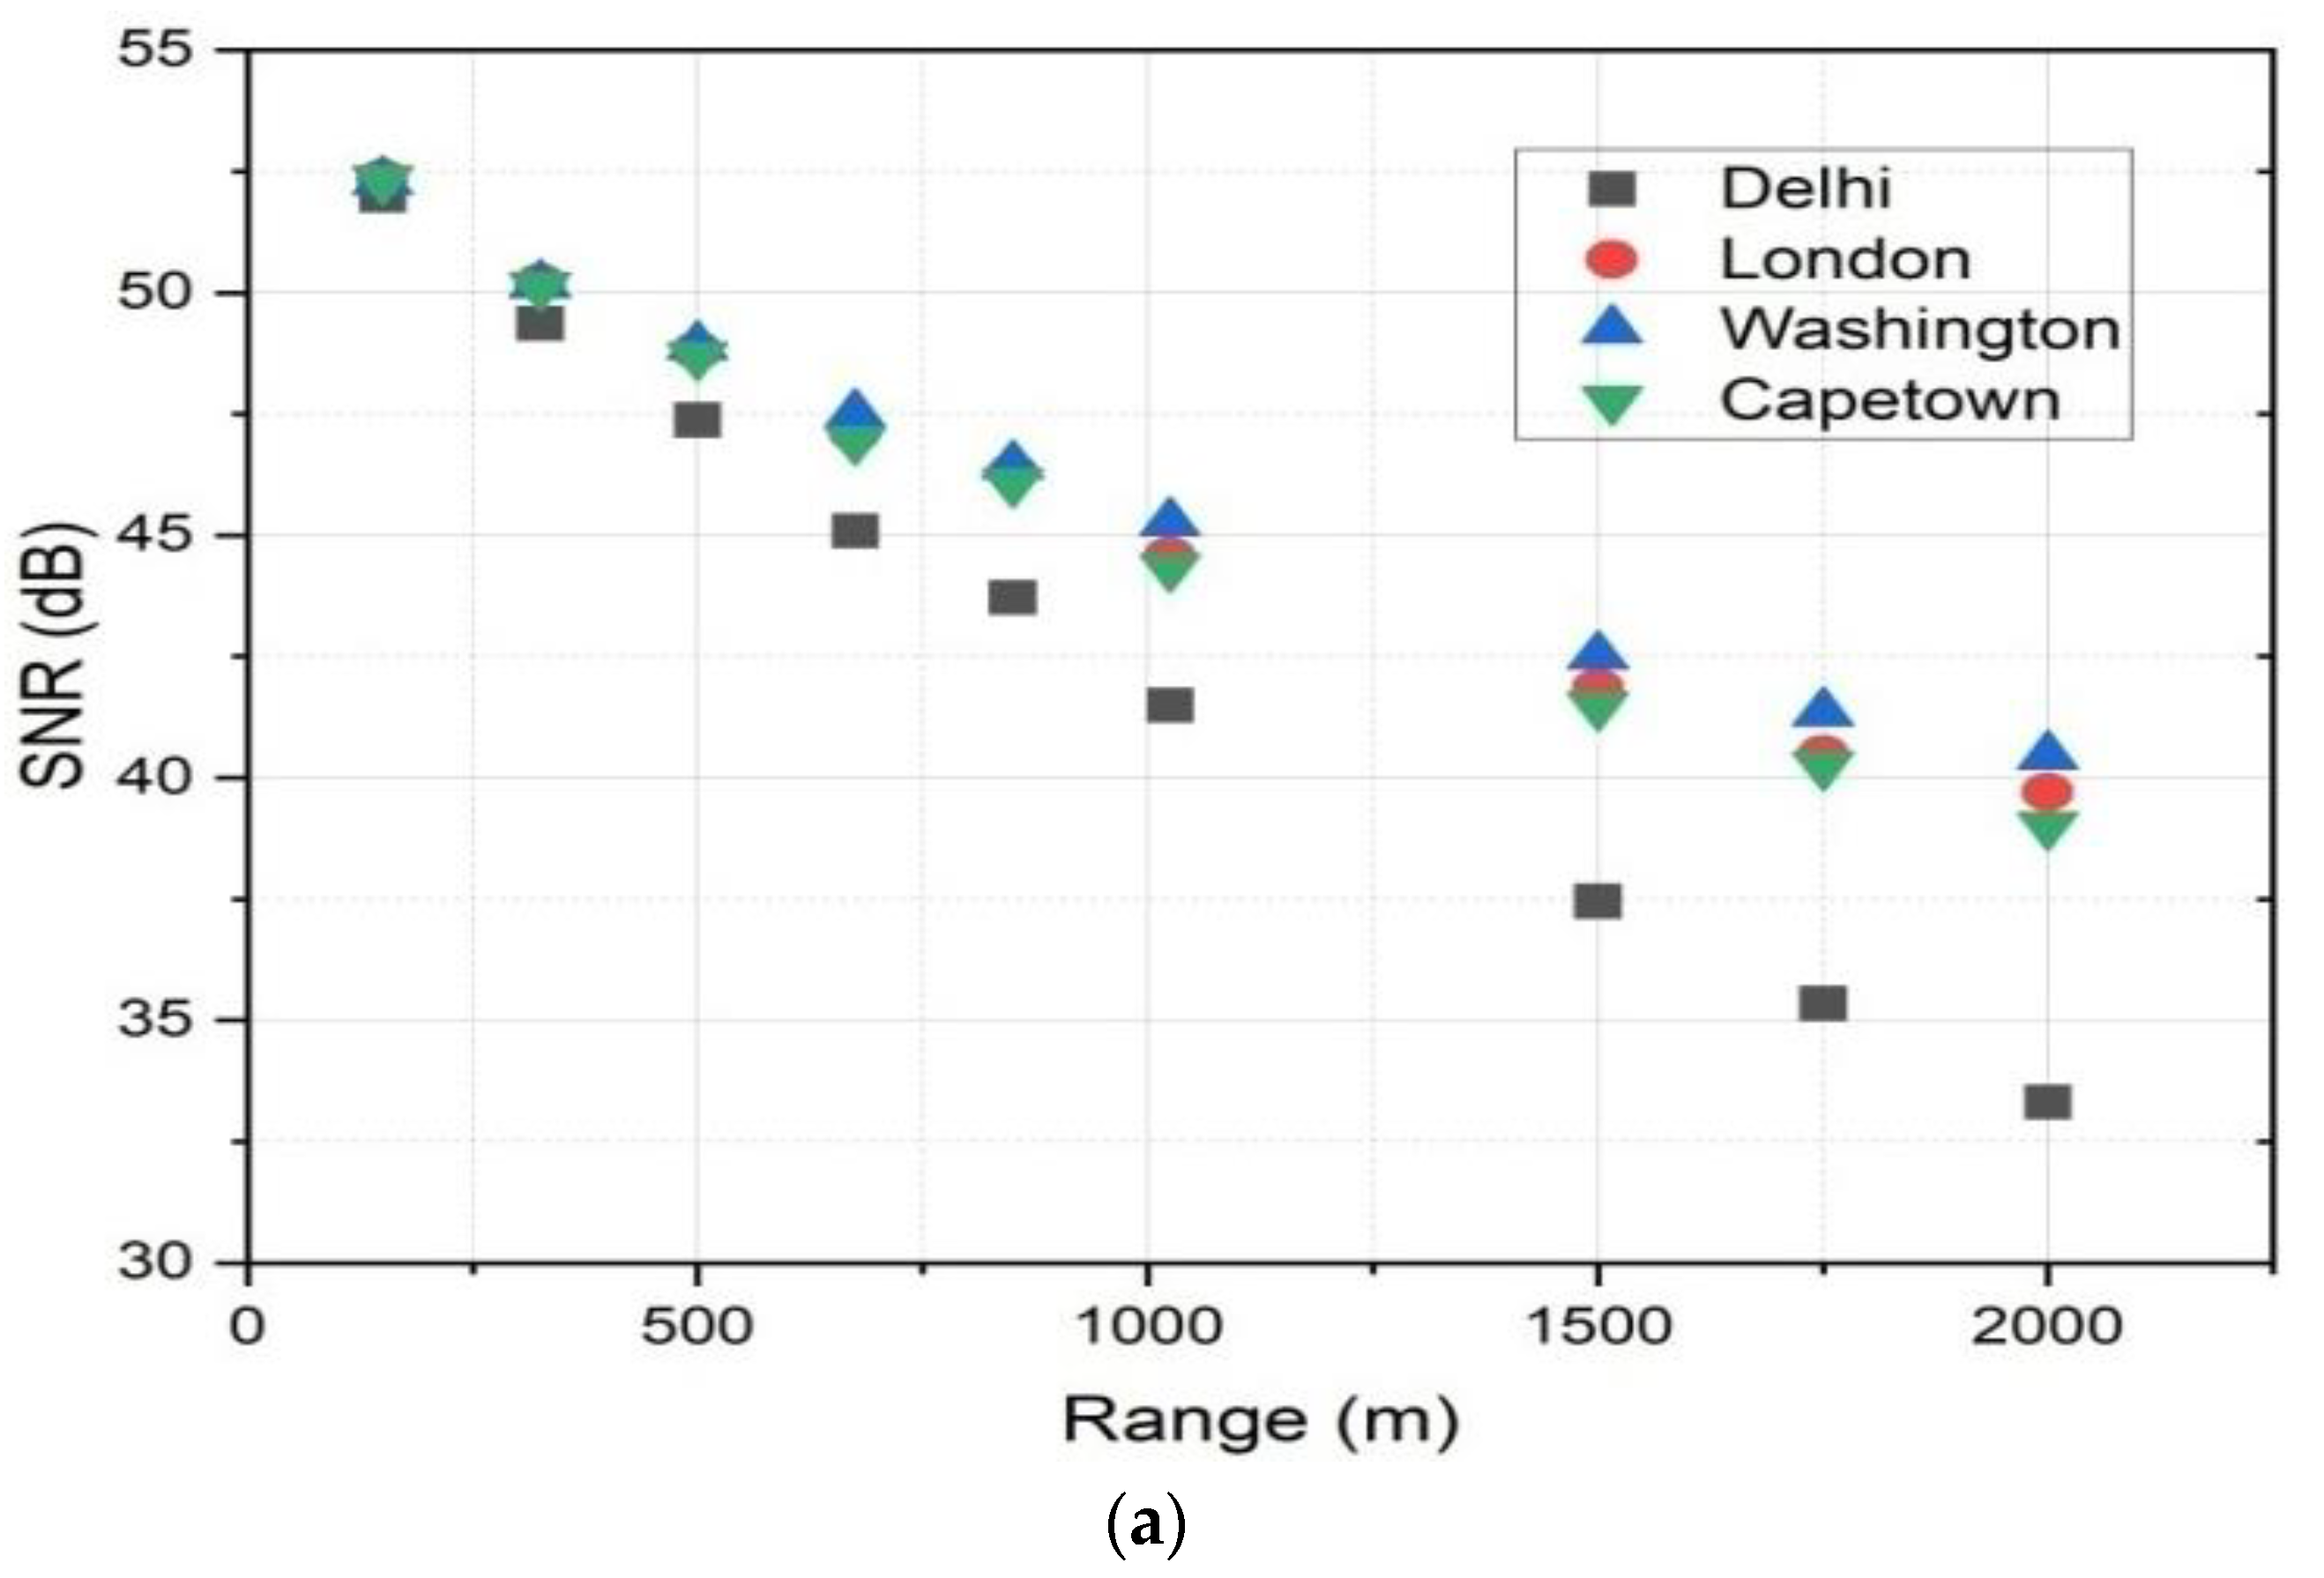
Figure 11a shows the scatter plot of the SNR range for different geographical regions. It may be observed from the figure that the SNR value of the New Delhi region falls off linearly by −18 dB with an increase in the propagation range from 200 to 2000 m. SNR values above 38 dB have been reported for the other three regions over the observed propagation range. Minimum and maximum SNRs have been obtained in the case of the Delhi and Washington regions, respectively.
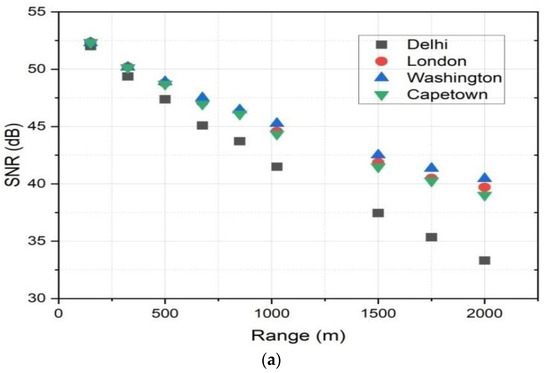
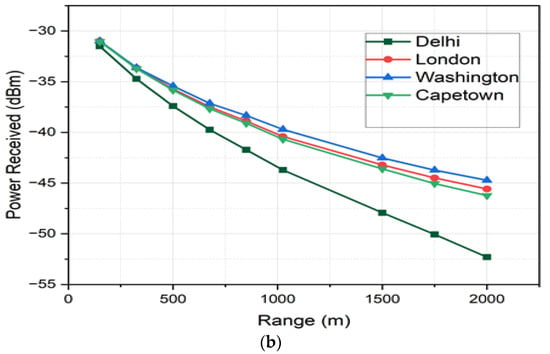
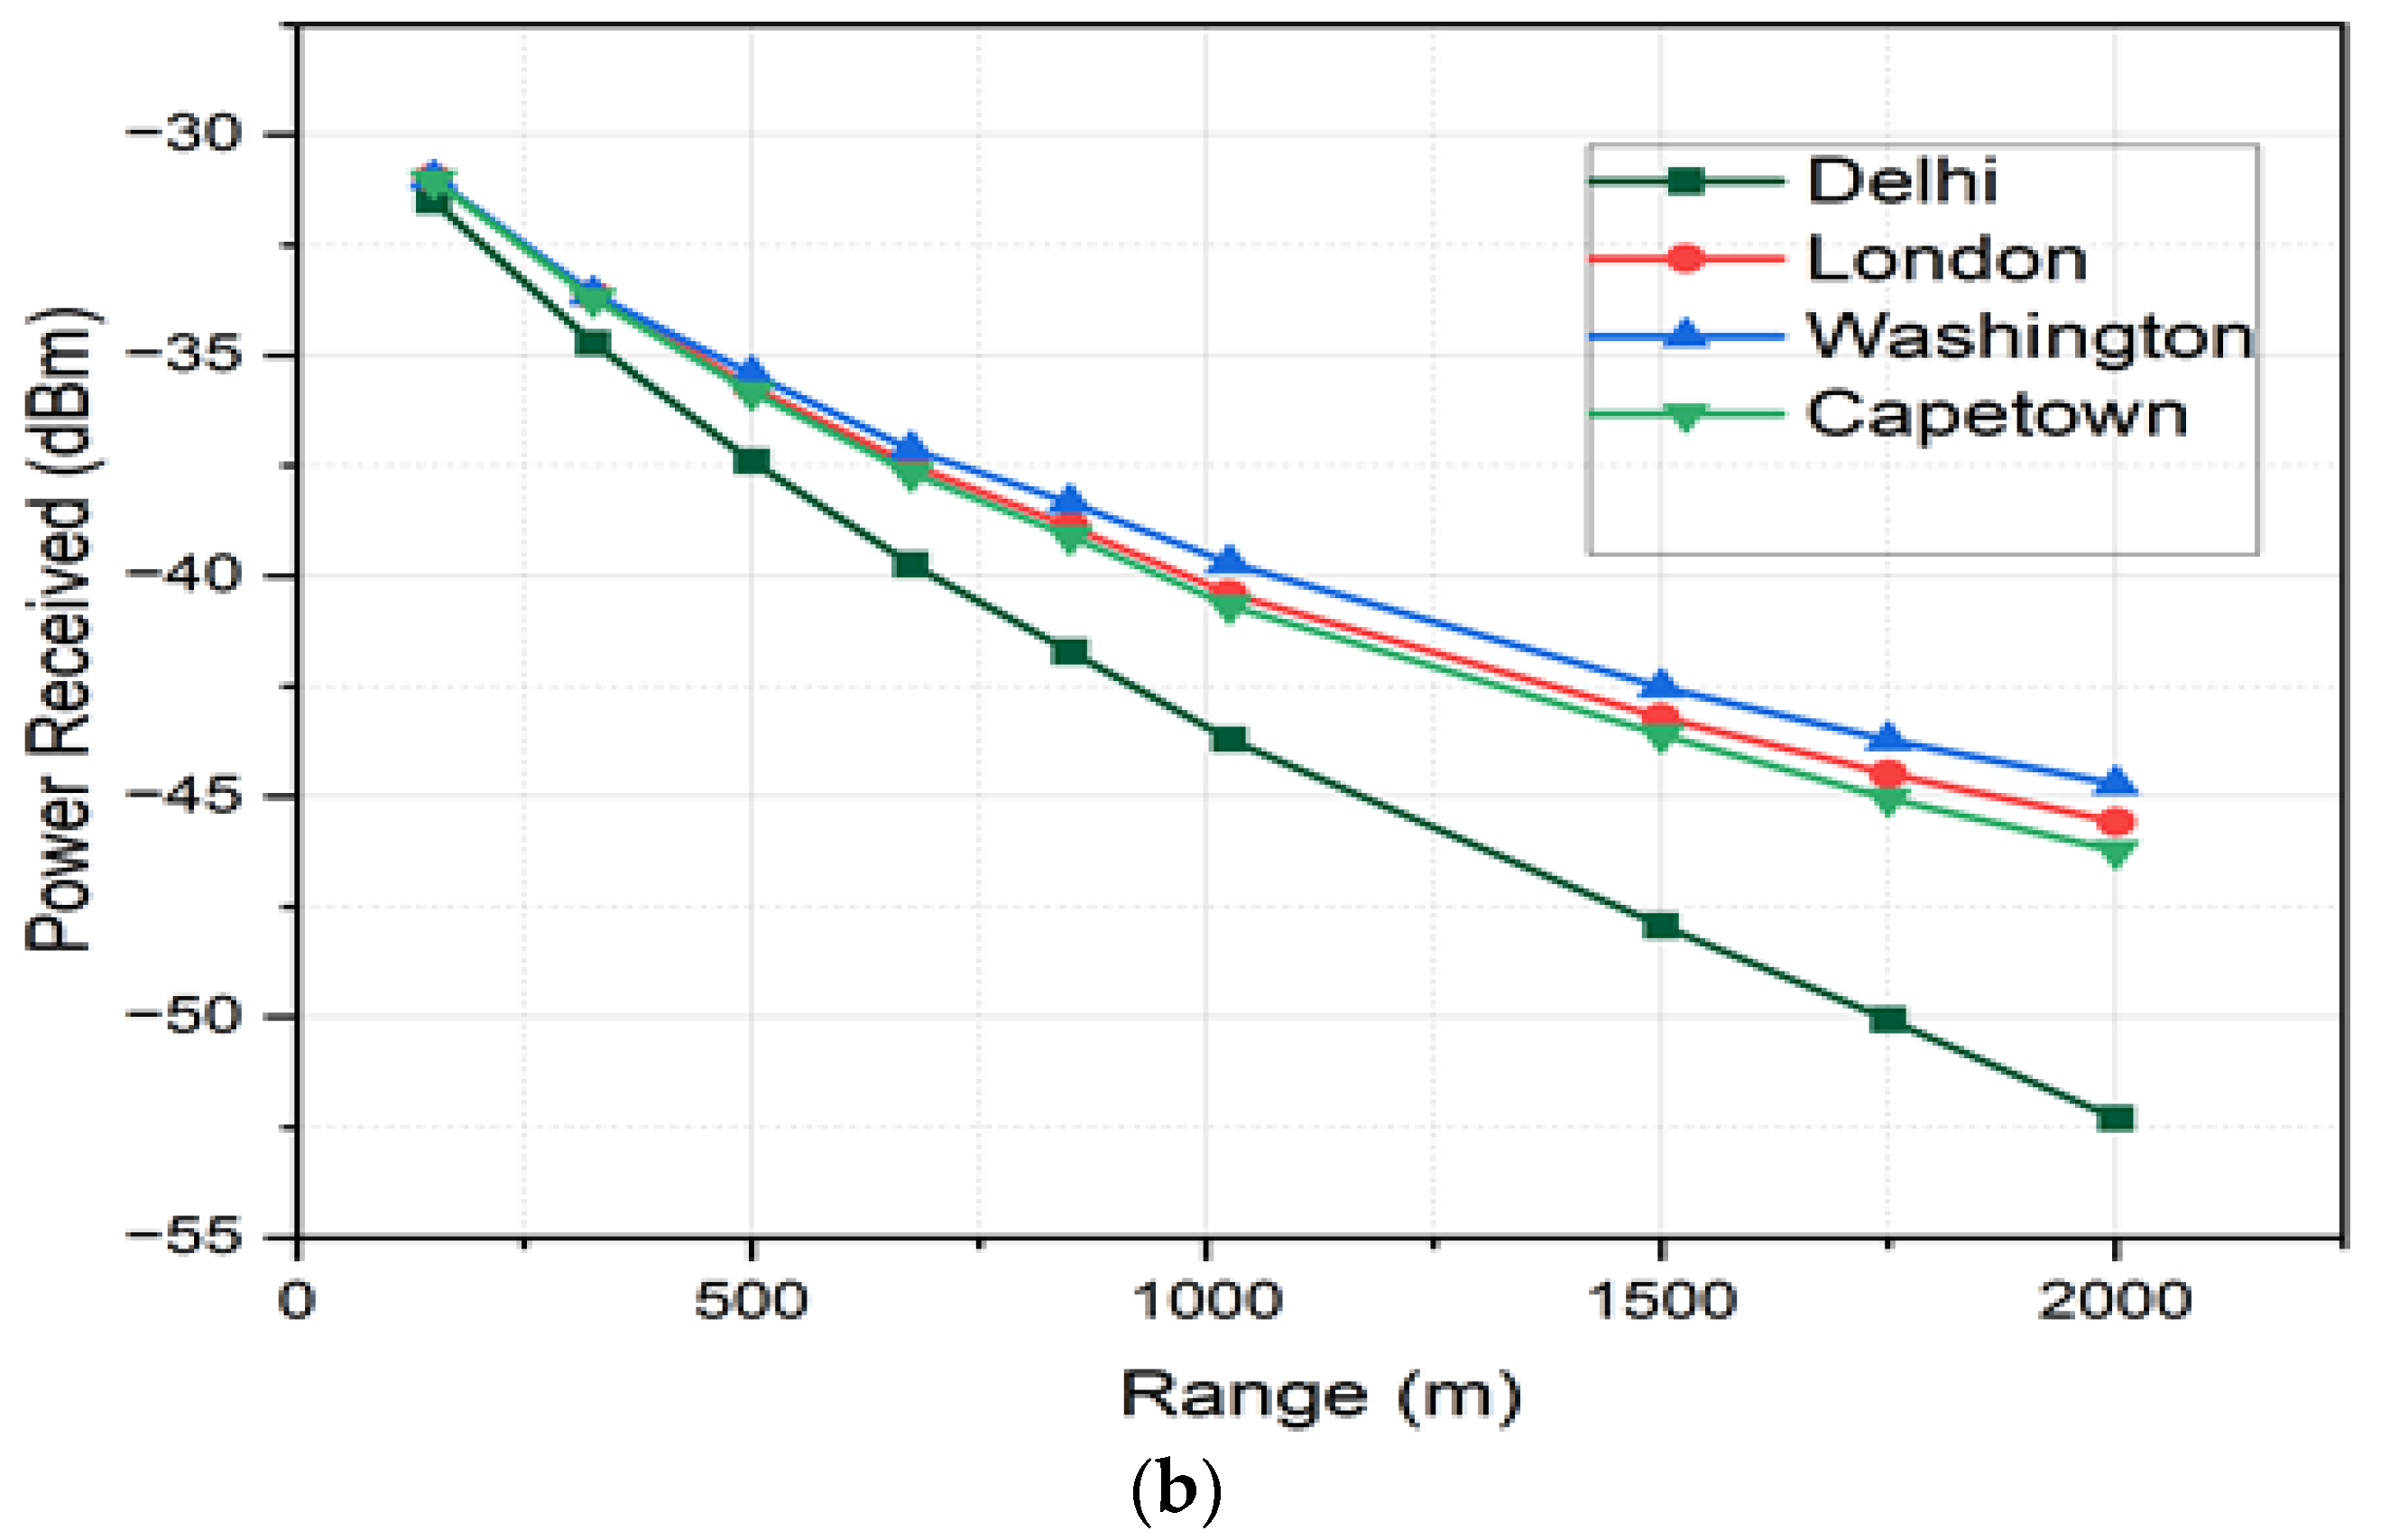
Figure 11.
Quality of the received signal for different geographic regions: (a) SNR; (b) Received power.
Figure 11b depicts the received power as a function of the transmission range for the four regions. It may be observed from the figure that received power decreases linearly by 20.79 dBm in the case of the Delhi region with an increase in the propagation range from 200 to 2000 m. A minimum received power of about −45 dB has been obtained for the observed transmission range in the case of the other three regions due to the effect of multi-impairments.
Further, different ML techniques (RF, KNN, MLP, GB) have been employed to assess the performance of the DP-QPSK-based FSO link using the Jupiter notebook in Python 3.0. The transmission range, wavelength, average attenuation, LG modes, and SNR are the input features and modeling target of the ML models, respectively. Initially, the entire sets of observations have been split into two subsets. Different models have been trained using the first subset and tested using the second data subset. Training and testing data sets are divided into fractions of 80% and 20%, respectively. The models develop relationships by learning from the features and target values of the training data and predict the SNR value for unseen data. Scaling has been performed to pre-optimize the features of the data set to similar ranges.
In RF, multiple decision trees have been developed and further averaged for predictions of the final outputs. It may reduce bias due to ensemble of learning and averaging errors of individual trees. The number of random variables chosen at each stage of splits for a single decision tree is set to 42. A total of 100 trees have been considered as one of the other hyper parameter of the RF algorithm. In the KNN algorithm, an optimal K value of 5 has been chosen to predict the class of new data points by selecting the K closest neighbors based on the distance between points in the training set and the new point. To assign the predicted class based on the majority class, the majority class of K neighbors has been identified. MLP incorporates input, hidden, and output neurons to improve the input–output mapping capabilities. Two hidden layers with 100 and 50 neurons each have been used in our work. The MLP algorithm updates the model’s weights using an optimization and back propagation technique. Stochastic gradient descent (SGD) has been used to minimize the loss function in the MLP model. An ensemble of weak learners is trained successively in the GB method, with each weak learner attempting to fix the failings of the preceding learners. Fewer repetitions enable GB to converge rapidly and the model performs well on both training and test data to give low bias.
The objective is to estimate the performance of the ML models in terms of SNR for different input feature values. Table 8 depicts the performance metrics employed to analyze the performance of RF, KNN, MLP, and GB ML techniques. The MSE, mean absolute error (MAE), root mean square error (RMSE), and coefficient of determination (R squared) have been determined. The GB technique has the ability to handle over fitting and noise and works well with the small dataset. The higher R squared (0.99) and lower MSE (0.11), MAE (0.25), and RMSE (0.33) values have been reported in the case of the GB algorithm, depicting a close relationship between training and testing data sets. ML models thus perform well in the estimation and prediction of the performance of the system.
Table 8.
SNR estimation by employing ML techniques.
6. Conclusions
In this work, DP-QPSK modulation with the MDM-WDM scheme has been employed to analyze the performance of the FSO link under fog, rain, and haze weather conditions. Real-time data for different months of 2023 and 2024 have been obtained for four diverse regions. Unified empirical models have been developed with the capability to predict overall attenuation due to multi-impairments of different regions. The minimum values of SNR and received power have been reported in the case of the New Delhi region. SNR and received power values above 38 dB and −45 dB have been obtained for the other three regions, respectively, due to the effect of multi-impairments. RF, KNN, MLP, and GB have been employed for the performance prediction of the MDM-WDM FSO link using DP-QPSK modulation under real weather conditions in the DP-QPSK system for SNR. The highest R squared (0.99) and lowest MSE (0.11), MAE (0.25), and RMSE (0.33) values have been reported in the case of the GB ML model for the estimation of the performance of the system. The work may be investigated further for cutting edge modulation techniques and real-time performance estimation and monitoring of impairments in optical networks.
Author Contributions
Conceptualization, T.K. and S.K.; methodology, T.K. and S.K.; validation, S.K. and M.I.; formal analysis, M.I.; resources, S.K.; writing—original draft preparation, T.K., S.K.; writing—review and editing, M.I.; Supervision, M.I.; project administration, M.I. All authors have read and agreed to the published version of the manuscript.
Funding
This research received no external funding.
Data Availability Statement
The data can be made available upon reasonable request from the authors due to ongoing research.
Conflicts of Interest
The authors declare that they do not have any conflicts of interest, and nor do they have any financial or non financial interest that are directly or indirectly related to the work submitted for publication.
References
- Sharma, A.; Kaur, S. Performance evaluation and fog attenuation modelling of FSO link for hilly regions of India. Opt. Quant. Electron. 2021, 53, 697. [Google Scholar] [CrossRef]
- Sabri, A.A.; Hameed, S.M.; Hadi, W.A.H. Last mile access-based FSO and VLC systems. Appl. Opt. 2023, 62, 8402–8410. [Google Scholar]
- Qu, C.; Ghafoor, S.; Ahmad, A.; Mirza, J.; Aljohani, A.J.; Aziz, I. A bidirectional free space optical link for last-mile terrestrial access links employing a novel wavelength shift keying technique. Opt. Quant. Electron. 2024, 56, 1367. [Google Scholar] [CrossRef]
- Kaur, S.; Singh, S.K.; Sharma, A. Machine Learning based performance estimation of terrestrial Ro-FSO Link. Phys. Scr. 2023, 98, 076001. [Google Scholar] [CrossRef]
- Hamza, A.S.; Deogun, J.S.; Alexander, R. Classification Framework for Free Space Optical Communication Links and Systems. IEEE Commun. Surv. Tutor. 2019, 21, 1346–1382. [Google Scholar] [CrossRef]
- Zhou, H.; Zhang, M.; Ren, X. Design and Implementation of Wireless Optical Access System for VLC-IoT Networks. J. Light. Wave Technol. 2023, 41, 2369–2380. [Google Scholar] [CrossRef]
- Kaur, S.; Kaur, J.; Sharma, A. Predicting the Performance of Radio over Free Space Optics System Using Machine Learning Techniques. Optik 2023, 281, 170798. [Google Scholar] [CrossRef]
- Kaur, S.; Goyal, R.; Chaudhary, S. 1000 Gbps MDM-WDM FSO link employing DP-QPSK modulation scheme under the effect of fog. Optik 2022, 257, 168809. [Google Scholar]
- Singh, M.; Pottoo, S.N.; Aly, M.H.; Hubalovsky, S.; Grover, A.; Adhikari, D.; Yupapin, P. Mode division multiplexing free space optics system with 3D hybrid modulation under dust and fog. Alex. Eng. J. 2023, 62, 113–127. [Google Scholar] [CrossRef]
- Khonina, S.N.; Kazanskiy, N.L.; Butt, M.A.; Karpeev, S.V. Optical multiplexing techniques and their marriage for on-chip and optical fiber communication: A review. Opto-Electron. Adv. 2022, 5, 210127. [Google Scholar] [CrossRef]
- Almogahed, A.; Amphawan, A.; Mohammed, F.; Alawadhi, A.; Yuen, C. Performance improvement of mode division multiplexing free space optical communication system through various atmospheric conditions with a decision feedback equalizer. Cogent Eng. 2022, 9, 2034268. [Google Scholar] [CrossRef]
- Le, H.D.; Nguyen, T.V.; Pham, A.T. Cloud attenuation statistical model for satellit, Cloud Attenuation Statistical Model for Satellite-Based FSO Communicationsin. IEEE Antennas Wirel. Propag. Lett. 2021, 20, 643–647. [Google Scholar] [CrossRef]
- Aovuthu, S.M.; Immadi, G.; Madhavareddy, V.N. Experimental studies on the effects of fog and haze on free-space optical link at 405 nm Microw. Opt. Technol. Lett. 2021, 63, 987–992. [Google Scholar] [CrossRef]
- El-Nahal, F.; Xu, T.; AlQahtani, D.; Leeson, M. A Bidirectional Wavelength Division Multiplexed (WDM) Free Space Optical Communication (FSO) System for Deployment in Data Center Networks (DCNs). Sensors 2022, 22, 9703. [Google Scholar] [CrossRef]
- Singh, H.; Mittal, N.; Miglani, R.; Singh, H.; Gaba, G.S.; Hedabou, M. Design and Analysis of High-Speed Free Space Optical (FSO) Communication System for Supporting Fifth Generation (5G) Data Services in Diverse Geographical Locations of India. IEEE Photonics J. 2021, 13, 7300312. [Google Scholar] [CrossRef]
- Lionis, A.; Peppas, K.; Nistazakis, H.E.; Tsigopoulos, A.; Cohn, K.; Zagouras, A. Using Machine Learning Algorithms for Accurate Received Optical Power Prediction of an FSO Link over a Maritime Environment. Photonics 2021, 8, 212. [Google Scholar] [CrossRef]
- Bazzi, A.; Slock, D.T.; Meilhac, L. Efficient maximum likelihood joint estimation of angles and times of arrival of multiple paths. In Proceedings of the 2015 IEEE Globecom Workshops (GC Wkshps), San Diego, CA, USA, 6–10 December 2015. [Google Scholar]
- Pugazhenthi, A.; Kumar, L.S. Calculation and analysis of cloud attenuation and other cloud parameters in India for earth-space links. Adv. Space Res. 2021, 68, 3957–3970. [Google Scholar]
- Alkholidi, A.G.; Altowij, K.S. Free Space Optical Communications—Theory and Practices; Contemporary Issues in Wireless Communications; InTech: London, UK, 2014. [Google Scholar]
- Kaushal, H.; Jain, V.K.; Kar, S.; Kaushal, H.; Jain, V.K.; Kar, S. Free-Space Optical Channel Models. Free Space Opt. Commun. 2017, 41–89. [Google Scholar] [CrossRef]
- Anis, A.A.; Rashidi, C.B.M.; Aljunid, S.A.; Rahman, A.K. Evaluation of FSO System Availability in Haze Condition. In IOP Conference Series: Materials Science and Engineering; IOP Publishing: Beijing, China, 2018; Volume 318. [Google Scholar]
- Yin, J.-F.; Wang, D.-H.; Zhai, G.-Q.; Xu, H.-B. An investigation into the relationship between liquid water content and cloud number concentration in the stratiform clouds over North China. Atmos. Res. 2014, 139, 137–143. [Google Scholar] [CrossRef]
- Support of Fog, Haze and Clouds Data. Available online: https://www.timeanddate.com/weather/india/new-delhi/historic?month=2&year=2023 (accessed on 19 March 2023).
- Amphawan, A.; Chaudhary, S.; Chan, V.W.S. 2 × 20 Gbps—40 GHz OFDMRo-FSOtransmission with mode division multiplexing. J. Eur. Opt. Soc.-Rapid Publ. 2014, 9, 14041. [Google Scholar] [CrossRef]
- Singh, M.; Malhotra, J.; Atieh, A.; Kakati, D.; Vigneswaran, D. Investigation of 340-Gbps terrestrial FSO link incorporating spectral-efficient DP-QPSK-PolSK hybrid modulation scheme. Opt. Eng. 2020, 59, 2020. [Google Scholar] [CrossRef]


Disclaimer/Publisher’s Note: The statements, opinions and data contained in all publications are solely those of the individual author(s) and contributor(s) and not of MDPI and/or the editor(s). MDPI and/or the editor(s) disclaim responsibility for any injury to people or property resulting from any ideas, methods, instructions or products referred to in the content. |
© 2025 by the authors. Licensee MDPI, Basel, Switzerland. This article is an open access article distributed under the terms and conditions of the Creative Commons Attribution (CC BY) license (https://creativecommons.org/licenses/by/4.0/).