Abstract
The COVID-19 pandemic has affected human life worldwide and forced the implementation of lockdown periods in order to reduce the physical interactions of people. Italy has been heavily affected by a large number of deaths. The government had to impose a long lockdown period during the spring of 2020. In this paper, we provide a critical analysis of the 2020 Italian spring lockdown (ISL) through observation of the spatiotemporal NOx pattern differences in connection with the social changes imposed by such restrictions. Different freely available sources of information are used: European Space Agency (ESA) TROPOspheric Monitoring Instrument (TROPOMI) measurements, ground-based measurements, and model estimates. The results show high NOx pollution levels, even during the lockdown, that suggest new approaches to sustainable mobility policies.
1. Introduction
The disease caused by the severe acute respiratory syndrome coronavirus 2 (SARS-CoV-2), simply known as COVID-19, has led to 193,798,265 confirmed cases worldwide, with 4,158,041 deaths recorded by the World Health Organization (WHO) as of 26 July 2021 [1]. At the same time, Italy had confirmed 4,312,673 cases and 127,942 deaths. In spring 2020, Italy was the second most affected country (after China) and the foremost in Europe to be significantly affected by the COVID-19 pandemic. The first COVID-19 Italian disease case was confirmed in the Lombardy region on 21 February 2020; this led to a consistent set of restrictions on human activities within the region.
At the time when the analysis was considered, three different measures to counteract the pandemic situation emerged, namely (i) vaccination, (ii) herd immunity development, and (iii) lockdown [2]. As the first measure was not ready at that stage, and the second measure was largely considered unreasonable—on account of the huge number of fatalities—a vast majority of countries have practiced the third option, despite it having a potentially immense adverse economic impact [3]. Although the virus mostly affected the richest northern Italian regions in spring 2020, there was widespread concern regarding the whole Italian national health system’s capacity to respond effectively to the needs of patients, especially those requiring intensive care [4]. Hence, in [4], a data-driven model was developed to estimate the time to get to the maximum capacity of an intensive care unit (ICU).
In order to mitigate the spread of the virus in Italy and to keep the pressure on the national health system (especially in terms of ICUs) under control, the Italian government introduced progressive mitigation measures on 9 March and 11 March 2020; the aim of these measures was to limit social interactions drastically and, thus, to prevent the diffusion of the virus. The period of time spanning from the beginning of March to the beginning of May was named the Italian spring lockdown (ISL), with only drugstores, newsstands, and grocery retailers open and fixed quotas of customers/clients allowed within a shop at the same time. The spread of the virus after such a lockdown was effectively reduced, as well as the mortality rate; however, in autumn 2020, after a summer of no or limited restrictions, there was a new increase in infections and the mortality rate.
Implementing a strict lockdown is not easy in democratic countries, where such personal limitations are often even considered out of lifestyle; however, at that moment, without fully reliable care and with the vaccine campaign starting, albeit slowly, in December 2020, social distancing and (to the extreme) a lockdown was the only reliable strategy to prevent the collapse of ICUs and, overall, to limit the number of fatalities [5]. Obviously, as people were forced to stay home, thus limiting their social life and personal movements, the impact of the lockdown on the economy was striking. The Italian gross domestic product (GDP) fell by 5.4% and 12.4% during the first and second quarters of 2020, respectively [6]. Travel, tourism, and leisure industries, which play a main role in the Italian GDP, were hit the hardest. At the same time, along with the lockdown-related drastic reduction of transport demand, external costs due to private motorized trips, such as congestion and pollution, also decreased. This improved freight distribution due to the withdrawal of vehicles normally circulating in crowded and congested urban roads and allowed logistics operators to successfully manage a hugely increased number of deliveries, due to the increase in e-commerce, with a further reduction of emissions.
Obviously, given the transport-related nature of these emissions, a positive correlation is expected, which may prove the effectiveness of reducing urban transport for improving air quality, even in nonpandemic conditions. At the high combustion temperatures of most transport sources of air pollution, atmospheric nitrogen (N) is oxidized into nitric oxide (NO) and small quantities of nitrogen dioxide (NO), in addition to smaller quantities from nitrogen-containing impurities in the fuel, while nitrous oxide (NO) is emitted only in small quantities from the combustion process [7]. Hence, NOx emission levels are mostly associated to the transport system. Nitrogen oxides are among the main drivers in air quality degradation in urban and industrialized areas, since they act as catalysts of tropospheric ozone formation and since they play the role of precursors of secondary inorganic aerosols, affecting the global climate and human health [8,9,10]. In Italy, approximately 64% of the total NO emissions come from transport-related sources, primarily originating from the fuel combustion in road vehicles (33%)—quite equally split into passenger (18%) and freight (15%)—maritime (23%), and aviation (7%), while the remainder of the NO emissions come from agriculture (14%), other production processes (11%), and heating (9%); finally, natural sources, such as vegetation fires, volcanoes, lightning, and so on, sum up to 2% [11]. The close link between NO atmospheric levels over cities and human activities has also been clearly witnessed, in terms of the significant reduction of NO emissions during official rest days and public holidays [12].
The global outbreak of the COVID-19 spring pandemic, declared as a public health emergency of international concern by the WHO [13], led to unprecedented public health safety rules, including travel restrictions, curfews, and quarantines, almost worldwide, among which the most drastic were those in Italy [14]. Their enforcement, combined with measures in other countries, as well as voluntary limitations of activity [15], resulted in sweeping disruptions of social and economic activities and even risk of a global recession [16].
Within such a framework, it is interesting to place satellite and ground air pollution measurements side-by-side, as well as ancillary information on economic and mobility policies, during the ISL. To the best of our knowledge, no other study has analysed the pollution reduction due to the lockdown and its likely mobility implications for a specific region in Italy. Thus, in this paper, we try to fill the gap by observing NO pollution levels (provided by the TROPOMI), ground-based measurements, and model estimates vs. mobility activities around the city of Milan in the northwestern Lombardy region. The case study region was chosen because it is not only the densest, richest, and most air-polluted region in Italy, but it was also the most affected by the pandemic outbreak. To this aim, we used both primary data on pollution and secondary data on mobility. In particular, we considered the effects of the 2020 ISL on air pollution by means of remote-sensed nitrogen oxides (NO = NO + NO) measurements.
The remainder of the paper is organized as follows. In Section 2, the authors introduce the relevant literature investigating the relationship between environmental pollution and economic activities, as well as the most recent works considering the impact of the COVID-19 pandemic. Section 3 briefly illustrates the case study context. In Section 4, the authors present the key results of the multidisciplinary investigation. In Section 5, a critical discussion of the results, some final remarks, and first policy recommendations and methodology implications are given.
2. Literature Review
This section briefly presents some previous works dealing with the relationship between economic activities and environmental pollution (Section 2.1), as well as the more recent literature focused on the impact of COVID-19 on the environment, economy, and transport (Section 2.2).
2.1. Environment and Economy
First of all, it must be noted that the economic literature considering the relationship between the economy and the environment has mainly been devoted to pollution and externalities, observed from a theoretical perspective, while more empirical works have dealt with the fiscal aspects related to market regulations. As transport is a derived demand (i.e., it results from the demand of another good, service, or place to reach) [17], it is strictly correlated to economic activities; thus, most of the previous conclusions also apply. One of the first attempts to shed light on the interactions between economic activities and air pollution dates back to [18], who studied the functional relationship between the economy and environment within the input–output (I–O) model framework. The analysis was carried out both theoretically and empirically, observing airborne wastes (including NO) as negative externalities from specific sources (e.g., private motorized mobility) in the early 1960’s, comparing data from Canada and the USA, and making a proposal for an economic–ecological I–O model for Britain.
From a theoretical perspective, the authors of [19] observed pollution as an inevitable side effect of economic activity, then focused on the environmental care impact on the optimal growth rate and technological choices. Actually, not only may economic growth increase pollution and environmental degradation, thus making growth less desirable when considering the amenity value of the environment, but the quality of the environment also affects productivity and, consequently, economic growth. Moreover, as agents tend to ignore the effects of their own actions on pollution levels, negative externalities arise, market outcomes are thus inefficient, and there exists a role for the government [20]. More specifically, considering transport pollution sources, the authors in [7] recognized that emissions from road traffic have already been substantially reduced through the introduction of technology and local traffic reduction measures, such as road pricing and parking.
In more detail, the authors of [21] used a two-stage production–pollution model to investigate how a firm can maximize its profit subject to its polluting impact on the environment, given only the incentive of a bad reputation (when polluting too much). Despite the sustainability commitment power, which has been widely explored in the corporate social responsibility field, policy interventions for incentivizing green technology or pollution restrictions permits or taxation are also expected.
Interestingly, the authors of [22] explored the economy-and-environment-as-substitutes hypothesis, that is, the pervasive belief among scholars, according to which proenvironmental preferences (and, consequently, concern for the environment by policymakers) weaken during economic downturns. An inverse correlation between national economic strength and public commitment to environmental action has been traced due to the costs of public commitment to climate reforms. Nonetheless, they empirically disproved this hypothesis at the individual level using the results of a panel survey carried out in the USA in 2008 and 2011. Therefore, in the future, policymakers may have broader latitude to address environmental concerns across a range of economic circumstances. In particular, as recently argued by [23], who analysed fiscal measures against pollution in terms of their impact on the scale of the economy, a tax on pollution is less efficient than a subsidy on abatement activity, which decreases pollution while increasing per capita consumption. Important implications follow; different green fiscal policies and individual preferences might explain the differences and correlations between economic performance and environmental outcomes (i.e., pollution flows) at the regional scale.
However, another economy-related impact has also been shown: the mobility was reduced severely. Of course, such an unavoidable effect is expected to be environmentally positive, as discussed in the next subsection.
2.2. Societal Effects of the COVID-19 Lockdown
After the outbreak of the pandemic, flourishing empirical literature addressed the impact of lockdowns on the environment, especially in terms of pollution and emissions, mobility, and the economy.
2.2.1. Impact of COVID-19 Lockdown on the Environment
Concerning the first group, the authors of [24,25] emphasized the impact of lockdown on the environment, with an air quality increase due to the closure of factories and a reduction in the use of transport vehicles. More specifically, the authors of [26] tested the hypothesis that the lockdown reduced (tropospheric and ground-level) air pollution concentrations through the use of satellite data and a network of more than 10,000 air quality stations. After accounting for the effects of meteorological variability, they determined declines in the population-weighted concentration of ground-level nitrogen dioxide by about 60% in 34 countries, mainly due to reductions in transport sector emissions. Positive effects on air quality have been observed in specific large cities in the USA, Spain, India, Kazakhstan, New Zealand, South Korea, China, and Brazil, as well as in larger regions of Canada, China, The Netherlands, and the United Kingdom.
Similar analyses have also been carried out in Italy. In [27], focusing on the impact of the ISL on various emissions (PM, PM, NO, and O) in three cities of Tuscany, the authors discovered a direct relationship between the ISL and PM reduction only in high-traffic areas, while a significant decrease in NO concentrations was observed in all the considered cities. As for Milan, whose outcomes are discussed in the following sections, in [28], air pollutants were observed over the entire Metropolitan City (the former province), by means of meteorological data from weather stations and air quality control units on the ground provided by the Lombardy Regional Agency for Environmental Protection (ARPA). Meanwhile, in [29], among other pollutants, NO in the atmosphere was compared over eight major cities, including Milan, during their respective lockdowns. In this context, long-term records of satellite observations of NO columns have already been used to assess the effectiveness of long-term pollution reduction strategies [30,31,32], as well as the effects of the 2008–2009 world economic crisis [33]. In addition, with reference to short-term emission reduction programs during particular events, such as the 2008 Olympic Games in Beijing [34,35] and the 2010 World Expo in Shanghai [36], satellite observations of NO columns, together with in situ data, have been used to determine their impact on air quality. An analysis performed by the German Aerospace Center (DLR) using weather data and models, pollution measurements from ground stations, and satellite spectral data has indicated the dominant role of lockdown restrictions, compared with weather factors, in improving air quality [37]. They found that NO emission levels due to manufacturing and transport were reduced, with respect to those of 2019, by 30% to 50% worldwide on average during the COVID-19 pandemic. The role played by the restrictions adopted to control the spread of the COVID-19 pandemic, in terms of improving the air quality, has been assessed, over China, in [38]. The authors found that the significant reduction of NO emissions was highly correlated to the restrictions imposed on the transport sector.
2.2.2. Impact of COVID-19 Lockdown on Mobility
Other studies have mainly dealt with the relationships between lockdowns and mobility. With regard to Italy, for example, the authors of [39] described the movements which occurred during the lockdown, according to location-based social network (Facebook) data and taking into account geographical differences. Focusing on those factors contributing to the investigation of behavioural changes in mobility and/or aggregate flows of short-distance trips makes it possible to identify different studies at the local or national level. The authors of [40] analysed the impact of a lockdown in Santander (Spain), focusing on new origin–destination trip matrices, daily mobility reduction, and the changed modal distribution and journey purposes. They found that overall mobility decreased by 76%, with public transport suffering the most (93%). Moreover, they also confirmed that NO emissions were reduced by up to 60%. More specifically, the authors of [41] compared transit ridership in La Coruna (Spain) during the lockdown to similar data in 2017–2019 and to the 2020 nonlockdown standard situation, discovering that the impact of the lockdown on transit ridership was more significant than that on the general level of traffic, both public and private. The authors of [42] observed a drastic reduction (−75%) in traffic in Madrid and Barcelona (with consequent NO concentration reductions of 62% and 50%, respectively). The authors of [43] estimated that lockdown policies had generally reduced the overall mobility by half in several major USA cities within the first week. The authors of [44] developed mathematical models to cluster travelers, based on mode, trip frequencies, and sociodemographic characteristics, before and during the lockdown. The results of a multiple discrete choice extreme value (MDCEV) analysis indicated the high propensity of shifting to virtual and private modes, depending on the trip purpose and length. The age, income, and working status of respondents also mattered. This was also in line with other studies who noticed that, apart from the lockdown-imposed restrictions on personal mobility, the fear of being infected amplified the reduction in the number or trips, especially with respect to collective and/or shared transport modes. For example, the authors of [45] analysed 20 years of daily transit ridership data in Chicago, using a Bayesian structural time series model and partial least squares regression. Their findings suggest that, due to COVID-19, there was an 72.4% decrease in ridership on average, with peak reduction in regions with more commercial lands and higher percentages of white, educated, and high-income individuals, as well as regions with less jobs in the trade, transport, and utility sectors or less COVID-19 cases/deaths. Similarly, the authors of [46] used a logistic regression model to investigate the propensity of commuters to take rail transit during the COVID-19 pandemic, taking into account occupation, commuting tools used before the COVID-19 pandemic, walking time from residence to the nearest subway station, and difference in perceived infection of risk between private cars and public transport. The authors of [47] explored the early-pandemic impact on local trip daily mobility activities, especially with respect to factors influencing changes in travel times and in the modal split across various societal groups in Poland. They used a general linear model (GLM) and observed similar decreases (−66%) across age groups and gender, while the purpose of travel, means of transport, traveler’s household size, fear of coronavirus, main occupation, and life change affected the time reduction. In more detail, the authors of [48] analysed the public transport modal share variations in Poland at both the country and regional levels and discovered that the forced lockdown, rather than the local epidemic status, induced a greater decrease in mobility. Data were obtained from the Google Community Mobility Report, which, with a wide perspective on 131 countries, allowed [49] to compile a global modal transport shares data set, the aim of which was to serve for future analyses of global emissions reductions due to mobility restrictions. Similarly, the authors of [50] presented insights on the effects of the intelligent lockdown on people’s activities and travel behaviors in The Netherlands, as determined through panel data. Their findings highlighted that outdoors activities were approximately reduced by 80%, especially in the elderly age group. Trips and distance traveled also decreased by 55% and 68%, respectively. Active travel round trips (e.g., walking or cycling tours) gained popularity, and people were more likely to use a private car and avoid local public transport (LPT), as testified by 88% of the sample leaving shared and collective modes. The authors of [51] collected and analysed Global Positioning System (GPS) data on changes in average distance traveled by individuals at the county level, COVID-19 infections, and other demographic information in order to estimate how local disease prevalence and mobility restriction orders affected individual mobility in the USA. The findings presented a reduction in mobility by 2.31%, associated with a rise of local infection rate from 0% to 0.003%, while an official stay-at-home restriction reduced mobility by 7.87%. Countries with an older population, lower share of Republicans (2016 presidential election), and higher population density were more responsive. These results are in line with [52], who used travel flows reconstructed from mobile phone trajectories, in order to measure the impact of lockdowns on mobility patterns at both local and national scales. In France, the lockdown caused a 65% reduction in the number of displacements at the national level, which was particularly effective in reducing work-related short-range mobility, especially during rush hours, and recreational long-range trips. Mobility drops across regions differed, depending on the active population, occupation sectors, hospitalizations per region, and socioeconomic level of the region. Major cities largely shrank their pattern of connectivity, reducing it mainly to short-range commuting, despite the persistence of some long-range trips.
2.2.3. Impact of COVID-19 Lockdown on the Economy
While impacts on mobility and the environment were immediately observable, long-term effects on the economy are expected, estimates of which are not easy to determine. The authors of [53] affirmed that the global economy could shrink by up to 1% in 2020 due to the pandemic, and even further if restrictions are not accompanied by adequate fiscal responses. Foreign direct investment (FDI) flows will dramatically flop, while the impact on multinational enterprises (MNEs), local business, and investment will have far-reaching social and economic repercussions. More specifically, focused on the economic–environmental trade-off, the authors of [54] used a global multiregional macroeconomic model to capture direct and indirect spillover effects, in terms of the social, economic, and environmental effects of the pandemic. As the transport and tourism sectors suffered the most, especially in Asia, Europe, and the USA, the world economy was finally hit through ripple effects. This indicates the intrinsic link between socioeconomic and environmental dimensions, as well as revealing the huge challenge of addressing unsustainable global patterns. The authors of [55] used mobility data provided by Facebook to investigate the impact of lockdowns on the economic conditions of individuals and local governments in Italy, modeling the change in mobility as an exogenous shock. Their findings showed that the impact of lockdown, in terms of mobility restrictions, was stronger in municipalities with higher fiscal capacity and presented a segregation effect, as mobility restrictions are stronger in municipalities where inequality is higher and where individuals have lower income per capita. Furthermore, the authors of [56] aimed to estimate the economic consequences of alternative lockdown lifting schemes by leveraging a massive data set of daily movements of individuals in Italy under different scenarios: during the lockdown and in a postlockdown phase. They found that different policy schemes tend to induce heterogeneous distributions of losses at the regional level, depending on mobility restrictions. Another simulation of a lockdown-related adverse economic impact has been provided by [2], who proposed a data-driven dynamic clustering framework based on the intelligent fusion of healthcare and simulated mobility data, validated in the Malaysian context.
3. Reference Scenario
In the following section, a regional-scale analysis around Milan, the capital city of the Lombardy region (Italy), is detailed. According to the aims of the present study, given the mostly urban character of the pandemic, when dealing with transport activities, the cities—as local administrative units (LAUs)—could be considered as a whole together with their commuting zone, including the surrounding travel-to-work areas, in the so-called functional urban region (FUR) or provincial/metropolitan area (NUTS3). Due to its importance, in terms of occupation and high-rank urban functions hosted by the city, in the case considered herein, the regional level (NUTS2) could seem even more appropriate. From the demographic viewpoint, as derived from [57], in 2019, Milan had a population of 1,395,980 at the LAU level and 4,965,808 at the FUR level (about 8.3% of the whole population of Italy), while the Lombardy region (NUTS2) hosted 10,010,833 inhabitants (i.e., about 17% of the Italian population).
Actually, the city of Milan is the second main Italian city by density (after Naples), while its NUTS3 area is the third densest province (after Naples and Monza/Brianza, which is its neighboring province), while Lombardy (NUTS2) is the densest region in Italy. It is no surprise, then, that the province, with its 237,188 cases (as of 27 March 2021), is still the most affected in Italy, while Lombardy itself counted three times the deaths of any other region in Italy. Nevertheless, the first case of COVID-19 in Italy was registered on 21 February 2020 in Lombardy, where the lockdown was first imposed in specific microzones two days after (23 February 2020) and in the whole region on 8 March 2020. The day after (9 March 2020), the ISL began, which lasted until 3 May 2020.
When analyzing the Italian situation, it should be noted that the NO from road transport decreased from 47% to 43% in the period 2009–2018 [11]. Following the approach of the European Union, many Italian cities have adopted measures to achieve sustainable mobility at the urban scale, such as transport policies, land use planning, technological innovations, and campaigns for sensitizing citizens and operators [17,58,59]. The final aim of all these measures (i.e., to reduce the number and length of motorized trips) is actually a difficult task due to the high Italian motorization rate (646 passenger cars per 1000 inhabitants) in Europe (second only to Luxembourg in 2018 [60]), and more than 39 million cars overall [61]. In particular, Milan is characterized by a population density of about 7700 inhabitants/km and a motorization level of about 480 cars per 1000 inhabitants [62]. Hence, Milan has a population density much larger than other main European cities, such as Berlin (about 3900 inhabitants/km), Paris (about 2600 inhabitants/km), and Madrid (about 5200 inhabitants/km) [63]; however, its motorization level is much larger than that of Berlin (316 cars per 1000 inhabitants) but similar to that of Paris (464 cars per 1000 inhabitants) and Madrid (517 cars per 1000 inhabitants) [63].
This mobility information indicates Milan as one of the most polluted places in Europe. Focusing on NO, in 2019, it presented the highest yearly average of NO (58 g/m), with 5 h (third value in Italy, after Turin and Naples) of passing the alert level (40 g/m) [62]. Conversely, Milan is one of Italy’s cleanest cities, in terms of vehicles. Not only is the average NO level for vehicles (0.425 g/km) one of the lowest for the major Italian cities, but also the composition of the car fleet shows a high percentage of less-polluting vehicles, such hybrid and electric (Euro 6), or those provided with a diesel particulate filter (Euro 5). The same percentage applies to motor vehicles [64].
Finally, concerning the LPT fleet, the Milan Transport Company, Azienda Trasporti Milanesi (ATM), has adopted a full electric plan, according to which, in 2030, the whole bus fleet (1,200) will go electric. In 2020, it already included 26% of hybrid and 17% electric buses; furthermore, the city, since 2020, has sworn to buy only electric buses. This is in line with the efforts of Milan to achieve sustainable mobility. Following the Sustainable Urban Mobility Plan (SUMP) approved in 2018 [61], with the so-called Strade Aperte plan, Milan is to reallocate street space from cars (35 km of streets) to cycling and walking, in order to fend off a resurgence in car use by citizens willing to avoid busy LPT after the pandemic. Moreover, being one of the most polluted cities across Europe and hard hit by the pandemic, Milan has been considered as a roadmap for other bigger cities, such as New York or Bogota [63].
4. Results
This section analyzes the case study region with reference to the ISL. NO air pollution is measured using different freely available sources (Section 4.1), contrasted with mobility and economic changes (Section 4.2).
4.1. NO Pollution
In this subsection, we analyze NO air pollution during the ISL. NO is a short-lived pollutant that, once emitted, generally resides in the atmosphere for less than one day; therefore, it remains close to its emission source. Most of the NO emissions at the Earth’s surface are due to anthropogenic activities, such as agriculture, energy production, residential heating, industries, use of pollutant vehicles, and so on; thus, it varies significantly over the year. However, NO emissions also indirectly depend on the weather; for example, colder days may trigger larger residential heating and energy demand. The weather also affects the surface NO concentration, as winds and vertical mixing may promote (or not) accumulation conditions close to the sources and high concentrations at the surface. As a result of those variabilities, strong daily variations at hourly timescales characterize NO emissions. Due to their adverse impact on climate and human health, NO emissions, as well as those associated to other pollutants, have been regulated worldwide [65,66]. In the European Union (EU), the allowed annual average NO column is 40 g/m, while the limit value (fixed to 200 g/m) can be exceeded no more than 1 h per day and 18 times per year. In addition, one of the goals of the European Union is to achieve a 30% NO emissions reduction by 2030.
Typical sources of data are satellite TROPOMI measurements, ground-based stations, regional air quality analyses, and forecast simulation models. Special emphasis has been paid to freely available data, with respect to the area of interest. Satellite data have been used in many air quality applications (see, e.g., [67]), thanks to their beneficial spatial coverage, as compared to sparse ground measurements. Although satellite data do not provide noise-level concentrations, they can perform high-quality measurements that are useful to estimate the trend and variations of pollutants. Nevertheless, it must be noted that TROPOMI NO column data are different from NO concentrations at ground level, which have been related to potentially harmful effects on human health.
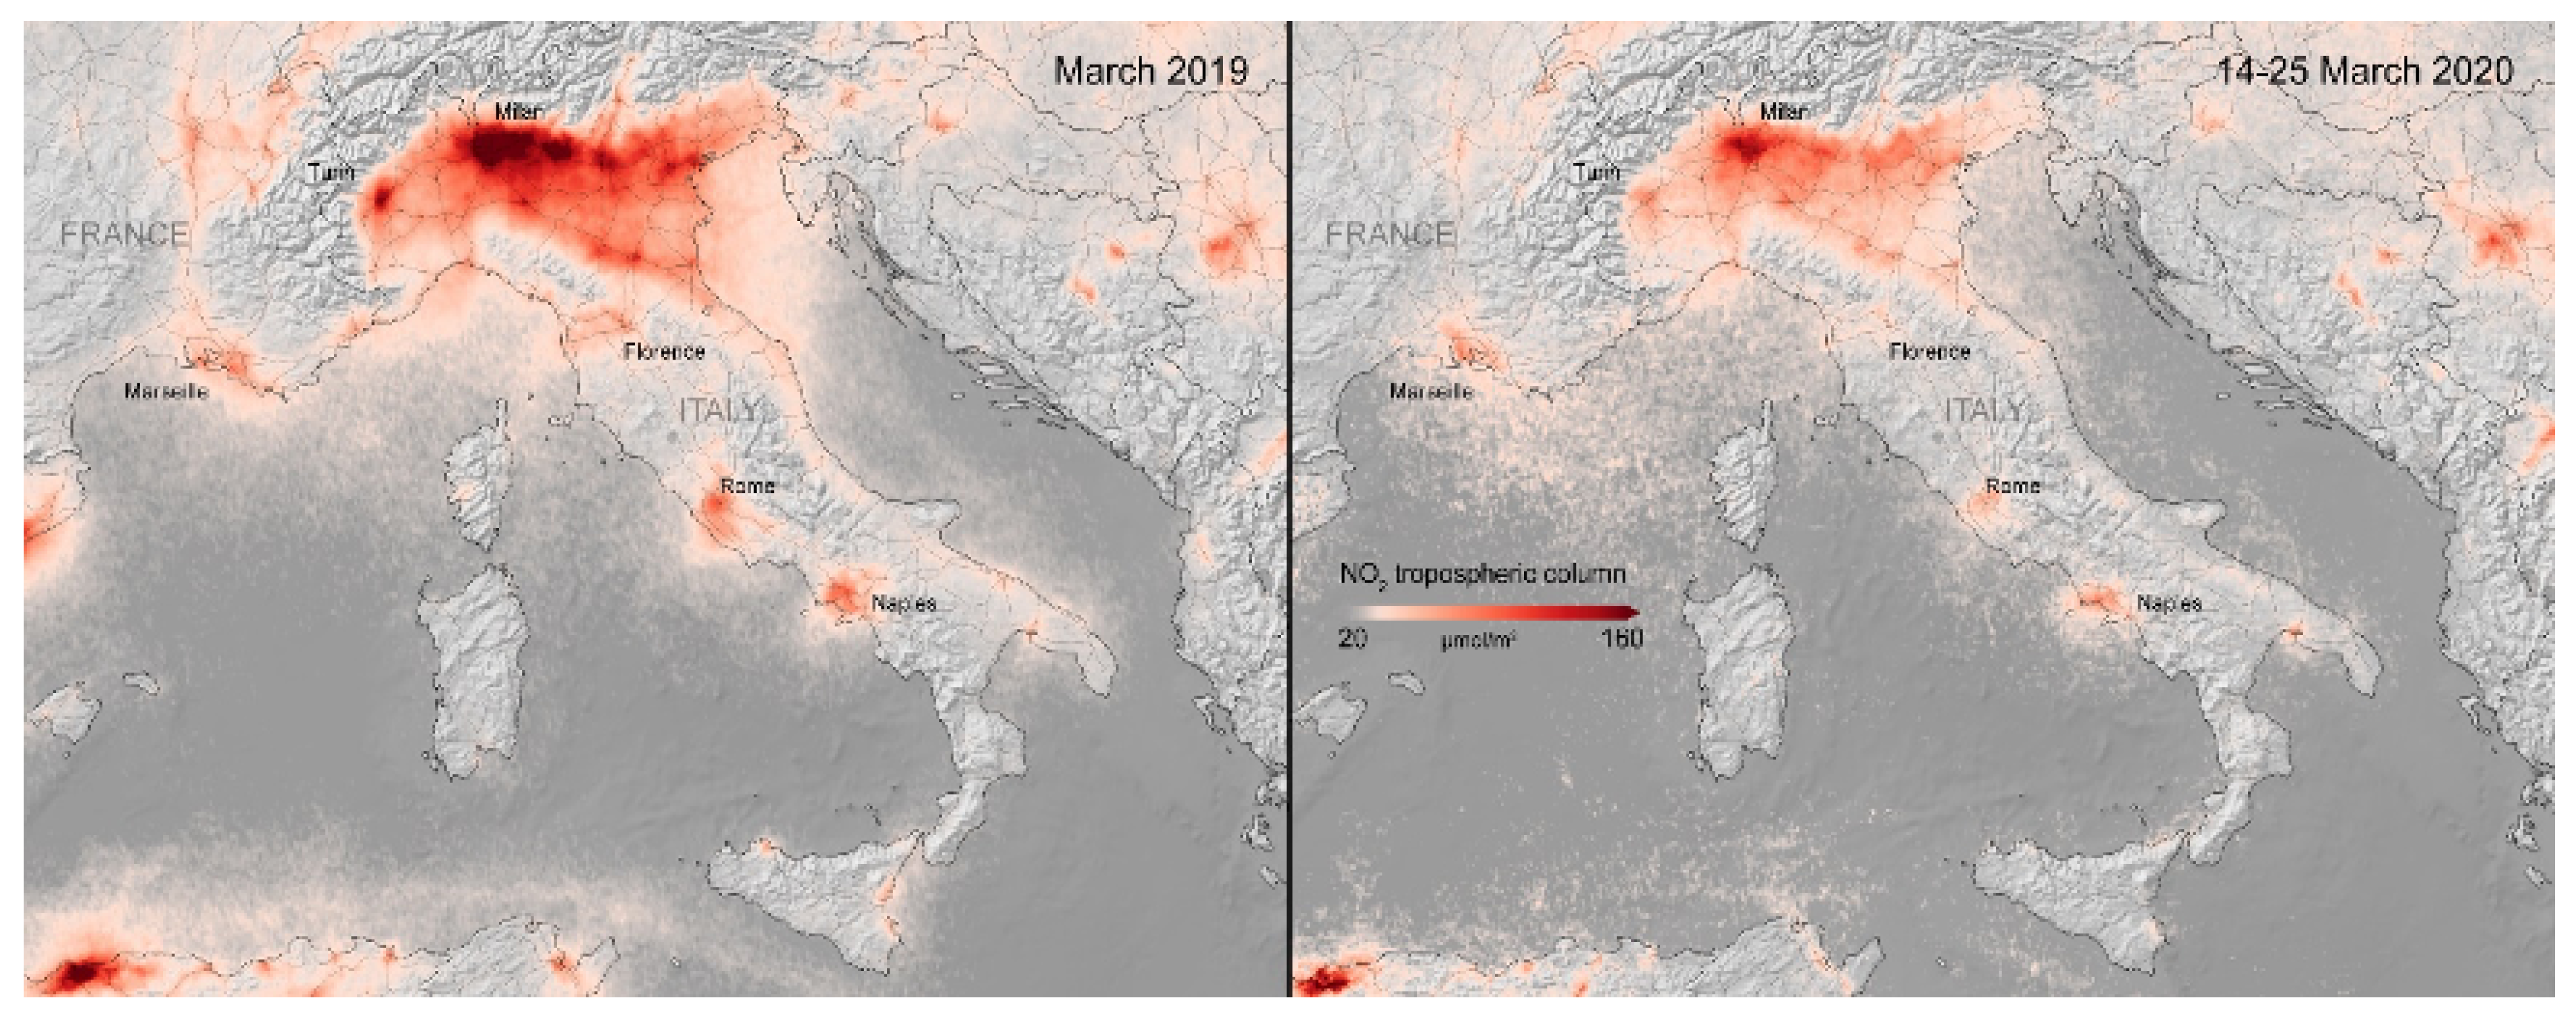
The estimate of NO supported by European Space Agency (ESA) Sentinel-5P TROPOMI satellite observations, as analysed in [68], are first presented. Our first analysis is focused on the comparison between NO tropospheric vertical column concentrations evaluated during the first two weeks after the lockdown declaration, with respect to the same period in 2019 [68]. More technical details about the TROPOMI NO products can be found in [69,70]. The results are shown in Figure 1, where the reduction can be clearly noted. A quantitative comparison over the main cities was also performed, whose results are listed in Table 1. The observed reduction ranged between about 30% and 60%. A lower emissions reduction was found over Naples (from 120 mol/m down to 85 mol/m), while the most significant emissions reduction was found over Florence (from 80 mol/m down to 30 mol/m). It is also interesting to notice that those cities, even during the ISL, exhibited NO emission values much larger that the limit imposed by European regulation, except for Florence.
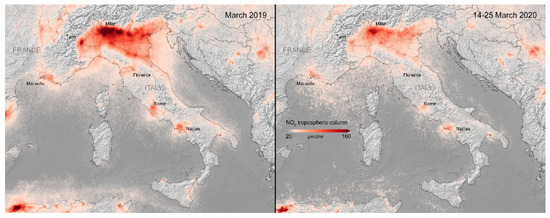
Figure 1.
2020 versus 2019 TROPOMI NO columns, evaluated over Italy during the first two weeks of the ISL. Source: [68].

Table 1.
TROPOMI NO concentration in the major Italian cities in March 2019 and during the first two weeks of the ISL.
With respect to the use of TROPOMI NO pollution data over Italy, it is important to refer to the study detailed in [69], where a temporal analysis of the NO emissions was proposed. The authors used TROPOMI near cloud-free (cloud coverage below 40%) 0.05× 0.05 gridded NO column emissions obtained from the near real-time operational products (Copernicus open data access hub, https://s5phub.copernicus.eu, accessed on 27 July 2021) [71,72] and removed systematic error by comparing 2020 data with the previous year, in order to determine yearly return patterns and the photochemically induced seasonal variability, while they reduced single-pixel uncertainties by applying temporal (14-day) and spatial (7,500 km) averaging. Four reference periods were considered: 15–22 February, 23–29 February, 1–7 March, and 8 March–12 April, all in 2020. It was shown that, during the first period, the NO pollution was more relevant, in terms of extent and intensity. The largest and most NO-polluted areas were those located in the northern part of Italy (i.e., the Po Valley), and were in correspondence with the cities of Florence, Rome, and Naples. In the following three periods, there was a reduction in the NO pollution, in terms of both intensity and extent, where the lowest values were obtained in the last period. The authors also carried out a comparison with analogous time periods for 2019. Comparison between the 2019 and 2020 periods demonstrated that the NO pollution extent and intensity were always larger than the corresponding values in 2020; however, the reduction was less remarkable for the first period. With reference to the main city of the Po Valley—Milan—the average NO column during the lockdown period was found to be between 38% lower than during the same period in 2019, where the uncertainty associated to this estimate was lower than 9.5%.
It must be noted, however, that interannual comparison can be tricky, as changes in NO column values over short timescales cannot be directly associated to changes in emissions, due to the effects of different meteorological conditions [73,74]. In fact, in [75], it was underlined that the March 2020 NO concentrations likely decreased during ISL, even though the 2020 winter season, which was the warmest ever recorded in Europe, had a boosted general NO emissions decrease, in comparison to the winter of 2019.
In [76], the average TROPOMI column and in situ surface NO concentrations (using a 14-day moving average) were evaluated over Milan and the Po Valley, comparing the 2019 and 2020 spring seasons. A large degree of correlation between the two types of NO measurements was found. In [75,77,78], it was shown that, although the temporal variability on the ground and along the vertical tropospheric column were different, a good correlation was found, especially for the Po Valley. This is due to the fact that the Po Valley is characterized by pollution trapping (especially during winter), related to intense anthropogenic activities and to orographic conditions, which can determine unfavourable local weather conditions [75].
In summary, it can be stated that the general reduction in NO pollution during the 2020 winter was also clearly seen at ground stations and, therefore, was not an artifact of satellite data. Ground station data are freely provided by the Lombardy ARPA, through an open data portal available to users [79].
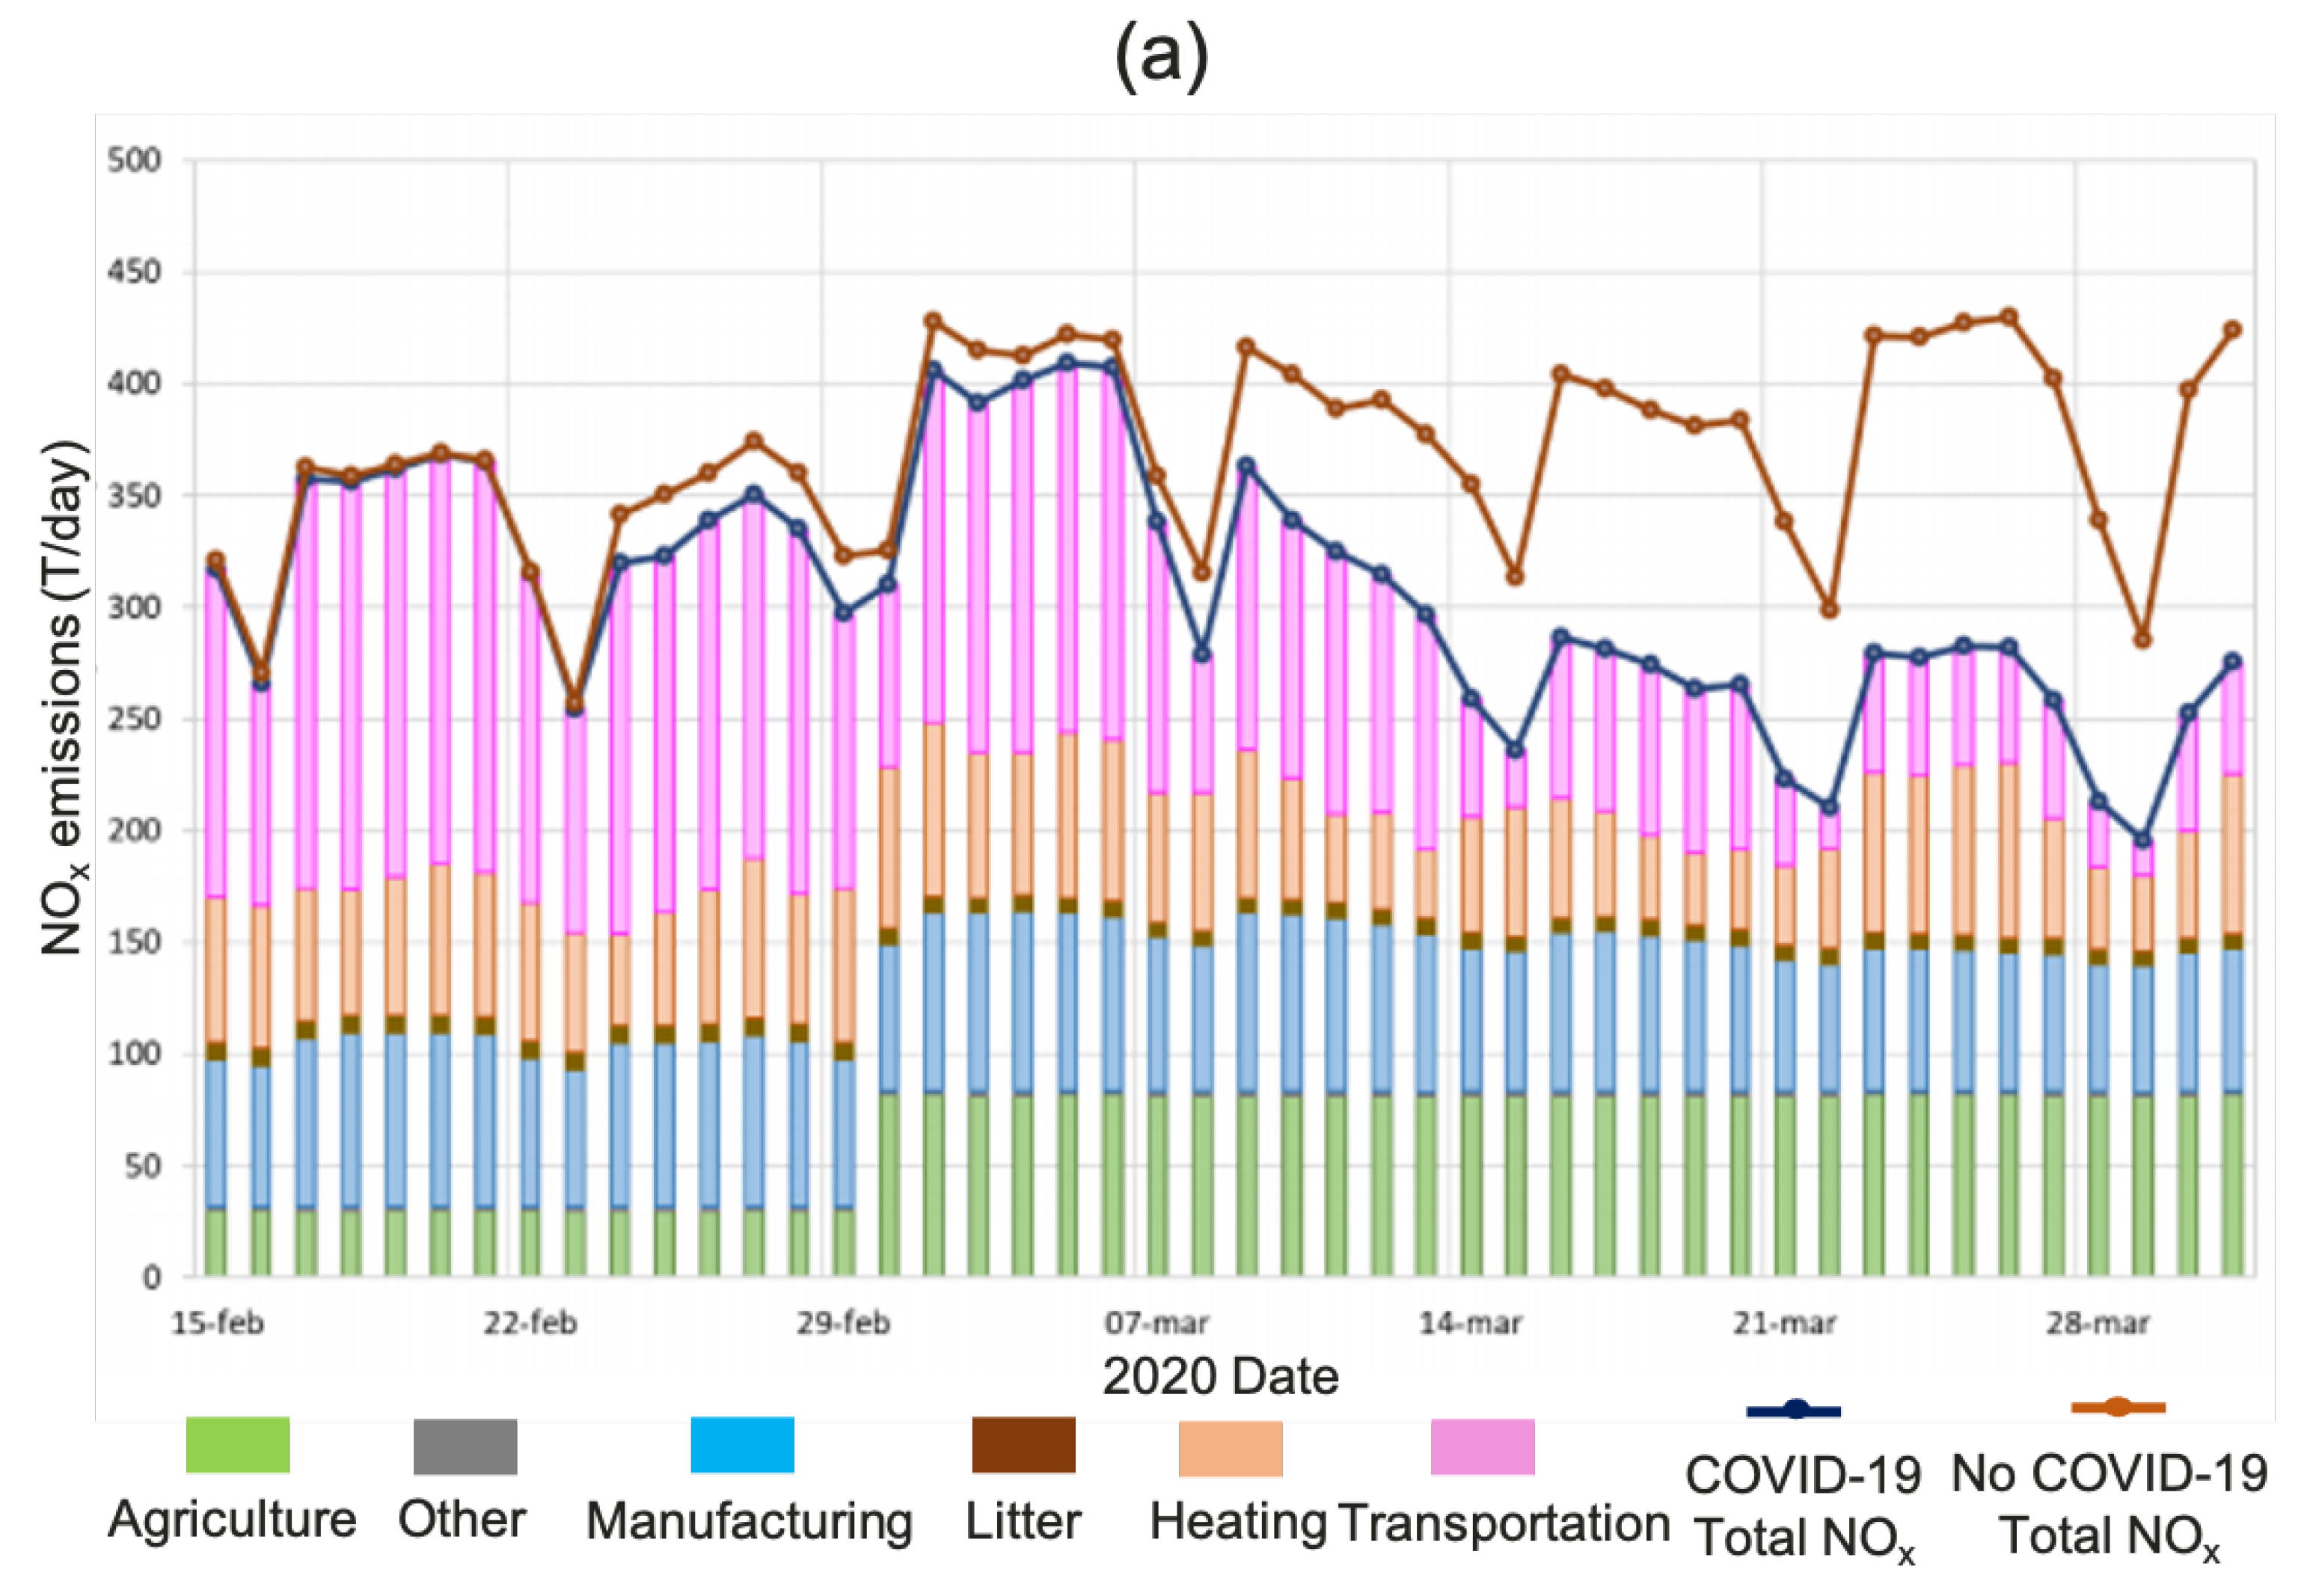
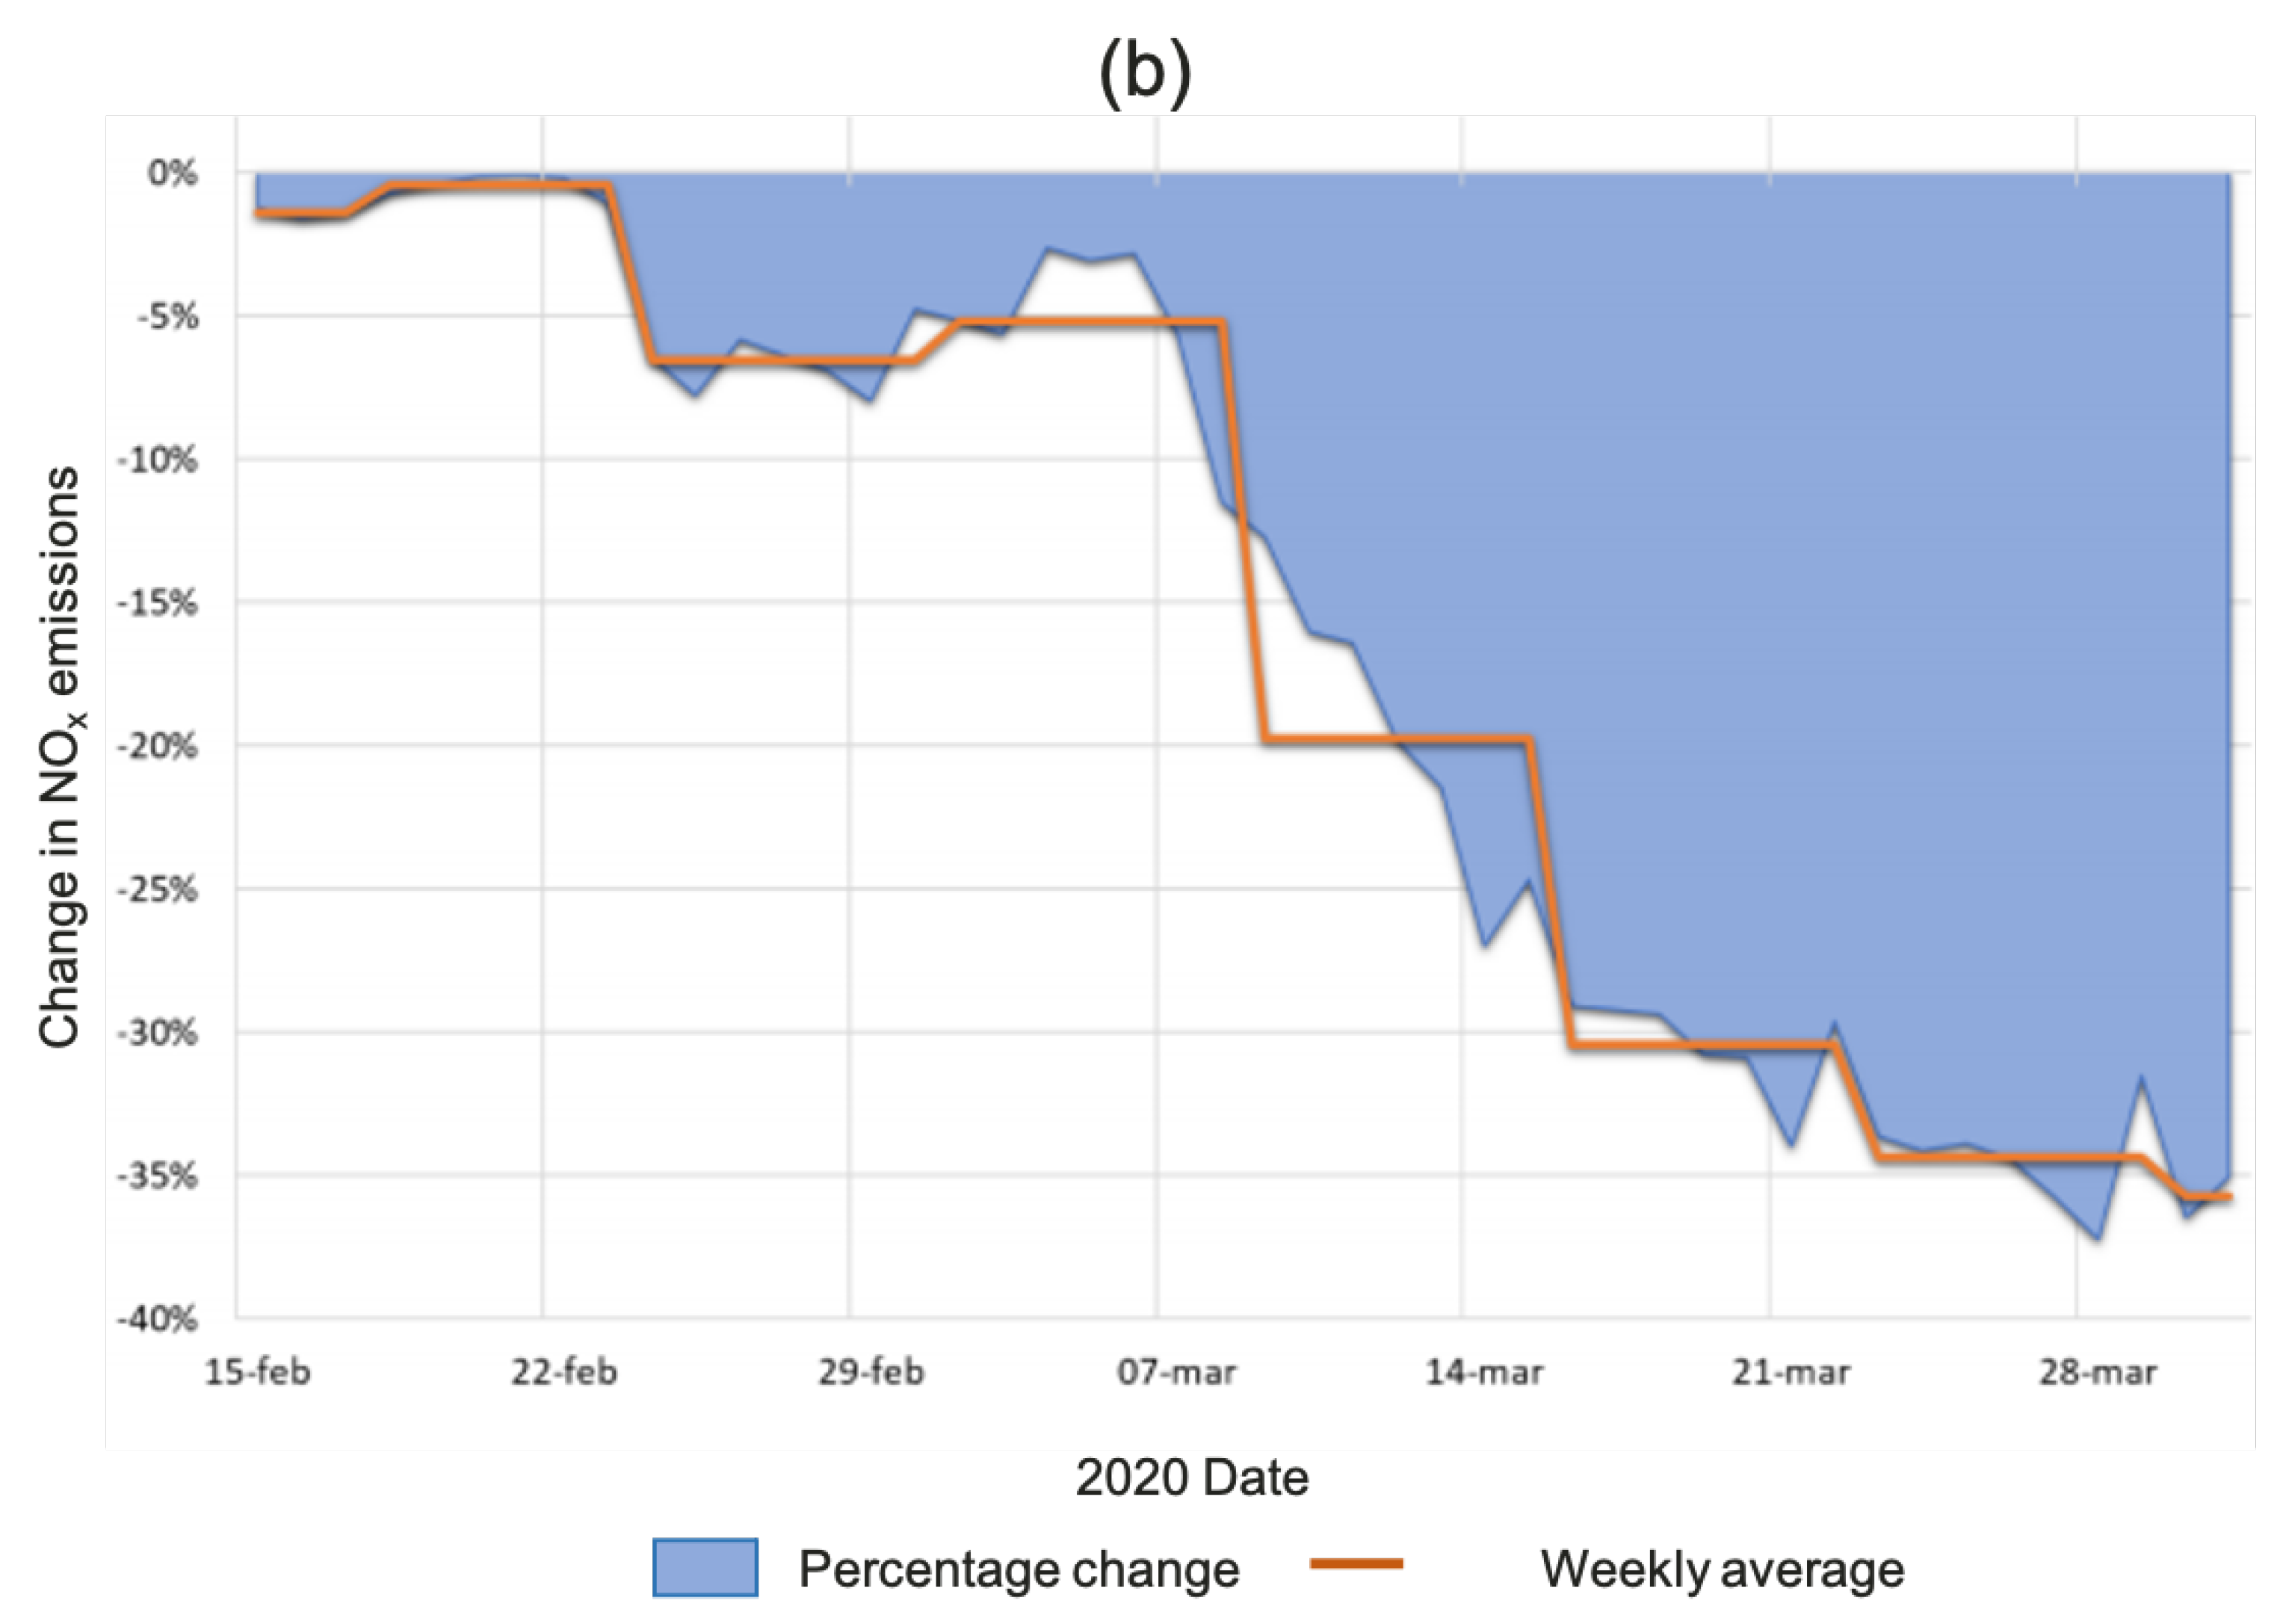
In the Lombardy region within the Po Valley, the 2020 emissions were analysed, based on regional databases, according to the different pollutants and pollutant sources in [79]. The results are shown in Figure 2a, where reference is made to 2017 levels, against which 2020 emissions were evaluated, according to a linear relationship between the activity of the pollutant source and its emissions. The latter were normalised with respect to a baseline emission scenario during the same period, but without lockdown restrictions, in order to evaluate the change rate. It was found that, during the ISL period of 9–29 March 2020, there was an increased weekly reduction of NO emissions, with a reduction of −28% overall (see Figure 2b). In particular, limited daily reductions of NO emissions were found before the nationwide lockdown declaration (i.e., lower than 10% from 15 February to 7 March 2020). The reduction increased up to 30% during the first nationwide lockdown week, with a more than 30% reduction observed in the second half of March. Among all the identified key sources of NO emissions, including manufacturing processes, industrial and nonindustrial combustion, and use of solvents, the lockdown-induced limitations on road transport contributed the most (60%; see Figure 2a). During the first week, a 43% reduction of NO emissions due to road transport was observed, which significantly increased to 63% and 74% during the second and third weeks, respectively.
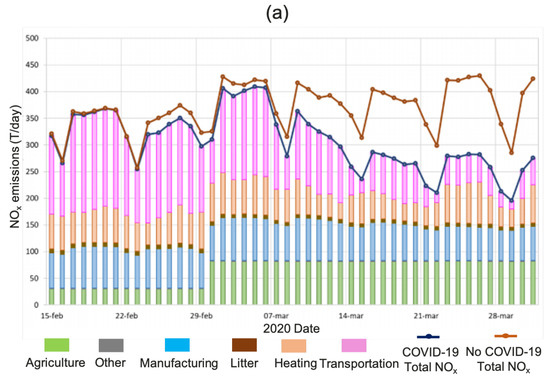
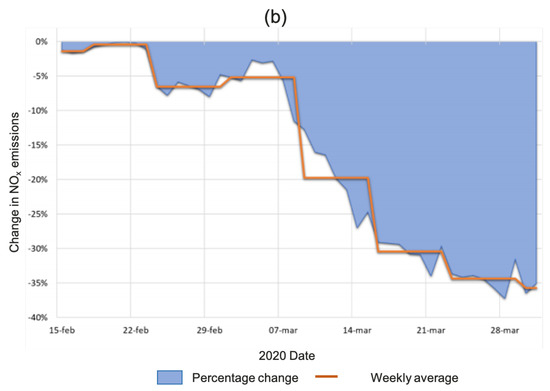
Figure 2.
Daily NO emissions in Lombardy region: (a) daily values per source; and (b) change rate. Adapted from [79].
Air quality can be also estimated by advanced numerical models assimilating satellite and ground-based observations. A freely available European service is the Copernicus Atmosphere Monitoring Service (CAMS).
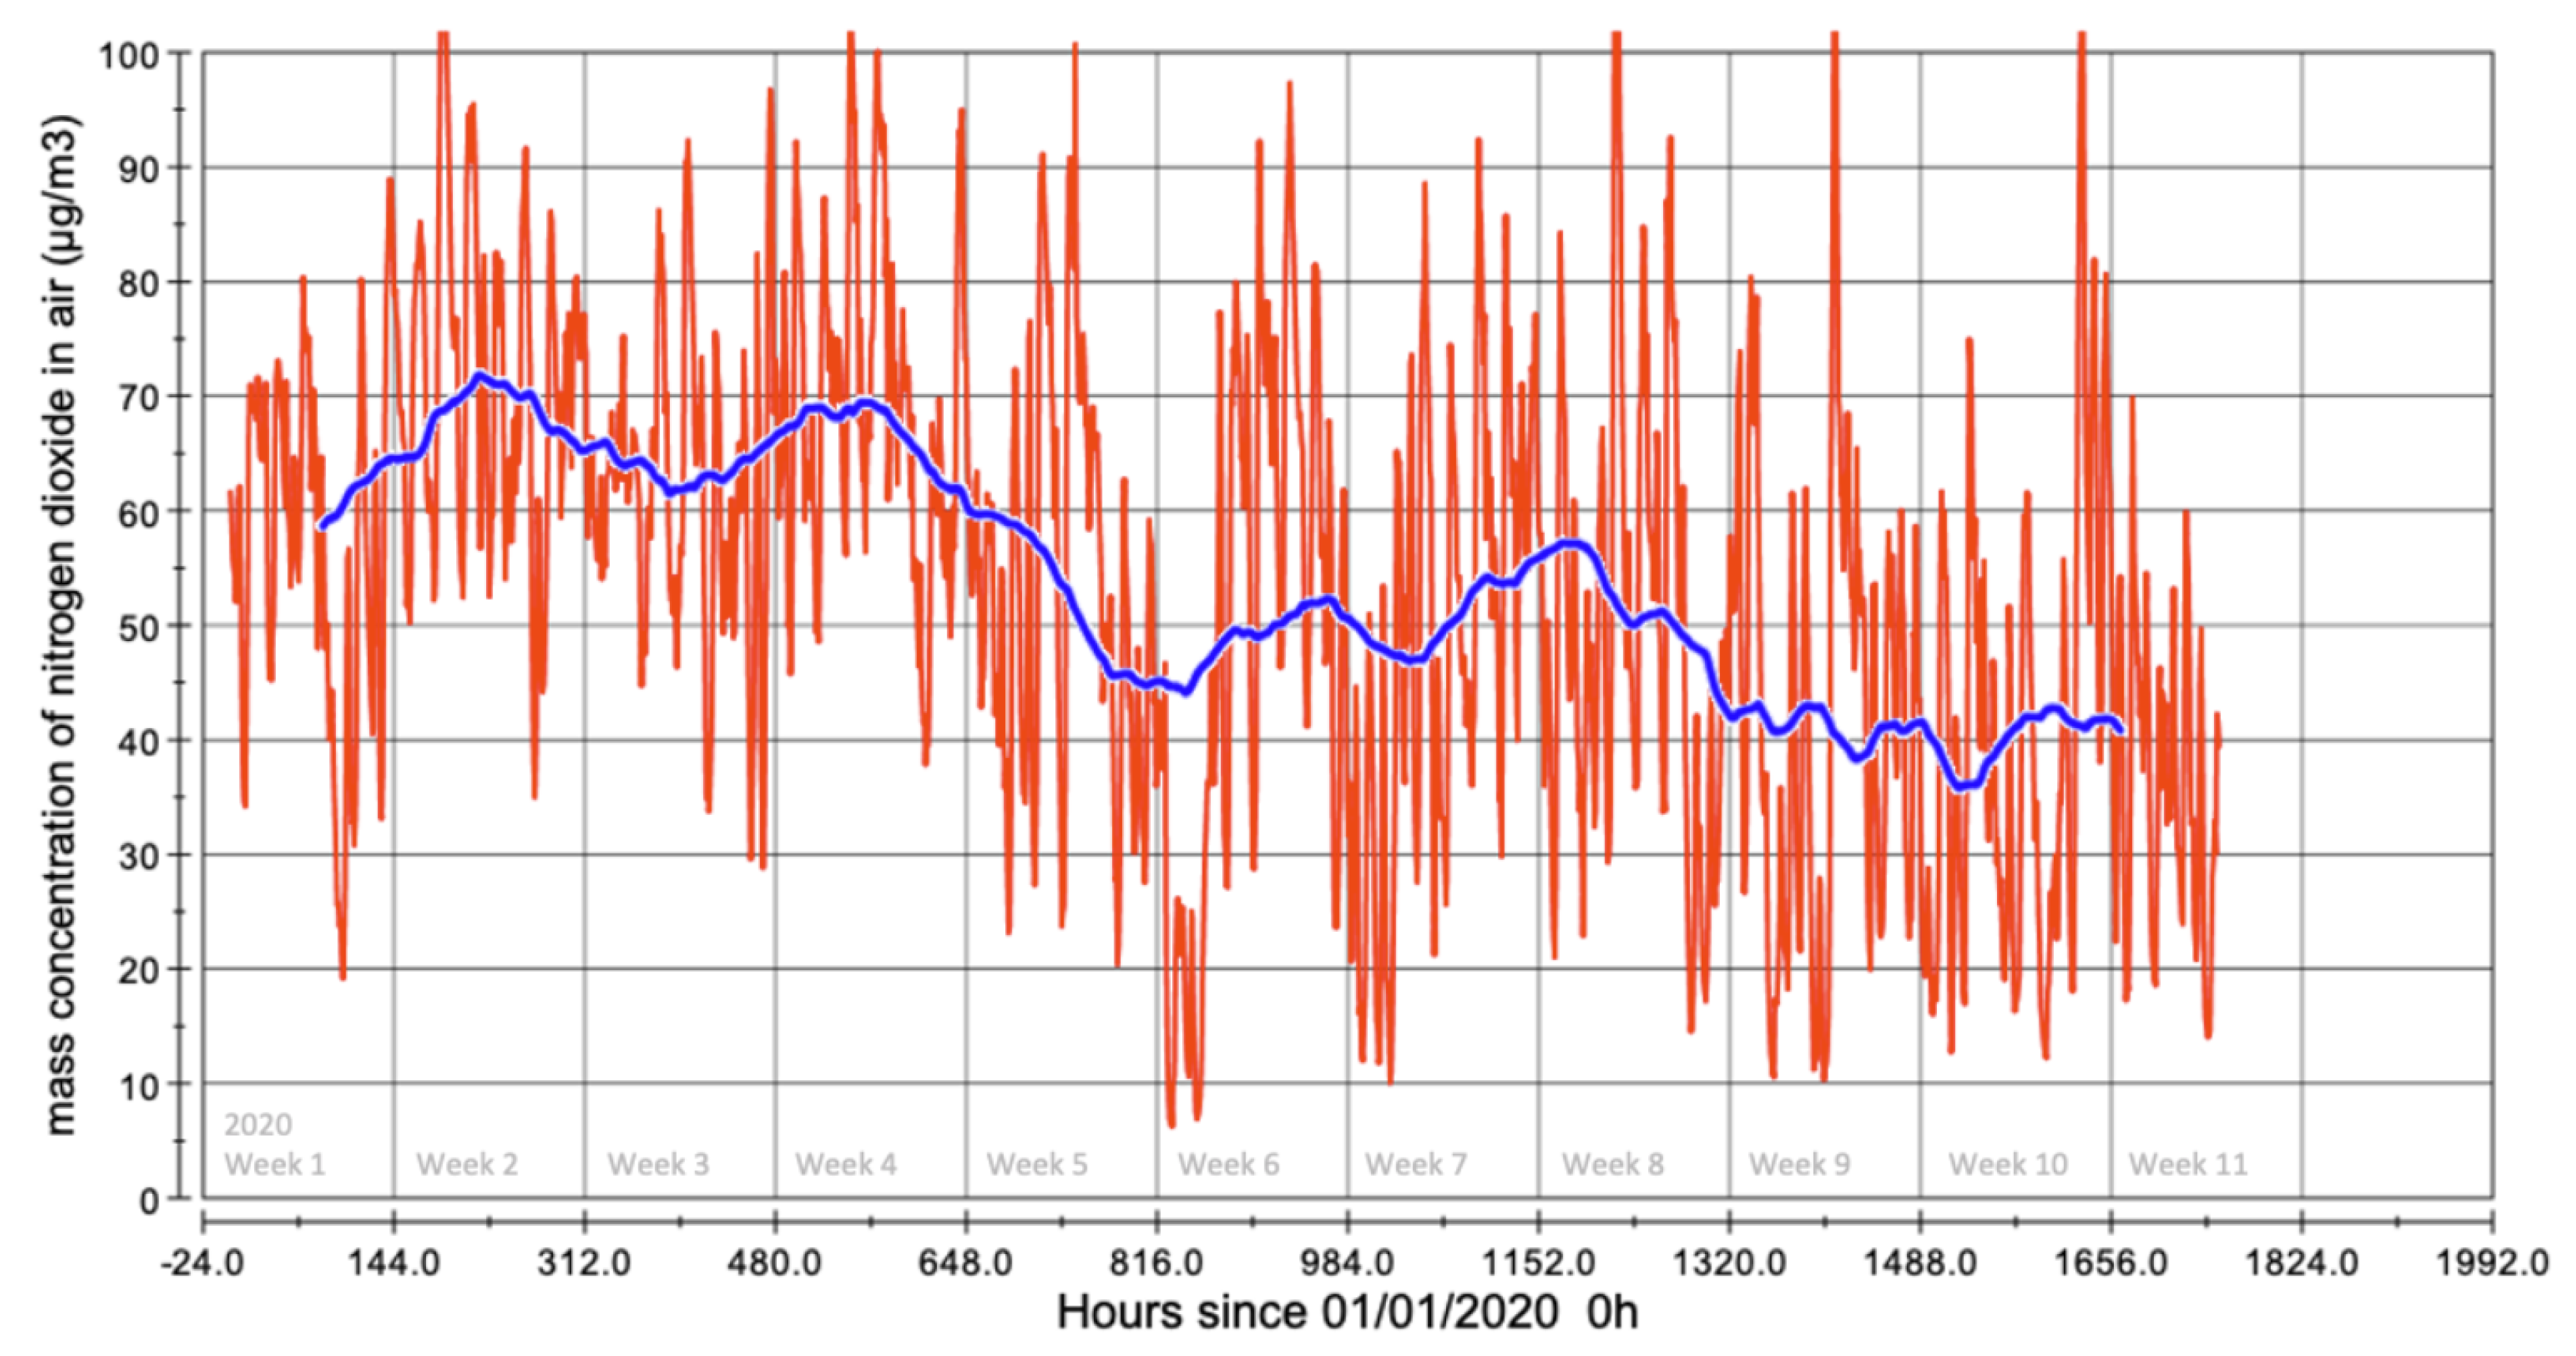
Figure 3 shows the hourly (red) and one-week running average (blue) time series of surface NO concentration, evaluated over Milan during the first 11 weeks of 2020. While no clear trend is visible over the first five weeks of the year, starting in the sixth week, a decreasing trend can be seen (after a short period of low values, likely due to weather conditions) [80]. It can be observed that, in January and February 2020, the average NO emissions over Milan were well above the EU annual average limit (i.e., 65 g/m and 50 g/m, respectively) while, as the effects of the lockdown restrictions included the closure of many industrial and commercial activities, as well as the consequent traffic reductions, a linear decreasing trend in NO emissions was observed after the local lockdown declaration (23 February 2020; week 7), with a rate of −4 g/m per week, that allowed for a decrease in NO emissions, for the first time, below the EU limit value during the first half of March [80]. These results can be partly explained by the outcomes proposed in [81], where the authors observed that Milan experienced, on average, the largest mobility reduction with respect to 2019 (i.e., about 25%).
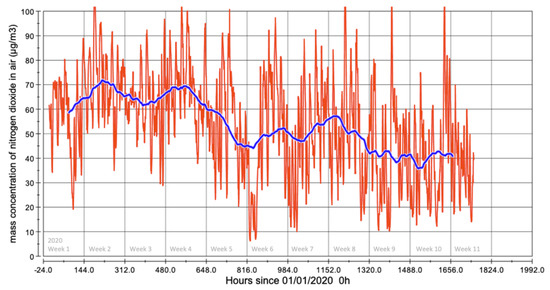
Figure 3.
Hourly (red) and one-week running average (blue) time series of surface NO concentration over the Milan urban area during the first 11 weeks of 2020. Source: [80].
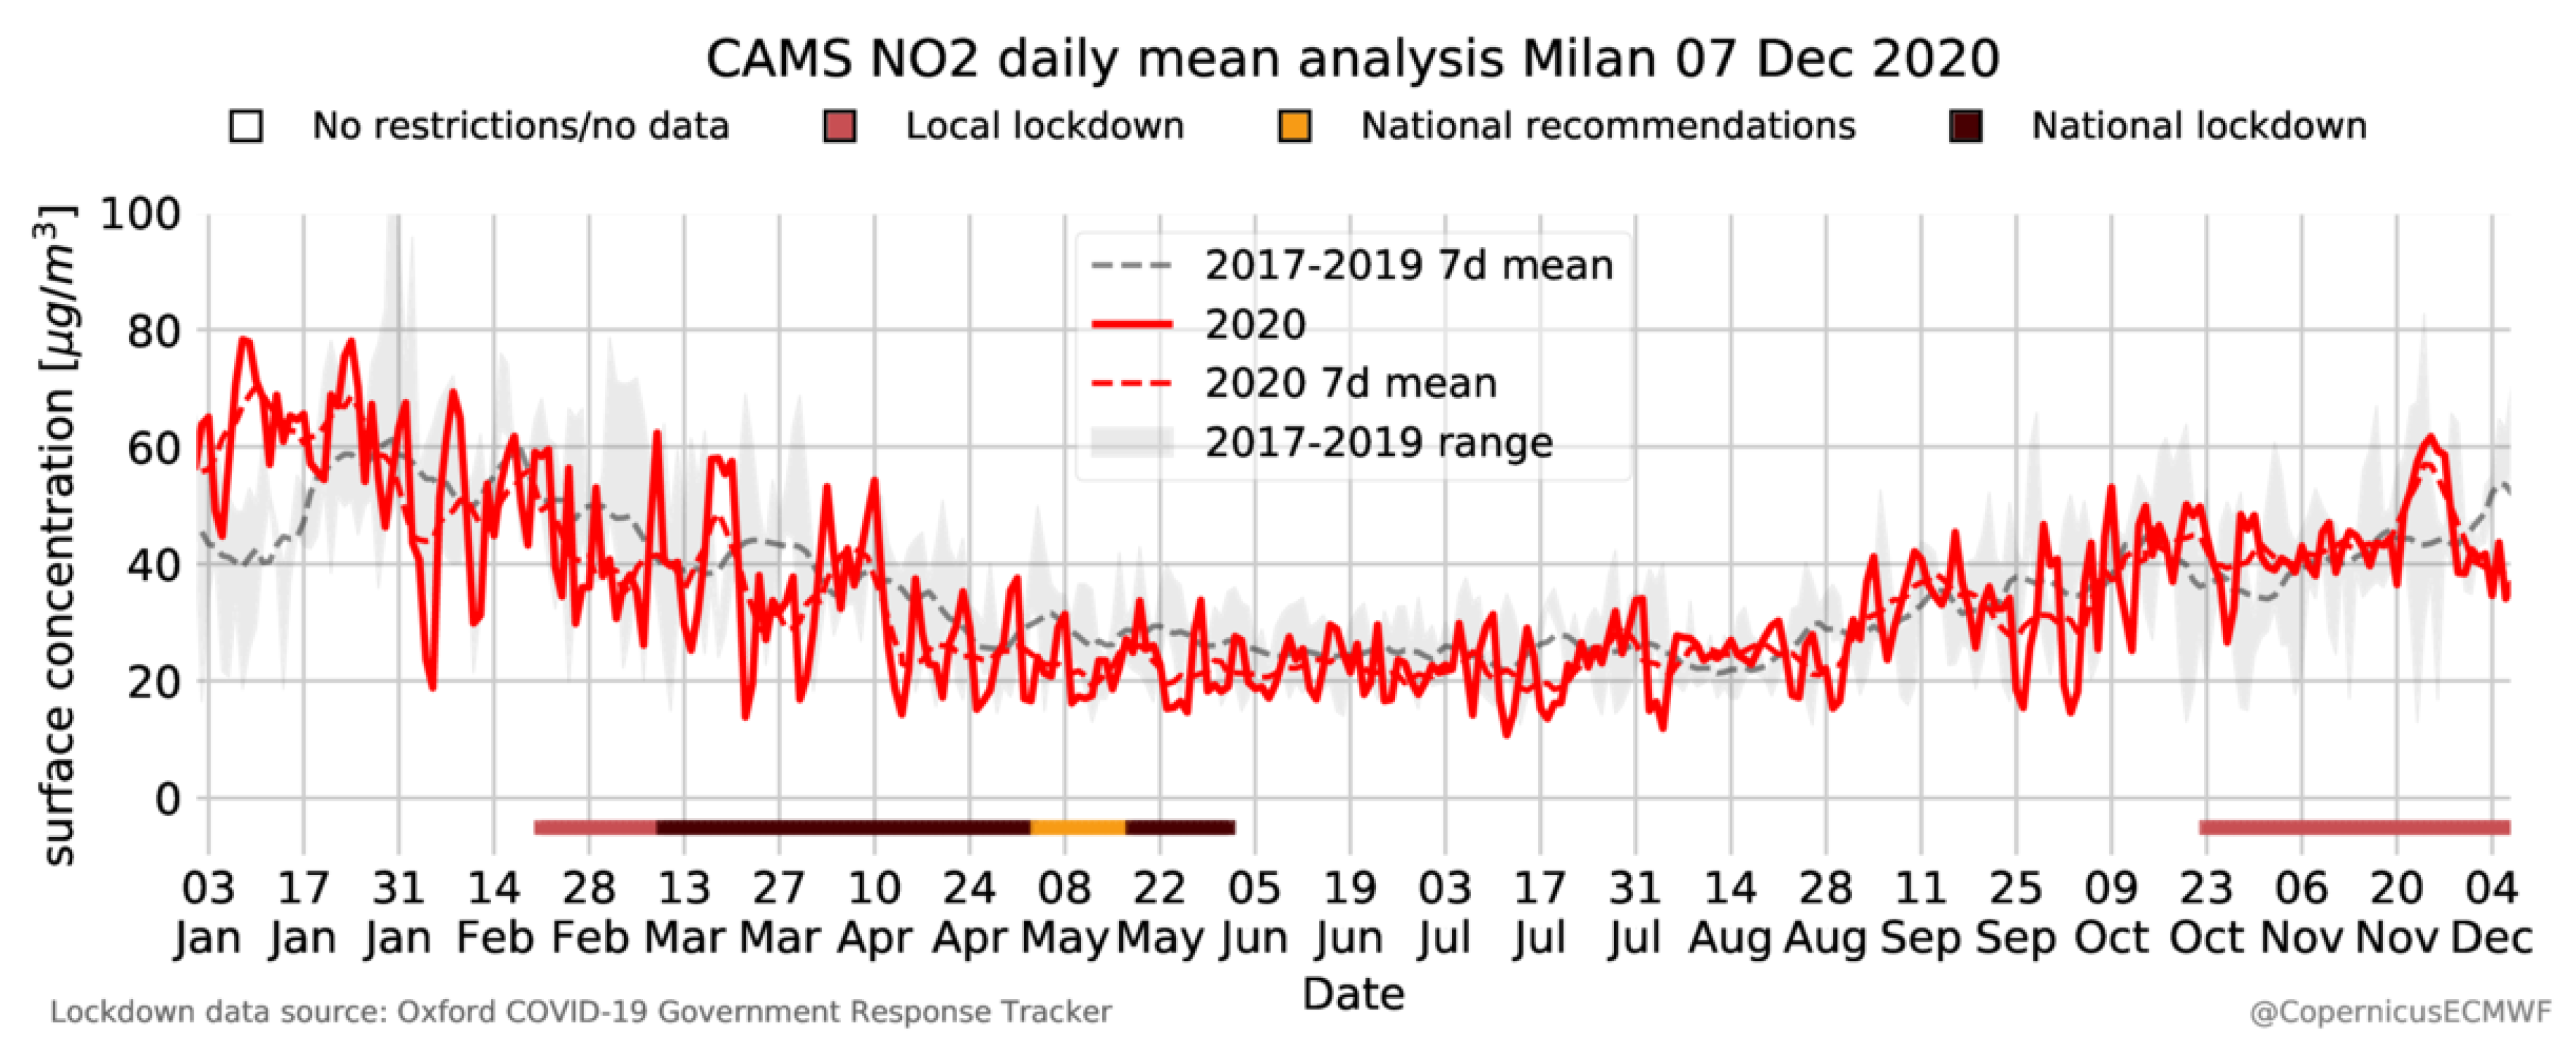
A similar trend was found in [82] (see Figure 4). The continuous and dashed red plots refer to the 2020 and 2020 seven-day average trends, respectively, while gray and dashed gray plots refer to the 2017–2019 range and 2017–2019 seven-day average trends, respectively. The periods relevant to the local and nationwide Italian lockdown are also annotated. Before the local lockdown, the daily average NO emissions were at least at the same levels of previous years (2017–2019 range). Together with the seasonal reduction of NO emissions, already visible during the 2017–2019 period, a further decrease can be observed after the local lockdown and, more significantly, after the ISL declaration, with surface NO concentration decreasing to less than 20 g/m. Even in this case, interannual differences were not only due to different emission scenarios.
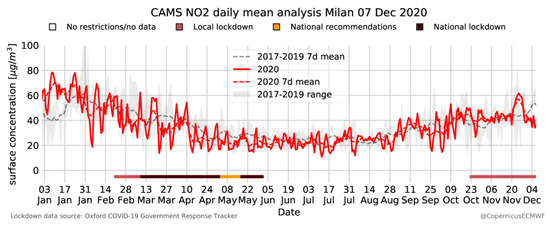
Figure 4.
Time series of daily average surface NO concentration over Milan. Source: [82].
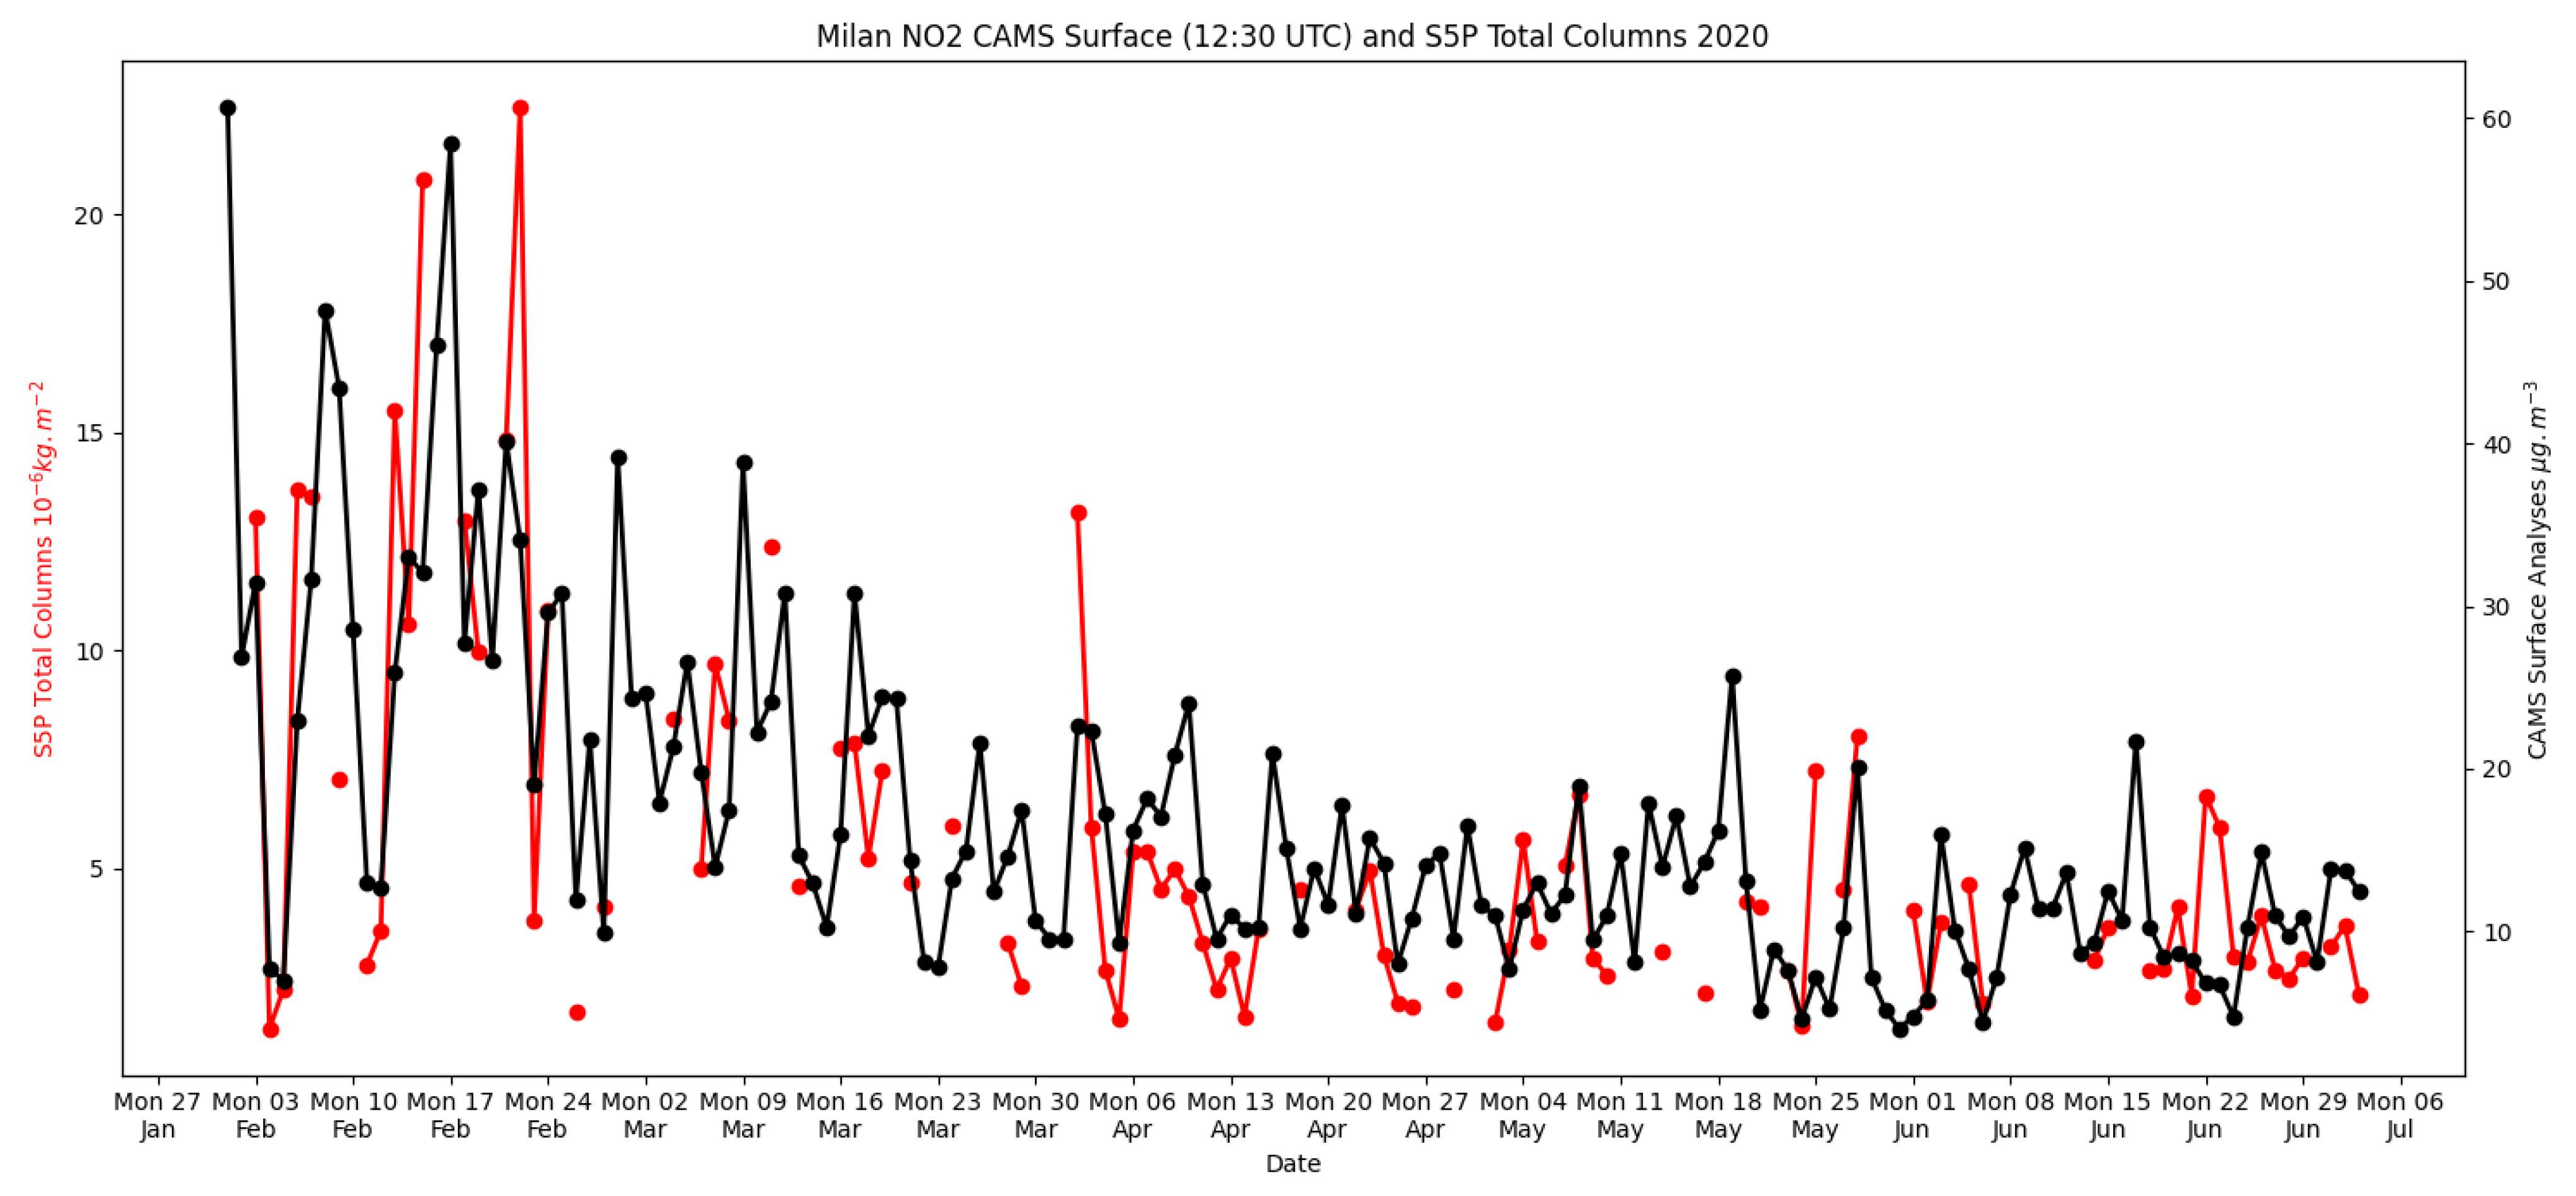
A comparative analysis between CAMS-derived surface and TROPOMI total tropospheric column NO emission levels was provided in [82]. The trend observed over the Milan urban area during the ISL is shown in Figure 5, where the red and black plots refer to the former and latter observables, respectively. Gaps in the TROPOMI observable are due to data with insufficient quality. It can be noted that, even though the two kinds of emission observables were different and independent, a high degree of correlation was observed. On average, larger emissions levels were observed before the beginning of lockdown restrictions (i.e., 10 × 10 kg/m and 30 g/m for TROPOMI total column and CAMS surface emissions, respectively, during the period 3 February–9 March 2020), which remarkably dropped due to the lockdown restrictions declared on 10 March 2020 (i.e., less than 5 × 10 kg/m and 15 g/m for TROPOMI total column and CAMS surface emissions, respectively, until the end of June 2020).
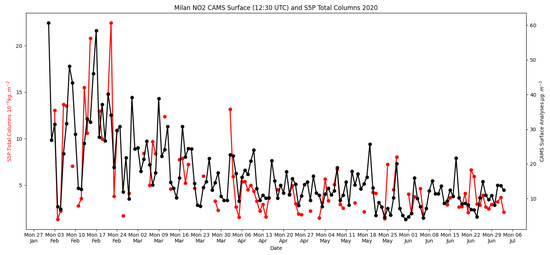
Figure 5.
Surface CAMS regional analysis versus total column TROPOMI NO emission levels over the Milan urban area. Source: [82].
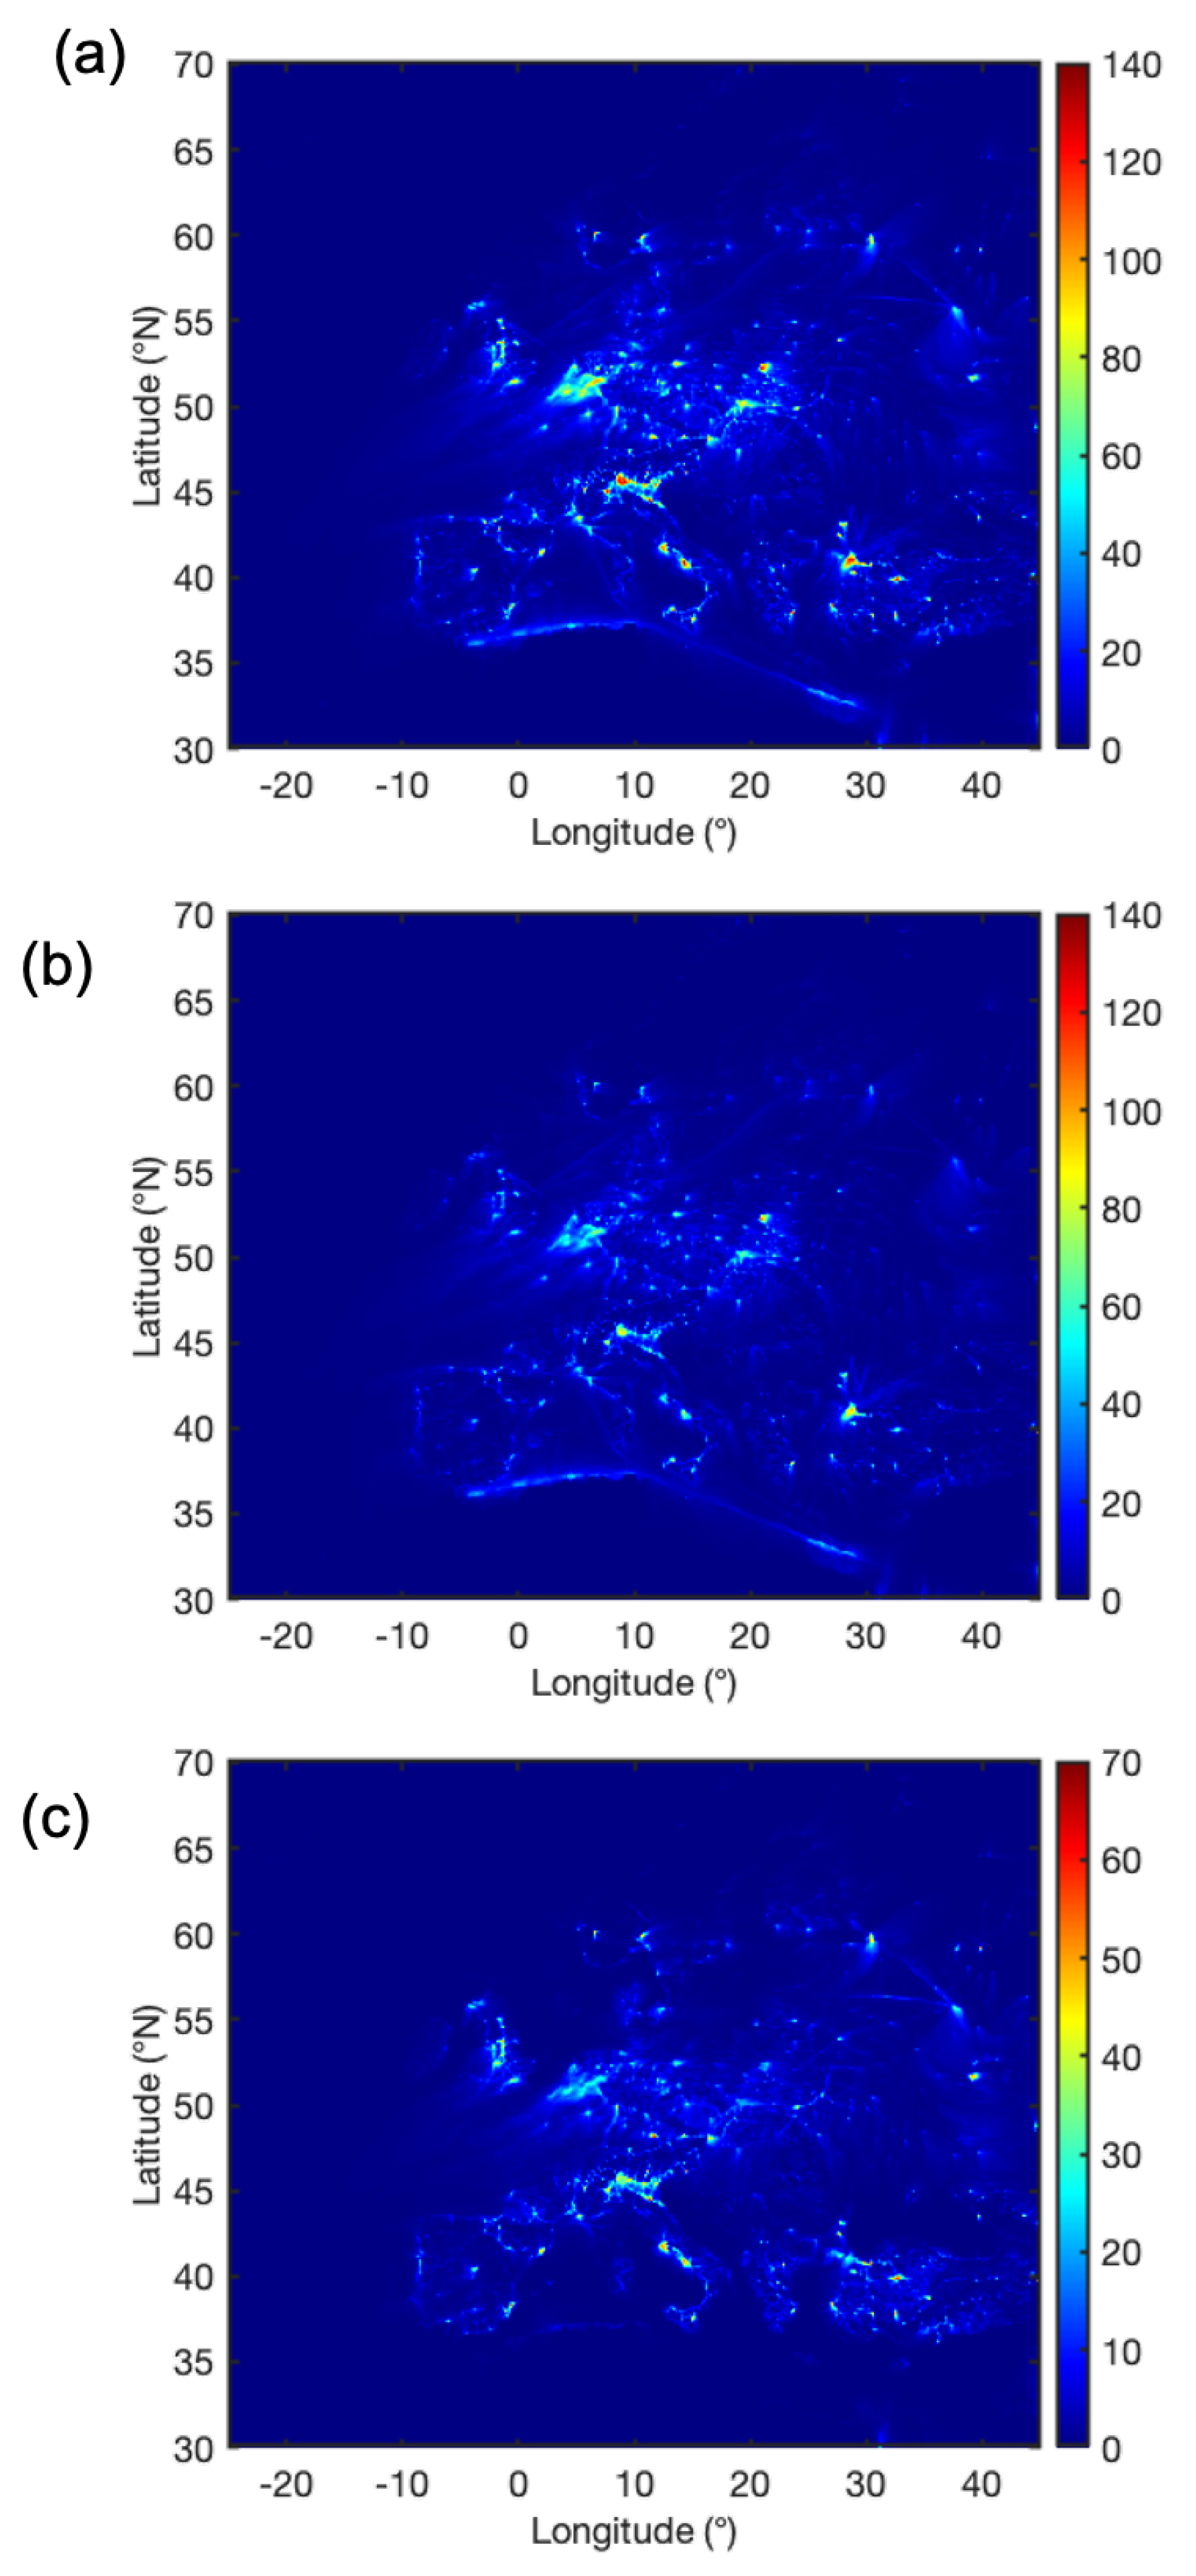
The CAMS service also provides forecast emission scenarios for regional air quality analyses. In this way, the relative influences of changing emissions and weather on the NO concentration can be removed when running the CHIMERE model with different sets of emissions (i.e., one with reference standard emissions and one with lockdown emissions), which were derived from country- and sector-dependent reduction factors provided by the Barcelona Supercomputing Center (BSC) [82]. As all the other parameters of the runs (e.g., weather) remain the same, by calculating the difference between the two emission scenarios, it can be seen how the change in emissions affected the surface NO concentrations.
The results are shown in Figure 6. In Figure 6a, the reference emissions scenario provided by the CHIMERE model for 31 March 2020 is shown, where no lockdown restrictions were applied. Such results indicate that the largest surface NO values (i.e., >80 g/m) were found in Italy (Po Valley, including Milan, Rome, and Naples), Turkey (Istanbul and Ankara), Germany (Berlin and Ruhr region), Poland (Warsaw and Krakow), and midsouthern England (Birmingham). Overall, in 0.16% of the considered area (corresponding to about 53,600 km), the surface NO emissions exceeded 80 g/m (i.e., they more than doubled the EU annual average emissions limit).
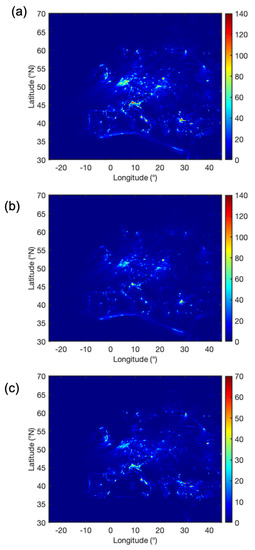
Figure 6.
Surface NO (g/m) CAMS simulations run for 31 March 2020 over Europe: (a) reference emissions scenario, (b) lockdown emissions scenario, and (c) difference.
Conversely, in Figure 6b, the lockdown emissions scenario for the same day is considered, leading to surface NO values much lower than those observed in Figure 6a. Nonetheless, it can be clearly noted that Figure 6b is not simply a rescaled version of Figure 6a, but that the different national lockdown restrictions had a different impact on the surface NO emissions. In this CHIMERE lockdown scenario, most of the regions characterized by emissions larger than 80 g/m in the reference scenario call for significantly lower values. As a result, just 0.02% of the considered area (i.e., about 6900 km) was responsible for surface NO emissions larger than 80 g/m. However, it is interesting to notice that some of the hottest pollution spots still call for surface NO emissions larger than 80 g/m, that is, Milan, Istanbul, Warsaw, and Berlin.
The surface NO pollution reduction is shown in Figure 6c, which was dependent on some key factors: (i) different national lockdown restrictions; (ii) different transport systems; (iii) different manufacturing processes; and (iv) different use of green technologies. The results indicate that a significant surface NO pollution reduction occurred over Italy (Po Valley, Rome, and Naples), Germany, and England. The most remarkable reduction (i.e., a surface NO difference between reference and lockdown emission scenarios larger than 50 g/m) was generally observed far from the hottest pollution spots (excluding Rome), that is, in Munich, Alicante, and Bologna. This remarkable surface NO pollution reduction was experienced by only 0.01% of the considered area (i.e., about 360 km). Nonetheless, in some areas (including Italy), the absolute value of surface NO pollution remained well above the EU annual average emissions limit.
The remarkable NO pollution drop over all the main urban areas in Italy as a result of lockdown restrictions has been confirmed by [81], who integrated NO emission levels measured at ground level, from air quality and weather stations and traffic mobility data from municipal databases during similar 2019 and 2020 periods (25 February–2 May 2019 and 24 February–30 April 2020). In particular, it was found that urban road traffic was significantly impacted by the nationwide lockdown restrictions, with an average reduction of about 48%–69%. Even according to meteorological conditions that may boost the NO pollution or not, the reduction of emissions during the ISL was found to be in the range of 25% (Milan) to 50% (Naples). The study also confirmed the highly complicated, nonlinear nature of atmospheric phenomena and the key role played by weather conditions in pollution formation, spreading, and removal.
4.2. Economic and Mobility Impacts
The impact of the pandemic on a single economy, sector, or company is related to the chance to move the related activity online (i.e., the technological preparedness factor and technical possibility to go virtual) and to the risk–benefit associated to the good itself. According to a study published by a leading Italian merchant bank, Mediobanca, the most affected sectors during the ISL were the airline manufacturing (−22.1%), energy (−15.9%), fashion (−14.1%), and automotive (−9.1%) sectors; the tourism sector, including catering and accommodation, representing 13% of the Italian GDP, was also severely affected [6]. Conversely, some sectors had a positive outcome. Companies operating in Web and software services benefited the most (+17.4% compared to the first semester of 2019), followed by major grocery retail groups (+9.1%), pharmaceuticals (+6.1%), online payment system providers (+4.7%), electronics (+4.5%), and food (+3.4%) [6].
Manufacturing also faced an unprecedented crisis, thus reducing revenues and employment levels.
The Lombardy GDP loss in 2020 was estimated to be −7.1%, compared to the Italian one (−12.8%). With regard to the Milan GDP specifically, also due to high growth rates registered in the previous years, its drop was even higher (−7.7%), especially for retail (−6.7%) and services (−8.8%) [83].
These estimates, provided in July 2020 (just after the ISL), were recently confirmed by the National Confederation of Artisanship (CNA) for Lombardy, with a GDP loss of −9.8% and for Milan [84]. With an added value drop of 11%, Milan was hit harder than Italy in general due to a more severe pandemic diffusion, and also more than Lombardy due to a higher service-oriented sectorial vocation.
As expected, transport-derived demand suffered from the drastic reduction in movement of people, as imposed by the lockdown. Along with the reduction in private motorized trips, both emissions and congestion also decreased. In particular, NO, whose main anthropogenic sources at the regional scale are transport-related, dramatically fell.
Based on Google Mobility Reports data, the authors of [85] investigated the change in use of public transport hubs, such as subway, bus, and train stations, during the COVID-19 pandemic. In Italy, where the usage reduction was also accompanied by a reduced service supply and the widespread perception of public transport as the riskiest way to move, due to the associated crowded conditions, the largest reduction was achieved. The use of public transport decreased by about 80% during the ISL period (18 March–6 May 2020).
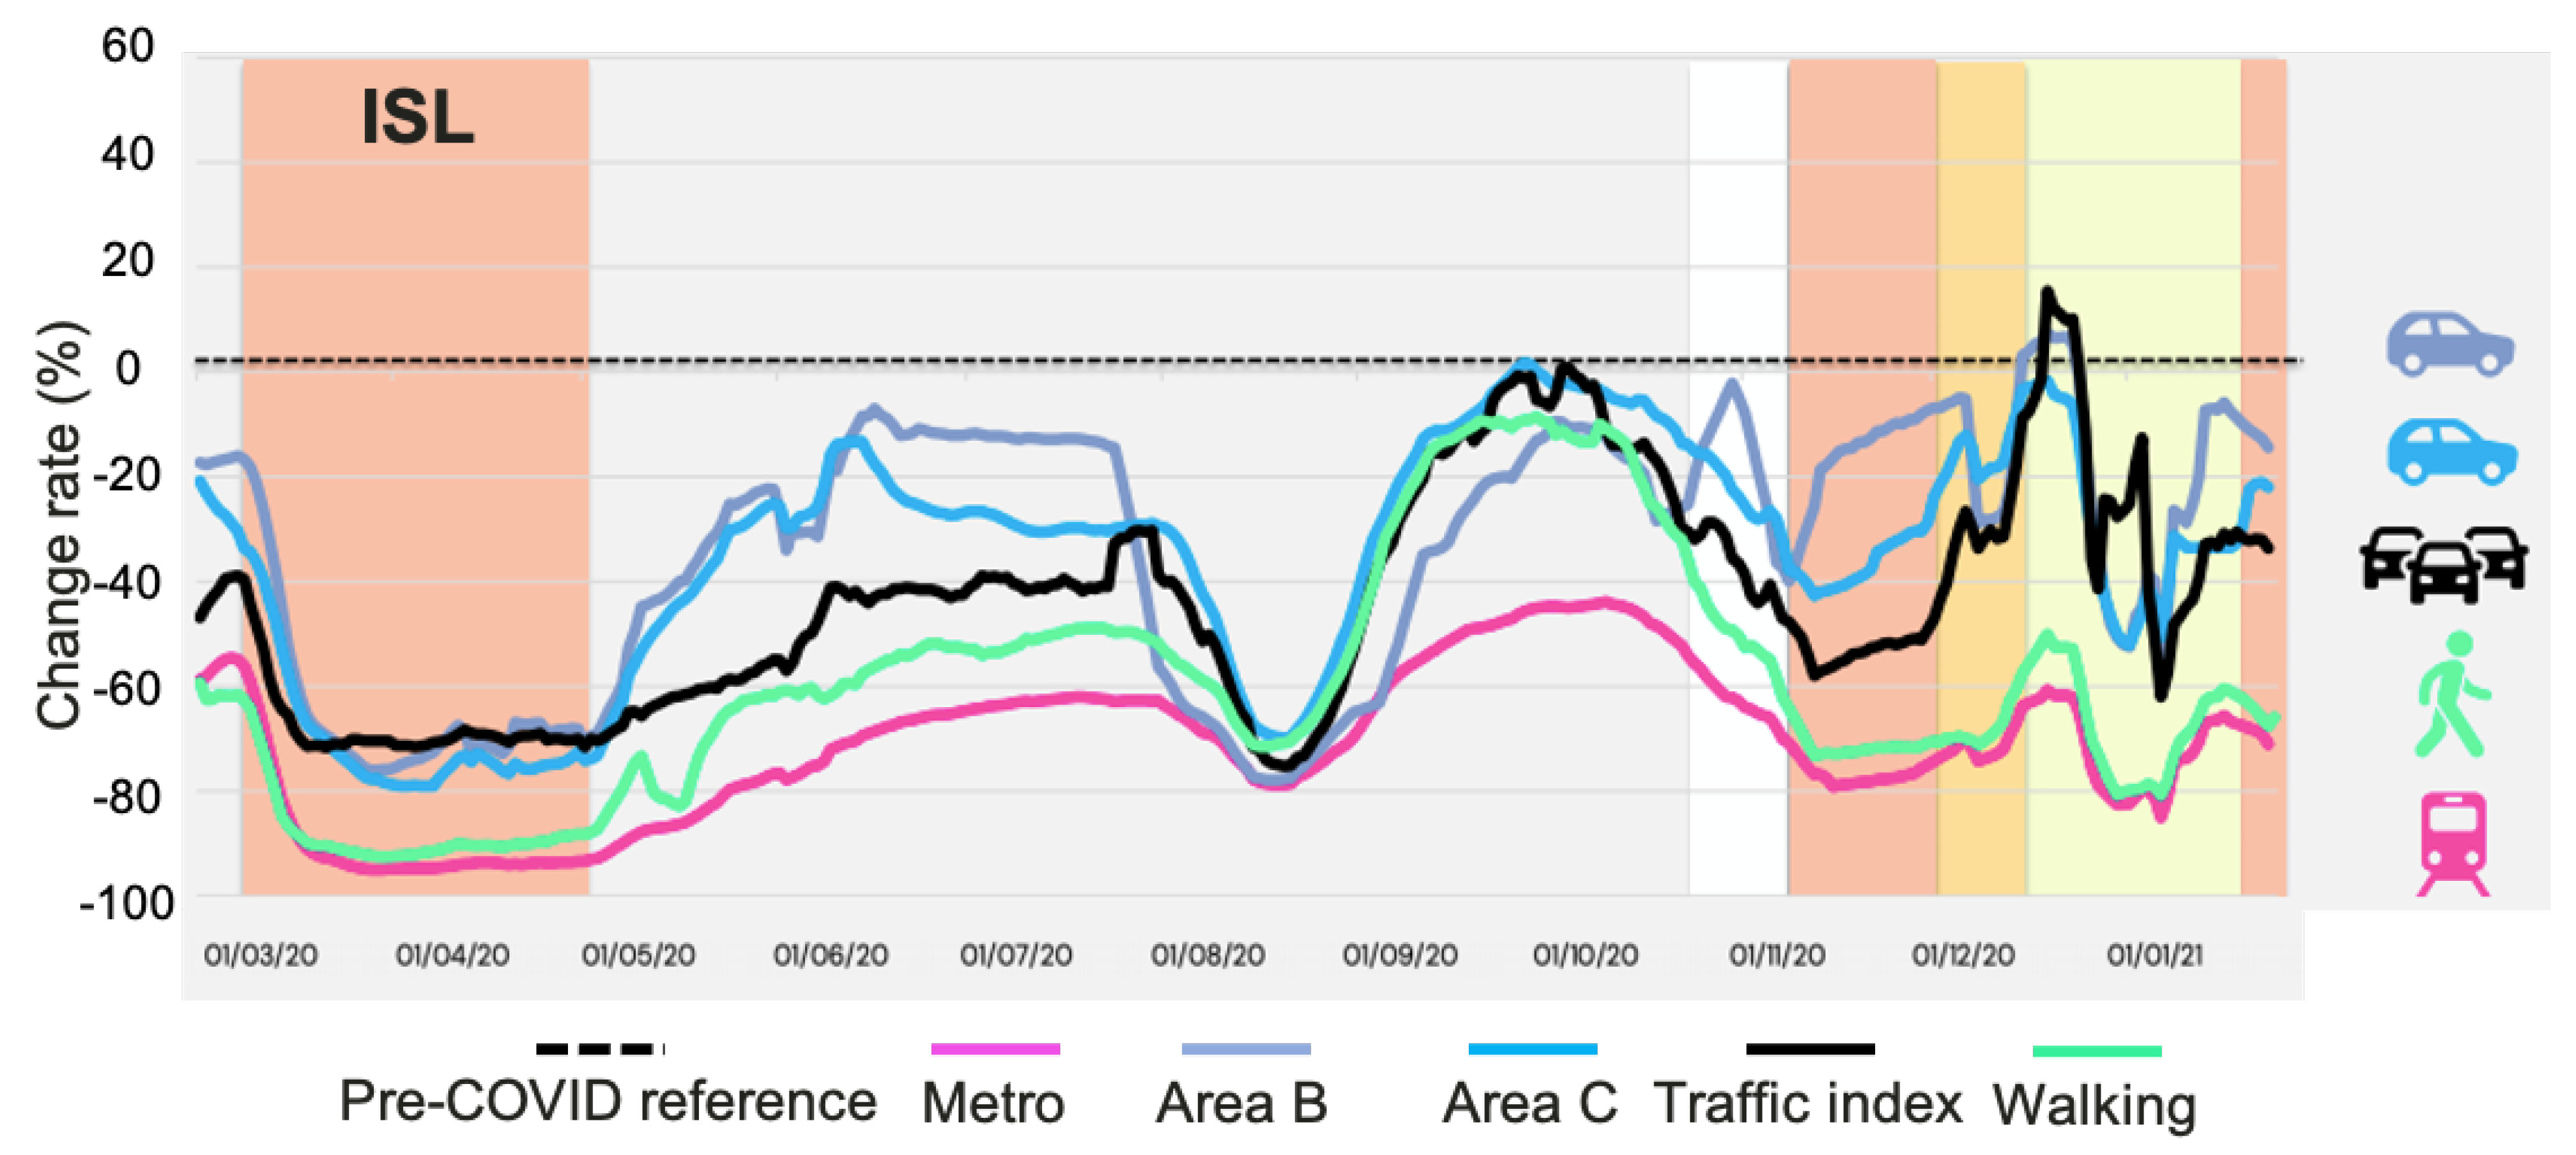
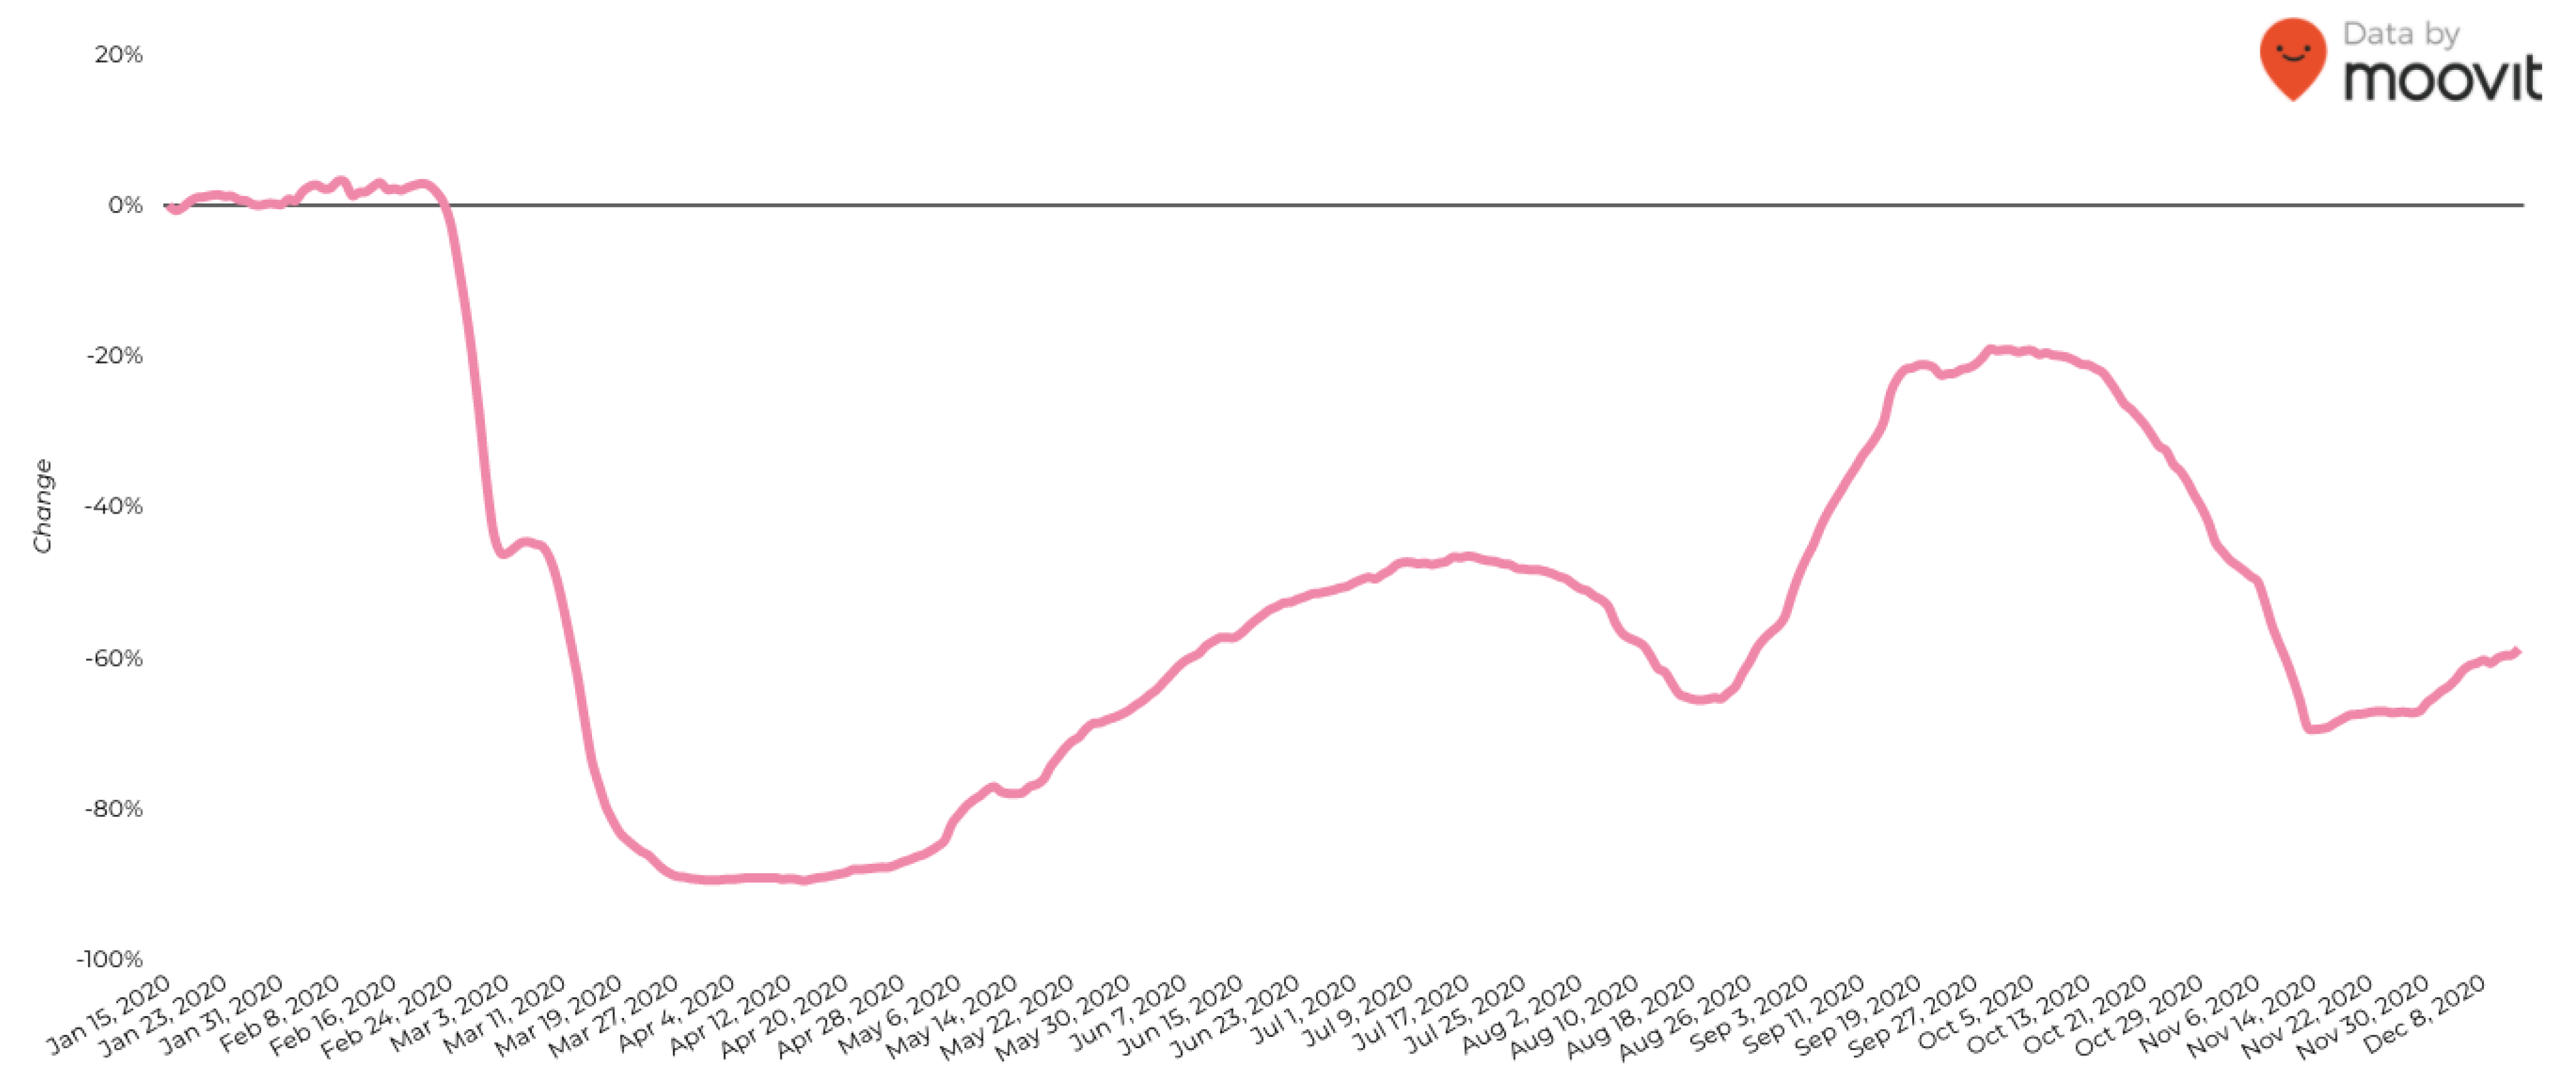
Considering Milan in particular, according to [84], with smart working helping to mitigate human losses, a huge impact has been registered over time for places in the city, as well as on the transport demand, which was already reduced by behavioral changes in purchasing channel choice (online, instead of in-store) and, of course, by the limitations on private mobility imposed by the restrictions. In the specific period of the ISL, mobility in Milan showed a 51% decrease in buying necessary goods; an 86% decrease in leisure, entertainment, shopping, and cultural trips; and a 70% decrease in terms of reaching workplaces. Residential mobility, in contrast, increased by 32%; for most, this meant traveling by bike or on foot. A modal shift towards private modes also occurred. In the last year, public transport dropped by 70%, while that of private vehicles decreased only by 35%; congestion, which was previously addressed by the road pricing measure called Area C (which was suspended during the first period of the pandemic), increased (see Figure 7).
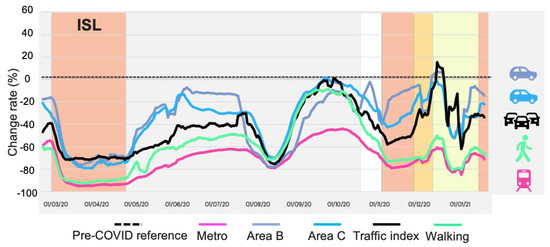
Figure 7.
Usage change rate of mobility sources in Milan since the 2020 ISL. Adapted from [84].
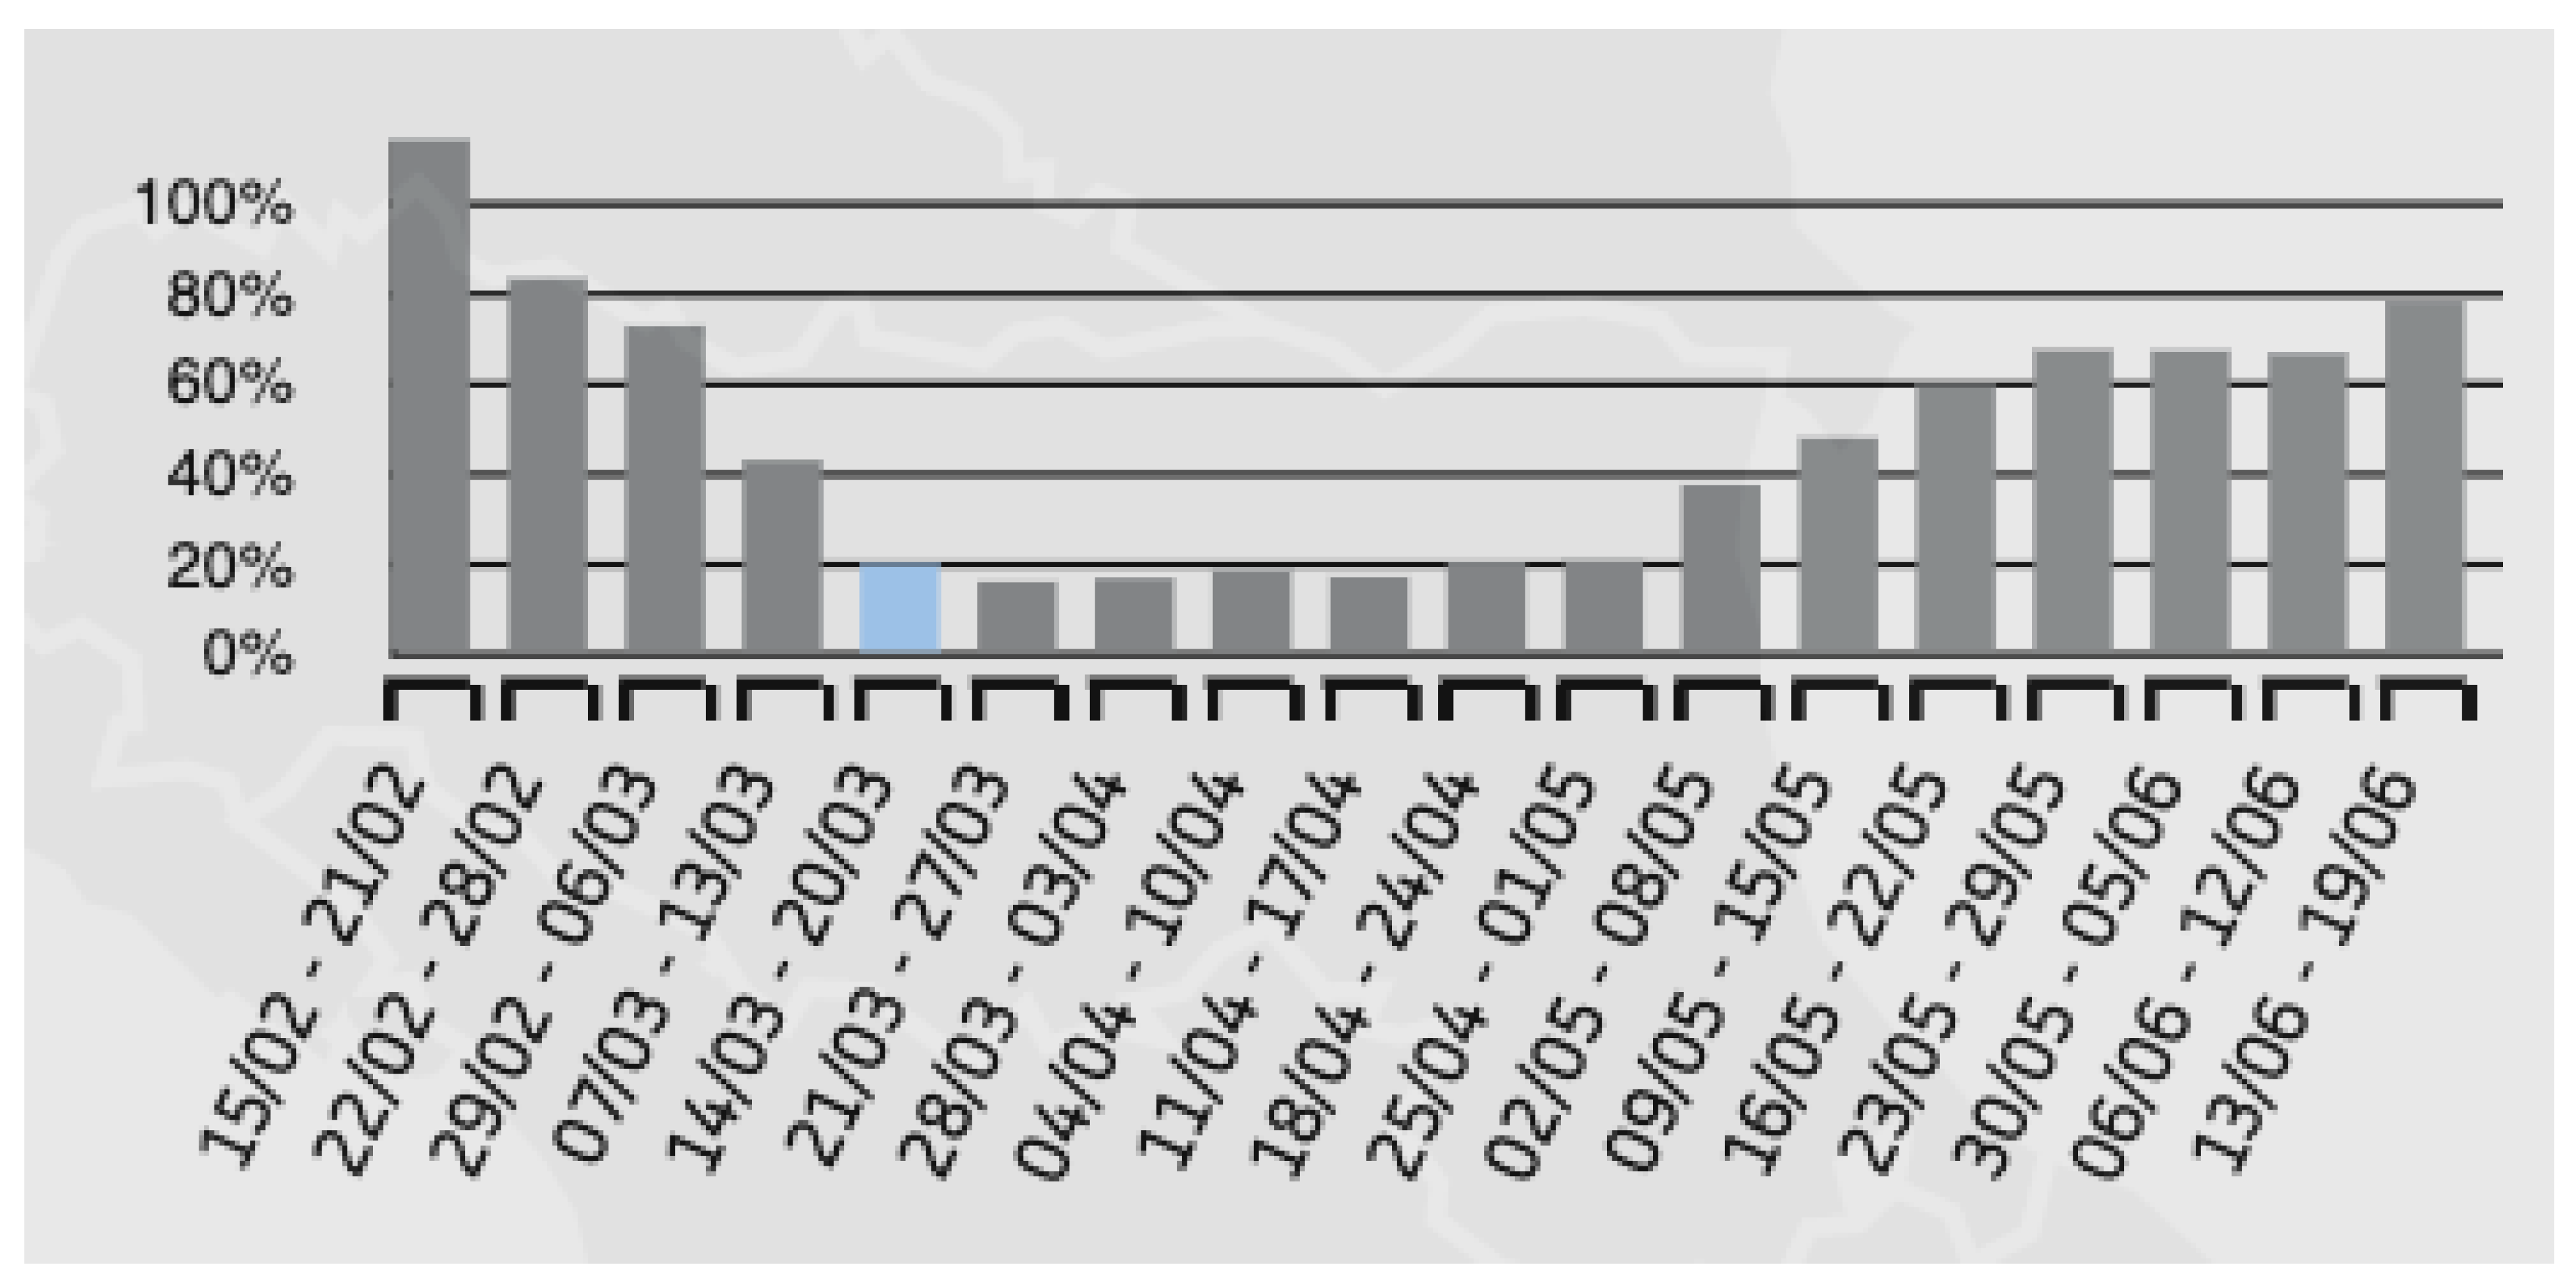
An important source of information about Italian traffic and road mobility is the data set provided by the TomTom company, showing that traffic reduction during the ISL was remarkable [86]. Figure 8 shows an overview of the traffic flows in Milan, relative to their January averages. Since the week after the local lockdown restrictions, the daily traffic in the Milan urban area was found to be less than 20% of the traffic in January. This level was conserved until the end of April, with the first week of May resulting—for the first time since the lockdown restrictions were applied—in a significant increase in daily traffic, to the same level as the first nationwide lockdown week (i.e., about 40% of the January traffic).
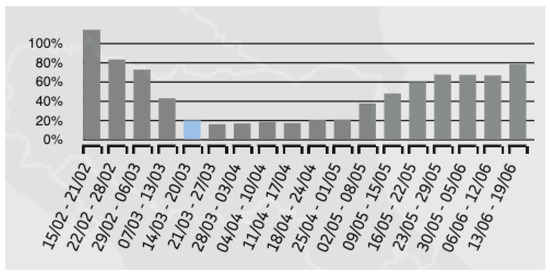
Figure 8.
Overview of the traffic flows in Milan relative to their January averages. The number of daily trips between and within cities are compared to the average number of daily trips in January. Source: [86].
These findings are in accordance with those related to public transport (see Figure 9) [87]. Since the beginning of the nationwide lockdown restrictions, a reduction of more than 50% in the usage of public transport was observed, with respect to a typical working day, resulting in a maximum reduction change rate (i.e., about 90%) in the period of 27 March–18 April 2020. After that, a slight increase in the usage of public transport in Milan was observed during May and June, once more reaching the 50% reduction level, with respect to a typical working day, on 1 July.
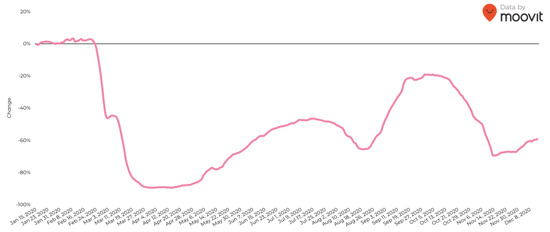
Figure 9.
Change rate in public transport usage in Milan during 2020. Source: [87].
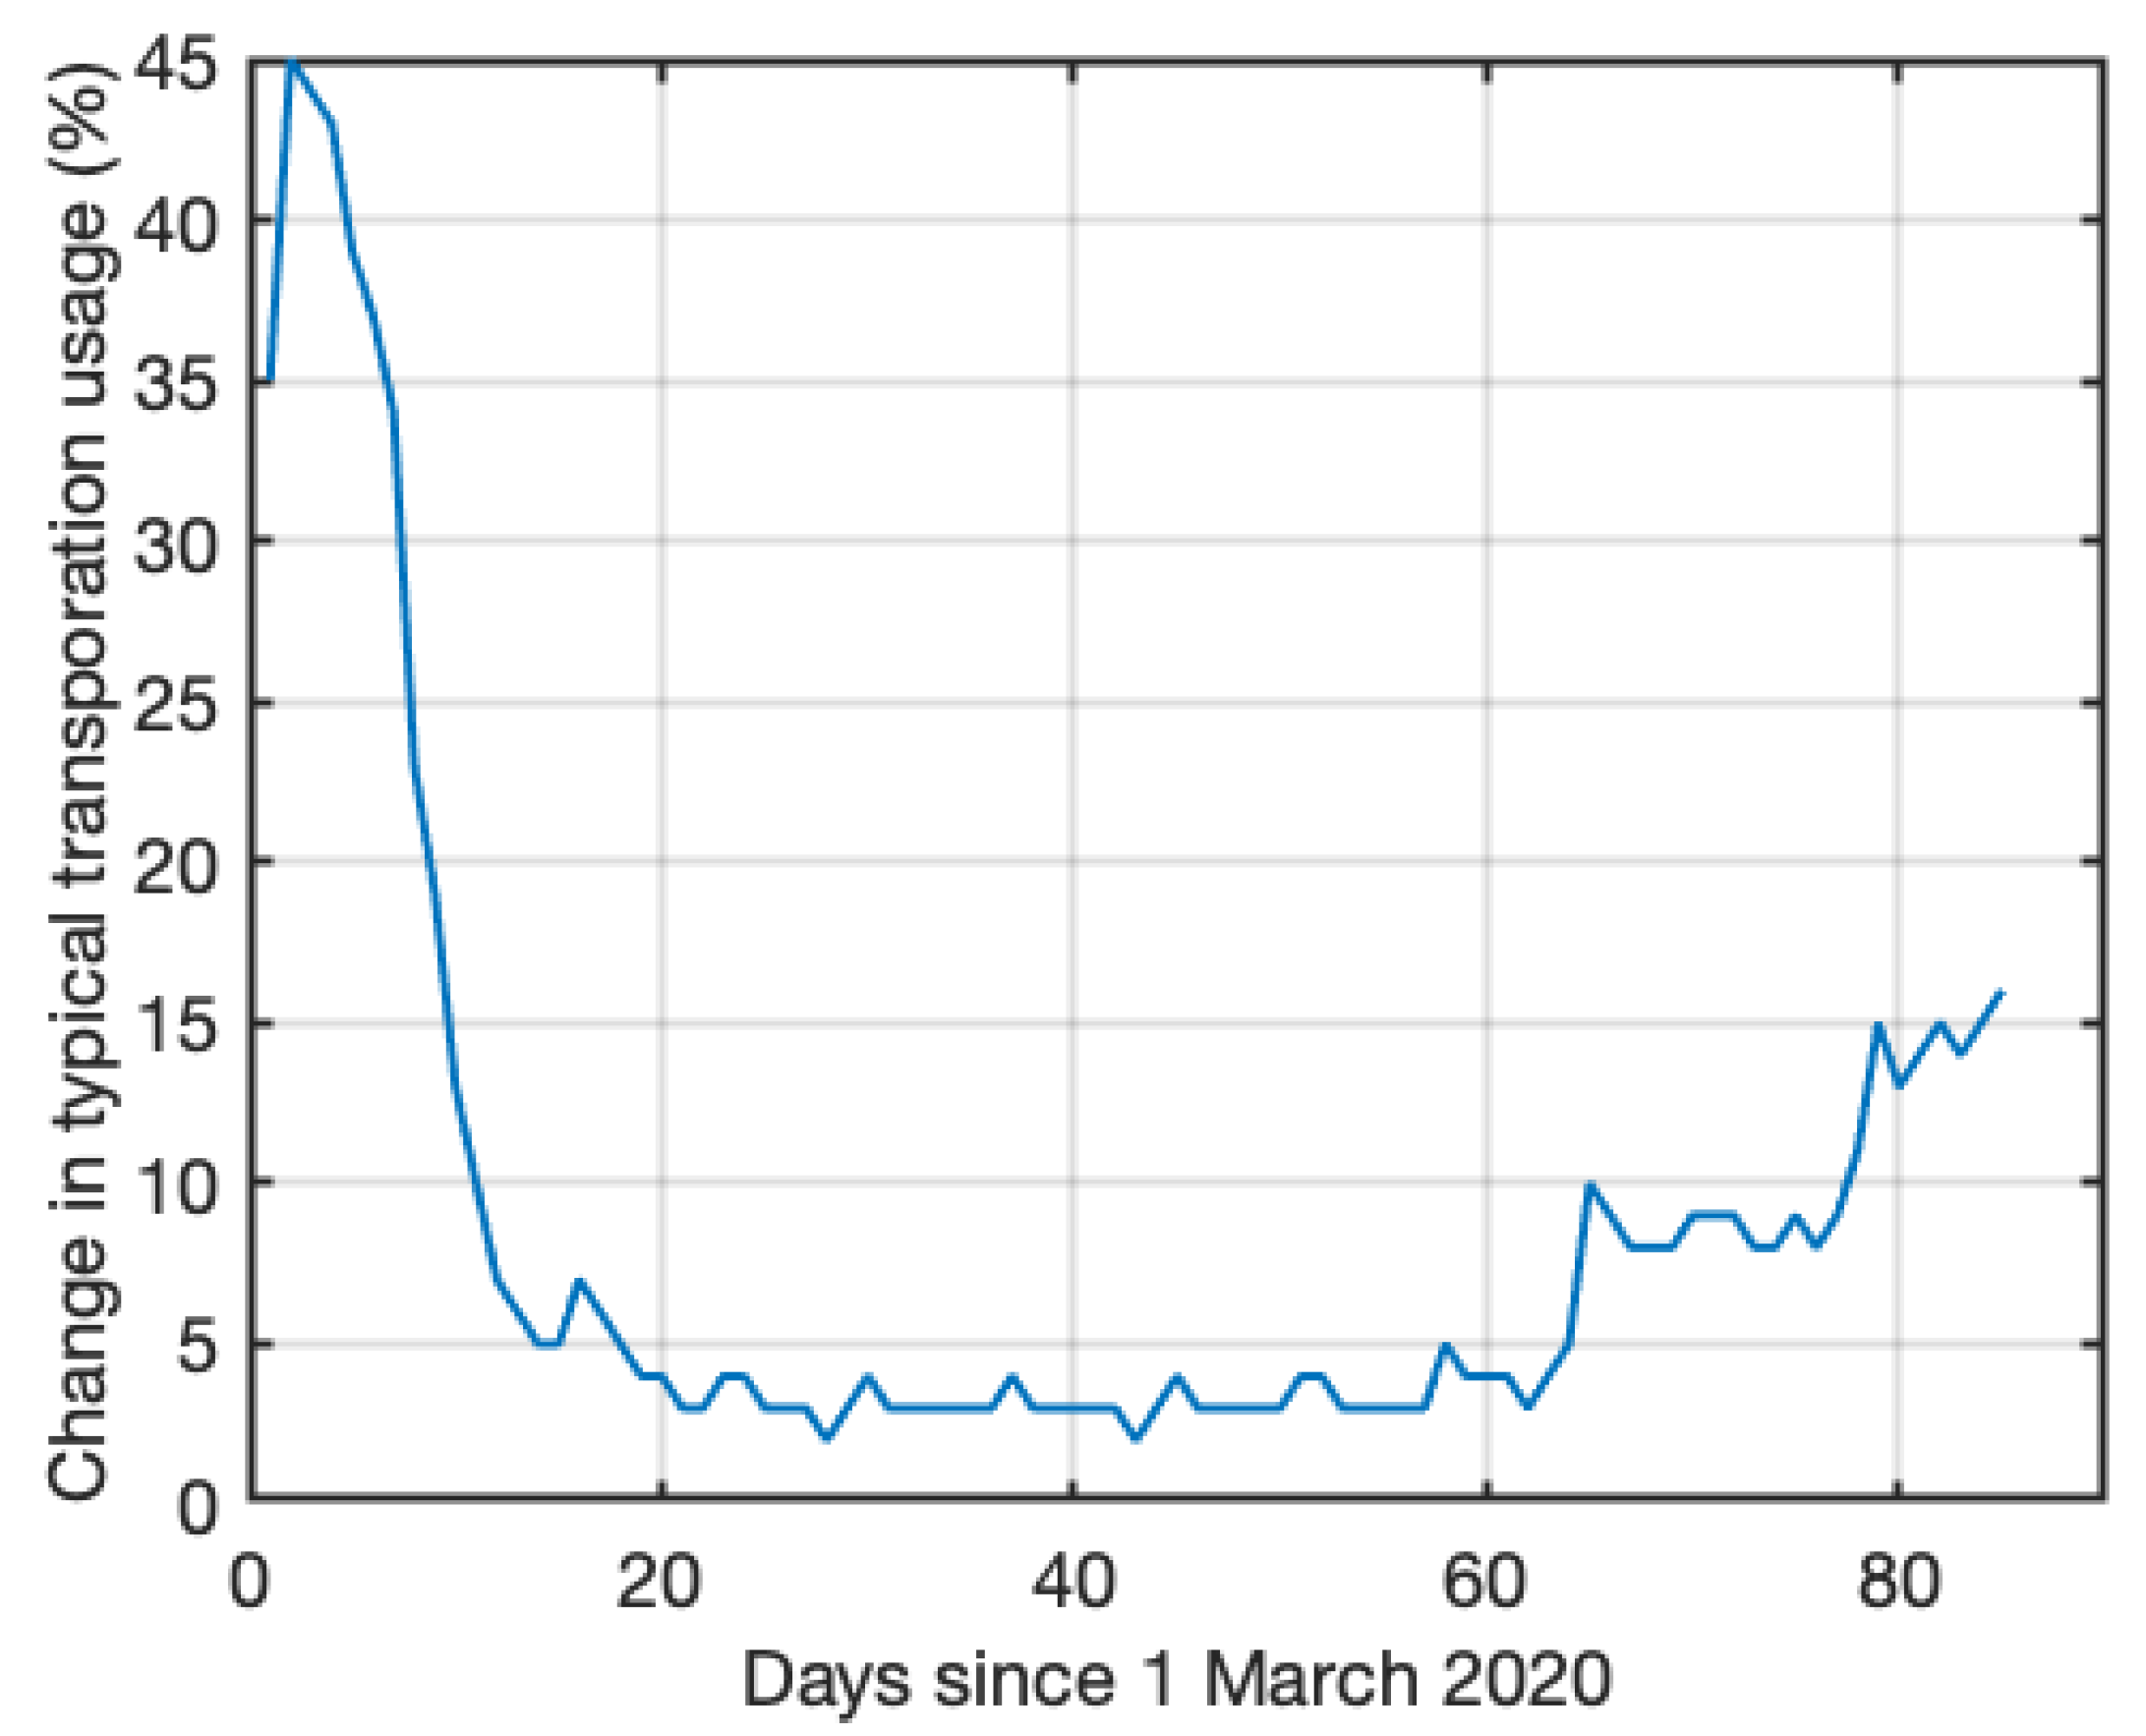
In [88], the effects of the lockdown restrictions on mobility and transport were analysed from 1 March to 24 May 2020 (i.e., during the ISL), in terms of a mobility index derived from CityMapper data, which includes trips made on public transport, walking, cycling, and some micromobility and taxi services. Changes were identified with respect to a typical usage period (6 January–2 February 2020). Results relevant to Milan are shown in Figure 10, from which it can be noted that the mobility index significantly dropped from the beginning of the nationwide restrictions—that is, from more than 35% in the first week of March to less than 5% until the end of April. Only in May was observed a slow increasing trend, up to about 15%.
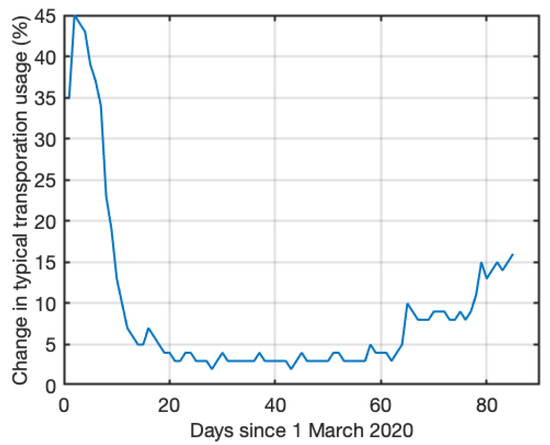
Figure 10.
Changes in the Citymapper mobility index for Milan since 1 March 2020.
5. Discussion and Conclusions
In order to face the pandemic, the Italian government adopted strict two-month lockdown measures in spring 2020 (also known as ISL), in order to minimize social interactions and limiting the spread of the virus. With offices and schools closed, social and cultural places banned, transport (derived) demand also severely decreased. Side effects of the ISL thus included a decrease of the negative externalities provoked by the use of public and private motorized vehicles, such as congestion and pollution, which constitutes a positive environmental impact.
In this paper, we investigated the potential correlation between ISL and NO pollution levels, which is mainly related to transport activities, in the area around Milan, in the North of Italy. On one hand, we conducted a multidisciplinary analysis based on freely available NO air pollution measurements/estimates (primary data) while, on the other hand, ancillary information on the economy and mobility during the ISL (secondary data) was utilized. Exceptional decreases in NO levels were observed over the Milan area during the 2020 ISL, compared with the same period in 2019. Satellite TROPOMI measurements, ARPA ground-based measurements, and CAMS model estimates were considered. In the area of interest—the Po Valley—the correlation between satellite and ground-based measurements was high; apart from the small variability due to different meteorological conditions, this decrease was due to activity and transport reductions. This peculiar pollution trapping behavior is due to the orography of the region. In this period of time, the warmer meteorology was favorable for limiting NO pollution; however, although the interannual reduction with reference to 2019 was remarkable, the pollution level was still high, even during the lockdown.
From the point of view of policymakers, it is important to underline that freely available and reliable different sources of measurements/estimates can be exploited, beyond those of standard ground measurement stations.
At first glance, these findings, which confirm other previous analyses conducted in the same line (see Section 2.2), could seem obvious and worthless; nonetheless, they present some interesting food for thought. Similar scenarios of severely reduced urban and suburban mobility are not likely to be reproduced, as the lockdown was an extreme measure, accepted only due to extenuating (and, hopefully, temporary) circumstances.
This is especially clear when considering both the social and economic impacts of a lockdown, which is not sustainable, as it increases the risk of an economic recession, with an associated spike in job and GDP losses, and withers social and cultural life. To the contrary, environmental concerns, despite their “public” dimension, always seemed to be far less crucial [89], even when considering the first evidence provided regarding the correlation between the COVID-19-related death rate and pollution [90,91,92] or, more specifically, NO [93]. Therefore, once the lockdown is released, its results should be used as convincing arguments for the population to accept urban car-free zones.
Another important issue deals with the future of mobility during the reopening process and life coming back to “new” normal. After many years—and plenty of efforts—of transport policies and planning aimed at achieving sustainable mobility, the pandemic could turn out to be a double-edged sword, being worse for the future of cities than for their present. In fact, if the number of trips suddenly dropped during the lockdown, the loosened restrictions have led to a new and reinforced propensity toward private mobility, which may worsen the future situation. Private motorized mobility has already turned out to be preferred over public (i.e., collective and shared) transport, due not only to the fear of contagion but, paradoxically, to reduced costs (less congestion, more available parking spaces, and suspended fees, such as the Area C fee) of the road modes, and to a lowered perceived level of supply efficiency and service quality of the LPT. The new deal for achieving medium- and long-term sustainable mobility might then consider several tools, such as: promoting active travel at the urban scale and multimodality, and enhancing a behavioral change in modal share for commuting by launching information campaigns for restoring confidence in transit usage, especially in terms of cleanliness and vehicle occupancy rate, but also improving a real-time information system. Technological incentives could also help by reducing the impact of private motorized vehicles, in terms of pollutants, and fostering the adoption of electric and hybrid vehicles. This is in line with the currently adopted mobility policies of the city of Milan, whose congestion charge—Area C—does not apply to electric vehicles and provides fiscal revenues that are partially used for the maintenance of bike sharing services.
Nonetheless, this extreme event has demonstrated that: (1) remarkable transport mobility reductions are not able to generate lower pollution levels; (2) national emissions limits are not enough to ensure the respect of air quality standard norms in critical areas such as those examined herein; (3) green transport technologies must be implemented in such areas; and (4) strong policies encouraging switching to green alternative transport must be more time-efficient and cost-effective.
Moreover, it is also interesting to notice that the pandemic provided a huge and widespread information communication technology (ICT) improvement, in terms of both demand and supply, which supported not only a reduction of trips—for example, by fostering remote working and e-commerce—but also a new way to look at different cultures, countries, and socioeconomic systems and to use technology as a real “connecting” tool covering physical distances [94].
Last, but not least, from a purely methodological point of view, these restriction measures allow us to assess the impact of anthropogenic (mainly transport-related) activities on air quality in an unprecedented way; actually, the ISL represents a unique opportunity to analyse the effects—through lockdown restrictions—of transport policies on the environment. In this sense, the analysis undertaken in this study can be framed within the EU Agenda 2030 program on sustainable development, which, among the seventeen goals to be pursued, includes goals 11 and 13, regarding sustainable cities and communities and climate action, respectively.
Summarizing, the main points highlighted by this multidisciplinary study are as follows:
- The pandemic-related lockdown forced people to stay at home and economic activities to stop.
- NO emissions, mainly related to transport, consequently decreased.
- Freely available TROPOMI satellite measurements, ground-based measurements, and model estimates were used.
- A correlation between NO emission levels, the mobility habits (e.g., movements) of people, and economic activities was observed
- Policymakers could take inspiration from this extreme and unavoidable scenario for developing sustainable mobility policies.
Author Contributions
Conceptualization, M.M. (Maurizio Migliaccio); methodology, M.M. (Maurizio Migliaccio) and A.B. (Andrea Buono); formal analysis, A.B.; investigation, M.M. (Maurizio Migliaccio) and A.B.; resources, I.M. (Ila Maltese) and M.M. (Margherita Migliaccio); data curation, M.M. (Margherita Migliaccio); writing—original draft preparation, M.M. (Maurizio Migliaccio), A.B. and I.M.; writing—review and editing, M.M. (Maurizio Migliaccio) and I.M.; supervision, M.M. (Maurizio Migliaccio) and I.M. All authors have read and agreed to the published version of the manuscript.
Funding
This research received no external funding.
Institutional Review Board Statement
Not applicable.
Informed Consent Statement
Not applicable.
Acknowledgments
This paper was written during the COVID-19 pandemic in Italy and is dedicated to all people working in the healthcare system. The authors would like to thank the ESA for providing useful information and material on TROPOMI observations and CAMS for providing air quality analysis and forecast data free of charge. We would also like to thank Carmine Serio (Università degli Studi della Basilicata, Italy), Frank Silvio Marzano (Università degli Studi di Roma La Sapienza, Italy), and Gabriele Curci (Università degli Studi de L’Aquila) for their useful insights and discussions. We would also like to thank Ferdinando Nunziata and Giovanna Inserra (Università degli Studi di Napoli Parthenope, Italy) for their support in editing the paper in LaTex.
Conflicts of Interest
The authors declare no conflict of interest.
Abbreviations
The following abbreviations are used in this manuscript:
| ARPA | Environmental Protection Regional Agency |
| ATM | Milan Transport Company (Azienda Trasporti Milanesi) |
| BSC | Barcelona Supercomputing Center |
| CAMS | Copernicus Atmosphere Monitoring Service |
| CNA | National Confederation of Artesanship |
| DLR | German Aerospace Center |
| ESA | European Space Agency |
| EU | European Union |
| FDI | Foreign Direct Investment |
| FUR | Functional Urban Region |
| GDP | Gross Domestic Product |
| GLM | General Linear Model |
| GPS | Global Positioning System |
| ICT | Information Communication Technology |
| ICU | Intensive Care Unit |
| I–O | Input–Output |
| ISL | Italian Spring Lockdown |
| LAU | Local Administrative Unit |
| LPT | Local Public Transport |
| MDCEV | Multiple Discrete Choice Extreme Value |
| MNE | Multinational Enterprise |
| NUTS | Nomenclature of Territorial Units for Statistics |
| SUMP | Sustainable Urban Mobility Plan |
| TROPOMI | TROPOspheric Monitoring Instrument |
| WHO | World Health Organization |
References
- World Health Organization. WHO Coronavirus (COVID-19) Dashboard Overview. 2021. Available online: https://covid19.who.int/?gclid=Cj0KCQiAnKeCBhDPARIsAFDTLTJFDA61RwxLM818L3iP0nplp3OgGNfUXNeyvM3ZryY5_s_s0KeCkbMaApuxEALw_wcB (accessed on 26 July 2021).
- Rahman, M.A.; Zaman, N.; Asyhari, A.T.; Al-Turjman, F.; Bhuiyan, M.Z.A.; Zolkipli, M.F. Data-driven dynamic clustering framework for mitigating the adverse economic impact of Covid-19 lockdown practices. Sustain. Cities Soc. 2020, 62, 102372. [Google Scholar] [CrossRef]
- Chaudhrya, R.; Dranitsarisb, G.; Mubashirc, T.; Bartoszkoa, J.; Riazi, S. A country level analysis measuring the impact of government actions, country preparedness and socioeconomic factors on COVID-19 mortality and related health outcomes. EClinicalMedicine 2020, 25, 100464. [Google Scholar] [CrossRef] [PubMed]
- Remuzzi, A.; Remuzzi, G. COVID-19 and Italy: What next? Lancet 2020, 395, 1225–1228. [Google Scholar] [CrossRef]
- Alwan, N.A.; Burgess, R.A.; Ashworth, S.; Beale, R.; Bhadelia, N.; Bogaert, D.; Dowd, J.; Eckerle, I.; Goldman, L.R.; Greenhalgh, T.; et al. Scientific consensus on the COVID-19 pandemic: We need to act now. Lancet 2020, 396, e71–e72. [Google Scholar] [CrossRef]
- Vismara, F. Reflections on COVID-19—Views from Italy. Restructuring GlobalView. 17 September 2020. Available online: https://www.restructuring-globalview.com/2020/09/reflections-on-covid-19-views-from-italy/ (accessed on 27 July 2021).
- Colvile, R.N.; Hutchinson, E.J.; Mindell, J.S.; Warren, R.F. The transport sector as a source of air pollution. Atmos. Environ. 2001, 35, 1537–1565. [Google Scholar] [CrossRef] [Green Version]
- Myhre, G.; Shindell, D. Anthropogenic and Natural Radiative Forcing. In Climate Change 2013: The Physical Science Basis; Stocker, T.F., Ed.; Cambridge University Press: Cambridge, UK; New York, NY, USA, 2013; pp. 659–740. [Google Scholar]
- Lelieveld, J.; Evans, J.S.; Fnais, M.; Giannadaki, D.; Pozzer, A. The contribution of outdoor air pollution sources to premature mortality on a global scale. Nature 2015, 525, 367–371. [Google Scholar] [CrossRef]
- Atkinson, R.W.; Butland, B.K.; Anderson, H.R.; Maynard, R.L. Long-term concentrations of nitrogen dioxide and mortality: A meta-analysis of cohort studies. Epidemiology 2018, 29, 460–472. [Google Scholar] [CrossRef]
- Eurostat. EEA Air Pollutants by Source Sector. 2021. Available online: https://appsso.eurostat.ec.europa.eu/nui/show.do?dataset=env_air_emis&lang=en (accessed on 27 July 2021).
- Beirle, S.; Platt, U.; Wenig, M.; Wagner, T. Weekly cycle of NO2 by GOME measurements: A signature of anthropogenic sources. Atmos. Chem. Phys. 2003, 3, 2225–2232. [Google Scholar] [CrossRef] [Green Version]
- World Health Organization. Coronavirus Disease (COVID-19) Outbreak. 2020. Available online: who.int/emergencies/diseases/novel-coronavirus-2019 (accessed on 27 July 2021).
- Horowitz, J. Italy Locks Down Much of the Country’s North Over the Coronavirus. The New York Times. 11 March 2020. Available online: nytimes.com/2020/03/07/world/europe/coro-navirus-italy.html (accessed on 27 July 2021).
- Kim, S. How South Korea Lost Control of Its Coronavirus Outbreak. The New Yorker. 4 March 2020. Available online: newyorker.com/news/news-desk/how-south-korea-lost-control-of-its-coronavirusoutbreak (accessed on 27 July 2021).
- Leggett, T. Coronavirus: Global Growth ‘Could Halve’ if Outbreak Intensifies. BBC. 2 March 2020. Available online: bbc.com/news/business-51700935 (accessed on 27 July 2021).
- Banister, D. The sustainable mobility paradigm. Transp. Policy 2008, 15, 73–80. [Google Scholar] [CrossRef]
- Victor, P.A. Pollution: Economy and Environment; Routledge: London, UK, 1972. [Google Scholar]
- Gradus, R.; Smulders, S. The trade-off between environmental care and long-term growth pollution in three prototype growth models. J. Econ. 1993, 58, 25–51. [Google Scholar] [CrossRef] [Green Version]
- Smulders, S.; Gradus, R. Pollution abatement and long-term growth. Eur. J. Politics Econ. 1996, 12, 505–532. [Google Scholar] [CrossRef] [Green Version]
- Moser, E.; Seidl, A.; Feichtinger, G. History-dependence in production-pollution-trade-off models: A multi-stage approach. Ann. Oper. Res. 2014, 222, 457–481. [Google Scholar] [CrossRef]
- Mildenberger, M.; Leiserowitz, A. Public opinion on climate change: Is there an economy–environment tradeoff? Environ. Politics 2017, 26, 801–824. [Google Scholar] [CrossRef]
- Renstrom, T.I.; Spataro, L.; Marsiliani, L. Can subsidies rather than pollution taxes break the trade-off between economic output and environmental protection? Energy Econ. 2021, 95, 105084. [Google Scholar] [CrossRef]
- Chakraborty, I.; Maity, P. COVID-19 outbreak: Migration, effects on society, global environment and prevention. Sci. Total Environ. 2020, 728, 138882. [Google Scholar] [CrossRef] [PubMed]
- Saadat, S.; Rawtani, D.; Hussain, C.M. Environmental perspective of COVID-19. Sci. Total Environ. 2020, 728, 138870. [Google Scholar] [CrossRef] [PubMed]
- Venter, Z.S.; Aunan, K.; Chowdhury, S.; Lelieveld, J. COVID-19 lockdowns cause global air pollution declines. Proc. Natl. Acad. Sci. USA 2020, 117, 18984–18990. [Google Scholar] [CrossRef]
- Donzelli, G.; Cioni, L.; Cancellieri, M.; Morales, A.; Suarez-Varela, M.M.M. The Effect of the Covid-19 Lockdown on Air Quality in Three Italian Medium-Sized Cities. Atmosphere 2020, 11, 1118. [Google Scholar] [CrossRef]
- Collivignarelli, M.C.; Abba, A.; Bertanza, G.; Pedrazzani, R.; Ricciardi, P.; Carnevale Miinoa, M. Lockdown for CoViD-2019 in Milan: What are the effects on air quality? Sci. Total Environ. 2020, 732, 139280. [Google Scholar] [CrossRef]
- Wang, Q.; Li, S. Nonlinear impact of COVID-19 on pollutions—Evidence from Wuhan, New York, Milan, Madrid, Bandra, London, Tokyo and Mexico City. Sustain. Cities Soc. 2021, 65, 102629. [Google Scholar] [CrossRef]
- Duncan, B.N.; Lamsal, L.N.; Thompson, A.M.; Yoshida, Y.; Lu, Z.; Streets, D.; Hurwitz, M.; Pickering, K.E. A space-based, high-resolution view of notable changes in urban NOx pollution around the world (2005–2014). J. Geophys. Res. 2016, 121, 976–996. [Google Scholar] [CrossRef] [Green Version]
- De Foy, B.; Lu, Z.; Streets, D. Satellite NO2 retrievals suggest China has exceeded its NOx reduction goals from the twelfth Five-Year Plan. Nat. Sci. Rep. 2016, 6, 35912. [Google Scholar] [CrossRef] [PubMed] [Green Version]
- van der A, R.J.; Mijling, B.; Ding, J.; Koukouli, M.; Liu, F.; Li, Q.; Mao, H.; Theys, N. Cleaning up the air: Effectiveness of air quality policy for SO2 and NOx emissions in China. Atmos. Chem. Phys. 2017, 17, 1775–1789. [Google Scholar] [CrossRef] [Green Version]
- Castellanos, P.; Boersma, K.F. Reductions in nitrogen oxides over Europe driven by environmental policy and economic recession. Nat. Sci. Rep. 2012, 2, 265. [Google Scholar] [CrossRef]
- Mijling, B.; Boersma, R.J.v.A.K.F.; Roozendael, M.V.; Smedt, I.D.; Kelder, H.M. Reductions of NO2 detected from space during the 2008 Beijing Olympic Games. Geophys. Res. Lett. 2009, 36. [Google Scholar] [CrossRef]
- Guo, S.; Hu, M.; Guo, Q.; Zhang, X.; Schauer, J.J.; Zhang, R. Quantitative evaluation of emission controls on primary and secondary organic aerosol sources during Beijing 2008 Olympics. Atmos. Chem. Phys. 2013, 13, 8303–8314. [Google Scholar] [CrossRef] [Green Version]
- Hao, N.; Valks, P.; Loyola, D.; Cheng, Y.F.; Zimmer, W. Space-based measurements of air quality during the World Expo 2010 in Shanghai. Environ. Res. Lett. 2011, 6, 044004. [Google Scholar] [CrossRef] [Green Version]
- Peskoe-Yang, L. Yes, COVID-19 Shutdowns Improved Air Quality Worldwide. Inst. News IEEE 2020, 44, 12–13. [Google Scholar]
- Wang, T.; Yuan, Y.; Wang, Q.; Liu, C.; Zhi, Q.; Cao, J. Changes in air quality related to the control of coronavirus in China: Implications for traffic and industrial emissions. Sci. Total Environ. 2020, 731, 1–8. [Google Scholar] [CrossRef]
- Beria, P.; Lunkar, V. Presence and mobility of the population during the first wave of Covid-19 outbreak and lockdown in Italy. Sustain. Cities Soc. 2021, 65, 102616. [Google Scholar] [CrossRef]
- Aloi, A.; Alonso, B.; Benavente, J.; Cordera, R.; Echaniz, E.; Gonzalez, F.; Ladisa, C.; Lezama-Romanelli, R.; Lopez-Parra, A.; Mazzei, V.; et al. Effects of the COVID-19 lockdown on urban mobility: Empirical evidence from the city of Santander (Spain). Sustainability 2020, 12, 3870. [Google Scholar] [CrossRef]
- Orro, A.; Novales, M.; Monteagudo, A.; Perez-Lopez, J.B.; Bugarin, M.R. Impact on city bus transit services of the COVID-19 lockdown and return to the new Normal: The case of La Coruna (Spain). Sustainability 2020, 12, 7206. [Google Scholar] [CrossRef]
- Baldasano, J.M. COVID-19 lockdown effects on air quality by NO2 in the cities of Barcelona and Madrid (Spain). Sci. Total. Environ. 2020, 741, 140353. [Google Scholar] [CrossRef] [PubMed]
- Klein, B.; LaRock, T.; McCabe, S.; Torres, L.; Privitera, F.; Lake, B.; Kraemer, M.U.G.; Brownstein, J.S.; Lazer, D.; Eliassi-Rad, T.; et al. Assessing Changes in Commuting and Individual Mobility in Major Metropolitan Areas in the United States during the COVID-19 Outbreak. 2020. Available online: https://www.networkscienceinstitute.org/publications/assessing-changes-in-commuting-and-individual-mobility-in-major-metropolitan-areas-in-the-united-states-during-the-covid-19-outbreak (accessed on 27 July 2021).
- Bhaduri, E.; Manoj, B.S.; Wadud, Z.; Goswami, A.K.; Choudhury, C.F. Modelling the effects of COVID-19 on travel mode choice behaviour in India. Transp. Res. Interdiscip. 2020, 8, 100273. [Google Scholar]
- Hu, S.; Chen, P. Who left riding transit? Examining socioeconomic disparities in the impact of COVID-19 on ridership. Transp. Res. Part D Transp. Environ.. 2021, 90, 102654. [Google Scholar] [CrossRef]
- Tan, L.; Ma, C. Choice behavior of commuters’ rail transit mode during the COVID-19 pandemic based on logistic model. J. Traffic Transp. Eng. 2020, 8, 186–195, in print. [Google Scholar] [CrossRef]
- Borkowski, P.; Jazdzewska-Gutta, M.; Szmelter-Jarosz, A. Lockdowned: Everyday mobility changes in response to COVID-19. J. Transp. Geogr. 2021, 90, 102906. [Google Scholar] [CrossRef]
- Wielechowski, M.; Czech, K.; Grzeda, L. Decline in Mobility: Public Transport in Poland in the time of the COVID-19 Pandemic. Economies 2020, 8, 78. [Google Scholar] [CrossRef]
- Fountas, G.; Sun, Y.Y.; Akizu-Gardoki, O.; Pomponi, F. How do people move around? National data on transport modal shares for 131 countries. World 2020, 1, 34–43. [Google Scholar] [CrossRef]
- De Haas, M.; Faber, R.; Hamersma, M. How COVID-19 and the Dutch ‘intelligent lockdown’ change activities, work and travel behaviour: Evidence from longitudinal data in the Netherlands. Transp. Res. Interdiscip. Perspect. 2020, 6, 100150. [Google Scholar] [CrossRef]
- Engle, S.; Stromme, J.; Zhou, A. Staying at Home: Mobility Effects of COVID-19. 2020. Available online: https://papers.ssrn.com/sol3/papers.cfm?abstract_id=3565703 (accessed on 27 July 2021).
- Pullano, G.; Valdano, E.; Scarpa, N.; Rubrichi, S.; Colizza, V. Population Mobility Reductions during COVID-19 Epidemic in France under Lockdown. 2020. Available online: https://www.medrxiv.org/content/10.1101/2020.05.29.20097097v1.full.pdf (accessed on 27 July 2021).
- Mishra, M.K. The World after COVID-19 and Its Impact on Global Economy; ZBW—Leibniz Information Centre for Economics: Kiel, Germany, 2020. [Google Scholar]
- Lenzen, M.; Li, M.; Malik, A.; Pomponi, F.; Sun, Y.Y.; Wiedmann, T.; Faturay, F.; Fry, J.; Gallego, B.; Geschke, A.; et al. Global socio-economic losses and environmental gains from the Coronavirus pandemic. PLoS ONE 2020, 15, e0235654. [Google Scholar] [CrossRef]
- Bonaccorsi, G.; Pierri, F.; Cinelli, M.; Flori, A.; Galeazzi, A.; Porcelli, F.; Schmidt, A.L.; Valensise, C.M.; Scala, A.; Quattrociocchi, W.; et al. Economic and social consequences of human mobility restrictions under COVID-19. Proc. Natl. Acad. Sci. USA 2020, 117, 15530–15535. [Google Scholar] [CrossRef]
- Spelta, A.; Flori, A.; Pierri, F.; Bonaccorsi, G.; Pammolli, F. After the lockdown: Simulating mobility, public health and economic recovery scenarios. Sci. Rep. 2020, 10, 1–13. [Google Scholar] [CrossRef]
- Eurostat. Population & Demographics 2021. Available online: https://ec.europa.eu/eurostat/web/population-demography/demography-population-stock-balance/database (accessed on 27 July 2021).
- Holden, E. Achieving Sustainable Mobility, 1st ed.; Taylor & Francis: Aldershot, UK, 2007. [Google Scholar]
- Maltese, I.; Mariotti, I.; Oppio, A. An ex-post assessment of sustainable mobility: The case of European neighbourhoods. In Territorio; Franco Angeli: Milano, Italy, 2011; pp. 51–58. [Google Scholar]
- Eurostat. Luxembourg—Most Cars per Inhabitant in the EU. 2020. Available online: https://ec.europa.eu/eurostat/web/products-eurostat-news/-/DDN-20200611-2?inheritRedirect=true&redirect=%2Feurosta%2Fnews%2Fwhats-new (accessed on 27 July 2021).
- Maltese, I.; Gatta, V.; Marcucci, E. Active Travel in Sustainable Urban Mobility Plans. An Italian overview. Res. Transp. Bus. Manag. 2021, 100621. [Google Scholar] [CrossRef]
- SCRAT Euromobility. Osservatorio 50 Città Italiane. 2019. Available online: https://www.xn--osservatorio50citt-wrb.it/searchIndicator_NEW/index.php?ind=58&year=2019 (accessed on 27 July 2021).
- Laker, L. Milan Announces Ambitious Scheme to Reduce Car Use after Lockdown. The Guardian. 21 April 2020. Available online: https://www.theguardian.com/world/2020/apr/21/milan-seeks-to-prevent-post-crisis-return-of-traffic-pollution (accessed on 27 July 2021).
- Bertuccio, L.; Piras, V. Osservatorio Mobilità Sostenibile in Italia. 2019. Available online: https://www.euromobility.org/wp-content/uploads/2019/11/50-città2019.pdf (accessed on 27 July 2021).
- Chianese, E.; Camastra, F.; Ciaramella, A.; Landi, T.C.; Staiano, A.; Riccio, A. Spatio-temporal learning in predicting ambient particulate matter concentration by multi-layer perceptron. Ecol. Inform. 2019, 49, 54–61. [Google Scholar] [CrossRef]
- Chianese, E.; Galletti, A.; Giunta, G.; Landi, T.C.; Marcellino, L.; Montella, R.; Riccio, A. Spatiotemporally resolved ambient particulate matter concentration by fusing observational data and ensemble chemical transport model simulations. Ecol. Model. 2018, 385, 173–181. [Google Scholar] [CrossRef]
- Lamsal, L.N.; Duncan, B.N.; Yoshida, Y.; Krotkov, N.A.; Pickering, K.E.; Streets, D.G.; Lu, Z.U.S. NO2 trends (2005–2013): EPA Air Quality System (AQS) data versus improved observations from the Ozone Monitoring Instrument (OMI). Atmos. Environ. 2015, 110, 130–143. [Google Scholar] [CrossRef]
- European Space Agency. Coronavirus Lockdown Leading to Drop in Pollution across Europe. 2020. Available online: www.esa.int/Applications/Observing_the_Earth/Copernicus/Sentinel-5P/ (accessed on 27 July 2021).
- Bauwens, M.; Compernolle, S.; Stavrakou, T.; Muller, J.-F.; van Gent, J.; Eskes, H.; Levelt, P.F.; van der, A.R.; Veefkind, J.P.; Vlietinck, J.; et al. Impact of coronavirus outbreak on NO2 pollution assessed using TROPOMI and OMI observations. Geophys. Res. Lett. 2020, 47, e2020GL087978. [Google Scholar] [CrossRef] [PubMed]
- Bassani, C.; Vichi, F.; Esposito, G.; Montagnoli, M.; Giusto, M.; Ianniello, A. Nitrogen dioxide reductions from satellite and surface observations during COVID-19 mitigation in Rome (Italy). Environ. Sci. Pollut. Res. 2021, 28, 22981–23004. [Google Scholar] [CrossRef] [PubMed]
- Van Geffen, J.; Eskes, H.J.; Boersma, K.F.; Maasakkers, J.D.; Veefkind, J.P. TROPOMI ATBD of the Total and Tropospheric NO2 Data Products; Technical Report S5P-KNMI-L2-0005-RP; Royal Netherlands Meteorological Institute: De Bilt, The Netherlands, 2021; Volume 2.2.0. [Google Scholar]
- Van Geffen, J.; Boersma, K.F.; Eskes, H.J.; Sneep, M.; ter Linden, M.; Zara, M.; Veefkind, J.P. S5P/TROPOMI NO2 slant column retrieval: Method, stability, uncertainties and comparisons with OMI. Atmos. Meas. Tech. 2020, 13, 1315–1335. [Google Scholar] [CrossRef] [Green Version]
- Goldberg, D.L.; Anenberg, S.C.; Griffin, D.; McLinden, C.A.; Lu, Z.; Streets, D.G. Disentangling the Impact of the COVID-19 Lockdowns on Urban NO2 From Natural Variability. Geophys. Res. Lett. 2020, 47, 1–11. [Google Scholar] [CrossRef]
- Zhang, R.; Zhang, Y.; Lin, H.; Feng, X.; Fu, T.-M.; Wang, Y. NOx Emission Reduction and Recovery during COVID-19 in East China. Remote Sens. 2020, 11, 433. [Google Scholar] [CrossRef] [Green Version]
- Cersosimo, A.; Serio, C.; Masiello, G. TROPOMI NO2 Tropospheric Column Data: Regridding to 1 km Grid-Resolution and Assessment of their Consistency with In Situ Surface Observations. Remote Sens. 2020, 12, 2212. [Google Scholar] [CrossRef]
- European Space Agency. Air Pollution in a Post-COVID-19 World. 2020. Available online: www.esa.int/Applications/Observing_the_Earth/Copernicus/Sentinel-5P/Air_pollution_in_a_post-COVID-19_world (accessed on 27 July 2021).
- Zhang, R.; Wang, Y.; Smeltzer, C.; Qu, H.; Koshak, W.; Folkert Boersma, K. Comparing OMI-based and EPA AQS in situ NO2 trends: Towards understanding surface NOx emission changes. Atmos. Meas. Tech. 2018, 11, 3955–3967. [Google Scholar] [CrossRef] [Green Version]
- Tong, D.Q.; Lamsal, L.; Pan, L.; Ding, C.; Kim, H.; Lee, P.; Chai, T.; Pickering, K.E.; Stajner, I. Long-term NOx trends over large cities in the United States during the great recession: Comparison of satellite retrievals, ground observations, and emission inventories. Atmos. Environ. 2015, 107, 70–84. [Google Scholar] [CrossRef]
- Marongiu, A. Stima Preliminare delle Emissoni in Lombardia Durante L’emergenza COVID-19; Technical Report; Agenzia Regionale per la Protezione dell’Ambiente della Lombardia: Milano, Italy, 2020; Available online: https://www.arpalombardia.it/sites/DocumentCenter/Documents/ARIA/report-stima-emissiva-COVID19-lombardia.pdf (accessed on 27 July 2021).
- Atmosphere Monitoring Service. Air Quality Information Confirms Reduced Activity Levels Due to Lockdown in Italy. 2020. Available online: atmosphere.copernicus.eu/air-quality-information-confirms-reduced-activity-levels-due-lockdown-italy (accessed on 27 July 2021).
- Gualtieri, G.; Brilli, L.; Carotenuto, F.; Vagnoli, C.; Zaldei, A.; Gioli, B. Quantifying road traffic impact on air quality in urban areas: A Covid19-induced lockdown analysis in Italy. Environ. Pollut. 2020, 267, 1–10. [Google Scholar] [CrossRef]
- Copernicus Atmosphere Monitoring Service. European Air Quality Information in Support of the COVID-19 Crisis. 2020. Available online: https://atmosphere.copernicus.eu/european-air-quality-information-support-covid-19-crisis (accessed on 27 July 2021).
- Monaci, S. Milano Dopo il Covid: Commercio e Servizi Vanno Peggio della Media Italiana. Il Sole 24 ore. 7 July 2020. Available online: https://www.ilsole24ore.com/art/milano-il-covid-commercio-e-servizi-vanno-peggio-media-italiana-ADqHZnc (accessed on 27 July 2021).
- Assolombarda. Dati e Analisi della Città che Cambia. Available online: https://www.assolombarda.it/centro-studi/your-next-milano-2021 (accessed on 27 July 2021).
- Tirachini, A.; Cats, O. COVID-19 and Public Transportation: Current Assessment, Prospects, and Research Needs. J. Public Transp. 2020, 22, 1–21. [Google Scholar] [CrossRef]
- TomTom. The Effect of the COVID-19 Lockdown on Mobility in Italy. 2020. Available online: https://www.tomtom.com/covid-19/country/italy/ (accessed on 27 July 2021).
- Moovit. L’impatto del Coronavirus (Covid-19) Sull’utilizzo del Trasporto Pubblico. 2020. Available online: https://moovitapp.com/insights/it/Analisi_Moovit_sull_indice_per_la_mobilitá_pubblica-223 (accessed on 27 July 2021).
- Sung, J.; Monschauer, Y. Changes in Transport Behaviour during the COVID-19 Crisis. 2020. Available online: https://www.iea.org/articles/changes-in-transport-behaviour-during-the-covid-19-crisis (accessed on 27 July 2021).
- Boscacci, F.; Maltese, I.; Mariotti, I. Smartness and Italian cities. A cluster analysis. TeMA J. Land Use Mobil. Environ. 2014, 141–162. [Google Scholar] [CrossRef]
- Conticini, E.; Frediani, B.; Caro, D. Can atmospheric pollution be considered a co-factor in extremely high level of SARS-CoV-2 lethality in Northern Italy? Environ. Pollut. 2020, 261, 114465. [Google Scholar] [CrossRef] [PubMed]
- Magazzino, C.; Mele, M.; Sarkodie, S.A. The nexus between COVID-19 deaths, air pollution and economic growth in New York state: Evidence from Deep Machine Learning. J. Environ. 2021, 286, 112241. [Google Scholar]
- Magazzino, C.; Mele, M.; Schneider, N. The relationship between air pollution and COVID-19-related deaths: An application to three French cities. Appl. Energy 2020, 279, 115835. [Google Scholar] [CrossRef] [PubMed]
- Mele, M.; Magazzino, C.; Schneider, N.; Strezov, V. NO2 levels as a contributing factor to COVID-19 deaths: The first empirical estimate of threshold values. Environ. Res. 2021, 194, 110663. [Google Scholar] [CrossRef] [PubMed]
- Perry, T.S. The post-pandemic tech workplace. IEEE Spectr. 2020, 9, 19. [Google Scholar]
Publisher’s Note: MDPI stays neutral with regard to jurisdictional claims in published maps and institutional affiliations. |
© 2021 by the authors. Licensee MDPI, Basel, Switzerland. This article is an open access article distributed under the terms and conditions of the Creative Commons Attribution (CC BY) license (https://creativecommons.org/licenses/by/4.0/).

