
Development of Roughness Prediction Models for Laos National Road Network


Abstract
1. Introduction
- Rate of pavement degradation at both the project and network level,
- Evaluation of pavement assets (residual service life), and
- Road user costs.
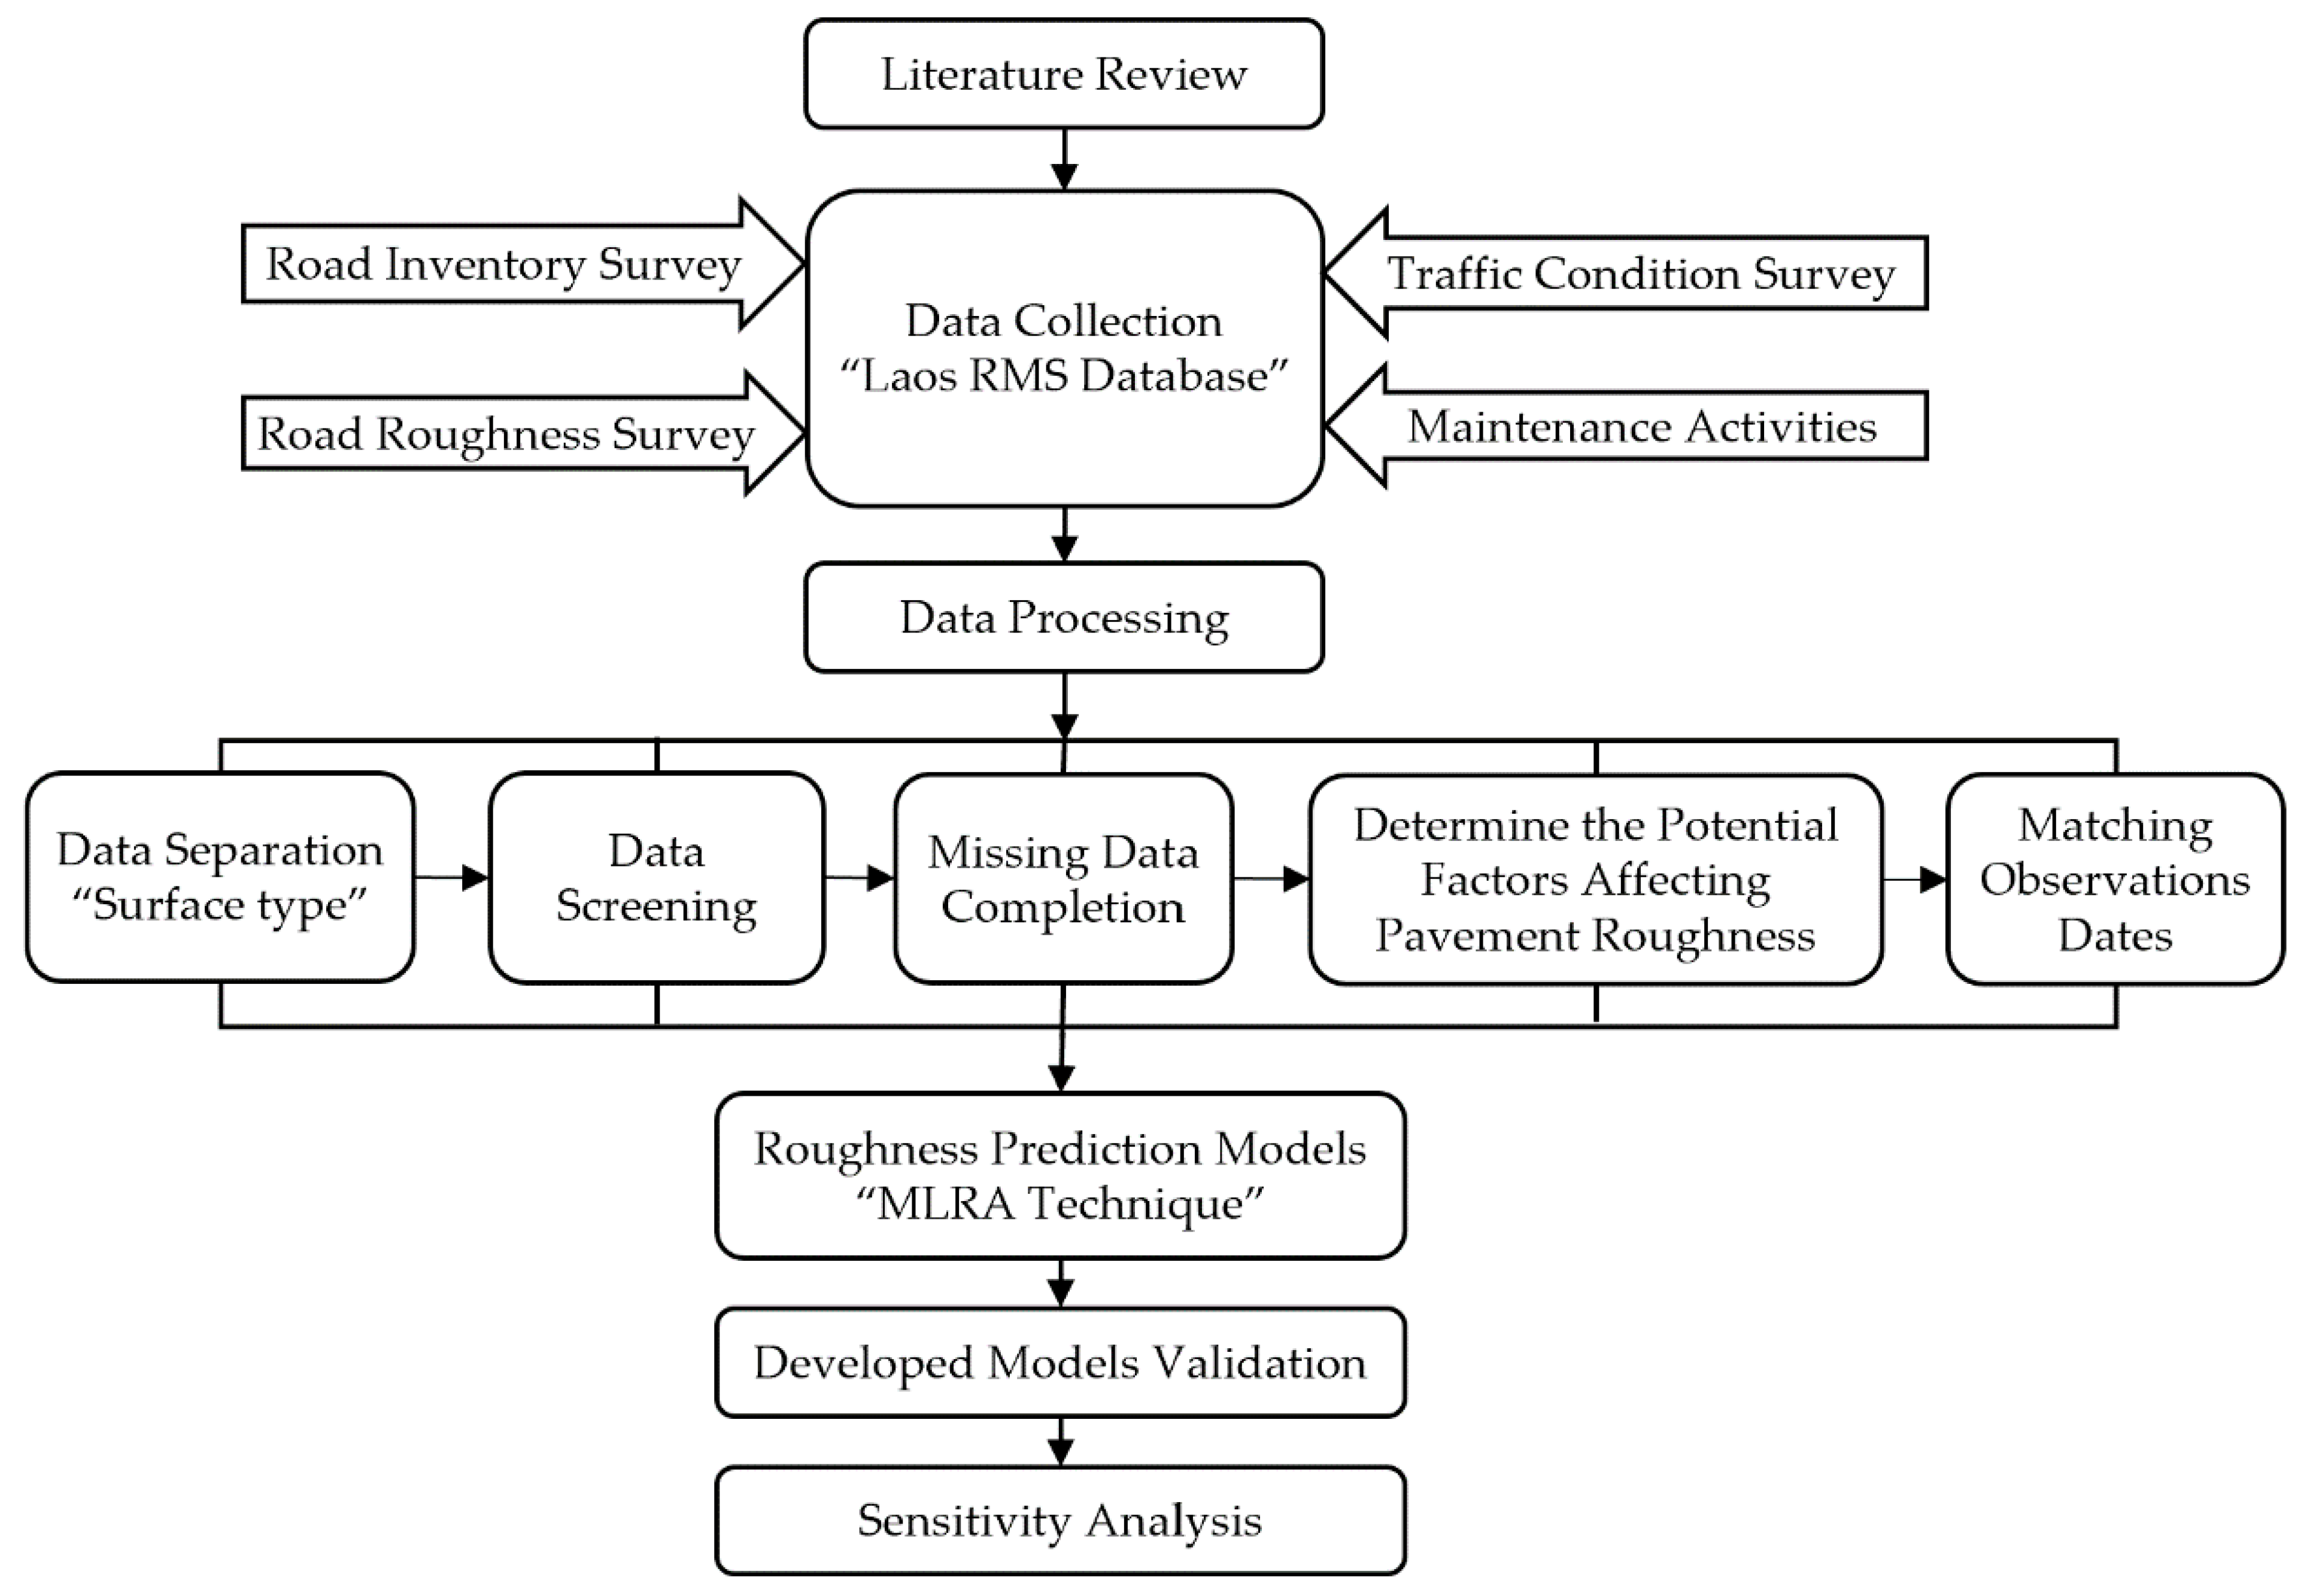
2. Methodology
2.1. Data Collection
- Road Inventory Survey (RIS): road and section number, section length and width, surface type, no. of lanes, shoulder type and width, kilometric stations, road category, and survey date.
- Road Roughness Survey (ROS): 100 m interval IRI values over each section’s entire length. The IRI data were measured at an approximate speed of 80 km/h for the right (outer) wheel track without any specific criteria for the distance from the road’s pavement edge.
- Traffic Condition Survey (TCS): annual average daily traffic (AADT), traffic growth rates, classified traffic volume survey, and vehicle classification (See Table 4).
- Last maintenance activity type and date.
2.2. Data Separation
2.3. Data Screening
2.4. Missing Data Completion
2.5. Determining the Potential Factors Affecting Pavement Roughness
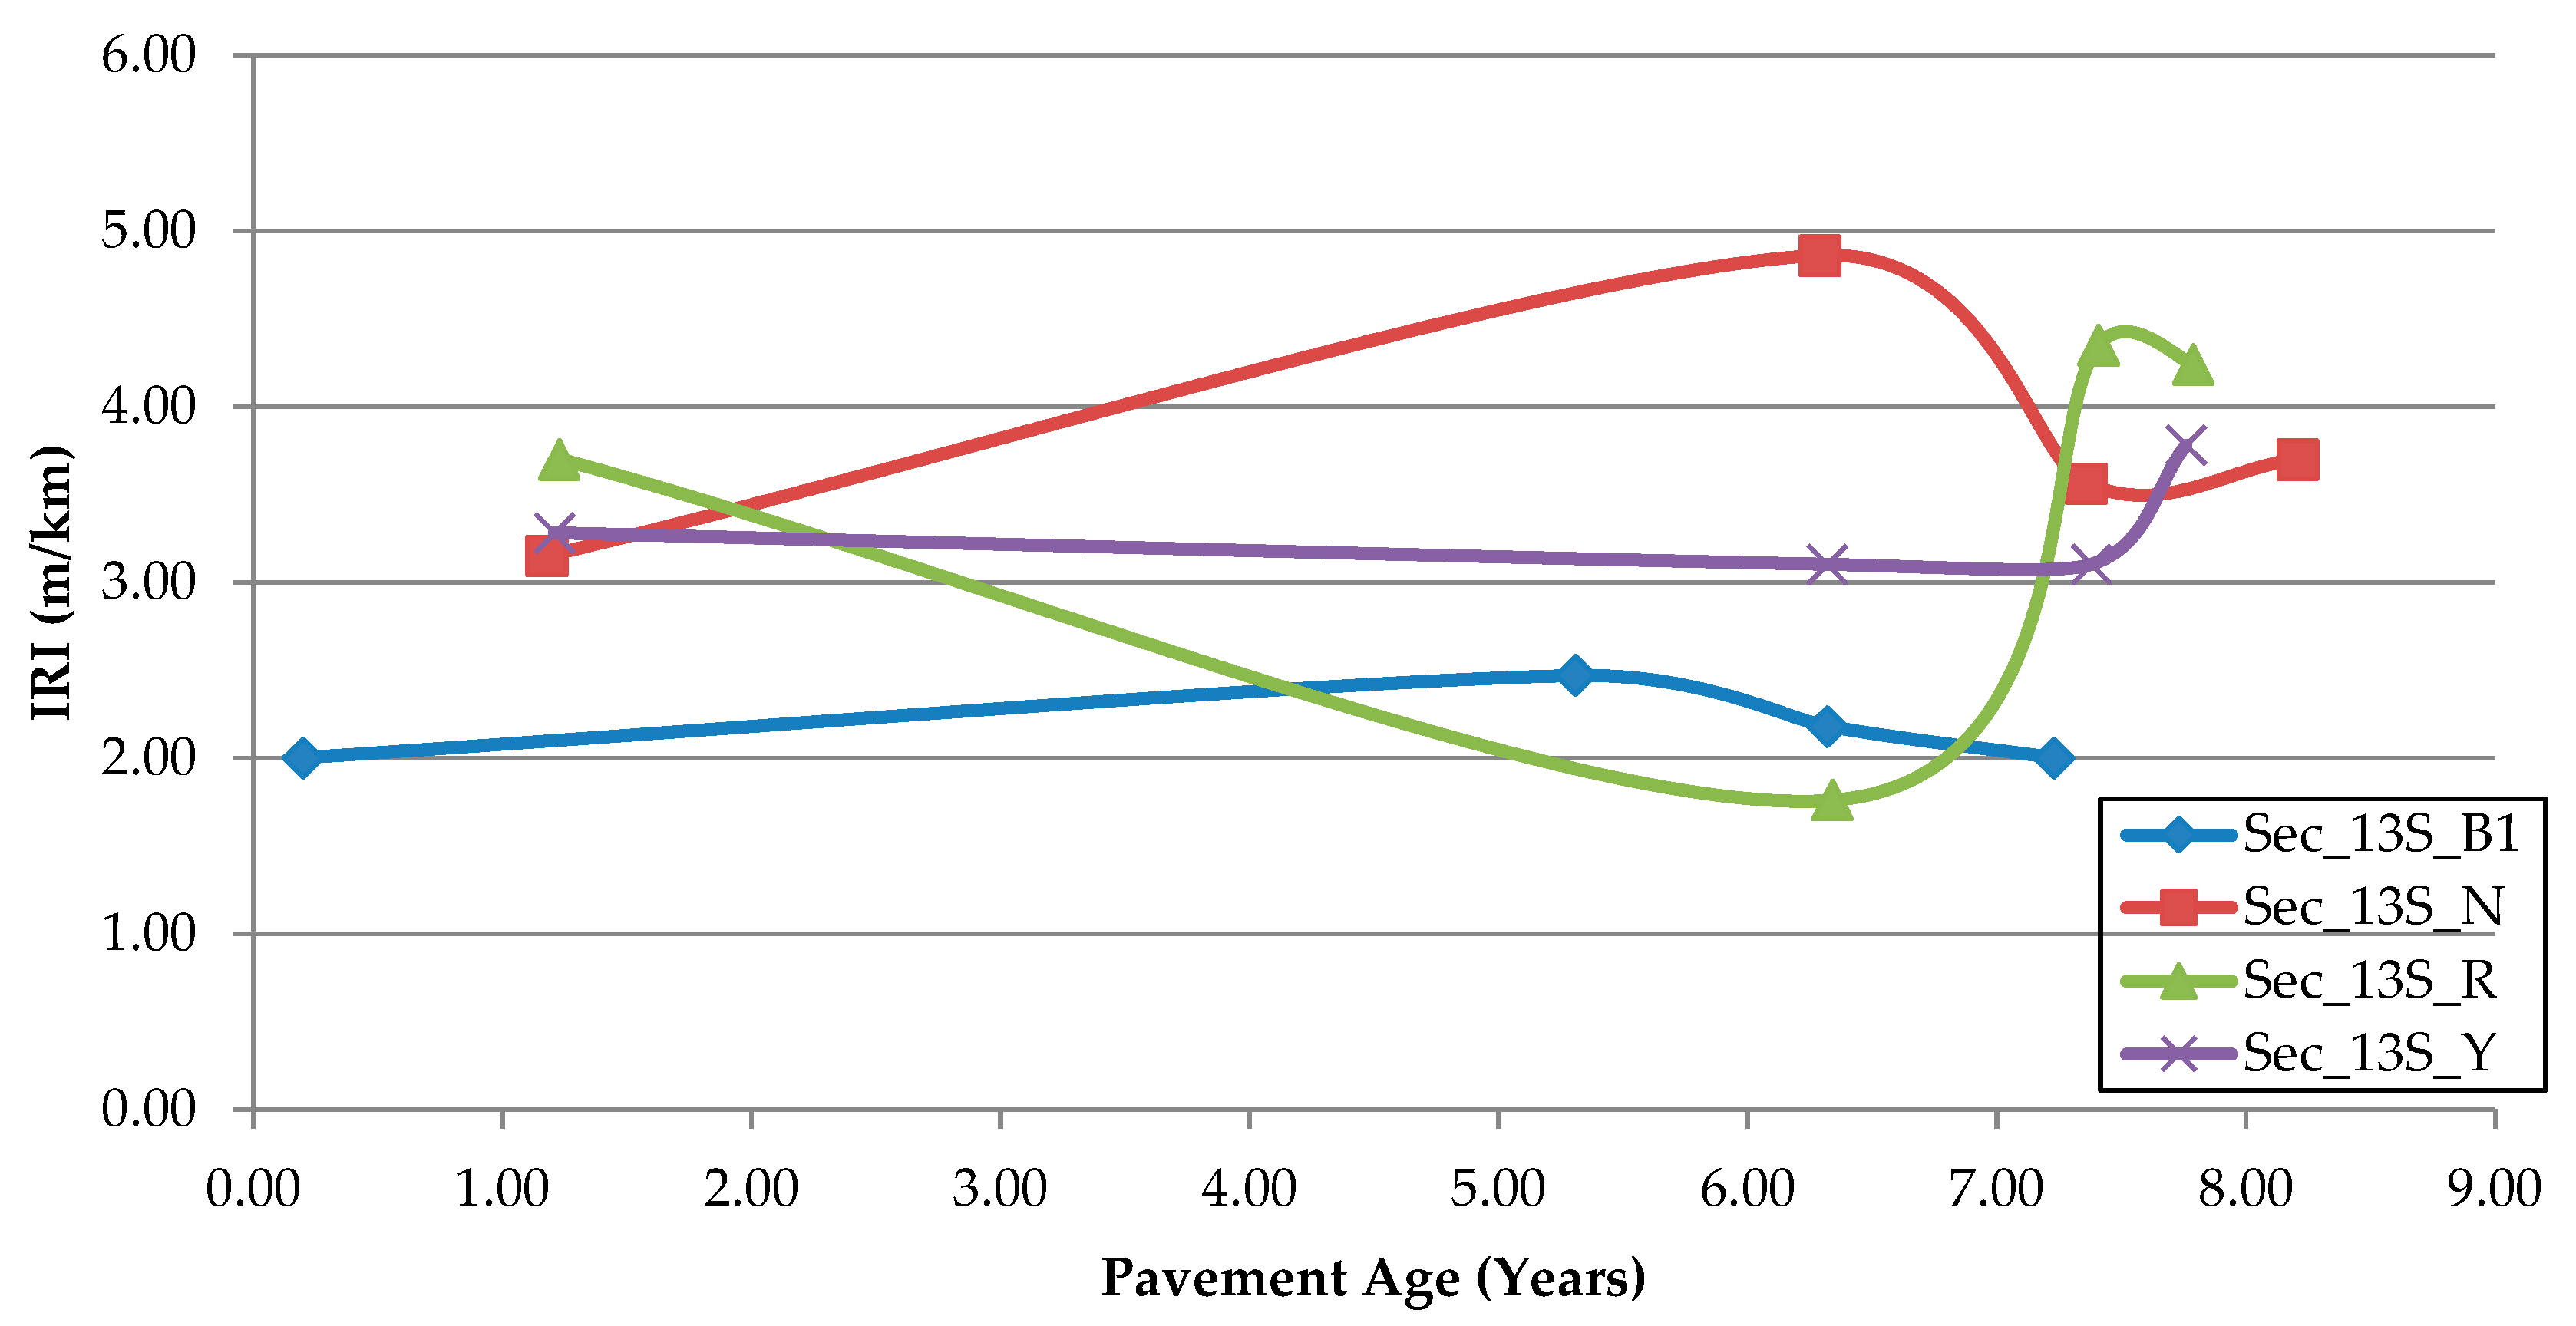
2.5.1. Pavement Age
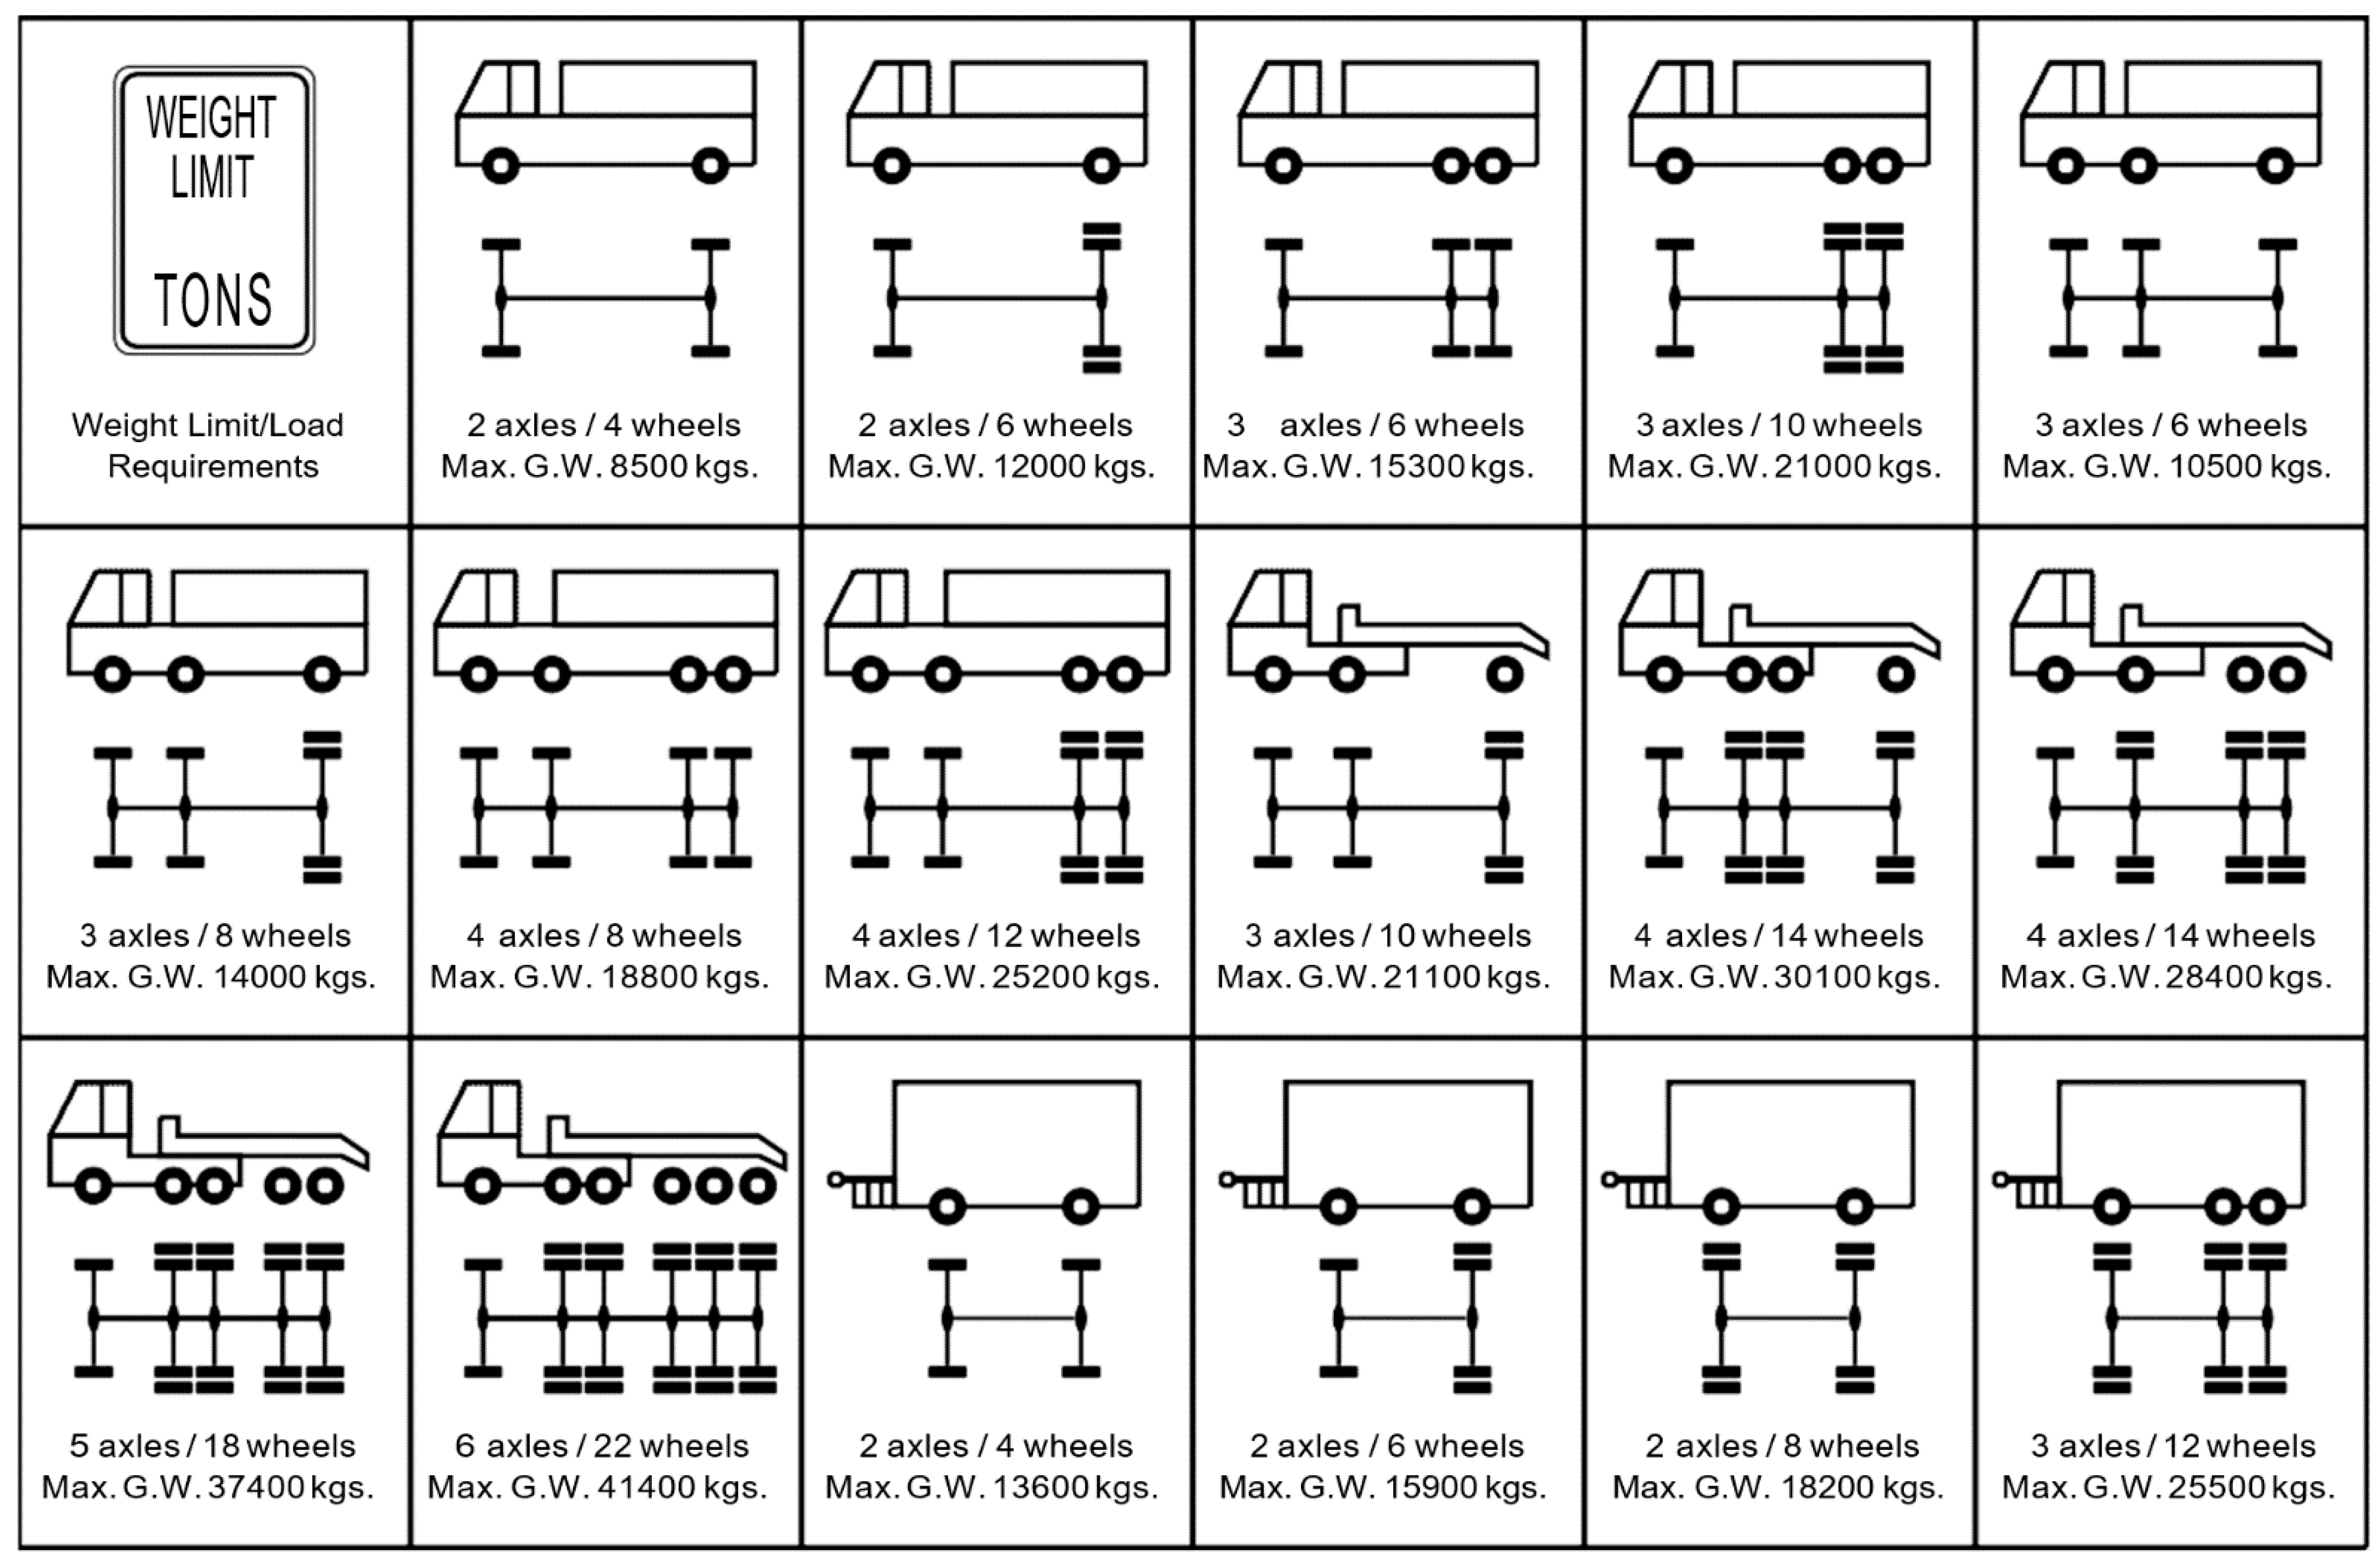
2.5.2. Cumulative Equivalent Single-Axle Load (CESAL)
- Axle load distribution: The axle load distribution, wheel configuration, and maximum gross vehicle weight amongst commercial vehicles that use NRs were collected from the Ministry of Public Work and Transport (MPWT), Lao PDR (as shown in Figure 3). The legal axle load limits enforced in Lao PDR are as follows: 9.10 tons for single-axle 4-wheelers, 6.80 tons for single-axle 2-wheelers, 6.10 tons (per axle) for tandem-axle 4-wheelers, and 6.80 tons (per axle) for triple-axle 4-wheelers [6,42].
- Equivalent Axle Load Factor: The ratio of the destructive effect of a nonstandard axle load to a standard axle load is called the Equivalent Axle Load Factor (EALF) [44]. The number of repetitions under every single-, tandem-, or triple-axle load should be multiplied by its EALF to get the equivalent effect depending on an 80 kN single-axle load. Equation (1) is used to calculate the EALF for different axle loads applied in Laos commercial vehicles [6].
- Truck Factor (TF): TF can be counted for every vehicle by collecting all vehicle EALF values. Then, an average TF is calculated for each vehicle class (e.g., medium trucks, heavy trucks, and truck trailers) by collecting the ESAL of all vehicles in every class and dividing by the number of vehicles using Equation (2).where:TFi = Truck factor for the ith vehicle class,n = vehicle number in the ith vehicle class,EALFj = Equivalent Axle Load Factor for the jth vehicle.
- Cumulative Equivalent Single-Axle Load: The data and parameters obtained from the prior sections can now be utilized to calculate the CESAL using Equation (3) [45].where:DF = Directional Factor is the ratio of ESAL allocation by direction.LF = Lane distribution Factor is the ratio of traffic volume allocation over lanes in one direction.(AADT0)i = Initial annual average daily traffic for the ith vehicle category in both directions.TFi = Truck factor for the ith vehicle category.r = Traffic growth rate, found in the Laos RMS database.n = Design period.

2.6. Matching Observation Dates
3. Result
3.1. Regression Model Development
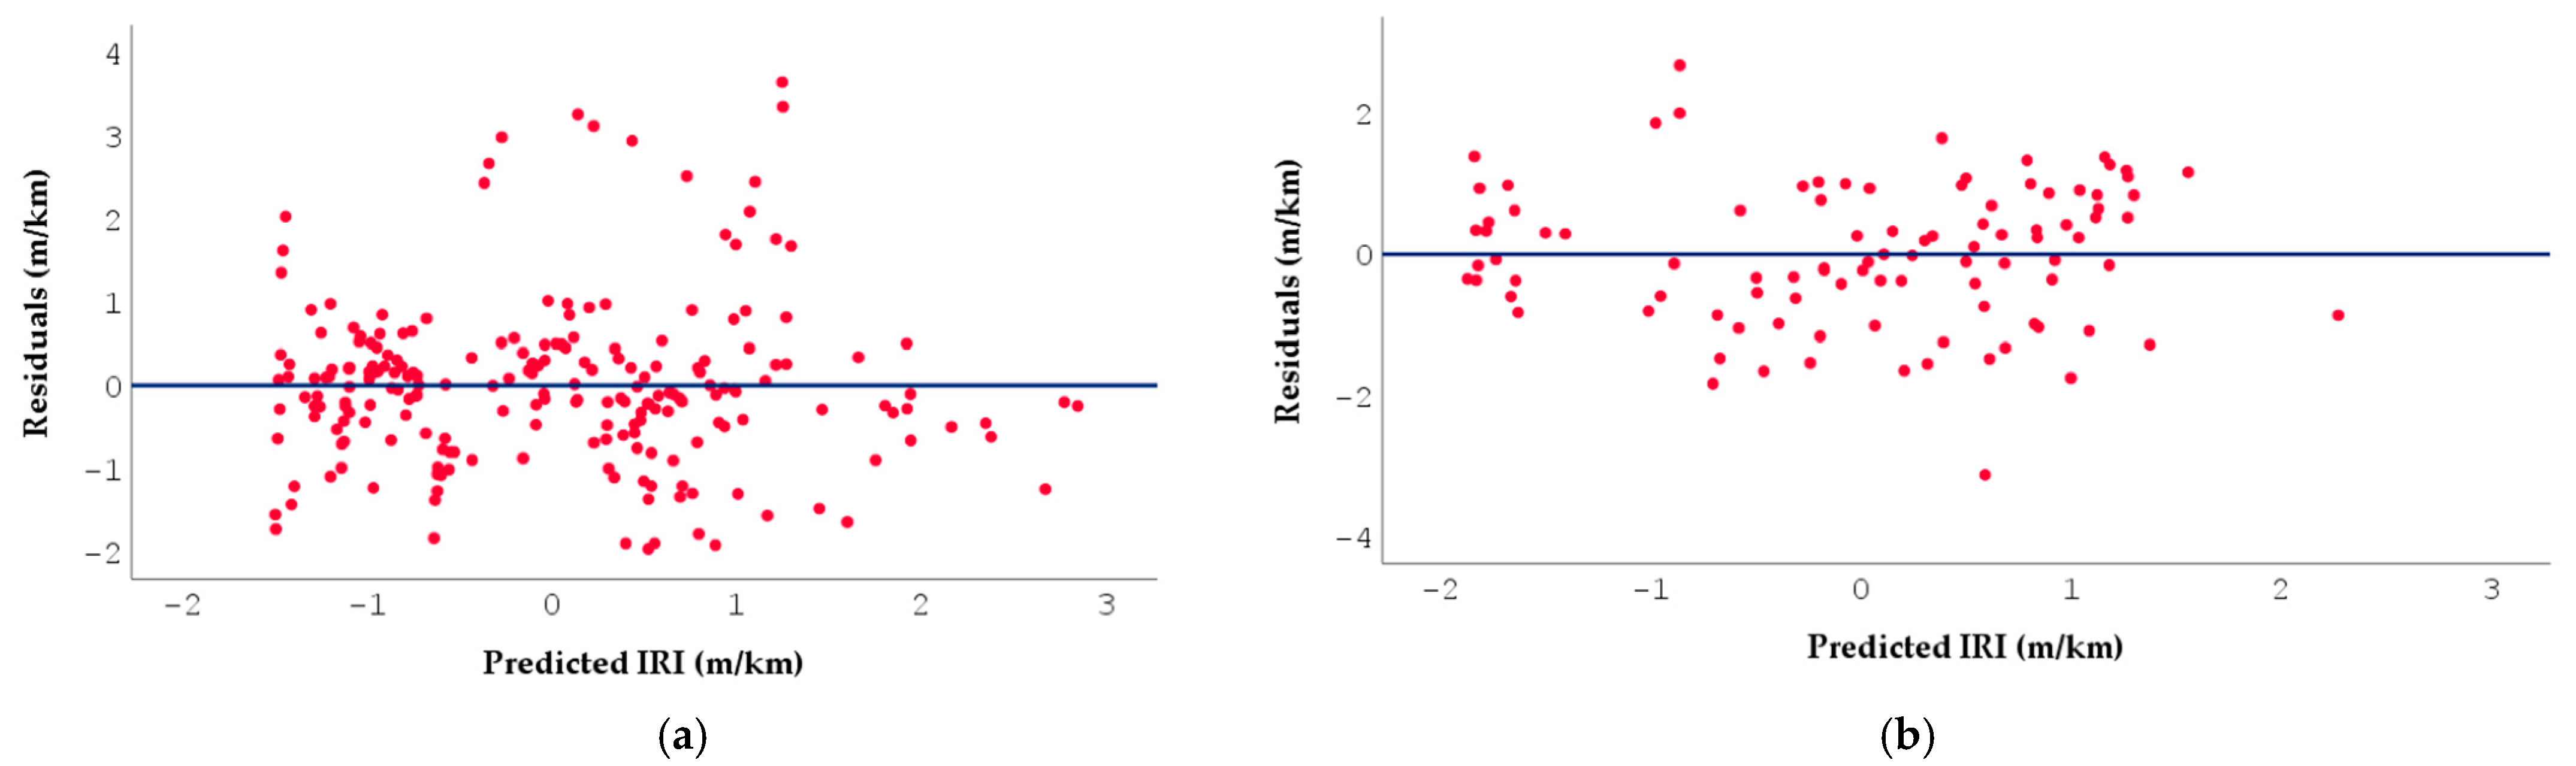
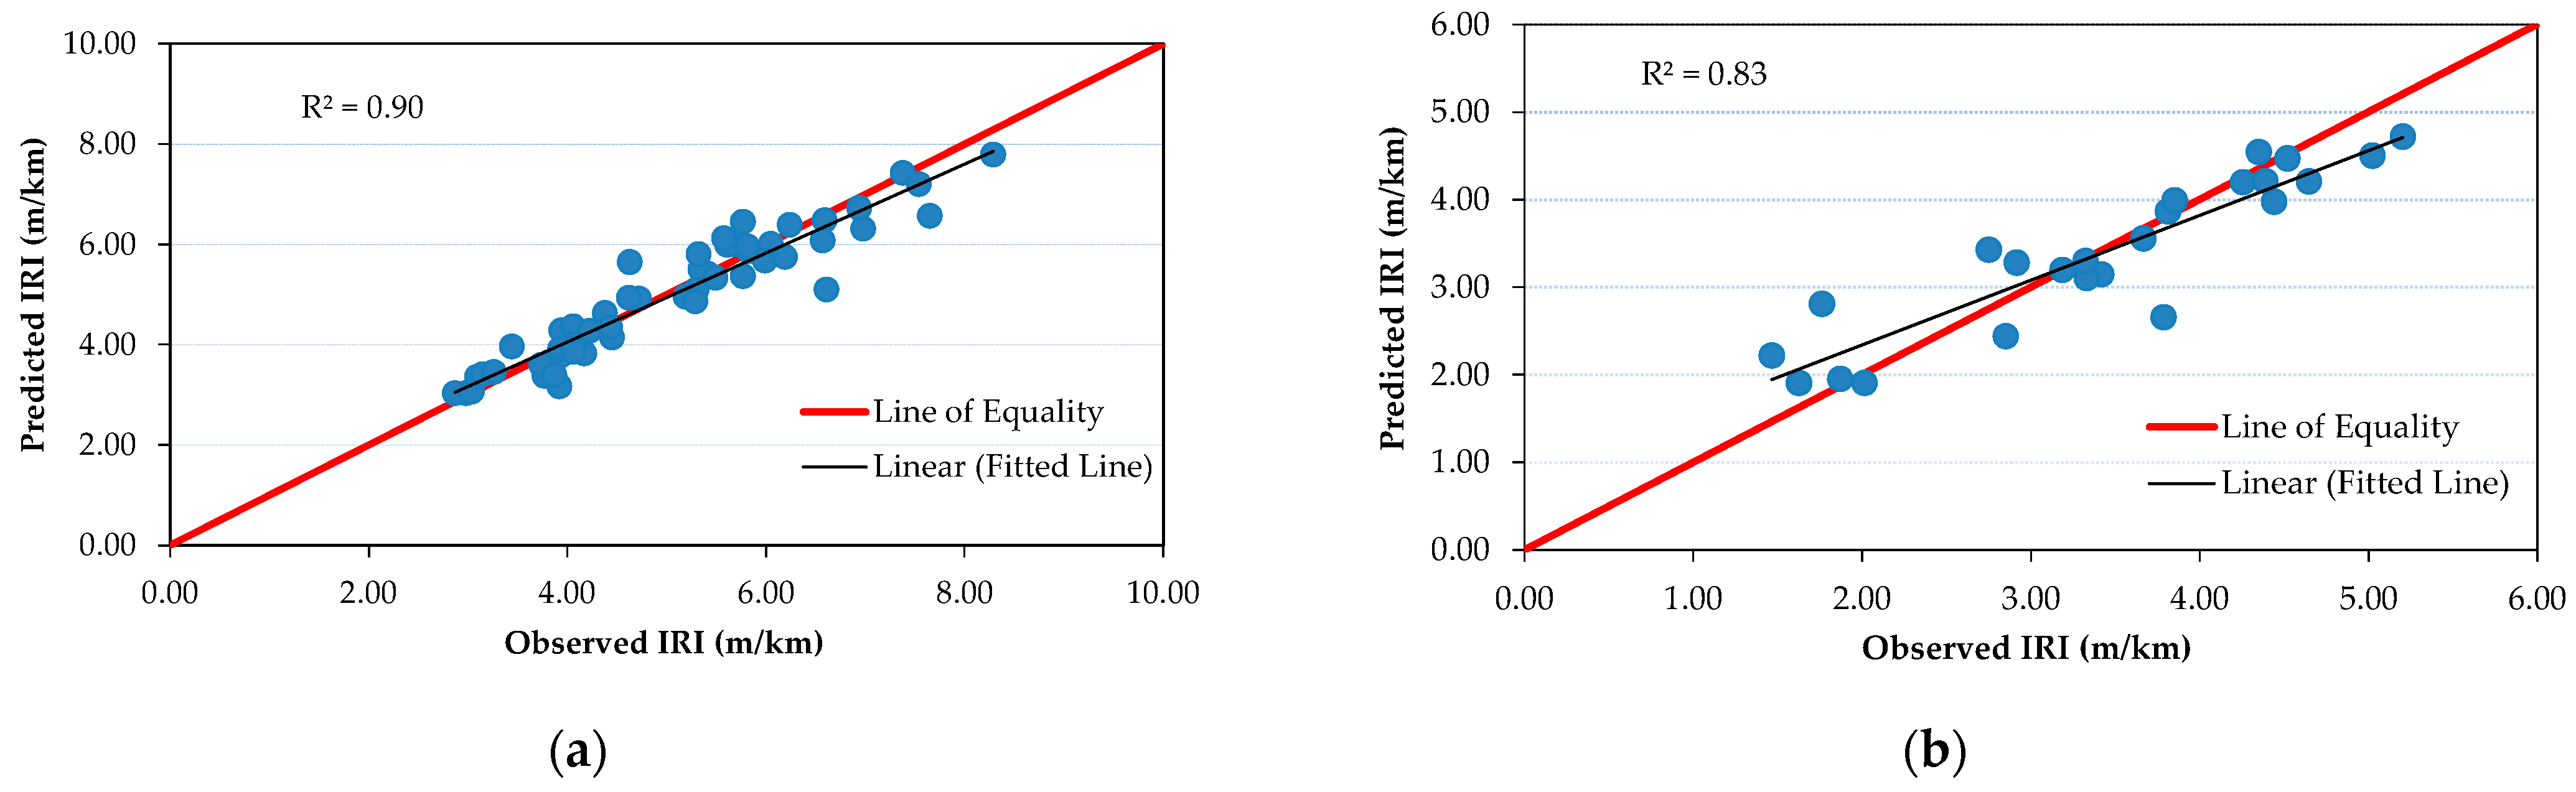
3.2. Model Validation
3.3. Statistical Validity of the Developed Models
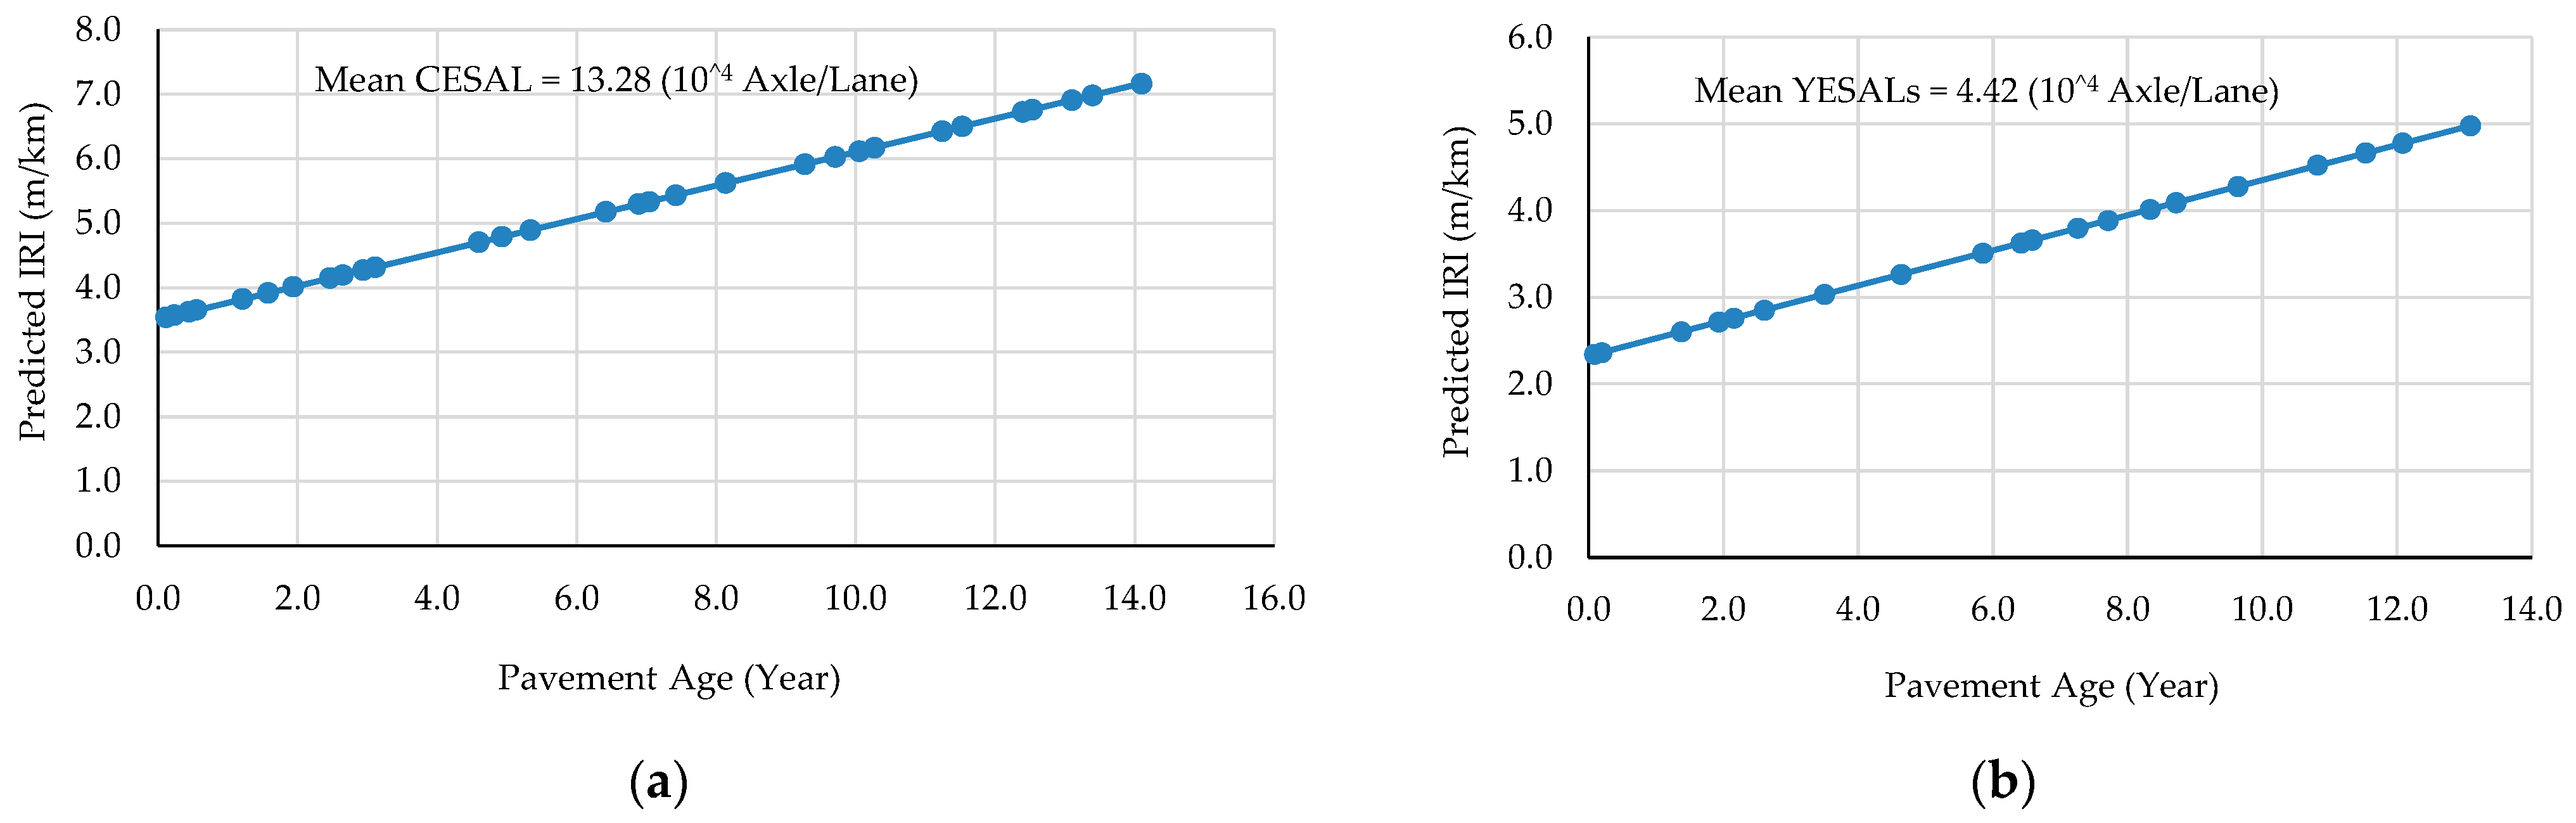
3.4. Sensitivity Analysis of Roughness Models
4. Discussion
Author Contributions
Funding
Institutional Review Board Statement
Informed Consent Statement
Data Availability Statement
Acknowledgments
Conflicts of Interest
Appendix A

| Abbreviation Symbols | Variable Name | Abbreviation Symbols | Variable Name |
|---|---|---|---|
| IRI0 | Initial IRI | TLF | Time Lapse Factor |
| AGE | Pavement age since last overlay reconstruction or new construction | RL | Ravelling as percent of total lane area |
| AGE0 | Initial age | RUT | Rutting |
| ΔAGE0 | Difference in AGE0 | SDRU | Standard Deviation of Rut Depth |
| AADT | Average Annual Daily Traffic | COVRU | Rut Depth Coefficient of Variation |
| ESAL | Equivalent Single-Axle Load | TC | Transverse Cracking |
| CESAL0 | Initial Cumulative ESAL | MC | Miscellaneous Cracking |
| ΔCESAL0 | Difference in CESAL0 | FC | Fatigue Cracking |
| CVPD | No. of Commercial Vehicles per day | BC | Block Cracking |
| MSN | Modified Structural Number | PI | Plasticity Index |
| SNPKb | Adjusted Structural Number due to Cracking | ΔRDS | Incremental change in standard deviation of rut depth |
| BTH | Base Layer Thickness | P | Patches as percent of total lane area |
| HSOLD | Total thickness of previous underlying surfacing layers | LCSNWP | Sealed Non-Wheel Path Longitudinal Cracking (WPLC) |
| HSNEW | Thickness of most recent surfacing | LCNWP | Non-WPLC |
| ACTH | Asphalt Concrete Overlay Thickness | LCS | Sealed WPLC |
| Rm | Average Annual Rainfall | ACXa | Area of Indexed Cracking |
| RSD | Standard Deviation in Monthly Rainfall | PACK | Area of Previous Indexed Cracking in the old surfacing |
| FI | Freezing Index | ΔACRA | Incremental change in area of total cracking |
| M | Environmental Coefficient | NPTa | Number of Potholes per km |
| P200 | Percent Passing No.200 sieve | ΔNPT | Incremental change in NPTa |
| P0.02 | Percent Passing 0.02 sieve | PH | Potholes as percent of total lane area |
| FM | Freedom of Maneuvering Index |
References
- ADB. Technical Assistance Consultant’s Report, Lao People’s Democratic Republic: Road Sector Governance and Maintenance Project (ADB TA-8492 LAO); ADB: Mandaluyong, Philippines, 2015. [Google Scholar]
- The World Bank. Implementation Status Results Report, Lao People’s Democratic Republic-Road Sector Project (P 102398); The World Bank: Washington, DC, USA, 2018. [Google Scholar]
- AIIB. Lao People’s Democratic Republic—National Road 13 Improvement and Maintenance Project (PD000066-LAO); AIIB: Beijing, China, 2009. [Google Scholar]
- ADB. Lao People’s Democratic Republic: Transport Sector Assessment, Strategy, and Road Map; ADB: Mandaluyong, Philippines, 2011. [Google Scholar]
- ABD. Independent Evaluation Department. Sector Assistance Program Evaluation for The Transport Sector in the Lao People’s Democratic Republic (LAO 2010-44); ABD, Independent Evaluation Department: Vientiane, Laos, 2010. [Google Scholar]
- Laos Ministry of Public Works and Transport. D. of R. Road Design Manual; Laos Ministry of Public Works and Transport: Vientiane, Laos, 2018.
- Laos Ministry of Public Works and Transport. D. of R. Summary of Road Network Statistics Year; Laos Ministry of Public Works and Transport: Vientiane, Laos, 2018.
- Gupta, A.; Kumar, P.; Rastogi, R. Pavement deterioration and maintenance model for low volume roads. Int. J. Pavement Res. Technol. 2011, 4, 195–202. [Google Scholar] [CrossRef]
- Arhin, S.A.; Williams, L.N.; Ribbiso, A.; Anderson, M.F. Predicting Pavement Condition Index Using International Roughness Index in a Dense Urban Area. J. Civ. Eng. Res. 2015, 5, 10–17. [Google Scholar] [CrossRef]
- Múčka, P. International Roughness Index specifications around the world. Road Mater. Pavement Des. 2017, 18, 929–965. [Google Scholar] [CrossRef]
- Sayers, M.W.; Gillespie, T.D.; Paterson, W.D.O. Guidelines for Conducting and Calibrating Road Roughness Measurements; The World Bank: Washington, DC, USA, 1986. [Google Scholar]
- Sayers, M.; Queiroz, C.; Queiroz, C. International Experiment to Establish Correlation and Standard Calibration Methods for Road Roughness Measurements, Draft Report to World Bank (UMTRI-82-45-1); The University of Michigan, Transportation Research Institute: Ann Arbor, MI, USA, 1982. [Google Scholar]
- Sayers, M.; Gillespie, T.; Queiroz, C. International Experiment to Establish Correlation and Standard Calibration Methods for Road Roughness Measurements; The World Bank: Washington, DC, USA, 1982. [Google Scholar]
- Sayers, M.W.; Karamihas, S.M. The Little Book of Profiling—Basic Information about Measuring and Interpreting Road Profiles; University of Michigan: Ann Arbor, MI, USA, 1998. [Google Scholar]
- Sayers, M.W. On the Calculation of International Roughness Index from Longitudinal Road Profile. Transp. Res. Rec. 1995. Available online: https://trid.trb.org/view/452992 (accessed on 1 February 2021).
- ARA. Guide for Mechanistic-Empirical Design of New and Rehabilitated Pavement Structures. Appendix A: Glossary of Terms. National Cooperative Highway Research Program. 2004. Available online: http://onlinepubs.trb.org/onlinepubs/archive/mepdg/appendix_A_Glossary.pdf (accessed on 1 February 2021).
- Jagadeesh, H.S.; Harikeerthan, M.K. Pavement roughness modelling on arterial roads in Bangalore City. Int. J. Sci. Res. Dev. 2017, 5, 123–126. [Google Scholar]
- Park, K.; Thomas, N.E.; Lee, K.W. Applicability of the international roughness index as a predictor of asphalt pavement condition. J. Transp. Eng. 2007, 133, 706–709. [Google Scholar] [CrossRef]
- Chang, L.-W.; Chou, C.-P.; Tsai, C.-Y.; Chen, A.-C. Analysis the Relationship between Pavement Smoothness Indices. J. East. Asia Soc. Transp. Stud. 2011, 9, 1376–1390. [Google Scholar] [CrossRef]
- Laos Public Works and Transport Institute. D. of I. and T. Annual Road Asset Report; Laos Public Works and Transport Institute: Vientiane, Laos, 2017.
- Sandra, A.K.; Sarkar, A.K. Development of a model for estimating International Roughness Index from pavement distresses. Int. J. Pavement Eng. 2013, 14, 715–724. [Google Scholar] [CrossRef]
- Abdelaziz, N.; Abd El-Hakim, R.T.; El-Badawy, S.M.; Afify, H.A. International Roughness Index prediction model for flexible pavements. Int. J. Pavement Eng. 2020, 21, 88–99. [Google Scholar] [CrossRef]
- Japan International Cooperation Agency (JICA). The Project for Improvement of Road Management Capability in Lao PDR; Japan International Cooperation Agency: Yokosuka, Japan, 2018.
- Japan International Cooperation Agency (JICA). Mitsubishi Research Institute, I. Information Collection and Confirmation Survey on Road and Bridge Maintenance Management Final Report (Summary); International Cooperation Agency: Yokosuka, Japan, 2013.
- Hamdi; Hadiwardoyo, S.P.; Correia, A.G.; Pereira, P.; Cortez, P. Prediction of surface distress using neural networks. AIP Conf. Proc. 2017, 1855. [Google Scholar] [CrossRef]
- Xu, G.; Bai, L.; Sun, Z. Pavement deterioration modeling and prediction for Kentucky interstate and highways. In Proceedings of the 2014 Industrial and Systems Engineering Research Conference, Nashville, TN, USA, 30 May–2 June 2014; pp. 993–1002. [Google Scholar]
- Knudsen, F.; Kirk, J. Pavement management in finland: Decision-making from national policies to project-level programming. In Proceedings of the 4th International Conference on Managing Pavements, Durban, South Africa, 17–21 May 1998; International Convention Centre (ICC): Sydney, Australia, 1998; Volume 26, p. 15. [Google Scholar]
- Lin, J.; Yau, J.-T.; Hsiao, L.-H. Correlation Analysis Between International Roughness Index (IRI) By. In Proceedings of the 82nd Annual Meeting of the Transportation Research Board, Washington, DC, USA, 12–16 January 2003; pp. 1–21. [Google Scholar]
- Ziari, H.; Sobhani, J.; Ayoubinejad, J.; Hartmann, T. Prediction of IRI in short and long terms for flexible pavements: ANN and GMDH methods. Int. J. Pavement Eng. 2015, 17, 776–788. [Google Scholar] [CrossRef]
- Hossain, M.I.; Gopisetti, L.S.P.; Miah, M.S. International roughness index prediction of flexible pavements using neural networks. J. Stomatol. 2019, 145, 1–10. [Google Scholar] [CrossRef]
- ARA. Guide for Mechanistic-Empirical Design of New and Rehabilitated Pavement Structures. Appendix OO-1: Background and Preliminary Smoothness Prediction Models for Flexible Pavements. National Cooperative Highway Research Program. 2001. Available online: http://onlinepubs.trb.org/onlinepubs/archive/mepdg/2appendices_oo.pdf (accessed on 1 February 2021).
- Nassiri, S.; Shafiee, M.H.; Bayat, A. Development of roughness prediction models using alberta transportation’s pavement management system. Int. J. Pavement Res. Technol. 2013, 6, 714–720. [Google Scholar] [CrossRef]
- Makendran, C.; Murugasan, R.; Velmurugan, S. Performance prediction modelling for flexible pavement on low volume roads using multiple linear regression analysis. J. Appl. Math. 2015, 2015. [Google Scholar] [CrossRef]
- Mazari, M.; Rodriguez, D.D. Prediction of pavement roughness using a hybrid gene expression programming-neural network technique. J. Traffic Transp. Eng. 2016, 3, 448–455. [Google Scholar] [CrossRef]
- Odoki, J.B.; Kerali, G.R.H. Volume Four: Analytical Framework and Model Descriptions. Highway Development and Management Model HDM-4 (Version 1.2). 2001. Available online: http://hdm4.piarc.org/ (accessed on 23 December 2020).
- Aggarwal, S.; Jain, S.S.; Parida, M. Calibration of HDM-4 bituminous road deterioration models for Indian conditions. Proc. Conf. Aust. Road Res. Board 2003, 21, 1535–1553. [Google Scholar]
- Darter, M.I. Concrete pavement evaluation system (COPES)-nationwide prediction model demonstration. In Proceedings of the 3rd International Conference on Cocrete Pavement Design and Rehabilitation, Indianapolis, IN, USA, 23–25 April 1985; pp. 453–468. [Google Scholar]
- Sadek, A.W.; Freeman, T.E.; Demetsky, M.J. The Development of Performance Prediction Models for Virginia’s Interstate Highway System, Volume II: Model Development; FHWA/VTRC: Springfield, VA, USA, 1995. [Google Scholar]
- Han, D.; Kobayashi, K.; Do, M. Improved calibration for HDM-4 implementation: A lesson from Korean experiences. JSCE 2009, 4. Available online: http://library.jsce.or.jp/jsce/open/00039/200911_no40/pdf/84.pdf (accessed on 23 December 2020).
- Han, D.; Kobayashi, K.; Do, M. Section-based multifunctional calibration method for pavement deterioration forecasting model. KSCE J. Civ. Eng. 2013, 17, 386–394. [Google Scholar] [CrossRef]
- Pérez-Acebo, H.; Linares-Unamunzaga, A.; Rojí, E.; Gonzalo-Orden, H. IRI performance models for flexible pavements in two-lane roads until first maintenance and/or rehabilitation work. Coatings 2020, 10, 97. [Google Scholar] [CrossRef]
- ADB. Technical Assistance Consultant’s Report, Regional: Knowledge Development Support for Southeast Asia, Assessment of Axle Load Control Operations in Greater Mekong Subregion Countries (Project Number: 49150-001); ADB: Mandaluyong, Philippines, 2019. [Google Scholar]
- Ksoll, C.; Apthorp, P.F.; Phimphachanh, P. Transport Costs and Prices in Lao PDR: Unlocking the Potential of an Idle Fleet; The World Bank: Washington, DC, USA, 2018. [Google Scholar]
- Tjan, A.; Fung, C. Determination of Equivalent Axle Load Factor of Trailer with Multiple Axles on Flexible Pavement Structures. J. East. Asia Soc. Transp. Stud. 2005, 6, 1194–1206. [Google Scholar]
- AASHTO. Guide for the Design of Pavement Structures; AASHTO: Washington, DC, USA, 1986; p. 1993. [Google Scholar]
- Alin, A. Multicollinearity. Wiley Interdiscip. Rev. Comput. Stat. 2010, 2, 370–374. [Google Scholar] [CrossRef]
- Kutner, M.H.; Nachtsheim, C.J.; Neter, J. Simultaneous inferences and other topics in regression analysis. In Applied Linear Regression Models, 4th ed.; McGraw-Hill Irwin: New York, NY, USA, 2004; pp. 168–170. [Google Scholar]


| Type of Road | Concrete | Asphalt | DBST | Gravel | Earth | Total | Percent |
|---|---|---|---|---|---|---|---|
| National Roads (km) | 85.73 | 995.23 | 5426.01 | 794.95 | 238.05 | 7539.96 | 12.45% |
| Provincial Roads (km) | 81.73 | 64.70 | 1770.69 | 5614.85 | 959.77 | 8491.74 | 14.02% |
| District Roads (km) | 67.78 | 0.00 | 586.20 | 4244.73 | 2289.38 | 7188.09 | 11.87% |
| Urban Roads (km) | 255.42 | 127.67 | 1219.02 | 1325.52 | 706.86 | 3634.50 | 6.00% |
| Rural Roads (km) | 29.61 | 4.00 | 559.31 | 10,007.72 | 15,577.05 | 26,177.69 | 43.23% |
| Special Roads (km) | 31.74 | 11.53 | 352.37 | 1198.02 | 5933.89 | 7527.56 | 12.43% |
| Total Length (km) | 552.02 | 1203.13 | 9913.60 | 23,185.79 | 25,705.00 | 60,559.54 | |
| Percent | 0.91% | 1.99% | 16.37% | 38.29% | 42.45% |
| Pavement Condition | Excellent | Good | Fair | Poor | Bad | Failed |
|---|---|---|---|---|---|---|
| IRI (m/km) | <3 | 3 to 4 | 4 to 5 | 5 to 6 | 6 to 8 | >8 |
| First Author, Year | Pavement Type | Source of Data | Prediction Method | Independent Variables 1 | Goodness of Fit |
|---|---|---|---|---|---|
| Von Quintus, 2001 [31] | Conventional HMA with thick granular base | LTPP database, GPS and SPS | Stepwise linear regression | IRI0, TC, COVRU, FC, BC, LCSNWP, AGE, RSD, Rm, P200, P0.02, PI, FI | R2 = 0.62, RMSE = 0.387 m/km, N = 353 |
| HMA deep-strength with asphalt-treated base | IRI0, AGE, FI, TC, FC, P | R2 = 0.49, RMSE = 0.29 m/km, N = 428 | |||
| HMA semi-rigid with cement-treated base | IRI0, SDRUT, FC, TC, BC, LCNWP | R2 = 0.83, RMSE = 0.23 m/km, N = 50 | |||
| HMA overlay of flexible pavement | IRI0, AGE, FC, TC, LCS, P, PH | R2 = 0.70, RMSE = 0.18 m/km, N = 797 | |||
| Nassiri (2013) [32] | New AC | Alberta’s PMS database | Multiple Linear Regression (MLR) | AGE, AADT, P200, TC, MC, RUT | R2 = 0.39, SEE = 0.42 m/km, N = 1000 |
| Straight AC overlay | AGE, AADT, FI, BTH, CTH, RUT, PI. | R2 = 0.39, SEE = 0.452 m/km, N = 501 | |||
| Makendran, 2015 [33] | Flexible pavement | Direct field measurement, India | MLR | AGE, MSN, CVPD | R2 = 0.89, SE = 0.77 m/km, N = 120 |
| Mazari, 2016 [34] | AC over unbound granular layers | LTPP, SPS database | Gene expression programming algorithm | IRI0, AGE0, CESAL0, SN, ΔAGE, ΔCESAL | R2 = 0.99, SE = 0.112 m/km, N = 80 |
| Abdelaziz, 2018 [22] | AC overlay | LTPP database for six sections; GPS-1, 2, 6; SPS-1, 3, 5 | MLR | IRI0, AGE, FC, TC, SDRUT | R2 = 0.57, SE = 0.325 m/km, N = 2439 |
| Sandra, 2012 [21] | AC overlay | Direct field measurement, India | MLR | IRI0, RUT, P, PH, MC, RL | R2 = 0.98, RMSE = 0.17 m/km, N = 355 |
| Odoki, 2000 [35] | Asphalt mix and surface treatment | Sections from more than 100 developed and developing countries | Structured empirical approach | IRI0, AGE, ESAL, AADT, SNPKb, ACXa, PACK, HSNEW, HSOLD, M, ΔACRA, ΔRDS, TLF, FM, NPTa, ΔNPT | N/A |
| Class Group | Description | Class Group | Description |
|---|---|---|---|
| Class 1 | Bicycle | Class 8 | Small bus (max 12 seats) |
| Class 2 | Oxcart | Class 9 | Medium bus (from 13 to 25 seats) |
| Class 3 | Minitractor | Class 10 | Heavy bus (more than 25 seats) |
| Class 4 | Motorcycle | Class 11 | Light truck (less than 4 tons) |
| Class 5 | Tuk-tuk | Class 12 | Medium truck (2 axles) |
| Class 6 | Passenger car | Class 13 | Heavy truck (3 axles or more) |
| Class 7 | Pick-up | Class 14 | Truck trailer |
| Surface Type | Total No. of Sections | Total No. of Observations | Valid No. of Sections | Valid No. of Observations |
|---|---|---|---|---|
| DBST | 214 | 997 | 83 | 269 |
| AC | 36 | 184 | 29 | 122 |
| CC | 4 | 33 | 2 | 6 |
| Surface Type | No. of the Best Fitting Relationship Type | Avg. R2 | |||
|---|---|---|---|---|---|
| Exponential | Linear | Logarithmic | Power | ||
| DBST | 44 | 27 | 8 | 4 | 0.94 |
| AC | 10 | 10 | - | 9 | 0.97 |
| DBST Model | AC Model | ||||||
|---|---|---|---|---|---|---|---|
| Variable | IRI | AGE | CESAL | Variable | IRI | AGE | YESAL |
| IRI | 1 | 0.85 | 0.73 | IRI | 1 | 0.82 | 0.64 |
| AGE | 0.85 | 1 | 0.42 | AGE | 0.82 | 1 | 0.31 |
| CESAL | 0.73 | 0.42 | 1 | YESAL | 0.64 | 0.31 | 1 |
| Variable Description | Notation | Unit | Range | Mean | Std. Deviation | |
|---|---|---|---|---|---|---|
| Min | Max | |||||
| DBST Model | ||||||
| Roughness | IRI | m/km | 2.20 | 8.91 | 5.09 | 1.44 |
| Pavement age since the last overlay | Age | years | 0.10 | 14.10 | 6.03 | 3.73 |
| Cumulative Equivalent Single-Axle Load | CESAL | 104 axles/lane | 0.02 | 99.26 | 13.28 | 16.55 |
| AC Model | ||||||
| Roughness | IRI | m/km | 1.47 | 5.46 | 3.54 | 1.02 |
| Pavement age since the last overlay | Age | years | 0.09 | 13.08 | 5.95 | 3.44 |
| The average Yearly Equivalent Single-Axle Load | YESAL | 104 axles/lane | 0.03 | 20.53 | 4.42 | 3.34 |
| Pavement Type | Model Equation | R2 | Std. Error of Estimate | No. of Observations |
|---|---|---|---|---|
| DBST | IRI = 3.006 + 0.259 age + 0.038 CESAL | 0.892 | 0.483 | 215 |
| AC | IRI = 1.782 + 0.203 age + 0.123 YESAL | 0.847 | 0.395 | 98 |
| df | Sum of Squares | Mean Square | F | p-Value | |
|---|---|---|---|---|---|
| DBST Model | |||||
| Regression | 2 | 406.912 | 203.456 | 872.091 | 3.6858 × 10−103 |
| Residual | 212 | 49.459 | 0.233 | ||
| Total | 214 | 456.370 | |||
| AC Model | |||||
| Regression | 2 | 82.508 | 41.254 | 263.848 | 8.0861 × 10−39 |
| Residual | 95 | 14.854 | 0.156 | ||
| Total | 97 | 97.362 | |||
| Independent Variable | Coefficient | Std. Error | Student’s t | p-Value | VIF |
|---|---|---|---|---|---|
| DBST Model | |||||
| Age | 0.259 | 0.010 | 26.426 | 3.7348 × 10−71 | 1.214 |
| CESAL | 0.038 | 0.002 | 18.265 | 1.5469 × 10−45 | 1.214 |
| AC Model | |||||
| Age | 0.203 | 0.012 | 16.405 | 2.4503 × 10⁻²⁹ | 1.105 |
| YESAL | 0.123 | 0.012 | 10.230 | 2.6803 × 10⁻¹⁶ | 1.105 |
Publisher’s Note: MDPI stays neutral with regard to jurisdictional claims in published maps and institutional affiliations. |
© 2021 by the authors. Licensee MDPI, Basel, Switzerland. This article is an open access article distributed under the terms and conditions of the Creative Commons Attribution (CC BY) license (http://creativecommons.org/licenses/by/4.0/).
Share and Cite
Gharieb, M.; Nishikawa, T. Development of Roughness Prediction Models for Laos National Road Network. CivilEng 2021, 2, 158-173. https://doi.org/10.3390/civileng2010009
Gharieb M, Nishikawa T. Development of Roughness Prediction Models for Laos National Road Network. CivilEng. 2021; 2(1):158-173. https://doi.org/10.3390/civileng2010009
Chicago/Turabian StyleGharieb, Mohamed, and Takafumi Nishikawa. 2021. "Development of Roughness Prediction Models for Laos National Road Network" CivilEng 2, no. 1: 158-173. https://doi.org/10.3390/civileng2010009
APA StyleGharieb, M., & Nishikawa, T. (2021). Development of Roughness Prediction Models for Laos National Road Network. CivilEng, 2(1), 158-173. https://doi.org/10.3390/civileng2010009