Article

Site-Specific Response Spectra: Guidelines for Engineering Practice

1
Department of Infrastructure Engineering, The University of Melbourne, Parkville, VIC 3010, Australia
2
Department of Civil and Construction Engineering, Swinburne University of Technology, Hawthorn, VIC 3122, Australia
3
Faculty of Engineering, Computing and Science, Swinburne University of Technology, Kuching 93350, Malaysia
*
Author to whom correspondence should be addressed.
CivilEng 2021, 2(3), 712-735; https://doi.org/10.3390/civileng2030039
Submission received: 22 July 2021 / Revised: 24 August 2021 / Accepted: 30 August 2021 / Published: 2 September 2021
(This article belongs to the Special Issue Advances in Civil Engineering)

Abstract

:
Code response spectrum models, which are used widely in the earthquake-resistant design of buildings, are simple to apply but they do not necessarily represent the real behavior of an earthquake. A code response spectrum model typically incorporates ground motion behavior in a diversity of earthquake scenarios affecting the site and does not represent any specific earthquake scenario. The soil amplification phenomenon is also poorly represented, as the current site classification scheme contains little information over the potential dynamic response behavior of the soil sediments. Site-specific response spectra have the merit of much more accurately representing real behavior. The improvement in accuracy can be translated into significant potential cost savings. Despite all the potential merits of adopting site-specific response spectra, few design engineers make use of these code provisions that have been around for a long time. This lack of uptake of the procedure by structural designers is related to the absence of a coherent set of detailed guidelines to facilitate practical applications. To fill in this knowledge gap, this paper aims at explaining the procedure in detail for generating site-specific response spectra for the seismic design or assessment of buildings. Surface ground motion accelerograms generated from the procedure can also be employed for nonlinear time-history analyses where necessary. A case study is presented to illustrate the procedure in a step-by-step manner.

1. Introduction

The conventional approach of seismic design employs code response spectrum models for defining seismic actions on the structure. In the Australian standard for earthquake actions AS 1170.4-2007 [1], response spectrum models are stipulated for five soil classes. The classification is based predominately on the average shear wave velocity of the soil layers. This code approach waives the need to undertake detailed site investigations, regional hazard analyses and soil response analyses. There are limitations in the code procedure as described for two main reasons. First, a code response spectrum model is derived by enveloping response spectra associated with a diversity of earthquake scenarios, some of which may not be applicable in specific instances. Thus, there are potential cost savings in adopting site-specific response spectra, each of which is based on a specific earthquake scenario affecting the site under consideration. Second, the statistical analyses of data for deriving a code response spectrum model can under-represent the actual extent of site amplification for reasons explained below. The amplification phenomenon is controlled by the shear wave velocity of the soil layers, the soil column depth to bedrock and the nature of the excitations transmitted from the bedrock [2]. It is acknowledged that soil–water interaction (saturated conditions) [3,4,5,6] and 2D phenomena (characterized by topographical and geotechnical parameters) [7,8,9,10] can also affect site response behavior, but their considerations are outside the scope of this study. Substantial amplification is expected when the natural period of the soil column model (which is known as the site period) comes close to the natural period of the structure, resulting in conditions pertaining to resonance behavior, and more so if the site period also comes close to the dominant period of the bedrock excitation. The site period can vary significantly between individual sites belonging to the same site class. Thus, ground motion data collected from multiple sites can have resonant spikes occurring at different periods. This explains why the averaging process in the derivation of a code spectrum model can smear the individual spikes occurring in the raw records, thereby understating the real extent of soil amplification. Meanwhile, the range of natural periods that are affected by the amplification phenomenon can be over-estimated, too. The modelling error is particularly pronounced in lower seismicity regions because of linear elastic behavior prevailing the potential response behavior of limited/non ductile structures which typify building stocks in these regions [11].
Unlike code response spectra, site-specific response spectra need to be developed individually for the building site when subject to a specific earthquake scenario defined by the magnitude–distance (M-R) combination (ground motion modelling needs to take into account the likely faulting mechanism of the considered earthquake scenario [12]). The procedure involves regional seismic hazard analyses, soil conditions analyses and soil response analyses [13,14]. Despite the shortcomings of code models, few engineers use site-specific response spectra for determining seismic actions because of the lack of operational knowledge, the amount of work involved and the need to provide an extensive amount of information required for input into the analyses. This article aims to provide clear guidelines for generating site response spectra for use in dynamic analyses of a structure. No such document which gives up-to-date information and adequate guidance to the design engineer can be found from the literature. Towards the end of the article, the practical application of the procedure is illustrated by using a case study featuring a class De soil site in Melbourne and earthquake scenarios consistent with a 2500-year return period.

2. Overview of Analyses Required for Developing a Site-Specific Response Spectrum

The approach recommended in this article for generating a site-specific response spectrum is to employ the conditional mean spectrum (CMS) methodology for generating accelerograms for bedrock conditions. The generation of the soil surface accelerograms is to be accomplished in a separate step. The procedure consists of the following routines: (1) interpretation and analysis of information presented in a borelog for estimating the shear wave velocity (SWV) profile and dynamic properties of the soil layers; (2) selection and scaling of accelerograms for defining input motion transmitted onto the bedrock; and (3) execution of dynamic analysis of the soil column model for generating accelerograms and response spectra on the soil surface. Refer to Figure 1 for a diagrammatic presentation. Each listed routine is elaborated below.
The first routine is about processing information to characterize the properties of the soil layers (namely thickness, SPT blow count, soil type and water content) for modelling the SWV profile.
The second routine adopts the CMS methodology to source ground motions at the bedrock level. The CMS methodology has become widely known for selecting and scaling ground motions to the response spectrum of a specific considered earthquake event [15,16,17]. The reference period ( T * ) is the period at which the CMS matches the code response spectrum. The fundamental natural period of the structure T 1 and the site period T n can both be taken as T * . For a given user-specified intensity level (as defined by the design hazard factor kpZ), accelerogram records and the corresponding response spectra that are sourced by the CMS methodology are scenario-specific (i.e., M-R scenario specific) and therefore less conservative than those selected/scaled to the code spectrum, which accounts for multiple different scenarios that cannot possibly all occur at the same time.
The third routine is the one-dimensional equivalent linear analysis of the soil column to simulate soil response behavior and generate accelerograms on the soil surface, or at the foundation depth of the structure [18,19]. If the structure is found on piled foundation, soil surface motions may be applied to give conservative estimates of the seismic actions provided that the horizontal stiffness of the piles may be neglected, which is consistent with recommendations in the commentary to AS 1170.4 [20]. For structures featuring a major underground substructure such as a basement soil structure interaction needs be taken into account, and the dynamic analysis of the structure should be based on applying excitations at the base of such a substructure. The nonlinear behavior of the soil material properties is modeled in accordance with the material curves for characterizing the rate of degradation of the soil shear modulus and energy dissipation (damping) behavior.
The three routines are elaborated in the next three sections in accordance with the Australian standard AS1170.4-2007 [1] and the seismic characteristics of south eastern Australia (crustal condition, recurrence rate, etc.). The approach can be extended to other stable continental regions by generating regional CMS in the second routine. A step-by-step guide to generating CMS by applying representative ground motion models and performing probabilistic seismic hazard analyses can be found in Ref. [21].

3. Modelling Shear Wave Velocity and Dynamic Properties of Soil and Bedrock

This section deals with analytical modelling of the soil column based on information provided by a borelog. The analyses are aimed at determining the following properties of the soil layers: (1) the SWV profile, (2) material curves characterizing stiffness degradation and damping behavior of the soil and (3) bedrock properties including density and SWV, which controls the reflection of seismic waves at the soil–bedrock interface. Influences by the principal stress (which is also known as the vertical stress or confining stress) are accounted for by using a few selected predictive models for estimating the SWV profile and material curves. The two well-known empirical models for representing these influences are (1) the PEER model [22] and (2) the model by Darendeli [23]. Calculation of effective principal stresses requires knowledge of the water level and the amount of vertical stresses imposed from the structure. Calculations of the soil properties from the foundation depth down to 10 m below the foundation itself are particularly sensitive to the imposed stresses. In the upper 10 m of the soil layers, vertical stresses resulted from the weight of the structure can dominate over stresses derived from the self-weight of the soil. The imposed stresses may significantly affect the SWV properties and are required to be taken into account through the use of Equations (17)–(20). In the absence of reliable published information, a rule-of-the-thumb expression for estimating the vertical stress imposed by a reinforced concrete building (not found on piles) is provided below.
V e r t i c a l   s t r e s s   f r o m   s t r u c t u r e = N u m b e r   o f   S t o r e y × 10   kPa
The effective principal stress in each soil layer can be calculated at the mid-height position of the considered soil layer i using Equations (2) and (3).
σ v = V e r t i c a l   s t r e s s   f r o m   s t r u c t u r e + ( n = 1 i 1 ρ n × g × h n ) + ρ i × g × h i / 2 P i
P i = ρ w × g × m a x ( n = 1 i 1 h n + h i / 2 W a t e r   L e v e l , 0 )
where ρ i is density of soil layer i (refer Appendix A for soil density); h i is thickness of soil layer i;   P i is accumulated pore water pressure at the mid-position of soil layer i; ρ w is density of water (i.e., 1000 kg / m 3 ) ; g is gravitational acceleration (i.e., 9.81 m / s 2 ) . Note that in situations where an accurate estimate of the effective principal stress cannot be obtained (because of unknown water level or vertical stress imposed from the structure), the authors recommend avoid using the stress-dependent models.

3.1. Shear Wave Velocity

Shear wave velocity accounts for the stiffness properties of the soil layers and is an important and influential input parameter for site amplification analyses [24,25,26]. Standard penetration test blow count (SPT N-value) as derived from in situ testing of soil samples is the common metrics for characterizing the stiffness properties of the soil. Correlations between SWV and SPT N-values have been studied extensively [22]. Accurate estimations of SWV can be achieved when additional parameters have been taken into account, such as the effective principal stress ( σ v ), soil age and soil type [27]. Four empirical models which are presented herein for estimating SWV values involve the use of a list of expressions as presented in Table 1 (along with Equation (4)). The parameter N 60 (where the subscript refers to 60% energy transfer rate) as appeared in the listed expressions of Table 1 is the SPT N-value that has been corrected for field procedures including hammer efficiency.
N 60 = E n e r g y   R a t i o × N m e a s u r e d
where E n e r g y   R a t i o is the ratio between 60% and the actual rate of energy transfer; the default E n e r g y   R a t i o may be taken as unity for Australia.
With the predictive expressions listed in Table 1, the required amount of input information (hence, the expected degree of accuracy) increases down the list. Equation (5) which is placed at the top of the list requires the minimum amount of input information.

3.2. Soil Dynamic Property

The initial shear modulus (Gmax) of soil is related to its SWV (Vs) and density (ρ) through Equation (21).
G m a x = ρ × V S 2
As deformation (hence, shear strain) in the soil is increased with the intensity of ground shaking, the shear modulus (stiffness) of the soil is reduced and the amount of energy dissipation (represented by the damping ratio) is increased. In examining the nonlinear stress–strain relationship of soils, the strain-dependent behavior of degradation in the shear modulus and damping can be identified. These dynamic properties of the soil are controlled by the plasticity index (PI), over-consolidation ratio (OCR) and effective principal stress ( σ v ). Soils with higher PI values generally exhibit a lower extent of nonlinear behavior because of a lower rate of degradation in the shear modulus and a lower level of damping for a given level of shear strain. Higher amplification of seismic waves would occur as a result.
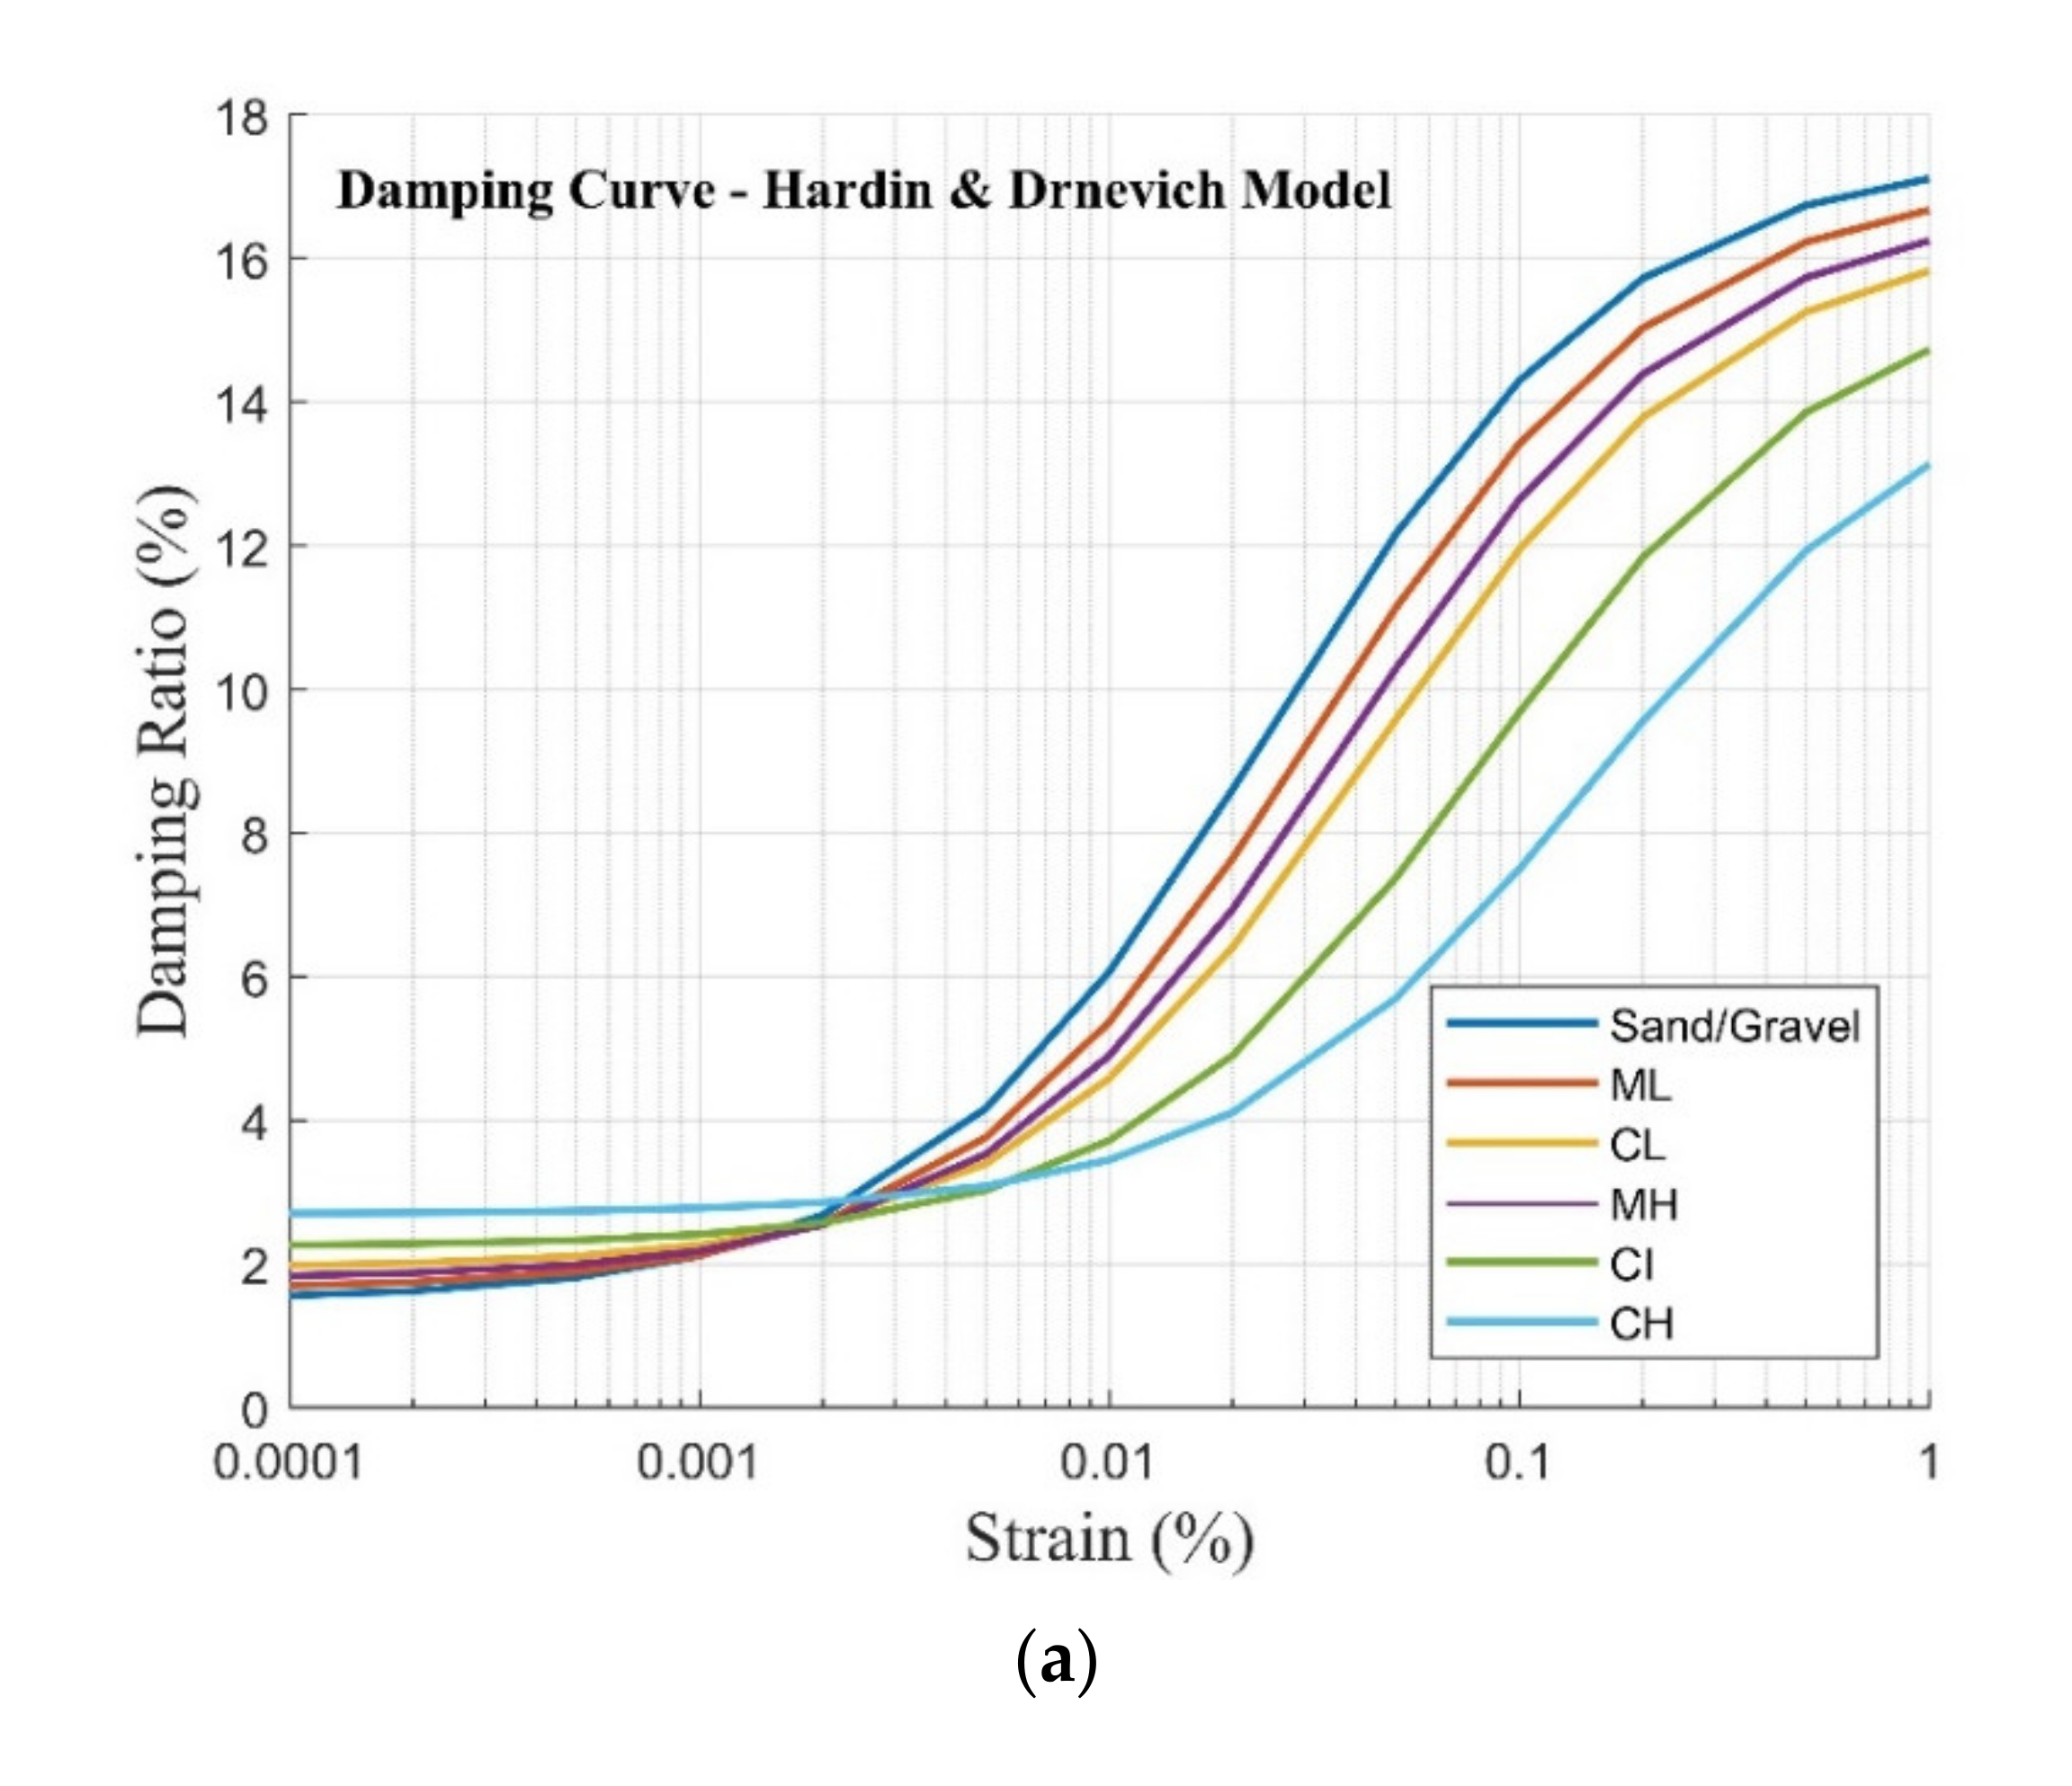
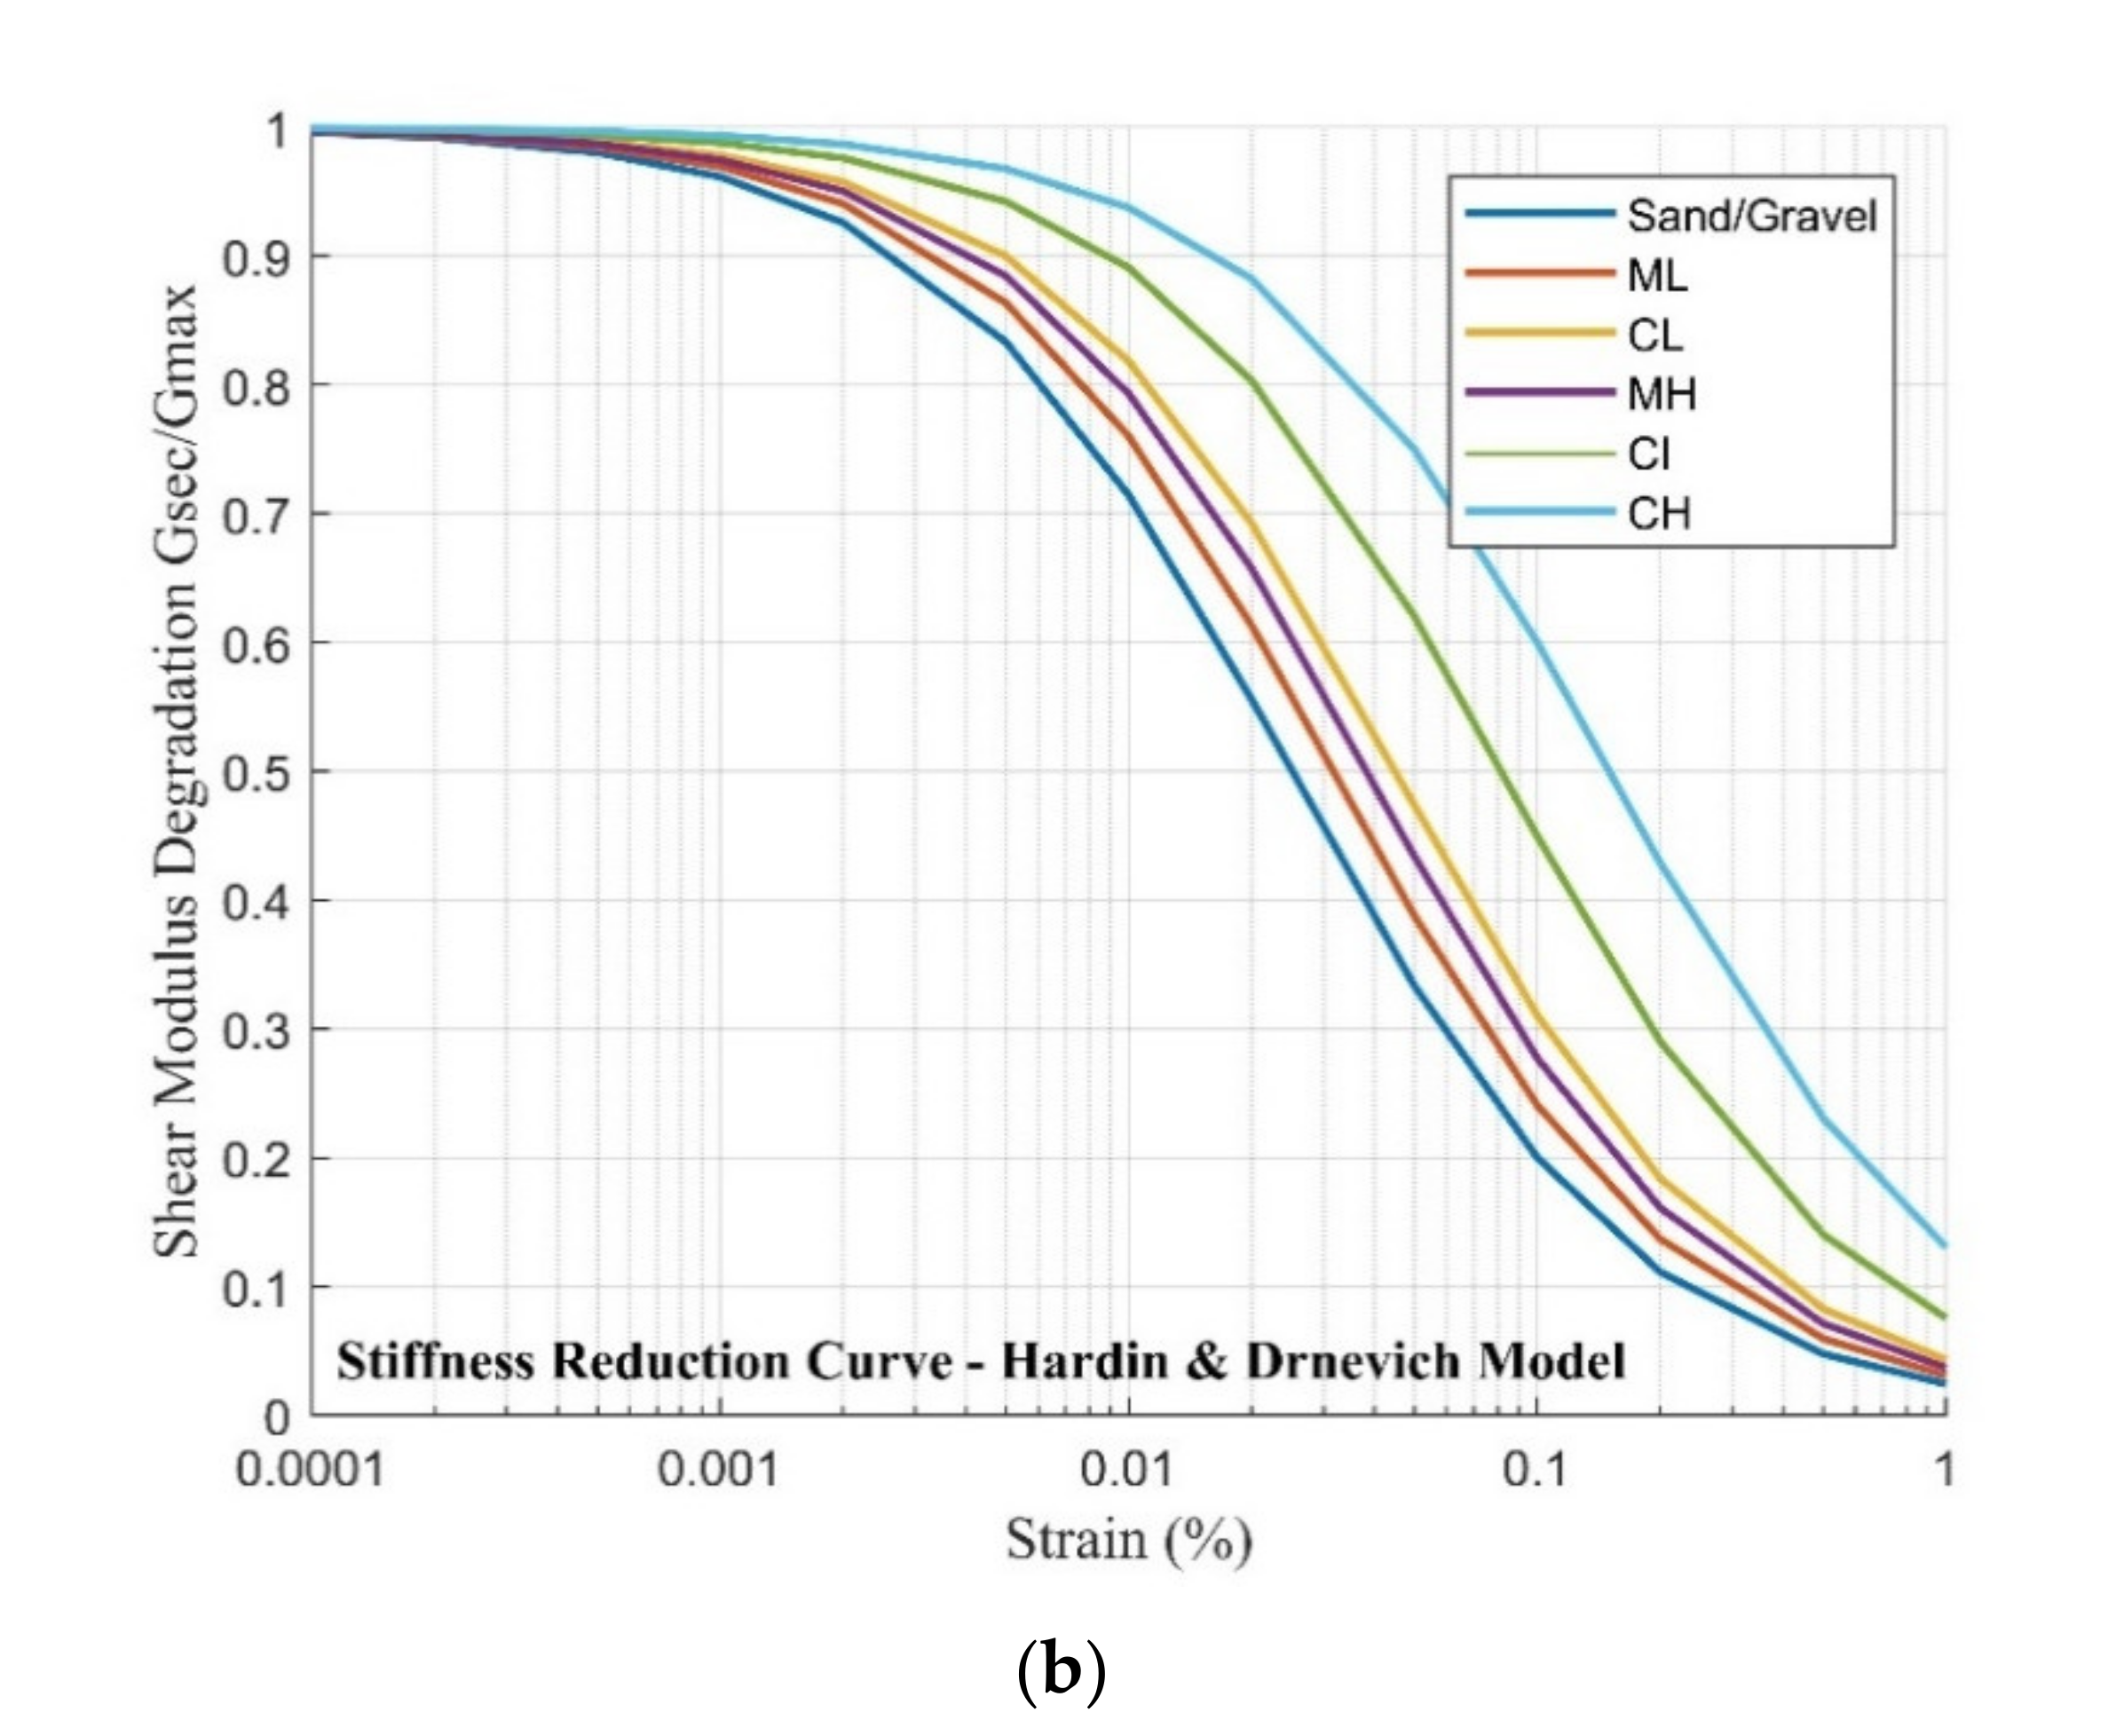
Different PI values are recommended for the five soil classes of cohesive soils as per classification criteria stipulated in AS 1726-2017 [30] (refer to Table 2 and Table 3 for details). In the absence of specific information, PI = 30% may be assumed for silts and clays, whereas PI = 0% may be assumed for sands and gravels. The two commonly used models for estimating the dynamic properties of soils are the model by Hardin and Drnevich [31] and that by Vucetic and Dobry [32]. With both models, the PI value is the only input parameter. The strain-dependent degradation in shear modulus is given by Equation (22), whereas strain-dependent damping by Equations (23)–(25) as per recommendations presented in Hardin and Drnevich [31].
G G m a x = 1 1 + γ γ r e f
ζ = ζ i + ζ m a x γ γ r e f 1 + γ γ r e f
ζ i = 0.015 + 0.0003 × P I % 0.058
ζ m a x = 0.16 0.001 × P I % 0
where G G m a x is shear modulus ratio, ζ is damping ratio expressed in percentages, γ is shear strain, γ r e f is reference strain and PI is plasticity index. Correlations between the latter two parameters are presented in Table 4. Illustration of material curves for different soil types as per the Hardin and Drnevich model is presented in Figure 2.
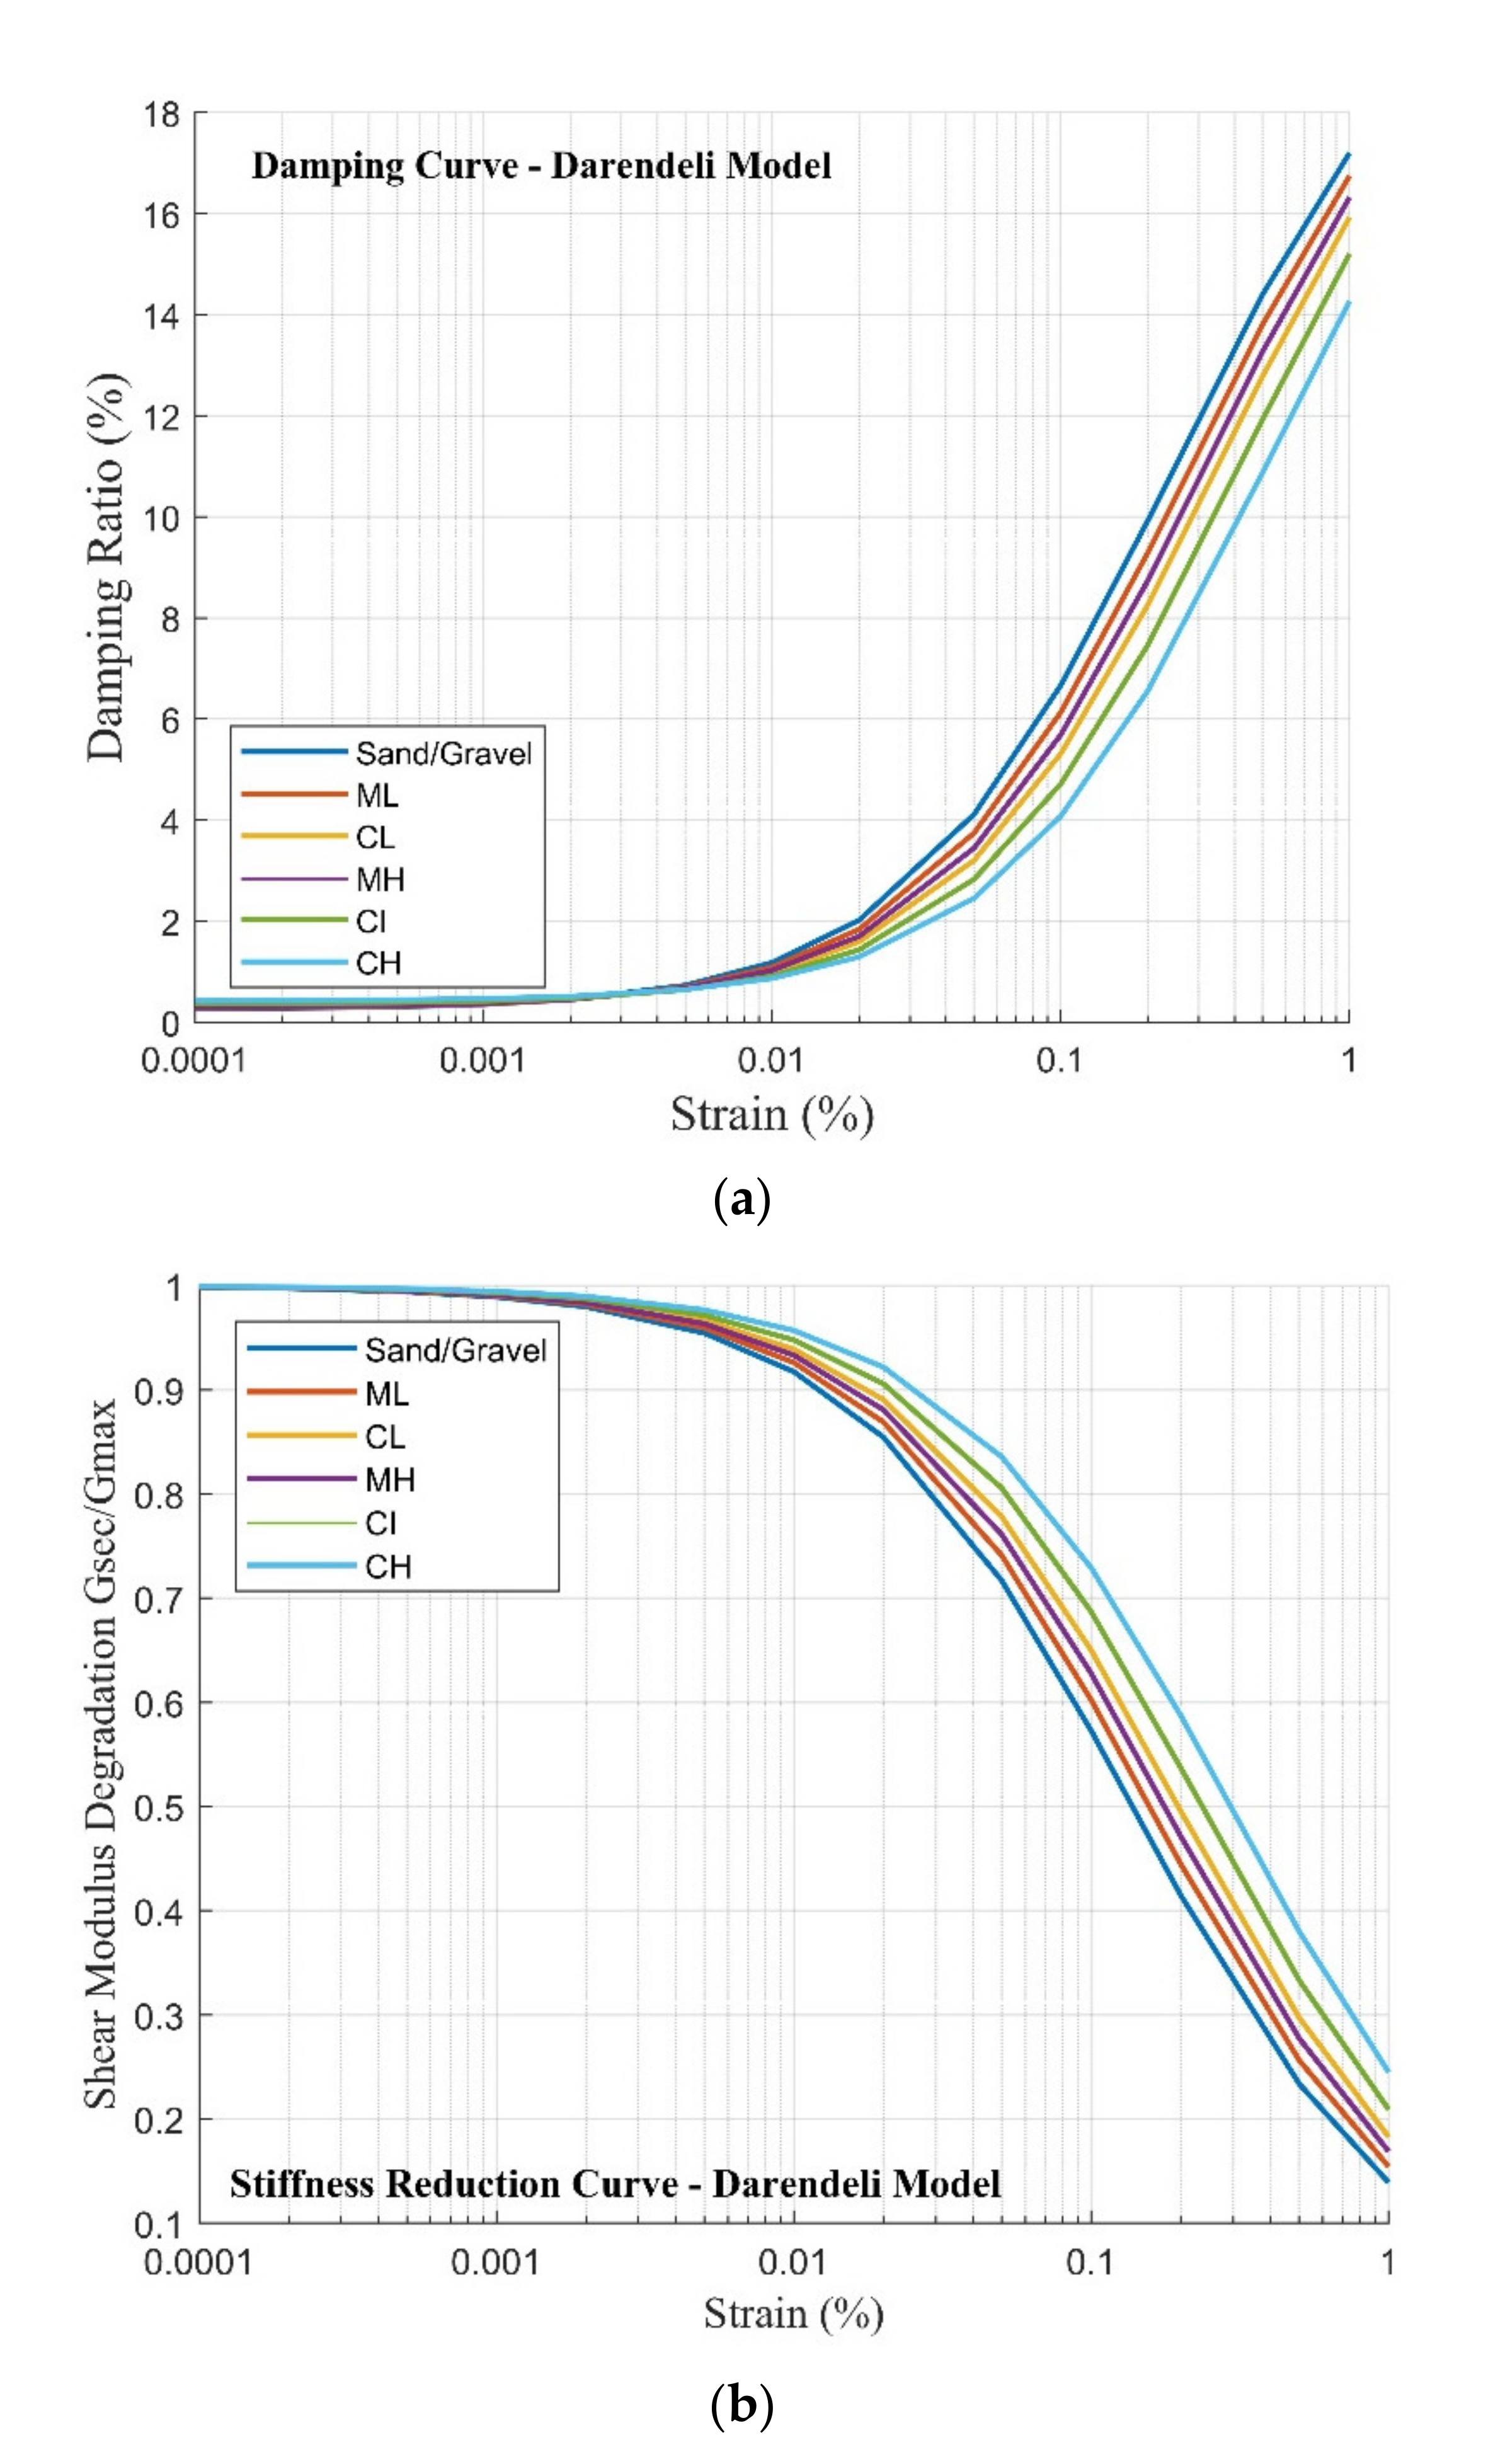
With the more elaborate model of Darendeli [23] the controlling parameters are the PI, OCR and effective principal stress. Detailed descriptions of the dynamic properties of soil based on models presented in Vucetic and Dobry [32] and Darendeli [23] can be found in Appendix B.

3.3. Bedrock Property

The dynamic response analysis of a soil column model may be accomplished by the use of computer programs such as SHAKE [18]. Accurate information on the density and SWV properties of the bedrock is required for the analysis as multiple reflections of seismic waves at the soil–rock interface is controlled by these parameters [33,34]. In this context, the authors advise against relying on information derived from the testing of rock core samples that have been taken at the bottom of the borehole where the bedrock is exposed. This is because the part of the rock crusts controlling wave reflection properties may extend some tens of meters deep from the surface of the soil–rock interface [35]. In the absence of representative seismological information, values of the density and SWV as listed in Table 5 may be adopted. The higher the density and SWV of the bedrock, the larger the amount of wave energy trapped within the soil sediments on reflection at the interface resulting in a higher level of amplification. Parameter values are listed in Table 5 against rock types that are commonly found in various major capital cities based on information reported in the literature [36,37,38,39,40]. These bedrock SWV values were determined from either borehole reports or non-invasive testing (such as the spectral analysis of surface waves method) results. A more rigorous method for determining the SWV of bedrock in an area, as presented in Ref. [23], involves surveying the SWV profile of the bedrock along with that of the overlying soil sediments, followed by analysis of the combined SWV profile. The corresponding rock densities can also be found by making use of the correlation relationship of Equation (26) [41], where V R is the bedrock shear wave velocity. The strain-dependent dynamic behavior of bedrock can be defined in accordance with the generic model presented in the original SHAKE program [18] (refer Appendix B for details).
ρ R = 1.8 + V R 3550 × 1000

4. Accelerograms for Defining Input Motion at the Bedrock Level

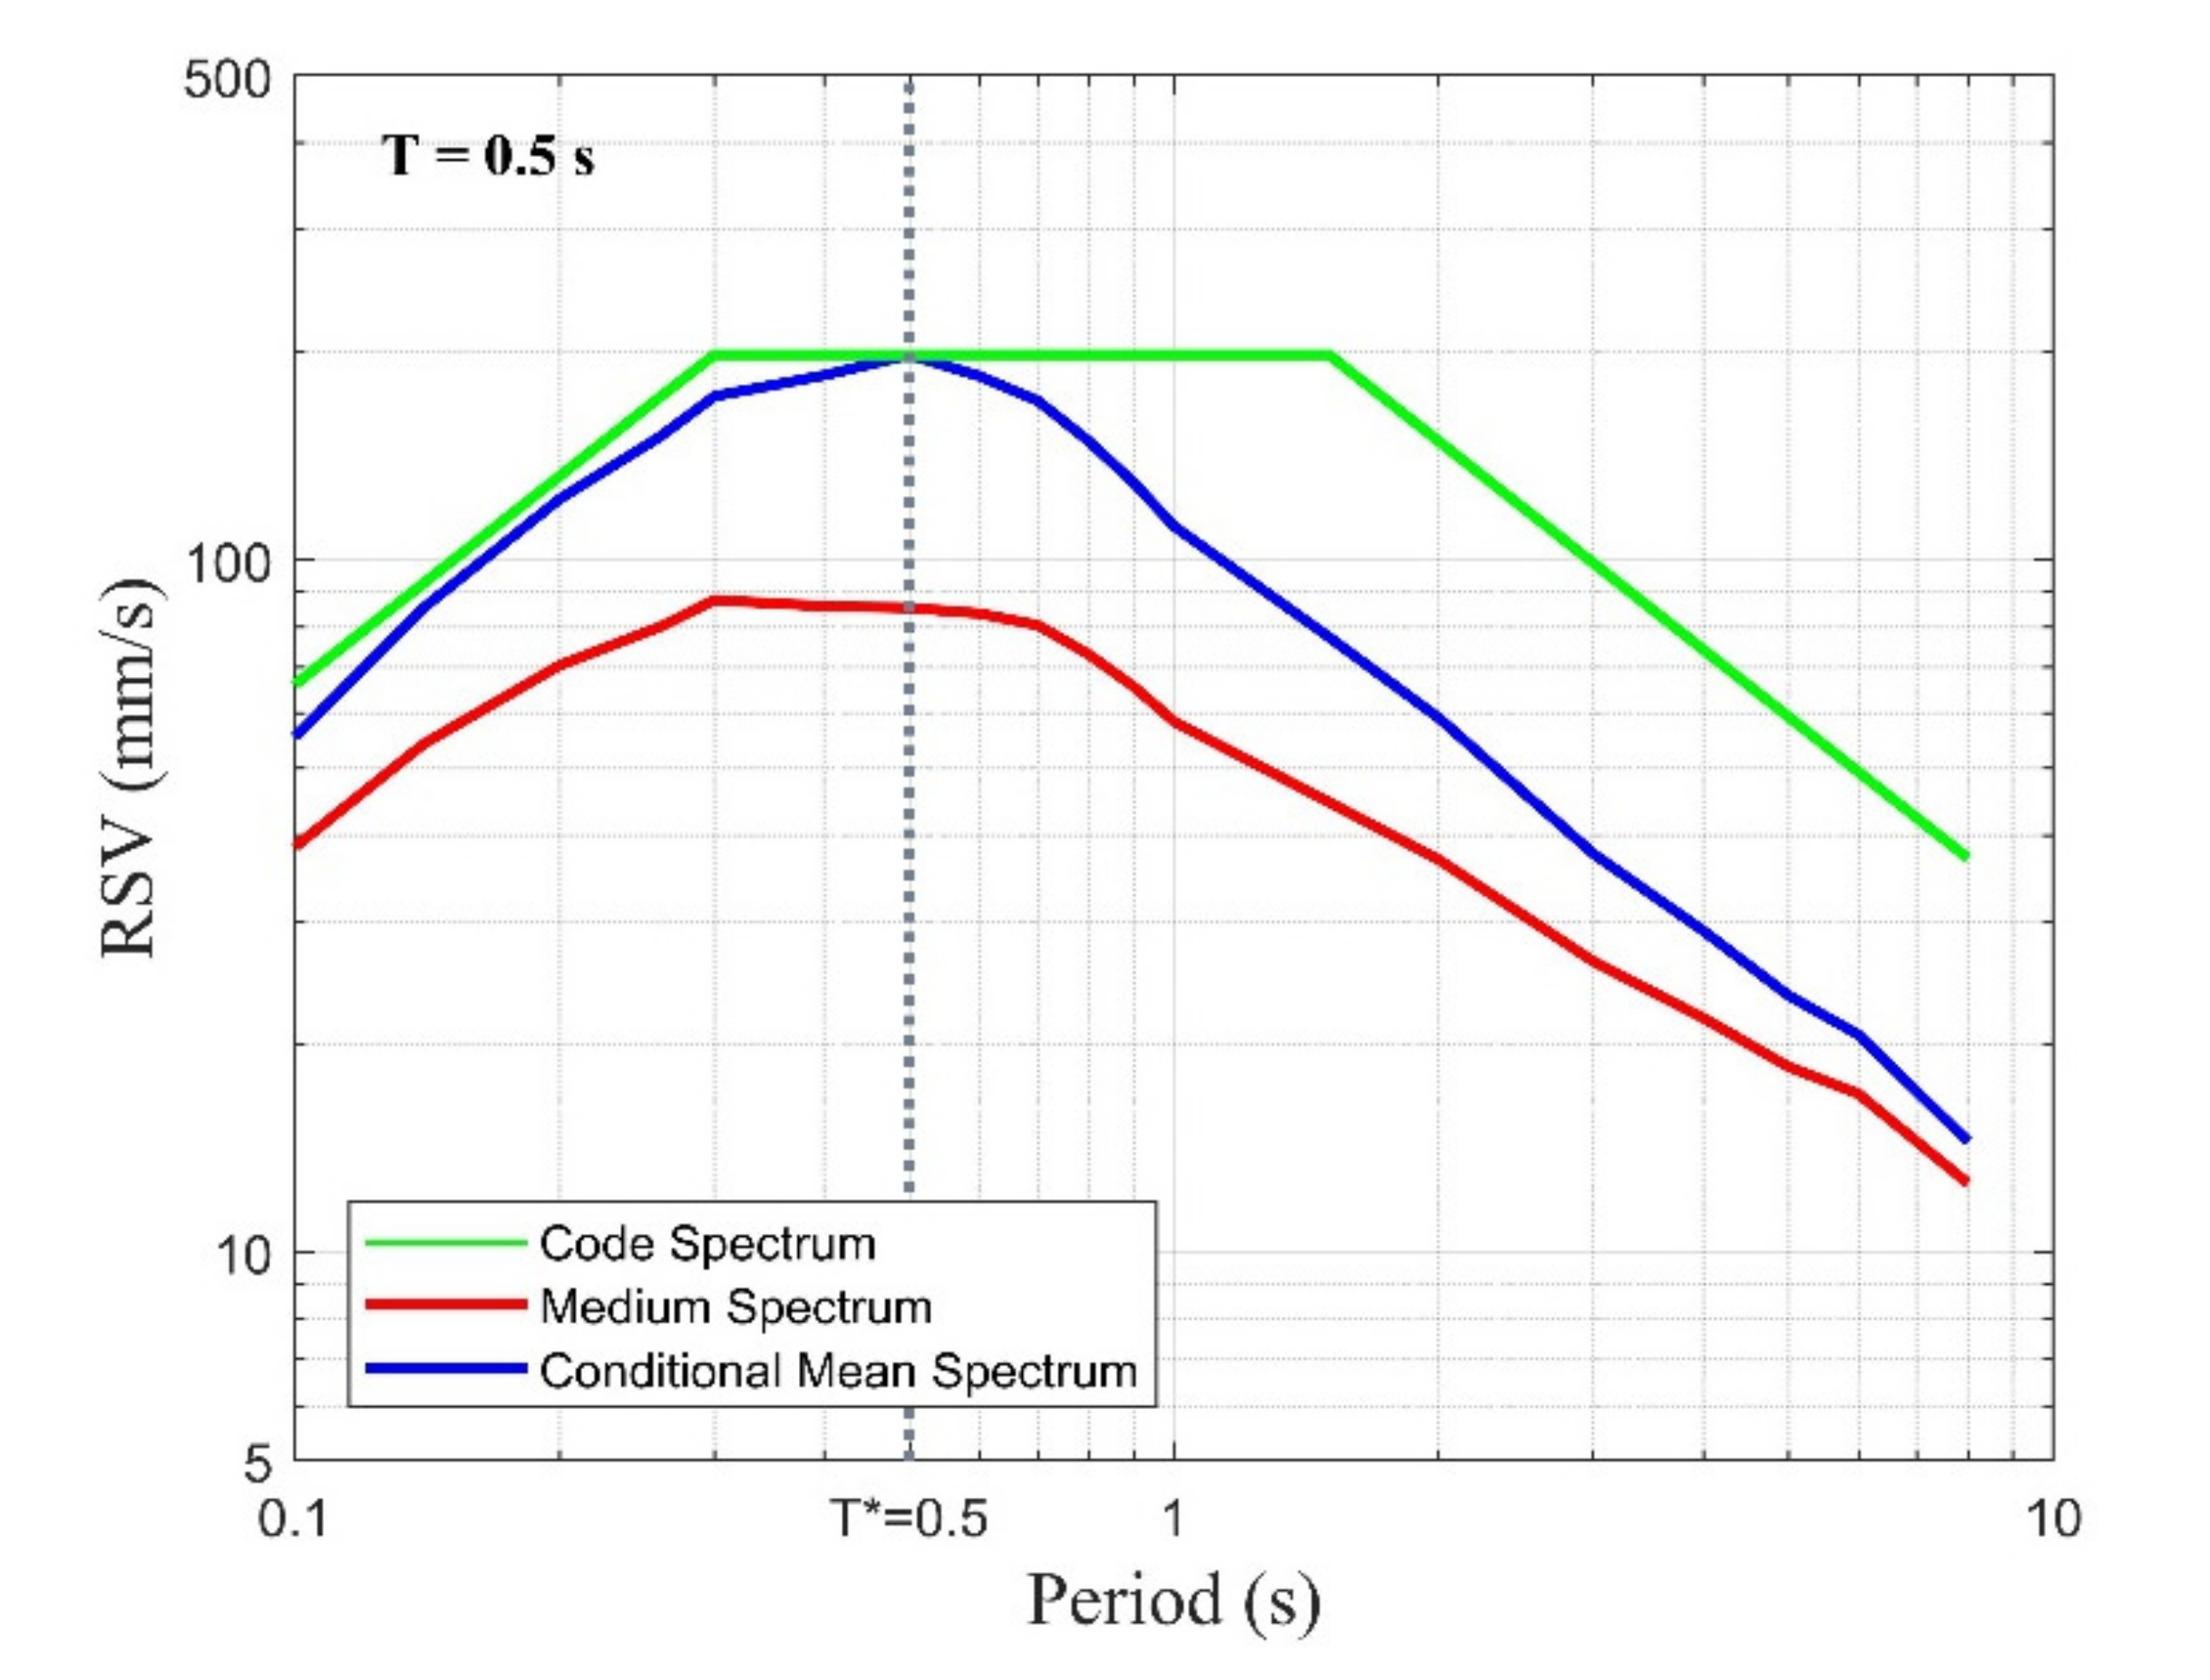
The selection and scaling of accelerograms for use in Australia taking into account crustal conditions and rate of earthquake recurrence has been studied by Hu and co-workers [21]. The study employed the conditional mean spectrum (CMS) methodology which has been reported widely in the literature [15,16,17]. In the CMS methodology, response spectral values for the considered earthquake scenarios are determined for a series of reference periods ( T * ) which is the period at which the CMS is scaled to match the code response spectrum. The fundamental natural period of the structure and the site period are both taken as T * . Further details in relation to the determination of the values of T * are presented in the later part of this section. For a given value of T * , the controlling earthquake scenarios (i.e., M-R combinations) are to be determined through hazard disaggregation analysis. The medium and standard deviation predictions of the response spectral accelerations are then determined across the period range of engineering interests (using reliable and representative ground motion prediction expressions). The CMS, which is essentially an event-specific response spectrum corresponding to a considered T * value, is hence determined. The condition that needs to be satisfied is that the CMS has been scaled to ensure that its spectral value matches the code specified value at T * (as illustrated by an example in Figure 3). Details of the implementation of the CMS methodology based on taking T * = 0.2, 0.5, 1 and 2 s can be found in Ref. [21].
Earthquake records can be retrieved from the international Pacific Earthquake Engineering Research (PEER) NGA-West 2 strong motion database [42] under the following searching criteria:
  • Style of faulting: reverse/oblique (typical of intraplate earthquakes);
  • Magnitude: magnitude range (half-bin width) of ± 0.3   M w centered at the magnitude of the controlling scenarios;
  • Joyner–Boore distance Rjb (distance to the fault projection to the surface): distance range (half-bin width) of ± 30   km centered at the distance of the controlling scenarios (with the range extended to ± 50   km at T * = 2   s );
  • V S , 30 : 450   ms 1 to 1800   ms 1 representing rock conditions.
In the CMS methodology, accelerogram records need to be selected and scaled in order that the individually calculated response spectra conform with the CMS in the period range between 0.2 T * to 2 T * .
The ground motion selection scheme should incorporate the site period and the fundamental natural period of vibration of the building (or building period) as T * . The selection scheme is based on that in Ref. [21]. If either the site period or the building period is within ±20% of one of the four T * periods (0.2, 0.5, 1 or 2 s), then six accelerogram records based on the considered T * should be selected. If neither the site period nor the building period is within ±20% of any of the T *   periods, then at least four accelerogram records are to be selected from each of the adjacent T *   periods. Two additional accelerogram records are to be selected from other T *   periods that are further away to incorporate considerations of period elongation and higher mode effects. The ground motion selection methodology as described is illustrated in detail in Section 6 by use of a case study.
As mentioned earlier, the approach recommended by the authors is to employ the CMS methodology for generating accelerograms for bedrock conditions only. The generation of soil surface accelerograms is to be accomplished in a separate step. The bedrock records ensemble should consist of 12 to 16 accelerograms derived from different earthquake events to achieve diversity. Artificial ground motion accelerograms can also be generated to make up the ensemble where necessary (refer to Appendix C for details). The time step for each ground motion record is standardized to a pre-determined time step (and can be default at 0.005 s) for both real and artificial ground motion accelerograms. Moreover, with reference to numerical simulation of dynamic boundary problems, the time step of the signal should be consistent with the literature suggestions (e.g., [43]).
To facilitate bi-directional time history analyses, bedrock accelerograms are sorted in pairs to be applied in orthogonal directions and with motions in the primary direction (i.e., stronger direction) matching the CMS. The response spectral amplitude of the orthogonal motion (i.e., motion in the weaker direction) relative to the corresponding primary motion in the period ranging between 0.2 T * to 2 T * should always be sufficiently high to cover for the possibility of the structure experiencing an onerous combination of ground motions from different directions in an earthquake. Based on the authors’ analysis and examination of the PEER strong motion database, it was found that the majority of recorded earthquake ground motions had an average response spectrum acceleration in the range of period of interest in the primary to secondary direction ratio greater than 60%. Therefore, it is recommended to only use pairs of ground motions where the orthogonal direction ground motion is at least 60% of the primary direction.

5. Dynamic Analysis of the Soil Column Model

One-dimensional equivalent linear analysis has been commonly adopted for simulating the seismic response behavior of a soil column model. Vertically propagating seismic waves are modelled as a combination of harmonic waves possessing different frequencies. The response behavior of the soil layers can be linearized. An iterative procedure can be employed to determine the stiffness and damping properties of individual soil layers based on the level of effective shear strain sustained by the soil material. Detailed descriptions of the theoretical basis of the analysis are outside the scope of this paper.
Many computer programs have been written to operate the one-dimensional equivalent linear analysis as described (SHAKE2000, EERA, and Strata) [18,44,45,46]. SUA MATLAB routines have also been written to perform the analyses [19]. Consistencies in results generated from different programs and from the more sophisticated nonlinear soil dynamic analyses have been found for a maximum strain of 1% for clayey soils and 0.5% for sandy soils [47,48,49]. The users need to be alerted when the maximum strain exceeds these limits.

6. Case Study

The application of the analytical procedure presented in this article is illustrated by using the case study of a class De soil site in Melbourne when subject to earthquake scenarios consistent with a return period of 2500 years. Site class De refers to deep or soft soil sites which have a low-amplitude site natural period exceeding 0.6 s and do not consist of any layer of very soft soil exceeding 10 m in thickness (soil with shear wave velocity of 150 m/s or less, or SPT N-values less than 6 is considered as very soft soil). The upper bound site natural period limit of 0.9 s has been recommended for site class De [50]. An authentic borelog has been retrieved from geotechnical investigations conducted in North Melbourne with well-documented descriptions of the soil type, water content and SPT blow count. The structure to be designed is a five-story reinforced concrete building with an estimated fundamental natural period of 0.5 s. The input parameters into the procedure are listed in Table 6. Initials to denote soil type and water content, as summarized in Table 7, are based on conventions stipulated in AS 1726-2007 [30].
The authors developed a computer program to operate the calculation routines presented in this article (the generated program is available online at www.quakeadvice.org accessed on 24 August 2021). Parameters marked with an asterisk have default values embedded in the program to facilitate speedy usage and reduce the risk of errors with the input data. The water level is commonly provided in borelogs. The water level which controls the calculation of the effective principal stress is set at 5 m by default. The default values can be adjusted by the user as desired. In situations where the ground water level is not mentioned in the borelog, specifying the water level at “zero” would generate conservative site-specific response spectra.
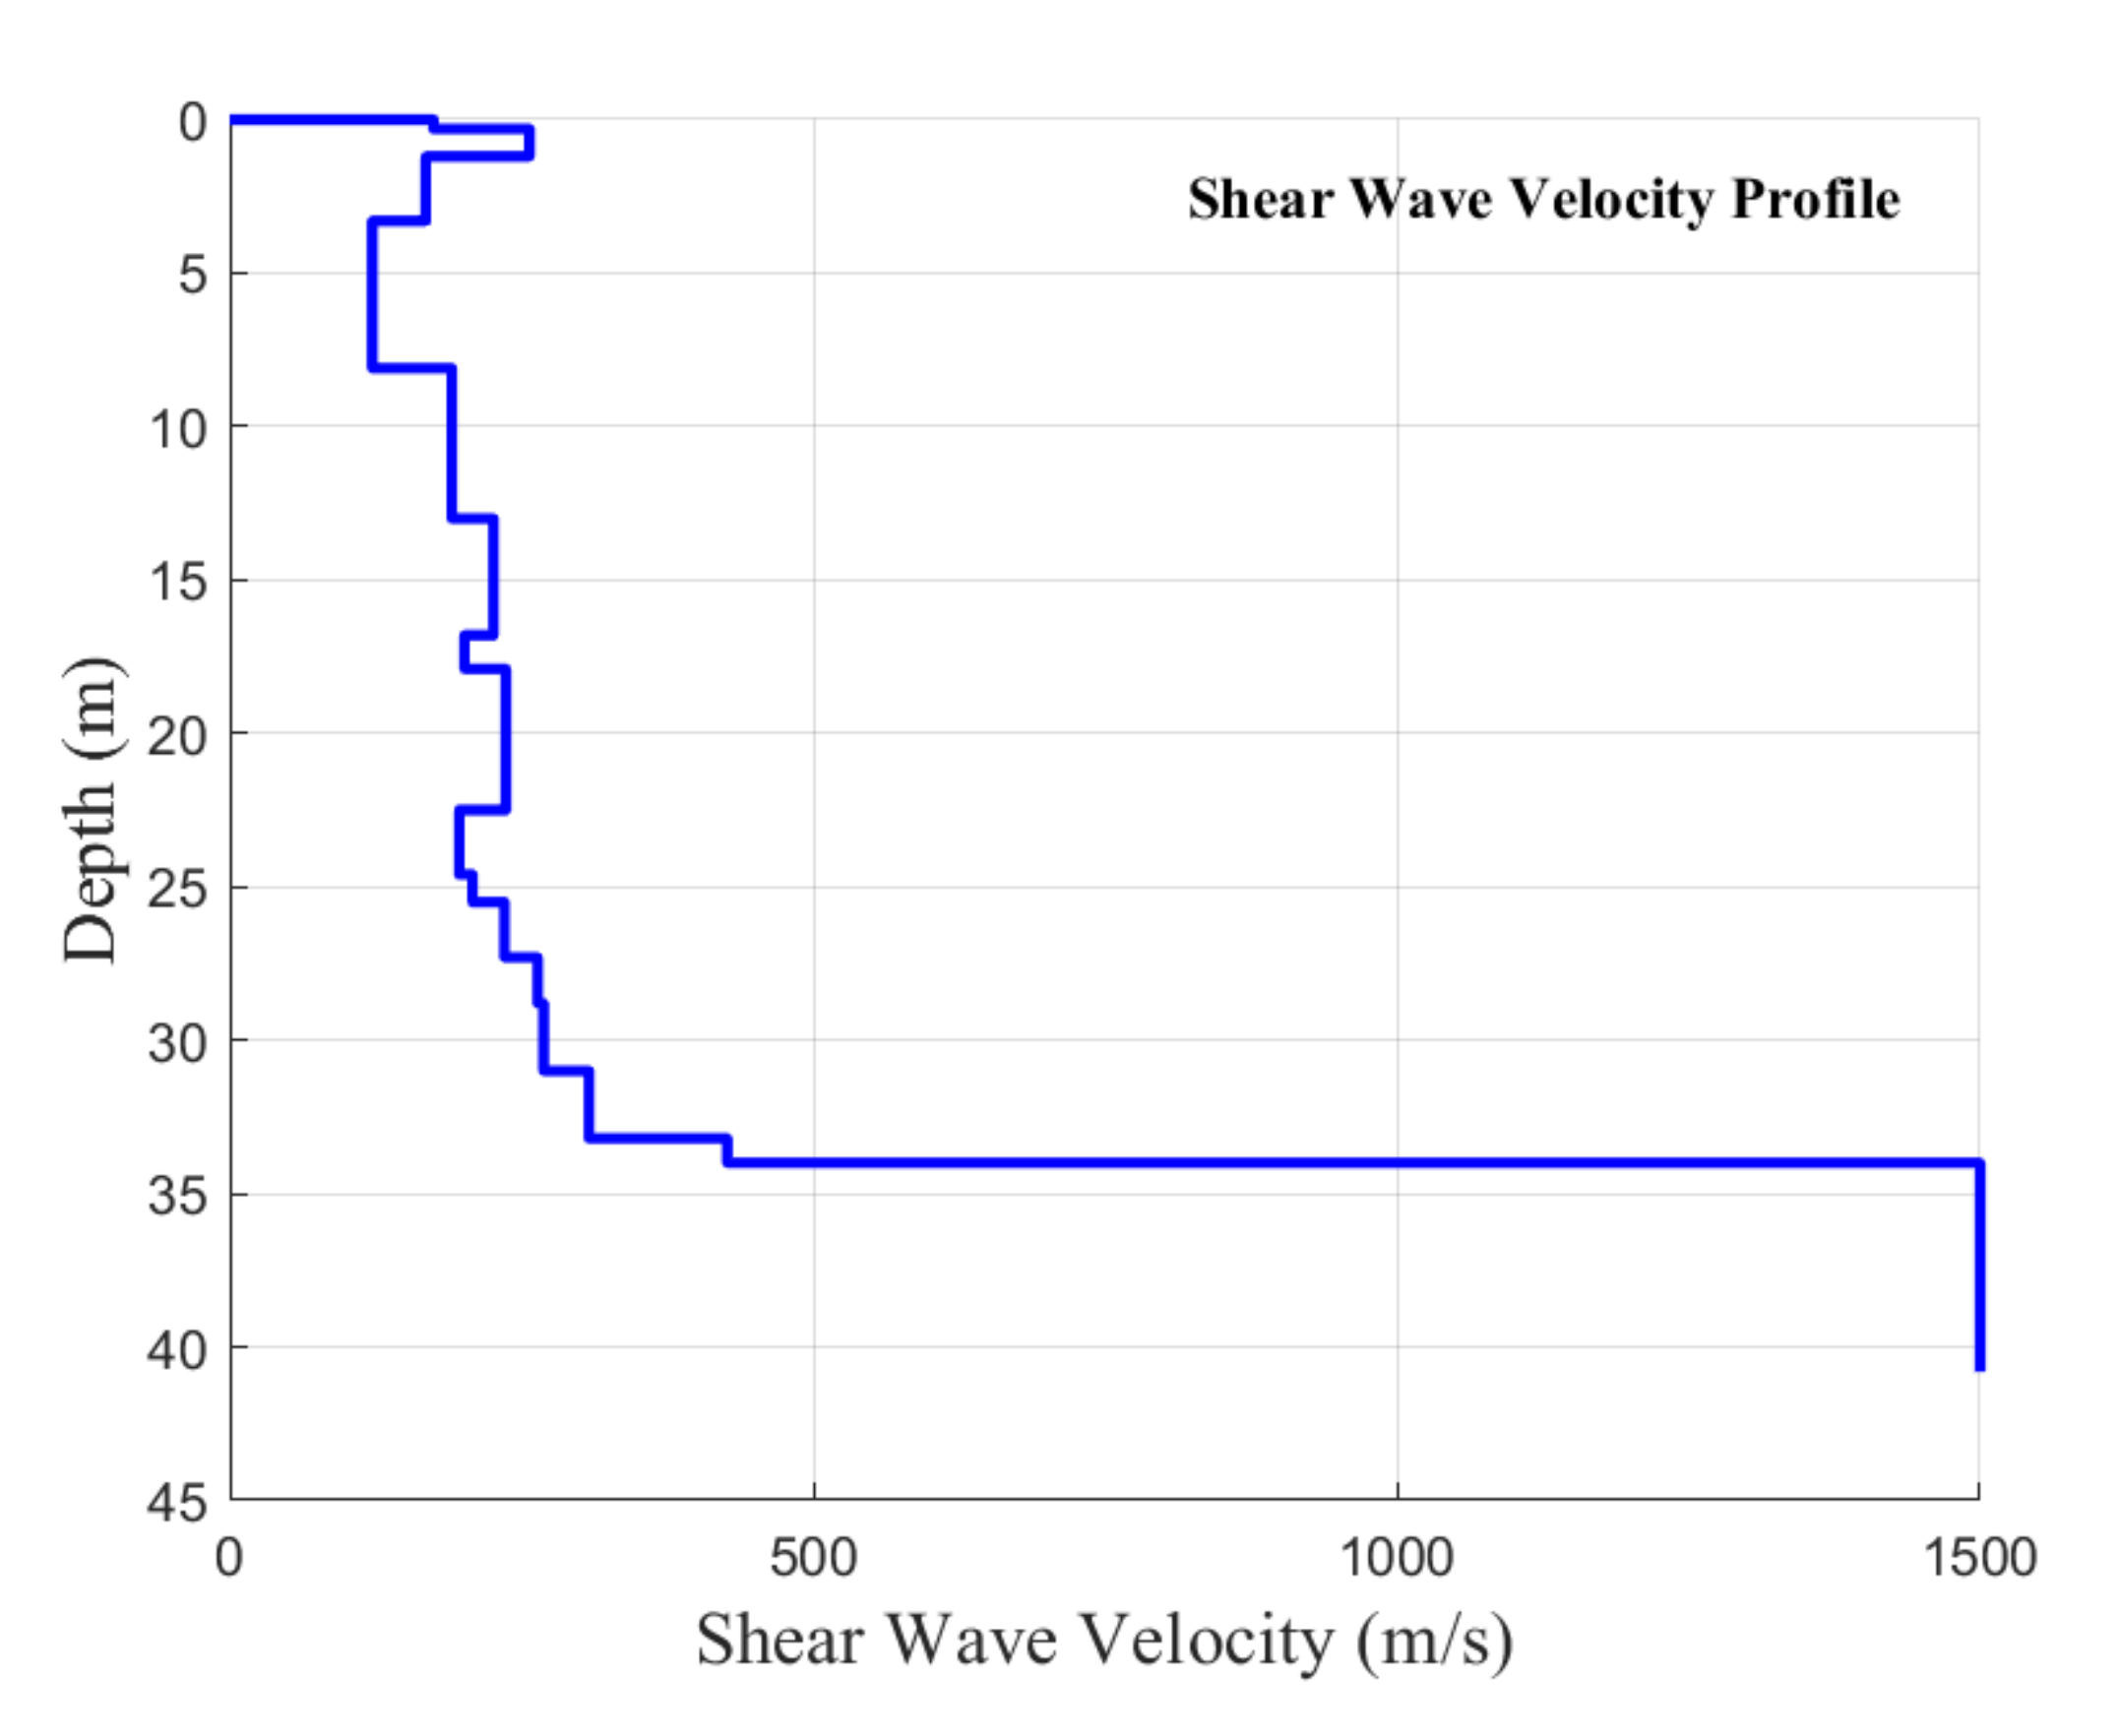
As the execution of the program is completed, the SWV profile is generated (refer to Figure 4). The equation for calculating the site natural period is given by Equation (27).
T n = 4 × H S V S
where H S is the total depth of the soil column and V S is the time-averaged SWV of all the soil layers.
The site period is 0.68 s for the case study site, which is deemed a class De site.
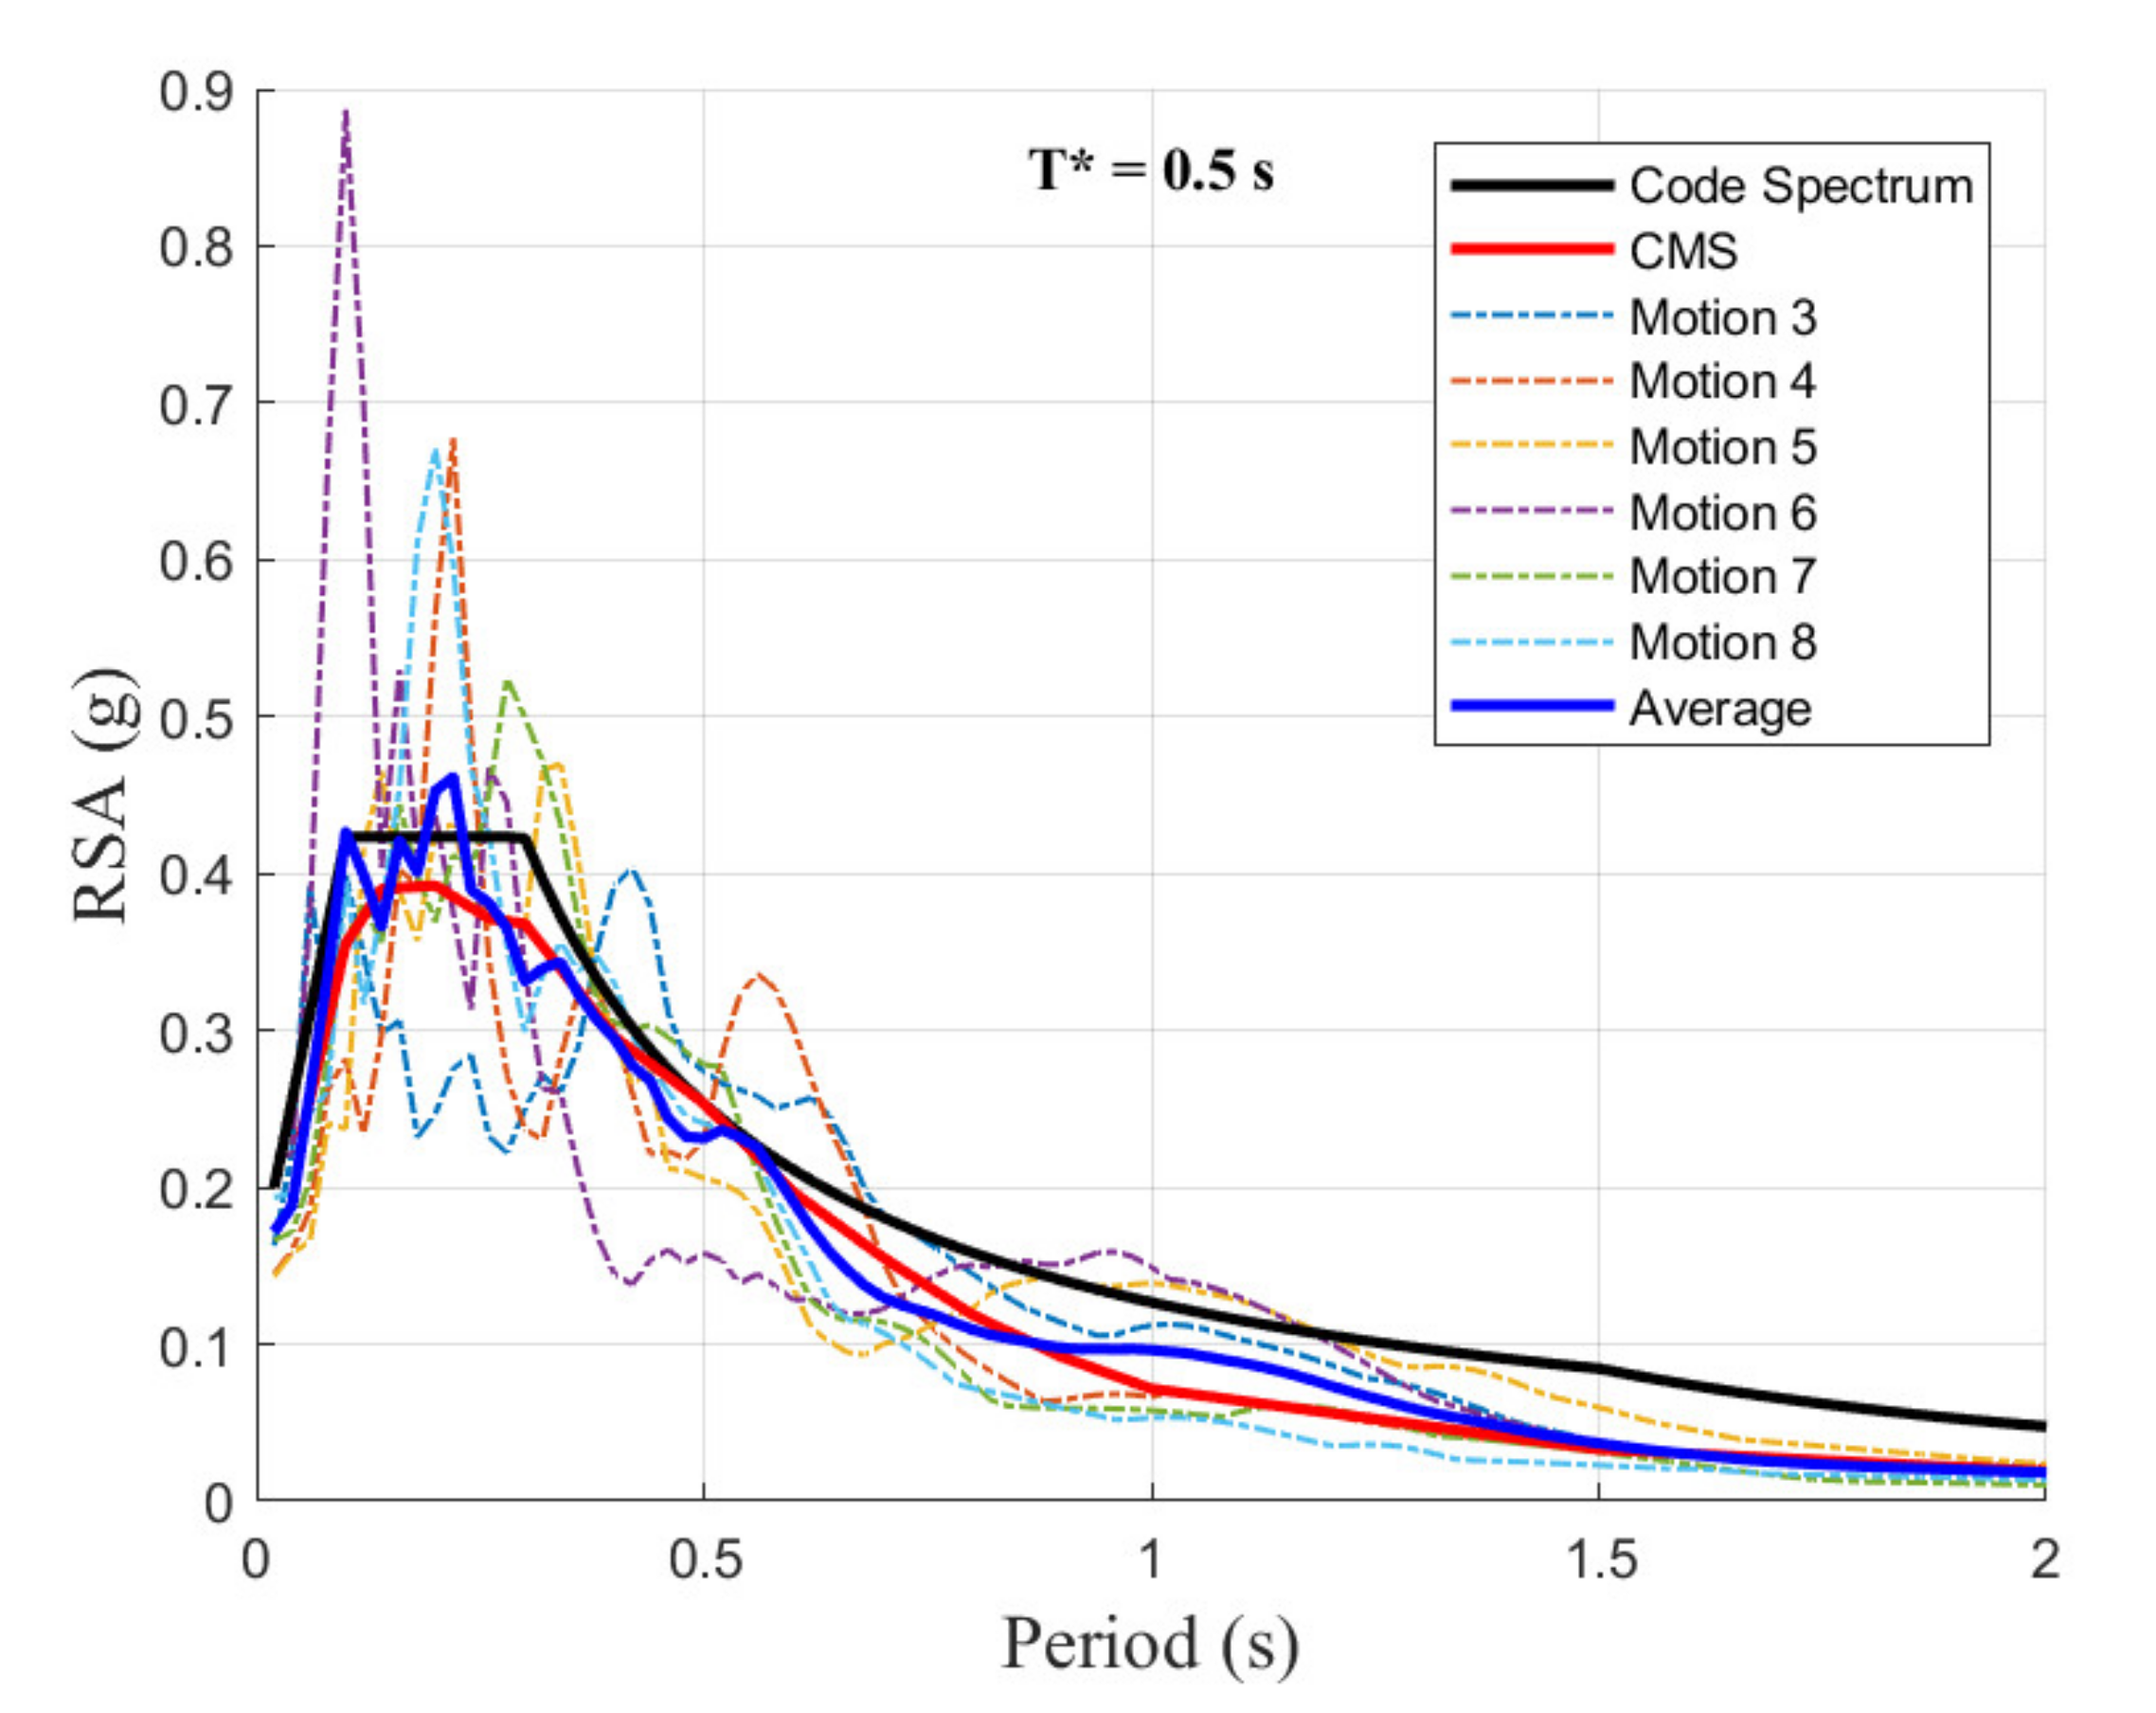
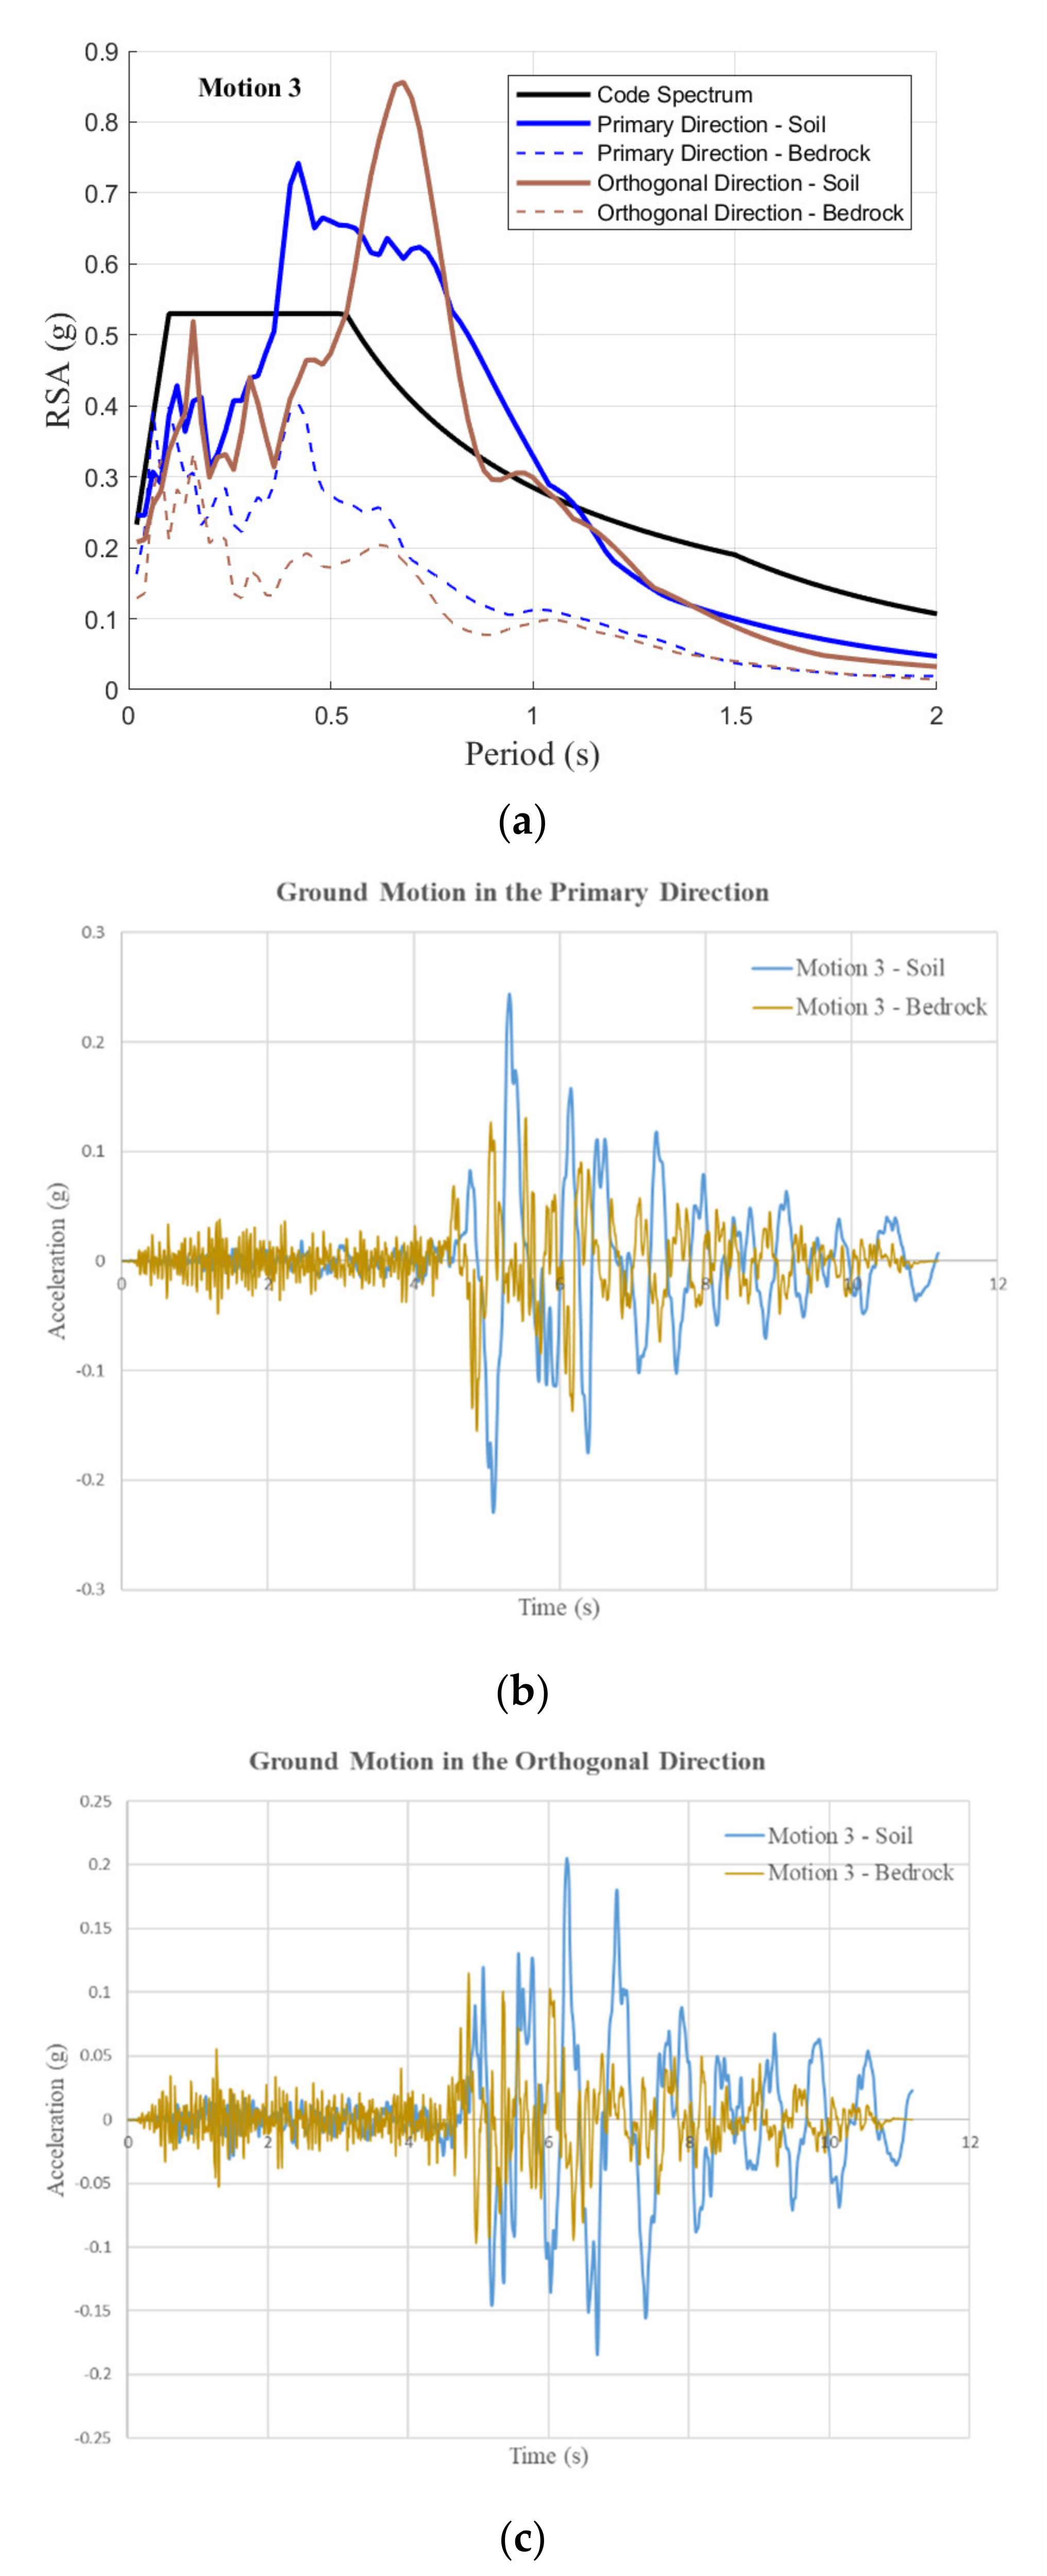
The selection methodology is explained by using the case study as presented in the schematic diagram of Figure 5. In this case study, the site period ( T n ) is 0.68 s and the fundamental period of vibration of the structure ( T 1 ) is 0.5 s. Ground motion records retrieved from the PEER database have been scaled to the CMS, and records which have their response spectra matching the CMS at each of the four reference periods were selected [21] (as shown in Figure 6). In total, fourteen ground motions (as shown in Table 8) have been selected with scaling factors ranging between 0.7 and 1.5 (the scaling factors are lower than the normally accepted upper limit of 4 [51,52]). Among the fourteen selected motions, six pairs of accelerograms (recorded in orthogonal directions) that have been selected and scaled to the CMS at T * = 0.5   s are highlighted in the red box and presented in Figure 7 as an example to demonstrate good agreement between the CMS and acceleration response spectra calculated from the individual accelerogram records. The ensemble of fourteen bedrock accelerograms were processed further to simulate the upward propagation of the seismic waves through the soil sediments onto the soil surface at the foundation depth of the structure. The soil surface accelerogram records obtained were then used to calculate the respective response spectra, which are the site-specific response spectra that this procedure aims to generate. The site-specific response spectra in both primary direction and orthogonal direction are presented in Figure 7a–c in comparison to the code spectrum for class De sites. In addition, the response spectra and time histories of Motion No. 3 are presented in Figure 8 to demonstrate the difference between bedrock motion and soil surface motion. As expected, higher amplification in spectral value occurs close to the site period ( T n = 0.68   s ) due to resonance. Whilst ground motions that are scaled to the CMS at T * = 0.5   s or T * = 1   s (i.e., Motion Nos. 3–10) are more likely to dominate structural performance as explained earlier, engineers are encouraged to make use of all accelerograms that have been selected and scaled, by exercising their own judgement to incorporate considerations of period elongation and higher mode effects. Site-specific response spectra generated for the case study are shown to be more conservative than the code spectrum for class De site. Consider another case where the site-specific response spectra were derived for the same site but for another structure which has a fundamental period of 1.8 s (and not 0.5 s as in the original case study). Response spectra calculated for the accelerogram ensemble are plotted in Figure 9. The response spectral acceleration at T = 1.8   s for each motion is lower than the code spectrum. The case studies demonstrate potential cost savings that can be achieved by the use of the site-specific response spectra.

7. Conclusions

This paper aims at facilitating the generation of site-specific response spectra and surface ground motion accelerograms for the seismic design or assessment of buildings. The presented procedure complies with requirements stipulated by the current edition of the Australian Standard AS 1170.4-2007. Much of the underlying principles of the presented methodology are equally applicable to other countries that have site response spectrum provisions incorporated into their regulation. The presented procedure comprises routines for (i) processing information provided by borelogs for determination of the SWV profile, the site period and dynamic properties of the soil layers; (ii) selecting and scaling accelerogram records representing excitations transmitted from the bedrock for the targeted earthquake scenarios; and (iii) simulating soil amplification through equivalent linear analysis for generation of accelerograms representing ground motions at the soil surface and their corresponding response spectra. Detailed guidelines in relation to modelling techniques, underlying assumptions and recommended default parameters have been provided for each routine. An ensemble of 12 to 16 pairs of orthogonal surface ground motions (along with their respective site-specific response spectra) can be generated by the routines. Depending on the value of the site natural period and the fundamental period of structure, the use of site-specific response spectra in structural design can result in considerable potential cost savings compared to the use of code response spectrum models, as is common in current practices.

Author Contributions

Conceptualization, N.L., D.T.W.L.; methodology, Y.H., N.L.; software, Y.H.; validation, Y.H., P.K.; formal analysis, Y.H., S.J.M.; writing—original draft preparation, Y.H.; writing—review and editing, N.L., P.K., S.J.M., D.T.W.L.; visualization, Y.H.; supervision, N.L. All authors have read and agreed to the published version of the manuscript.

Funding

This research received no external funding.

Acknowledgments

The authors acknowledge the financial support given by the University of Melbourne through its postgraduate research scholarship scheme and are also grateful for the valuable advice given by Elisa Lumantarna, Yuxiang Tang and Hing Ho Tsang in related research activities.

Conflicts of Interest

The authors declare no conflict of interest.

Appendix A. Density

The method adopted by the authors for estimating soil density is based on relative density and moisture ratio for cohesionless soils (namely gravels and sands), or based on shrinkage curves for cohesive soils (namely silts and clay). The estimates are in good agreement with soil density values reported in “Geotechnical Engineering: Principles and Practices” by Coduto and co-workers [53].
Soil density values as obtained from borelog records are summarized in Table A1 for different soil types and water contents. Soil density values can be conveniently called up from Table A1 once the soil type and water content information are known. In the absence of information that is related to soil type or water content, a density value of 2000 kg / m 3 may be taken for gravel and sand, and 1800 kg / m 3 for silts and clay. Adopting these values are expected to generate conservative outcomes in the prediction of soil amplification.
Table A1. Soil density estimated from detailed soil type and water content: (a) soil density for cohesive soils; (b) soil density for cohesionless soil.
(a)
Soil TypeWater Content
M1M2M3W1W2
ML1.491.591.61.591.6
MH1.591.611.651.731.72
CL1.411.441.491.611.54
CI1.441.511.61.611.64
CH1.61.721.541.641.72
(b)
Soil TypeWater Content
DryMoistWet
Relative DensityRelative DensityRelative Density
VLLMDDVDVLLMDDVDVLLMDDVD
GP1.791.831.911.992.041.951.992.052.122.162.112.142.192.242.27
GW1.801.861.972.12.181.962.012.102.22.272.122.162.232.312.36
GM1.641.71.811.942.021.831.881.972.072.142.022.062.132.212.26
GC1.641.71.811.942.021.831.881.972.072.142.022.062.132.212.26
SP1.561.621.731.861.941.761.811.902.012.071.972.012.082.162.21
SW1.571.641.791.962.071.771.831.952.092.181.982.022.112.222.29
SM1.341.431.611.842.021.581.661.812.002.141.831.892.002.152.26
SC1.411.491.651.841.981.641.711.841.992.11.881.932.022.142.23

Appendix B. Dynamic Properties

The calculation of dynamic soil properties as per the model recommended by Vucetic and Dobry [32] and Darendeli [23] is described in Appendix B. The dynamic property of bedrock that needs to be specified when executing dynamic analysis of the soil column model using a program is also provided.
(1)
Vucetic and Dobry model
The Vucetic and Dobry model parametrizes plastic index (PI) to calculate the stiffness degradation and damping in the soil. Material curves corresponding to a number of reference plastic index (PI) values are summarized in Table A2. To obtain material curves for any given PI value, apply linear interpolation between values listed in the table.
Table A2. Dynamic properties of soils (after Vucetic and Dobry): (a) degradation in shear modulus; (b) damping.
(a)
Stiffness Degradation Curve G s e c / G m a x
Shear Strain (%)PI = 0PI = 15PI = 30PI = 50
0.000011111
0.00011111
0.00021111
0.00050.99111
0.0010.9840.99211
0.0020.9160.9650.9921
0.0050.8180.8980.9530.982
0.010.7110.8180.8980.953
0.020.5780.7190.8160.898
0.050.3810.5490.6640.781
0.10.2560.4080.5370.676
0.20.160.2870.4160.535
0.50.0670.1580.2660.377
10.0270.0960.1620.246
20.0080.0550.090.135
50.0040.0280.0450.068
(b)
Damping Curve (%)
Shear Strain (%)PI = 0PI = 15PI = 30PI = 50
0.000011.01.01.00.9
0.00011.21.11.01.0
0.00021.21.21.11.0
0.00050.51.31.21.1
0.0011.81.61.41.3
0.0022.52.11.71.6
0.0053.83.22.72.3
0.015.44.63.72.9
0.027.86.35.03.7
0.0512.09.16.94.9
0.115.211.68.66.1
0.218.414.210.87.8
0.521.817.714.110.9
123.920.016.913.4
225.422.119.916.3
526.724.322.619.2
(2)
The Darendeli model
The Darendeli model takes into account influences of the PI, over-consolidation ratio (OCR) and effective principal stress ( σ v ). For the convenience of computations, the value of OCR may be taken as unity [23]. The Darendeli model was built upon the work of Hardin and Drnevich [31]. Coefficients specified in the model were derived from experimentation. The calculation procedure involved in applying the model is presented below involving the use of Equations (A1–A10). Note, the effective principal stress σ v is expressed in the unit of atmospheric pressure, and shear strain and damping are both expressed in percentages. Material curves for cohesive and cohesionless soils are illustrated in Figure A1.
Degradation in shear modulus:
G G m a x = 1 1 + ( γ γ r e f ) 0.919
Damping:
ζ = D m i n + 0.62 × ( G s e c G ) 0.1 × D M a
Calculation of obtaining values of the model parameters:
γ r e f = 0.0352 + 0.001 × P I × σ v 0.3483 / 100
D m i n = 0.8005 + 0.0129 × P I × σ v 0.2889
D M a = c 1 × D M a , a = 1 + c 2 × D M a , a = 1 2 + c 3 × D M a , a = 1 3
D M a , a = 1 = 100 π × ( 4 × γ γ r e f × ln γ + γ r e f γ r e f γ 2 γ + γ r e f 2 )
c 1 = 1.1143 × a 2 + 1.8618 × a + 0.2523
c 2 = 0.0805 × a 2 0.071 × a + 0.2523
c 3 = 0.0005 × a 2 + 0.0002 × a + 0.003
a = 0.919
Figure A1. Dynamic properties of soils as per the Darendeli model: (a) damping curve; (b) stiffness reduction curve.
Civileng 02 00039 g0a1
(3)
Dynamic properties for bedrock
The dynamic properties of bedrock [18,54] which is required for input into computer programs are listed in Table A3.
Table A3. Dynamic properties for bedrock.
Stiffness Degradation CurveDamping Curve
Shear Strain (%) G s e c / G m a x Shear Strain (%)Damping Ratio (%)
0.00000110.0000010.01
0.0000110.000010.1
0.000110.00010.4
0.000310.0010.8
0.0010.98750.011.5
0.0030.95250.13
0.010.914.6
0.030.81
0.10.725
10.55
100.2
1000.1

Appendix C. Artificial Ground Motion Accelerograms

In situations where the number of representative accelerogram records that can be retrieved from the database of recorded ground motion is insufficient, the record ensemble can be augmented by artificial accelerograms. In the computational procedure for generating artificial accelerograms, the acceleration time histories need to be adjusted iteratively based in accordance with the power spectral density function (PSDF) [55]. Details of the computational algorithm are briefly discussed below and is represented in the schematic diagram of Figure A2.
Figure A2. Schematic summary of the artificial accelerogram generation method.
Civileng 02 00039 g0a2
Simulation of the artificial accelerograms can be based on the assumption of non-stationary behavior of the frequency properties of the ground motion. The non-stationary behavior of the ground motion amplitude is defined by the envelope function in the time domain. The envelope function recommended by Saragoni and Hart [56] is described below.
(1)
Duration. Duration is function of magnitude and distance and is estimated as the sum of “source” and “distance” durations [57,58,59]. Expressions for calculation of the total duration are presented in Equations (A11)–(A18).
t = t s + t d
t d = 0.05 × R
t s = 0.5 f a + 0.5 f b
log f a = 2.41 0.533 × M
log ϵ = 2.52 0.637 × M
f c = 4.906 × 10 6 × 3.5 × 200 M 0 1 / 3
M 0 = 10 1.5 × M + 16.05
f b = f a × f c / f a 2 1 ϵ ϵ
(2)
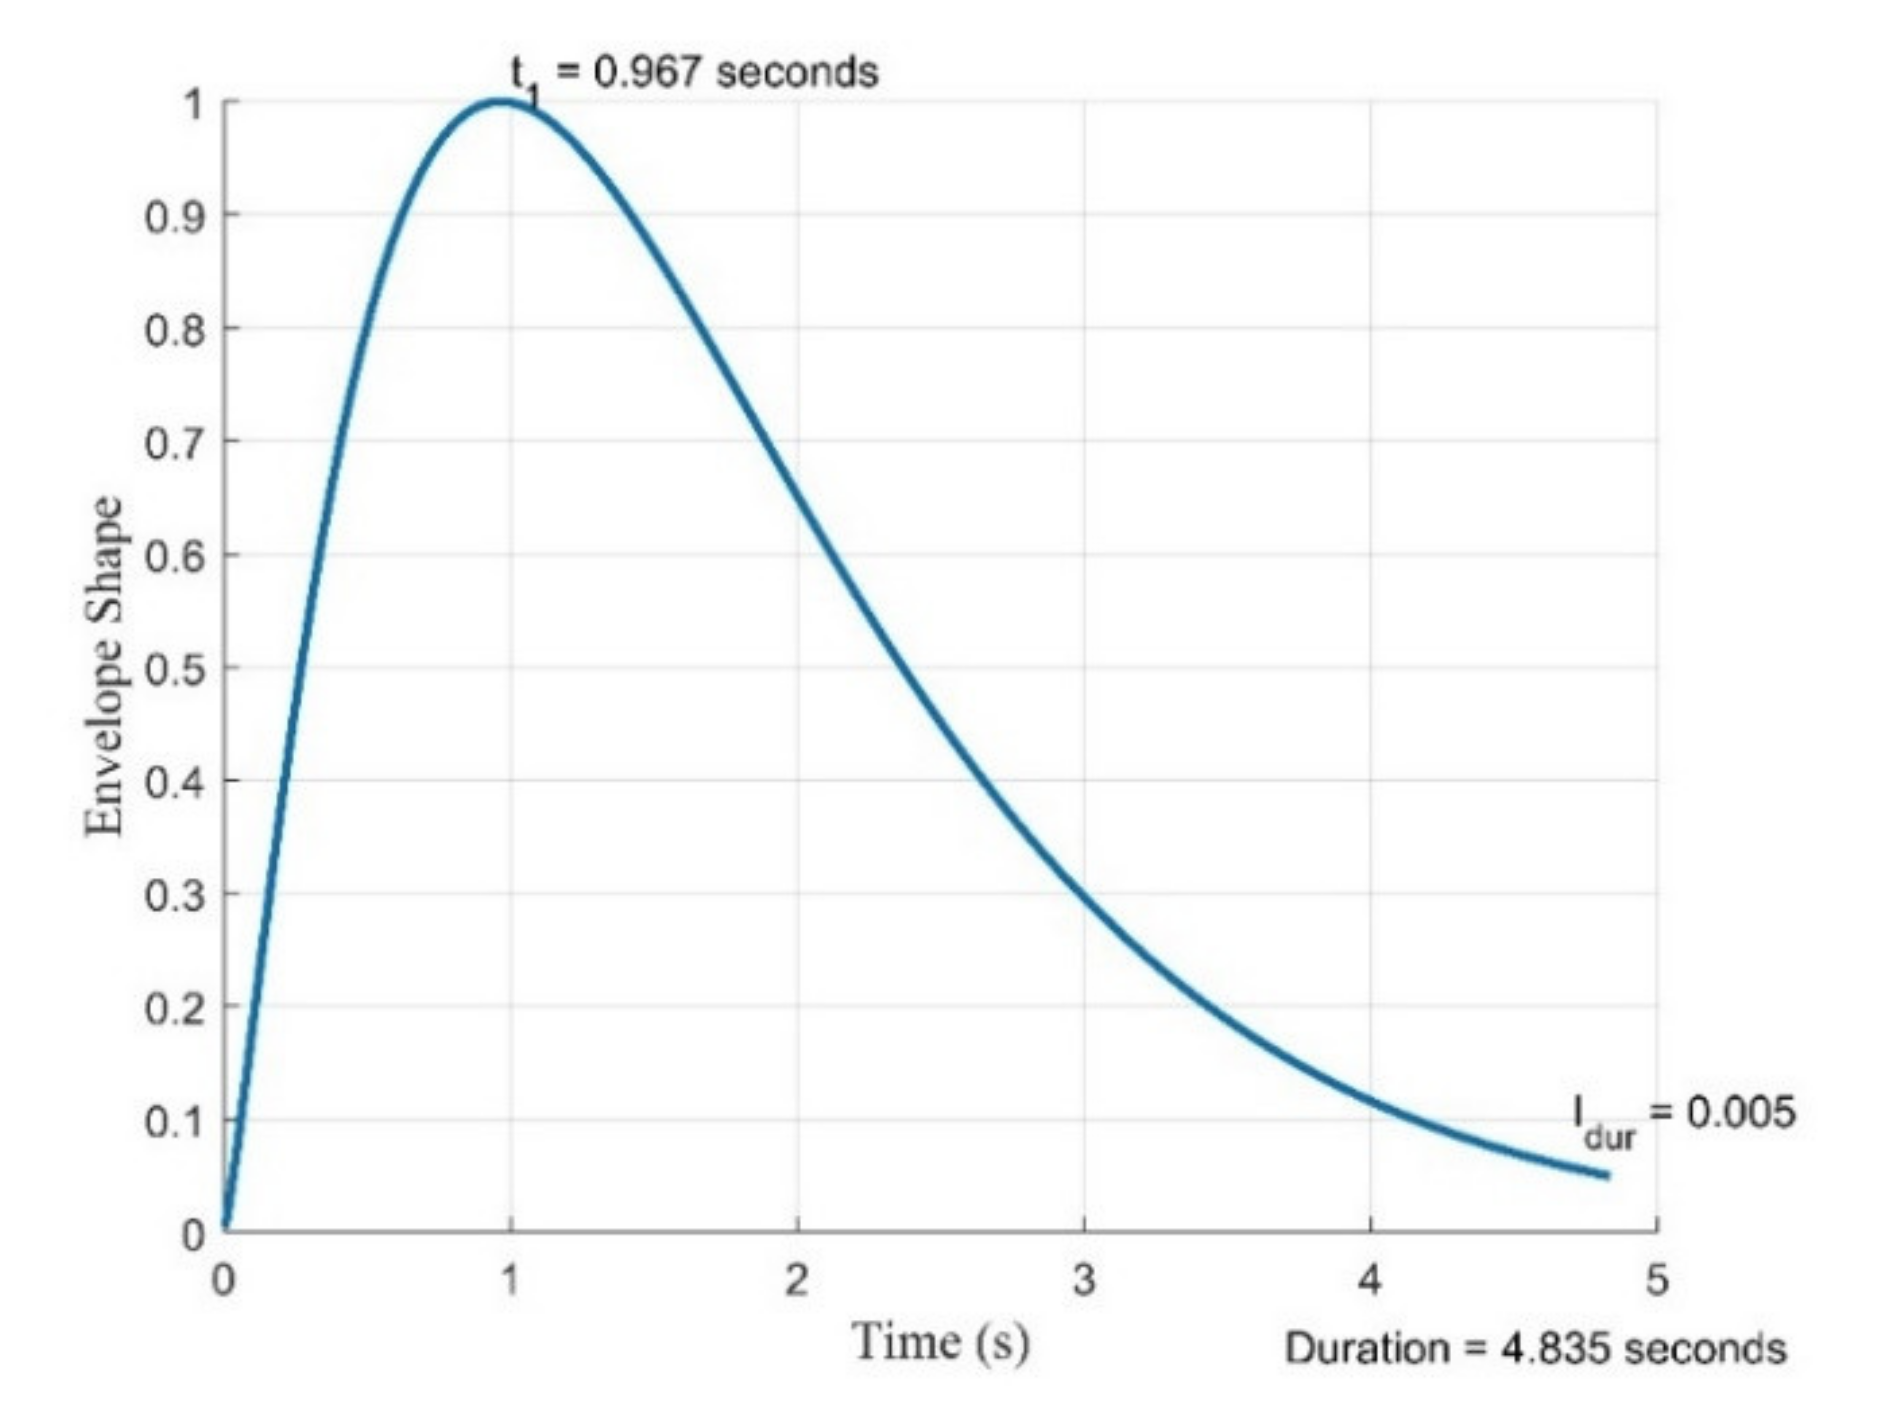
Peak time t 1 corresponds to the time at which the amplitude of the ground motion reaches the peak, meaning that the envelope function (representing the normalized amplitude) equals to unity at this point. The value of t 1 may be taken as 0.2 × T o t a l   D u r a t i o n by default.
(3)
I d u r may be taken as 0.05 by default.
In each iteration, the generated artificial ground motions are expressed as sum of a series of harmonic waves, as shown by Equation (A19).
Z t = I t × n A n × sin ω n × t + n
where I t is the envelope function, A n is amplitude, ω n is angular velocity and n is the phase angle of harmonic wave No. n (where values of n vary randomly within the range 0 and 2 π ) .
An example envelope function for an M6 R30 km earthquake event is shown in Figure A3.
Figure A3. The shape curve for an M6 R30 km earthquake event.
Civileng 02 00039 g0a3
The acceleration response spectrum and the power spectral density function (PSDF) of the ground motion need to be pre-defined at the beginning of the iteration process. In each iteration, the acceleration response spectrum is compared to the target spectrum for assessing the relative errors. When the magnitude of the relative errors exceeds the tolerable limit, the calculated PSDF is modified by the square of the ratio of the targeted and calculated response spectral value.
P S D F _ m o d i f i e d ω = P S D F ω × R S A _ t a r g e t ω R S A _ c a l c u l a t e d ω 2
The modified PSDF is then used for calculating the value of A n , and I t is also applied to the iterated motion before starting a new iteration circle. The iteration process ends when discrepancies between the targeted and calculated response spectra are within 5%. An example artificial accelerogram which has its response spectrum matching the code spectrum of AS 1170.4 for a class Be site in Melbourne for an earthquake event of M6 R30 km (consistent with a 2500-year return period) is shown in Figure A4.
Figure A4. Demonstration of an artificial ground motion accelerogram: (a) acceleration response spectrum; (b) acceleration time history.
Civileng 02 00039 g0a4

References

  1. AS 1170. 4-2007 Structural Design Actions. In Part 4: Earthquake Actions in Australia; Standards Australia: Sydney, Australia, 2007. [Google Scholar]
  2. Dhakal, R.P.; Lin, S.-L.; Loye, A.K.; Evans, S.J. Seismic design spectra for different soil classes. Bull. N. Z. Soc. Earthq. Eng. 2013, 46, 79–87. [Google Scholar] [CrossRef]
  3. Calzolari, C.; Ungaro, F. Predicting shallow water table depth at regional scale from rainfall and soil data. J. Hydrol. 2012, 414, 374–387. [Google Scholar] [CrossRef]
  4. Forcellini, D. The Role of the Water Level in the Assessment of Seismic Vulnerability for the 23 November 1980 Irpinia–Basilicata Earthquake. Geosciences 2020, 10, 229. [Google Scholar] [CrossRef]
  5. Mina, D.; Forcellini, D. Soil–structure interaction assessment of the 23 November 1980 Irpinia-Basilicata earthquake. Geosciences 2020, 10, 152. [Google Scholar] [CrossRef] [Green Version]
  6. Simonson, G.; Boersma, L. Soil morphology and water table relations: II. Correlation between annual water table fluctuations and profile features. Soil Sci. Soc. Am. J. 1972, 36, 649–653. [Google Scholar] [CrossRef]
  7. Gatmiri, B.; Arson, C. Seismic site effects by an optimized 2D BE/FE method II. Quantification of site effects in two-dimensional sedimentary valleys. Soil Dyn. Earthq. Eng. 2008, 28, 646–661. [Google Scholar] [CrossRef]
  8. Luo, Y.; Fan, X.; Huang, R.; Wang, Y.; Yunus, A.P.; Havenith, H.-B. Topographic and near-surface stratigraphic amplification of the seismic response of a mountain slope revealed by field monitoring and numerical simulations. Eng. Geol. 2020, 271, 105607. [Google Scholar] [CrossRef]
  9. Maufroy, E.; Chaljub, E.; Hollender, F.; Kristek, J.; Moczo, P.; Klin, P.; Priolo, E.; Iwaki, A.; Iwata, T.; Etienne, V. Earthquake ground motion in the Mygdonian basin, Greece: The E2VP verification and validation of 3D numerical simulation up to 4 Hz. Bull. Seismol. Soc. Am. 2015, 105, 1398–1418. [Google Scholar] [CrossRef] [Green Version]
  10. Moczo, P.; Kristek, J.; Bard, P.-Y.; Stripajová, S.; Hollender, F.; Chovanová, Z.; Kristeková, M.; Sicilia, D. Key structural parameters affecting earthquake ground motion in 2D and 3D sedimentary structures. Bull. Earthq. Eng. 2018, 16, 2421–2450. [Google Scholar] [CrossRef] [Green Version]
  11. Tsang, H.; Wilson, J.; Lam, N.; Su, R. A design spectrum model for flexible soil sites in regions of low-to-moderate seismicity. Soil Dyn. Earthq. Eng. 2017, 92, 36–45. [Google Scholar] [CrossRef] [Green Version]
  12. Bindi, D.; Massa, M.; Luzi, L.; Ameri, G.; Pacor, F.; Puglia, R.; Augliera, P. Pan-European ground-motion prediction equations for the average horizontal component of PGA, PGV, and 5%-damped PSA at spectral periods up to 3.0 s using the RESORCE dataset. Bull. Earthq. Eng. 2014, 12, 391–430. [Google Scholar] [CrossRef] [Green Version]
  13. Falcone, G.; Acunzo, G.; Mendicelli, A.; Mori, F.; Naso, G.; Peronace, E.; Porchia, A.; Romagnoli, G.; Tarquini, E.; Moscatelli, M. Seismic amplification maps of Italy based on site-specific microzonation dataset and one-dimensional numerical approach. Eng. Geol. 2021, 289, 106170. [Google Scholar] [CrossRef]
  14. Yi, J.; Lam, N.; Tsang, H.-H.; Au, F.T. Selection of earthquake ground motion accelerograms for structural design in Hong Kong. Adv. Struct. Eng. 2020, 23, 2044–2056. [Google Scholar] [CrossRef]
  15. Baker, J.W.; Cornell, C. Spectral shape, epsilon and record selection. Earthq. Eng. Struct. Dyn. 2006, 35, 1077–1095. [Google Scholar] [CrossRef]
  16. Baker, J.W. Conditional mean spectrum: Tool for ground-motion selection. J. Struct. Eng. 2011, 137, 322–331. [Google Scholar] [CrossRef]
  17. Jayaram, N.; Lin, T.; Baker, J.W. A computationally efficient ground-motion selection algorithm for matching a target response spectrum mean and variance. Earthq. Spectra 2011, 27, 797–815. [Google Scholar] [CrossRef]
  18. Schnabel, P.B.; Lysmer, J.; Seed, H.B. SHAKE: A Computer Program for Earthquake Response Analysis of Horizontally Layered Sites; EERC Report 72-12; University of California, Berkeley: Berkeley, CA, USA, 1972. [Google Scholar]
  19. Robinson, D.; Dhu, T.; Schneider, J. SUA: A computer program to compute regolith site-response and estimate uncertainty for probabilistic seismic hazard analyses. Comput. Geosci. 2006, 32, 109–123. [Google Scholar] [CrossRef]
  20. Wilson, J.; Lam, N. AS 1170.4 Supp1-2007 Commentary to Structural Design Actions Part 4: Earthquake Actions in Australia; Australian Earthquake Engineering Society: McKinnon, VIC, Australia, 2007. [Google Scholar]
  21. Hu, Y.; Lam, N.; Menegon, S.J.; Wilson, J. The Selection and Scaling of Ground Motion Accelerograms for Use in Stable Continental Regions. J. Earthq. Eng. 2021, 1–21. [Google Scholar] [CrossRef]
  22. Wair, B.R.; DeJong, J.T.; Shantz, T. Guidelines for Estimation of Shear Wave Velocity Profiles; Pacific Earthquake Engineering Research Center: Berkeley, CA, USA, 2012. [Google Scholar]
  23. Darendeli, M.B. Development of a New Family of Normalized Modulus Reduction and Material Damping Curves; The University of Texas at Austin: Austin, TX, USA, 2001. [Google Scholar]
  24. Ciancimino, A.; Foti, S.; Lanzo, G. Stochastic analysis of seismic ground response for site classification methods verification. Soil Dyn. Earthq. Eng. 2018, 111, 169–183. [Google Scholar] [CrossRef]
  25. Guzel, Y.; Rouainia, M.; Elia, G. Effect of soil variability on nonlinear site response predictions: Application to the Lotung site. Comput. Geotech. 2020, 121, 103444. [Google Scholar] [CrossRef]
  26. Rathje, E.M.; Kottke, A.R.; Trent, W.L. Influence of input motion and site property variabilities on seismic site response analysis. J. Geotech. Geoenvironmental Eng. 2010, 136, 607–619. [Google Scholar] [CrossRef]
  27. Sykora, D.W. Examination of Existing Shear Wave Velocity and Shear Modulus Correlations in Soils; Corps of Engineers Vicksburg MS: Vicksburg, MS, USA, 1987. [Google Scholar]
  28. Imai, T.; Tonoughi, K. Correlation of N value with S-wave velocity and shear modulus. In Proceedings of the 2nd European symposium on penetration testing, Amsterdam, The Netherlands, 24–27 May 1982; pp. 67–72. [Google Scholar]
  29. Ohta, Y.; Goto, N. Empirical shear wave velocity equations in terms of characteristic soil indexes. Earthq. Eng. Struct. Dyn. 1978, 6, 167–187. [Google Scholar] [CrossRef]
  30. AS 1726. 2017 Geotechnical Site Investigations; Standards Australia: Sydney, Australia, 2017. [Google Scholar]
  31. Hardin, B.O.; Drnevich, V.P. Shear modulus and damping in soils: Measurement and parameter effects (terzaghi leture). J. Soil Mech. Found. Div. 1972, 98, 603–624. [Google Scholar] [CrossRef]
  32. Vucetic, M.; Dobry, R. Effect of soil plasticity on cyclic response. J. Geotech. Eng. 1991, 117, 89–107. [Google Scholar] [CrossRef]
  33. Baise, L.G.; Kaklamanos, J.; Berry, B.M.; Thompson, E.M. Soil amplification with a strong impedance contrast: Boston, Massachusetts. Eng. Geol. 2016, 202, 1–13. [Google Scholar] [CrossRef] [Green Version]
  34. Falcone, G.; Romagnoli, G.; Naso, G.; Mori, F.; Peronace, E.; Moscatelli, M. Effect of bedrock stiffness and thickness on numerical simulation of seismic site response. Italian case studies. Soil Dyn. Earthq. Eng. 2020, 139, 106361. [Google Scholar] [CrossRef]
  35. Tsang, H.-H.; Sheikh, M.N.; Lam, N.T. Modeling shear rigidity of stratified bedrock in site response analysis. Soil Dyn. Earthq. Eng. 2012, 34, 89–98. [Google Scholar] [CrossRef]
  36. Collins, C.; Kayen, R.; Carkin, B.; Allen, T.; Cummins, P.; McPherson, A. Shear wave velocity measurement at Australian ground motion seismometer sites by the spectral analysis of surface waves (SASW) method. In Proceedings of the Conference of the Australian Earthquake Engineering Society (AEES), Canberra, Australia, 24–26 November 2006; pp. 173–178. [Google Scholar]
  37. Roberts, J.; Asten, M.; Tsang, H.H.; Venkatesan, S.; Lam, N.; Chandler, A. Shear wave velocity profiling in Melbourne silurian mudstone using the spac method. In Proceedings of the a Conference of the Australian Earthquake Engineering Society (AEES), Mount Gambier, South Australia, 5–7 November 2004. [Google Scholar]
  38. Setiawan, B.; Jaksa, M.; Griffith, M.; Love, D. Estimating bedrock depth in the case of regolith sites using ambient noise analysis. Eng. Geol. 2018, 243, 145–159. [Google Scholar] [CrossRef]
  39. Bertuzzi, R. Sydney sandstone and shale parameters for tunnel design. Aust. Geomech. 2014, 49, 1–40. [Google Scholar]
  40. Asten, M.; Collins, C.; Volti, T.; Ikeda, T. The good, the bad and the ugly-lessons from and methodologies for extracting shear-wave velocity profiles from microtremor array measurements in urban Newcastle. ASEG Ext. Abstr. 2013, 2013, 1–7. [Google Scholar] [CrossRef]
  41. Tsang, H.-H.; Pitilakis, K. Mechanism of geotechnical seismic isolation system: Analytical modeling. Soil Dyn. Earthq. Eng. 2019, 122, 171–184. [Google Scholar] [CrossRef]
  42. Timothy, D.A.; Robert, B.D.; Jonathan, P.S.; Emel, S.; Walter, J.S.; Brian, S.J.C.; Katie, E.W.; Robert, W.; Albert, R.K.; David, M.B.; et al. 2013. PEER NGA-West 2 Database. Available online: http://ngawest2.berkeley.edu (accessed on 24 June 2021).
  43. Bathe, K.-J. Finite Element Procedures; Klaus-Jurgen Bathe: Watertone, MA, USA, 2006. [Google Scholar]
  44. Ordonez, G.A. SHAKE2000: A Computer Program for the 1D Analysis of Geotechnical Earthquake Engineering Problems; Geomotions, LLC: Lacey, DC, USA, 2000. [Google Scholar]
  45. Bardet, J.; Ichii, K.; Lin, C. EERA: A Computer Program for Equivalent-Linear Earthquake Site Response Analyses of Layered Soil Deposits; University of Southern California, Department of Civil Engineering: LosAngeles, CA, USA, 2000. [Google Scholar]
  46. Kottke, A.R.; Rathje, E.M. Technical Manual for Strata; Pacific Earthquake Engineering Research Center: Berkeley, CA, USA, 2009. [Google Scholar]
  47. Papaspiliou, M.; Kontoe, S.; Bommer, J.J. An exploration of incorporating site response into PSHA-part II: Sensitivity of hazard estimates to site response approaches. Soil Dyn. Earthq. Eng. 2012, 42, 316–330. [Google Scholar] [CrossRef] [Green Version]
  48. Régnier, J.; Bonilla, L.F.; Bard, P.Y.; Bertrand, E.; Hollender, F.; Kawase, H.; Sicilia, D.; Arduino, P.; Amorosi, A.; Asimaki, D. International benchmark on numerical simulations for 1D, nonlinear site response (PRENOLIN): Verification phase based on canonical cases. Bull. Seismol. Soc. Am. 2016, 106, 2112–2135. [Google Scholar] [CrossRef]
  49. Régnier, J.; Bonilla, L.F.; Bard, P.Y.; Bertrand, E.; Hollender, F.; Kawase, H.; Sicilia, D.; Arduino, P.; Amorosi, A.; Asimaki, D. PRENOLIN: International benchmark on 1D nonlinear site-response analysis—Validation phase exercise. Bull. Seismol. Soc. Am. 2018, 108, 876–900. [Google Scholar] [CrossRef]
  50. Tsang, H.-H.; Wilson, J.L.; Lam, N.T. A refined design spectrum model for regions of lower seismicity. Aust. J. Struct. Eng. 2017, 18, 3–10. [Google Scholar] [CrossRef]
  51. Bommer, J.J.; Acevedo, A.B. The use of real earthquake accelerograms as input to dynamic analysis. J. Earthq. Eng. 2004, 8, 43–91. [Google Scholar] [CrossRef]
  52. Krinitzsky, E.; Chang, F. Specifying Peak Motions for Design Earthquakes; State-of the-Art for Assessing Earthquake Hazards in the United States, United States Army Corps of Engineers: Washington, DC, USA, 1977; Volume 7. [Google Scholar]
  53. Coduto, D.P. Geotechnical Engineering: Principles and Practices; Prentice Hall: Hoboken, NJ, USA, 1999. [Google Scholar]
  54. Seed, H.B.; Idriss, I.M. Soil Moduli and Damping Factors for Dynamic Response Analyses; University of California Berkeley: Berkeley, CA, USA, 1970. [Google Scholar]
  55. Gasparini, D.A. Simulated Earthquake Motions Compatible with Prescribed Response Spectra; MIT Department of Civil Engineering Research Report: Boston, MA, USA, 1976. [Google Scholar]
  56. Rodolfo Saragoni, G.; Hart, G.C. Simulation of artificial earthquakes. Earthq. Eng. Struct. Dyn. 1973, 2, 249–267. [Google Scholar] [CrossRef]
  57. Atkinson, G.M. Earthquake source spectra in eastern North America. Bull. Seismol. Soc. Am. 1993, 83, 1778–1798. [Google Scholar]
  58. Boore, D.M.; Di Alessandro, C.; Abrahamson, N.A. A generalization of the double-corner-frequency source spectral model and its use in the SCEC BBP validation exercise. Bull. Seismol. Soc. Am. 2014, 104, 2387–2398. [Google Scholar] [CrossRef] [Green Version]
  59. Tang, Y.; Lam, N.; Tsang, H.-H.; Lumantarna, E. An Adaptive Ground Motion Prediction Equation for Use in Low-to-Moderate Seismicity Regions. J. Earthq. Eng. 2020, 1–32. [Google Scholar] [CrossRef]
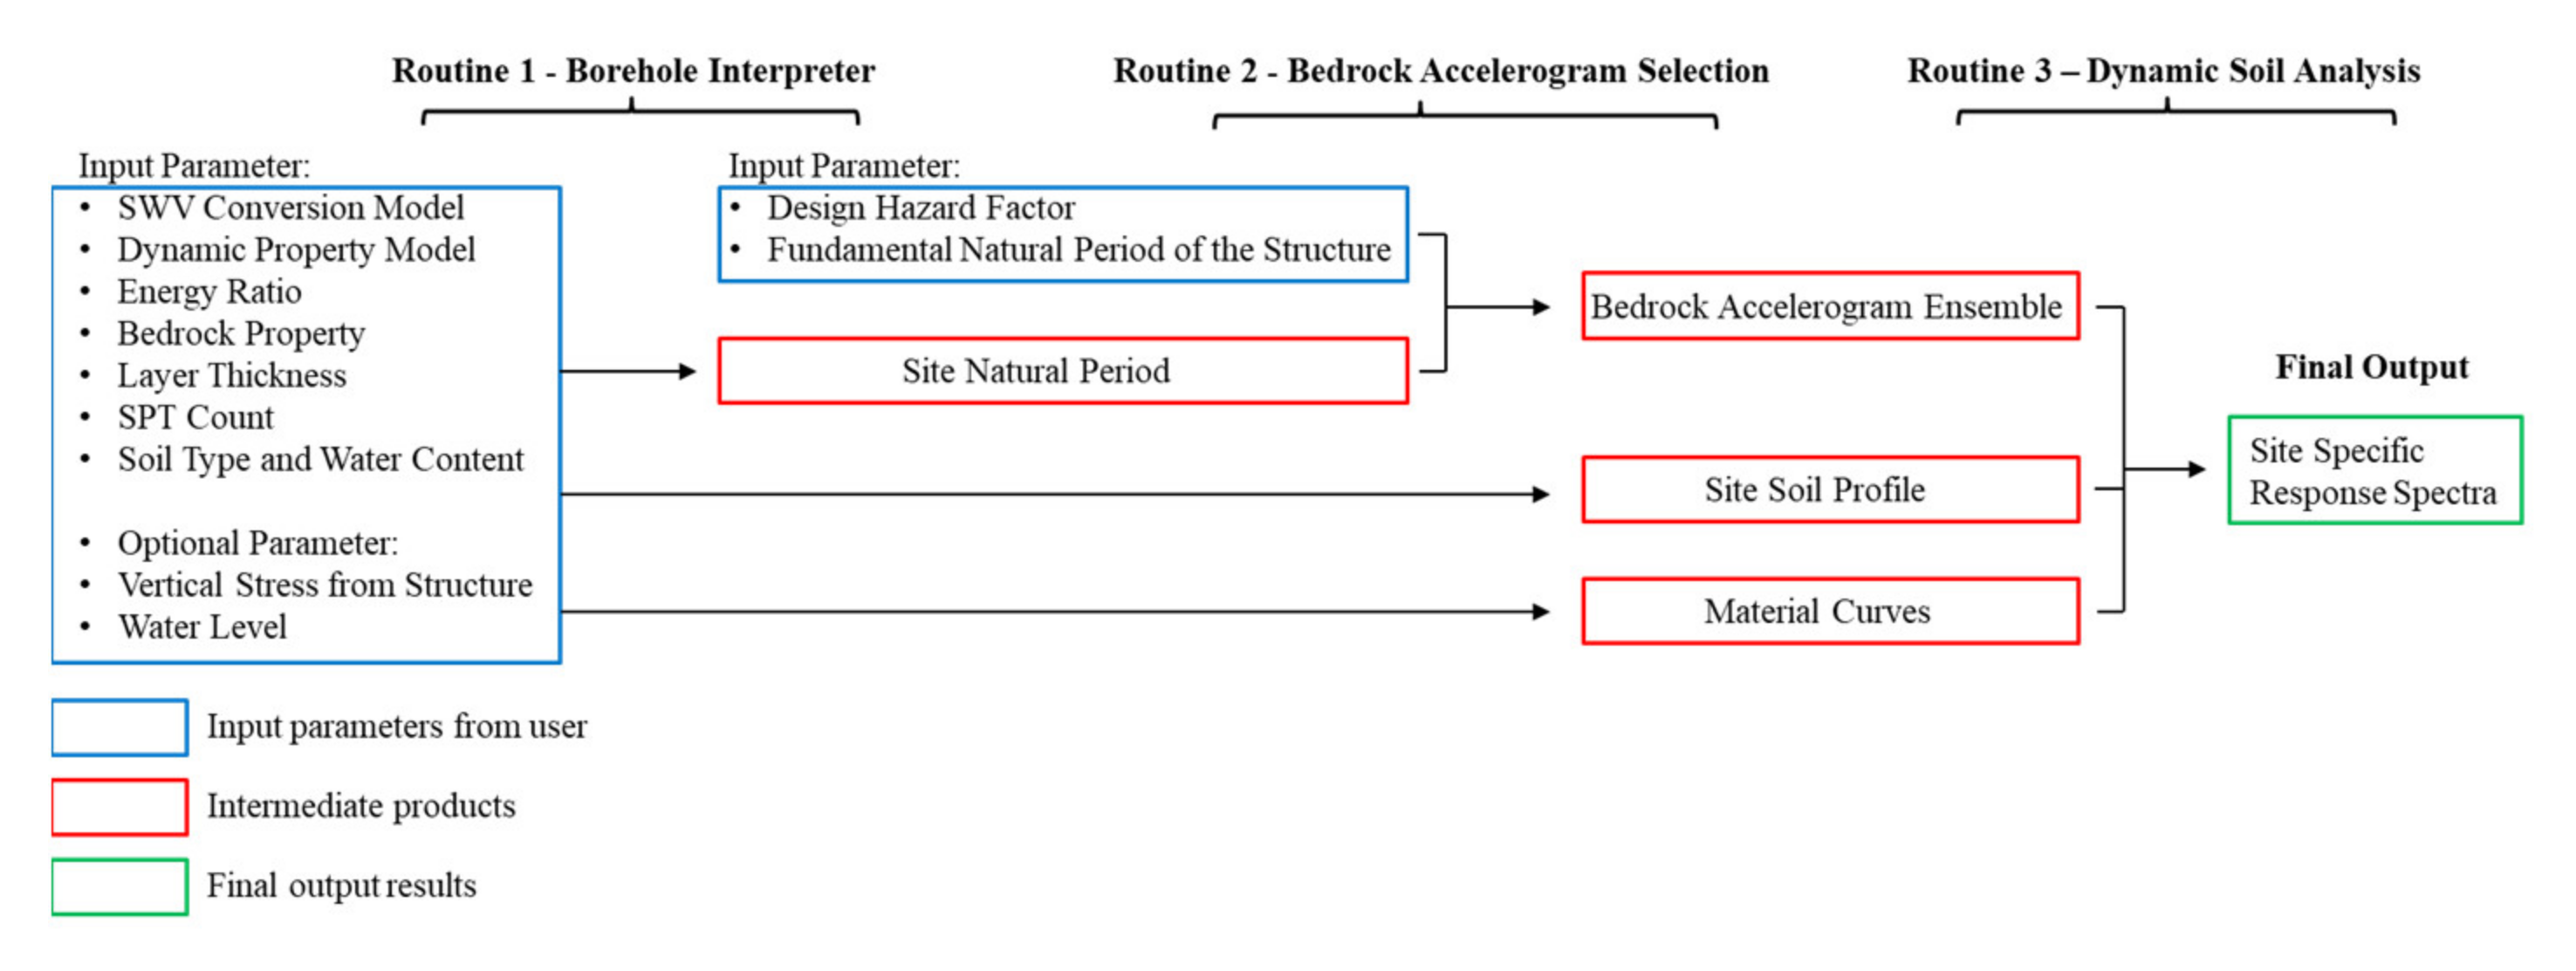
Figure 1. Procedures for generating a site-specific response spectrum.
Civileng 02 00039 g001
Figure 2. Dynamic properties of soils as per the Hardin and Drnevich model: (a) damping curve; (b) stiffness reduction curve.
Civileng 02 00039 g002aCivileng 02 00039 g002b
Figure 3. Illustration of the CMS for a 2500-year return period event in Melbourne.
Civileng 02 00039 g003
Figure 4. Case Study Output—shear wave velocity profile.
Civileng 02 00039 g004
Figure 5. Case Study Output—the number of selected motions at each reference period.
Civileng 02 00039 g005
Figure 6. Case Study Output—bedrock ground motion ensemble, the CMS and the class Be code spectrum in response spectral acceleration format.
Civileng 02 00039 g006
Figure 7. Case Study Output—soil surface ground motion ensemble: (a) site-specific acceleration response spectra in the primary direction; (b) site-specific acceleration response spectra in the orthogonal direction; (c) comparison of the mean response spectra of the primary and orthogonal directions with the class De code spectrum.
Civileng 02 00039 g007
Figure 8. Case Study Output—Motion 3: (a) comparison of the response spectra (in term of pseudo acceleration) of the bedrock and soil surface motion in both primary and orthogonal directions with the class De spectrum; (b) soil surface accelerograms in the primary direction; (c) soil surface accelerograms in the orthogonal direction.
Civileng 02 00039 g008
Figure 9. Case Study Output—site-specific acceleration response spectra in the primary direction when the fundamental period of structure is 1.8 s.
Civileng 02 00039 g009
Table 1. Shear wave velocity and SPT N-value correlation expression.
Soil Age 1Soil TypeCorrelation ExpressionEq. No
(1) Imai and Tonouchi all soil model—SPT N-value dependent [28]
--All Soil V S = 93.7 × N 60 0.314 (5)
(2) Ohta and Goto Model—SPT N-value and soil type dependent [29]
--Clay and Silt V S = 82.4 × N 60 0.34 (6)
--Fine Sand V S = 86.8 × N 60 0.34 (7)
--Medium Sand V S = 78.3 × N 60 0.34 (8)
--Coarse Sand V S = 77.2 × N 60 0.34 (9)
--Gravel V S = 100.8 × N 60 0.34 (10)
(3) Imai and Tonouchi model—SPT N-value, soil type and soil age dependent [28]
HoloceneClay and Silt V S = 103.8 × N 60 0.27 (11)
Sand V S = 85 × N 60 0.29 (12)
Gravel V S = 72.3 × N 60 0.35 (13)
PleistoceneClay and Silt V S = 124.4 × N 60 0.26 (14)
Sand V S = 106.6 × N 60 0.29 (15)
Gravel V S = 132.4 × N 60 0.25 (16)
(4) PEER model—SPT N-value, soil type, soil age and effective principal pressure dependent [22]
--Clay and Silt V S = 26 × N 60 0.17 × σ v 0.32 (17)
--Sand V S = 30 × N 60 0.23 × σ v 0.25 (18)
HoloceneGravel V S = 53 × N 60 0.19 × σ v 0.18 (19)
PleistoceneGravel V S = 115 × N 60 0.17 × σ v 0.12 (20)
1 the Pleistocene (~2.588 million years to 11.7 thousand years ago) and the Holocene (past 11.7 thousand years) are two epochs in the Quaternary period; in situations where soil age is Quaternary or not specified in the borelog, SWV is calculated as the average value from the expressions for Holocene and Pleistocene soils.
Table 2. Recommended PI values for different soil types.
Soil TypeGeneralDifferent Classes of Cohesive Soils
Sand/GravelSilt/ClayMLMHCLCICH
PI (%)030515102540
Table 3. Initials for cohesive soils.
Cohesive Soil
InitialSoil Type
MLLow plasticity silt
MHHigh plasticity silt
CLLow plasticity clay
CIMedium plasticity clay
CHHigh plasticity clay
Table 4. The reference shear strain for the Hardin and Drnevich model.
PI (%)0153050
γ r e f (%) 10.00250.00450.10.2
1 Use linear interpolation where necessary to obtain the reference shear strain for any value of PI.
Table 5. Recommended bedrock properties for different rock types and regions.
State—CityRock TypeDensity (kg/m3)SWV (m/s)
NSW—SydneyHawkesbury sandstone22001300
NSW—NewcastleSedimentary rock22501500
SA—AdelaideSedimentary rock21001000
VIC—MelbourneBasalt23501800
Silurian siltstone/sandstone23001700
Table 6. Input parameters for the case study.
Input ParametersValueUnit
Bedrock Ground Motion Selection
I. Design Hazard Factor (kpZ)0.144
II. Fundamental Period of the Structure0.5second
III. Time Step *0.005second
Soil Profile Based on Borehole Logs
I. Shear Wave Velocity Conversion Model *PEER Model
II. Soil Dynamic Property Model *Darendeli Model
III. Dominant Soil TypeClayey
IV. Initial Vertical Stress from Structure *50kPa
V. Energy Ratio *1
VI. Water Level *3.3m
VII. Bedrock Shear Wave Velocity *1800m/s
VIII. Bedrock Density *2350kg/m3
IX. Total Number of Soil Layer15
Layer Characteristics
Layer NumberThickness (m)SPT CountSoil TypeWater ContentSoil Age
10.340SPMUnknown
20.920GCMUnknown
32.112CHM2Unknown
44.81CHM2Unknown
54.99CHM3Unknown
63.819CHM3Unknown
71.120SMWUnknown
84.618CHM3Unknown
92.115SCWUnknown
100.918SMWUnknown
111.812CHM3Unknown
121.522CHM3Unknown
132.223CHM3Unknown
142.216GPWUnknown
150.895GPWUnknown
* Parameters marked with an asterisk have default values embedded in the program.
Table 7. Explanation of soil terminologies: (a) initials for soil type; (b) initials for water content; (c) soil descriptions and correlation to SPT count.
(a)
Cohesive SoilCohesionless Soil
InitialSoil TypeInitialSoil Type
MLLow plasticity siltGWWell-grade gravel
MHHigh plasticity siltGPPoorly-grade gravel
CLLow plasticity clayGMSilty gravel
CIMedium plasticity clayGCClayey gravel
CHHigh plasticity claySWWell-grade sand
SPPoorly-grade sand
SMSilty sand
SCClayey sand
(b)
Cohesive SoilCohesionless Soil
InitialTermWater ContentInitialWater Content
M1 w < P L Moist, dry of plastic limitDDry
M2 w P L Moist, near plastic limitMMoist
M3 w > P L Moist, wet of plastic limitWWet
W1 w L L Wet, near liquid limit
W2 w > L L Wet, wet of liquid limit
(c)
Cohesive SoilCohesionless Soil
InitialDescriptionSPT countInitialDescriptionSPT count
VSVery Soft0–2VLVery Loose0–4
SSoft2–4LLoose4–10
FFirm4–8MDMedium Dense10–30
StStiff8–15DDense30–50
VStVery Stiff15–30VDVery Dense > 50
HHard > 30
Table 8. Case Study Output—detailed information about the bedrock ground motion ensemble.
Ref. NumberEarthquake NameReference Period (s)YearStation NameMagnitudeRjb (km)Scaling Factor
1Whittier Narrows-020.21987Mt Wilson—CIT Seis Sta5.2716.451.20
2Chi-Chi_ Taiwan-020.21999KAU0505.980.571.46
3N. Palm Springs0.51986Cranston Forest Station6.0627.210.89
4Whittier Narrows-010.51987Brea Dam (L Abut)5.9919.120.92
5Chi-Chi_ Taiwan-020.51999TCU0715.920.11.41
6Chi-Chi_ Taiwan-050.51999TCU1386.241.460.95
7Whittier Narrows-010.51987Beverly Hills—12520 Mulhol5.9925.911.23
8N. Palm Springs0.51986San Jacinto—Soboba6.0622.960.75
9Coalinga-0111983Parkfield—Stone Corral 3E6.3632.811.14
10San Fernando11971Pasadena—Old Seismo Lab6.6121.50.87
11Niigata_ Japan12004NIGH106.6339.171.02
12Coalinga-0111983Parkfield—Stone Corral 2E6.3635.291.24
13Loma Prieta21989Yerba Buena Island6.9375.070.79
14Iwate_ Japan22008Maekawa Miyagi Kawasaki City6.974.820.88
Publisher’s Note: MDPI stays neutral with regard to jurisdictional claims in published maps and institutional affiliations.