Article

A Study of the Efficiency of Mediterranean Container Ports: A Data Envelopment Analysis Approach

by
Tatiana P. Moschovou
* and
Dimitrios Kapetanakis
Department of Transportation Planning and Engineering, National Technical University of Athens, 157 73 Athens, Greece
*
Author to whom correspondence should be addressed.
CivilEng 2023, 4(3), 726-739; https://doi.org/10.3390/civileng4030041
Submission received: 11 May 2023 / Revised: 9 June 2023 / Accepted: 19 June 2023 / Published: 27 June 2023
(This article belongs to the Special Issue Feature Papers in CivilEng)

Abstract

:
The current paper presents the results of a study that analyzed and evaluated the efficiency of the largest container ports in the wider area of the Mediterranean Basin. The research question that this paper seeks to respond to is how the resources (inputs) of a container port reflect its level of activity and efficiency. In particular, what is the relationship between ports’ infrastructures, equipment and their productivity and the ports’ ability to attract economic activities as well as the extent of their effect on a port’s efficiency? The methodology uses the data envelopment analysis (DEA) output-oriented model following a cross-sectional approach. The research conducts two modeling approaches, the CCR and the BCC model. The analysis goes deeper and compares port efficiency estimates in relation to medium-sized and large ports’ classification and their total market share. The main findings indicated an average efficiency of 0.88 and 0.89 assuming constant and variable returns of scale, respectively, implying that the ports can increase their output levels up to approximately 1.2 times without any change in their inputs.

1. Introduction

Container ports play a crucial role in the supply chain and in the container transport and transshipment processes. The pivotal status and role of container ports is apparent as they support and foster a country’s economic development [1]. A key factor for ports to productively contribute to the economy is their ability to optimize their performance. Ports with a good performance increase their productivity, efficiency, reliability and therefore competitiveness [2].
Port performance is formed by a set of components, among which efficiency and effectiveness are two major interrelated ones. Efficiency is an important measure “in indicating any change in overall performance” [3]. It is expressed as a ratio of an output to an input. By the term port efficiency, the operational performance of a port and the maximization of its output production are implied while possessing specific resources and inputs [4]. It is usually measured in terms of throughput, turnaround time, operational costs and customer satisfaction. High port efficiency provides a competitive advantage to the port and the associated businesses that rely on it. Nevertheless, except efficiency, another important criterion for high port performance is effectiveness, understood as the ability of a port to meet the demand, achieve customers’ satisfaction and the desired services [5].
Container ports located in the wider Mediterranean area act as important maritime gateways connecting Europe, Asia and North Africa. They are considered as important and strategic nodes that facilitate intercontinental transport activities. European countries are the main connections for the Mediterranean with 40–50% of total extra-Mediterranean traffic, while the share of intra-Mediterranean traffic (in total Mediterranean traffic) increased from 49% to 58% in 2016 [6]. According to recent figures, the total container throughput of the top 10 Mediterranean ports increased by 133% from 2004 to 2020 [7].
The current work presents the results of a study that analyzed and evaluated the efficiency of the largest container ports in the wider area of the Mediterranean Basin. The research questions that this paper seeks to answer are (a) how do the resources (inputs) of container ports, such as their handling capacity, reflect on their level of activity and efficiency? (b) What is the relationship between a port’s infrastructures and equipment and its productivity as well as the port’s ability to attract economic activities? (c) What are the extent and effects of ports’ resources to produce their outcomes (outputs), the ports’ efficiency and, consequently, their effectiveness and performance? The methodology uses the data envelopment analysis (DEA) modeling procedure following cross-sectional data analysis. All data are collected for the year with the most recent available data, i.e., 2021, and the sample includes the top 14 container ports from 10 Mediterranean countries. The research conducts two modeling approaches, the CCR model [8] and the BCC data envelopment analysis model [9]. This work is expected to fill the gap in the research of container port efficiency by the inclusion of a robust model and by revealing the ways a port can further invest to improve its performance and productivity. The analysis goes deeper and compares port efficiency estimates in relation to medium-sized and large ports’ classification and their total market share.
The remainder of this paper evolves as follows: Section 2 provides a presentation of previous studies and results on port efficiency, followed by Section 3, which presents the theoretical background of the DEA methodology and the modeling method followed. Section 4 focuses on the definition of input and output variables and the criteria for the data collection process for the ports under study. Section 5 summarizes the main estimates of the efficiency levels, emphasizing the major findings and results of the analysis implemented. Finally, Section 6 presents the main conclusions, shortcomings and future research directions.

2. Literature Review

There are a wide range of studies in the literature that have investigated and measured the efficiency and effectiveness of container ports. Several studies have analyzed and examined the crucial role of container ports and their significance in the economy of the countries in which they are located. Other studies investigated the potential impact of privatization on the efficiency of ports and whether the entry of private entities in their operation has led to increased performance. Moreover, various research works analyzed and examined the relationship of ports’ resources with their productivity and efficiency by use of the data envelopment analysis method. An overview of previous research works is summarized in the following.

2.1. Ports, Economic Development and Privatization

The significant impacts of container ports on the economy have been analyzed from a variety of perspectives, either for their direct impact on the national gross domestic product of the country in which they are located or for being a catalyst for economic growth and development and facilitating international trade. Bottasso et al. (2014) [10] reported that for every 10% increase in port productivity, the GDP of the port’s region increases by 6–20% and by 5–18% in the neighboring regions of the port. Shan et al. (2014) [11] investigated 41 major ports in China to conclude that for every 1% increase in transported containers there is an increase of 7.6% in GDP and a positive economic impact on neighboring economies. Similarly, the exploration of the economic impact of ports in South Africa showed that a 1% drop in port activity results in a 17% economic loss [12]. The authors of [13] highlighted the strong correlation of maritime trade with a country’s GDP and showed that, due to globalization, the importance of ports has been greatly increased. Therefore, cities which host ports present a competitive advantage over those that do not, which is obvious due to their rapid development. More recently, Miambo (2021) [14] examined the impact of African ports on trade and economy, showing the strong relation of port efficiency, economic growth and trade competitiveness.
The concept of ports’ privatization and its impact on their efficiency has been studied by several scholars, including whether the ports’ performance was improved due to the change in their ownership and the involvement of the private sector. The main objective of port privatization is to improve efficiency by the inclusion of management practices. Cui and Notteboom [15] examined a number of container ports in China and found that privatization actions have improved ports’ efficiency, operation and reduced vessels’ waiting time. Similarly, Pagano et al. (2013) [16] assessed the performance and effectiveness of Panama ports during government and private sector operation and their results showed that positive effects and savings could be gained. This opinion is also shared by a number of other studies as well (interested readers can refer to [17,18]). A characteristic example of the effect of the entry of the private sector on port efficiency is the port of Piraeus in Greece. The most significant result of this investment is the port’s redevelopment into a competitive one, something that is evident from its high ranking in terms of TEUs (of 5 among European ports) [19]. Recently, the ownership of the port of Haifa in Israel changed from state-owned to private, and the process of port privatization is now completed [20]. In a non-Mediterranean area, in Brazil, talks for the continuation of the privatization process for the port of Santos have taken place once more [21]. On the other hand, there are several studies suggesting that there are cases where privatization does not always lead to more efficient ports and that the role of the public sector is significant (e.g., [3,15,22,23]).

2.2. Port Efficiency with DEA Models

Various researchers studied the efficiency of container ports, under the prism of various DEA methodologies. In the 1990s only a few scholars conducted studies applying DEA models (for example, [24,25,26]), while during and after the 2000s, the DEA technique was gradually expanded to compare ports from all over the world (e.g., [27,28,29,30,31,32,33,34,35]). For example, [27] applied DEA-CCR and DEA-Additive models to four Australian ports and twelve international east/west container ports and showed that efficiency is not necessarily related to the size and functioning of the port. This conclusion challenged [28] who supported and demonstrated, when applying the DEA-CCR-Tobit model to ports of North America, that the size (length of quay, size of terminal, etc.) of the port plays an important role in efficiency. Additionally, the authors noted the correlation between increased port productivity and the presence of rail infrastructure and hinterland requirements. The authors of [29] also applied DEA for ports’ efficiency in the area of Greece and Portugal. In 2007, ref. [36] explained that efficiency increases when resources (inputs) are limited and used in an economical way in order to produce the best possible results (outputs). Applying DEA-CCR and DEA-BCC-Robit, they concluded that DEA provides reliable results when comparing ports with similar characteristics. Three years later (2010), ref. [32] used the DEA-Panel data model for the 25 major, in terms of TEUs, east–west container ports. They concluded that port container throughput (a port’s productivity) does not have a clear link with efficiency and that more detailed research is needed for the extraction of certain results.
Recent works regarding port efficiency estimation conducted with the DEA modeling approach are [37], comparing the efficiency of container ports in the Asian and Middle East area, [38] that studied Spanish ports in relation to their efficiency levels and [39], measuring technical inefficiency of European ports. Outside the EU, some indicative studies are [40,41] that measured the operational efficiency of Vietnamese ports, [42] for Tunisian commercial ports and [43,44] for Chinese and Tunisian ports. While all the above applications used (with minimal exceptions) almost the same inputs and outputs, the author of [45] uses, among others, economic terms as outputs (revenue generated) in an attempt to find the opportunity cost of environmental regulations (OCER), i.e., the money which was spent on environmental taxes which could have been used to the benefit of each port organization. The study was applied to four ports in Taiwan for a period of 7 years. More recently, [46] also considered as output variables the revenue and profit of 14 Vietnamese seaport companies. Recent studies that apply the DEA methodology as a tool for port efficiency estimation include other outputs as well, e.g., vessel calls, number of stops at a port, total container movements, number of ships, index of liner shipping connectivity, berth productivity [47,48,49,50].
Regardless of the wide application of the DEA method to assess container ports’ efficiency, a few studies exist for the ports in the Mediterranean Basin. Among them, [51,52,53,54,55] have used port throughput in TEUs as the output variable. The current study goes a step beyond and includes, as well as container traffic (in TEUs), container volume (in tons) and revenue as outputs for the estimation of the efficiency of the 14 Mediterranean container ports and furthermore aims at their classification and efficiency estimation, according to their size and market share.

3. Materials and Methods

The data envelopment analysis (DEA) is a non-parametric method that can be used to assess the (comparative) efficiency of a decision-making unit (DMU) by comparing it with other uniformed units. DMUs are homogenous operating units, the “units of assessment” defined as the entities that are going to be compared on their performance [56]. These DMUs (a) use the same number of inputs (the resources they use) to produce the same number of outputs (the outcomes, what each unit achieves), (b) make decisions on the production process and their efficiency level and (c) have control over the transformation of their inputs to outputs. Therefore, a fundamental step for applying the DEA method is to define the decision-making units and to identify the corresponding input and output variables.
Since this method is comparative, the outcome of the method, i.e., the efficiency, is characterized as relative. The purpose of the method is to find the limit of the production capability of a unit. More specifically, a frontier (or efficient frontier) is created, which determines the optimal combination of inputs and outputs, an ideal combination, whereby, with the least possible inputs, the maximum possible outputs are achieved. The frontier is the measure of comparison used to evaluate the performance of the unit under study. The values (inputs/outputs) of the group under study are placed on the same graph and compared to the frontier. If the values are higher than the frontier, then the unit is characterized as efficient, while in the opposite case where the values are enclosed by the frontier, then the unit is characterized as inefficient, relative to the frontier.
Efficiency is based on the assumption that production exhibits constant returns to scale, meaning that the conversion of inputs to outputs is characterized by constant returns to scale. If a constant variation is applied to an input, then an equal variation is applied to the output. This case is termed a DEA-CCR model [8]. In contrast to constant returns to scale, there is the option of variable returns to scale. In this case, a constant increase in an input implies a smaller increase in the output (decreasing return to scale) or a constant increase in an input implies a greater increase in the output (increasing return to scale). The DEA model then is named a DEA-BCC model [9]. These models can be distinguished whether they are input or output oriented. Based on a certain level of output, input-oriented DEA models study how to minimize inputs, while keeping the given outputs levels. Whereas, based on the given values of inputs, output-oriented DEA models attempt to maximize outputs.
This work is based on the output-oriented efficiency model that attempts to maximize the outputs by using certain amounts of inputs.

3.1. CCR—Constant Return to Scale Model

The CCR models assume constant returns to scale and provide a measure of technical efficiency. Therefore, the frontier of this model forms a straight line and the units that are on this line depict the efficient ones. Let us suppose m inputs and denote the inputs for a DMU as xk = (x1j, x2j, …, xmk) and x k R 0 m , which produce n outputs written as yk = (y1j, y2j, …, ynk) and y k R 0 n . The input and output data form data matrixes X and Y, respectively, where X is an (mXk) matrix and Y an (nXk) matrix. Let μ = (μ1, μ2, …, μK) be a non-negative vector forming the linear combination of the K units.
The DEA-CCR model assumes that each DMU will use a set of weights in the most efficient (for that unit) way in comparison to the other units. Subsequently, according to [57], if η is the optimal objective value:
max η , μ η
Subject to:
xkXμ ≥ 0
ηykΥμ ≤ 0
μ ≥ 0
The task is to find the appropriate weighting coefficients so that the efficiency of a unit can be maximized. More specifically, the CCR model computes the variables u (a weight assigned to an output) and v (a weight assigned to an input). For each DMU the optimal set of weights is determined with values that vary from one DMU to the other.

3.2. DEA-BCC—Variable Return to Scale Model

The BCC models assume variable returns to scale. In this way, the frontier creates a convex hull and so the inefficient units span below it. If we assume the same inputs (m) and the same outputs (n) as in the CCR model, the BCC model introduces an additional restriction. More specifically, let λ = (λ1, λ2, …, λK) be a non-negative vector forming the linear combination of the K firms and let e be a row vector in which all elements are equal to 1:
max η , λ η
Subject to:
xk ≥ 0
ηykΥλ ≤ 0
λ ≥ 0
= 1
There is another type of DEA model that includes an additional constraint in relation to the DEA-CCR model. With the addition of the above restriction (9) it is possible to take into consideration (constant or variable) scale payoffs and, consequently, create the convex hull mentioned above.
Then, the technical efficiency is measured as:
θ = 1⁄η

3.3. Scale Efficiency

The technical efficiency estimates that are derived from both DEA-CCR and DEA-BCC models are utilized together to obtain a measure of scale efficiency for each of the K DMUs. The authors of [47] provide the following equation:
Scale Efficiency (SE) = θCCRθBCC
where θCCR is the technical efficiency based on the CCR and θBCC is the technical efficiency by applying the BCC model. If the sum of every = 1, then the outputs are increasing in the same proportion as the inputs and constant returns to scale occur. When this sum is less than 1, decreasing returns to scale apply and the outputs’ increase is less than proportional to the respective increase in inputs. The case when the sum is more than 1 defines the increasing returns to scale.

4. Selection of Variables, DMUs Used and Data Collection

4.1. Input and Output Variables

The selection of the input and output variables is based on the objectives of the ports [3]. The main objective of the ports in this research is to maximize the outputs while using no more than the required quantity of the inputs. Outputs are a port’s product or services, the outcomes. Inputs are a port’s resources and can be selected based on the fact that its efficiency depends on the effective use of land, equipment and human resources [32,45]. Therefore, the following indicators were selected to be incorporated into the model as output and input variables:
Outputs
y1:
Container throughput in TEUs. The total container traffic measured in 20-foot equivalent units.
y2:
Container volume in tons. Total weight of goods handled by the port within a period of one year.
y3:
Revenue in millions of euros. It plays an important role, since it provides information related to the economic efficiency of the port.
Inputs
x1:
Length of berth (in m).
x2:
Terminal area (in hectares, ha). The area of the quay and land yard.
x3:
Number of quay cranes (quay cranes, ship to shore cranes, mobile cranes).
x4:
Number of gantry cranes in the stacking area (RTGs, RMGs).
During the research, additional input variables were also considered, such as the number of straddle carriers, berth occupancy time, crane operating hours, different handling speeds of yard and ship-to-shore cranes, equipment age and maintenance, the capital invested in a terminal and associated equipment, average number of containers handled per ship and the quayside water depth. However, due to a lack of reliable data and the unavailability of data, it was decided not to consider them in the model. During the selection of inputs and outputs, the approach of not including a great number of inputs and outputs, as this will lead to less accurate results from the analysis, was also followed [58,59]. Table 1 shows the descriptive statistics of the finally selected variables.

4.2. DMUs Used and Data Collection

The next step is the identification of the size of the DMUs to be compared. In the literature, there are some restrictions regarding the minimum number of DMUs, that should be:
  • The product of the number of input variables times the number of output variables [60].
  • At least twice the sum of the input and output variables [61,62].
  • At least three units for each input and output variable [63].
  • At least twice the product of the number of input variables and number of output variables [64].
The methodology applied in this research follows the restriction of [61]. There is a consideration that agrees with using a large number of units to increase the possibility of determining the efficient frontier. Nevertheless, there is another group that points out that a large number of units could also include units performing under different market conditions, meaning that the term of “homogeneity” is then lowered and therefore causes exogenous impacts on the data. Since there are four inputs and three output variables, the number of DMUs examined in this research comes from the result of Equation (12):
DMUs ≥ (m + n)∙2 = 14
where:
m = the number of input variables and
n = the number of output variables.

4.3. Data Collection

The following criteria were applied for the selection of the container ports (the DMUs) to be examined:
  • To handle sufficiently large volumes of containers. A measure of the container traffic of each port was the total incoming/outgoing containers in TEUs (20-foot equivalent units)
  • To handle a minimum of 1 million TEUs in the year 2021 (year of the most recent available data).
  • To be located in the wider Mediterranean area.
The collection of the data was a time-consuming process, as some of the ports examined had no officially published data regarding their infrastructure, equipment or productivity. Figure 1 compares their throughput for the years 2011 and 2021. The first thing to notice is the remarkable increase in productivity for all ports. A second observation is that the largest increases appear to occur for Tanger Med, Piraeus and Sines ports, more than 200%.
Based on the World Bank-defined ranges [2] and with a modification due to the ports under investigation in this study, two main port group sizes are used, namely medium-sized and large ports, depending on their levels of container throughput (interested readers can also check [36,65,66]):
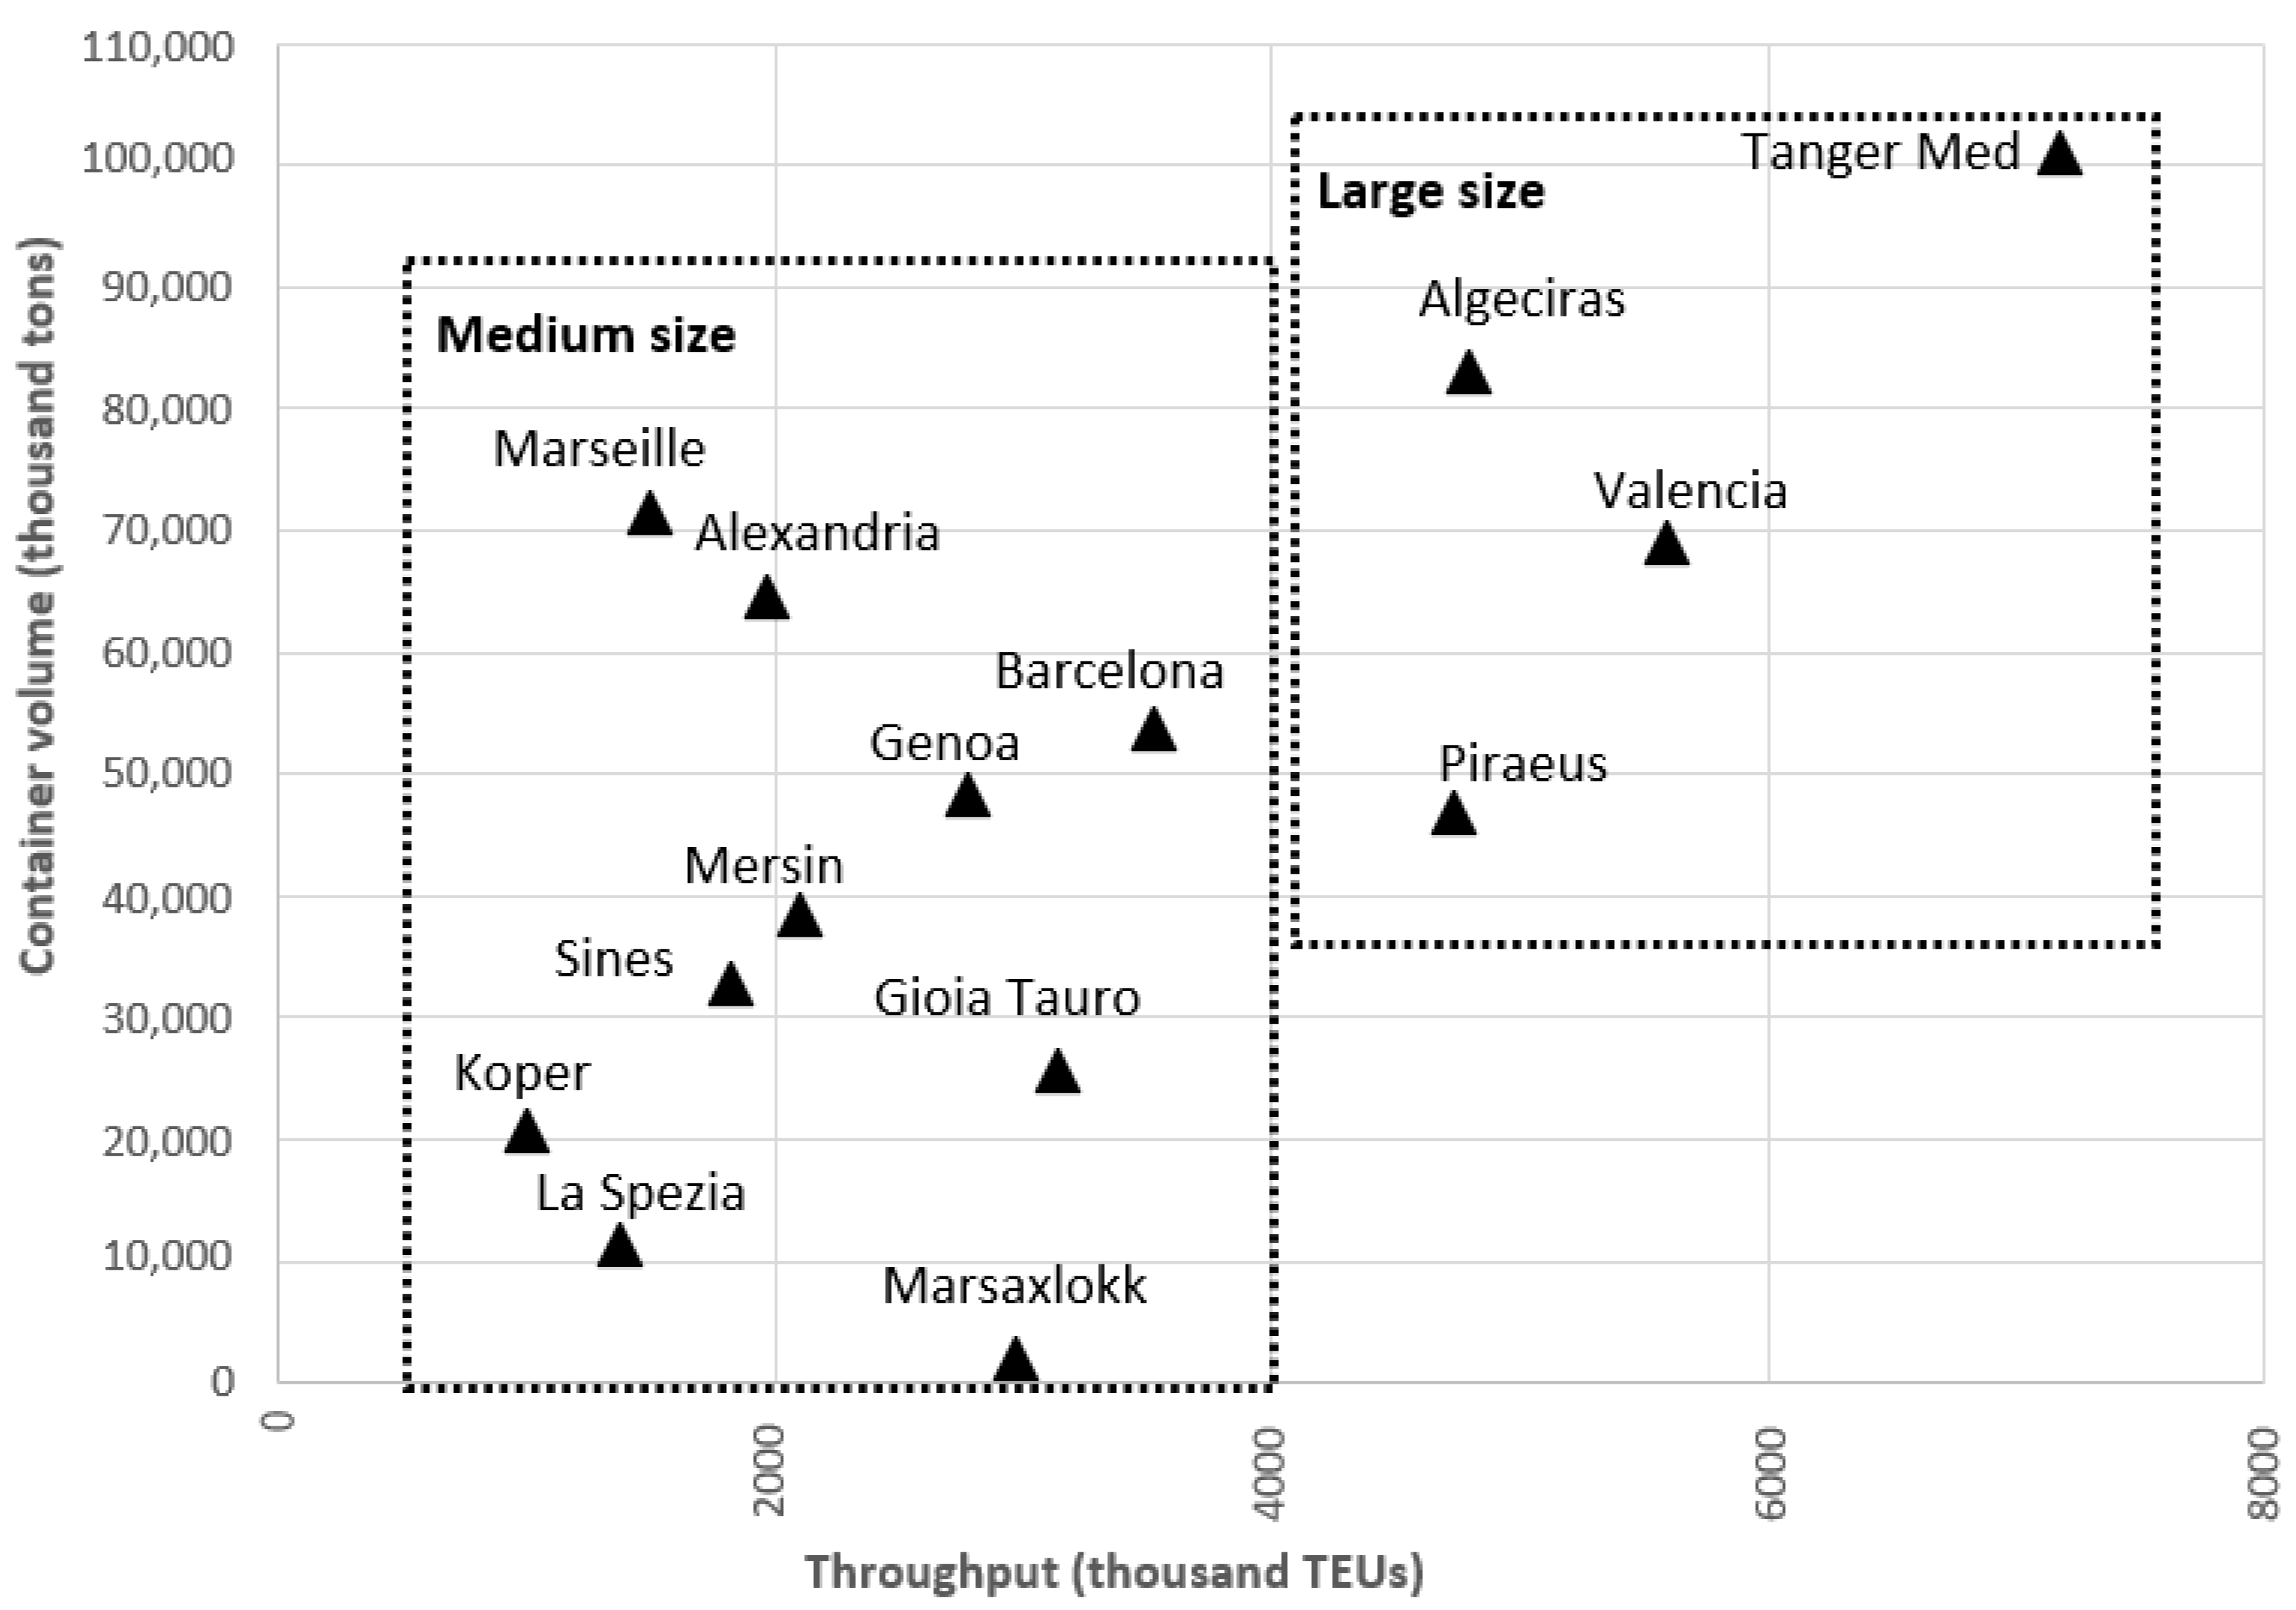
  • Large ports: more than 4 million TEUs.
  • Medium-sized ports: between 1 and 4 million TEUs.
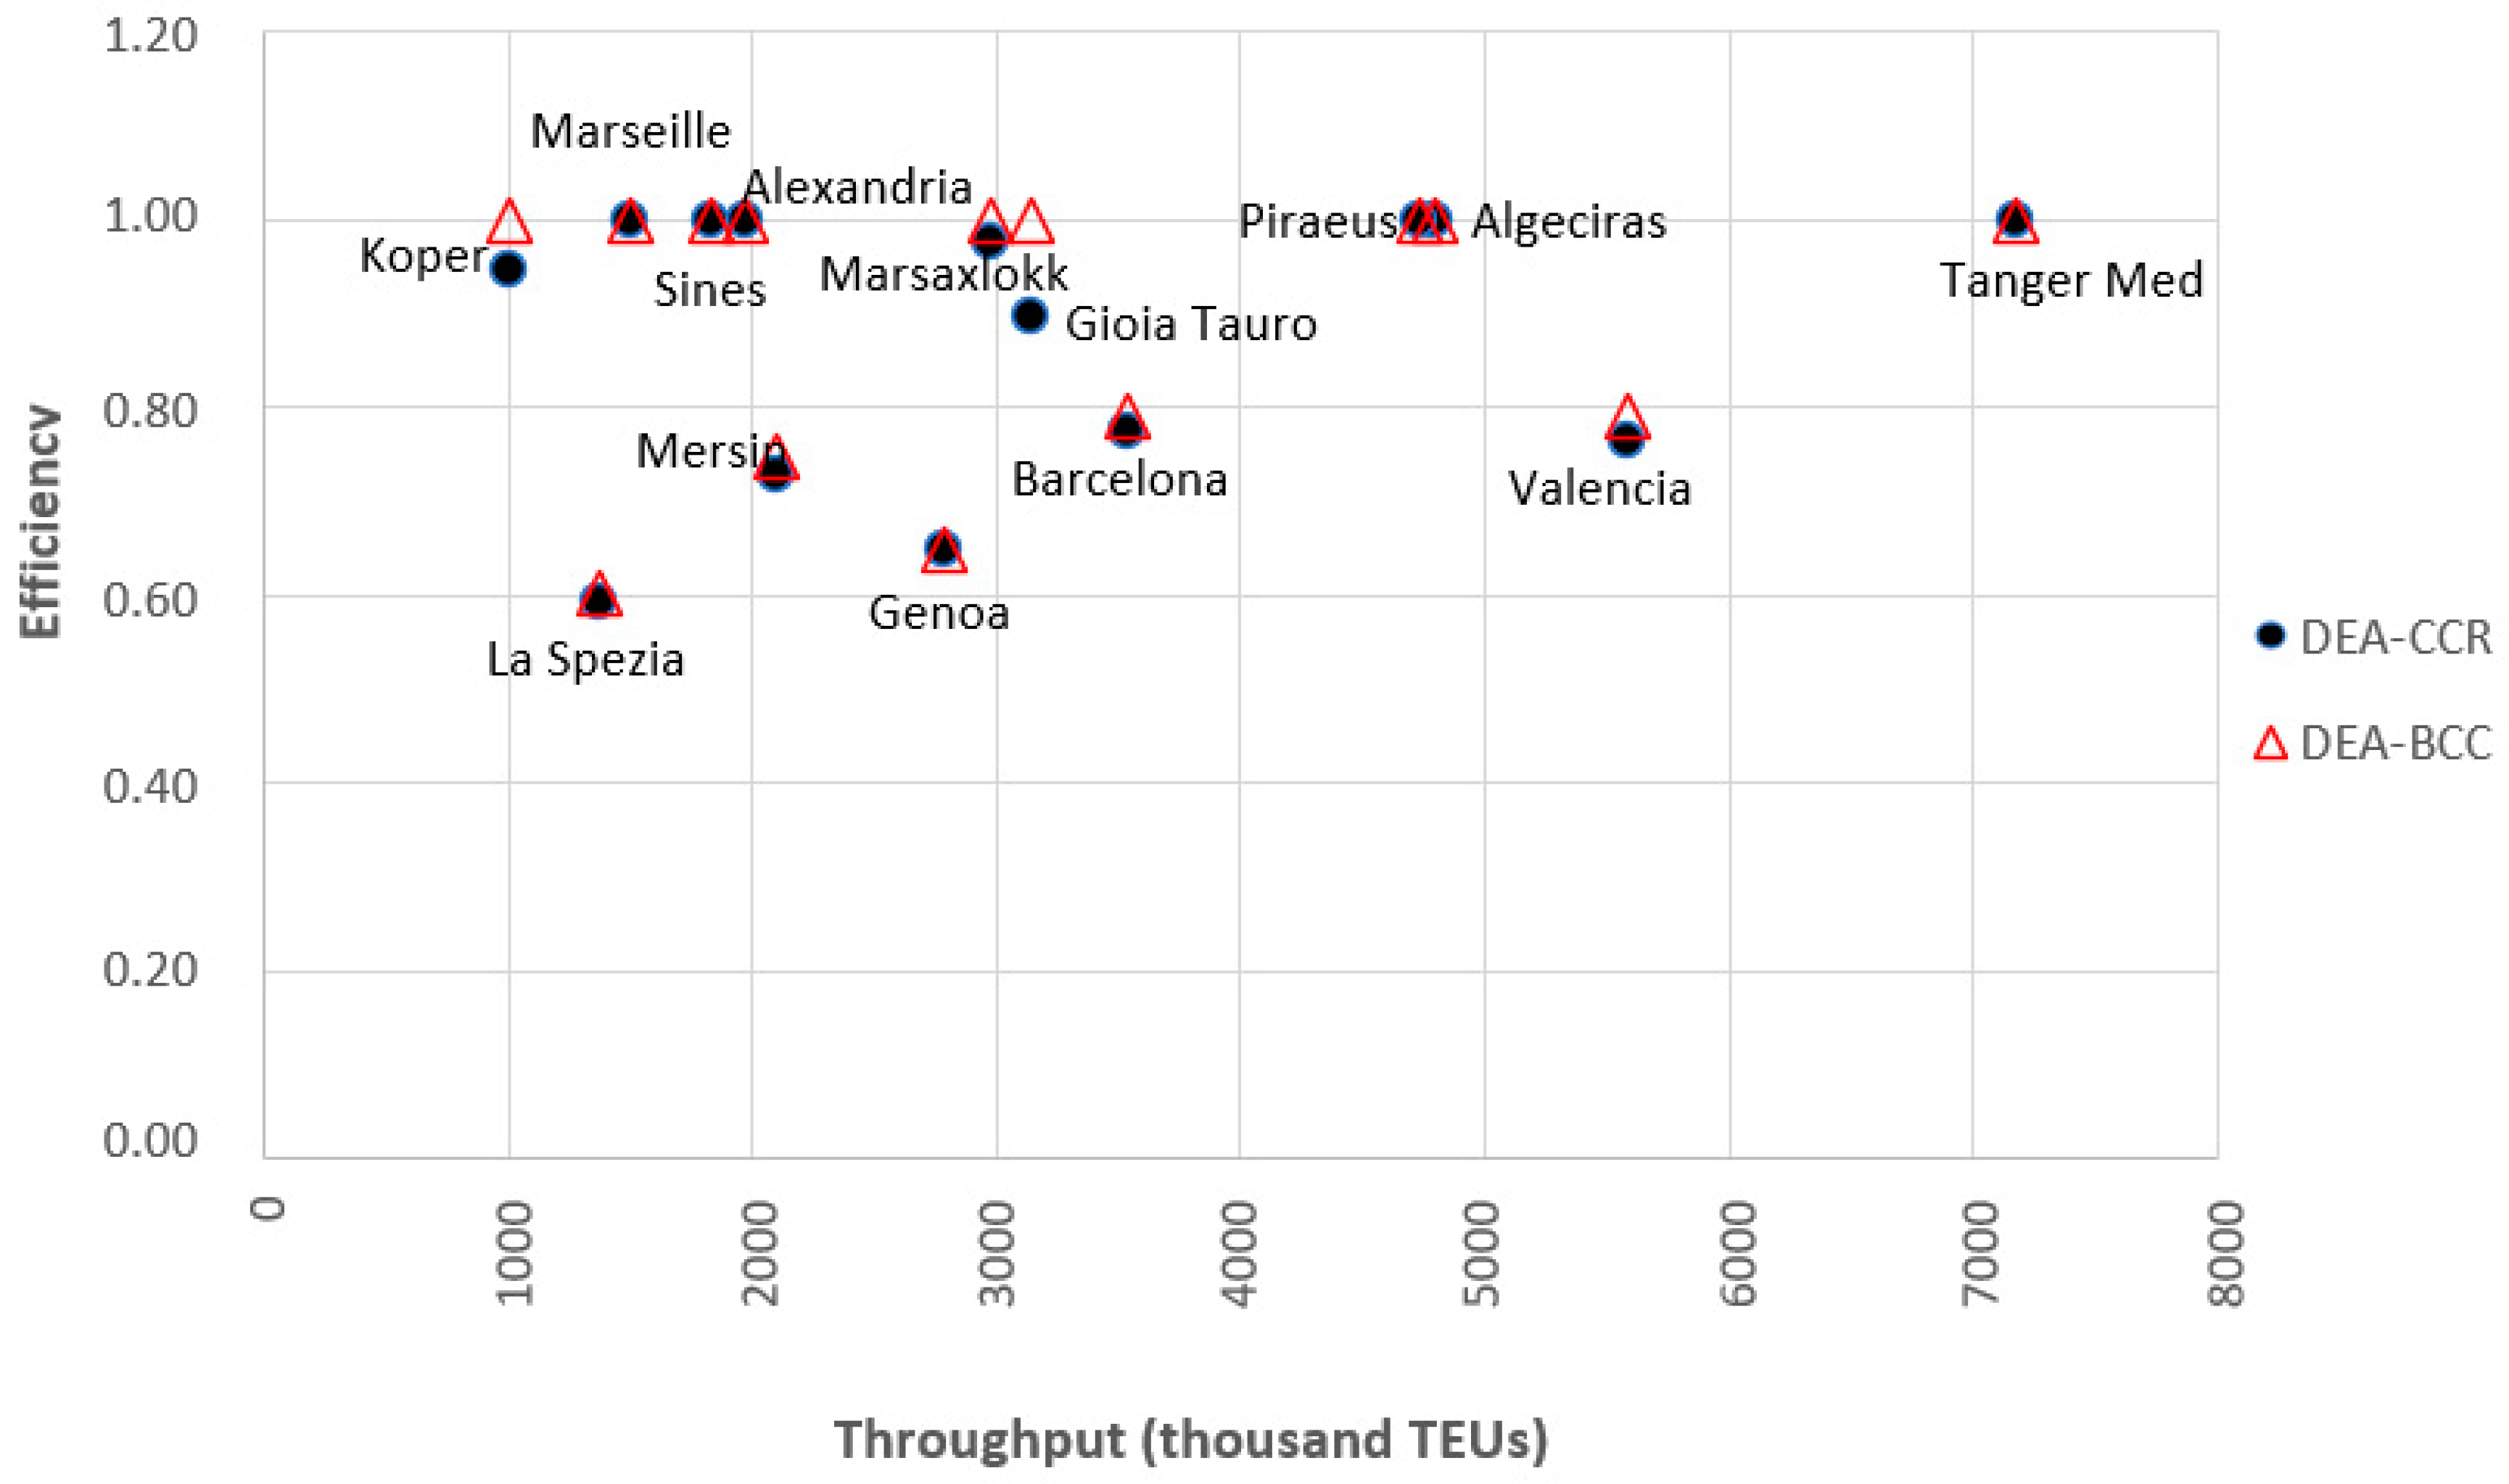
5. Results

Table 2 reports the results of the efficiency scores emerging for CCR and BCC models, an estimate for the scale efficiency and subsequently the returns to scale of each container port. An initial observation from Table 2 is that the average efficiency obtained from conducting the CCR model is lower than that with the BCC method. This observation is explained by the fact that the BCC model determines only technical efficiency, while the CCR identifies technical efficiency and scale efficiency. This explains the different numbers of ports characterized as fully efficient (efficient value = 1.000) when applying the two models. From the application of the CCR model, six ports were identified as efficient and nine ports when the BCC model was applied.
Table 2 also indicates the returns to scale classifications. From the 14 ports, 7 exhibit constant returns to scale, 4 show decreasing returns to scale and 3 increasing returns to scale. According to the results, the large ports, as indicated in the previous section (i.e., with container throughput of more than 4 million TEUs), have achieved perfect efficiency (i.e., unity), except for the port of Valencia, which exhibits decreasing returns to scale. On the other hand, from the medium-sized ports (container throughput between 1 and 4 million TEUs) three ports (Barcelona, Gioia Tauro and Marsaxlokk) exhibit decreasing returns to scale and three increasing returns to scale (Marsin, La Spezia and Koper).
More specifically, six ports (Tanger Med, Algeciras, Piraeus, Alexandria, Marseilles and Sines) are fully efficient, achieving an overall (CRS) and technical (VRS) efficiency of 1. Hence, their return to scale is constant, noting that their performance is optimized. Ports of Gioia Tauro, Marsaxlokk and Koper attained a full operating efficiency, with their VRS value being of unity and their CRS value slightly behind full efficiency (0.898, 0.977, 0.946, respectively), and can be characterized as “marginally efficient”. However, ports of Gioia Tauro and Marsaxlokk exhibit decreasing returns to scale, meaning an increase in their inputs corresponds to a lower increase in their outputs. The port of Koper, though, exhibits an increasing return to scale, implying that an increase in its inputs used for its production activities results in an unexpected increase in its outputs. The other five ports (Valencia, Barcelona, Genoa, Mersin and La Spezia) have quite a low efficiency (<0.8). For example, the CCR efficiency value of 0.776 of the port of Barcelona implies that the port needs to improve its productivity in order to achieve an increase of 22.4% to become efficient. Correspondingly, the port of Genoa (efficiency of 0.650) needs a 33.5% rise to become efficient, exhibiting constant returns to scale. Based on the ports’ revenue, two large ports (Tanger Med and Valencia) and one medium-sized port (Alexandria) reported a revenue of more than EUR 1 million but a range of efficiency levels.
When applying the CCR model, the ports of Marsaxlokk, Koper and Gioia Tauro had an efficiency level greater than or almost equal to 0.90, which is very close to unity. Based on the above, they were then expected to be fully efficient when applying the BCC model. The next observation, when comparing the results from the CCR and BCC models, is that the efficiency values for some ports are close (almost equal). This is explained by the limitation imposed when applying the DEA-BCC model. As mentioned, the BCC model takes into account variable returns to scale. This is achieved by using the variable λ for each port. Having introduced into the modeling procedure of the DEA-BCC model the constraint (9) eλ = 1, it was assumed that for a change in the value of an input by a value, then the value of the corresponding output changes equally, that is, each port operates with fixed scale returns. As mentioned above, the DEA-CCR model operates under the assumption of constant returns to scale. Therefore, the efficiency values obtained by the two methods cannot deviate much. Consequently, having considered the above limitation, it is obvious that the two methods should converge and verify each other, as they do, based on the above results.
As was stated in Section 4.3, ports were classified into two main groups. Ports were ranked following the work of [65] and their market share according to the container throughput they handle (Table 3). It is interesting to see that the four ports belonging to the large group (Tanger Med, Valencia, Piraeus and Algeciras) have almost half of the total market share (50.76%) of the 14 ports studied, while the remaining 10 medium-sized ports have the remaining 50% (49.24%) of the total market share.
For comparison reasons, Figure 2 presents the total throughput as a function of ports’ container volume. In this figure, ports are classified according to the two groups previously mentioned (medium-sized and large ports). Figure 3 shows the efficiency calculated by both models in relation to the port throughput in order to make conclusions about the relationship between productivity and port efficiency. Based on the two figures (Figure 2 and Figure 3) the efficiency of a port is not only related to the classification group it belongs to. The input variables examined also play an important role. A characteristic example is the port of Valencia, which handles a large number of containers compared to other ports (Figure 3) and is classified as a large port (Figure 2). However, considering the number of infrastructures it possesses (large terminal area, number of yard and quay cranes) its efficiency is characterized as low (Figure 3). This, in practice, means that based on a port’s input variables, its productivity (e.g., container throughput) would have to be sufficiently higher to be considered as efficient.

6. Discussion and Conclusions

Both DEA-CCR and DEA-BCC models implemented in this research were output oriented. This means that by keeping the inputs at a constant level, changing only the outputs, it is possible for a DMU to become fully efficient. Thus, generalizing the above example of the port of Valencia, the solution proposed to transform unproductive ports into efficient ones is to increase their outputs (container throughput/volume and revenue). As can be seen from Figure 2, port productivity does not directly depend on container volume, which is an output variable for ports (for example, the ports of Piraeus or Valencia that, although presenting a high throughput, have a container volume that is at a moderate level). Therefore, the increases not only in productivity but also in the volume of general cargo are factors that will also contribute to the increase in economic results (i.e., increase in revenue), with the consequent maximization of outputs and, subsequently, their efficiency. Of course, the changes mentioned here are not so simple to implement. Considering that port authorities, in an attempt to increase their competition, design strategies to increase port demand, this increased competition can lead to a further investment in its infrastructure and, as a result, to an increase in the port’s efficiency. However, this in turn could drive some ports to exceed their capacity levels. As a consequence, their efficiency values may remain stable. From the present study, a solution could be the redistribution of the already existing resources so that, with their new distribution and new mode of operation, they can achieve an increase in their productivity.
The main scope of this study was to measure and assess the performance of 14 of the largest container ports in the wider Mediterranean region. The methodology applied was data envelopment analysis (DEA). DEA allows the comparison of a port’s performance with other ports that share the same homogeneous parameters. The performance of a port is assessed by the calculation of its efficiency as a relationship between a port’s inputs (e.g., berth length, area, number of quay cranes, number of yard cranes) and its outputs (productivity, i.e., total handled containers and total volume of handled containers and revenue). The analysis of this study applied the DEA-CCR and the DEA-BCC models with an output orientation. A first conclusion can be extracted from the average efficiency levels (Table 2). More specifically, an average efficiency of 0.880 and 0.898 for the CCR and BCC models, respectively, indicates that the ports can increase their output levels up to approximately 1.2 times without any change in their inputs.
Consequently, for a port’s existing facilities, equipment and infrastructure and the existing levels of operation, the use of such methodology could reveal possible limitations to its expansion. The levels of investment that a port could require to further increase its capacity could discourage the port from a decision to expand further. Nevertheless, there are constraints (e.g., constraints regarding land availability) that can restrict any further port development. Mainly for large ports, they have achieved operation at a certain level (and regularly beyond their throughput capacity levels) by investing in advanced and expensive equipment [36]. Medium-sized ports operate at lower throughput levels and are encouraged to increase their operation scale.
The CCR method resulted in six ports out of fourteen (Tanger Med, Algeciras, Piraeus, Alexandria, Marseilles and Sines) having an optimal efficiency and the BCC model characterized nine (the same as the CCR method plus Marsaxlokk, Koper and Gioia Tauro) as fully efficient. The ports of Barcelona, Valencia and Mersin in both methods exhibited lower efficiency levels (<0.80). This means that, since the DEA models applied are output oriented, they will have to optimize the distribution of the resources so that, keeping them constant, they can enhance their productivity levels. Finally, the ports of Genoa and La Spezia exhibited the lowest efficiency values of all the examined ports (≤0.65). Ports with low efficiency (i.e., low productivity in relation to available means) could positively reform in order to offer value-added services with a higher quality and, in this way, the costs that appear to exist due to this low productivity may be balanced with the profit of these services. Therefore, the evaluation of a port is not based only on its efficiency. Results also indicated that the ports under study exhibit constant decreasing and increasing returns to scale. Such information reflects the proportional change in output with regard to the input variables used for the production. Therefore, they reveal the efficiency of a port and can be useful for policy formation allowing for the maximum capacity of production.
As mentioned in Section 4.1, due to a lack of sufficient data, some additional input variables were not taken into account. This was decided in order to ensure the reliability and correctness of the results and, therefore, to avoid reaching incorrect conclusions. Therefore, future research can emphasize the collection of data for more years in order to conduct a panel DEA model, to indicate possible fluctuations of the efficiency levels over the years. Furthermore, future examination of other (indirect) causes of each port being efficient or less efficient (e.g., [67]) as well as of the impact of environmental regulations on the efficiency of ports (e.g., [68,69]) could develop deeper insight into the subject and provide understanding on the relationship between ports’ development on the one hand and minimization of negative environmental impact on the other.

Author Contributions

Conceptualization, T.P.M.; methodology, T.P.M. and D.K.; software, T.P.M. and D.K.; validation, T.P.M. and D.K.; formal analysis, T.P.M. and D.K.; investigation, T.P.M. and D.K.; resources, D.K.; data curation, D.K.; writing—original draft preparation, T.P.M.; writing—review and editing, T.P.M. and D.K.; visualization, T.P.M. All authors have read and agreed to the published version of the manuscript.

Funding

This research received no external funding.

Data Availability Statement

The data are available upon reasonable request from the corresponding author.

Conflicts of Interest

The authors declare no conflict of interest.

References

  1. Rodrigue, J.-P.; Notteboom, T. Chapter 7.2—Ports and economic development, in Theo Notteboom, Athanasios Pallis and Jean-Paul Rodrigue. In Port Economics, Management and Policy; Routledge: New York, NY, USA, 2022. [Google Scholar] [CrossRef]
  2. World Bank. The Container Port Performance Index, 2021: A Comparable Assessment of Container Port Performance; License: Creative Commons Attribution CC BY 3.0 IGO; World Bank: Washington, DC, USA, 2022. [Google Scholar]
  3. Cullinane, K.; Ping, J.; Wang, T.F. The relationship between privatization and DEA estimates of efficiency in the container port industry. J. Econ. Bus. 2005, 57, 433–462. [Google Scholar]
  4. UNCTAD. Port Management Series, Volume 4, Linking Performance Indicators to Strategic Objectives. 2016. Available online: https://unctad.org/system/files/official-document/dtlkdb2016d1_en.pdf (accessed on 7 May 2023).
  5. Moya, J.M.; Valero, M.F. Port choice in container market: A literature review. Transp. Rev. 2017, 37, 300–321. [Google Scholar]
  6. Arvis, J.-F.; Vesin, V.; Carruther, R.; Ducruet, C.; de Langen, P. Maritime Networks, Port Efficiency and Hinterland Connectivity in the Mediterranean; World Bank Publications, International Development in Focus; World Bank: Washington, DC, USA, 2019. [Google Scholar] [CrossRef]
  7. Notteboom, T.; Satta, G.; Persico, L.; Vottero, B.; Rossi, A. Operational productivity and financial performance of pure transhipment hubs versus gateway terminals: An empirical investigation on Italian container ports. Res. Transp. Bus. Manag. 2023, 47, 100967. [Google Scholar]
  8. Charnes, A.; Cooper, W.W.; Rhodes, E. Measuring the efficiency of decision-making units. Eur. J. Oper. Res. 1978, 2, 429–444. [Google Scholar]
  9. Banker, R.D.; Charnes, A.; Cooper, W.W. Some Models for Estimating Technical and Scale Inefficiencies in Data Envelopment Analysis. Manag. Sci. 1984, 30, 1078–1092. [Google Scholar]
  10. Bottasso, A.; Conti, M.; Ferrari, C.; Tei, A. Ports and regional development: A spatial analysis on a panel of European regions. Transp. Res. A Policy Pract. 2014, 65, 44–55. [Google Scholar]
  11. Shan, J.; Yu, M.; Lee, C. An empirical investigation of the seaport’s economic impact: Evidence from major ports in China. Transp. Res. E-Log 2014, 69, 41–53. [Google Scholar]
  12. Chang, Y.; Shin, S.; Lee, W. Economic impact of port sectors on south African economy: An input-output analysis. Transp. Policy 2014, 35, 333–340. [Google Scholar]
  13. Munim, Z.; Schramm, H. The impacts of port infrastructure and logistics performance on economic growth: The mediating role of seaborne trade. J. Shipp. Trade 2018, 3, 1. [Google Scholar]
  14. Miambo, C. The impact of port performance in trade: The case of selected African states. Economies 2021, 9, 135. [Google Scholar] [CrossRef]
  15. Cui, H.; Notteboom, T. Modelling emission control taxes in port areas and port privatization levels in port competition and co-operation sub-games. Transp. Res. Part D Transp. Environ. 2017, 56, 110–128. [Google Scholar]
  16. Pagano, A.M.; Grace, W.Y.W.; Sánchez, O.V.; Ungo, R. Impact of privatization on port efficiency and effectiveness: Results from Panama and US ports. Marit. Policy Manag. 2013, 40, 100–115. [Google Scholar]
  17. Tongzon, J.; Heng, W. Port privatization, efficiency and competitiveness: Some empirical evidence from container ports (terminals). Transp. Res. Part A Policy Pract. 2005, 39, 405–424. [Google Scholar]
  18. Wang, G.W.; Knox, K.J.; Lee, P.T.W. A study of relative efficiency between privatised and publicly operated US ports. Marit. Policy Manag. 2013, 40, 351–366. [Google Scholar]
  19. Qianqian, L.; Davarinou, P. Sino-Greek economic cooperation: COSCO’s investment in the port of Piraeus. In The Belt and Road Initiative and the SDGs: Towards Equitable, Sustainable Development; Sen, G., Leach, M., Gu, J., Eds.; IDS Bulletin 50.4; IDS: Brighton, UK, 2019. [Google Scholar]
  20. Israel Ministry of Finance. Available online: https://www.gov.il/en/departments/news/press_10012023 (accessed on 7 June 2023).
  21. Bnamericas, Will Lula Agree to the Priatization of Santos Port Authority? Available online: https://www.bnamericas.com/en/news/will-lula-agree-to-the-privatization-of-santos-port-authority (accessed on 7 June 2023).
  22. Baird, A.J. Privatization trends at the world’s top-100 container ports. Marit. Policy Manag. 2002, 29, 271–284. [Google Scholar]
  23. Choi, K.; Lim, S. Tariff protection and port privatization: An import-competing approach. Marit. Econ. Logist. 2018, 20, 228–252. [Google Scholar]
  24. Roll, Y.; Hayuth, Y. Port Performance Comparison Applying Data Envelopment Analysis. Marit. Policy Manag. 1993, 20, 153–161. [Google Scholar]
  25. Poitras, G.; Tongzon, J.; Li, H. Measuring Port Efficiency: An Application of Data Envelopment Analysis; Working Paper Singapore; National University of Singapore: Singapore, 1996. [Google Scholar]
  26. Martinez-Budria, E.; Diaz-Armas, R.; Navarro-Ibanez, M.; Ravelo-Mesa, T. A Study of the Efficiency of Spanish Port Authorities Using Data Envelopment Analysis. Int. J. Transp. Econ. 1999, 26, 237–253. [Google Scholar]
  27. Tongzon, J. Efficiency measurement of selected Australian and other international ports using data envelopment analysis. Transp. Res. Part A 2001, 35, 107–122. [Google Scholar]
  28. Turner, H.; Windle, R.; Dresner, M. North American container port productivity: 1984–1997. Transp. Res. Part E 2004, 40, 339–356. [Google Scholar]
  29. Barros, C.P.; Athanassiou, M. Efficiency in European Seaports with DEA: Evidence from Greece and Portuga. Marit. Econ. Logist. 2004, 6, 122–140. [Google Scholar]
  30. Song, J.Y.; Sin, C.H. An Empirical Study on the Efficiency of Major Container Ports with DEA Model. J. Korean Navig. Port Res. 2005, 29, 195–201. [Google Scholar]
  31. Lin, L.C.; Tseng, C.C. Operational performance evaluation of major container ports in the Asia-Pacific region. J. Marit. Policy Manag. 2007, 34, 535–551. [Google Scholar]
  32. Cullinane, K.; Wang, T. The efficiency analysis of container port production using DEA panel data approaches. OR Spectr. 2010, 32, 717–738. [Google Scholar] [CrossRef]
  33. Wu, J.; Yan, H.; Liu, J. DEA models for identifying sensitive performance measures in container port evaluation. Marit. Econ. Logist. 2010, 12, 215–236. [Google Scholar] [CrossRef]
  34. Bichou, K. A two-stage supply chain DEA model for measuring container-terminal efficiency. Int. J. Shipp. Transp. Logist. 2011, 3, 6–26. [Google Scholar]
  35. Nikolaou, P.; Dimitriou, L. Lessons to be Learned from Top-50 Global Container Port Terminals Efficiencies: A Multi-Period DEA-Tobit Approach. Marit. Transp. Res. 2021, 2, 100032. [Google Scholar]
  36. Cullinane, K.; Wang, T. Data Envelopment Analysis (DEA) and Improving Container Port Efficiency. Res. Transp. Econ. 2007, 17, 517–566. [Google Scholar]
  37. Mustafa, F.S.; Khan, R.U.; Mustafa, T. Technical efficiency comparison of container ports in Asian and Middle East region using DEA. Asian J. Shipp. Logist. 2021, 37, 12–19. [Google Scholar]
  38. Fernández, X.L.; Hidalgo-Gallego, S.; Pérez-Urbaneja, S.; Coto-Millán, P. When container specialisation makes a difference: An efficiency analysis of the Spanish port authorities. Marit. Policy Manag. 2021, 48, 629–650. [Google Scholar] [CrossRef]
  39. Kammun, R.; Abdennadher, C. The impact of competition and environmental factors on technical inefficiency of European ports. In Proceedings of the 14th International Conference of Logistics and Supply Chain Management LOGISTIQUA, El Jadida, Morocco, 25–27 May 2022; National School of Business and Management (ENCGJ), A. Chouaib Doukkali University. Available online: https://ieeexplore.ieee.org/stamp/stamp.jsp?tp=&arnumber=9938039 (accessed on 7 June 2023).
  40. Nong, T.N.-M. Performance efficiency assessment of Vietnamese ports: An application of Delphi with Kamet principles and DEA model. Asian J. Shipp. Logist. 2023, 39, 1–12. [Google Scholar]
  41. Wang, C.-N.; Nguyen, P.-H.; Nguyen, T.-L.; Nguyen, T.-G.; Nguyen, D.-T.; Tran, T.-H.; Le, H.-C.; Phung, H.-T. A Two-Stage DEA Approach to Measure Operational Efficiency in Vietnam’s Port Industry. Mathematics 2022, 10, 1385. [Google Scholar] [CrossRef]
  42. Ben Mabrouk, M.; Elmsalmi, M.; Aljuaid, A.M.; Hachicha, W.; Hammami, S. Joined Efficiency and Productivity Evaluation of Tunisian Commercial Seaports Using DEA-Based Approaches. J. Mar. Sci. Eng. 2022, 10, 626. [Google Scholar] [CrossRef]
  43. Li, H.; Jiang, L.; Liu, J.; Su, D. Research on the Evaluation of Logistics Efficiency in Chinese Coastal Ports Based on the Four-Stage DEA Model. J. Mar. Sci. Eng. 2022, 10, 1147. [Google Scholar] [CrossRef]
  44. Sadri, E.; Harsej, F.; Hajiaghaei-Keshteli, M.; Siyahbalaii, J. Evaluation of the components of intelligence and greenness in Iranian ports based on network data envelopment analysis (DEA) approach. J. Model. Manag. 2022, 17, 1008. [Google Scholar]
  45. Yang, C. A DEA-Based Approach for Evaluating the Opportunity Cost of Environmental Regulations. Asia-Pacific J. Oper. Res. 2013, 30, 1250049-1–1250049-17. [Google Scholar]
  46. Wang, C.-N.; Nguyen, N.-A.-T.; Fu, H.-P.; Hsu, H.-P.; Dang, T.-T. Efficiency Assessment of Seaport Terminal Operators Using DEA Malmquist and Epsilon-Based Measure Models. Axioms 2021, 10, 48. [Google Scholar] [CrossRef]
  47. Kuo, K.-C.; Lu, W.-M.; Le, M.-H. Exploring the performance and competitiveness of Vietnam port industry using DEA. Asian J. Shipp. Logist. 2020, 36, 136–144. [Google Scholar]
  48. Nguyen, T.L.H.; Park, S.-H.; Kim, Y.; Yeo, G.-T. An efficiency analysis of container terminals in Southern Vietnam using DEA dynamic efficiency evaluation. Asian J. Shipp. Logist. 2021, 37, 329–336. [Google Scholar]
  49. Parra Santiago, J.I.; Camarero Orive, A.; González Cancelas, N. DEA-Bootstrapping Analysis for Different Models of Spanish Port Governance. J. Mar. Sci. Eng. 2021, 9, 30. [Google Scholar] [CrossRef]
  50. Pham, T.Q.M.; Park, G.K.; Choi, K.-H. The efficiency analysis of world top container ports using two-stage uncertainty DEA model and FCM. Marit. Bus. Rev. 2021, 6, 2–21. [Google Scholar] [CrossRef]
  51. Russo, F.; Rindone, C. Container maritime transport on an international scale: Data envelopment analysis for transhipment port. In Sustainable Development and Planning V; WIT Press: Billerica, MA, USA, 2011; Volume 150, pp. 831–846. [Google Scholar]
  52. Polyzos, S.; Niavis, S. Evaluating port efficiency in the Mediterranean. Int. J. Data Anal. Tech. Strateg. 2013, 5, 84–100. [Google Scholar]
  53. Gökçek, V.; Şenol, Y.E. Efficiency Analysis of Mediterranean Container Ports. J. ETA Marit. Sci. 2018, 6, 129–140. [Google Scholar]
  54. Nikolina, B.P.; Hua, Z.J. Technical and scale efficiency analysis of 25 nort Mediterranean ports: A data envelopment analysis approach. Int. J. Econ. Financ. 2020, 12, 55–63. [Google Scholar]
  55. Fancello, G.; Serra, P.; Aramu, V.; Mark Vitiello, D.M. Evaluating the efficiency of Mediterranean container ports using data envelopment analysis. Spec. Issue Compet. Issues Marit. Transp. Port Hinterl. 2021, 20, 1–26. [Google Scholar]
  56. Thanassoulis, E. Introduction to the Theory and Application of Data Envelopment Analysis; Springer: New York, USA, 2001. [Google Scholar] [CrossRef]
  57. Cooper, W.W.; Seiford, M.L.; Tone, K. Data Envelopment Analysis—A Comprehensive Text with Models, Applications, References and DEA—Solver Software, 2nd ed.; Springer: New York, NY, USA, 2007. [Google Scholar]
  58. Jenkins, L.; Anderson, M. A multivariate statistical approach to reducing the number of variables in data envelopment analysis. Eur. J. Oper. Res. 2003, 147, 51–61. [Google Scholar]
  59. Wong, W.-P. A Global Search Method for Inputs and Outputs in Data Envelopment Analysis: Procedures and Managerial Perspectives. Symmetry 2021, 13, 1155. [Google Scholar] [CrossRef]
  60. Boussofiane, A.; Dyson, R.G.; Thanassoulis, E. Applied data envelopment analysis. Eur. J. Oper. Res. 1991, 52, 1–15. [Google Scholar]
  61. Golany, B.; Roll, Y. An Application Procedure for DEA. Omega 1989, 1, 237–250. [Google Scholar]
  62. Ali, A.I.; Charnes, A.; Cooper, W.W.; Divine, D.; Klopp, G.A.; Stutz, J. An application of data envelopment analysis to US Army recruitment districts. In Applications of Management Science, A Research Annual; Schultz, R.L., Ed.; JAI Press: Stamford, CT, USA, 1989. [Google Scholar]
  63. Bowlin, W.F. Measuring performance: An introduction to data envelopment analysis (DEA). J. Cost Anal. 1998, 15, 3–27. [Google Scholar] [CrossRef]
  64. Dyson, R.G.; Allen, R.; Camanho, A.S.; Podinovski, V.V.; Sarrico, C.S.; Shale, E.A. Pitfalls and protocols in DEA. Eur. J. Oper. Res. 2001, 1321, 245–259. [Google Scholar]
  65. Ding, Z.Y.; Jo, G.S.; Wang, Y.; Yeo, G.T. The Relative Efficiency of Container Terminals in Small and Medium-Sized Ports in China. Asian J. Shipp. Logist. 2015, 31, 231–251. [Google Scholar]
  66. Feng, L.; Notteboom, T. Peripheral challenge by Small and Medium Sized Ports (SMPs) in Multi-Port Gateway Regions: The case study of northeast of China. Pol. Marit. Res. Spec. Issue 2013, 79, 55–66. [Google Scholar]
  67. Niavis, S.; Tsekeris, T. Ranking and causes of inefficiency of container seaports in South-Eastern Europe. Eur. Transp. Res. Rev. 2012, 4, 235–244. [Google Scholar] [CrossRef] [Green Version]
  68. Chang, Y.-T.; Park, H.K.; Lee, S.; Kim, E. Have Emission Control Areas (ECAs) harmed port efficiency in Europe? Transp. Res. Part D Transp. Environ. 2018, 58, 39–53. [Google Scholar] [CrossRef]
  69. He, X.; Liu, W.; Hu, R.; Hu, W. Environmental Regulations on the Spatial Spillover of the Sustainable Development Capability of Chinese Clustered Ports. J. Mar. Sci. Eng. 2021, 9, 301. [Google Scholar] [CrossRef]
Figure 1. Comparison of ports’ throughput between 2011 and 2021 (source: combination of Eurostat databases MAR_GO_QM).
Civileng 04 00041 g001
Figure 2. Port category according to their container volume and throughput (black triangles denote the container ports examined).
Civileng 04 00041 g002
Figure 3. Throughput vs. efficiency under DEA-CCR and DEA-BCC models.
Civileng 04 00041 g003
Table 1. Summary statistics.
InputsOutputs
Berth
Length
Terminal
Area
Quay-Side
Cranes
Yard Gantry CranesThroughput VolumeRevenue
(m)(ha)(Number)(Number)(TEUs)(Tons)(Million
Euros)
Mean287312023513,176,87147,825,000687
Standard
Deviation
12917210391,806,00028,231,000824
Minimum695271101,000,0001,906,000123
Maximum4812231431137,173,000101,055,0002766
Table 2. Port container efficiency under DEA-CCR and DEA-BCC modeling analysis.
PortContainer ThroughputContainer
Volume
RevenueDEA-CCRDEA-BCCScale EfficiencyReturns to Scale
(TEUs)(Thousand Tons)(Thousand Euros)(CRS)(VRS)(CRS/VRS)
Tanger Med7,173,870101,0552,175,4601.0001.0001.000con
Valencia5,588,00069,1311,346,8900.7640.7910.966drs
Algeciras4,797,49783,051309,5001.0001.0001.000con
Piraeus4,731,00046,951391,8301.0001.0001.000con
Barcelona3,531,32453,642151,4000.7760.7930.979drs
Gioia Tauro3,140,00025,721123,1000.8981.0000.898drs
Marsaxlokk2,970,0001906500,8000.9771.0000.977drs
Genoa2,781,11248,212409,0000.6500.6501.000con
Mersin2,097,00038,579316,4800.7290.7500.973irs
Alexandria1,967,00064,5002,766,0001.0001.0001.000con
Marseilles1,500,00071,590162,0001.0001.0001.000con
Sines1,823,76732,904575,0401.0001.0001.000con
La Spezia1,375,62611,486161,9000.5800.5890.985irs
Koper1,000,00020,821228,4000.9461.0000.946irs
Average3,176,87147,825686,9850.8800.8980.980
Note 1: efficient port = 1. Note 2: drs = decreasing return to scale, irs = increasing return to scale, con = constant return to scale. Note 3: CRS = constant returns to scale, VRS = variant returns to scale.
Table 3. Market share (%) of container ports according to their throughput and size.
PortContainer Volume (Thousand Tons)Container Throughput (TEU)Market Share %Total
Percentage
Tanger Med101,0557,173,00015.92%50.76%
Valencia69,1315,588,00012.40%
Piraeus46,9514,731,00011.79%
Algeciras83,0514,797,49710.65%
Barcelona53,6423,531,3247.84%49.24%
Gioia Tauro25,7213,140,0006.97%
Marsaxlokk19062,970,0006.59%
Genoa48,2122,781,1126.17%
Mersin38,5792,097,0004.65%
Alexandria64,5001,967,0004.37%
Marseilles71,5901,500,0004.05%
Sines32,9041,823,7673.33%
La Spezia11,4861,376,6263.05%
Koper20,8211,000,0002.22%
Total44,476,196100.00%100.00%
Disclaimer/Publisher’s Note: The statements, opinions and data contained in all publications are solely those of the individual author(s) and contributor(s) and not of MDPI and/or the editor(s). MDPI and/or the editor(s) disclaim responsibility for any injury to people or property resulting from any ideas, methods, instructions or products referred to in the content.

