Article

Evaluating the Seismic Performance of Circular Concrete-Encased Steel Bridge Columns for High Seismicity Regions


by
Mohammadreza Kenarkoohi
and
Munzer Hassan
*
Department of Construction Engineering, École de Technologie Supérieure, University of Quebec, Montreal, QC H3C 1K3, Canada
*
Author to whom correspondence should be addressed.
CivilEng 2026, 7(3), 54; https://doi.org/10.3390/civileng7030054
Submission received: 27 June 2026 / Revised: 12 August 2026 / Accepted: 24 August 2026 / Published: 27 August 2026
(This article belongs to the Section Structural and Earthquake Engineering)

Abstract

This research evaluates the seismic resilience of lifeline bridge columns in Vancouver, British Columbia, by comparing traditional reinforced concrete (RC) columns with an equivalent circular concrete-encased steel (CES) system. Designed to meet the stringent performance-based requirements of CSA S6-25 and the BC Ministry of Transportation and Infrastructure (MoTI) Supplement, the structures were analyzed under a suite of ground motions representing the complex crustal, subcrustal, and subduction hazards of the Pacific Northwest. Nonlinear fiber-discretization modeling, validated against experimental data, was employed to assess damage progression and serviceability limits through comprehensive pushover, moment-rotation, and nonlinear time-history analyses. The results demonstrate that while both systems satisfy lifeline criteria, the CES configuration provides a superior safety margin due to the presence of the encased structural steel core. This internal steel member maintains vertical load capacity and extends the stable displacement plateau beyond the capacity of conventional RC, effectively reducing reinforcement strain and facilitating immediate post-seismic recovery. These findings highlight circular CES piers as a highly resilient alternative for critical transportation infrastructure in high-seismicity regions.

1. Introduction

Bridges are the indispensable arteries of modern transportation networks, facilitating the movement of people and resources essential for economic stability. In Canada, the strategic demand for new bridge infrastructure has surged due to extensive road expansion, while a significant portion of the national inventory has surpassed its 50-year service life. This aging population of structures requires urgent repair or replacement to meet modern seismic safety standards. Bridge columns are the most critical components in these systems, as they must support gravity loads while serving as the primary lateral force-resisting system. During a seismic event, the location of plastic hinges and the ductile behavior of these columns directly govern energy dissipation and the extent of structural damage. Consequently, researchers and transportation agencies worldwide have focused on developing innovative strategies to enhance seismic capacity and minimize the socioeconomic burden of post-disaster repairs [1].
The transition toward Performance-Based Design (PBD) in recent iterations of the Canadian Highway Bridge Design Code [2,3] has introduced a more rigorous framework for ensuring the resilience of critical infrastructure. However, as noted by [4] in a comprehensive evaluation of these provisions for reinforced concrete (RC) structures, the practical application of PBD in high-seismicity zones like Vancouver remains complex [4]. Implementing the CSA S6 framework for RC bridges requires navigating significant challenges related to the calibration of performance criteria and the selection of appropriate numerical models to accurately predict damage. Furthermore, traditional RC designs frequently result in extreme reinforcement congestion when attempting to satisfy the stringent strain limits imposed by the BC Ministry of Transportation and Infrastructure (MoTI) Supplement [5]. This congestion not only complicates the casting process but can also lead to premature material degradation during the long-duration ground motions characteristic of subduction zones. These identified limitations in conventional RC design underscore the pressing need for alternative structural systems, such as composite members, that can satisfy performance objectives without compromising constructability. Furthermore, recent advancements in the seismic resilience assessment of critical lifeline infrastructure, such as underground tunnel linings evaluated by Shen et al. (2026) [6] demonstrate the importance of defining clear damage states and functionality restoration curves to evaluate post-event serviceability and operational recovery.
Concrete-Encased Steel (CES) columns have emerged as a practical and structurally effective solution to these vulnerabilities. Established in high-rise buildings and tall hollow bridge piers, CES columns integrate a structural steel I-section within a concrete core to prevent local buckling and enhance confinement. Previous research has demonstrated that the confinement provided by the synergy of the structural steel section and transverse hoops significantly improves concrete strength and ductility [7]. The structural behavior of CES members has been explored through numerous investigations; Chen and Lin (2006) established confinement factors for rectangular CES sections [8], while Ellobody and Young (2011) utilized 3D finite element models to study axially and eccentrically loaded composite columns [9]. Chen and Wu (2017) further refined this by presenting an analytical model for highly and partially confined concrete, resulting in the uniaxial stress–strain relationships used in modern analysis [10].
The seismic performance of these systems was verified experimentally by Ricles and Paboojian [11], while El-Tawil and Deierlein [12] evaluated CES columns against international codes, suggesting that standard criteria require revision to better account for composite ductility. Further investigations by Campian et al. [13] and Lai et al. [14] examined failure modes under cyclic loading and the buckling behavior of high-strength concrete-encased columns. For bridge applications, Naito et al. [15] conducted experimental and analytical studies that modified Mattock’s equation [16] to formulate plastic hinge lengths for composite piers. Additionally, research into concrete-filled steel tubes (CFST) by Roeder et al. [17] and Qian et al. [18] has highlighted the benefits of composite systems for accelerated bridge construction (ABC), a field recently synthesized in a comprehensive review by Kenarkoohi and Hassan [1].
Despite this growing interest, most literature remains focused on rectangular sections. Circular CES sections benefit from the uniform confinement provided by spirals, yet they remain under-researched for bridge applications. While recent studies by Anwaar et al. [19] and Behnam and Denavit [20] have explored N-M interaction curves and biaxial stress in composite columns, they did not address the specific demands of subduction zone hazards. The absence of specific regulatory guidelines in the Canadian code for CES piers, combined with the modeling and verification difficulties documented for RC structures by Ashtari [4], highlights a significant gap in current engineering practice regarding the use of circular composite sections under extreme seismic loading.
While the authors’ previous study [21] established the baseline performance of circular CES columns under moderate, crustal-dominated seismic hazard (Montreal), designing critical bridge infrastructure for high-seismicity subduction environments introduces distinct structural challenges. Subduction zones subject bridge piers to complex, long-duration ground shaking and high-frequency subcrustal excitations that accelerate material fatigue and stiffness degradation. This study addresses these specific demands by presenting a performance-based seismic evaluation of circular CES piers in Vancouver, British Columbia. Adhering to the latest CSA S6-25 and BC MoTI Supplement provisions [3,5], this work provides novel insights into local fiber strain demands, dual-confinement core stability, and hysteretic energy dissipation under multi-hazard ground motions representing crustal, subcrustal, and subduction sources.

2. Materials and Methods

2.1. Bridge Prototype and Numerical Structural Model

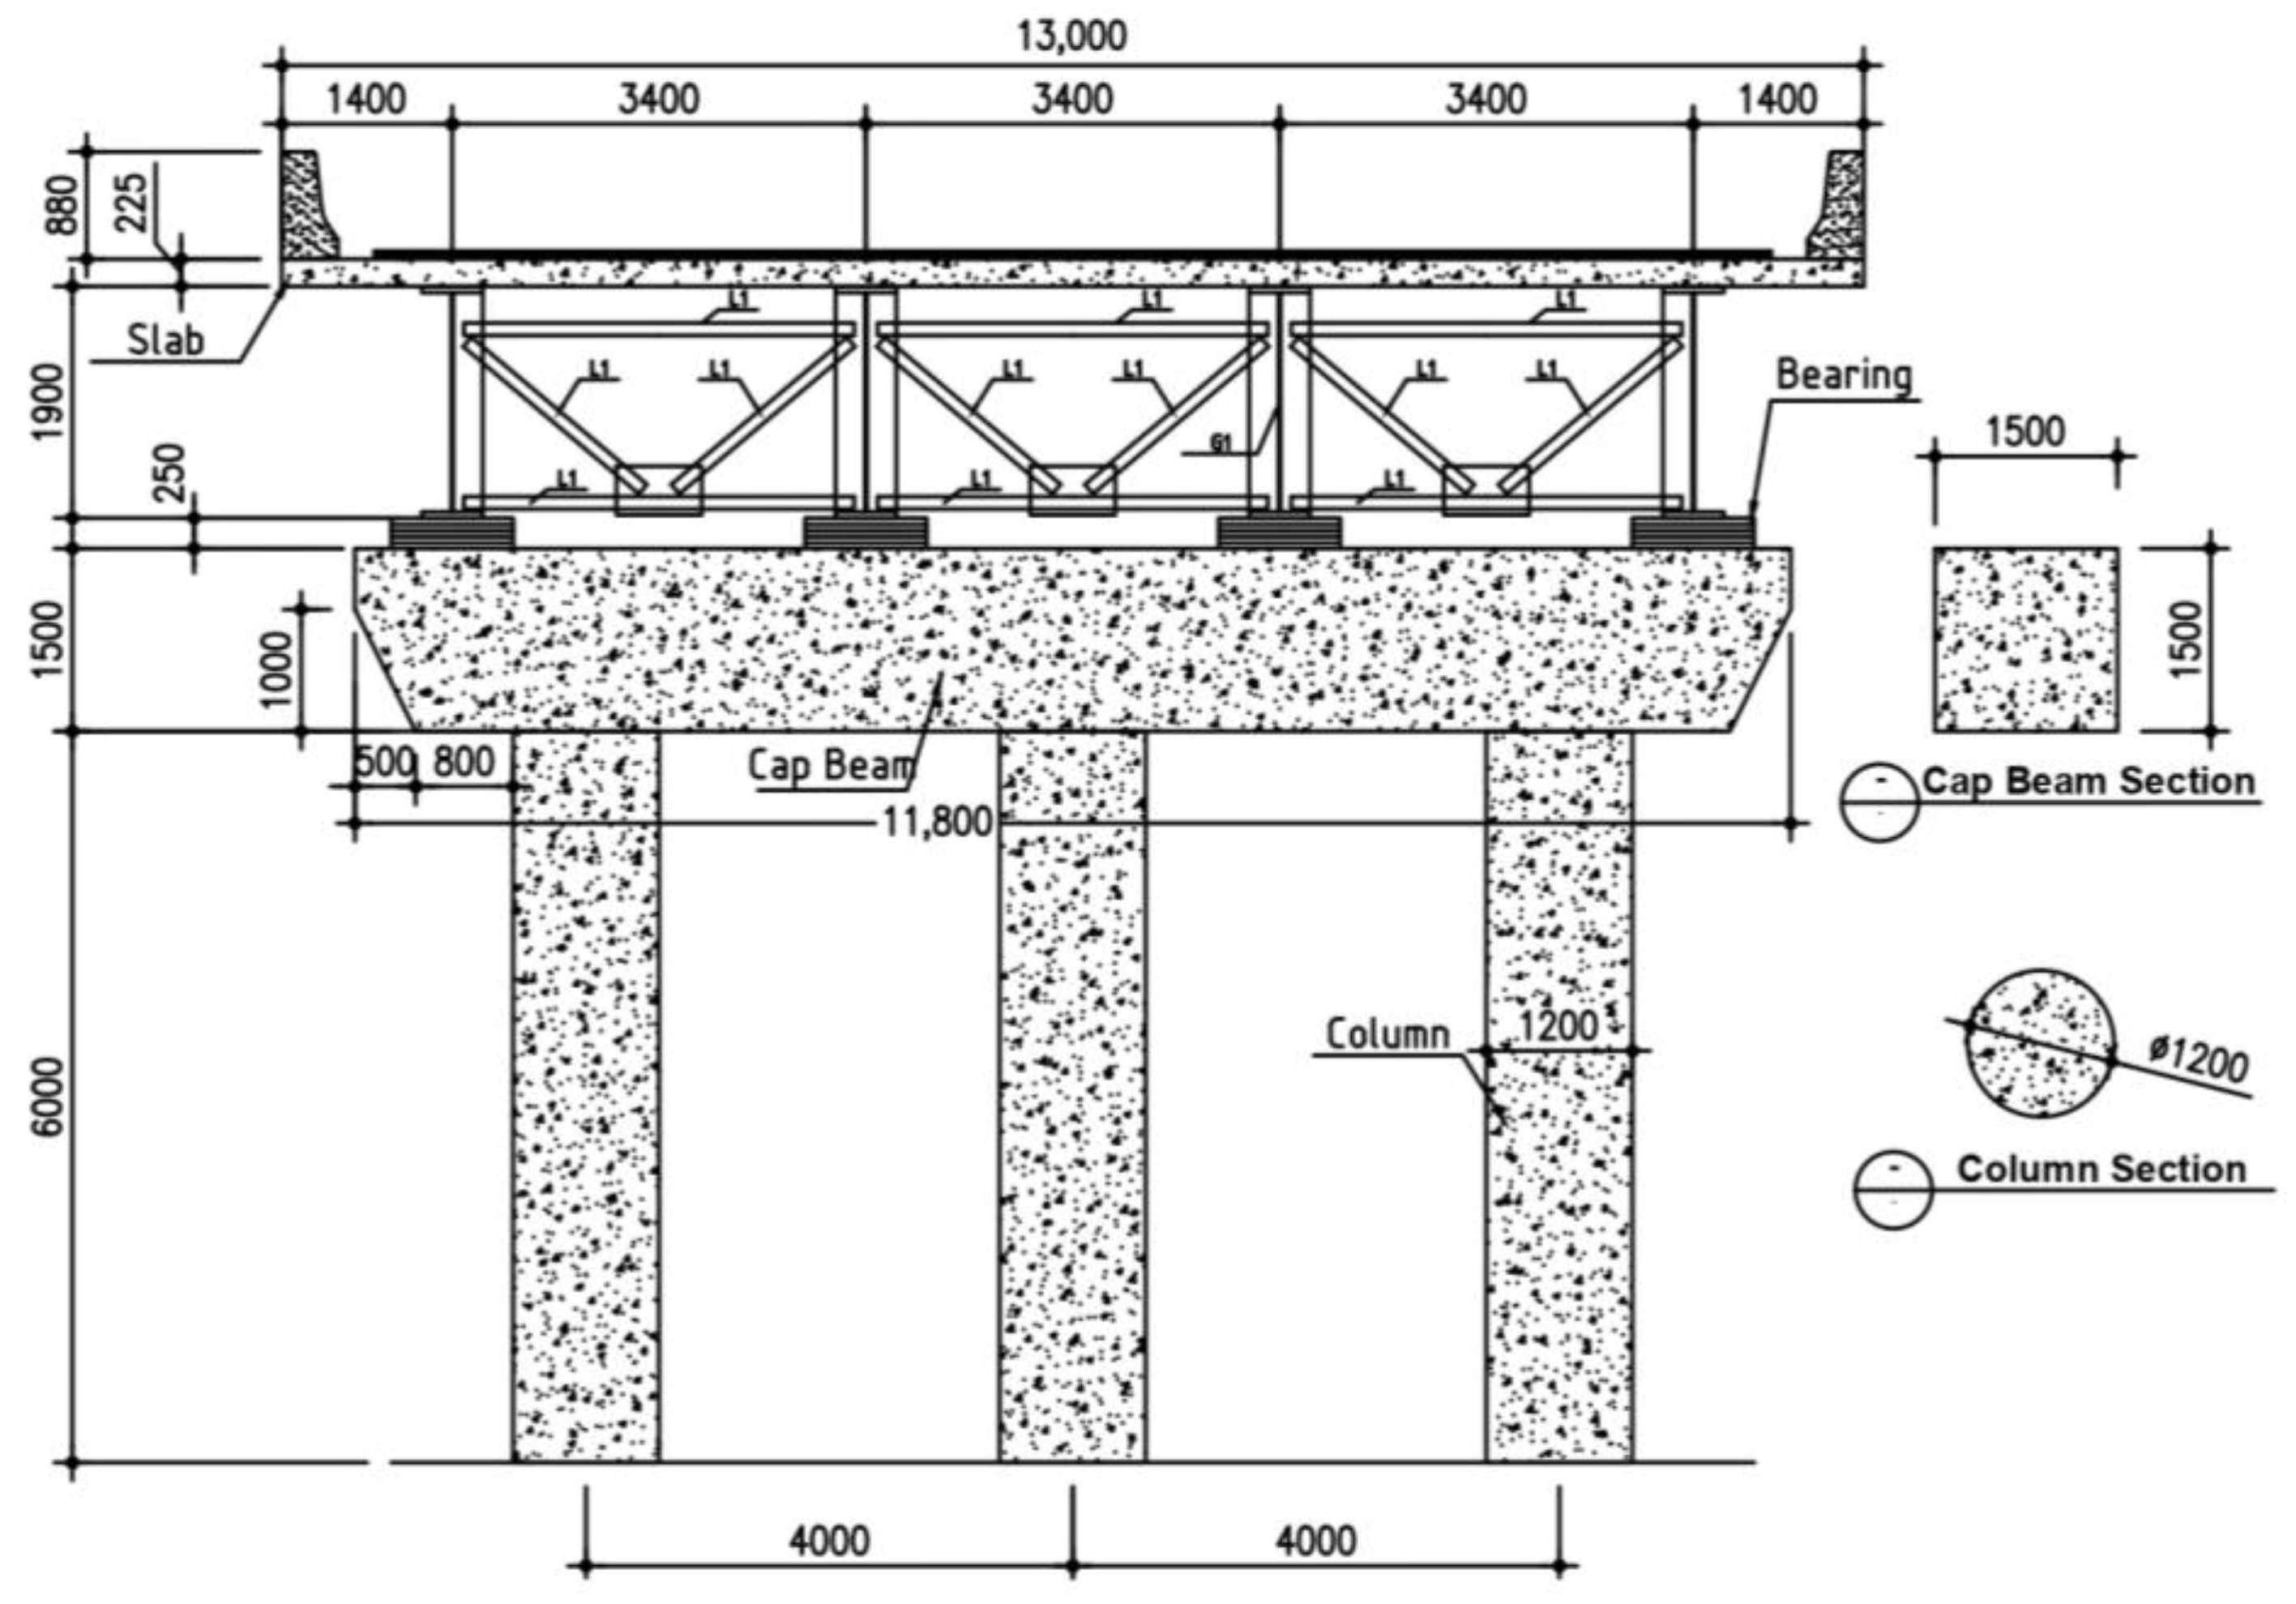
The core of this investigation centers on a representative two-span continuous highway bridge prototype, strategically located within the high-seismicity environment of Vancouver, British Columbia. The structure features a total length of 80 m, symmetrically divided into two 40-m spans, and is supported by a central pier system and two terminal abutments. This prototype configuration was selected as it is highly representative of typical regular, medium-span highway overpasses in British Columbia, allowing for a focused evaluation of pier cross-section behavior. To meet the rigorous demands placed on lifeline infrastructure, the central pier comprises three circular columns, each specified with a 1200 mm diameter to ensure adequate lateral stiffness and energy dissipation capacity. Integral structural action is maintained through a rigid cap beam that ties the column heads together. To ensure full moment transfer and composite action at column extremities, the embedded structural steel I-section extends into the concrete cap beam and footing foundations. Heavy steel anchor plates are welded to both ends of the I-section to maximize bearing capacity and connection integrity. Furthermore, the embedded length is detailed with headed shear studs welded to the steel flanges to transfer shear and flexural stresses into the concrete mass. Combined with standard 90-degree hook extensions of the longitudinal rebars, this detailing creates a rigid connection capable of developing the full plastic moment capacity of the composite section.
The transversal cross-section of the bridge and its pier are shown in Figure 1. The global structural response was simulated via CSI Bridge, employing a sophisticated nonlinear modeling approach.

2.2. Performance Objectives and Material Design

Adhering to the CSA S6-25 framework for “Lifeline” infrastructure, this study adopts a dual-level performance-based assessment to ensure post-disaster functionality. The mandated performance tiers are defined as follows:
Service Limited (Repairable Damage): Under a rare seismic event with a 2% probability of exceedance in 50 years (approximately a 2475-year return period), the bridge must remain structurally sound. While the code permits controlled inelastic behavior, damage must be localized and repairable, ensuring that primary structural components do not require replacement. To satisfy this, the maximum tensile strain in the reinforcing steel is strictly capped at 0.025.
Service Immediate (Minimal Damage): For a hazard with a 5% probability of occurrence over 50 years (a 975-year return period), the objective is immediate access for emergency traffic. The structure is expected to remain essentially elastic, with reinforcement strains restricted to 0.001 to prevent yielding.
While the Canadian code suggests a concrete compressive strain limit of 0.006 for this tier, such a value significantly exceeds the typical 0.0035 threshold at which unconfined concrete begins to fail. Consequently, this research applies a more conservative and technically robust limit of 0.004. This adjustment aligns with AASHTO guidelines for achieving a “fully operational” performance level, which is considered equivalent to the “immediate service” designation in the Canadian context. Furthermore, identical material strain limits 0.025 for reinforcement tension and 0.004 for concrete core compression) were enforced for both the RC and CES pier configurations under CSA S6-25 and the BC MoTI Supplement. We acknowledge that the interaction between the embedded structural steel I-section and the confined concrete allows the CES core to sustain strains significantly higher than 0.004 before any loss of load-carrying capacity occurs. However, applying uniform code-specified strain thresholds ensures that both structural systems are evaluated against identical regulatory performance metrics. Far from overstating the advantages of CES, enforcing these standard limits intentionally caps the CES section at a conservative operational boundary, demonstrating that its superior performance and reduced rebar strains are achieved without relying on relaxed material performance criteria.
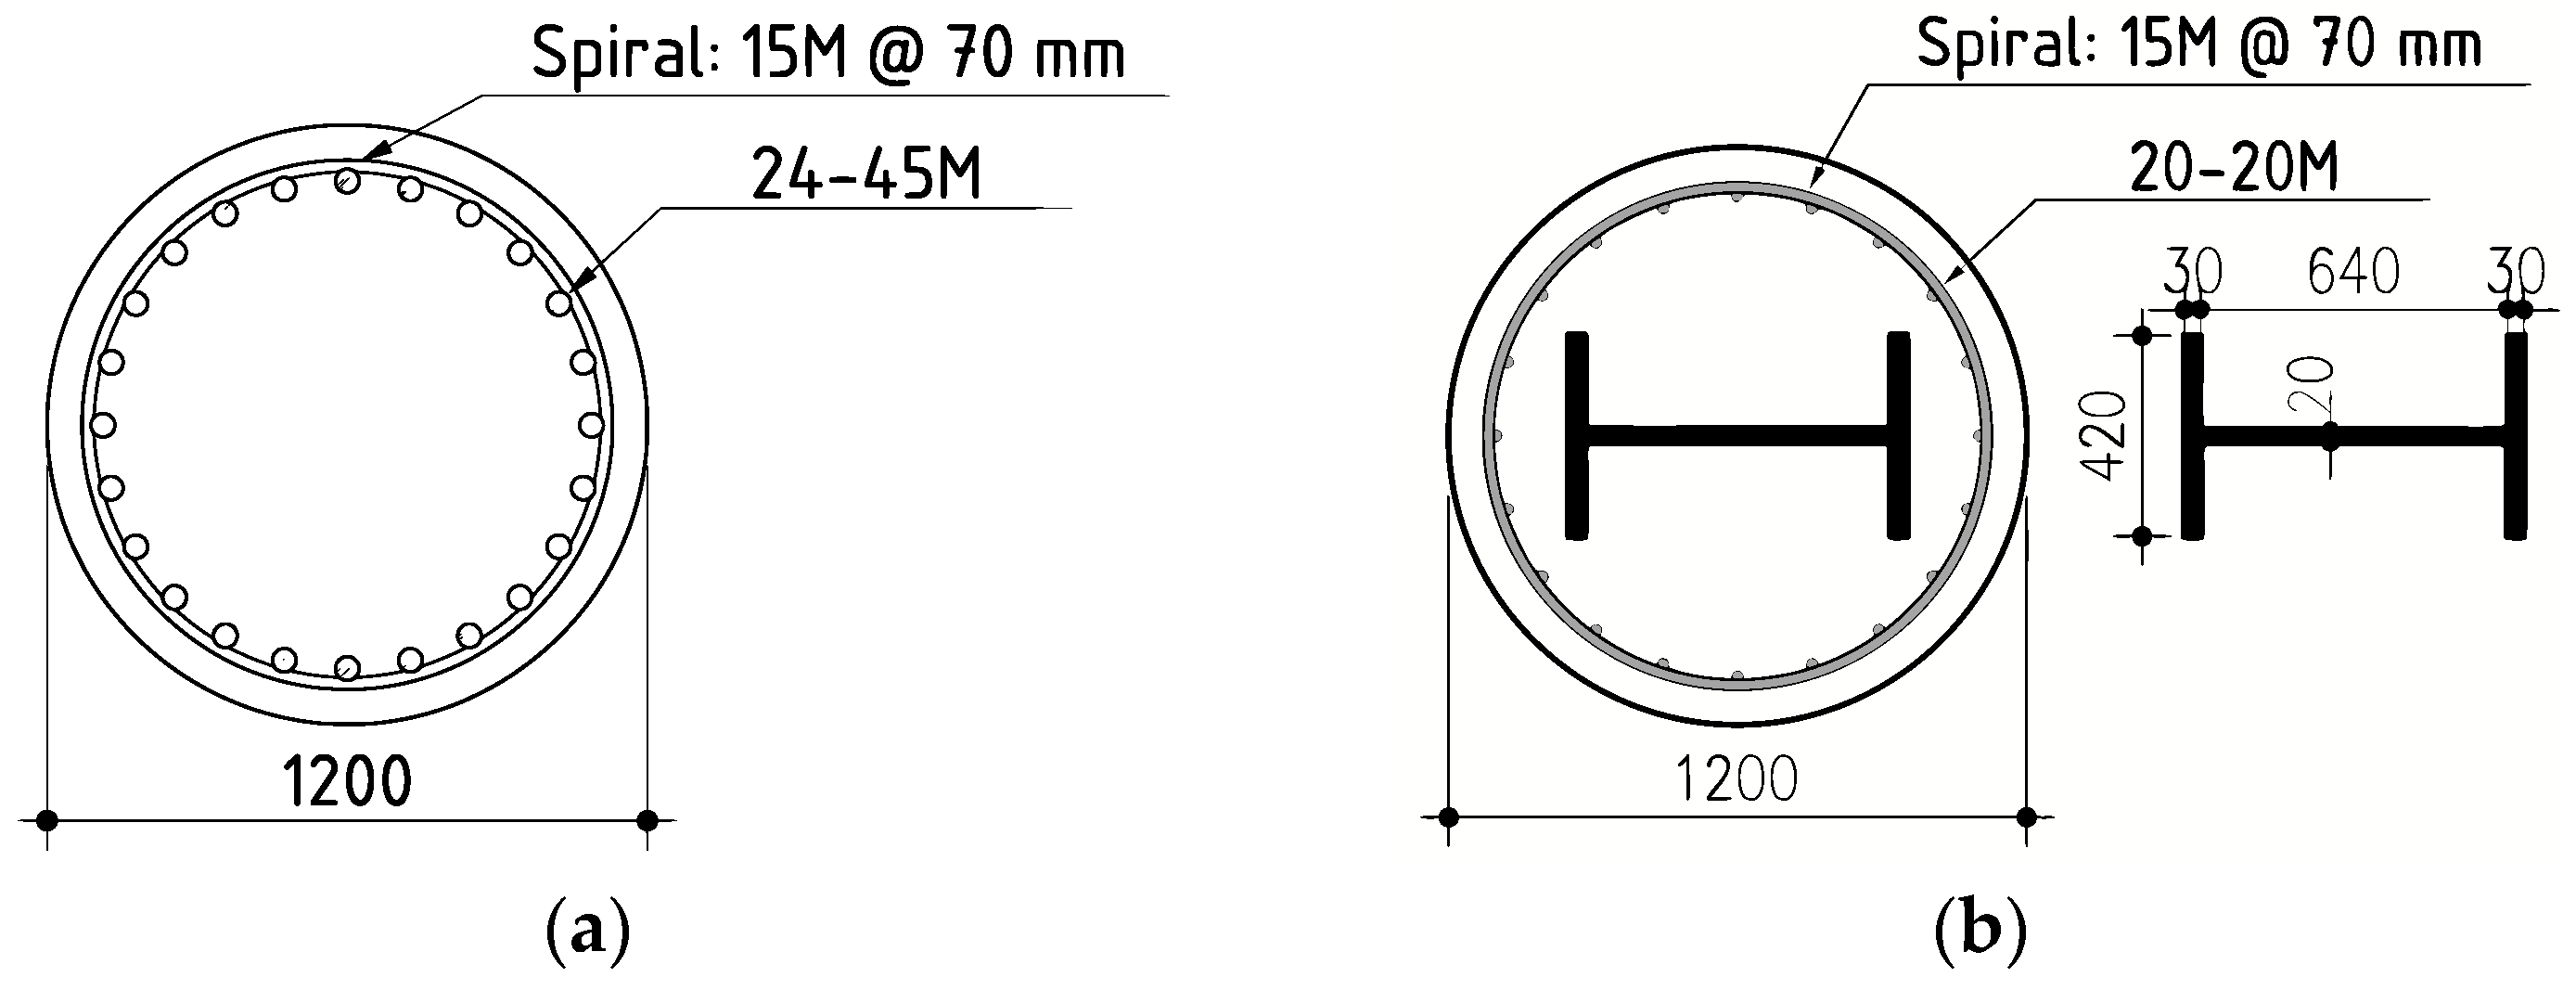
The design of the circular CES pier followed the systematic performance-based workflow previously established by Kenarkoohi and Hassan [21] to create a rational structural alternative to the conventional RC pier. First, the baseline 1200 mm diameter RC section was designed via spectral response analysis using Vancouver’s 5% and 2% in 50-year hazard spectra along with cracked effective stiffness (EIeff) to determine displacement demands. Nonlinear fiber-discretized pushover analyses were conducted to verify that local fiber strains remained within code-defined allowable damage limits, necessitating a 3.2% longitudinal rebar ratio (Figure 2a). Next, to proportion the CES pier, the outer diameter was kept identical (1200 mm) while specifying a nominal rebar ratio of 0.5% (twenty 20M bars), which remains above the 0.4% minimum threshold defined by AISC provisions [22]. The dimensions of the embedded Grade 350W steel I-section (420 × 30 mm flanges, 640 × 20 mm web) were selected to match the Axial Force-Moment (N-M) interaction envelope of the RC section (Figure 2b). Finally, the CES pier underwent the same demand-capacity verification using site-specific target spectra (EIeff) and fiber-based pushover analysis, confirming that local material strains strictly satisfied all allowable damage thresholds for both the 2% and 5% in 50-year events while successfully eliminating rebar congestion.
Confinement for both configurations is achieved through high-density spirals spaced at 70 mm, sized specifically per CSA S6-25 [3] to ensure the stability of the concrete core under extreme cyclic excursions.
Quantifying steel consumption for a representative 6.0 m pier height illustrates the material trade-offs between the two structural systems. The conventional RC section requires twenty-four 45M longitudinal Grade 400W bars (11.775 kg/m each), resulting in a rebar mass of 1696 kg per column. The CES section utilizes twenty 20M Grade 400W bars (2.355 kg/m each, totaling 283 kg) alongside a built-up Grade 350W structural steel I-section (298 kg/m, totaling 1788 kg), giving a combined steel mass of 2071 kg per column. While a detailed financial cost comparison is a multi-faceted matter involving market price differences between structural shapes and rebar, shop fabrication, and local labor rates that falls outside the scope of this study, the CES system provides substantial constructability benefits. Replacing the heavily congested 45M rebar cage with nominal 20M bars significantly increases clear spacing between bars. This mitigates aggregate blockage, ensures thorough concrete compaction around transverse spirals, and minimizes honeycomb defects.

2.3. Analytical Assessment of Effective Stiffness

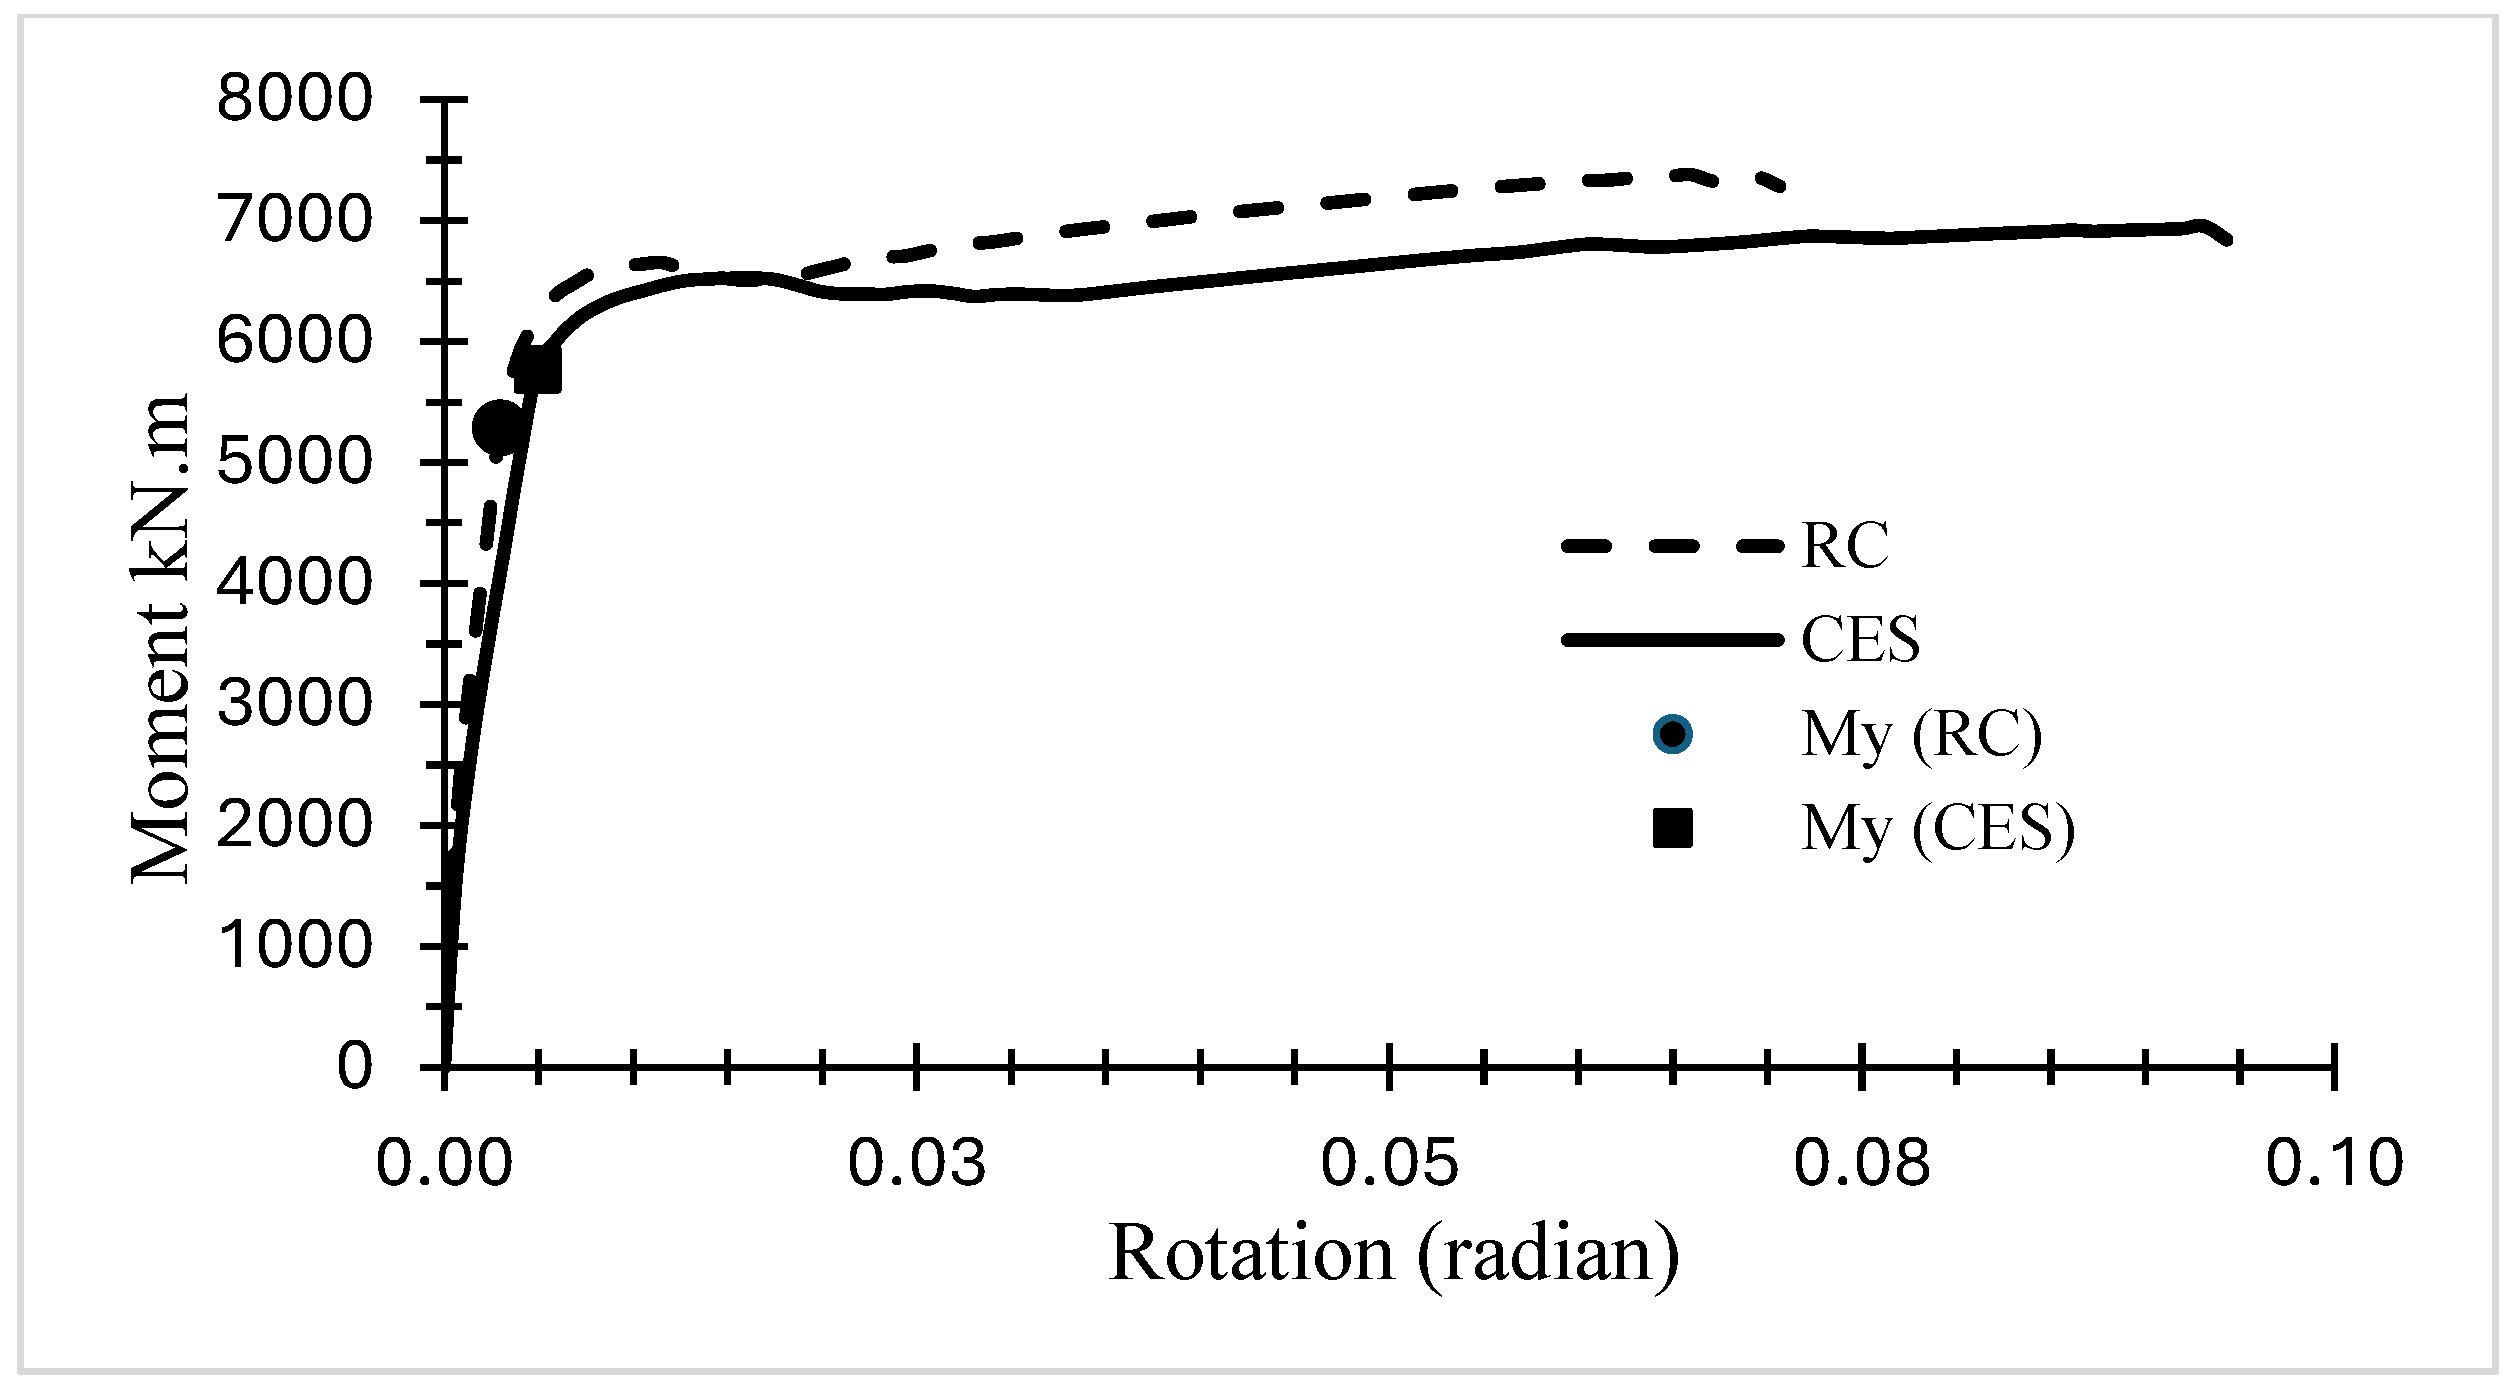
Accurate displacement-based seismic design mainly depends on the precise estimation of the effective cracked stiffness (EIeff), which governs the fundamental period and subsequent spectral demands. This parameter was extracted via comprehensive Moment-Curvature (M-φ) analysis (Figure 3), tracking the fiber-level response through incremental loading stages. The absolute effective stiffness was determined as follows:
E I e f f = M y φ y
where My and φy represent the moment and curvature at the point where the outermost longitudinal reinforcement reaches its functional yield.
While the RC prototype displayed a higher longitudinal stiffness ratio (EIeff/EIg = 0.58) compared to the CES system (0.45), the absolute structural stiffness of the two designs is remarkably similar. The inclusion of the massive steel I-section boosts the gross transformed stiffness (EIg) of the CES column to 0.1218Ec, surpassing the 0.1005Ec of the RC section. Consequently, the absolute EIeff for the CES section is approximately 94% of its RC counterpart (0.0548Ec vs. 0.0583Ec). This near-parity in stiffness ensures that both systems are subjected to nearly identical displacement demands when analyzed against the site-specific Vancouver response spectrum.

2.4. Nonlinear Modeling of Inelastic Regions

To faithfully capture the nonlinear seismic response, plastic hinges were integrated at the column extremities using a rigorous fiber discretization approach. The plastic hinge length (Lp) was determined using the foundational Paulay and Priestley empirical formulation [23] for RC members.
Given the scarcity of empirical plastic hinge expressions derived specifically for circular CES members under cyclic loading, the formulation proposed by [15] was adopted as a baseline. From a mechanics perspective, the actual plastic hinge length (Lp) in circular CES sections is anticipated to be longer than in rectangular composite piers. The uniform, continuous radial confinement provided by circular spirals, combined with the flexural rigidity of the embedded structural steel flanges, delays localized concrete crushing and rebar buckling, thereby spreading plastic deformation over a broader vertical region along the pier height. Because local curvature and strain demands scale inversely with assumed hinge length for a given target displacement (θp = φpLp), adopting a shorter rectangular-derived Lp concentrates plastic rotation over a narrower region. This yields conservative (higher) numerical estimations of localized concrete and rebar strains, confirming that the performance-based compliance reported in this study represents a safe, upper-bound demand assessment.
Material nonlinearity was simulated using constitutive models specifically adapted for complex confinement conditions:
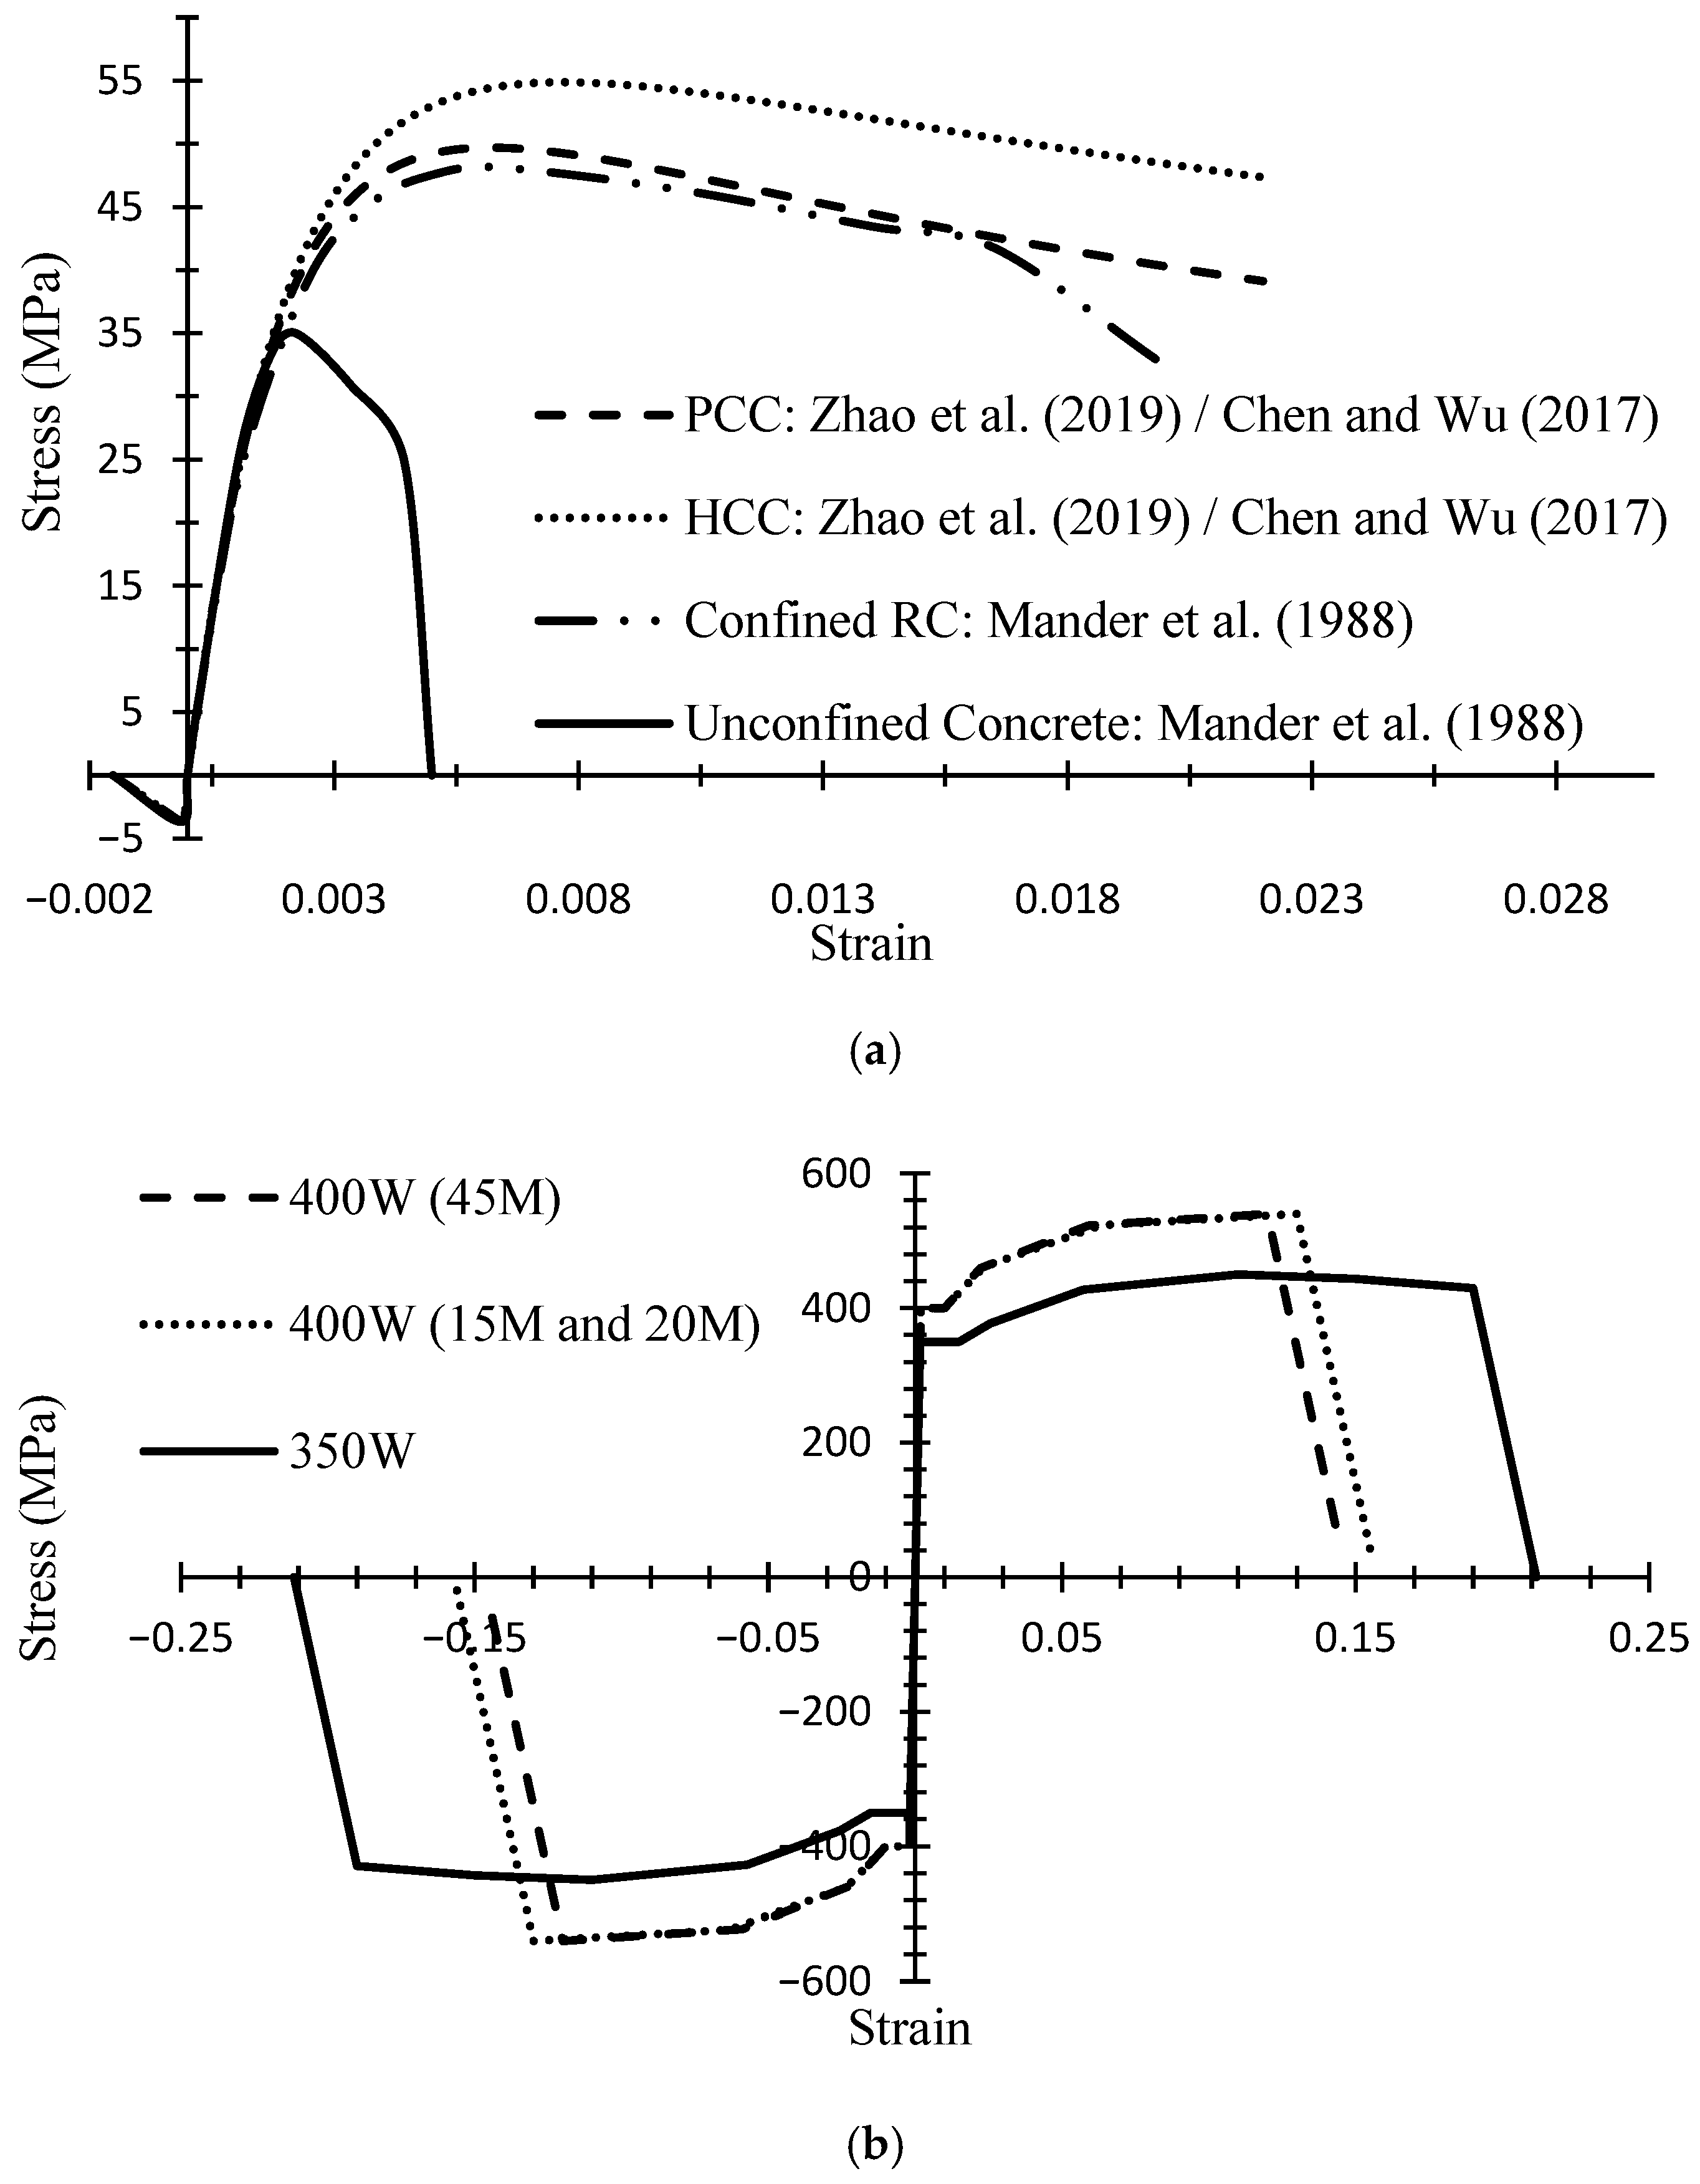
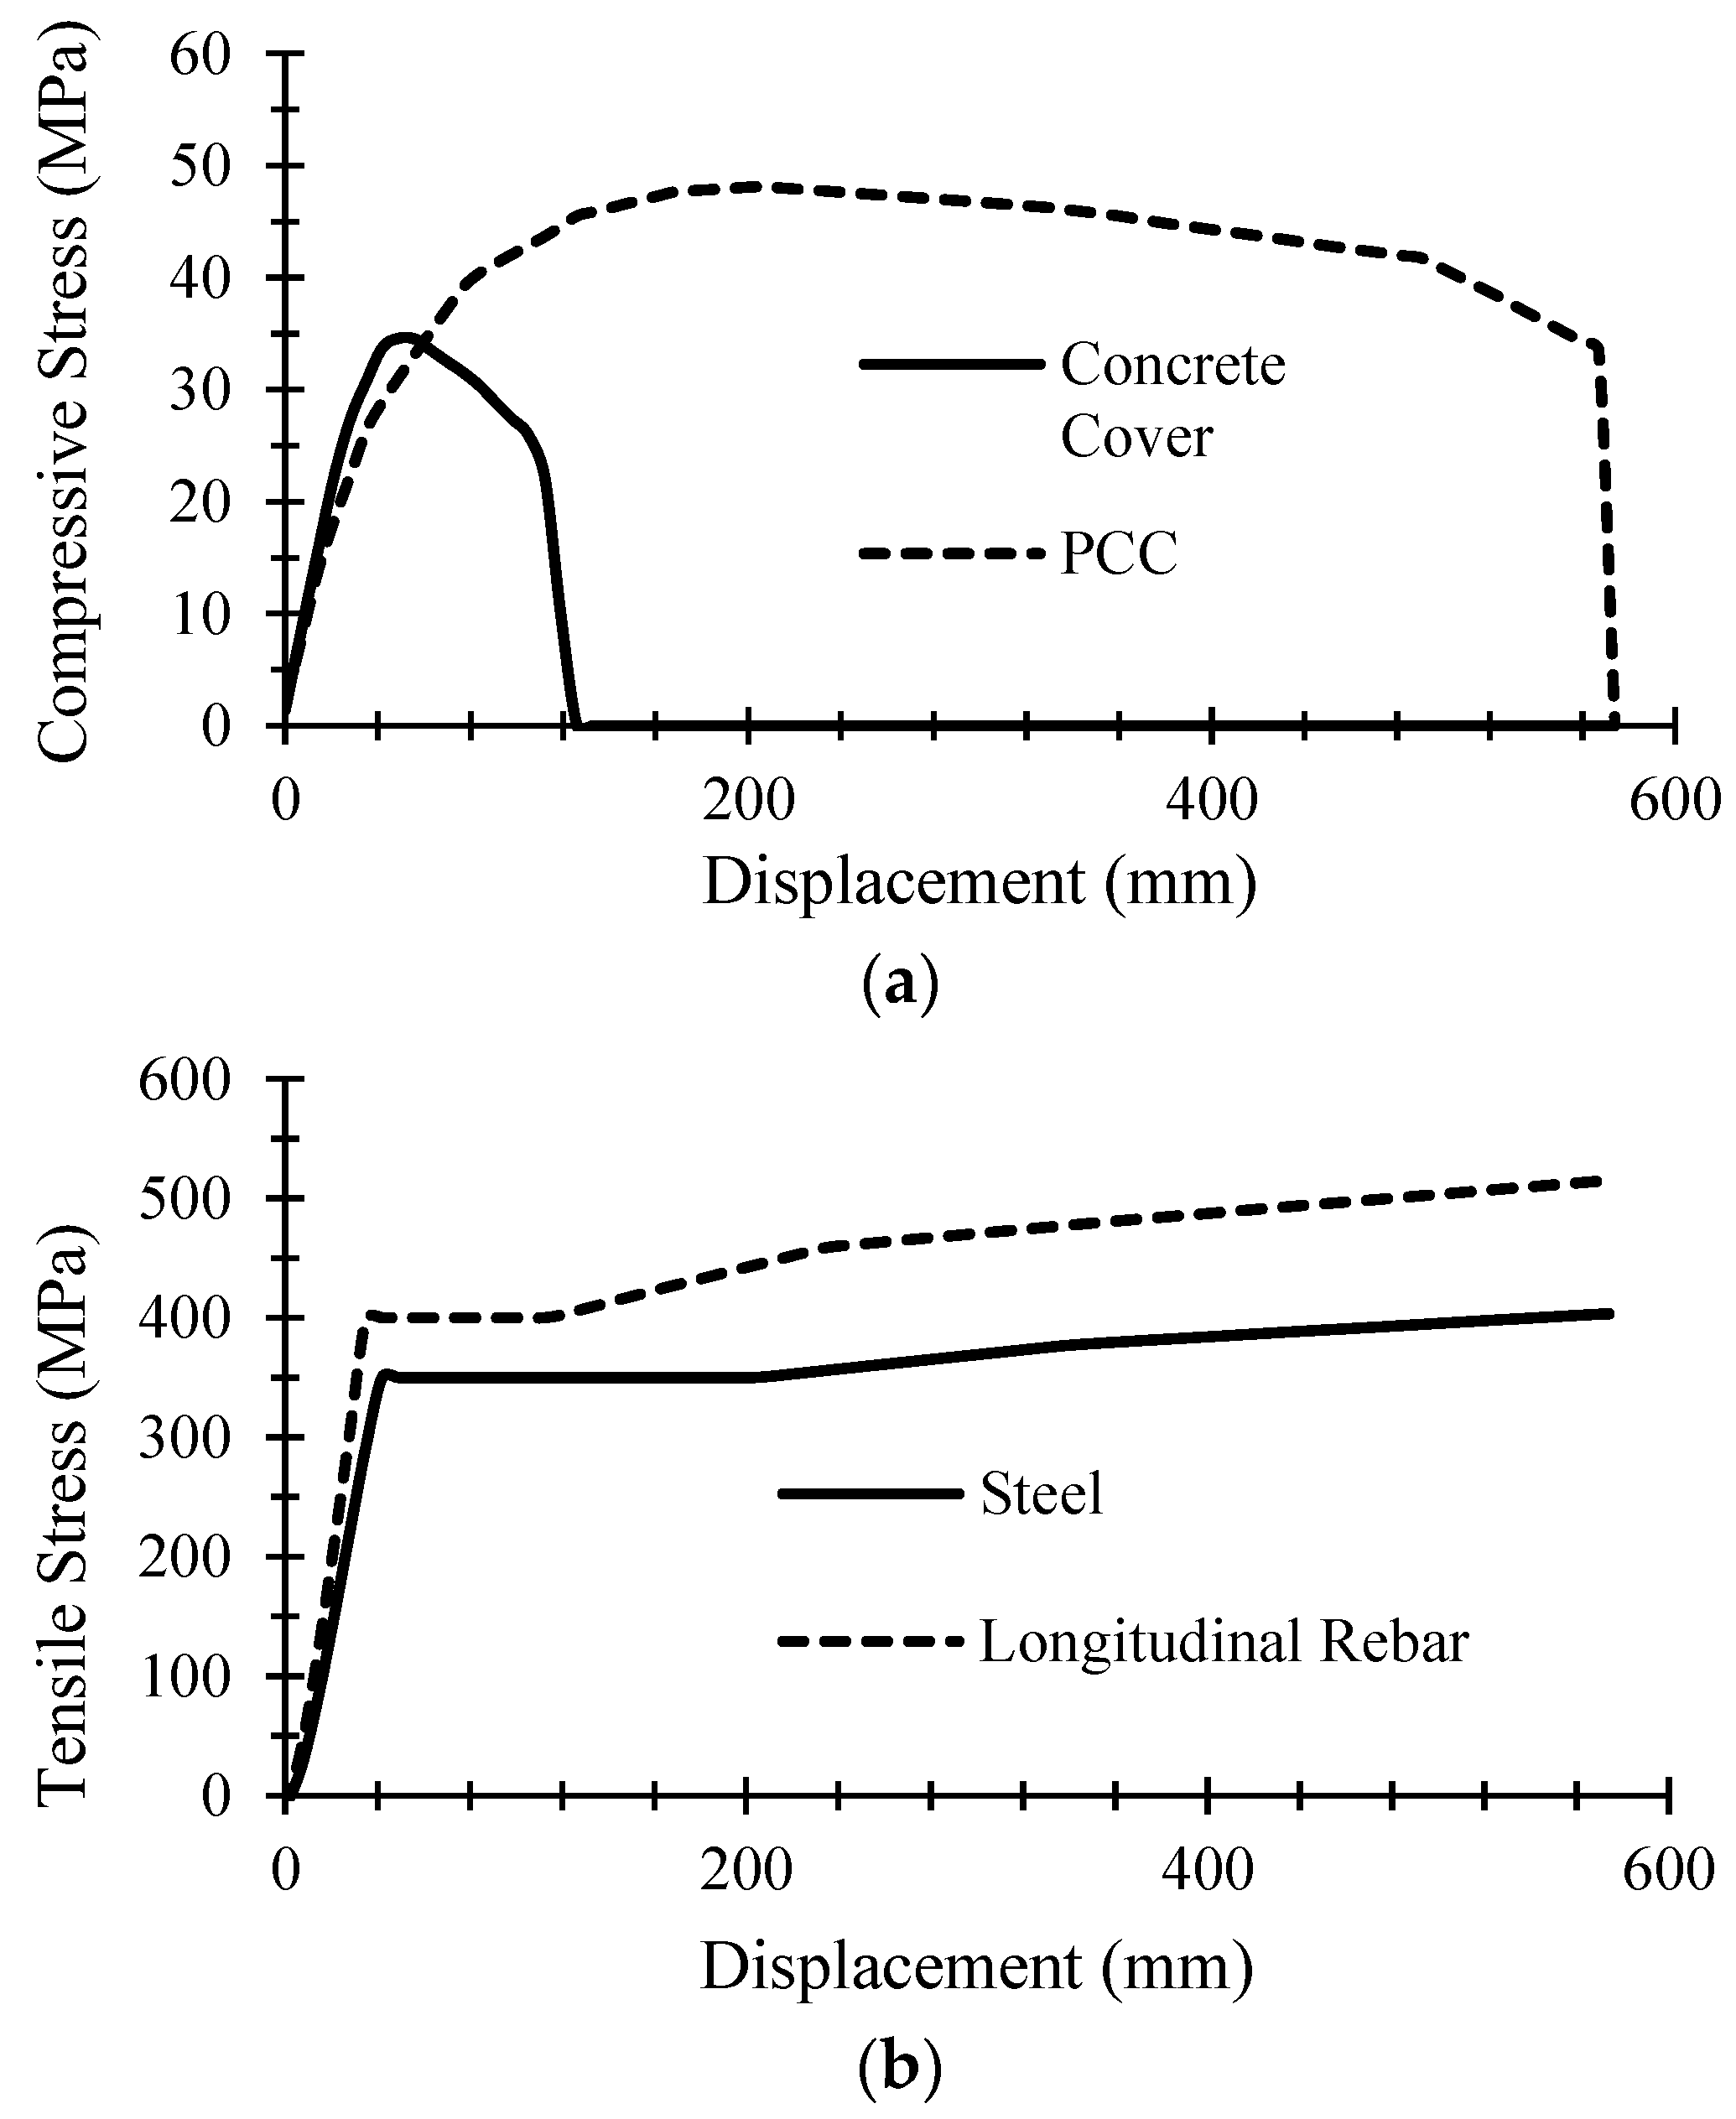
Concrete: The RC core was modeled using the well-established Mander et al. relation [24]. For the CES configuration, the ‘dual confinement’ phenomenon, resulting from the combined action of transverse spirals and the rigid steel flanges, was captured using the Zhao et al. model [7] based on the analytical framework developed by Chen and Wu [10]. This model mathematically partitions the core into Highly Confined Concrete (HCC), bounded by the steel web and flanges, and Partially Confined Concrete (PCC), located between the spirals and the HCC boundary. The complete mathematical formulation and implementation of this dual-confinement partition for circular CES bridge columns were previously established and detailed in Kenarkoohi and Hassan [21]. The stress–strain behavior for these concrete regions is illustrated in Figure 4a.
Steel: Both the rebar and the structural steel section were assigned nonlinear constitutive laws with strain-hardening properties as shown in Figure 4b, ensuring an accurate representation of the section’s ultimate overstrength and energy dissipation capacity.
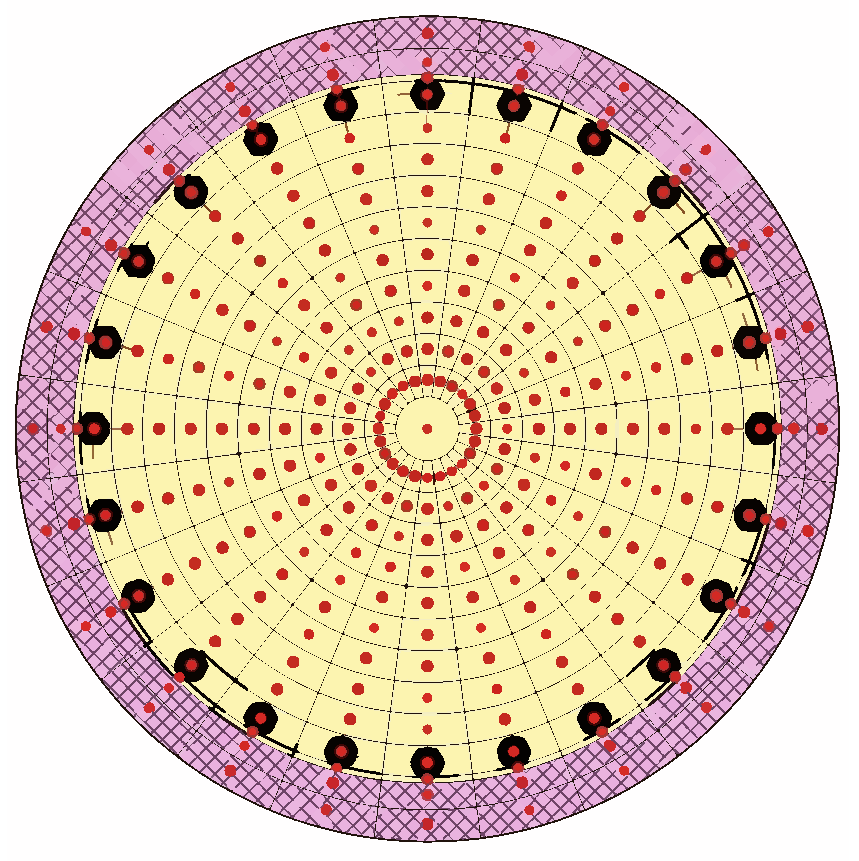
The nonlinear behavior of column extremities was captured using a fiber-discretization approach, which accurately represents the interaction between axial load and bending moment. For the RC section, the fiber layout was defined in radial coordinates, selected to ensure at least one fiber exists within the thickness of the concrete cover and between adjacent longitudinal rebars. This layout comprises 48 radial cover fibers (located in the 75 mm outer unconfined layer outside the spirals), 265 confined core fibers (located inside the spiral cage), and 24 individual longitudinal rebar fibers (Figure 5).
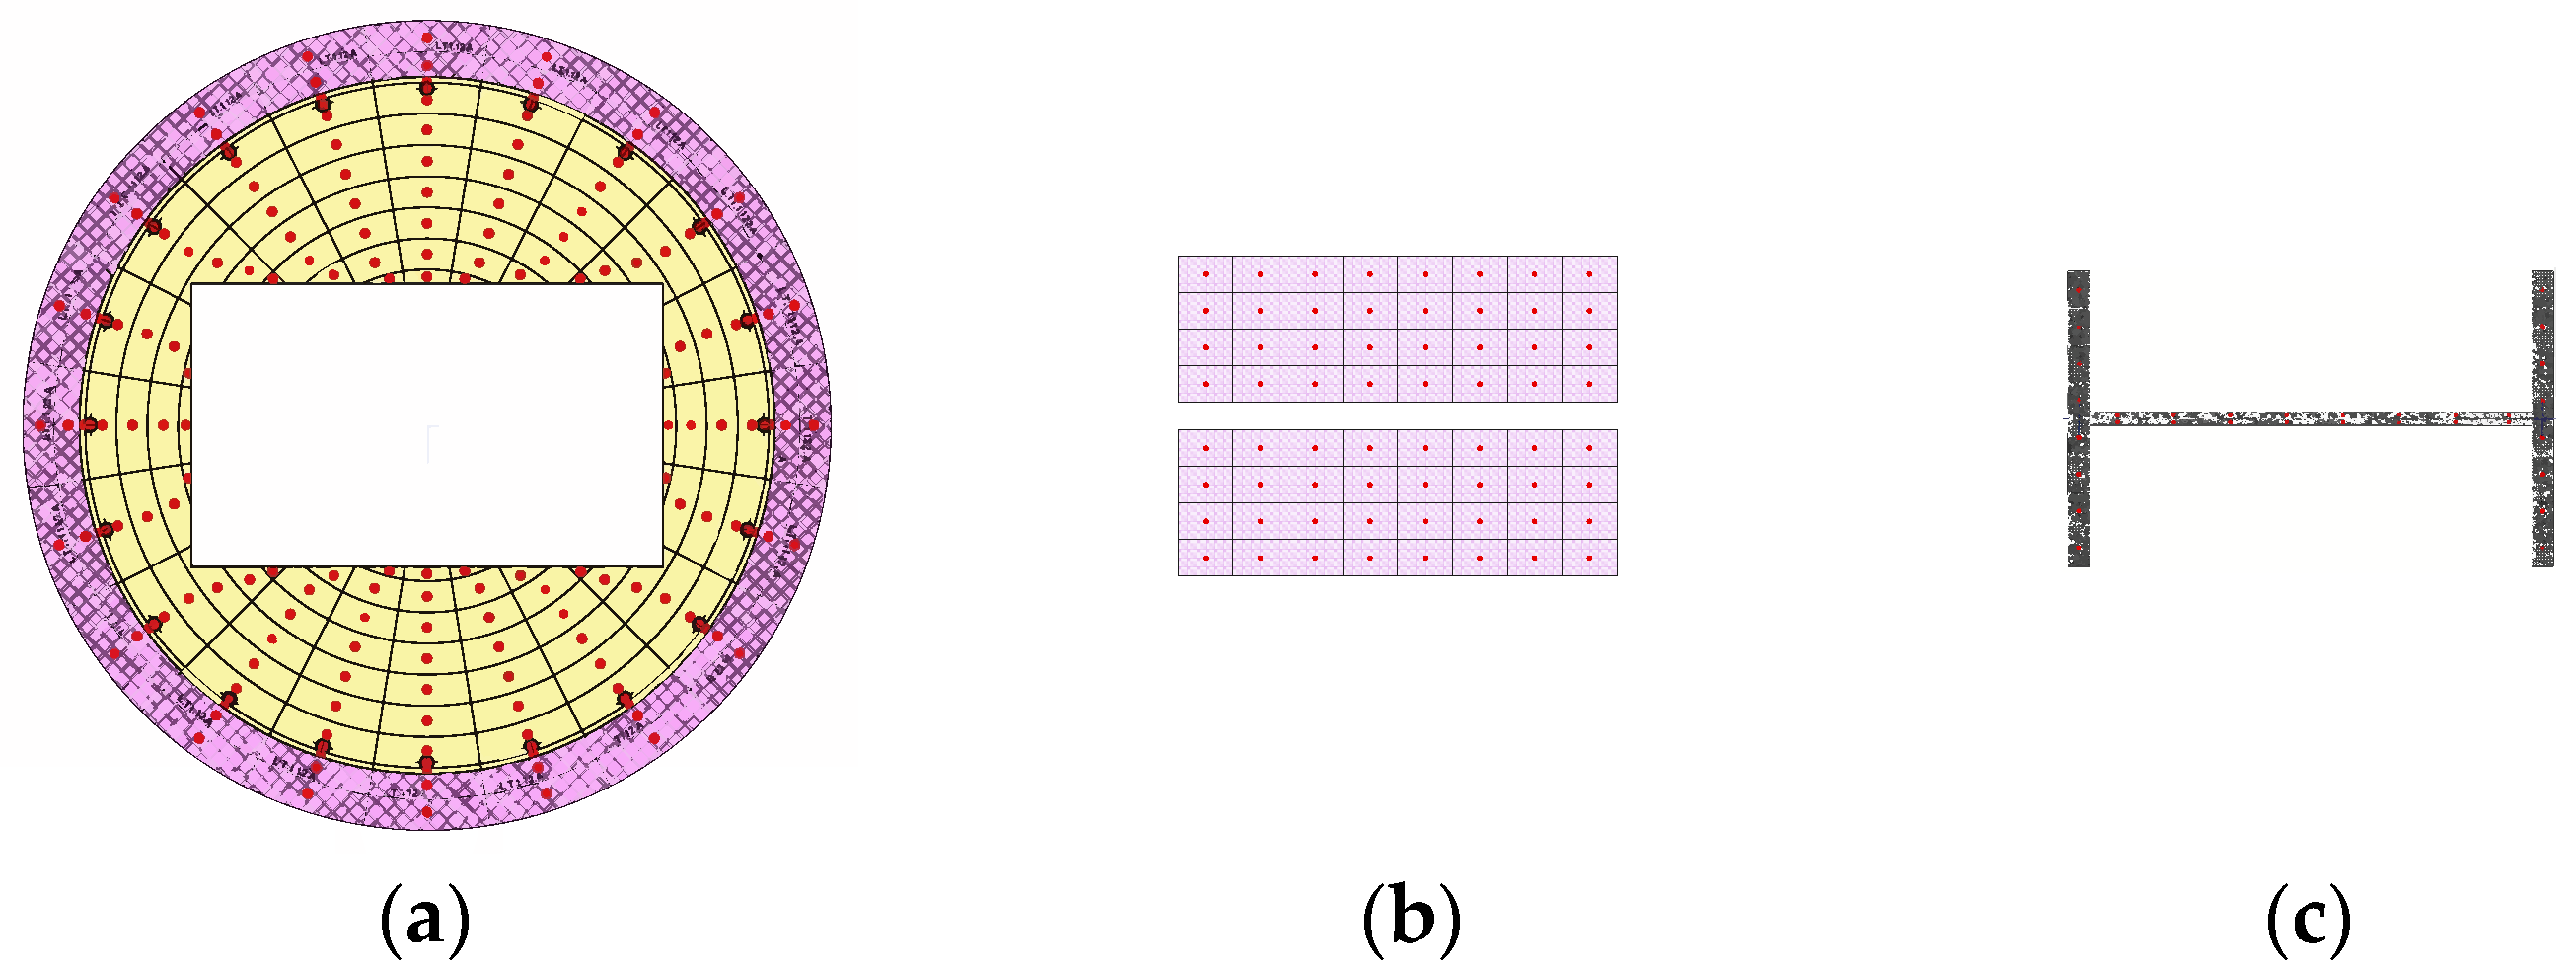
In the CES configuration, a hybrid discretization strategy was employed: 32 fibers represent the structural steel section (16 for the flanges and 16 for the web), an 8 × 8 Cartesian grid (64 fibers) models the Highly Confined Concrete (HCC) core bounded between the steel flanges, 130 radial fibers capture the Partially Confined Concrete (PCC, located inside the spirals excluding the HCC region) and the 75 mm unconfined cover regions, and 20 individual fibers represent the longitudinal rebars (Figure 6). A mesh convergence check confirmed that doubling the total fiber density across all material regions produced less than a 0.5% change in key response metrics—specifically the yield moment (My) and ultimate flexural curvature (φu), verifying that the discretization yields reliable outcomes and local strain localization is numerically stable and independent of mesh density.

2.5. Selection and Spectrally Matched Ground Motions

Given the complex tectonic setting of Vancouver, the seismic hazard is a hybrid of crustal, subcrustal, and subduction mega-thrust sources. Adhering to the methodology outlined by Tremblay et al. [25], a specialized suite of 11 site-specific ground motion records was selected to represent these dominant threats. The foundational selection of these earthquake events was guided by the research of Ashtari [4], which identifies the critical ground motion parameters required for the performance-based evaluation of Canadian bridges. To ensure the study remains grounded in the most current seismic data, the 2018 Anchorage earthquake was explicitly added to the suite, providing a high-fidelity, recent subcrustal record to the established historical set.
This collection includes high-intensity subduction events (e.g., Tohoku 2011 and Maule 2010 earthquakes) characterized by long durations, which are essential for testing the cumulative damage tolerance of composite systems, alongside significant subcrustal and crustal motions such as Chi-Chi and Nisqually.
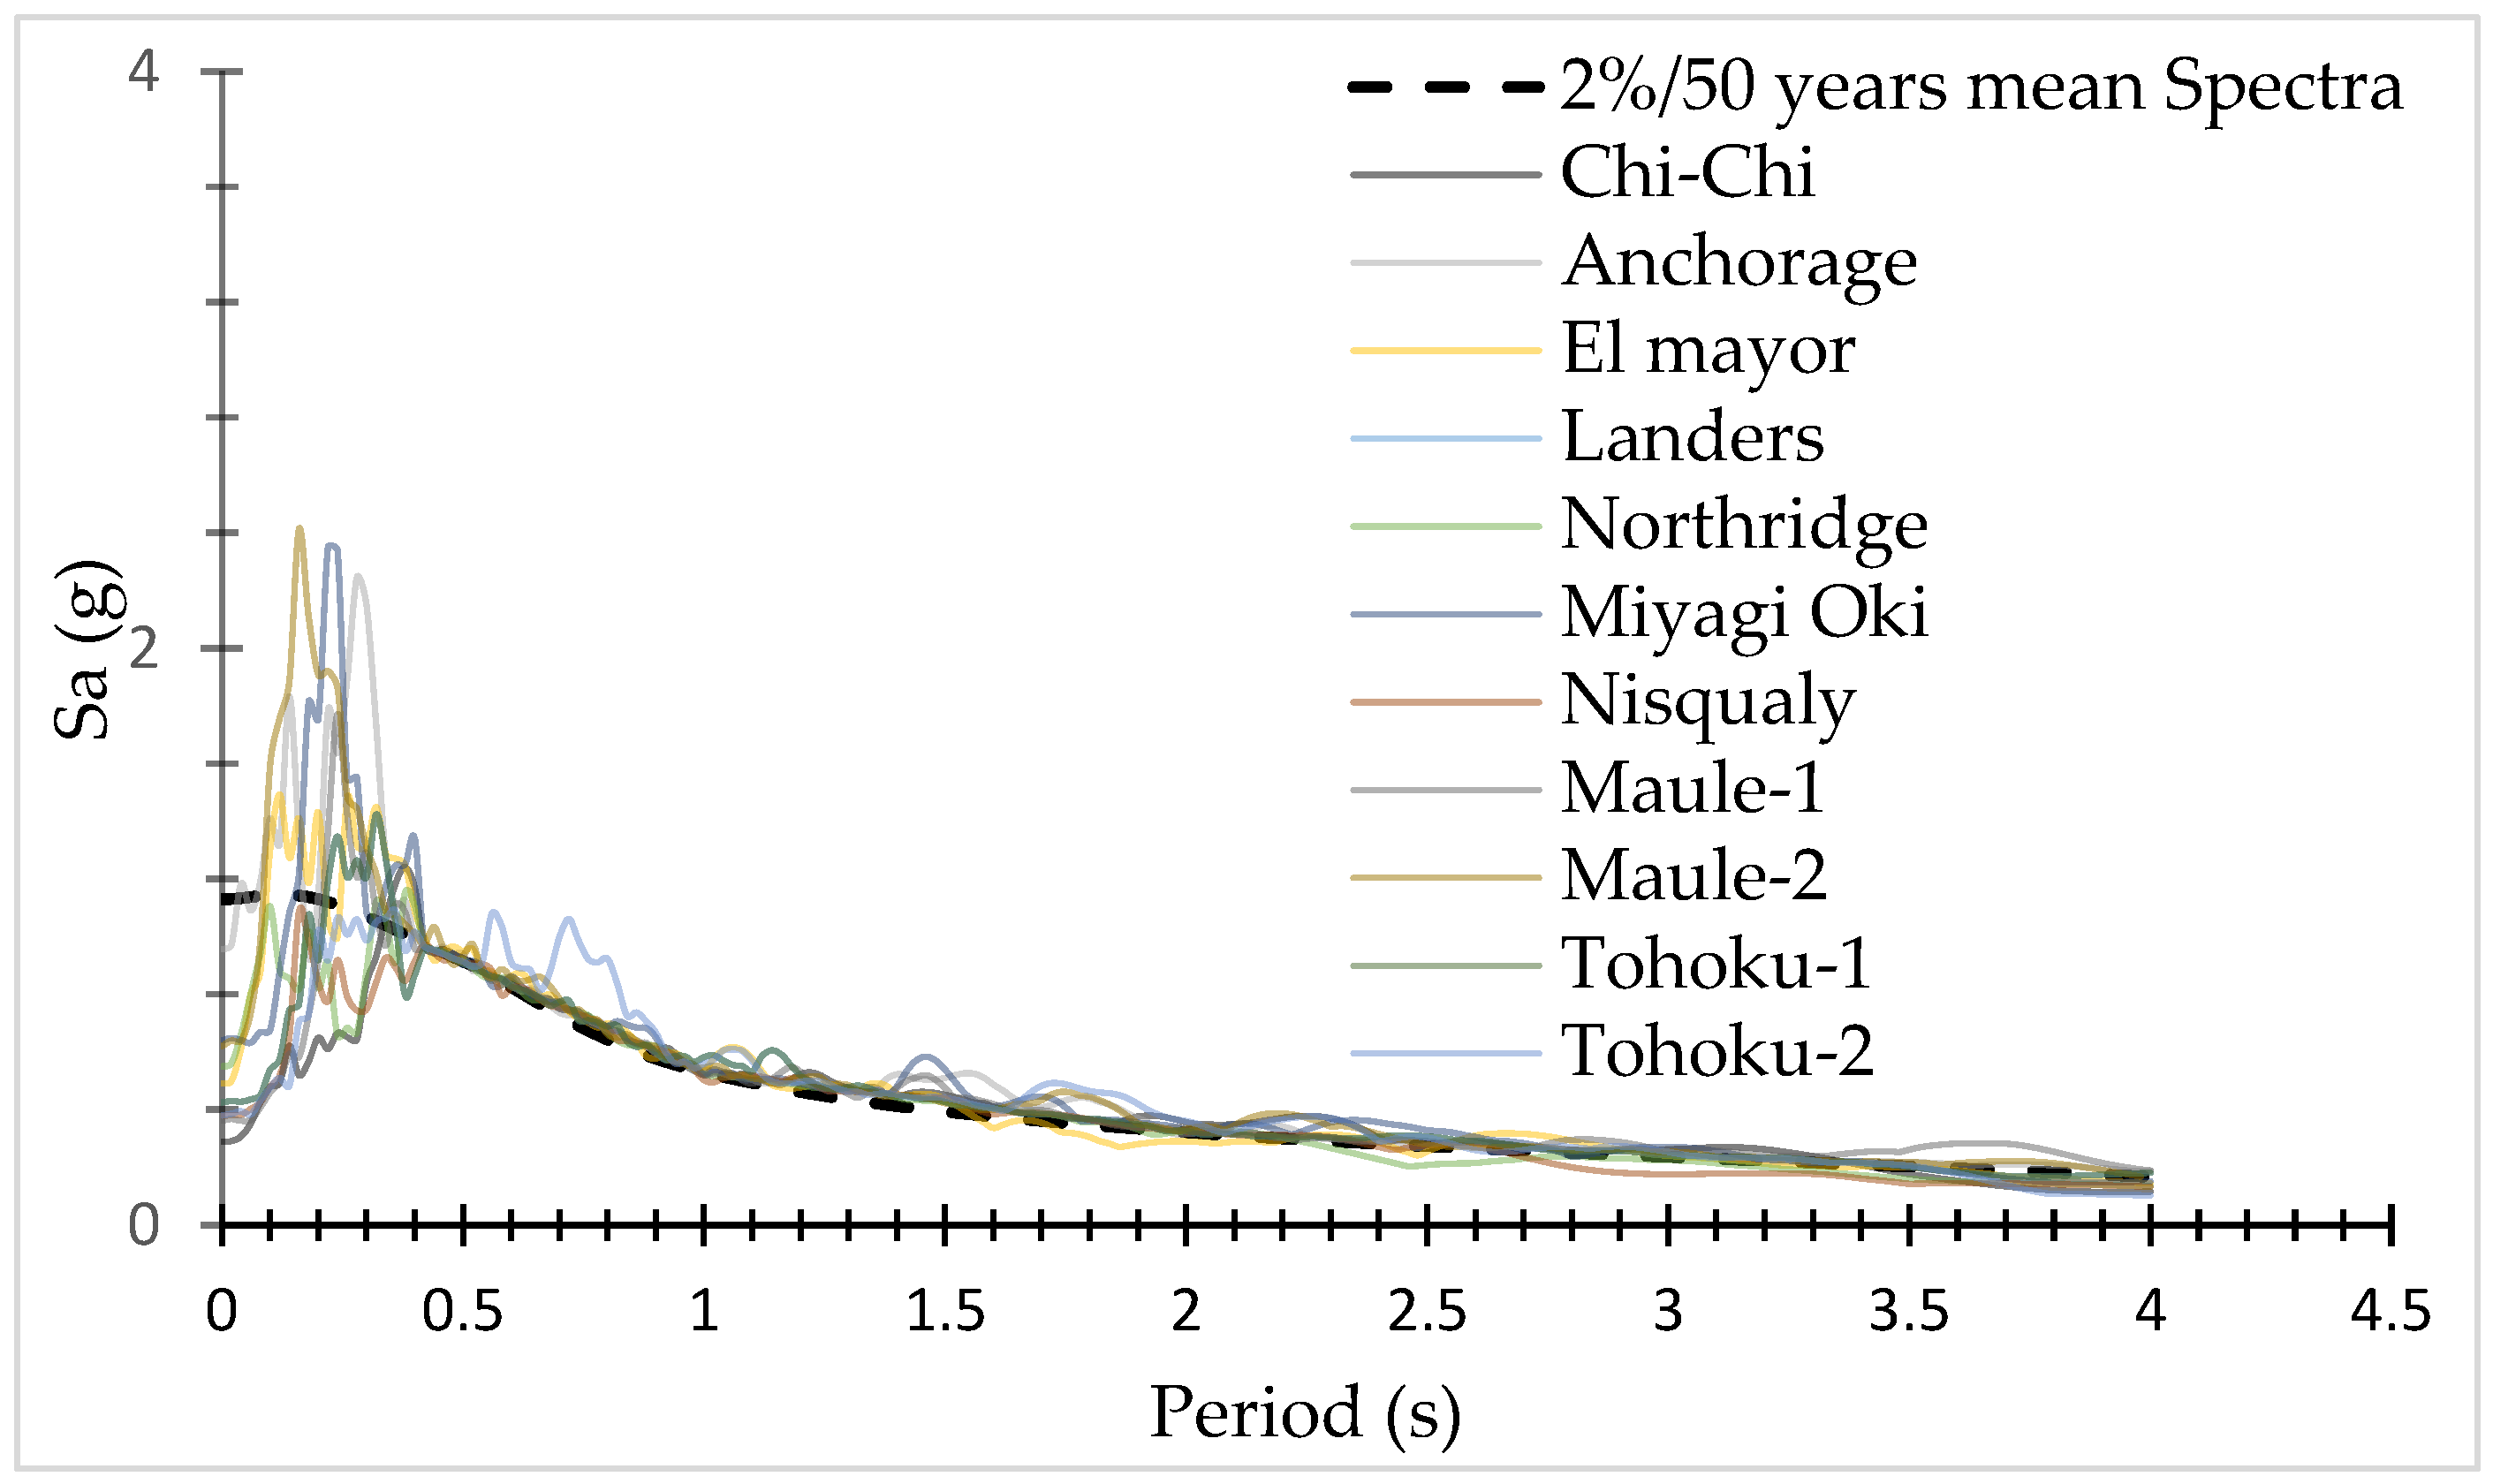
To ensure statistical reliability and compliance with the BC MoTI design requirements, the raw acceleration time histories were matched to the target Vancouver response spectrum using SeismoMatch based on the wavelet-based algorithm proposed by Al Atik and Abrahamson [26], setting a maximum spectral misfit tolerance of 0.30 across the fundamental period range of interest (0.2 T1T ≤ 2.0 T1). To illustrate the statistical dispersion of the matched suite, the individual response spectra of all 11 records and the target Uniform Hazard Spectrum (UHS) are presented in Figure 7. The algorithm achieved a close fit across the period spectrum while maintaining low record-to-record dispersion. While Conditional Mean Spectrum (CMS) methods provide alternative hazard targeting options, evaluating a single suite of 11 ground motions matched to the target spectrum adheres strictly to Section 4.4.3.6 of the BC MoTI Supplement to CSA S6-19 [5], which governs British Columbia bridge design and specifies the mean response quantity as the primary metric for performance evaluation. The metadata and characteristics for these 11 matched records are presented in Table 1.

3. Results

3.1. Verification of the Numerical Modeling Approach

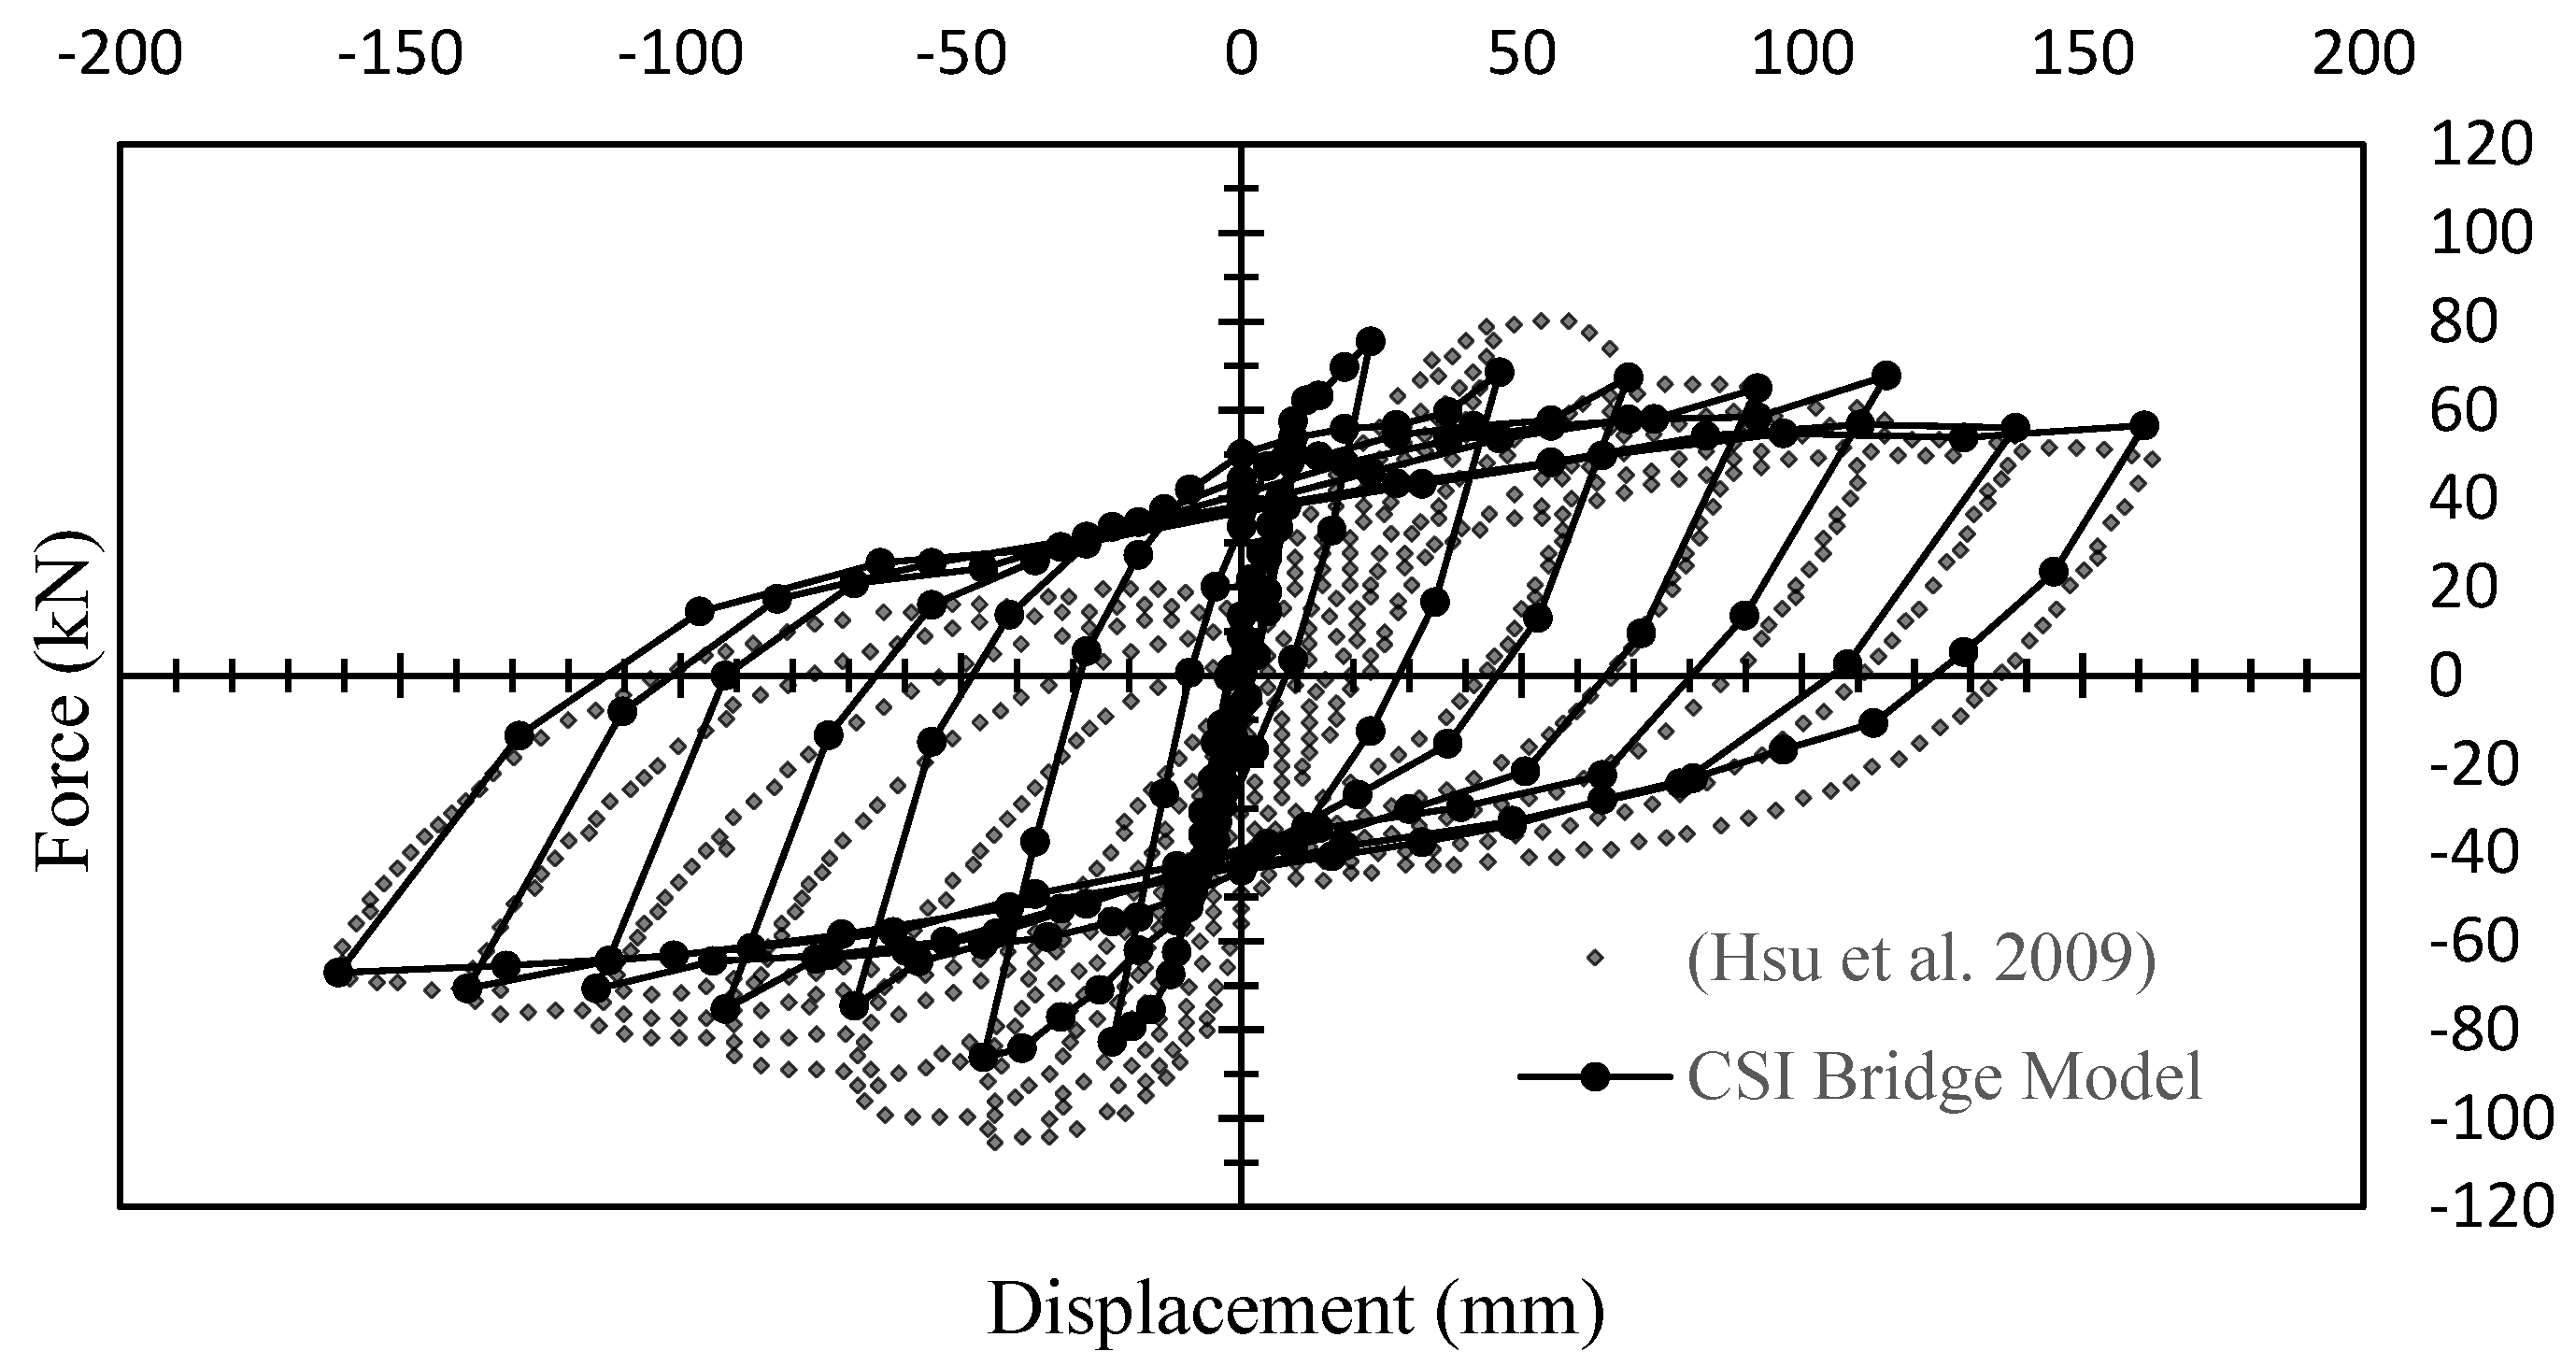
Before proceeding with the site-specific seismic evaluation of the circular pier configurations, it was imperative to establish the reliability of the nonlinear fiber-discretization method employed in CSiBridge. As detailed in our previous investigation [21], the lack of exhaustive experimental datasets specifically targeting circular concrete-encased steel (CES) sections necessitated a validation strategy using high-fidelity rectangular specimens. To this end, the numerical framework was benchmarked against the cyclic testing results of a rectangular CES column documented by Hsu et al. [27], and the results are shown in Figure 8.
The simulation successfully captured the complex hysteretic behavior of the composite member, including the stiffness degradation and energy dissipation characteristics inherent to encased structural steel systems [21]. A direct comparison between the experimental force–displacement response and the numerical output demonstrated a strong correlation, with the model accurately predicting both the peak lateral strength and the post-yield softening branch. This robust agreement confirms that the constitutive material laws and the “dual confinement” modeling assumptions integrated into the software are capable of faithfully depicting the structural mechanics of encased sections. Consequently, this validated modeling architecture serves as a dependable foundation for the subsequent comparative analysis of the RC and circular CES prototypes under Vancouver’s extreme seismic demands.
In addition, to quantify potential bias resulting from the application of confinement parameters calibrated against rectangular test specimens to circular geometries, a section-level sensitivity analysis was conducted on the bridge column model. The effective concrete core confinement parameters, the peak confined concrete strength and ultimate crushing strain (fcc and εcu), were varied by ±15%. Relative to the baseline peak base shear of 2653 kN obtained from the nonlinear static pushover analysis, the resulting maximum base shear was 2717kN (+2.41%) for +15% confinement and 2651 kN (−0.08) for −15% confinement. This minimal variation range (from −0.08% to +2.41%) confirms that while uniform radial spirals offer enhanced confinement efficiency compared to rectangular hoops, the fiber-discretization model provides reliable and conservative estimates of structural capacity.

3.2. Nonlinear Time-History Analysis and Damage Evolution

To evaluate the dynamic response of the bridge under site-specific Vancouver hazards, a series of nonlinear time-history analyses were performed using a suite of spectrally matched ground motions. This approach facilitates a high-fidelity assessment of damage progression by monitoring the localized response of individual material components within the plastic hinge regions. Both the RC and CES sections were specifically engineered to satisfy the dual-level performance criteria of CSA S6-25 for “Lifeline” infrastructure, targeting “Minimal Damage” and “Repairable Damage” states for the 975-year and 2475-year events, respectively.

3.2.1. Comparative Fiber Strains: Service Limited Hazard (2% in 50 Years)

The mean of maximum strains for the rare 2475-year hazard level illustrates that the CES architecture provides a significantly wider safety margin than traditional RC piers, particularly regarding the protection of reinforcing elements. The results are shown in Table 2 and Table 3 in the RC and CES sections, respectively.
Reinforcement Response: The RC section reinforcement reached an average strain of 24.8 × 10⁻³, which is nearly at the 25.0 × 10⁻³ limit for repairable damage. In contrast, the CES section reduced this demand to 20.7 × 10⁻³, effectively protecting the longitudinal rebar from excessive degradation.
Concrete Cover Integrity: In the RC section, the average cover strain reached 4.4 × 10⁻³, exceeding the typical spalling threshold and indicating a need for post-event repair. The CES section showed a similar average cover strain of 4.3 × 10⁻³, though it exhibited slightly better performance during subduction events (3.5 × 10⁻³ vs. 4.4 × 10⁻³).
Core Stability: While the average core strains were identical at 3.1 × 10⁻³, the CES section showed improved resilience during peak subcrustal events compared to the RC section (3.6 × 10⁻³ vs. 4.1 × 10⁻³), staying well below the refined 4.0 × 10⁻³ limit.

3.2.2. Performance Under Service Immediate Hazard (5% in 50 Years)

For the frequent 975-year event, both sections remained within the functional “Minimal Damage” thresholds, ensuring the bridge remains mostly elastic. The Results are presented in Table 4 and Table 5 in the RC and CES sections, respectively.
Elastic Component Comparison: At this hazard level, both sections show near-parity in concrete strains. The RC core and cover averages (2.0 × 10⁻³ and 2.8 × 10⁻³) are nearly identical to the CES core and cover values (2.1 × 10⁻³ and 2.7 × 10⁻³), all remaining well within elastic limits.
Steel Profile Performance: Crucially, the structural steel I-section in the CES configuration remained entirely elastic across all record types, with an average strain of 9.8 × 10⁻³. This ensures that the primary vertical load-carrying “spine” of the bridge suffers zero cumulative damage during moderate shaking and remains elastic.

3.2.3. Source-Specific Sensitivity and Event Discussion

Analyzing the seismic response based on earthquake source mechanisms is vital for high-seismicity regions like Vancouver. The data demonstrates that subcrustal events represent the most critical threat for both RC and CES sections, consistently producing the highest peak strains in the concrete core and reinforcement. This heightened demand likely stems from the high-frequency content of these events aligning with the structural period of the bridge. While subduction zone records present significantly longer durations, the instantaneous maximum demand was driven by subcrustal hazards. The CES system’s ability to navigate these peak demands with a superior safety margin, reducing average reinforcement strain by 16% in the 2475-year event, highlights its enhanced resilience compared to traditional RC designs.
It is worth noting that the constitutive material models adopted in this study are rate-independent, consistent with the material libraries available in CSiBridge. High-frequency ground motions, particularly subcrustal events, can induce elevated dynamic strain rates in structural elements. In physical members, rapid strain rates result in a Dynamic Increase Factor (DIF) that enhances the effective yield strength of reinforcement steel and the compressive strength of confined concrete. By using rate-independent models, these dynamic strength enhancements are intentionally omitted, providing a conservative upper-bound estimation of peak lateral displacements and fiber strains. Under subcrustal excitations, where reinforcement strains approached performance limit thresholds (26.8 × 10⁻³ for the RC bridge and 24.0 × 10⁻³ for the CES bridge), incorporating strain-rate effects would increase section flexural resistance, thereby reducing peak drift demands and further lowering localized reinforcement strains. Accounting for dynamic strain-rate sensitivity remains an important direction for future investigation using multi-platform modeling environments.

3.2.4. Dynamic Stability and Hysteretic Response

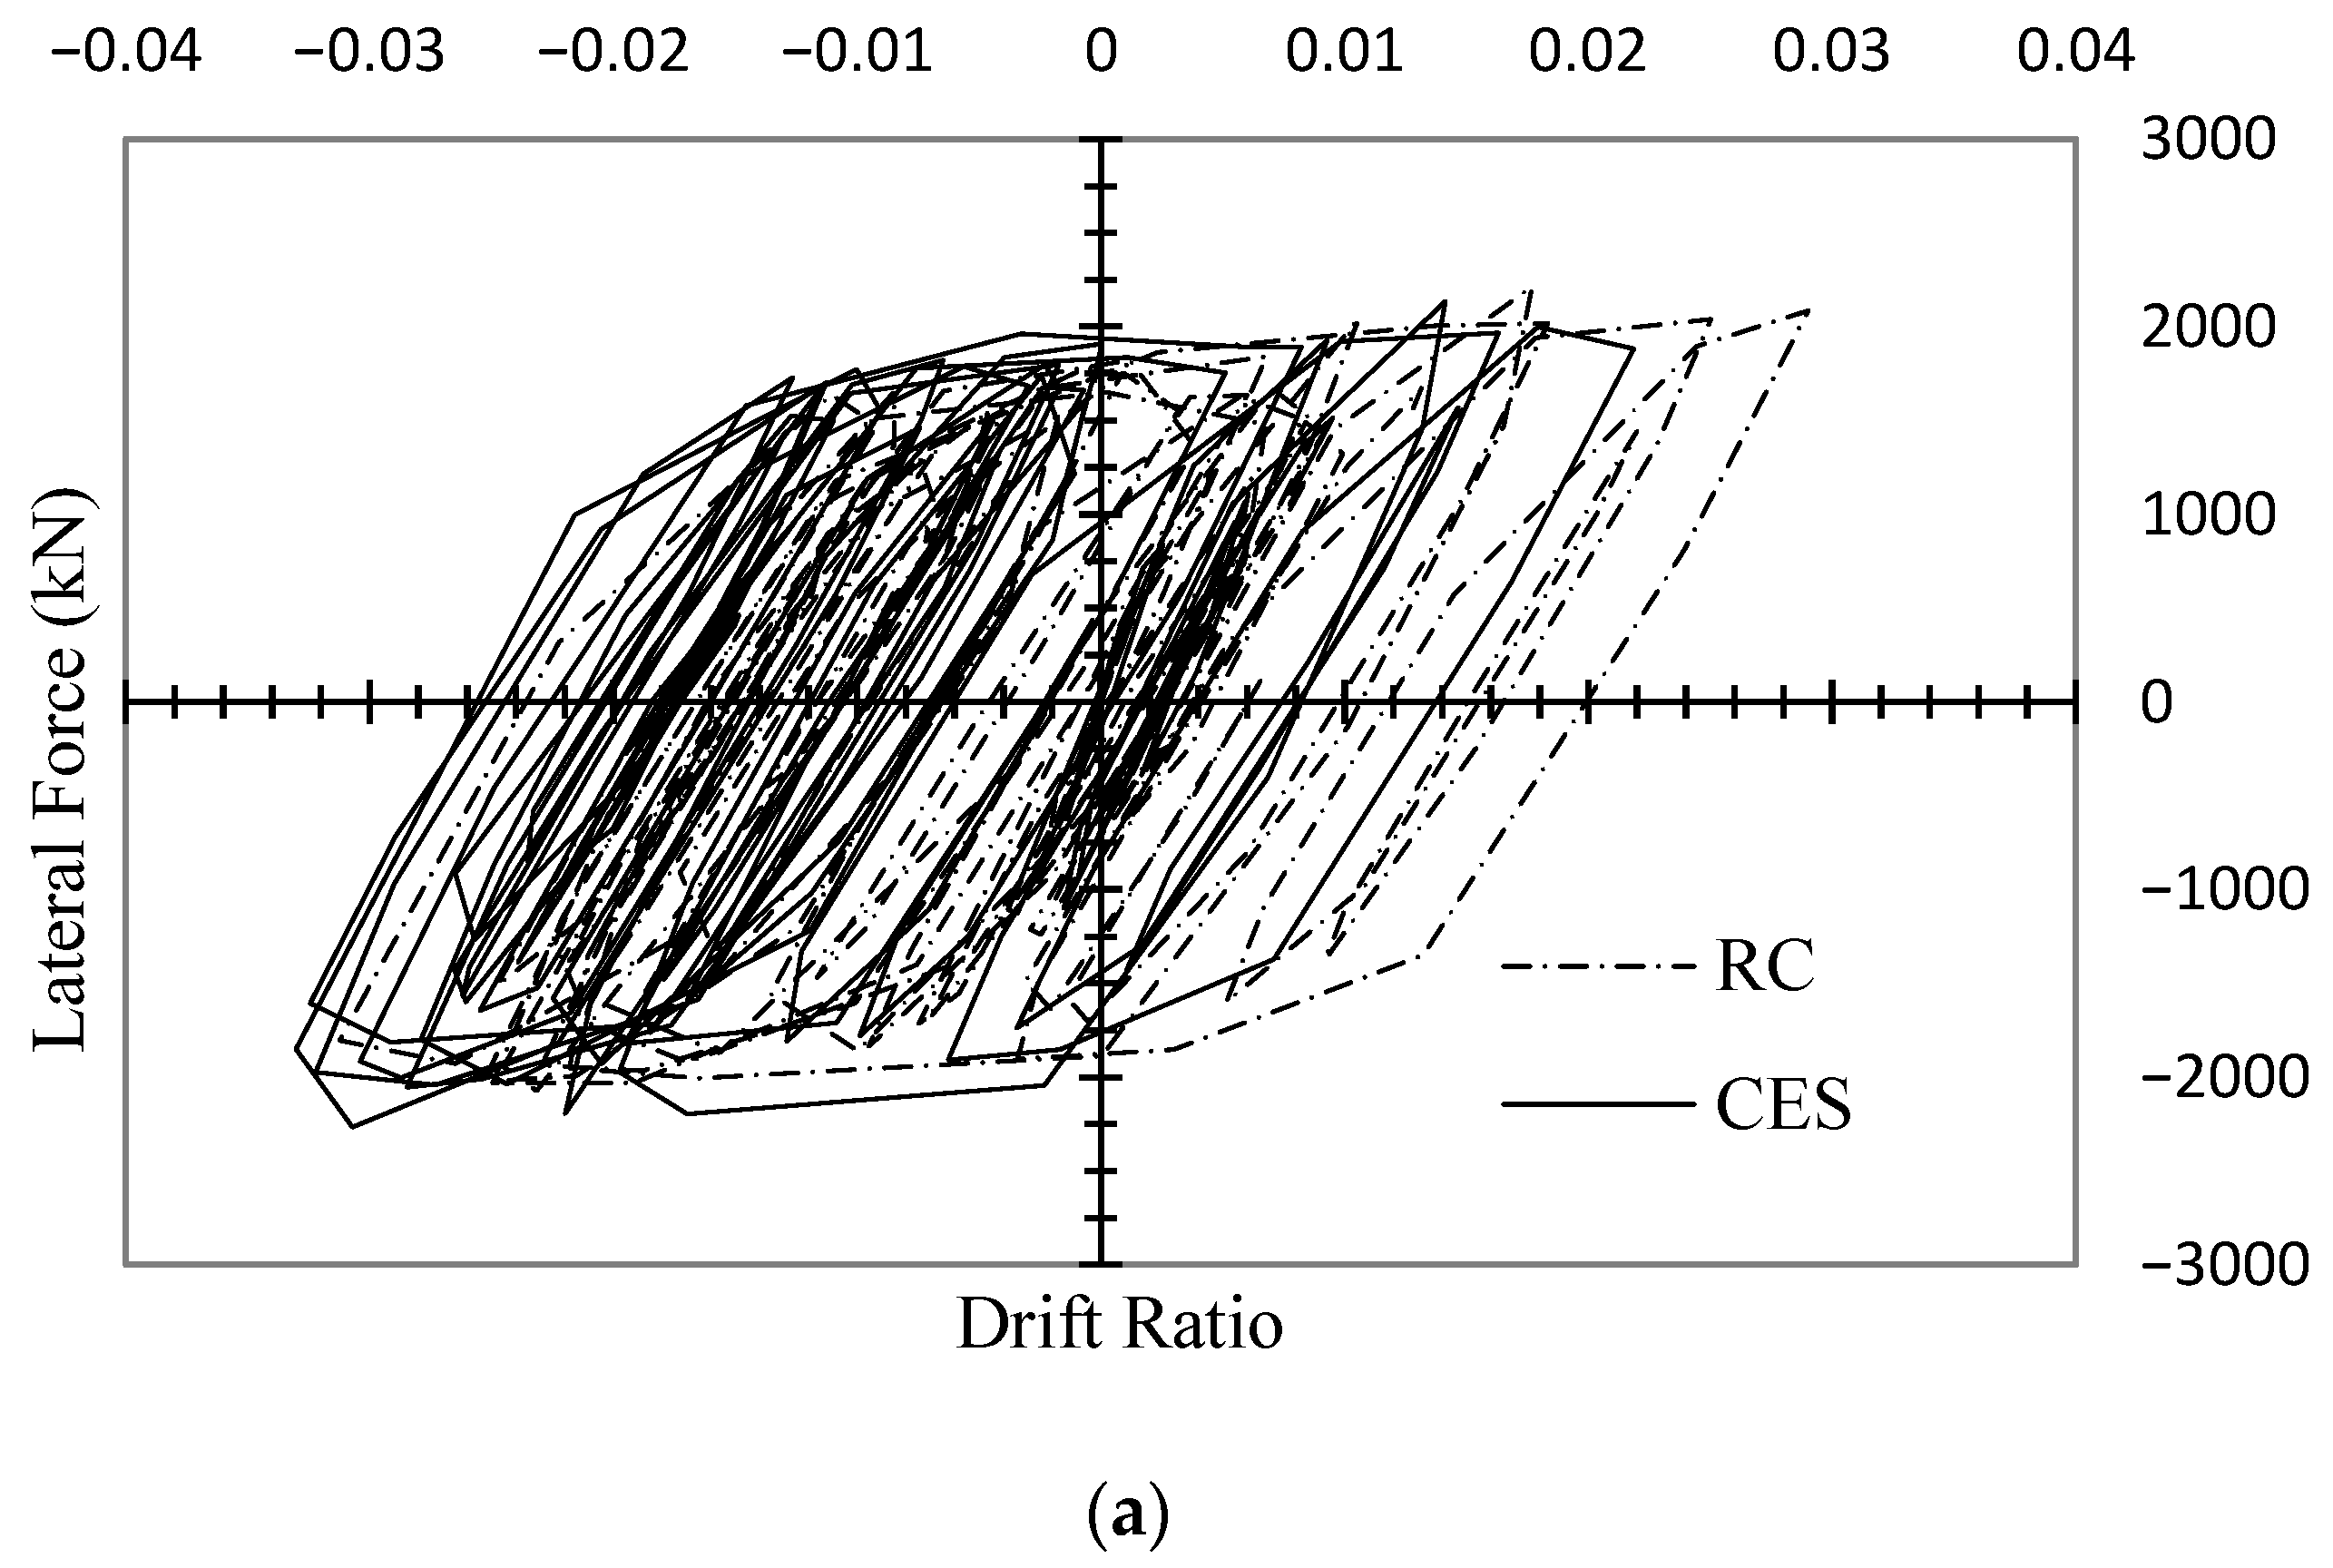
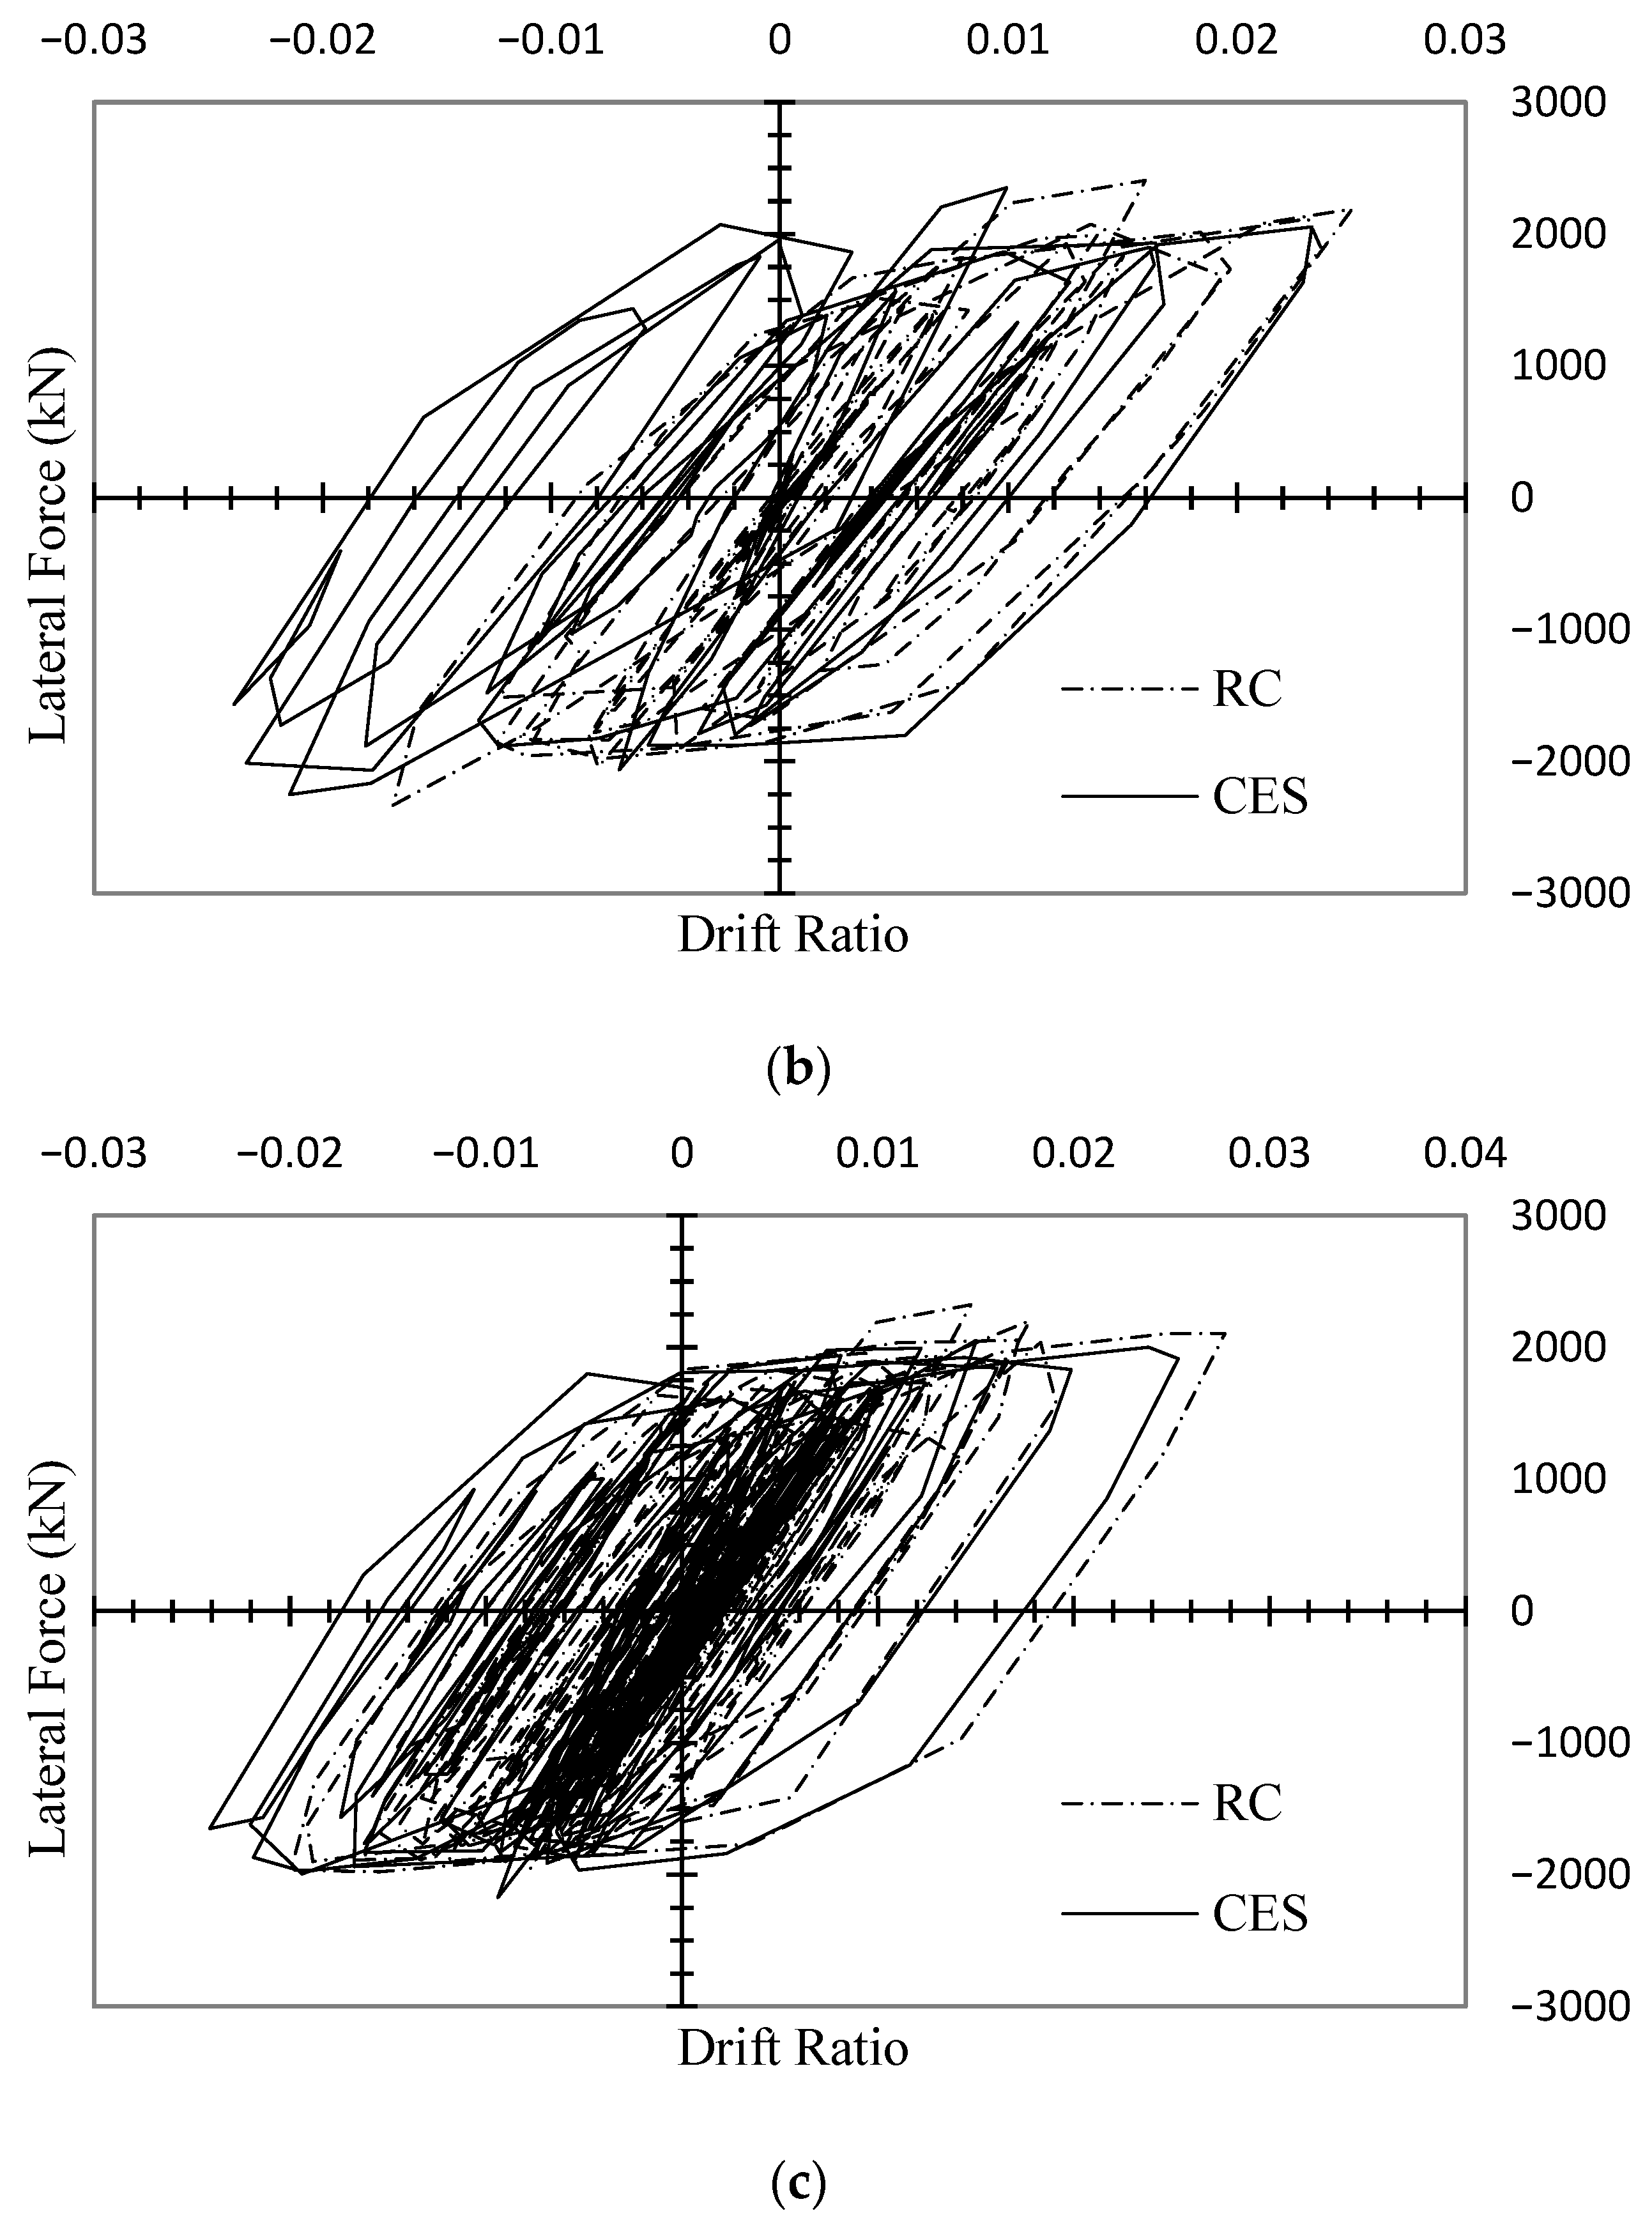
The hysteretic behavior of the bridge columns was evaluated by analyzing the lateral force versus drift ratio relationships under specific seismic excitations representing the three distinct source mechanisms. Figure 9 presents the comparative response for the Landers (Crustal), Anchorage (Subcrustal), and Maule-1 (Subduction) records.
To quantitatively evaluate hysteretic stability and low-cycle fatigue resilience under extended ground motion durations, numerical performance indices, including peak base shear (Fmax), peak drift ratio (Δmax), secant stiffness (Ksec), cumulative loop energy (Eloop), and peak equivalent viscous damping (ξeq), were calculated directly from the raw time-history output. Following established performance-based earthquake engineering formulation, the equivalent viscous damping ratio (ξeq) was calculated on the primary peak displacement cycle using Jacobsen’s expression (2):
ξ e q = E l o o p 2 π × F m a x × Δ m a x
where Eloop represents the area enclosed by the force–displacement hysteresis loop during the primary peak response cycle. Table 6 summarizes these quantitative hysteretic metrics across all three ground motion events.
Under the Landers crustal event (Figure 9a), while both sections exhibit comparable primary peak cycle damping (ξeq = 19.69% for CES vs. 20.33% for RC), the CES column maintains a fuller post-yield plastic plateau without the abrupt strength loss and pinching observed near the origin in the conventional RC pier. Under the Anchorage subcrustal event (Figure 9b), the CES pier achieved a peak equivalent viscous damping ratio of ξeq = 24.68%, significantly outperforming the RC column (ξeq = 7.48%) due to the unyielding embedded steel profile preventing loop pinching during peak excursions. Similarly, under the Maule-1 subduction record (Figure 9c), the CES system maintained higher primary cycle damping (ξeq = 17.24%) compared to the RC pier (ξeq = 15.55%) while extending stable post-yield energy dissipation across repeated cyclic reversals.
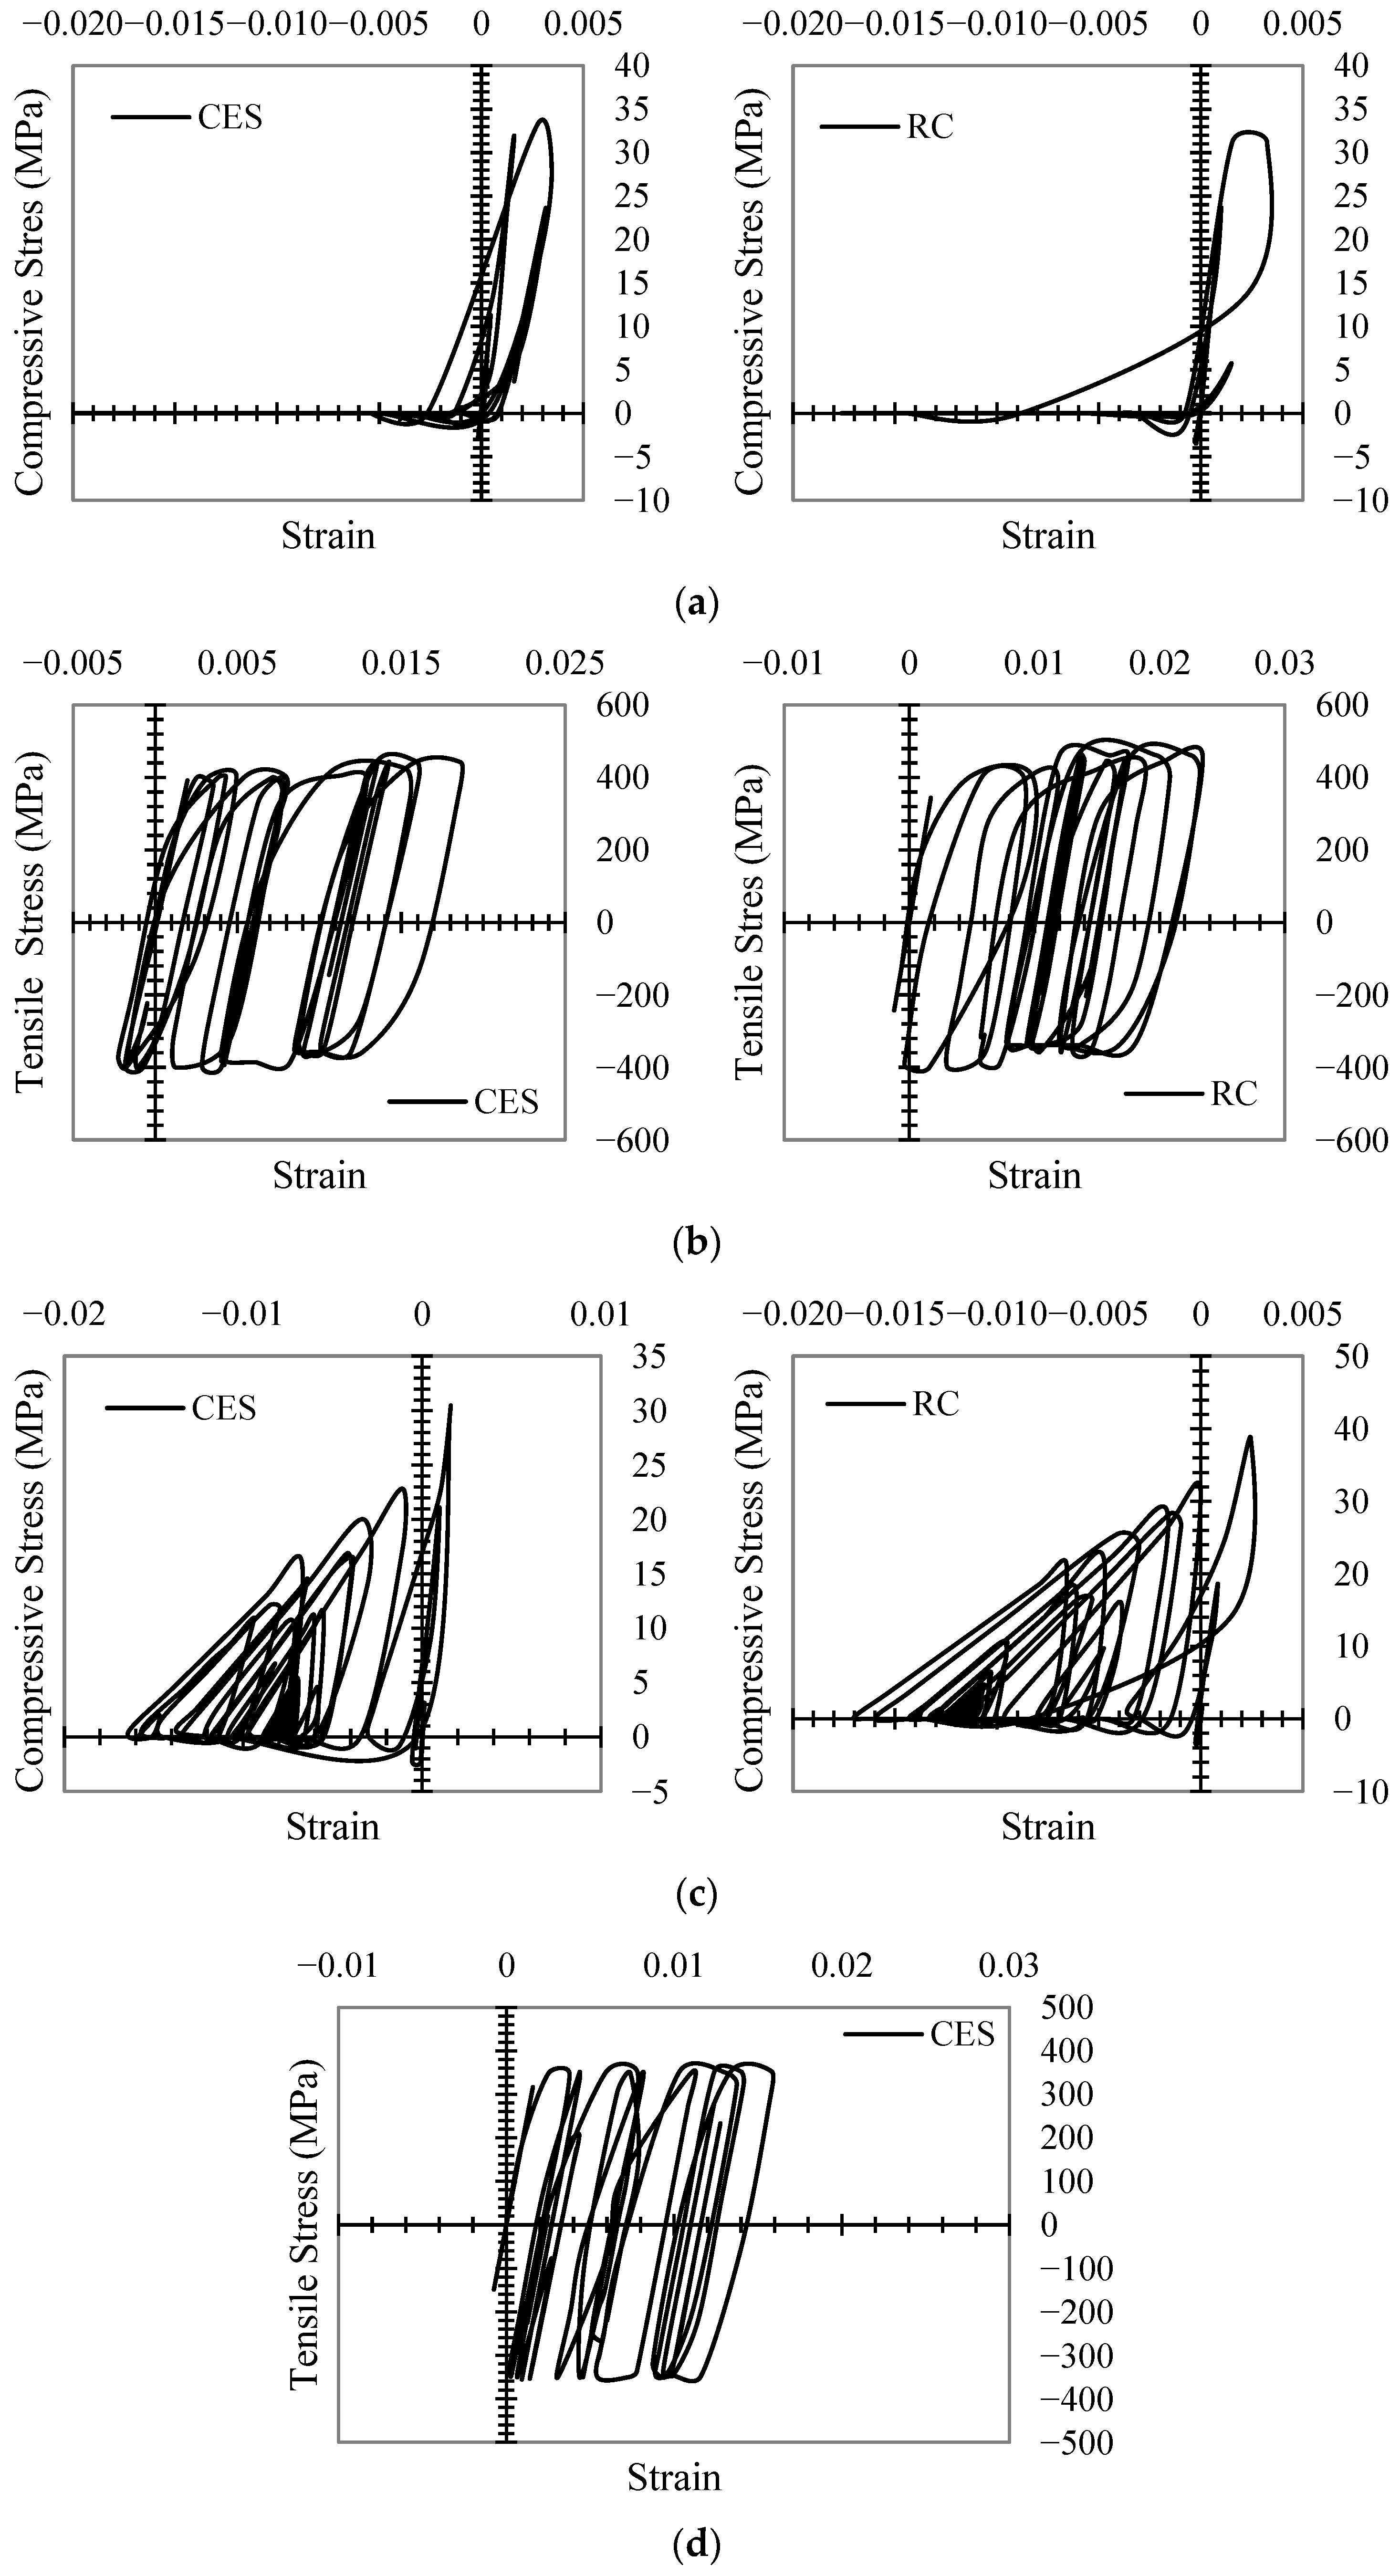
To understand these internal damage mechanisms more deeply, we isolated the stress–strain hysteretic response of the material fibers under the Anchorage subcrustal record. The concrete hysteresis loops reveal a subtle but important shift in how damage is distributed. While the RC core maintains its integrity up to a specific threshold, the concrete cover in the CES section reaches slightly higher peak strains. This indicates that the CES pier effectively sacrifices its outer surface to protect its heart (Figure 10a).
The most compelling evidence of CES superiority is seen in the Partially Confined Concrete (PCC) and the concrete core. While the RC core begins to show the early signs of “pinching” and stiffness degradation as the seismic cycles repeat, the PCC in the CES section remains remarkably stable, full, and robust, with hysteretic loops. This energy dissipation capacity remains consistent throughout the event, proving that the encased steel profile prevents the internal concrete from softening as rapidly as it does in a traditional RC design (Figure 10b).
The reinforcement behavior further supports this finding. The CES design effectively shields the longitudinal rebars from excessive inelastic demand. In the RC configuration, the rebars are subjected to wide hysteretic loops, reaching strains that approach the repairable limit. In contrast, the rebars in the CES section remain within a much narrower and more stable strain range because the primary energy dissipation is shifted to the encased structural steel (Figure 10c). Analysis of the steel I-section confirms that while it undergoes minor yielding, it remains largely within its elastic bounds throughout the event without significant plastic accumulation. This resilient internal ‘spine’ ensures the column retains its vertical load-carrying capacity (Figure 10d).

3.3. Global Pushover Response and Capacity Assessment

To further delineate the structural performance of the proposed systems, a non-linear static (pushover) analysis was conducted to establish the global capacity envelopes for both the RC and CES configurations. This analysis provides critical insights into the sequence of material degradation and the ultimate deformation limits of the bridge pier.

Capacity Curve Analysis

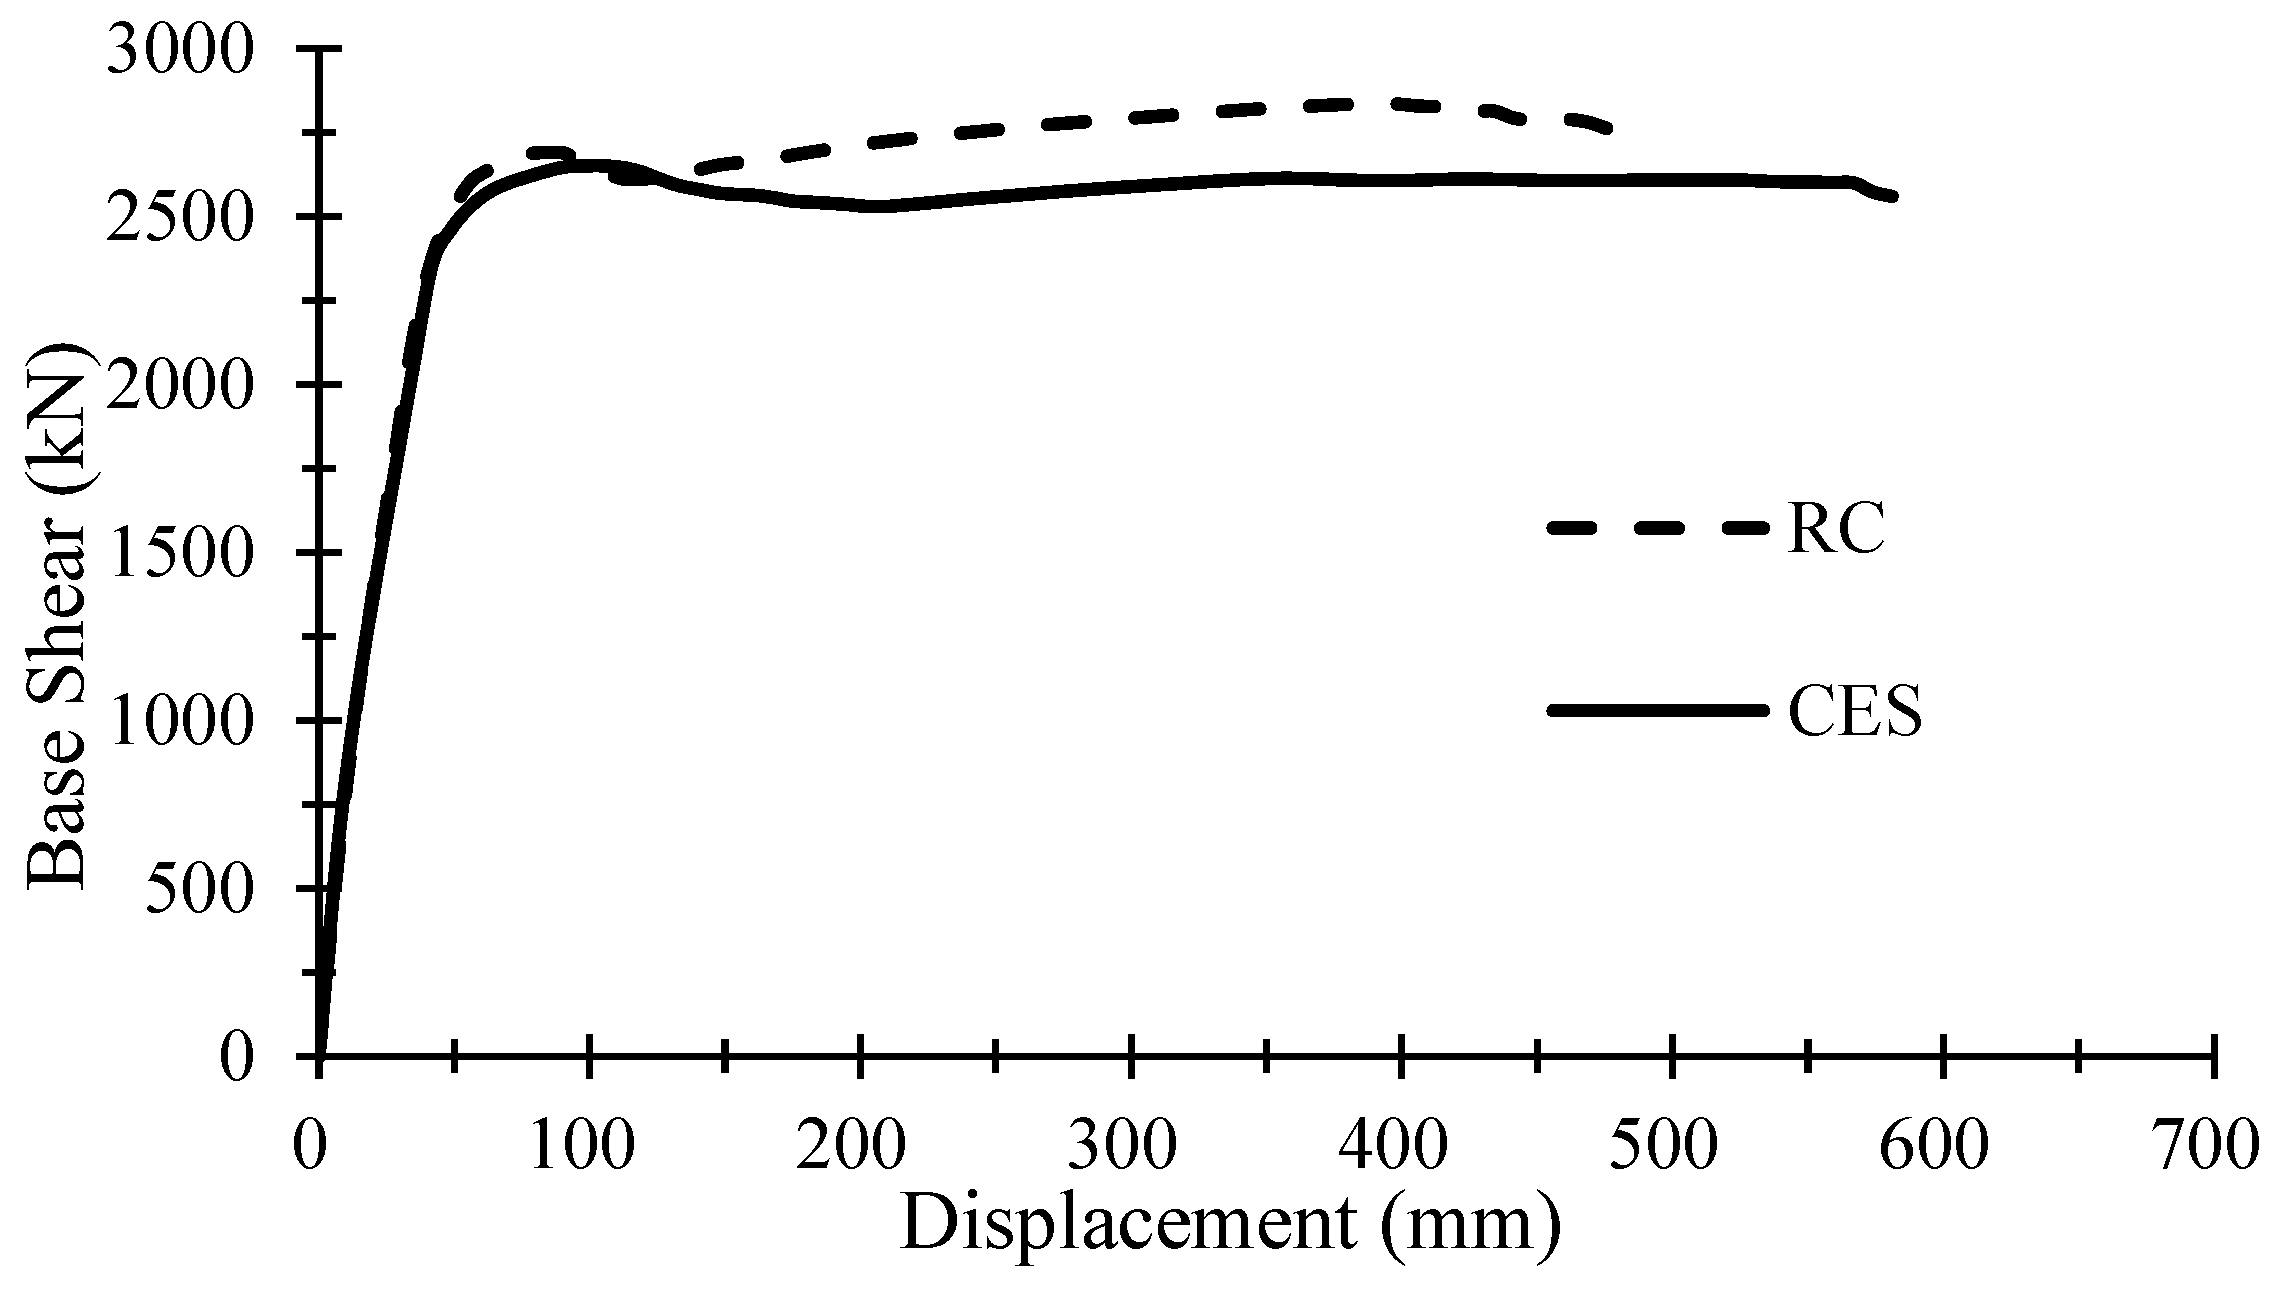
The resulting capacity curves, presented in Figure 11, illustrate a fundamental divergence in the failure mechanics of the two structural systems. RC Section Response: The traditional RC pier achieves a peak base shear of approximately 2800 kN. This higher initial strength is directly attributed to the heavy (3.2%) longitudinal reinforcement ratio required to meet Vancouver’s seismic demands. However, this strength is accompanied by a rapid loss of strength; the curve exhibits a sharp degradation starting at a displacement of 427 mm, corresponding to the catastrophic crushing of the concrete core. CES Section Response: While the CES pier exhibits a slightly lower peak capacity of approximately 2600 kN, it demonstrates vastly superior post-yield stability. The system maintains a long, stable plastic plateau extending beyond 574 mm, a 34% increase in deformation capacity over the RC counterpart. This behavior confirms that the encased steel profile functions as a redundant “fail-safe” spine, preserving vertical and flexural integrity long after the concrete core has reached its initial softening point.
To ensure an objective and consistent comparison between the two structural systems, the ultimate lateral displacement (Δu) on the capacity curves was determined based on a unified physical failure criterion. For both the RC and CES pier configurations, ultimate displacement was defined at the onset of confined core concrete crushing, corresponding to the instant when the innermost core concrete fibers reached their ultimate compressive strain limit (εcu). Neither section experienced a 20% drop in lateral strength before core crushing. Because both configurations were evaluated against this identical physical limit state (εc = εcu), the comparison confirms that the embedded structural steel profile directly enhances core confinement efficiency, delaying core crushing and yielding a genuine 34% increase in usable ultimate deformation capacity.
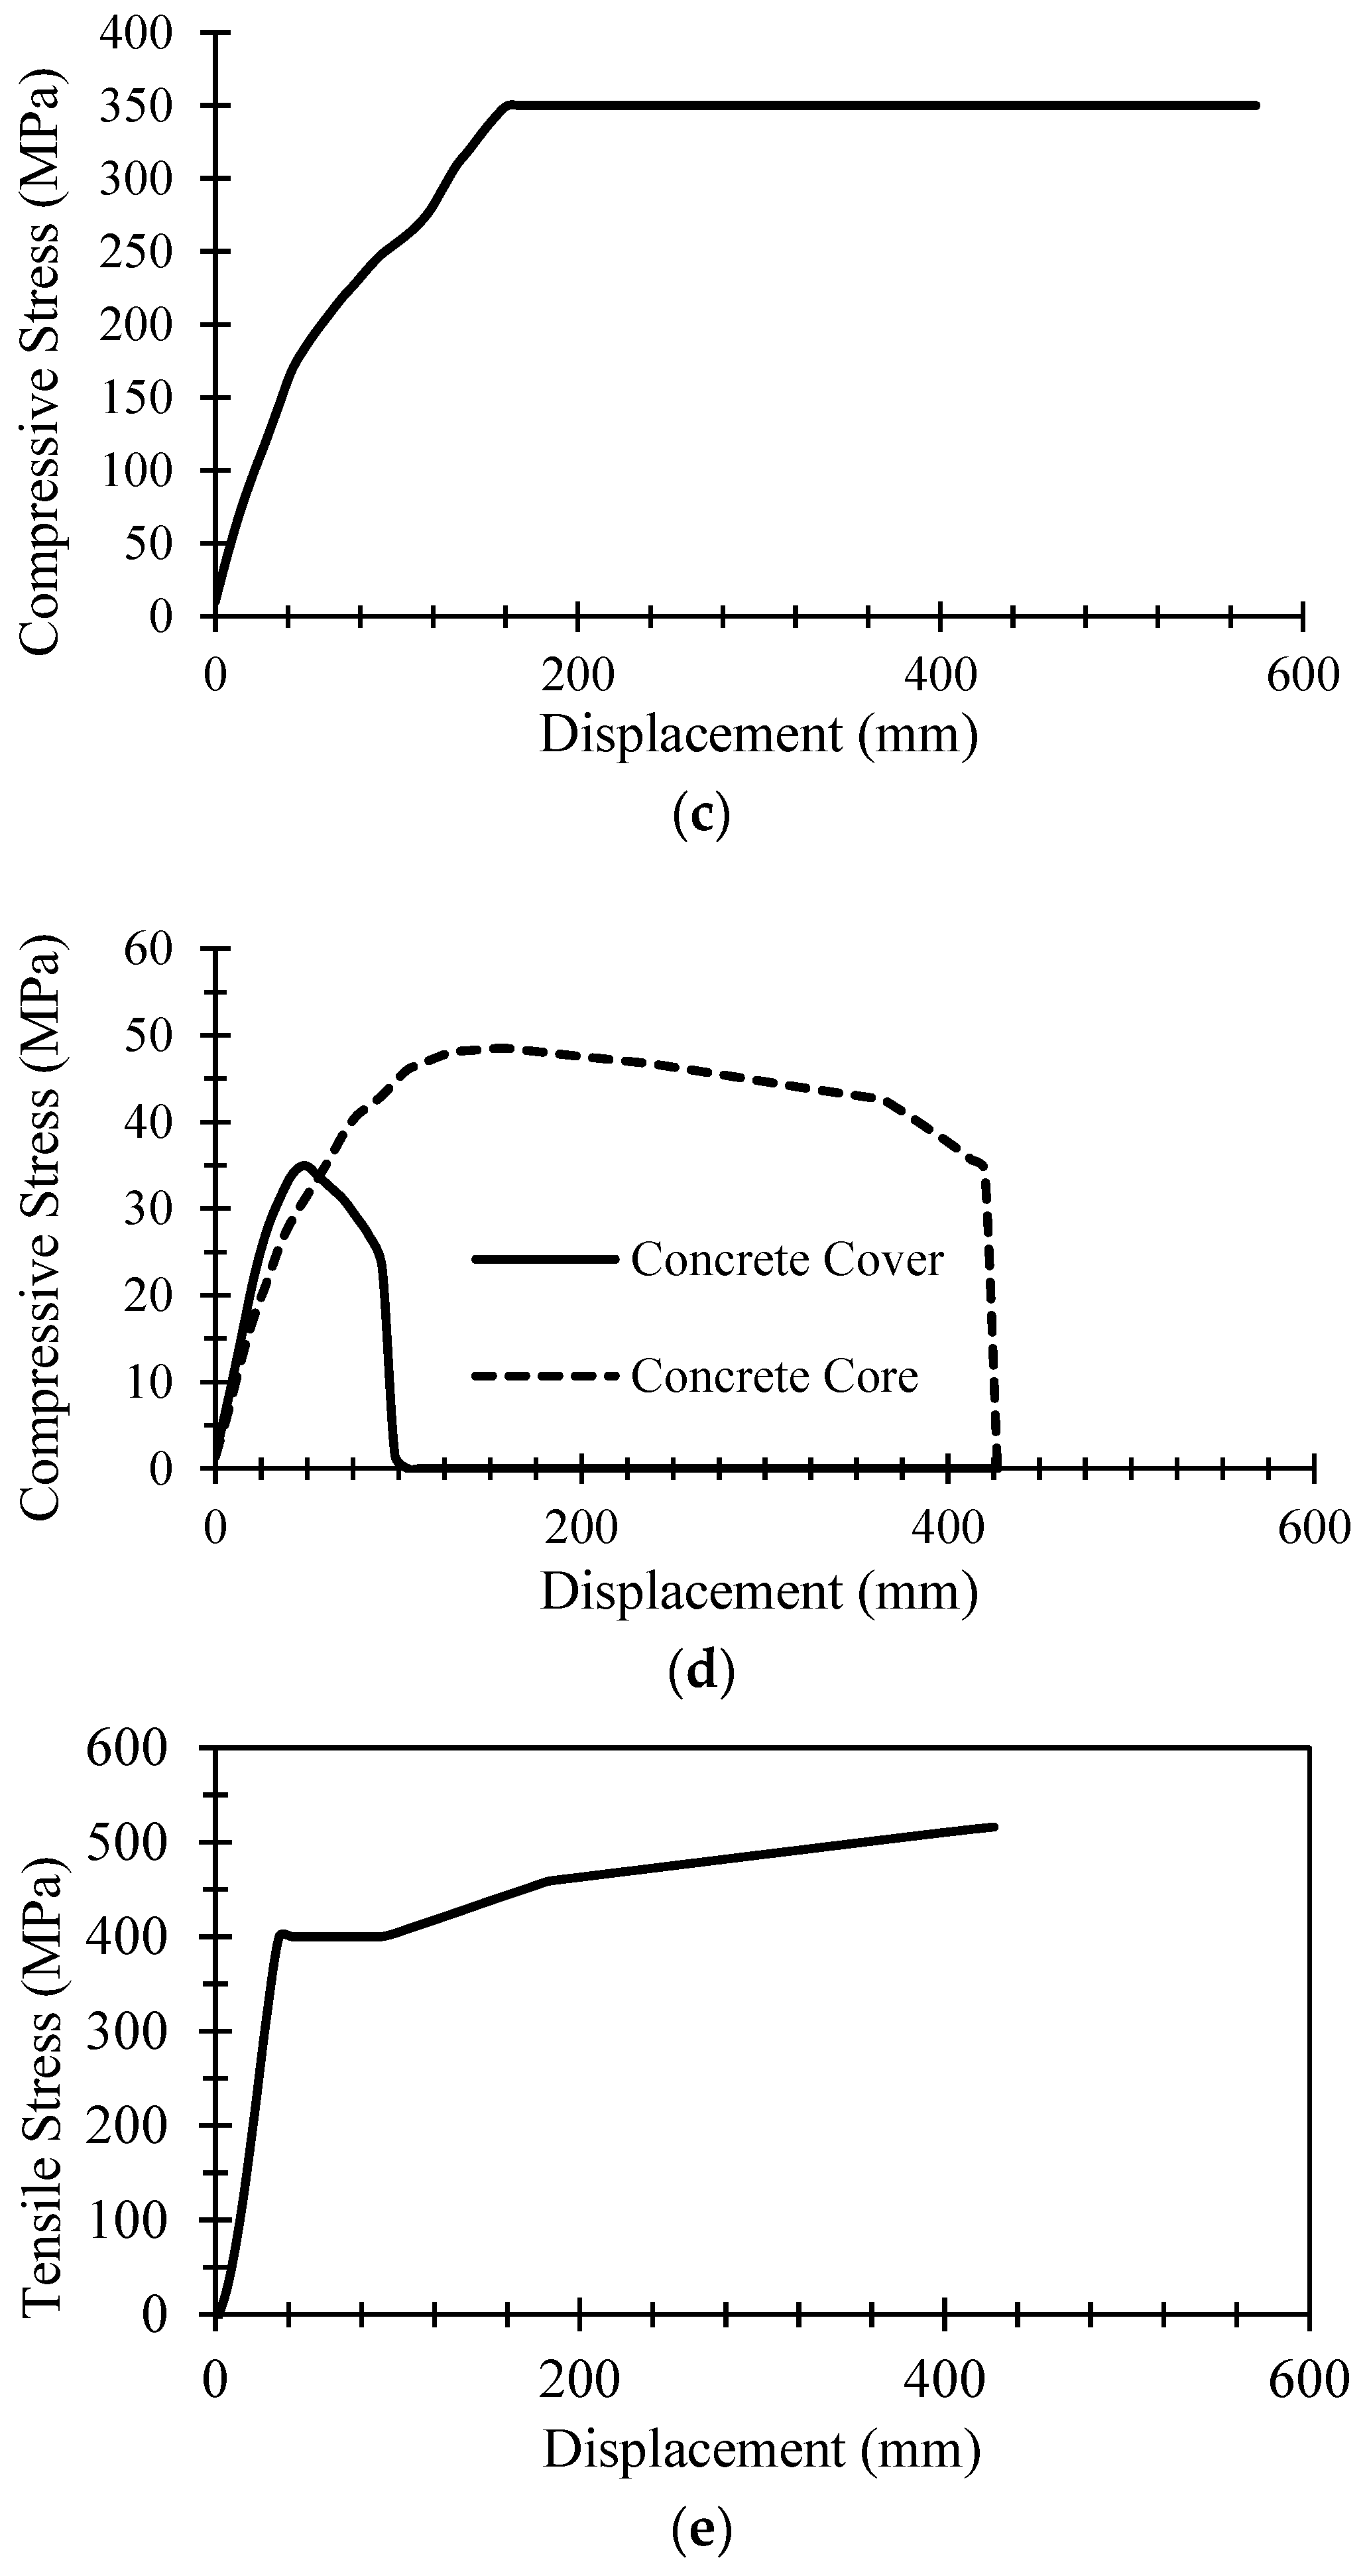
To understand the specific material transitions driving the global capacity loss seen in the pushover curves, we examined the stress–displacement paths of the most critically strained fibers in the plastic hinge. The RC section follows a traditional failure path characterized by abrupt concrete degradation. As shown in Figure 12d, the unconfined cover spalls early at roughly 120 mm. Consequently, the heavily reinforced core absorbs the remaining demand, peaking at 49 MPa before crushing catastrophically at 427 mm. Although the longitudinal rebar (Figure 12e) undergoes stable strain hardening, its full ductility is never realized; the system’s capacity is cut short by the concrete core’s inability to sustain further compression.
Conversely, the CES section employs a more resilient failure mechanism facilitated by internal stress redistribution. While the cover spalls similarly at 120 mm (Figure 12a), the behavior of the internal concrete is fundamentally different. The partially confined concrete (PCC) maintains a steady, resilient plateau until ultimate failure at 574 mm. This extended stability is a direct result of the encased steel profile. As seen in Figure 12c, the steel flange yields and remains perfectly plastic, acting as an unyielding spine that enforces “dual confinement” alongside the spirals. This architectural synergy prevents explosive spalling and allows the CES pier to sustain nearly 150 mm of additional lateral drift compared to the RC section. Meanwhile, on the tension face (Figure 12b), the structural steel and the longitudinal reinforcement yield sequentially before transitioning into stable strain hardening. This staggered response ensures a distributed tensile capacity that persists at high drift levels. Ultimately, the local fiber data confirms that while the RC column is fundamentally limited by the localized compressive failure of its core, the CES column leverages its embedded steel profile to bridge early local damage. By locking the concrete core in a superior state of triaxial confinement, the I-section prevents explosive spalling and extends the pier’s survivability by nearly 150 mm of additional lateral drift compared to the RC section.

4. Conclusions

The seismic resilience of our critical transportation networks depends on structural systems that can survive extreme events and remain functional. This study evaluated the potential of circular concrete-encased steel (CES) columns as an alternative to traditional reinforced concrete (RC) for lifeline bridges in Vancouver’s complex seismic environment. By subjecting both designs to a rigorous suite of crustal, subcrustal, and subduction ground motions, several key findings emerged regarding their performance and long-term viability:
A Reliable “Fail-Safe”: The internal steel core in the CES system effectively serves as a permanent, unyielding spine. Even as the concrete core reaches its initial softening point, this internal member preserves flexural integrity, providing a 34% higher deformation capacity (574 mm) than the RC design (427 mm).
Protecting the Core Components: During rare 2475-year seismic events, the CES configuration successfully shielded the longitudinal reinforcement, reducing its demand by 16% compared to RC. This reduction in strain translates directly to less localized degradation and a faster path to post-disaster recovery.
Immediate Functionality: For 975-year “Service Immediate” events, the structural steel I-section remained entirely elastic. This ensures that the primary vertical load-carrying spine survives moderate shaking without cumulative damage, which is vital for keeping emergency routes open.
Practicality and Construction: High-seismic RC pier designs frequently suffer from severe rebar congestion (3.2% longitudinal ratio in this study), which obstructs concrete aggregate flow and increases honeycombing risks. The CES configuration uses only 0.5% longitudinal rebar alongside an embedded Grade 350W steel core. While formal economic optimization depends on regional fabrication, steel unit prices, and erection costs, substituting congested rebar cages with an embedded steel core significantly enhances field constructability, improves concrete compaction quality, and ensures high structural reliability in critical transportation infrastructure.
This research confirms that circular CES piers are a powerful and practical evolution for the next generation of lifeline bridges. While our numerical models, validated against existing rectangular datasets, show clear benefits, the unique “dual confinement” of circular CES sections requires further investigation. To support future code provisions (e.g., CSA S6), dedicated physical testing on full-scale circular CES bridge columns subjected to cyclic loading is recommended to precisely calibrate dual-confinement factors, characterize plastic hinge behavior, and finalize the regulatory guidelines needed for widespread adoption in the Canadian code.

Author Contributions

Conceptualization, M.K. and M.H.; methodology, M.K. and M.H.; writing—original draft preparation, M.K.; writing—review and editing, M.H.; supervision, M.H. All authors have read and agreed to the published version of the manuscript.

Funding

The authors acknowledge the support of the Natural Sciences and Engineering Research Council of Canada (NSERC) through a Discovery Grant [Grant Number: CRSNG RGPIN-2024-04009].

Data Availability Statement

Data are available upon request from the corresponding author.

Conflicts of Interest

The authors declare no conflicts of interest.

References

  1. Kenarkoohi, M.; Hassan, M. Review of Accelerated Construction of Bridge Piers—Methods and Performance. Adv. Bridge Eng. 2024, 5, 3. [Google Scholar] [CrossRef] [Scilit]
  2. CSA S6:19; Canadian Highway Bridge Design Code. Canadian Standards Association CSA: Toronto, ON, Canada, 2019.
  3. CSA S6:25; Canadian Highway Bridge Design Code. Canadian Standards Association CSA Group: Toronto, ON, Canada, 2025.
  4. Ashtari, S. Evaluating the Performance-Based Seismic Design of RC Bridges According to the 2014 Canadian Highway Bridge Design Code. Ph.D. Thesis, University of British Columbia, Vancouver, BC, Canada, 2018. [Google Scholar]
  5. British Columbia Ministry of Transportation and Infrastructure. Bridge Standards and Procedures Manual: Volume 1—Supplement to CHBDC S6:19; BC Ministry of Transportation and Infrastructure: Victoria, BC, Canada, 2025; Volume 1. [Google Scholar]
  6. Shen, Y.; El Naggar, M.H.; Zhang, D.-M.; Huang, Z.-K.; Du, X. Seismic Resilience Assessment of Shield Tunnel Linings in Sites Susceptible to Liquefaction. Soil Dyn. Earthq. Eng. 2026, 207, 110320. [Google Scholar] [CrossRef] [Scilit]
  7. Zhao, X.; Wen, F.; Chan, T.-M.; Cao, S. Theoretical Stress–Strain Model for Concrete in Steel-Reinforced Concrete Columns. J. Struct. Eng. 2019, 145, 04019009. [Google Scholar] [CrossRef] [Scilit]
  8. Chen, C.-C.; Lin, N.-J. Analytical Model for Predicting Axial Capacity and Behavior of Concrete Encased Steel Composite Stub Columns. J. Constr. Steel Res. 2006, 62, 424–433. [Google Scholar] [CrossRef] [Scilit]
  9. Ellobody, E.; Young, B. Numerical Simulation of Concrete Encased Steel Composite Columns. J. Constr. Steel Res. 2011, 67, 211–222. [Google Scholar] [CrossRef] [Scilit]
  10. Chen, S.; Wu, P. Analytical Model for Predicting Axial Compressive Behavior of Steel Reinforced Concrete Column. J. Constr. Steel Res. 2017, 128, 649–660. [Google Scholar] [CrossRef] [Scilit]
  11. Ricles, J.M.; Paboojian, S.D. Seismic Performance of Steel-Encased Composite Columns. J. Struct. Eng. 1994, 120, 2474–2494. [Google Scholar] [CrossRef] [Scilit]
  12. El-Tawil, S.; Deierlein, G.G. Strength and Ductility of Concrete Encased Composite Columns. J. Struct. Eng. 1999, 125, 1009–1019. [Google Scholar] [CrossRef] [Scilit]
  13. Campian, C.; Nagy, Z.; Pop, M. Behavior of Fully Encased Steel-Concrete Composite Columns Subjected to Monotonic and Cyclic Loading. Procedia Eng. 2015, 117, 439–451. [Google Scholar] [CrossRef] [Scilit]
  14. Lai, B.; Richard Liew, J.Y.; Wang, T. Buckling Behaviour of High Strength Concrete Encased Steel Composite Columns. J. Constr. Steel Res. 2019, 154, 27–42. [Google Scholar] [CrossRef] [Scilit]
  15. Naito, H.; Akiyama, M.; Suzuki, M. Ductility Evaluation of Concrete-Encased Steel Bridge Piers Subjected to Lateral Cyclic Loading. J. Bridge Eng. 2011, 16, 72–81. [Google Scholar] [CrossRef] [Scilit]
  16. Mattock, A.H. Rotational Capacity of Hinging Regions in Reinforced Concrete Beams. Spec. Publ. 1965, 12, 143–181. [Google Scholar]
  17. Roeder, C.W.; Lehman, D.E.; Stephens, M. Concrete-Filled Steel Tubes for Accelerated Bridge Construction. Transp. Res. Rec. 2014, 2406, 49–58. [Google Scholar] [CrossRef] [Scilit]
  18. Qian, W.-W.; Li, W.; Han, L.-H.; Zhao, X.-L. Analytical Behavior of Concrete-Encased CFST Columns under Cyclic Lateral Loading. J. Constr. Steel Res. 2016, 120, 206–220. [Google Scholar] [CrossRef] [Scilit]
  19. Anwaar, O.; Schäfer, M.; Zhang, Q. Non-Linear Analysis of Circular Composite Columns. ce/papers 2021, 4, 691–699. [Google Scholar] [CrossRef] [Scilit]
  20. Behnam, A.; Denavit, M.D. Behavior and Design of Steel-Concrete Composite Columns Subjected to Combined Axial Compression and Biaxial Moment. J. Struct. Eng. 2021, 147, 04021113. [Google Scholar] [CrossRef] [Scilit]
  21. Kenarkoohi, M.; Hassan, M. Seismic Performance of Circular Concrete-Encased Steel Columns for Bridges. Can. J. Civ. Eng. 2025, 52, 2289–2306. [Google Scholar] [CrossRef] [Scilit]
  22. ANSI/AISC 360-22; Specification for Structural Steel Buildings. American Institute of Steel: Chicago, IL, USA, 2022.
  23. Paulay, T.; Priestley, M.N. Seismic Design of Reinforced Concrete and Masonry Buildings; John Wiley & Sons: New York, NY, USA, 1992. [Google Scholar]
  24. Mander, J.B.; Priestley, M.J.; Park, R. Theoretical Stress-Strain Model for Confined Concrete. J. Struct. Eng. 1988, 114, 1804–1826. [Google Scholar] [CrossRef] [Scilit]
  25. Tremblay, R.; Atkinson, G.M.; Bouaanani, N.; Daneshvar, P.; Léger, P.; Koboevic, S. Selection and Scaling of Ground Motion Time Histories for Seismic Analysis Using NBCC 2015. In Proceedings of the 11th Canadian Conference on Earthquake Engineering (11CCEE), Victoria, BC, Canada, 21–24 July 2015. [Google Scholar]
  26. Al Atik, L.; Abrahamson, N. An Improved Method for Nonstationary Spectral Matching. Earthq. Spectra 2010, 26, 601–617. [Google Scholar] [CrossRef] [Scilit]
  27. Hsu, H.-L.; Jan, F.-J.; Juang, J.-L. Performance of Composite Members Subjected to Axial Load and Bi-Axial Bending. J. Constr. Steel Res. 2009, 65, 869–878. [Google Scholar] [CrossRef] [Scilit]
Figure 1. Cross-section of the bridge and transversal view of the pier © M. Hassan, ETS.
Civileng 07 00054 g001
Figure 2. Detailed cross-sectional configuration of (a) conventional RC pier and (b) Concrete-Encased Steel (CES) pier © M. Hassan, ETS.
Civileng 07 00054 g002
Figure 3. Moment-Rotation response of the bridge column.
Civileng 07 00054 g003
Figure 4. Constitutive stress–strain relationships (f’c = 35 MPa) for: (a) concrete regions labeled with their respective analytical constraint models (Mander et al. [24] for RC cover/core; Zhao et al. [7]/Chen and Wu [10] for CES PCC/HCC); (b) reinforcing steel (Grade 400W) and structural steel (Grade 350W) components.
Civileng 07 00054 g004
Figure 5. Fibers in the RC section.
Civileng 07 00054 g005
Figure 6. Fibers in the CES section: (a) concrete cover and longitudinal rebars and partially confined concrete, (b) highly confined concrete, and (c) flanges and web of steel I-section.
Civileng 07 00054 g006
Figure 7. Response spectra of the 11 spectrally matched ground motion records along with the target 2%/50-year Uniform Hazard Spectrum (UHS) for Vancouver, BC.
Civileng 07 00054 g007
Figure 8. Force–displacement response derived from the numerical simulation in CSiBridge v26 Software and experimental study data from [27].
Civileng 07 00054 g008
Figure 9. Lateral force versus drift ratio diagram for both CES and RC columns from three-time history records: (a) Landers; (b) Anchorage; (c) Maule-1.
Civileng 07 00054 g009aCivileng 07 00054 g009b
Figure 10. Stress–strain hysteresis of different material components under the Anchorage time-history record: (a) concrete cover; (b) reinforcement bar; (c) PCC and concrete core; (d) steel section.
Civileng 07 00054 g010
Figure 11. Comparative Pushover Capacity Curves: Global Base Shear vs. Lateral Displacement for RC and CES Configurations.
Civileng 07 00054 g011
Figure 12. Constitutive stress–displacement relationships for CES and RC pier sections: (a) concrete cover and Partially Confined Concrete (PCC) in CES; (b) structural steel and longitudinal rebar in tension (CES); (c) steel flange in compression (CES); (d) concrete cover and confined core (RC); (e) longitudinal rebar (RC).
Civileng 07 00054 g012aCivileng 07 00054 g012b
Table 1. Seismic records and their properties.
Record NameTypeYear, LocationMwR (km)
Chi-ChiCrustal1999, Taiwan7.614
El MayorCrustal2010, Mexico7.214
LandersCrustal1992, California, US7.310
NorthridgeCrustal1994, California, US6.717
Miyagi OkiSubcrustal2005, Japan7.267
NisquallySubcrustal2001, Washington, US6.857
AnchorageSubcrustal2018, Alaska, US7.159
Maule-1Subduction2010, Chile8.8109
Maule-2Subduction2010, Chile8.8171
Tohoku-1Subduction2011, Japan9.0174
Tohoku-2Subduction2011, Japan9.0177
Table 2. Mean of maximum strains in the RC section (2% in 50 years).
Events TypeReinforcement
×10−3
Concrete Cover
×10−3
(Compressive)
Concrete Core
×10−3
(Compressive)
Crustal22.73.52.2
Subcrustal26.85.64.1
Subduction25.64.43.3
Average24.84.43.1
Table 3. Mean of maximum strains in the CES section (2% in 50 years).
Events TypeReinforcement
×10−3
Steel Section
×10−3
Concrete Cover
×10−3
(Compressive)
Concrete Core
×10−3
(Compressive)
Crustal17.414.24.33.2
Subcrustal24.019.65.33.6
Subduction21.618.73.52.6
Average20.717.54.33.1
Table 4. Mean of maximum strains in the RC section (5% in 50 years).
Events TypeReinforcement
×10−3
Concrete Cover
×10−3
(Compressive)
Concrete Core
×10−3
(Compressive)
Crustal10.32.62.0
Subcrustal11.33.22.2
Subduction11.22.71.9
Average10.92.82.0
Table 5. Mean of maximum strains in the CES section (5% in 50 years).
Events TypeReinforcement
×10−3
Steel Section
×10−3
Concrete Cover
×10−3
(Compressive)
Concrete Core
×10−3
(Compressive)
Crustal10.79.12.62.0
Subcrustal9.78.12.72.1
Subduction11.911.82.62.1
Average10.89.82.72.1
Table 6. Quantitative hysteretic response metrics extracted from time-history analyses.
Record NameHazard TypeSystemFmax (kN)ΔmaxKsec (kN/mm)Eloop (kN·m)ξeq (%)
LandersCrustalRC2213.500.031211.81529.7220.33%
CES2266.560.033011.44555.4919.69%
AnchorageSubcrustalRC2407.250.025016.02169.877.48%
CES2352.150.023916.41522.7924.68%
Maule-1SubductionRC2323.040.027713.97377.6115.55%
CES2174.330.025314.30358.1117.24%
Disclaimer/Publisher’s Note: The statements, opinions and data contained in all publications are solely those of the individual author(s) and contributor(s) and not of MDPI and/or the editor(s). MDPI and/or the editor(s) disclaim responsibility for any injury to people or property resulting from any ideas, methods, instructions or products referred to in the content.