Article

Temporal and Spatial Changes in Crop Patterns, Use of Inputs and Hydrological Alteration in the Case of Fogera Floodplain, Ethiopia

1
Ethiopian Institute of Architecture, Building Construction, and City Development, Addis Ababa University, Addis Ababa P.O. Box 518, Ethiopia
2
Water and Land Resource Center (WLRC), Addis Ababa University, Addis Ababa P.O. Box 3880, Ethiopia
3
College of Agriculture, Biotechnology and Natural Resources, University of Nevada, Reno, NV 89557-0222, USA
4
Amhara Design and Supervision Works Enterprise, Bahir Dar P.O. Box 1921, Ethiopia
*
Author to whom correspondence should be addressed.
Ecologies 2021, 2(4), 380-396; https://doi.org/10.3390/ecologies2040022
Submission received: 25 September 2021 / Revised: 20 November 2021 / Accepted: 8 December 2021 / Published: 13 December 2021

Abstract

:
More than half of the world’s population consumes rice. Recently, the area sown with modern rice varieties has expanded, and the use of chemical fertilizers and pesticides has increased in various countries. Wetland hydrology is also influenced by chemical and physical characteristics. Hence, this research focused on temporal and spatial changes in crop patterns, input usage, and hydrology in the Ethiopian Fogera floodplain, with the following objectives: (a) What are the spatial and temporal trends in crop production patterns? (b) What input changes have occurred to produce rice and other crops? (c) What hydrological changes have occurred in the area with intensification of production systems? Primary data were gathered through a questionnaire, focus group discussions, interviews, and field observations. Secondary data were obtained from Landsat imageries, the SWAT model, water flow measurements, and normalized difference vegetation index (NDVI). NDVI results indicated that the area cultivated for rice is increasing while the area of other crops is decreasing. Agricultural inputs are used in rice systems but were not used before the introduction of rice. Recession farming activities have also diminished wetland areas. Water flow showed a decrease, whereas Nitrogen and Phosphorus showed an increase with Pearson’s correlation values −0.069 and −0.072, respectively. Flow of water was negatively correlated with N and P water concentration, whereas N and P contents were positively correlated. In conclusion, growth of intensive rice systems has had negative environmental consequences on wetland ecology. Therefore, policies to regulate and manage wetland uses are recommended.

1. Introduction

Rice feeds more than half of the world’s population, with 148 million hectares of land devoted to the crop yielding 519 million tons in 1991 [1] and 503.17 million tons in 2020/21, out of which Ethiopia predicted to produce 91,000 metric tons [2]. For millennia, wetlands, especially floodplains with fertile soils and abundant water, have been used for rice production. Wetlands have undeniably aided the development of many significant cultures around the world, but wetlands being drained and reclaimed for agriculture has become more widespread in the last 20 years. Globally, more than half of the floodplains have been lost, with the agricultural conversion being one of the primary causes of the ongoing wetland losses [3]. In addition, modern rice production has increased the use of fertilizer where rice receives around 10% of the total nitrogen fertilizer applied globally [4]. Furthermore, around half of the Catla (common carp) fish died when the ammonia concentration reached 29.4 mg NH3–N/L [4]. Chemical pesticides used to control rice pests (microbial diseases, weeds, nematodes, snails, insects, and rodents) resulted in significantly higher grain yields, but its accumulation brings environmental hazards [5].
The hydrology of the wetland, which is affected by soil, biota, and build-up materials, influences and determines the wetland’s characteristics and processes such as amount of oxygen in the soil, as well as the supply of nutrients and toxicants [6,7]. Longer periods of inundation can result in longer periods of anaerobic conditions and limit the plants’ survival [8]. A study in Vietnamese floodplain rice production revealed that intensive rice systems have negative long-term effects on the environment [9]. In addition, a study in Ethiopia found that drainage and cultivation of floodplain wetlands induce extreme spatial and temporal variations in the wetland groundwater linked in part to soil structural and chemical changes which affect hydraulic conductivity [10].
A noticeable and important change in streamflow characteristics such as magnitude, timing, frequency, length, and rate of change of flow is referred to as hydrological alteration [11]. When the usual amount of water entering a wetland is decreased or raised, or when the time of saturation and inundation is prolonged, the ecosystem changes to an upland system [11]. Rice necessitates long-term hydrological processes. Rainfed wetland rice in Ethiopia is grown in areas where there is standing water during the growing season. Because of their high biomass production, wetlands in Ethiopia’s Lake Tana region such as the Fogera floodplain have historically provided valuable feedstock for livestock, later being cultivated for rice production [12,13]. Wetlands play an important ecological and hydrological role in environmental protection, as well as providing residents with a range of environmental and socioeconomic benefits [14]. Like the Fogera floodplain wetlands, agriculture faces a major challenge in developing strategies to maintain production while reducing environmental impacts. The trade-off between crop production (such as rice) and water quality ecosystems services is one of the most serious issues facing agriculture, as well as interest in achieving win–win outcomes through ecosystem service management [15].
Achieving a global transition to sustainable farming would necessitate a concerted effort to respond to our population’s rapid growth without jeopardizing the environment’s integrity [16]. Reducing trade-offs between crop production, water quality, and habitats increase the likelihood of win–win outcomes [15]. Different studies in the Fogera floodplain such as impact of fertilizer on rainfed rice [17], profitability and market chain of rice [18], evaluation of hand-weeding on rice yield [19], and response of rice on different levels of fertilizer in determining optimal application [20] have overlooked environmental issues and trade-offs. More research is required to determine how trade-offs can be mitigated and whether the likelihood of win–win outcomes can be increased in agricultural landscape management to encourage win–win strategies [15].
Therefore, this research aims to identify temporal and spatial shifts in rice-cropping patterns, input levels, and linkages with hydrological alteration in the Fogera floodplain. The study first identified the spatial and temporal trends in crop production patterns in the area, then estimated inputs used in the past and present to produce rice and other crops, finally trying to link it to the hydrological alteration in both quantity and quality in the area.

2. Methods and Materials

2.1. Description of Study Area

Fogera Woreda is situated between latitudes 11°46′ and 11°59′ north and longitudes 37°33′ and 37°52′ east, at an altitude of 1774 to 2410 m above mean sea level and a mean annual rainfall of 1216 mm, with long rains from June to September. Lake Tana borders the district on the west (Figure 1). Fogera Woreda is one of the surplus crop-producing areas, with a high potential for rice production [21]. The overflow from Lake Tana and the two surrounding major rivers, Ribb and Gumara, are channeled through the Fogera floodplain. The Ribb River has a dam under construction since 2010 and although not operational it is commissioned to store water in 2020. In the study area, rice is planted on lower slopes where the water table rises to the surface for a long time during the cropping season. Rice is also irrigated with water diverted from streams in a drainage system’s upper reaches [13]. The Fogera floodplain has permanent wetlands which are assigned as biosphere reserve areas having roosting sites for migratory birds and spawning grounds for migratory fish species from Lake Tana [22].

2.2. Sampling and Data Collection

Questionnaires, interviews, focus group discussions (FGDs), and field observations were used to gather data. Sample Kebeles were chosen with purposive sampling among 27 Kebeles in Fogera Woreda which are rice producers and close to the lake and floodplain wetlands. Interviewees were chosen with random sampling together with development agents going into villages. The rice-producing 5 Kebeles closest to the Lake Tana Fogera floodplain were first identified. The analysis included all five Kebeles, with sample households drawn proportionally from each kebele (385 in total). The total sample household number for interview was determined by the following formula [23]:
n = N 1 + N ( e ) 2
where, n = Sample; N = Population; e = Error term (5%)
On the other hand, focus groups were chosen based on their kebele’s representatives.
Quantitative data were gathered from both primary and secondary sources such as Landsat images for land use land cover mapping, and ground truth data were collected for land use classification signatures (Table 1). Vegetation was sampled for biodiversity and evenness analysis using standard sampling every 100 m distance along the longest cross-section of the study area and taking 1 m2 plot for identifying types and counting number of species in 3 × 15 plots in three Kebeles. Climate data such as rainfall (CHIRPS) and temperature (ERA5), and digital elevation model (USGS website), and soil map shapefiles [24] were collected as input for hydrological analysis of floodplain rivers including Ribb River using SWAT model. In addition, Ribb observed flow data (MoWIE) for validating simulated flow data, modelled and secondary data of Nitrogen (N) and Phosphorus (P) from Abebe et al. [25] and Negash et al. [26] for water quality analysis and normalized difference vegetation index (NDVI) data (MODIS from https://doi.org/10.5067/ASTER/ASTGTM.003) (accessed on 16 September 2020) for vegetation cover trend analysis were also collected. To verify the NDVI classes (range) with the existing cover of rice field, water body and dense vegetation, ground truth of 30 points for rice field, 30 points for dense vegetation and 30 for water and others (emergent aquatic vegetation) were collected from June to September (wet season) 2018 (Figure 2).

2.3. Methods of Data Analysis

Both qualitative and quantitative data were analyzed using percentage, mean, and correlation in Excel. Pearson’s correlations were used for water flow, Nitrogen (N) and Phosphorous (P) that indicate water pollution status. Indicators of Hydrological Alteration (IHA) software was used to figure out environmental flow components and analyze flow alterations of the Ribb River which floods to the Fogera floodplain [27]. Image processing and analysis were performed using ArcGIS10.4 software. SWAT2012 for flow and nutrient simulation and SWATCUP for calibration and uncertainty analysis were also used. Ribb observed flow between 1981 to 1999 and 2000 to 2004 were used for calibration and validation, respectively.
NDVI data for the years 2000, 2009, and 2018 were generated using Google Earth engine, cloud computing platform, to see rice expansion in the area. The NDVI was used to identify the rice, dense vegetation and water bodies, and other small grass areas within a wetland classified in ArcGIS 10.4 environment based on signatures suitable threshold indices values for rice 0.4–0.71 (Average = 0.66 and STDEV = 0.03), dense vegetation > 0.71 (Average = 0.71 and STDEV = 0.01), water and others < 0.4 (Average = −0.04 and STDEV = 0.08) based on Tucker, C.J. and P. Sellers [28] and the ground truth collected during the study period from June to September (wet season) 2018.
Shannon Diversity Index (H’) was also used to compute the diversity and composition of herbaceous and grass species of the wetlands in the Fogera floodplain [29]. This index takes into consideration species composition and evenness within the given area calculated using Equations (2) and (3) as follows:
H = i = 1 s Pi   ( In pi , pi = ni N
Evenness   ( J ) :   J = H Hmax
where ni = number of individuals of species “i”, N = total number of individuals of all species, pi = relative abundance of species “i”, S = total number of species, and H′ = the Shannon Diversity Index.

3. Results and Discussion

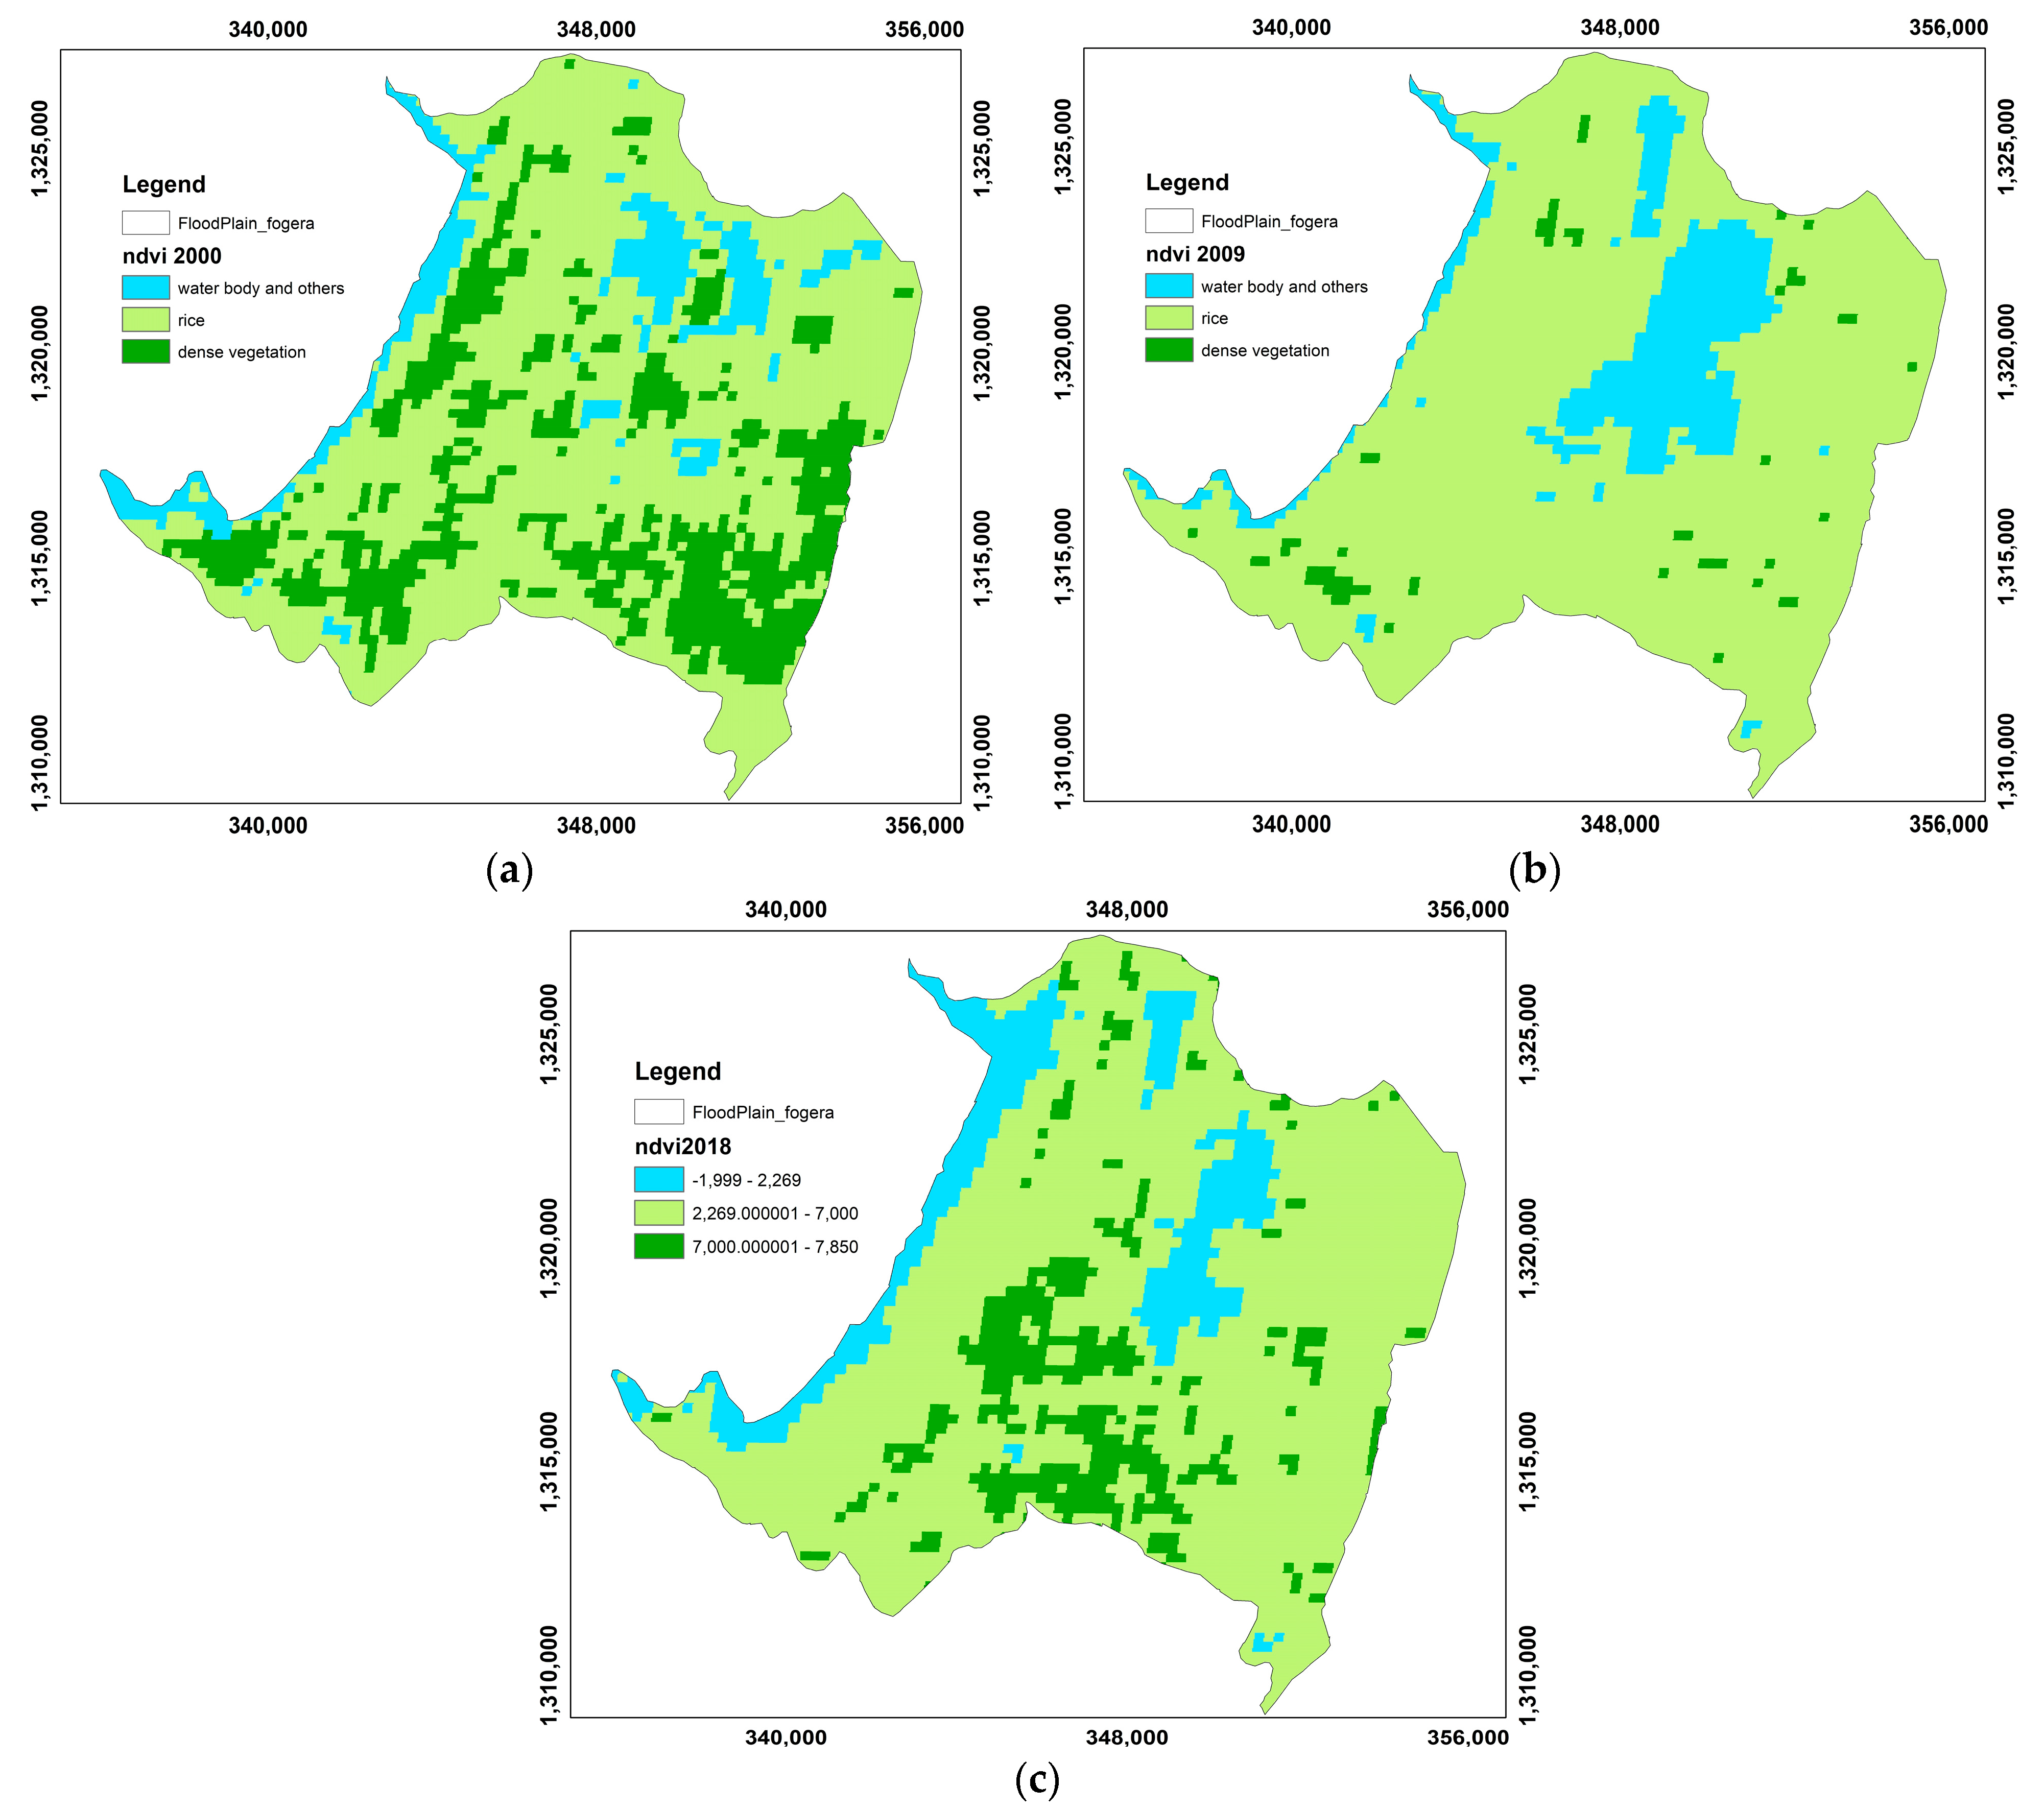
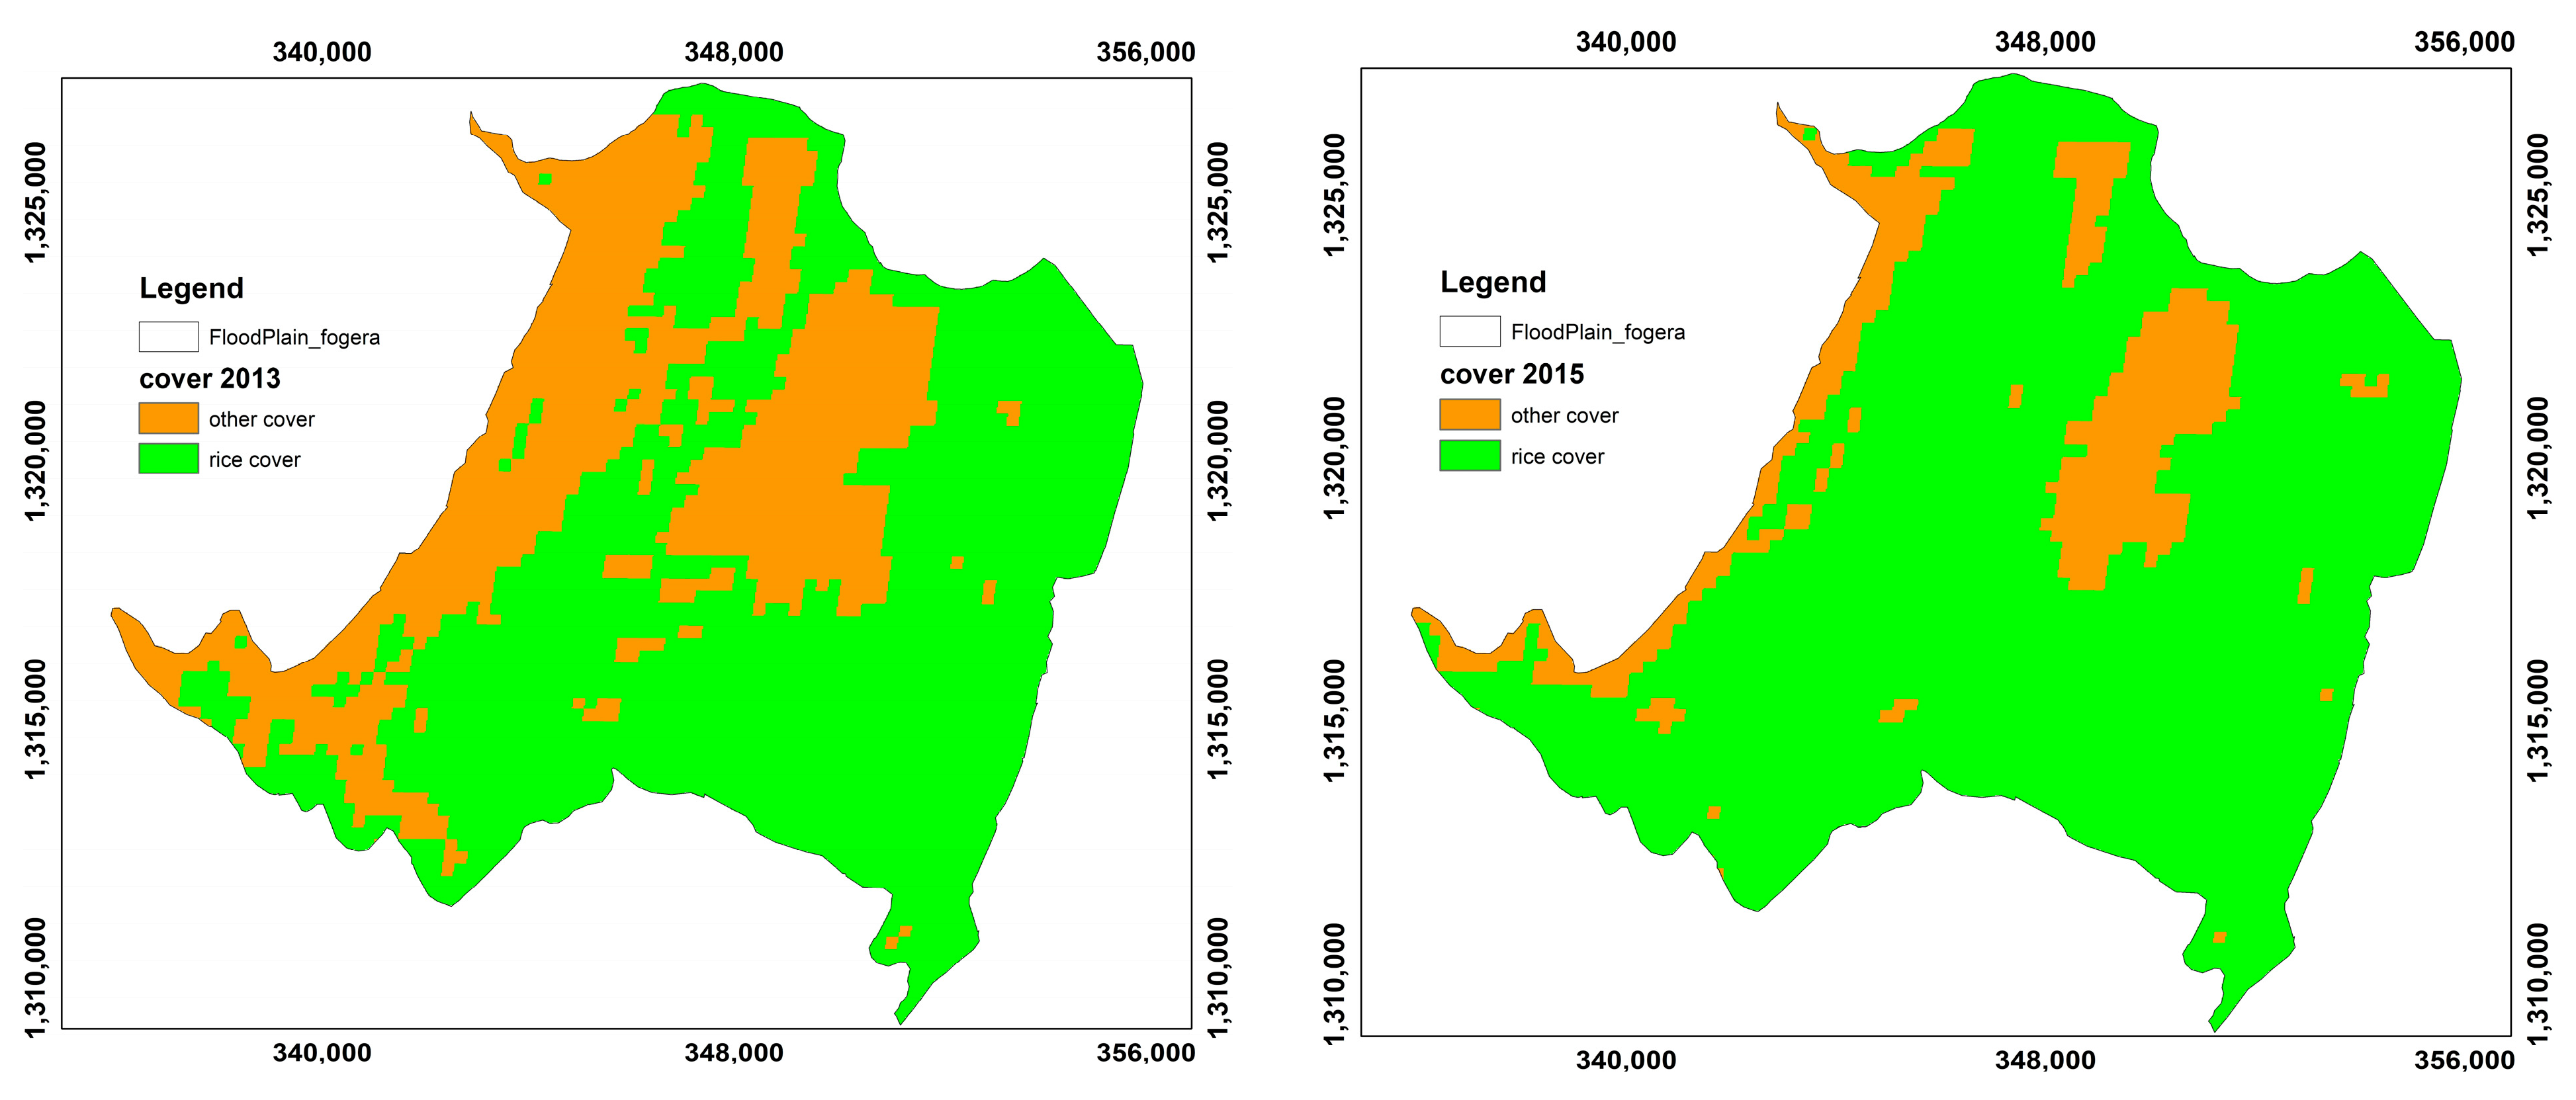
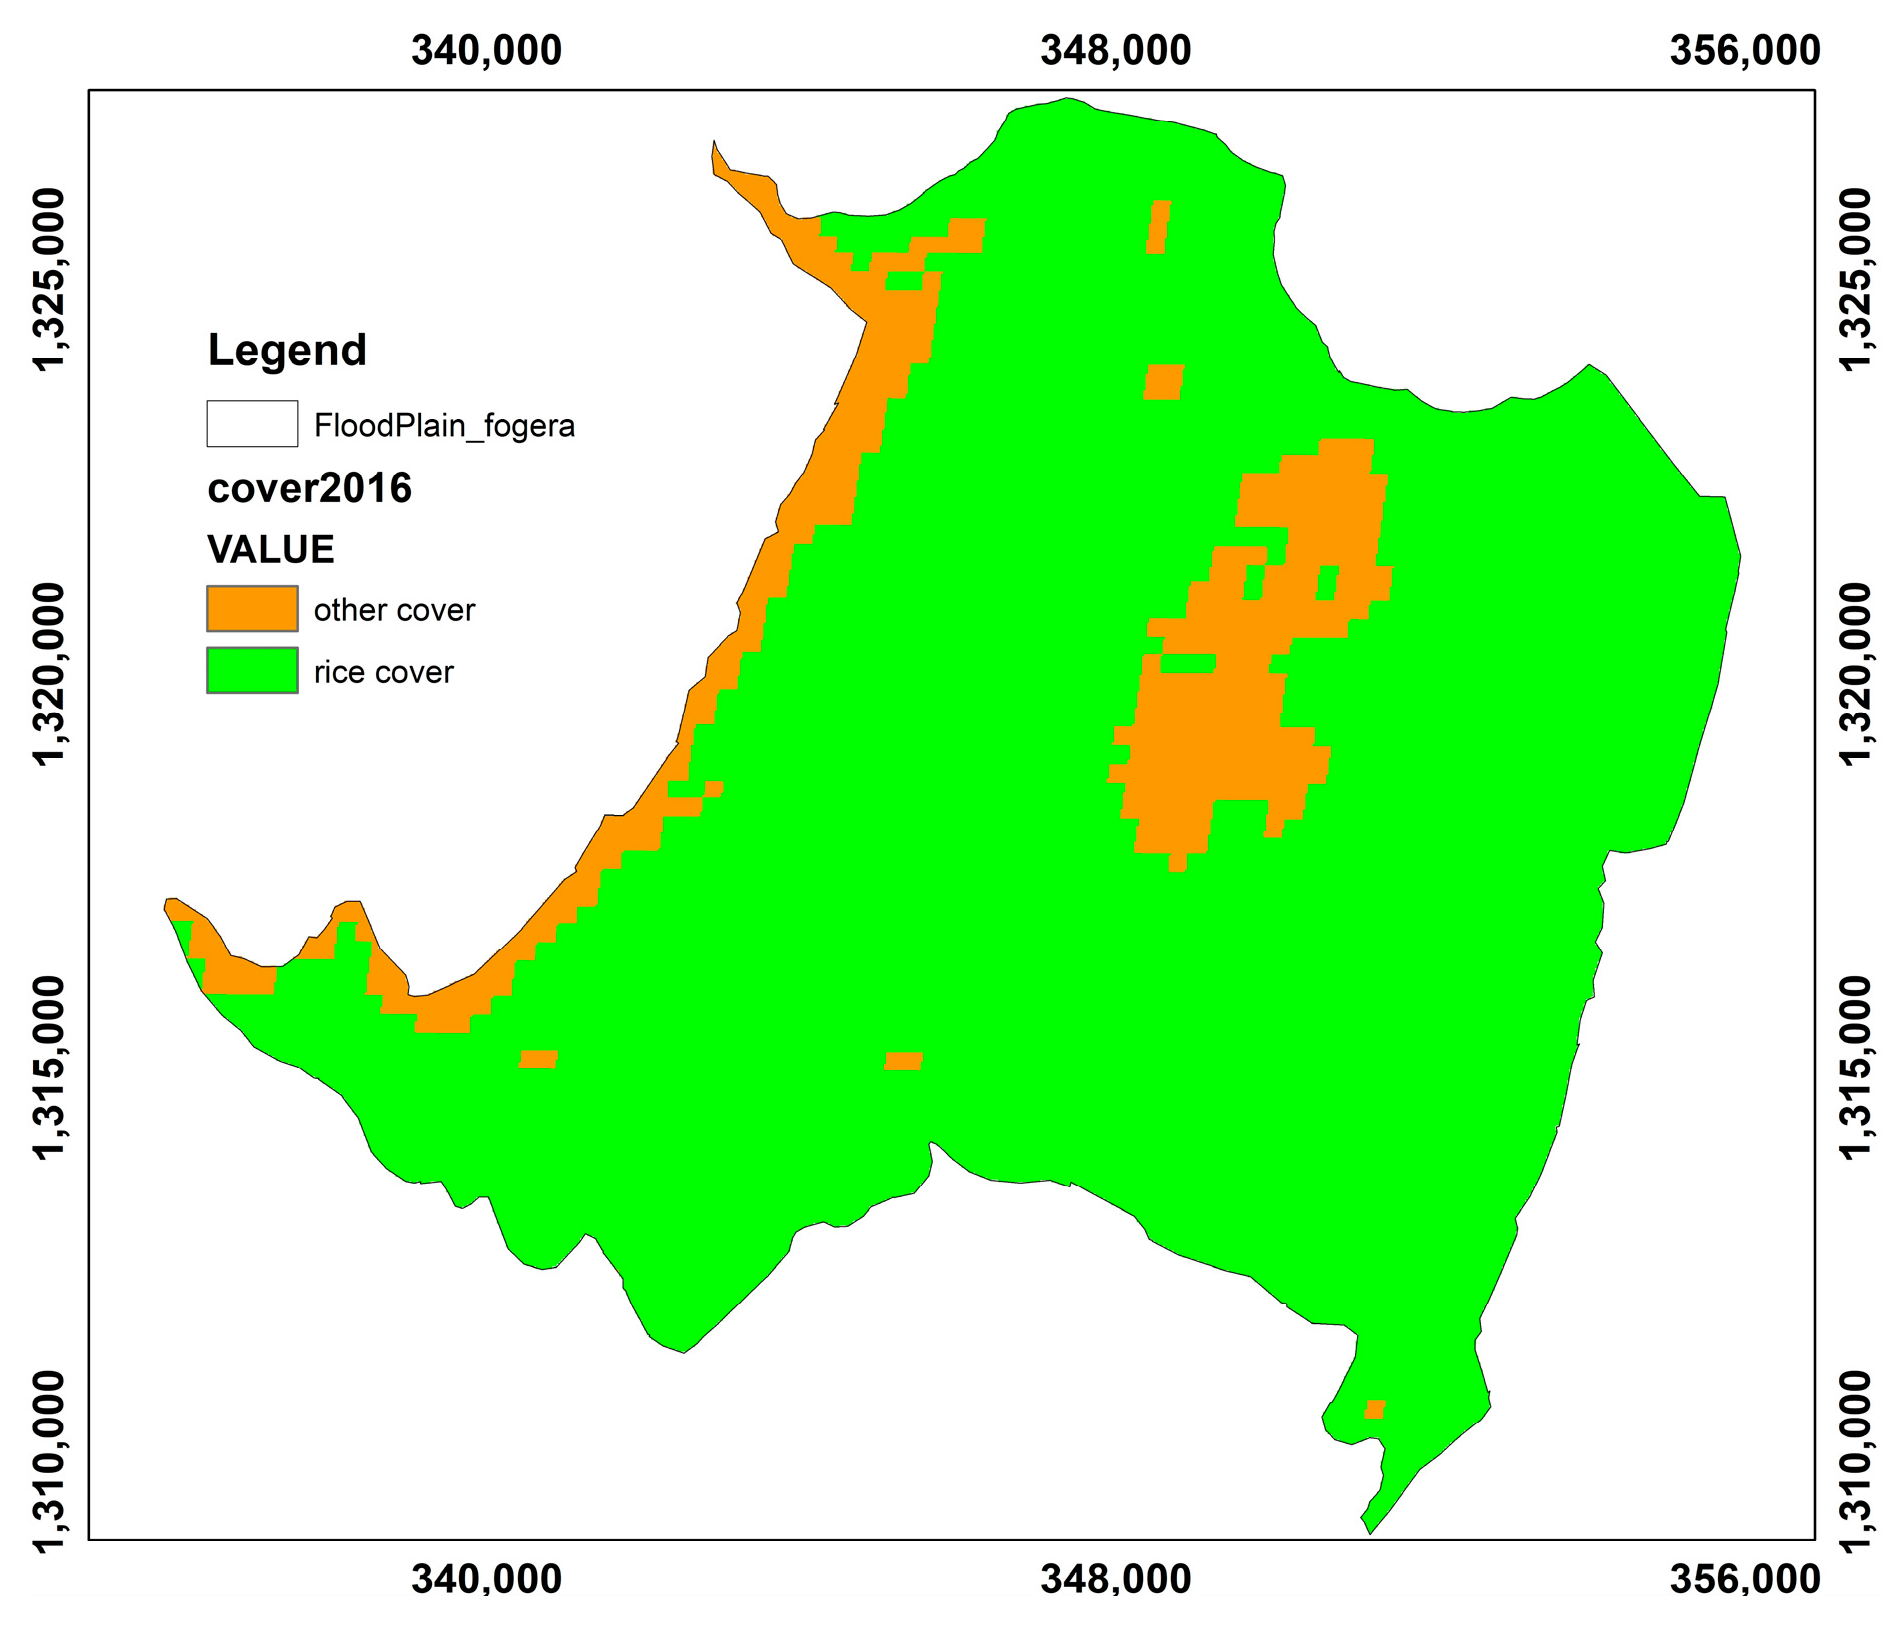
3.1. Spatial and Temporal Trends in Crop Production Pattern in the Area

Spatial and temporal patterns in the area’s crop production pattern based on three image classes showed that the rice crop increased at a rate of 1198 NDVI with R2 of 0.8 whereas dense vegetation, water and other small vegetation showed decreasing trends at a rate of −251 and −948 NDVI with R2 0.5 in the year 2000, 2009 and 2018, respectively (Figure 3 and Table S4).
Furthermore, the spatial analysis of the NDVI values in 2000 for dense vegetation, rice, water and others indicated 2691 ha, 11,127 ha, and 3328.0 ha area coverages, respectively (Figure 4a), whereas the coverage in 2009 for dense vegetation was 120 ha, for rice 13,469 ha, and water and others 3556 ha (Figure 4b). In the latest analysis in 2018, the area coverage for dense vegetation, rice and water, and others was 796 ha, 13,523 ha, and 2826 ha, respectively (Figure 4c). Hence, based in the spatial analysis, the area coverage for rice showed an increase while dense vegetation and water and others showed a decline. Overall, rice area increased by 2397 ha whereas “water and others” decreased by −502 ha. This is in line with other similar studies in Asia on rice-cropping system changes on floodplains [30,31].
Accordingly, as indicated in Table 2, the sampled respondent mentioned that the size of their farmland before the introduction of rice was 160 ha but after the introduction of rice this number flipped to 285 ha, or an increase of 125 ha (Table 2). A study of rice commercialization in the Fogera floodplain revealed similar conditions [32].
Respondents were asked about their previous production style before the introduction of rice. They indicated that they produced different crops in the study areas, including small amounts of teff (Eragrostis tef), maize (Zea mays L.), noug (Guizotia abyssinica), finger millet (Eleusine coracana), chickpea (Cicerarietinum), lentil (Lens culinaris), grass pea (Lathyrus sativus), green pepper (Capsicum spp.) and barely (Hordeum Vulgare), and devoted a larger amount of land for animals. They also stated these minor crops were produced far away from the wetlands in the study site.
Most respondents reported being engaged in rice production during the summer season while in the winter season, they focused more on horticultural crops such as onion (Allium cepa), garlic (Allium sativum), and tomatoes (Solanum Lycopersicum). These were grown using small-scale irrigation.
Regarding the area cultivated for the wetlands of the Fogera floodplain, the two-year data showed that the cultivated area coverage of the rice crop was 245 ha and 285 ha in the years 2014 and 2015, respectively (Table 3 and Figure 5). In Figure 5 the land-use coverage for rice and other land use for the years 2013, 2015, and 2016 is also mapped, and the result revealed the coverage for rice has shown an increment.
About 89% of the sampled household respondents reported that the types of cropping pattern practiced are mono cropping whereas about 11% of sampled respondents said that they practiced crop rotation (Table 4). Those who practiced crop rotation explained they used rotation because their farmland is far away from the floodplain which is located on the uplands.

3.2. Agricultural Inputs Application

The entire respondent group mentioned that the methods to maximize yield are applying agricultural inputs such as chemical fertilizer, improved seed, insecticide, and herbicide, resulting in expansion of rice farming through encroaching wetlands and communal grazing lands (Table 5). Insecticide has been used for most crops of chickpea (Cicer arietinum) and grass pea (Lathyrus sativus) which are relayed after rice (Oryza sativa). Not all respondents used agro-chemical inputs, but rather they used manure for the production of maize (Zea mays L.) and green pepper (Capsicum spp.), whereas manuring, fallowing and crop rotation were not applicable for rice in the area (Table 5).
About 45.5% of respondents applied fertilizer, and 23% used improved seed. In addition, about 95% of respondents used pesticides, and herbicides were used by about 64% of the respondents (Figure 6). This spraying of pesticides kills insects and those insects are eaten by birds (Figure 7). Therefore, the birds could be affected. This is in line with other studies that confirmed ecosystem functioning effects of pesticides application on rice [33,34].
About 74% of respondents recognized negative environmental effects of using agricultural inputs, including reduced numbers of birds (73%), bee colonies (96%), fish (73%) and other animals such as macroinvertebrates, reptiles, and amphibians (73%) in the wetlands of the study area (Table 6 and Figure 7).
About 22% of the respondent farmers said that they practice recession farming, i.e., they plant along the shore as water recedes (Figure 8 and Table 7). After rice is harvested, they tend to plant maize during the dry season. The majority who did not practice recession farming did so because their farms were too far away from receding bodies of water.
All respondents recognized effects of the practice on ecosystem services such as papyrus and grass production, bird populations, and the amount and quality of water, including increased siltation and turbidity. However, some farmers were trying to maximize their productivity through the expansion of recession farming at the expense of wetlands and Lake Tana in the study area. The interviewed farmers and FGD participants also recognized changes they had observed in wetland shrinkage and water resource depletion in their kebele. In summary, they observed a reduction in water levels and fish populations, lower papyrus and grass production, fewer birds and hippopotami, and a change in insect populations. Respondents were asked to rank changes in wetland resources. The respondents’ problem ranking results indicate that papyrus production was most affected, followed by fish, grass, amount of water, birds, hippopotamus, and sand. Reductions are presented in Table 8, and ranked 2nd, 3rd, 4th, 5th, 6th and 7th, respectively.
Respondents were unanimous in their strong desire to conserve the wetlands of Fogera and Lake Tana. Perceived benefits included preservation of papyrus, fish, birds, grass, clean water, reduced flooding, increased soil fertility, wildlife habitat, and vegetation, and reduced land and water degradation. Recession farming is considered as a disadvantage for certain users because respondents linked it to increasing number of hippopotamus and birds that damage their crops, and there would be no free fish harvest in the wetlands and the lake (Figure 9). Dejen, Anteneh [35] mentioned related effects of recession agriculture in the Fogera floodplain.

3.3. Biodiversity in the Fogera Floodplain

The diversity of herbaceous vegetations in the three Kebeles of the Fogera floodplain was found to be 2.15, 2.27 and 2.44 for Nabega, Shaga and Wagetera Kebeles respectively (Table 9). The overall average for the floodplain was 2.30. The evenness for the area was 0.80, 0.86, and 0.93 for Nabega, Shaga and Wagetera Kebeles, respectively. Most of the species identified in the area were found to be weeds which are encroaching the area because of cultivation (see Supplementary Materials). Hence, the evenness exhibited close to one, having many of those diverse weeds, whereas the maximum diversity index for the area was 2.71 and yet not reached by either of the Kebeles.
The increasing trend in rice cultivated land is supported by the fact that wetlands are characterized by fertile soil and sufficient water, which resulted in more land for rice production [36]. Farmers in the study area tend to grow rice because of its high yield and high market price relative to other food crops [37]. The introduction of rice has changed the production system, especially in the wetlands of the Fogera floodplain, from livestock-dominated to rice-dominated. Mono cropping is the most common cropping pattern recorded in the studied wetland areas, in line with results of Tilahun-Tadesse and Nigussie-Dechassa [17]. This has an effect on the biodiversity in the Fogera floodplain as studies indicated [25].
Before the introduction of rice, manure was used instead of chemical fertilizer to grow maize (Zea mays L.) and green pepper (Capsicum spp.), being that the soil was extremely fertile [38]. According to FGD participants, soil fertility depletion and addition of sand and other unfertile soil particles from upland erosion to the study area’s wetland decreased soil fertility and the amount of water in the wetland. This resulted in the use of agricultural inputs (chemical fertilizer, improved crop, insecticide, and herbicide) [38]. These have contributed to the biodiversity loss of the Fogera floodplain wetlands, as previous studies confirmed [26,39]. For example, rice cultivation allowed for a landscape rich in diversity, particularly in macroinvertebrates, fish, and waterfowl until the early twentieth century in rice-producing Asian countries, but the intensification of agricultural practices has changed their ecological character significantly [40,41].
After the start of chemical input applications, according to respondents, there is recognized water contamination, extinction of wetland vegetations such as papyrus, and a decrease in the number of birds, bee colonies, fish and other animals such as macroinvertebrates, reptiles and amphibians in the Fogera floodplain wetlands. This is in line with recent quantitative studies [25,26].
This had a significant negative impact on the attractiveness of the local tourism-based economy [42]. Earlier studies revealed that traditional rice systems were sufficiently multifaceted ecosystems that did not involve the use of chemical fertilizers but had optimum production for longer periods of time [43].

3.4. Hydrological Alteration in the Fogera Floodplain Wetlands

The performance of the SWAT2012 model was found to be R2 0.61 and NSE 0.60 for calibration and R2 0.51 and NSE of 0.50 for validation.

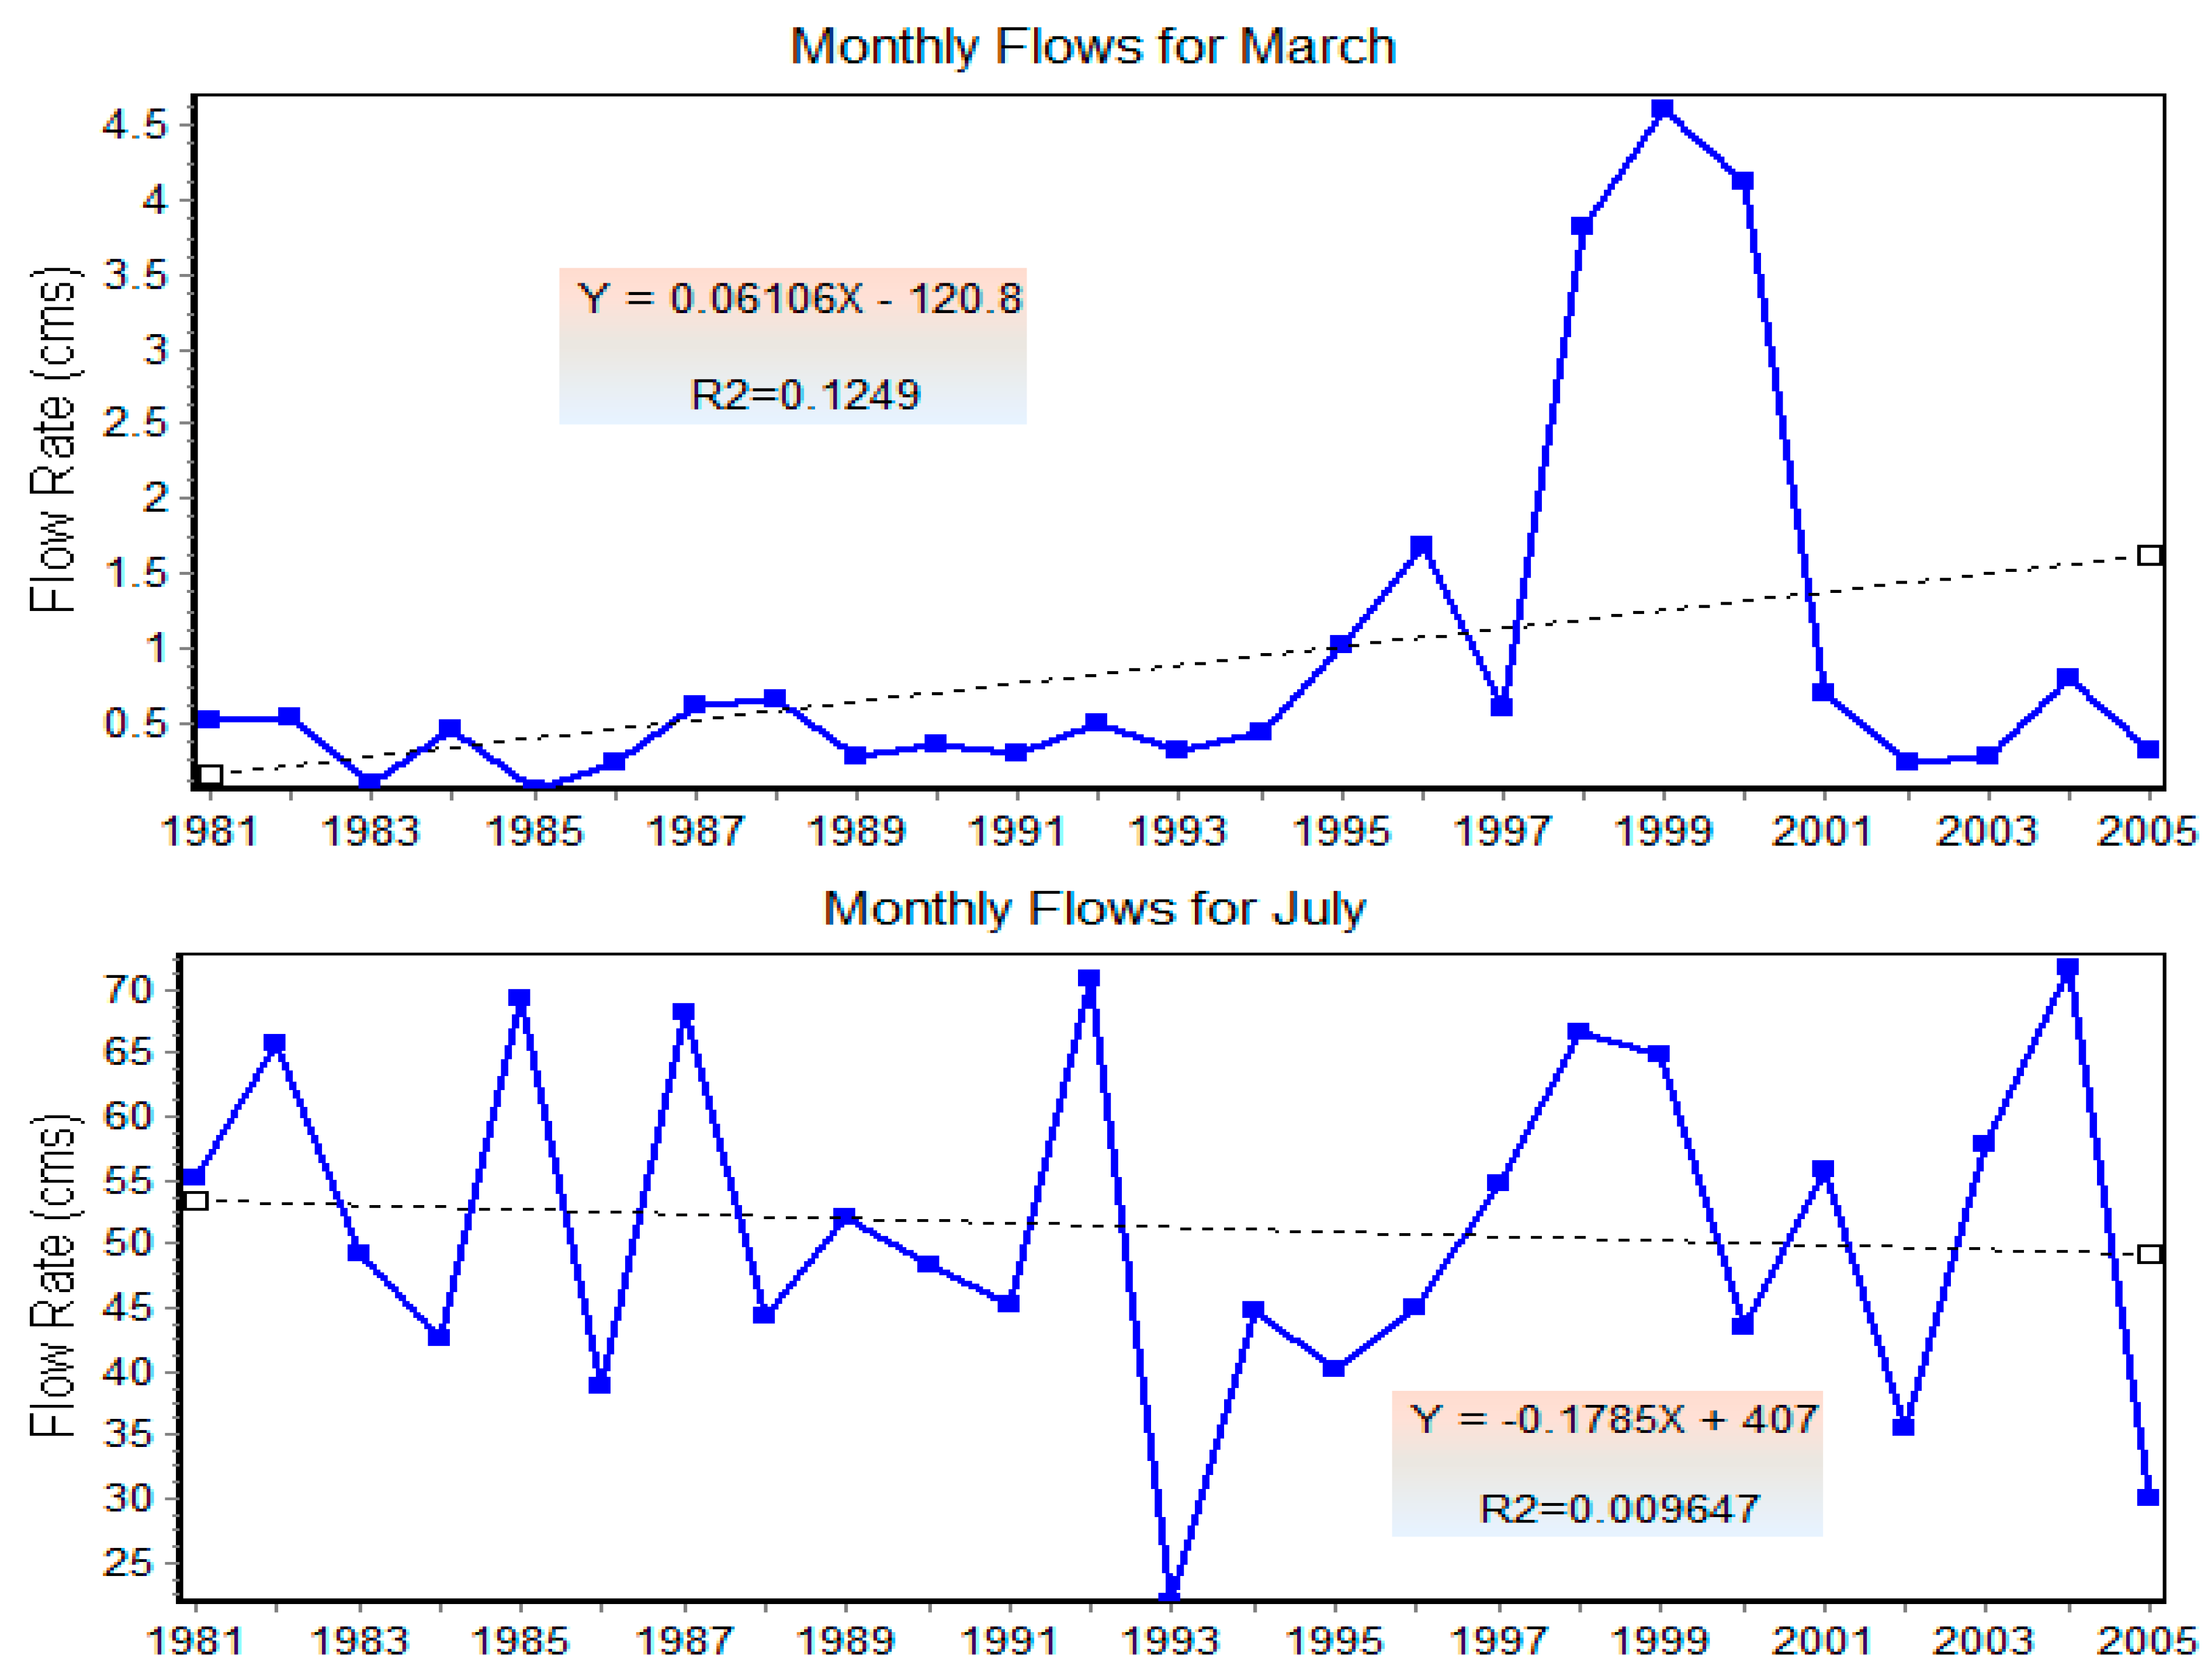
3.4.1. Monthly Flow Trends

The monthly flow analysis indicated that lower flows occur from December to June, the lowest being in April, with a median flow of 0.01 m3 s−1 and higher flows occurring from July to November, the highest being in August, with a median flow of 94.5 m3 s−1 (Figure 10). A high coefficient of variation (COV) of an average of 1.0 was found from November to May during the dry season, and a low COV of an average of 0.5 was observed from June to October during the wet season. Dry monthly flows have an increasing trend in the beginning months, and later months showed a decreasing trend, but rainy season months showed an overall decrease (Figure 11). Flows in the dry season in March and April increased in time likely due to the flow releases from the upstream Ribb dam during construction time, and May to September (rainy season) decreased likely due to that the dam holds water. This is contrary to the Gumara River, with no dam, which also floods the Fogera floodplain [44].

3.4.2. Water Chemistry

The summary statistics for water flow, Nitrogen and Phosphorous revealed that the Pearson’s correlation of water flow with N and P was −0.069 and −0.072, respectively. These have negative relationships, whereas the correlation between N and P has a positive correlation with the value of 0.242 (Table 10). Hence, the water quality deteriorates with flow decrease.
Seasonal and annual variations in the hydrological functions of the study wetlands were observed. In line with this, floodplain wetland communities have also recognized the decline in water level in the wetlands, where there is loss of fish, depletion of papyrus and other wetland grass species, and disappearance of the hippopotamus population as well as migratory birds. In aquatic ecosystems, hydrological regimes create biotic diversity, and hydrological variation is recognized as a primary driving force [45]. When humans alter the flow regime, the normal cycle of hydrologic variation and ecosystem dynamics is disturbed [39,46,47].
In addition, the effects of recession farming on wetland and lake resources have been demonstrated with change in the color of water, increased siltation and turbidity of the water, and decreased flow quality (Table 11). Recession farming has had a detrimental effect on the fauna, flora, and hydrology of the study site. New lands were developed at the land/swamp interface as a result of the recession and the draining of wetlands, resulting in major destruction of the wetland environment. Several studies have found a gradual shift in farming system enterprises from terrestrial to wetland-based development by households close to wetlands [48].
Aside from better land-use practices, livestock overgrazing and macrophyte overharvesting in the Fogera floodplain play a synergistic role in disrupting the area’s hydrological cycle and microclimate regulation. As wetland macrophyte vegetation disintegrates due to over-exploitation and loss of wetland vegetation, pollutants and nutrients are transported directly into the lake [49]. The euphotic zone in littoral area lakes gets shallow due to increased turbidity caused by the destruction of the buffer zone vegetation by cultivation, suggesting a drastic drop in water quality.

4. Conclusions

There is spatial increase in rice-cropping and temporal changes in crop production in the Fogera floodplain. The introduction and expansion of rice farming in the study area were at the expense of draining the wetlands and grazing land losses. In addition, the agricultural input applications on rice fields have also increased. Dry monthly flows have an increasing trend in the beginning months of the year, and later months showed a decreasing trend, but rainy season months showed an overall decrease. The diversity of herbaceous vegetation in the three Kebeles of the Fogera floodplain was found to be lower than the overall average index. Changes in wetland hydrology can affect soil chemistry as well as the plant and animal population in wetlands. Altering the natural amount of water entering a wetland or the cycle of saturation and inundation will cause the deterioration of biodiversity and loss of ecosystem services. The application of inputs caused water pollution and soil degradation. These have an effect on wetlands that play an important role in water purification, nutrient preservation, flood prevention, and erosion control. Generally, intensification of farming practices has an impact on the biodiversity of fauna and flora of the floodplain area. Therefore, the Fogera floodplain needs to be regulated based on a wetland management plan and the already established proclamations for biodiversity conservation areas in this region.

Supplementary Materials

The following are available online at https://www.mdpi.com/article/10.3390/ecologies2040022/s1, Table S1: Grass species at Nabega Kebele, Table S2: Grass species at Shaga Kebele, Table S3: Grass species at Wagetera Kebele, and Table S4. Land use and land cover ground truth points.

Author Contributions

Conceptualization, M.A.D., W.A.P. and G.Z.; Data curation, M.A.D.; Formal analysis, M.A.D. and W.B.A.; Funding acquisition, M.A.D.; Investigation, W.A.P.; Methodology, M.A.D., W.A.P. and G.Z.; Project administration, G.Z.; Resources, M.A.D., W.A.P. and G.Z.; Supervision, W.A.P. and G.Z.; Validation, W.A.P. and G.Z.; Writing—original draft, M.A.D.; Writing—review and editing, M.A.D., G.Z., W.A.P. and W.B.A. All authors have read and agreed to the published version of the manuscript.

Funding

The publication fee is covered by University of Nevada, Reno (UNR).

Institutional Review Board Statement

The study was conducted according to the guidelines of the Declaration of Helsinki, and approved by the Institutional Review Board of Addis Ababa University, Ethiopian Institute of Architecture, Building Construction, and City Development (protocol code AAU/EIABCCD/11/2012 and Date of approval 18 July 2020).

Data Availability Statement

All data produced from this study are provided in this manuscript.

Acknowledgments

The authors acknowledge Addis Ababa and Wollo University for giving this chance to do this project. I would like to thank Fogera Woreda Agriculture office for providing me information and secondary data, and development agents for assisting me in collecting data.

Conflicts of Interest

The authors declare that there is not any financial or non-financial competing interest. The authors declare that they have no competing interests.

References

  1. Roger, P.A. Biology and Management of the Floodwater Ecosystem in Rice Fields; International Rice Research Institute: Los Banos, Philippines, 1996. [Google Scholar]
  2. USDA. World Rice Production 2020/2021. 2021. Available online: http://www.worldagriculturalproduction.com/crops/rice.aspx (accessed on 10 August 2020).
  3. Villar, C.; Wetlands and Agriculture: Partners for Growth. Manila Bulletin, 2014, p. 12. Available online: https://ani.seafdec.org.ph/handle/20.500.12174/9918 (accessed on 15 July 2020).
  4. Ghosh, B.; Bhat, R. Environmental hazards of nitrogen loading in wetland rice fields. Environ. Pollut. 1998, 102, 123–126. [Google Scholar] [CrossRef]
  5. Roger, A.P.; Heong, K.; Teng, P. Biodiversity and sustainability of wetland rice production: Role and potential of microorganisms and invertebrates. Casafa. Rep. 1991, 4, 117–136. [Google Scholar]
  6. Mitsch, W.J.; Gosselink, J.G. The value of wetlands: Importance of scale and landscape setting. Ecol. Econ. 2000, 35, 25–33. [Google Scholar] [CrossRef]
  7. Gosselink, G.J.; Turner, R.E. Role of hydrology in freshwater wetland ecosystems. Freshw. Wetl. 2013, 1978, 63–78. [Google Scholar]
  8. Tiner, R.W. The primary indicators method—A practical approach to wetland recognition and delineation in the United States. Wetlands 1993, 13, 50–64. [Google Scholar] [CrossRef]
  9. Tran, D.D.; van Halsema, G.; Hellegers, P.J.; Ludwig, F.; Wyatt, A. Questioning triple rice intensification on the Vietnamese mekong delta floodplains: An environmental and economic analysis of current land-use trends and alternatives. J. Environ. Manag. 2018, 217, 429–441. [Google Scholar] [CrossRef]
  10. Dixon, A.B. The hydrological impacts and sustainability of wetland drainage cultivation in Illubabor, Ethiopia. Land Degrad. Dev. 2002, 13, 17–31. [Google Scholar] [CrossRef]
  11. Rosenberg, D.M.; McCully, P.; Pringle, C.M. Global-Scale Environmental Effects of Hydrological Alterations: Introduction. BioScience 2000, 50, 746–751. [Google Scholar] [CrossRef] [Green Version]
  12. Millennium Ecosystem Assessment. Ecosystems and Human Well-Being: Wetlands and Water; World Resources Institute: Washington, DC, USA, 2005. [Google Scholar]
  13. Improving Productivity and Market Success (IPMS). Fogera Wereda Pilot Learning Site: Diagnosis and Program Design Report. 2005. Available online: https://cgspace.cgiar.org/bitstream/handle/10568/16747/Fogera.pdf?sequence=1&isAllowed=y (accessed on 10 July 2020).
  14. Dugan, P. Wetland Conservation: A Review of Current Issues and Action IUCN; IUCN: Gland, Switzerland, 1990. [Google Scholar]
  15. Qiu, J.; Turner, M.G. Spatial interactions among ecosystem services in an urbanizing agricultural watershed. Proc. Natl. Acad. Sci. USA 2013, 110, 12149–12154. [Google Scholar] [CrossRef] [Green Version]
  16. Gomiero, T.; Pimentel, D.; Paoletti, M.G. Environmental Impact of Different Agricultural Management Practices: Conventional vs. Organic Agriculture. Crit. Rev. Plant Sci. 2011, 30, 95–124. [Google Scholar] [CrossRef]
  17. Tilahun-Tadesse, F.; Nigussie-Dechassa, R.; Wondimu Bayu, S.G. Effect of transplanting on terminal moisture stress, growth and yield of rain-fed lowland rice. Res. J. Agric. Environ. Manag. 2013, 2, 117–129. [Google Scholar]
  18. Takele, A. Analysis of Rice Profitability and Marketing Chain: The Case of Fogera Woreda, South Gondar Zone, Amhara national regional state, Ethiopia. Master’s Thesis, Haramaya University, Haramaya, Ethiopia, 2010. [Google Scholar]
  19. Agegnehu, S.; Fikremariam, A.; Agumas, B.; Eshetie, A.; Minwuyelet, J.; Getachew, A. Effect of time and frequency of hand weeding on yield of direct seeded rice in Fogera plain. Curr. Res. Microbiol. Biotechnol. 2013, 1, 266–269. [Google Scholar]
  20. Seyoum, M.; Gebrekidan, H. Effects of N and P Fertilisers on Yield and N Uptake of Flooded Rice Grown on Vertisols of Fogera Plain of Ethlopia. Indian J. Fertil. 2005, 1, 47. [Google Scholar]
  21. Desta, M.A.; Zeleke, G.; Payne, W.A.; Shenkoru, T.; Dile, Y. The impacts of rice cultivation on an indigenous Fogera cattle population at the eastern shore of Lake Tana, Ethiopia. Ecol. Process. 2019, 8, 19. [Google Scholar] [CrossRef]
  22. Zur Heide, F. Feasibility Study for a Lake Tana Biosphere Reserve, Ethiopia; Bundesamt für Naturschutz, BfN: Bonn, Germany, 2012. [Google Scholar]
  23. Yamane, T. Problems to Accompany ”Statistics, an Introductory Analysis”; Harper & Row: New York, UY, USA, 1967. [Google Scholar]
  24. BCEOM. Abay River Basin Integrated Development Master Plan–Phase 2–Land Resources Development–Reconnaissance Soils Survey; Ministry of Water Resources: Addis Ababa, Ethiopia, 1998. [Google Scholar]
  25. Abebe, W.B.; Tilahun, S.A.; Moges, M.M.; Wondie, A.; Dersseh, M.G.; Assefa, W.W.; Mhiret, D.A.; Adem, A.A.; Zimale, F.A.; Abera, W.; et al. Ecological Status as the Basis for the Holistic Environmental Flow Assessment of a Tropical Highland River in Ethiopia. Water 2021, 13, 1913. [Google Scholar] [CrossRef]
  26. Atnafu, N.; Dejen, E.; Vijverberg, J. Assessment of the Ecological Status and Threats of Welala and Shesher Wetlands, Lake Tana Sub-Basin (Ethiopia). J. Water Resour. Prot. 2011, 3, 540–547. [Google Scholar] [CrossRef] [Green Version]
  27. The Nature Conservancy (TNC). Indicators of Hydrologic Alteration Version 7.1; User’s Manual: Arlington, VI, USA, 2009; Available online: https://www.conservationgateway.org/Files/Pages/indicators-hydrologic-altaspx47.aspx (accessed on 5 July 2020).
  28. Tucker, C.J.; Sellers, P.J. Satellite remote sensing of primary production. Int. J. Remote Sens. 1986, 7, 1395–1416. [Google Scholar] [CrossRef]
  29. Shannon-Wiener, C.; Weaver, W.; Weater, W. The Mathematical Theory of Communication; University of Illinois Press: Champaign, IL, USA, 1949. [Google Scholar]
  30. Guan, X.; Huang, C.; Liu, G.; Meng, X.; Liu, Q. Mapping Rice Cropping Systems in Vietnam Using an NDVI-Based Time-Series Similarity Measurement Based on DTW Distance. Remote Sens. 2016, 8, 19. [Google Scholar] [CrossRef] [Green Version]
  31. Sakai, T.; Omori, K.; Oo, A.N.; Ma, S.S.; Zaw, Y.N. Decadal changes in the rice-cropping system in the Ayeyarwady Delta using a large archive of satellite imagery from 1981 to 2020. Paddy Water Environ. 2021, 19, 295–306. [Google Scholar] [CrossRef]
  32. Alemu, D.; Tesfaye, A.; Assaye, A.; Addis, D.; Tadesse, T.; Thompson, J. A Historical Analysis of Rice Commercialisation in Ethiopia: The Case of the Fogera Plain; 2018. Available online: https://opendocs.ids.ac.uk/opendocs/handle/20.500.12413/14283 (accessed on 5 July 2020).
  33. Sattler, C.; Schrader, J.; Farkas, V.M.; Settele, J.; Franzén, M. Pesticide diversity in rice growing areas of Northern Vietnam. Paddy Water Environ. 2018, 16, 339–352. [Google Scholar] [CrossRef]
  34. Berg, H.; Söderholm, A.E.; Söderström, A.-S.; Tam, N.T. Recognizing wetland ecosystem services for sustainable rice farming in the Mekong Delta, Vietnam. Sustain. Sci. 2016, 12, 137–154. [Google Scholar] [CrossRef] [Green Version]
  35. Dejen, E.; Anteneh, W.; Vijverberg, J. The Decline of the Lake Tana (Ethiopia) Fisheries: Causes and Possible Solutions. Land Degrad. Dev. 2015, 28, 1842–1851. [Google Scholar] [CrossRef] [Green Version]
  36. Lakew, T.; Tariku, S.; Alem, T.; Bitew, M. Agronomic performances and stability analysis of upland rice genotypes in North West Ethiopia. Int. J. Sci. Res. Publ. 2014, 4, 1–9. [Google Scholar]
  37. Gebey, T.; Berhe, K.; Hoekstra, D.; Alemu, B. Rice Value Chain Development in Fogera Woreda Based on the IPMS Experience; International Livestock Research Institute (ILRI): Addis Ababa, Ethiopia, 2012. [Google Scholar]
  38. Gebresllassie, H.; Gashaw, T.; Mehari, A. Wetland degradation in Ethiopia: Causes, consequences and remedies. J. Environ. Earth Sci. 2014, 4, 40–48. [Google Scholar]
  39. Anteneh, W.; Dejen, E.; Getahun, A. Shesher and Welala floodplain wetlands (Lake Tana, Ethiopia): Are they important breeding habitats for Clarias gariepinus and the migratory Labeobarbus fish species? Sci. World J. 2012, 2012, 298742. [Google Scholar] [CrossRef] [Green Version]
  40. Kawano, S. Nakaikemi, a Miraculous Lowland Marsh in Central Honshu, Japan—A Search for the Secret of its Fascination; NGO: Honshu, Japan, 2000. [Google Scholar]
  41. Shimoda, M. Conservation and management of rice field biodiversity. In Wetlands: Monitoring, Modelling and Management; Okruszko, T., Maltby, E., Szatylowicz, J., Miroslaw-Swiatek, D., Kotowski, V., Eds.; Taylor and Francis: London, UK, 2007; pp. 323–329. [Google Scholar]
  42. Wondie, A. Improving management of shoreline and riparian wetland ecosystems: The case of Lake Tana catchment. Ecohydrol. Hydrobiol. 2010, 10, 123–131. [Google Scholar] [CrossRef]
  43. Moorman, F.; van Breemen, N. Rice: Soil, Water, Land; IRRI: Los Banos, Philippines, 1978. [Google Scholar]
  44. Abebe, W.B.; Tilahun, S.A.; Moges, M.M.; Wondie, A.; Derseh, M.G.; Nigatu, T.A.; Mhiret, D.A.; Steenhuis, T.S.; Van Camp, M.; Walraevens, K.; et al. Hydrological Foundation as a Basis for a Holistic Environmental Flow Assessment of Tropical Highland Rivers in Ethiopia. Water 2020, 12, 547. [Google Scholar] [CrossRef] [Green Version]
  45. Taylor, V.; Schulze, R.; Jewitt, G. Application of the Indicators of Hydrological Alteration method to the Mkomazi River, KwaZulu-Natal, South Africa. Afr. J. Aquat. Sci. 2003, 28, 1–11. [Google Scholar] [CrossRef]
  46. Poff, N.L.; Allan, J.D. Functional Organization of Stream Fish Assemblages in Relation to Hydrological Variability. Ecology 1995, 76, 606–627. [Google Scholar] [CrossRef]
  47. Wondie, A. Ecological conditions and ecosystem services of wetlands in Lake Tana basin. Ecohydrol. Hydrobiol. 2018, 18, 231–244. [Google Scholar] [CrossRef]
  48. Kipkemboi, J. Fingerponds: Seasonal Integrated Aquaculture in East African Freshwater Wetlands: Exploring Their Potential for Wise Use Strategies; Taylor & Francis/Balkema: Leiden, The Netherlands, 2006. [Google Scholar]
  49. Odada, E.O.; Olago, D.O.; Kulindwa, K.; Ntiba, M.; Wandiga, S. Mitigation of environmental problems in Lake Victoria, East Africa: Causal chain and policy options analyses. Ambio J. Hum. Environ. 2004, 33, 13–23. [Google Scholar] [CrossRef]
Figure 1. Map of the study area. Note: On the top left side of the map, Ethiopia with a geographical map of the Amhara region; on the bottom left side, the Amhara Region and regional zones; on the right bottom, Fogera Woreda with 10 biosphere reserve ‘Kebeles’; and on the top right side, the study site. Kebele—lowest administrative boundary under Woreda.
Ecologies 02 00022 g001
Figure 2. Land use/cover ground truth points in the Fogera floodplain. (a) Ground truth points mapped on Google Earth map (white circles), and (b) ground truth points mapped on NDVI map (green circles).
Ecologies 02 00022 g002
Figure 3. NDVI of rice cultivated land, dense vegetation and water in the Fogera floodplain between 2000–2018.
Ecologies 02 00022 g003
Figure 4. NDVI maps of Fogera floodplain area. (a) Average NDVI classes from June to September (wet season) in 2000, (b) average NDVI classes from June to September in 2009, and (c) average NDVI classes from June to September in 2018.
Ecologies 02 00022 g004
Figure 5. Rice verse other land use in Fogera floodplain.
Ecologies 02 00022 g005aEcologies 02 00022 g005b
Figure 6. The chemical inputs application for rice in the Fogera floodplain.
Ecologies 02 00022 g006
Figure 7. Farmers spraying pesticide close to birds roosting sites.
Ecologies 02 00022 g007
Figure 8. Recession farming near Lake Tana and wetlands.
Ecologies 02 00022 g008
Figure 9. Fish harvest locally in Lake Tana at eastern shore.
Ecologies 02 00022 g009
Figure 10. Monthly flow average in m3 s−1 of Ribb River since 1981 to 2005.
Ecologies 02 00022 g010
Figure 11. Monthly flow trend of Ribb River between 1981 to 2005. March represents dry season months and July represents rainy season flows. cms-cubic meter per second.
Ecologies 02 00022 g011
Table 1. Data type and sources.
S.N.Data TypeSpatial ResolutionSource
1Landsat 8 image30 mUSGS Landsat images
2DEM SRTM, 200030 mNASA/USGS/JPL-Caltech
3NDVI250 mMODIS from:
https://doi.org/10.5067/ASTER/ASTGTM.003 (accessed on 16 September 2020)
4Rib River flow, 1981–2005discharge in m3s−1MoWIE, Ethiopia
5Precipitation, 1981-now0.25°CHIRPS 2.0 Africa
6Temperature, Minimum/Maximum, 1981-now0.25°ERA5 Africa
7Soil1:250,000MoWIE, BCEOM. [24]
Table 2. Expansion of farmland for rice production.
Sample KebelesNo. of Sample RespondentsTheir Farmland Size of Their Farmland in timad
(1 timad = 0.25 ha)
YesNoBefore Rice%After Rice%Increased%
Kidest Hana6968112419.522119.49719.3
Shina8181013020.523420.510420.6
Shaga57570951517515.48015.9
Wagetera919101462326122.911522.8
Nabega878701402224821.810821.4
Gross cropped area38538416351001139100504100
Table 3. The rice cultivated area for the year 2014 and 2015.
Name of Sample KebeleNo. of Sample Respondent20142015Increment in ha
Total Cultivated Land in haTotal Cultivated Land in ha
Kidest Hana694655.259.25
Shaga815258.56.5
Shina573643.757.75
Wagetera9156.2565.259
Nabega8755627
Table 4. Types of cropping pattern.
No. of KebelesNo Sample RespondentsMono CroppingCrop RotationIntercroppingOther
Kidest Hana6962700
Shaga81691200
Shina5751600
Wagetera9181900
Nabega8779800
Table 5. Inputs used for the production of crops.
If There Is an Increase in Production, What Are the Causes
No. of KebelesNo. of RespondentsFertilizersManureImproved SeedFallowingCrop RotationUsing InsecticidesUsing Herbicides
Kidest Hana6969069006969
Shaga8181081008181
Shina5757057005757
Wagetera9191091009191
Nabega8787087008787
Table 6. Negative impacts of application of agricultural inputs.
KebeleNo. of RespondentsWater PollutionReduction of BirdsReduction of BeesReduction of FishReduction of
Other Animals
Kidest Hana695347555048
Shaga816463806363
Shina574141574141
Wagetera916666916666
Nabega876262876262
Table 7. Availability of recession farming practices.
No. of Sample Kebeles Recession Farming
No. of Sample RespondentsYesNo
Kidest Hana691158
Shaga811665
Shina57849
Wagetera912566
Nabega872364
Table 8. Rank of wetland and Lake Tana resources.
Description of Wetland ResourcesResource
Rank
PapyrusFishSandBirdsGrassAmount of WaterHippopotamus
Wetland resources highly reduced is ranked from the smallest number 1 to the large number 7, e.g., if 1 is selected, the resource is highly reduced.First = 1385000000
Second = 2013557191470
Third = 30436310951713
Fourth = 401784117146012
Fifth = 502730189157153
Sixth = 60138322813273
Seventh = 70124530422344
In this table, the data are the weighted values for each resource responded by sampled respondents, e.g., 385 sampled respondents give rank for each resource.1385000000
202701014382940
30129189302855139
40712164685624048
5013515094575355265
Rank value ∗ each value given by respondents, e.g., 1 ∗ 385 = 385 continuous like this.606228192168781638
7071715210294161308
Weighted Sum Total 385125923081859126014412268
Rank1st2nd7th5th3rd4th6th
Table 9. Biodiversity of herbaceous vegetations in three Kebeles of Fogera floodplain.
Shannan Wiener Index (H′)Evenness
KebeleSample ASample BSample CAverage
Nabega1.912.312.232.150.80
Shaga2.282.272.262.270.86
Wagetera2.462.432.442.440.93
Table 10. Summary statistics for correlation of flow, N and P.
VariableObservationsObs. with Missing DataObs. without Missing DataMinimumMaximumMeanStd. Deviation
Flow m3/s3503518.67042.28031.2766.134
N m3/s350350.0402.8300.9110.651
P m3/s350350.1700.3600.2610.047
Table 11. Water quality status of the Welala and Shesher wetlands in the Fogera floodplain from different studies. Note: Shesher 01 and 02 are two sampling points in the wetland where a river comes in and out.
ParametersUnitsNegash et al. [26]Abebe et al. [25]Simulated
ShesherWelalaShesher 01Shesher 02Wetland Areas
(2009 to 2010)(2009 to 2010)2020202020092010201120122020
Nitratemg/L1.181.140.3490.1762.671.230.361.610.32
Phosphatemg/L0.5420.4431.3710.360.20.240.340.05
Publisher’s Note: MDPI stays neutral with regard to jurisdictional claims in published maps and institutional affiliations.

