Article

From Protected Habitat to Agricultural Land: Dogs and Small Mammals Link Habitats in Northern Thailand

by
Chuanphot Thinphovong
1,
Anamika Kritiyakan
1,
Ronnakrit Chakngean
2,
Yossapong Paladsing
1,3,
Phurin Makaew
1,
Morgane Labadie
4,
Christophe Mahuzier
5,
Waraphon Phimpraphai
6,
Serge Morand
7,* and
Kittipong Chaisiri
8
1
Faculty of Veterinary Technology, Kasetsart University, Bangkok 10900, Thailand
2
Nanthaburi Nation Park, Thawangpha, Nan 55140, Thailand
3
Thailand and Department of Entomology, US Army Medical Component, Armed Forces Research Institute of Medical Sciences, Ratchathewi, Bangkok 10400, Thailand
4
Allocataire de Recherche, Doctorante Projet EBOSURSY, CIRAD, Campus International de Baillarguet Bâtiment E Bureau 109, 34398 Montpellier, France
5
Institut d’Ecologie et des Sciences de l’Environnement de Paris (iEES Paris), Sorbonne Université, 75005 Paris, France
6
Faculty of Veterinary Medicine, Kamphaeng Saen Campus, Kasetsart University, Bangkok 73140, Thailand
7
IRL HealthDEEP, CNRS—Kasetsart University—Mahidol University, Bangkok 10900, Thailand
8
Department of Helminthology, Faculty of Tropical Medicine, Mahidol University, Bangkok 10400, Thailand
*
Author to whom correspondence should be addressed.
Ecologies 2023, 4(4), 671-685; https://doi.org/10.3390/ecologies4040044
Submission received: 7 August 2023 / Revised: 8 September 2023 / Accepted: 13 September 2023 / Published: 15 October 2023
(This article belongs to the Special Issue Feature Papers of Ecologies 2023)

Abstract

:
Wildlife communities are positively affected by ecological restoration and reforestation. Understanding the dynamics of mammal communities along a gradient of a human-dominated habitat to a protected habitats, right up to a reforestation habitat, is crucial for assessing the effects of reforestation on conservation biology and disease ecology. We used data obtained from a set of camera traps and live traps implemented in the “Spillover Interface” project. A network analysis showed that the reforested area was central in the sharing of mammal species between human-dominated habitats, such as plantations, and the protected area. A network analysis also confirmed the centrality of the domestic dog and the rodent Rattus tanezumi (R. tanezumi) in shared habitats and the co-occurrence with other mammal species. This rodent species was previously mentioned as a bridge species between habitats favouring disease transmission. This study is a first step to identify potential reservoirs and habitat interfaces associated with the risk of zoonotic diseases and pathogen spillover.

1. Introduction

The ongoing “Anthropocene defaunation” is leading to empty tropical forests [1]. Mammals are severely and negatively affected by land-use changes through deforestation due to the expansion of agriculture and plantations [2,3]. Habitat loss and fragmentation generally lead to a significant loss of species because remnant habitats are too small and isolated for species to either persist or to recolonise [4]. However, the structure and diversity of wildlife communities can be positively affected by ecological restoration, such as reforestation [5]. Understanding the dynamics of mammal communities along a gradient of a human-dominated habitat to a protected habitat is crucial for assessing the effects of deforestation or reforestation on conservation biology [6].
A human-dominated landscape favours synanthropic species, i.e., the species ecologically associated with humans. Synanthropic species are more likely than other wildlife to be a reservoir of emerging infectious diseases. These species are of low conservation risk due to their habitat generalist traits [7,8]. By carrying and disseminating zoonotic agents across diverse habitats, synanthropic species could enhance spillover to other reservoirs and to humans [9].
The present study is part of the “Spillover Interface” project, which aims at assessing the risk of pathogen spillover at the interface of wildlife, domestic animals, and humans [10]. The project is located along a gradient from a protected area to a village community and the agricultural land in the subdistrict of Saen Thong (Nan Province, Thailand) [10]. The specific aims of the present study are (1) to assess the wildlife diversity present in the investigated location, (2) to identify the co-occurrence of species, and (3) to identify synanthropic species and species central in the sharing of habitats. For these, we used the data obtained from a set of camera traps and live traps arranged along the gradient following the protocol and methodologies of the Spillover Interface project [10]. The results obtained are a first step to identify potential wildlife species, including synanthropic species, and habitat interfaces of importance for zoonotic disease risk and spread.

2. Materials and Methods

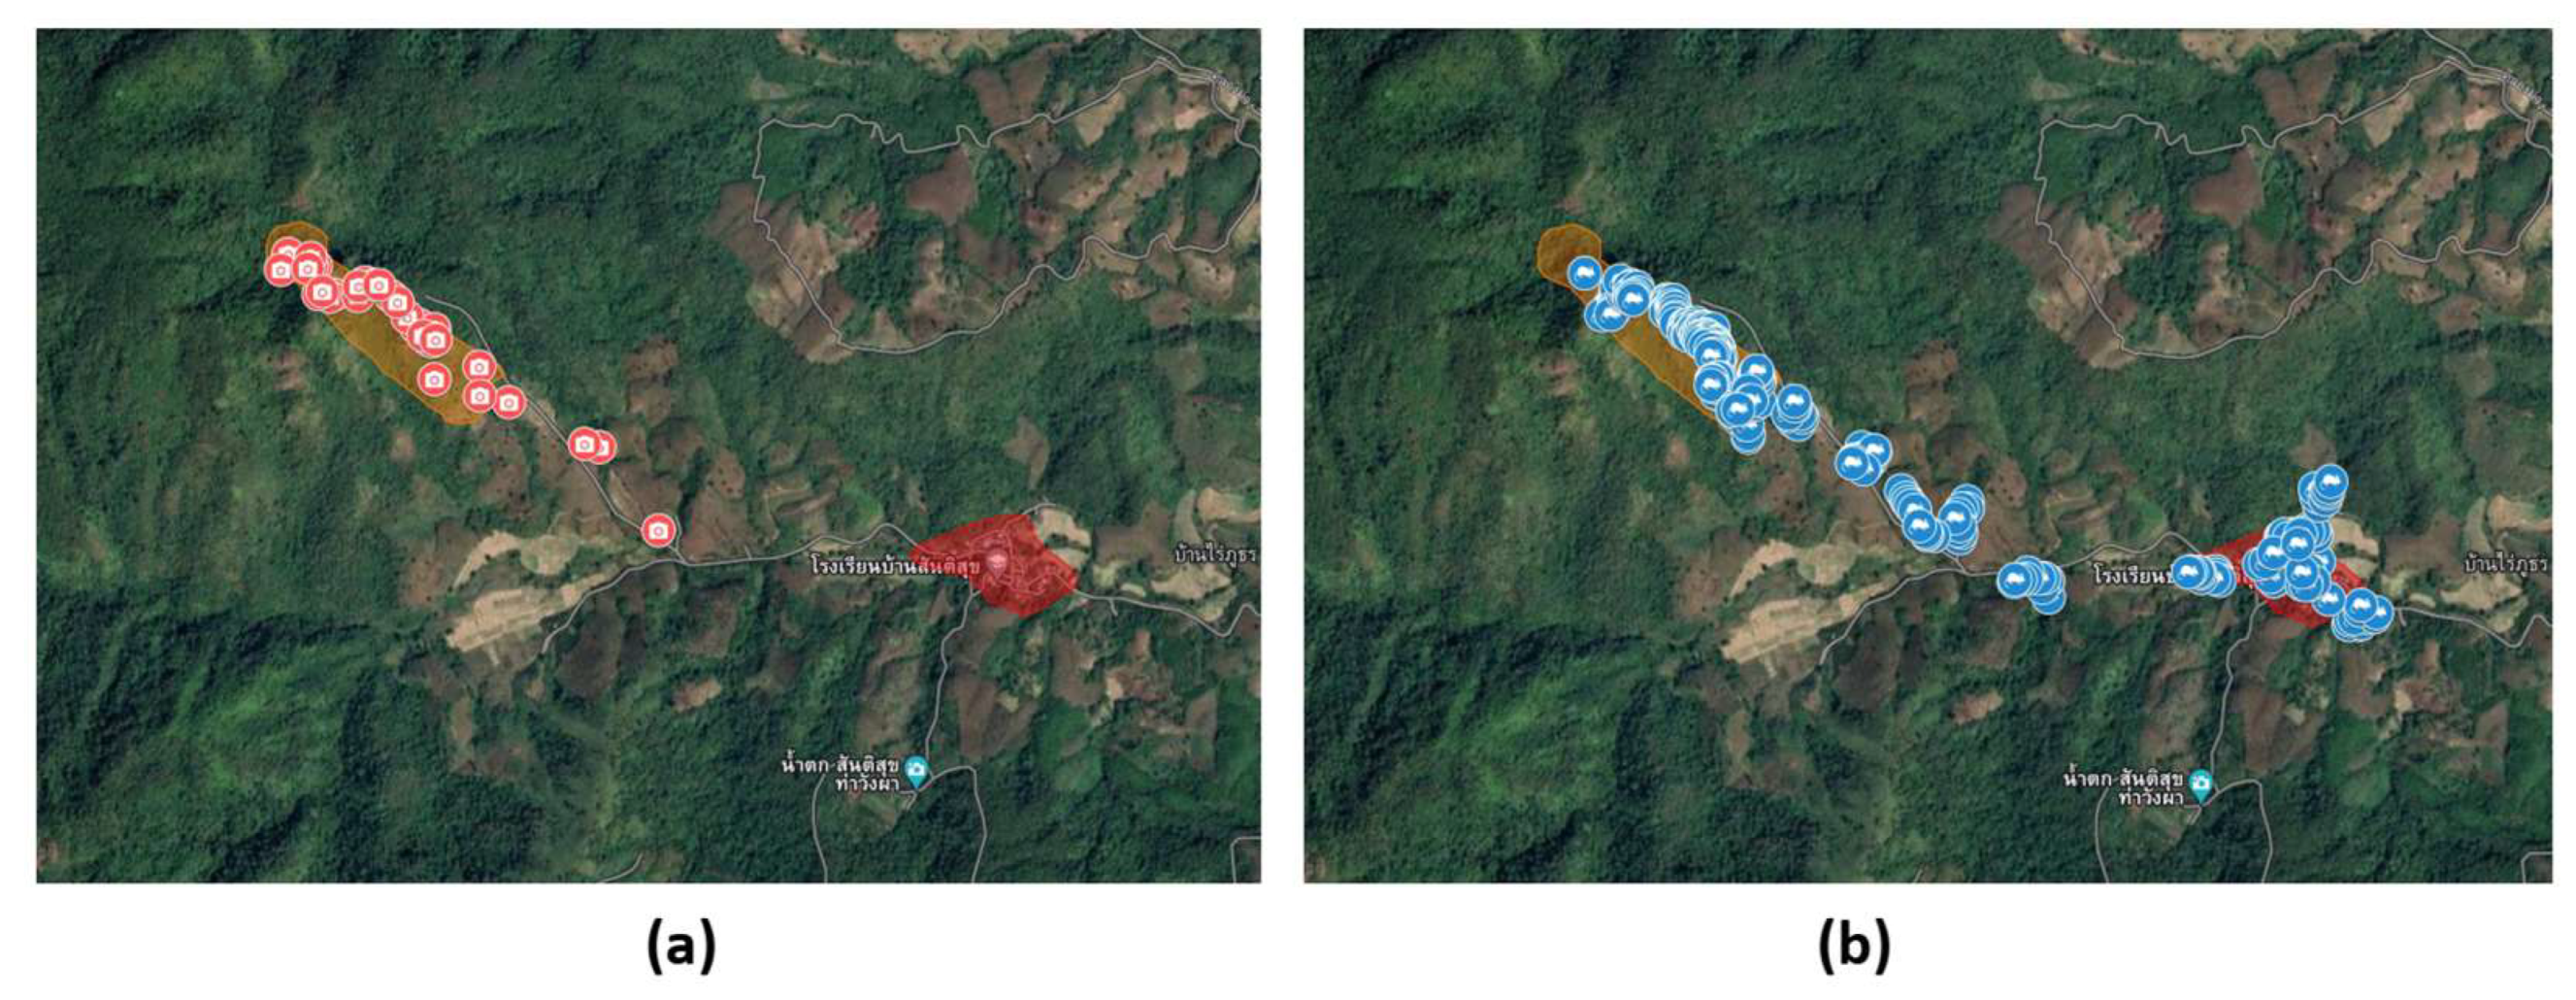
Study area. Since 2012, we have been conducting collaborative studies with local communities and administrations, such as the National Park of Nanthaburi in the subdistrict of Saen Thong (Nan Province, Thailand). The upland part of the subdistrict near the village of Santisuk provided an ideal site with a gradient from the protected area of Nanthaburi National Park to the reforestation area, plantations, agricultural land, and village (Figure 1a,b).
Research and ethical approvals. The study was approved by the Royal Forest Department and Department of National Parks, Wildlife and Plant Conservation. This permission approves trapping of rodents and bats and setting camera traps in the area. Animal ethics guidelines for the trapping, manipulation and anaesthesia, and tissue collection of rodents were provided by Kasetsart University (ACKU64-VTN-010).
Camera trap setting. We positioned 32 camera traps (model: Boly Guard, SG2060-D, Boly Inc., Santa Clara, CA, USA) with the help of the rangers of Nanthaburi National Park and village volunteers of Santisuk (Figure 2a and Figure 3). The internal setting of camera trap was photo mode, one photo burst, normal PIR trigger with 5 s interval, and xenon flash type. A first set of 25 camera traps was set up in the reforested area on 19 November 2021. A second set of 7 camera traps was set up in the plantation area on 3 March 2022. All camera traps were retrieved on 22 December 2022 (see Table 1). The camera traps were checked at least every three months. Batteries were replaced and pictures collected. Pictures were sorted, and identification of species was assessed by consensus among research team members using reference book [11]. The sorted pictures by species and by camera traps were analysed using the ‘camtrapR’ (version 2.2.0) package [12] implemented in R freeware (version 4.3.1) [13], which allows the exploration of the spatiotemporal activities of animals, including roaming domestic dogs.
Rodent trap setting. Rodent traps covered several habitat types: village, agriculture crops, plantations, and reforestation area at the edge of the National Park. Locally made cage traps were used. A total of 210 traps were set: 40 traps in and around the village, 60 traps in agricultural lands and plantations, 100 traps in the reforestation area, and 10 traps inside a cave (see Figure 3) in the area of the National Park (Figure 1b and Figure 3). Trapping sessions were conducted over a 4-night period for each of three sessions (first session started on 20 December 2021, second session on 27 February 2022, and third session on 19 December 2022). This corresponded to a total of 840 night traps per trapping session. The traps were left in the same positions for each session. Fresh corn was used as a trapping bait and changed regularly when required. Pictures, habitat descriptions, and rodent trap coordinates followed the protocol of the CERoPath project [14].
Land-use map. A high-resolution land-use map (10 m) of Saen Thong subdistrict was developed using Copernicus satellite data [15]. The land-use classification was validated on the ground, making it possible to separate multispecific forests, including reforestation areas and community forests, from plantations (such as rubber, teak, bamboo plantations, or even orchards). The land-use classification also helps to distinguish the dominant crops (e.g., corn, paddy rice, and ginger), plantations (e.g., rubber, teak, and orchard), houses, and other infrastructures (Figure 1a,b). A terrain elevation model was also developed [15]. We used this land-use map to extract the main land-use class, or habitat, in each 25 m buffer around each location of camera traps and rodent traps using the function ‘PatchStat’ from the SDMTools (version 1.1-221.2) package [16] in R. The values of the habitat surrounding each device, either camera traps or live traps, were used for the subsequent network analyses.
Statistical analysis. Species richness was defined as the observed number of small mammals found at different cage traps or mammal species detected at different camera traps. The first-order Jackknife 1 and bootstrap [17] were used to estimate species richness with the ‘vegan’ (version 2.5-3) [18] and ’BiodiversityR’ (version 2.15-3) packages [19] in R. To control for potential bias due to unequal number of days, we computed the number of camera trap detections per day for the mammal species that were observed in all habitats (protected area, reforestation, and plantation). A pairwise Wilcoxon test was used to detect differences in camera trap detections among habitats. We used network analysis with mammal species interacting with habitats, given by the land-use, in which they were observed, using the ‘bipartite’ (version 2.18) package [20,21] implemented in R. The matrix of presence/absence of each mammal species was projected onto unipartite networks using the ‘tnet’ (version 3.0.16) package [22] implemented in R. A unipartite network represented relative interactions amongst mammals through the sharing of habitats (i.e., protected area, cave, reforestation area, rubber plantation, orchard, rain-fed land or paddy field, and village). Each mammal species within the network played a different role in habitat sharing relative to all other mammal species. We used the function ‘cluster_louvain’ implemented in the package ‘igraph’ (version 1.5.1) [23] to identify the modularity structure of the unipartite networks, which is based on a multilevel modularity optimisation algorithm [24]. A mammal species central in the unipartite network, i.e., having a high centrality value, was the one that was highly connected to other mammal species and thus was supposed to have a greater chance to co-occur with them. We calculated the eigenvalue centrality (EC) of mammal species among habitats with the ‘evcent’ function from the package ‘igraph’ [23]. Then, we inversed the precedent unipartite network to obtain a new unipartite network where habitats, the new nodes, were linked by the sharing of mammal species, i.e., the species that occurred between habitats. Similarly, we calculated the eigenvalue centrality (EC) of habitats based on shared mammal species. Finally, to visualise the sharing of habitats among mammal species, we computed the modularity of the bipartite network where nodes from mammal species interacted with nodes of the different habitats. We used the ‘computeModules’ function of the package ‘bipartite’ implemented in R to compute modules using the modularity algorithm of Dormann and Strau [25].

3. Results

3.1. Camera Trapping

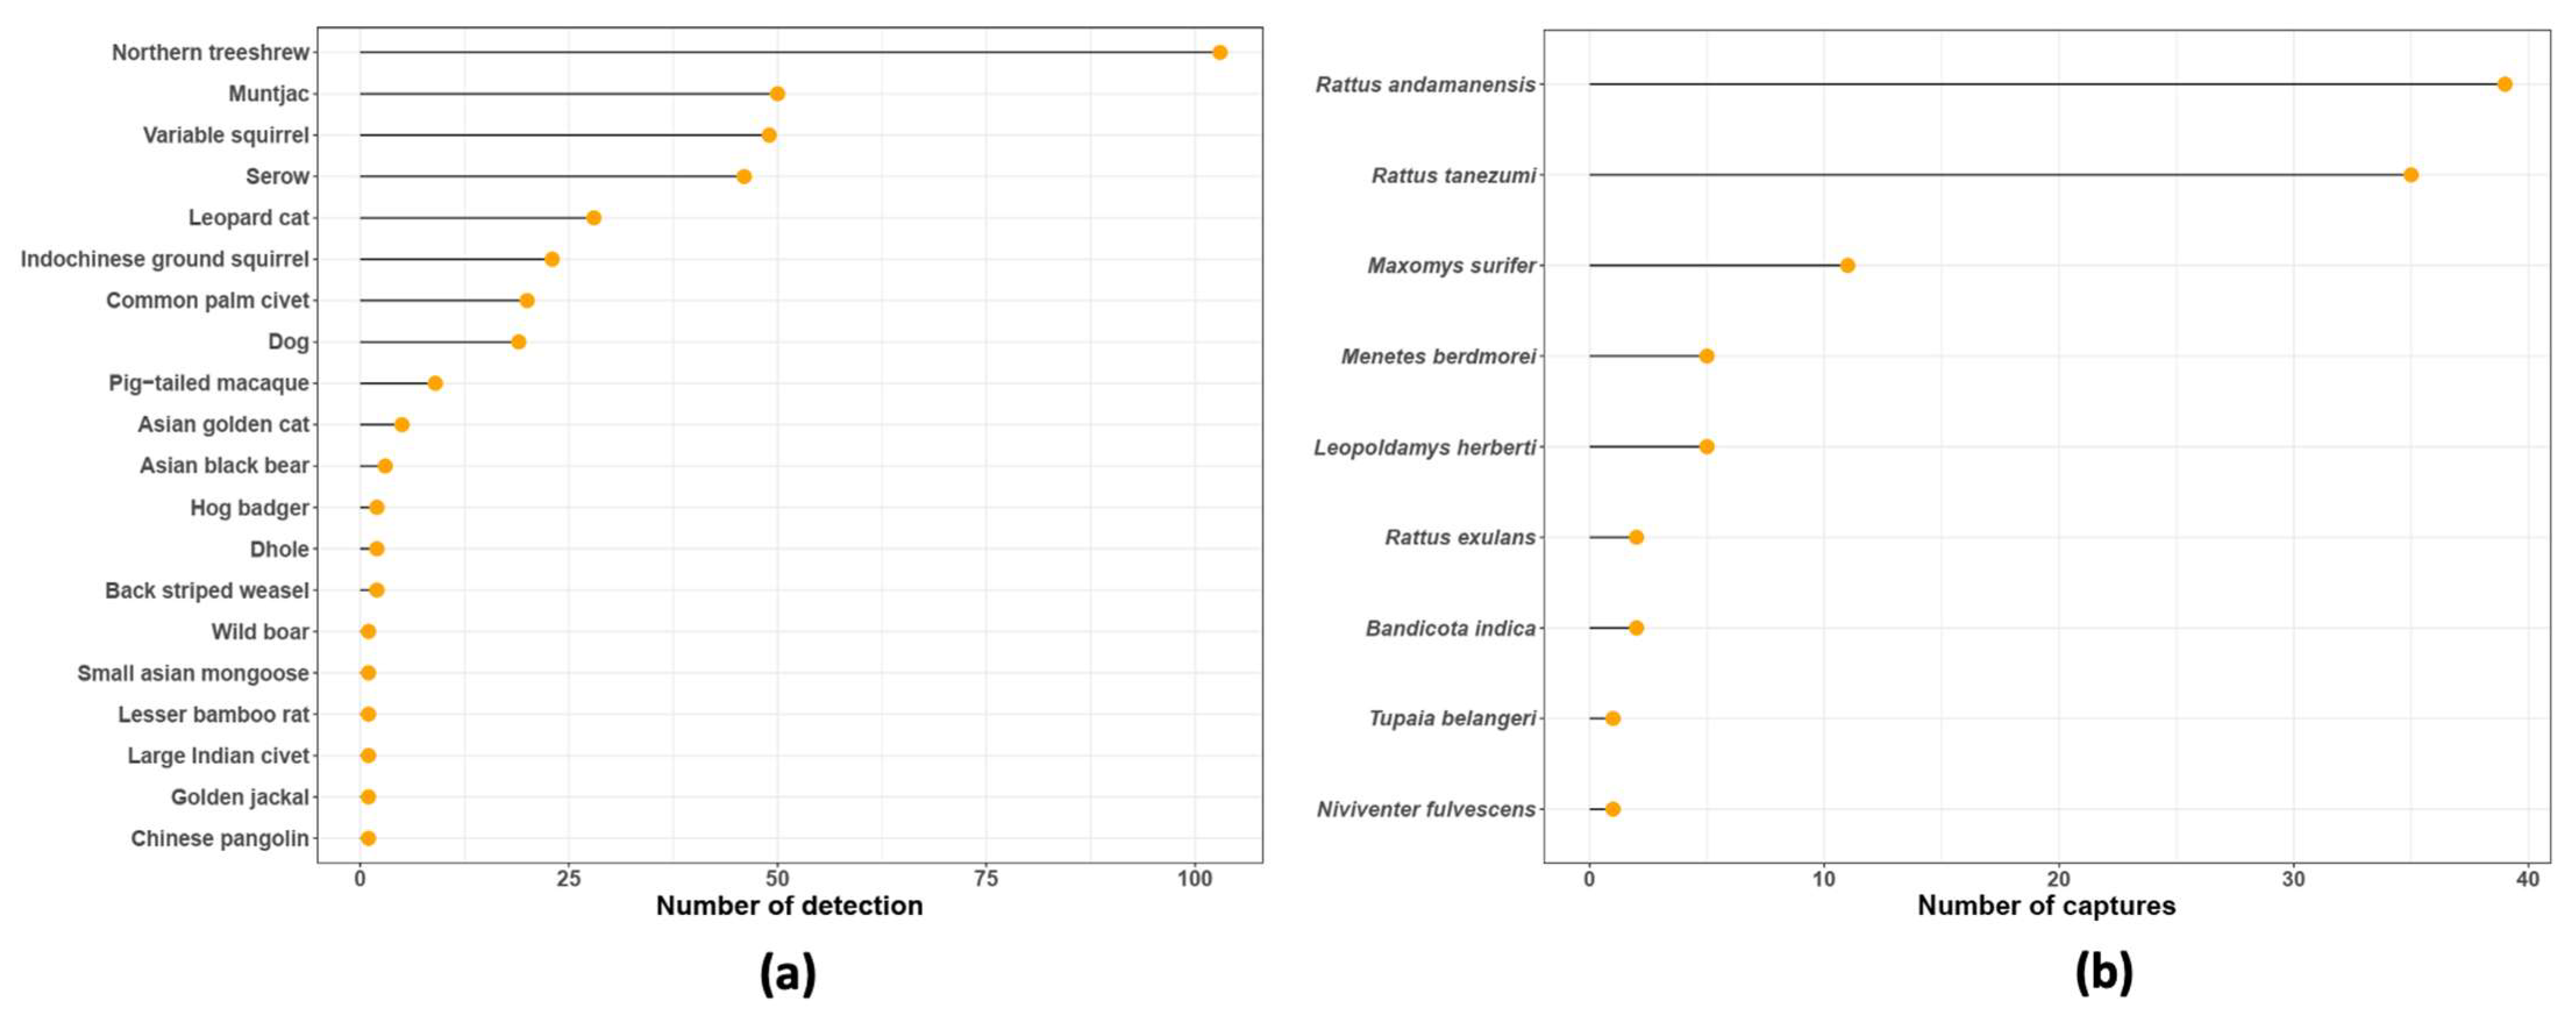
From the sessions of camera traps, we observed a total of at least 20 wild mammal species, including Indochinese serow (Capricornis milneedwardsi), red muntjac (Muntiacus muntjak), Northern pig-tailed macaque (Macaca leonina), leopard cat (Prionailurus bengalensis), Asian golden cat (Catopuma temminckii), back-striped weasel (Mustela strigidorsa), dhole (Cuon alpinus), golden jackal (Canis aureus), greater hog badger (Arctonyx collaris), small Asian mongoose (Herpestes javanicus), common palm civet (Paradoxurus hermaphroditus), large Indian civet (Viverra zibetha), Asian black bear (Ursus thibetanus), wild boar (Sus scrofa), Northern treeshrew (Tupaia belangeri), variable squirrel (Callosciurus finalaysonii), Indochinese ground squirrel (Menetes berdmorei), Chinese pangolin (Manis pentadactaly), lesser bamboo rat (Cannomys badius), various species of murid rodents, and bats (Table A1). Murid species were difficult to assess at the species level, although it was possible to recognise members of the three genera: Leopoldamys, Maxomys, and Rattus. We could not identify bat species from captured pictures. However, we observed bat species inside the cave by trapping and found only one bat species, the black-bearded tomb bat (Taphozous melanopogon). We also observed the domestic dog (Canis lupus familiaris). Some species showed a high level of detection, such as Northern treeshrew, red muntjac, variable squirrel, and leopard cat, while some species were rarely detected, such as Chinese pangolin, golden jackal, and lesser bamboo rat (Figure 4a).

3.2. Live Trapping of Small Mammals

From three sessions of small mammal trapping, we captured a total of nine species, including Northern treeshrew (Tupaia belangeri), Indochinese ground squirrel (Menetes berdmorei), greater bandicoot rat (Bandicota indica), Herbert’s long-tailed giant rat (Leopoldamys herberti), red spiny rat (Maxomys surifer), chestnut white-bellied rat (Niviventer mekongis, Indochinese forest rat (Rattus andamanensis), house rat (Rattus exulans), and oriental house rat (Rattus tanezumi) (Table A3). Some species were frequently trapped, such as R. andamanensis and R. tanezumi. Some other species were rarely trapped, such as N. mekongis or Northern treeshrew, even if this last species was highly detected by the camera traps (Figure 4b).

3.3. Species Richness

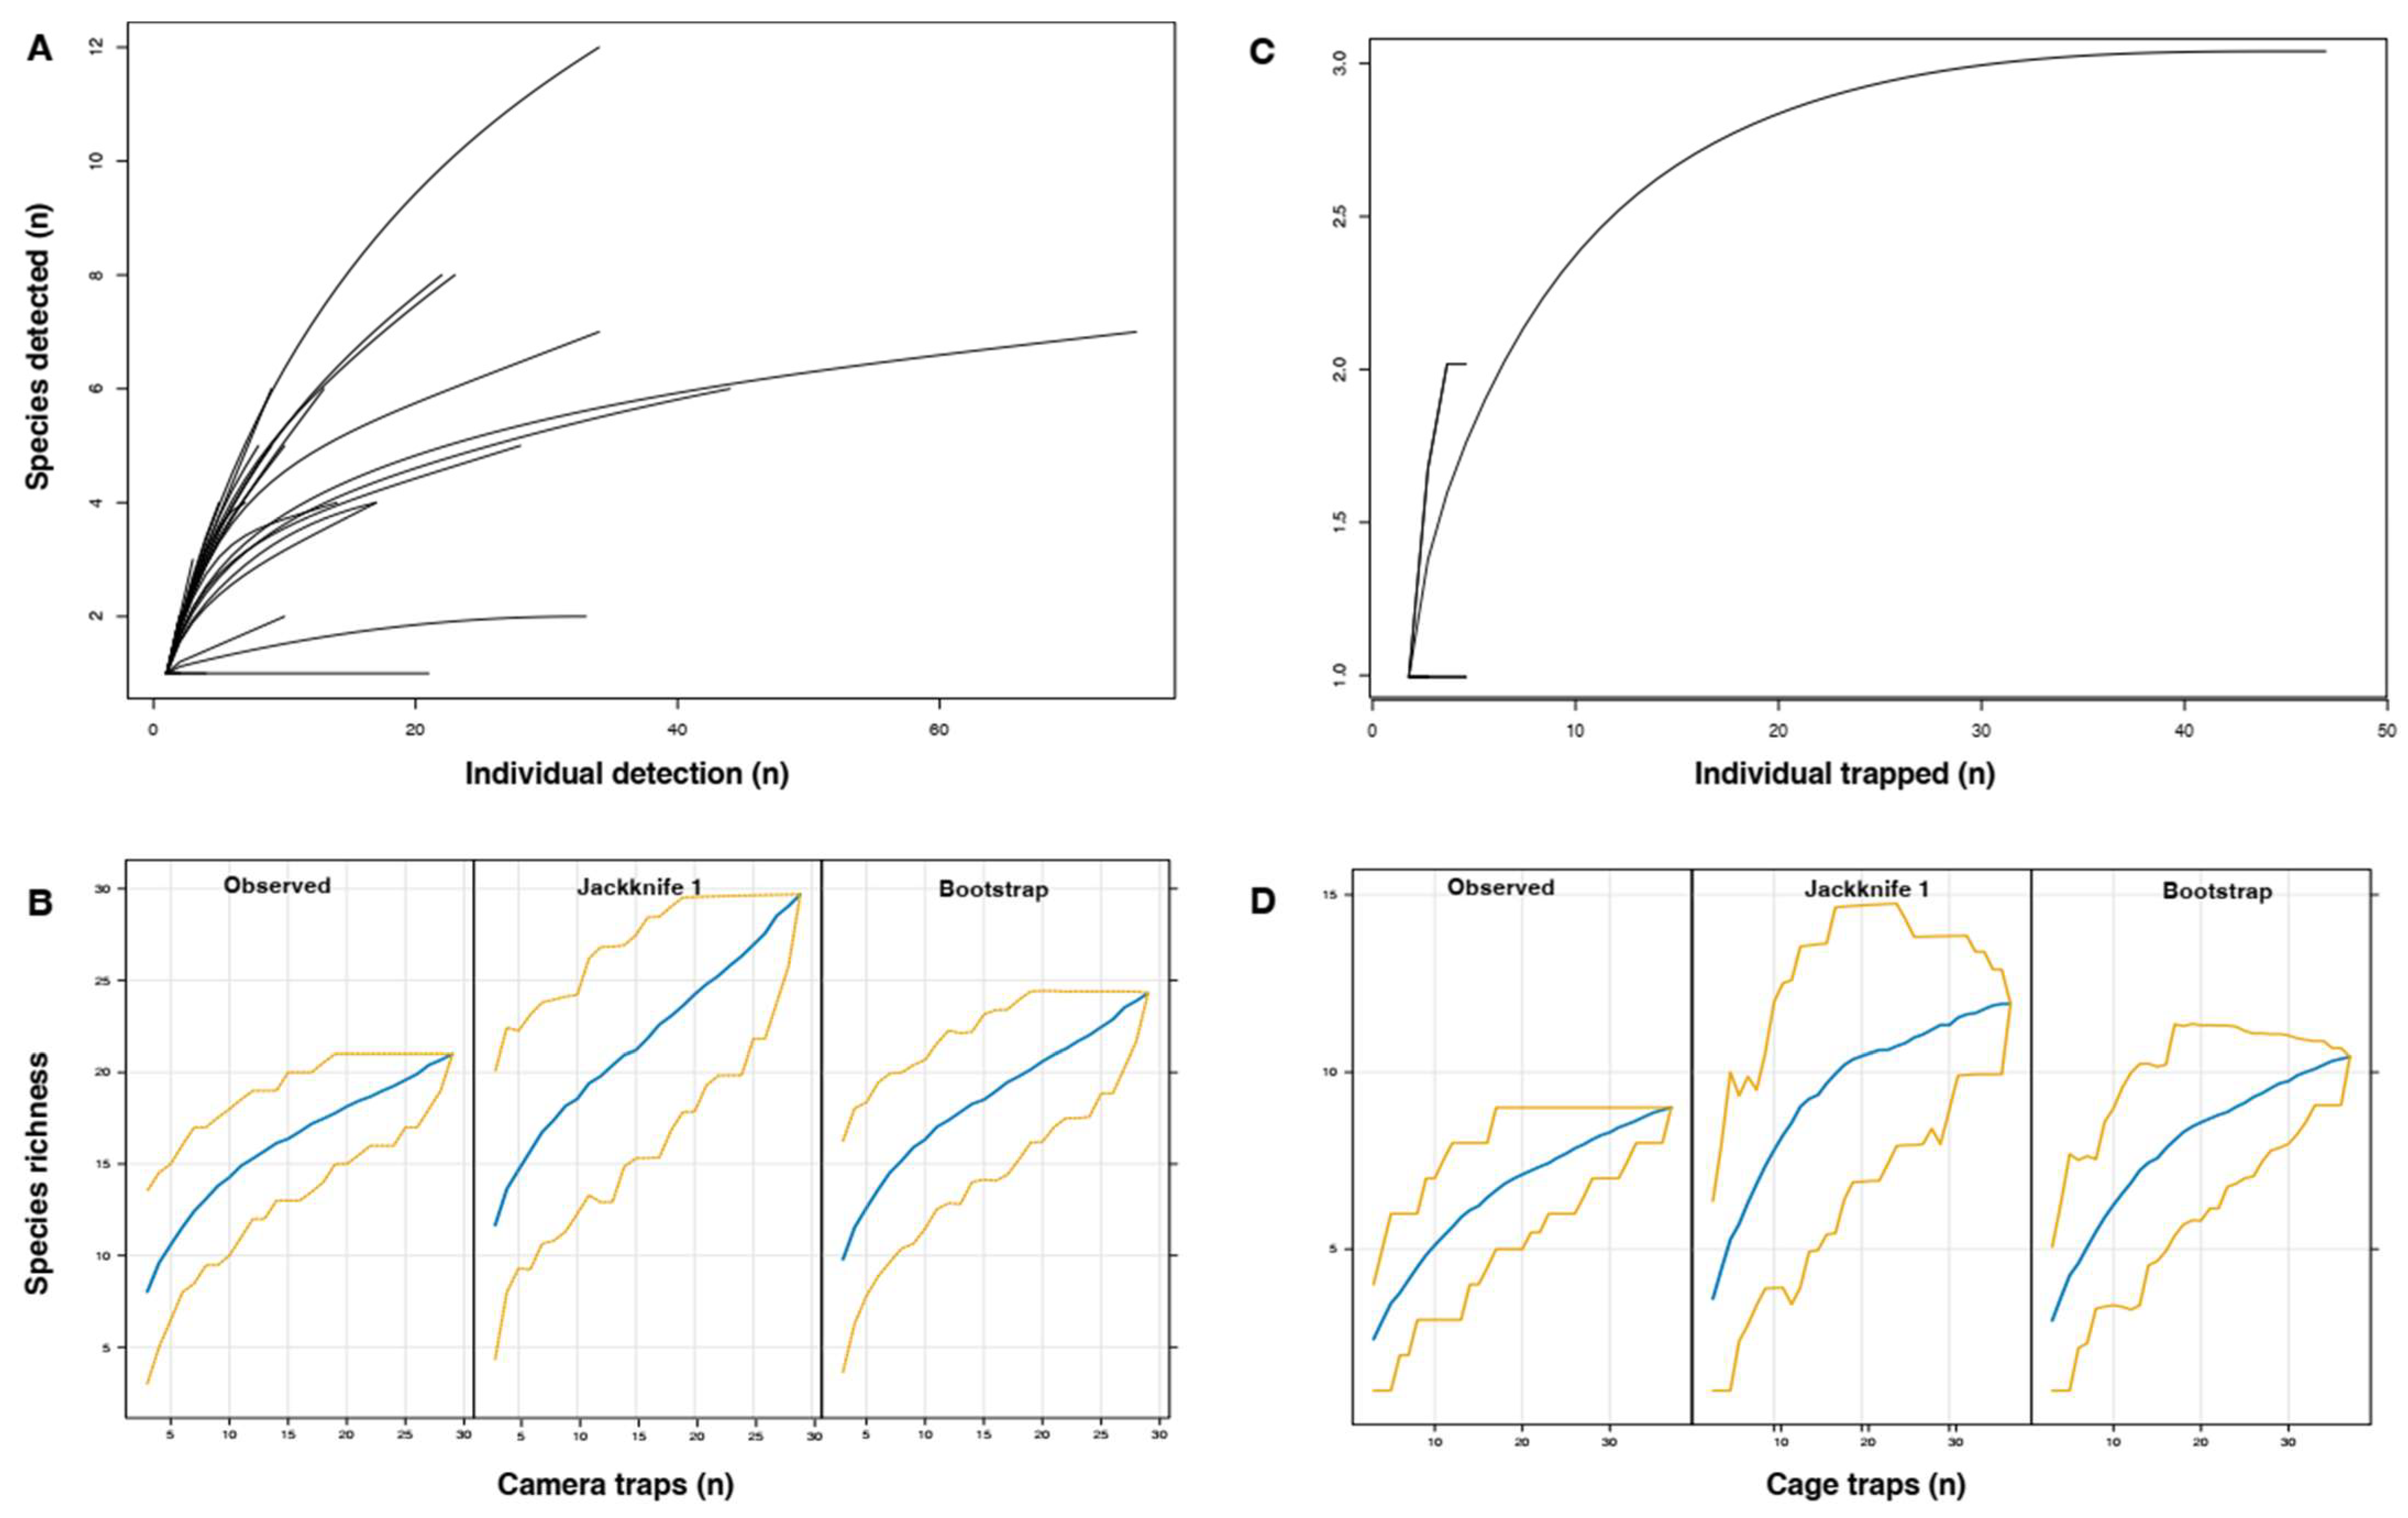
The number of species detected by the camera traps by habitat (Table 1) was compared to the estimated number of species using estimators (Table 1, Figure 5).
Both estimators showed that the number of potential species should be higher than the observed number of species using camera traps or cage traps (Figure 5), although the Jackknife 1 estimator gave higher values of species richness than the bootstrap estimator.

3.4. Camera Trap Detections

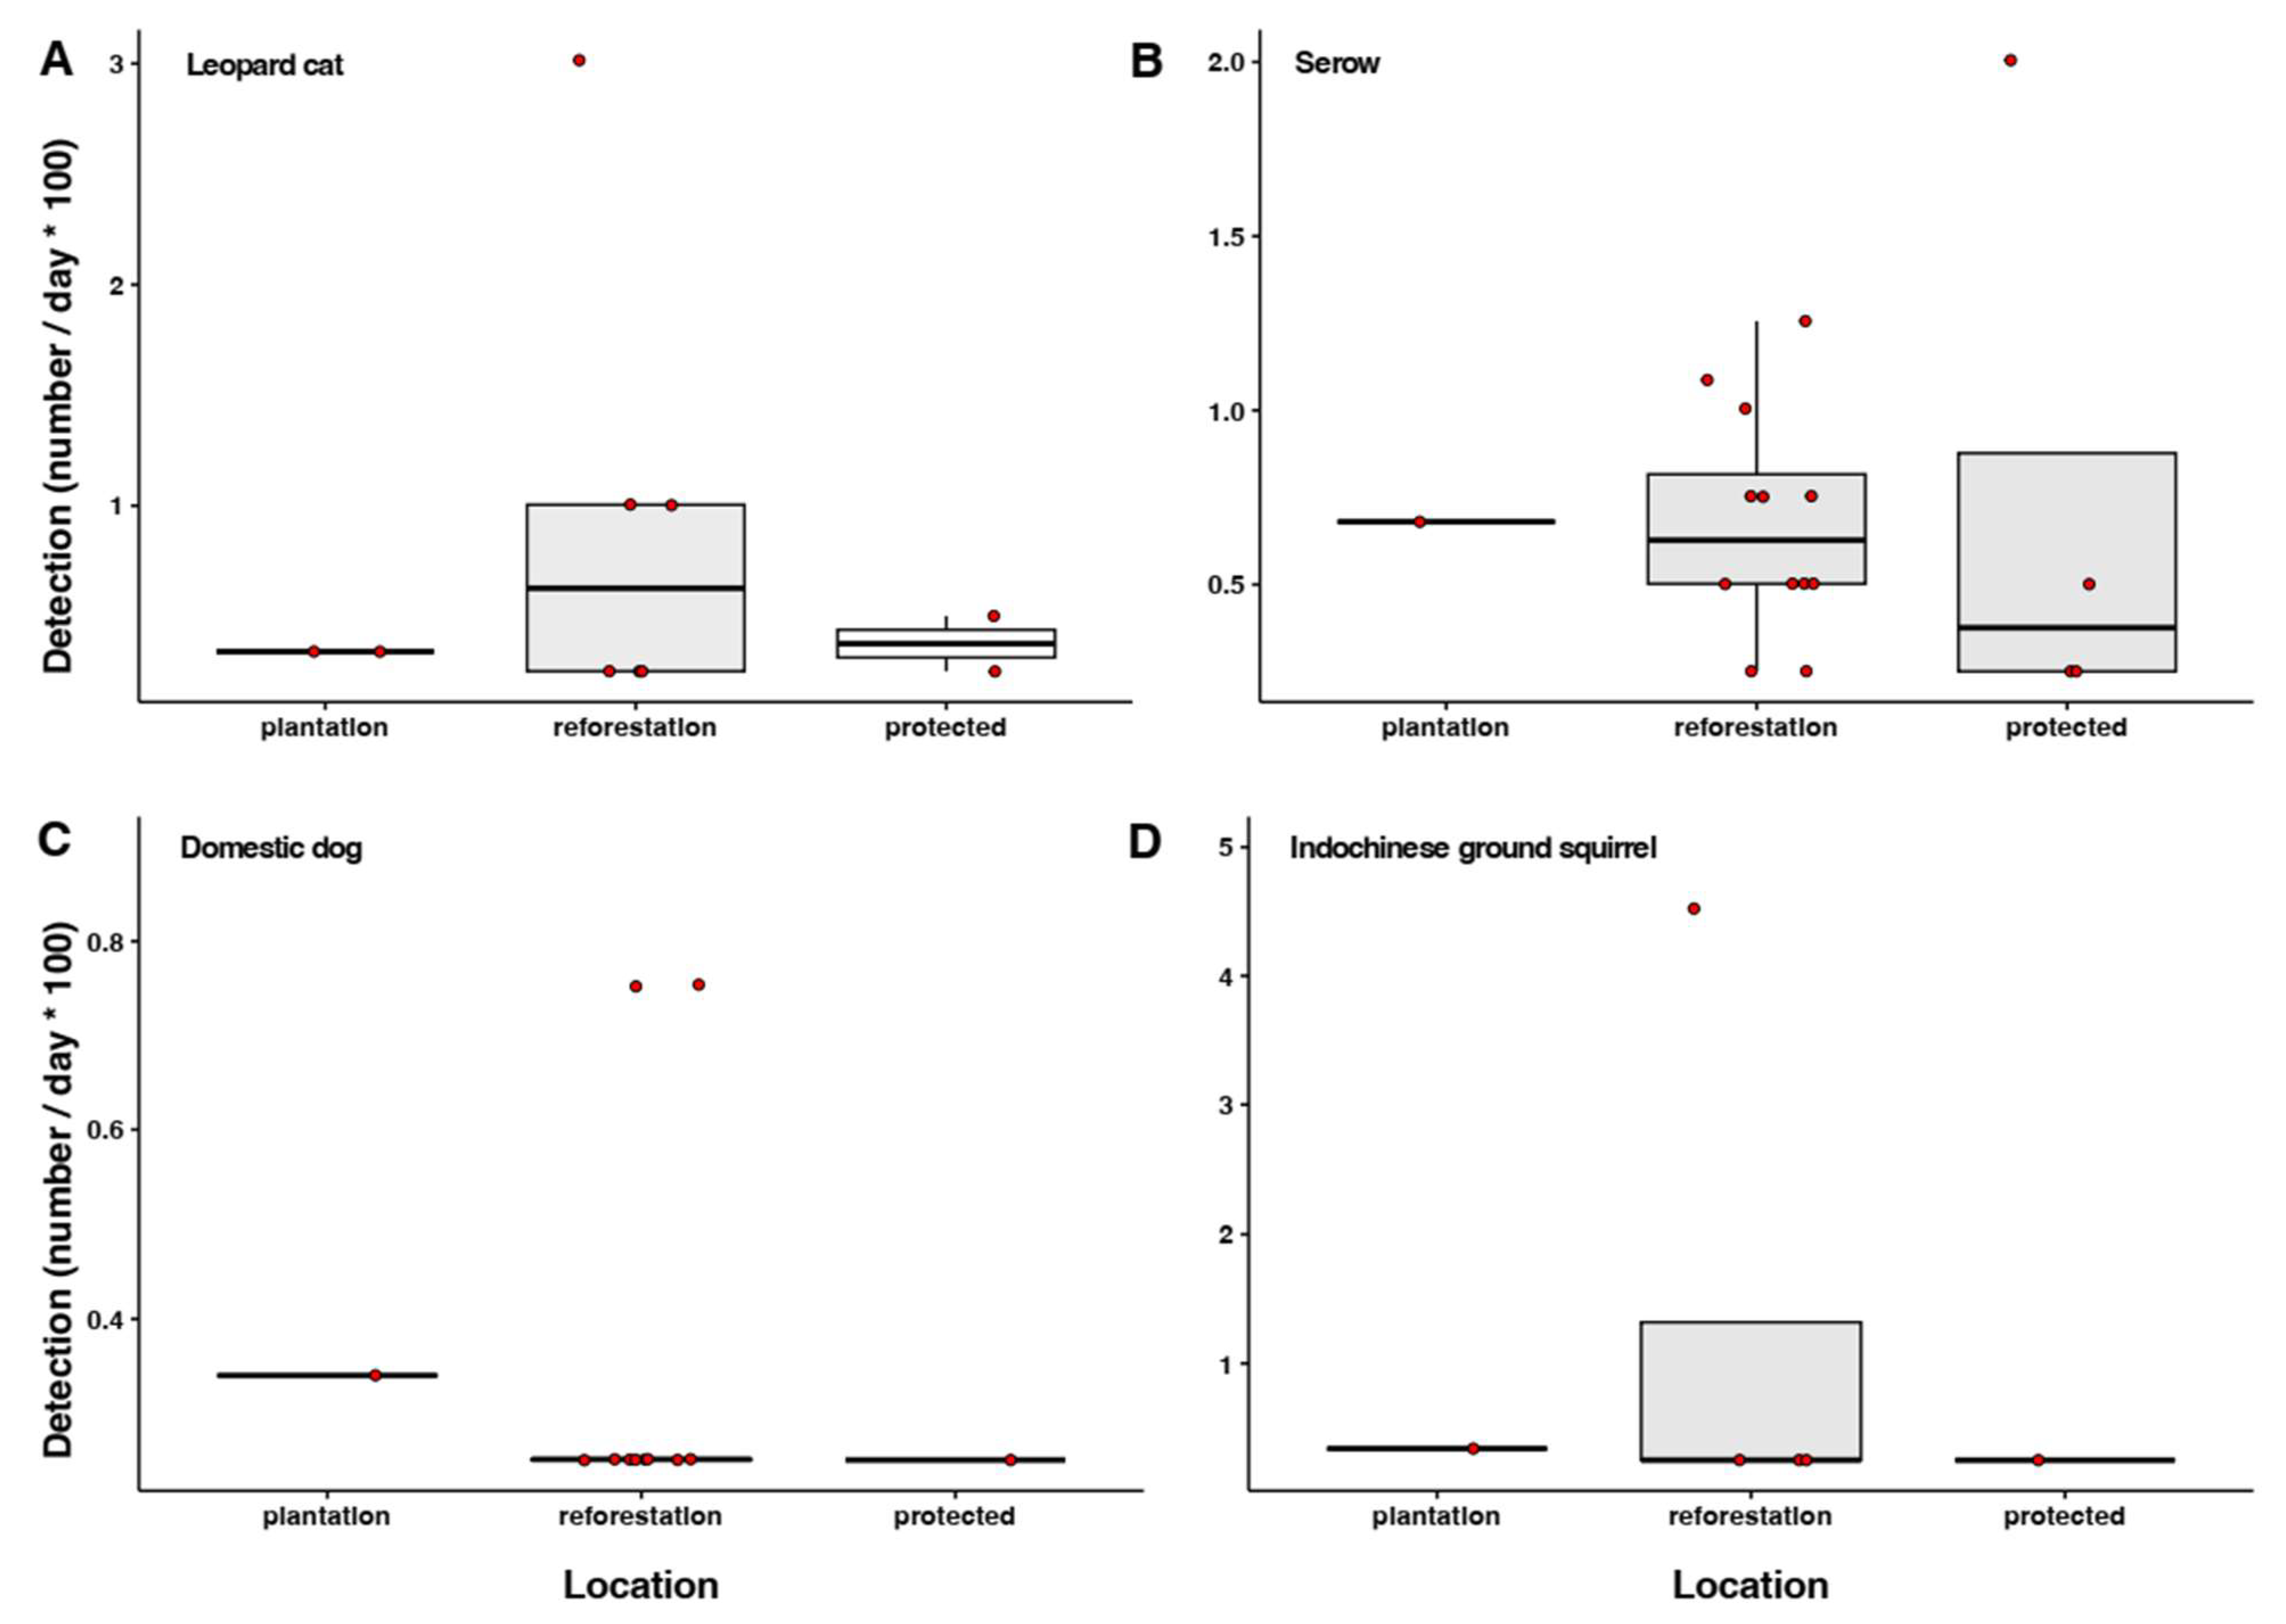
Four species were identified using camera traps in three main habitats (protected area, reforestation, and plantation), namely the leopard cat, serow, Indochinese ground squirrel, and domestic dog (Table 2). We used these four species to assess the potential detection bias due to unequal numbers of camera days between the reforested and plantation areas (Table 1). While there were some variabilities in the number of detections by camera day and by habitat (Figure 6), there were no significant differences between species for each of the three habitats (Wilcoxon rank sum test with continuity correction P = 0.87).

3.5. Species Occurrence in Space

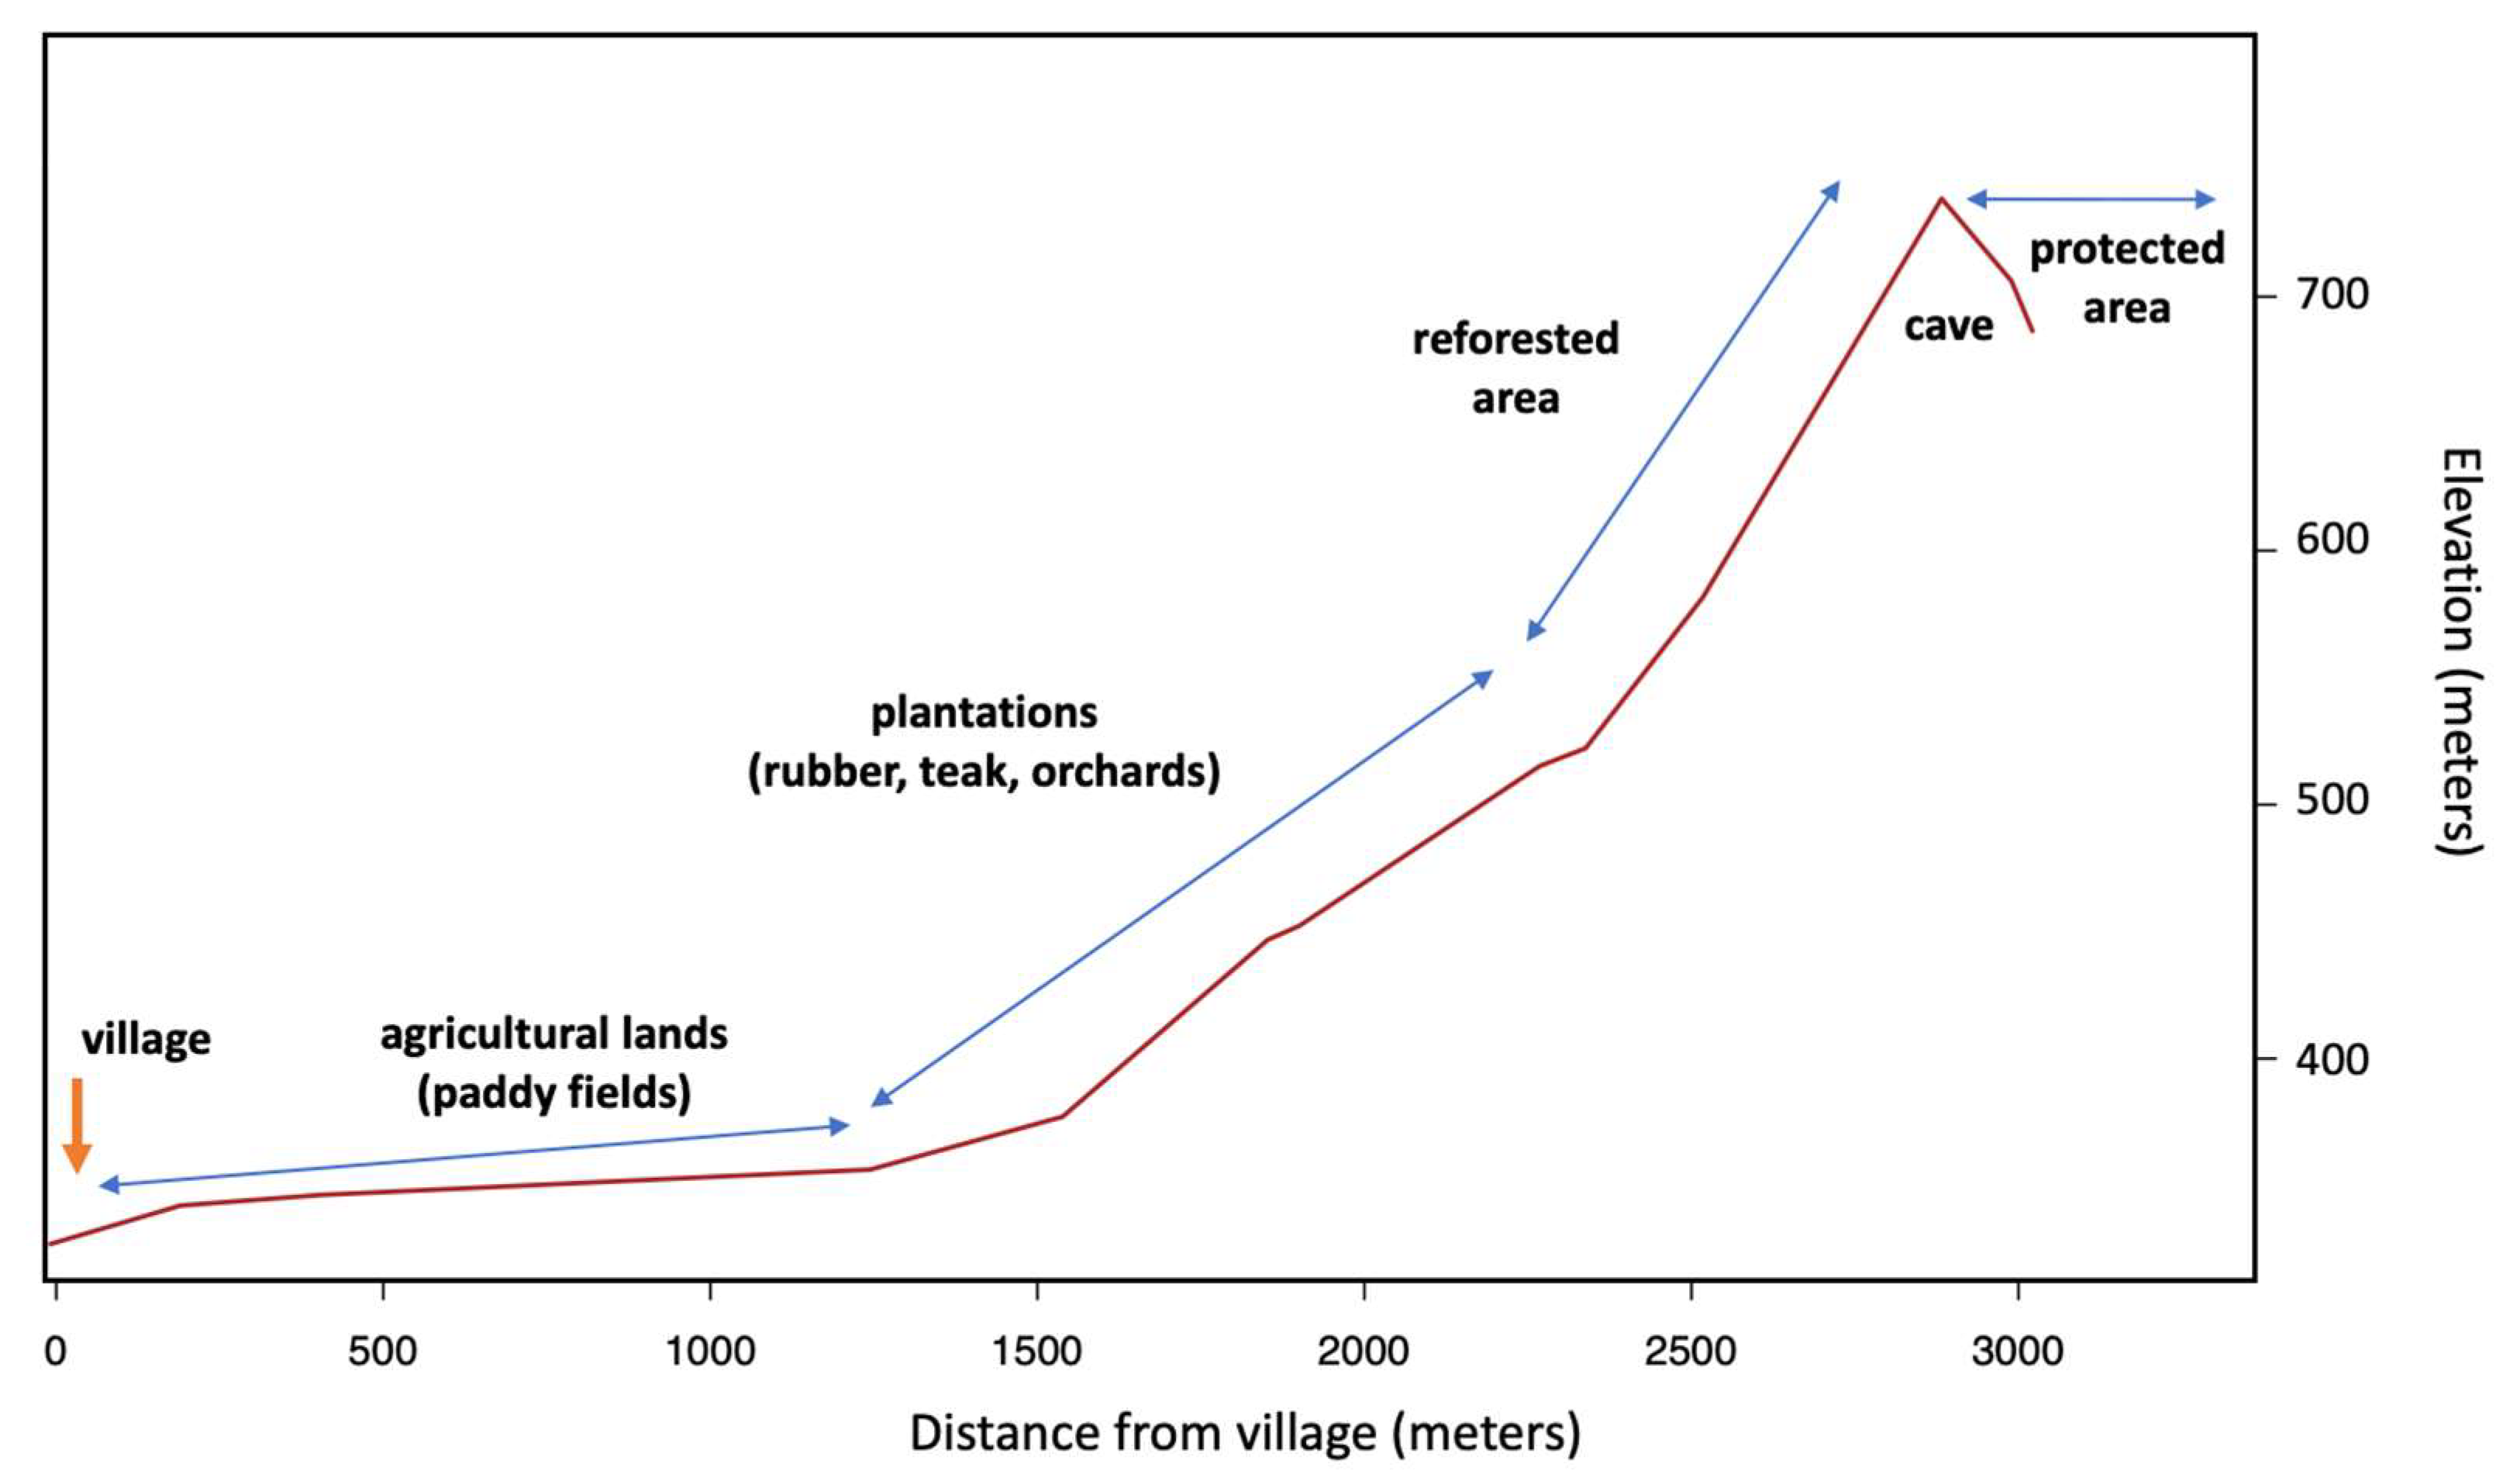
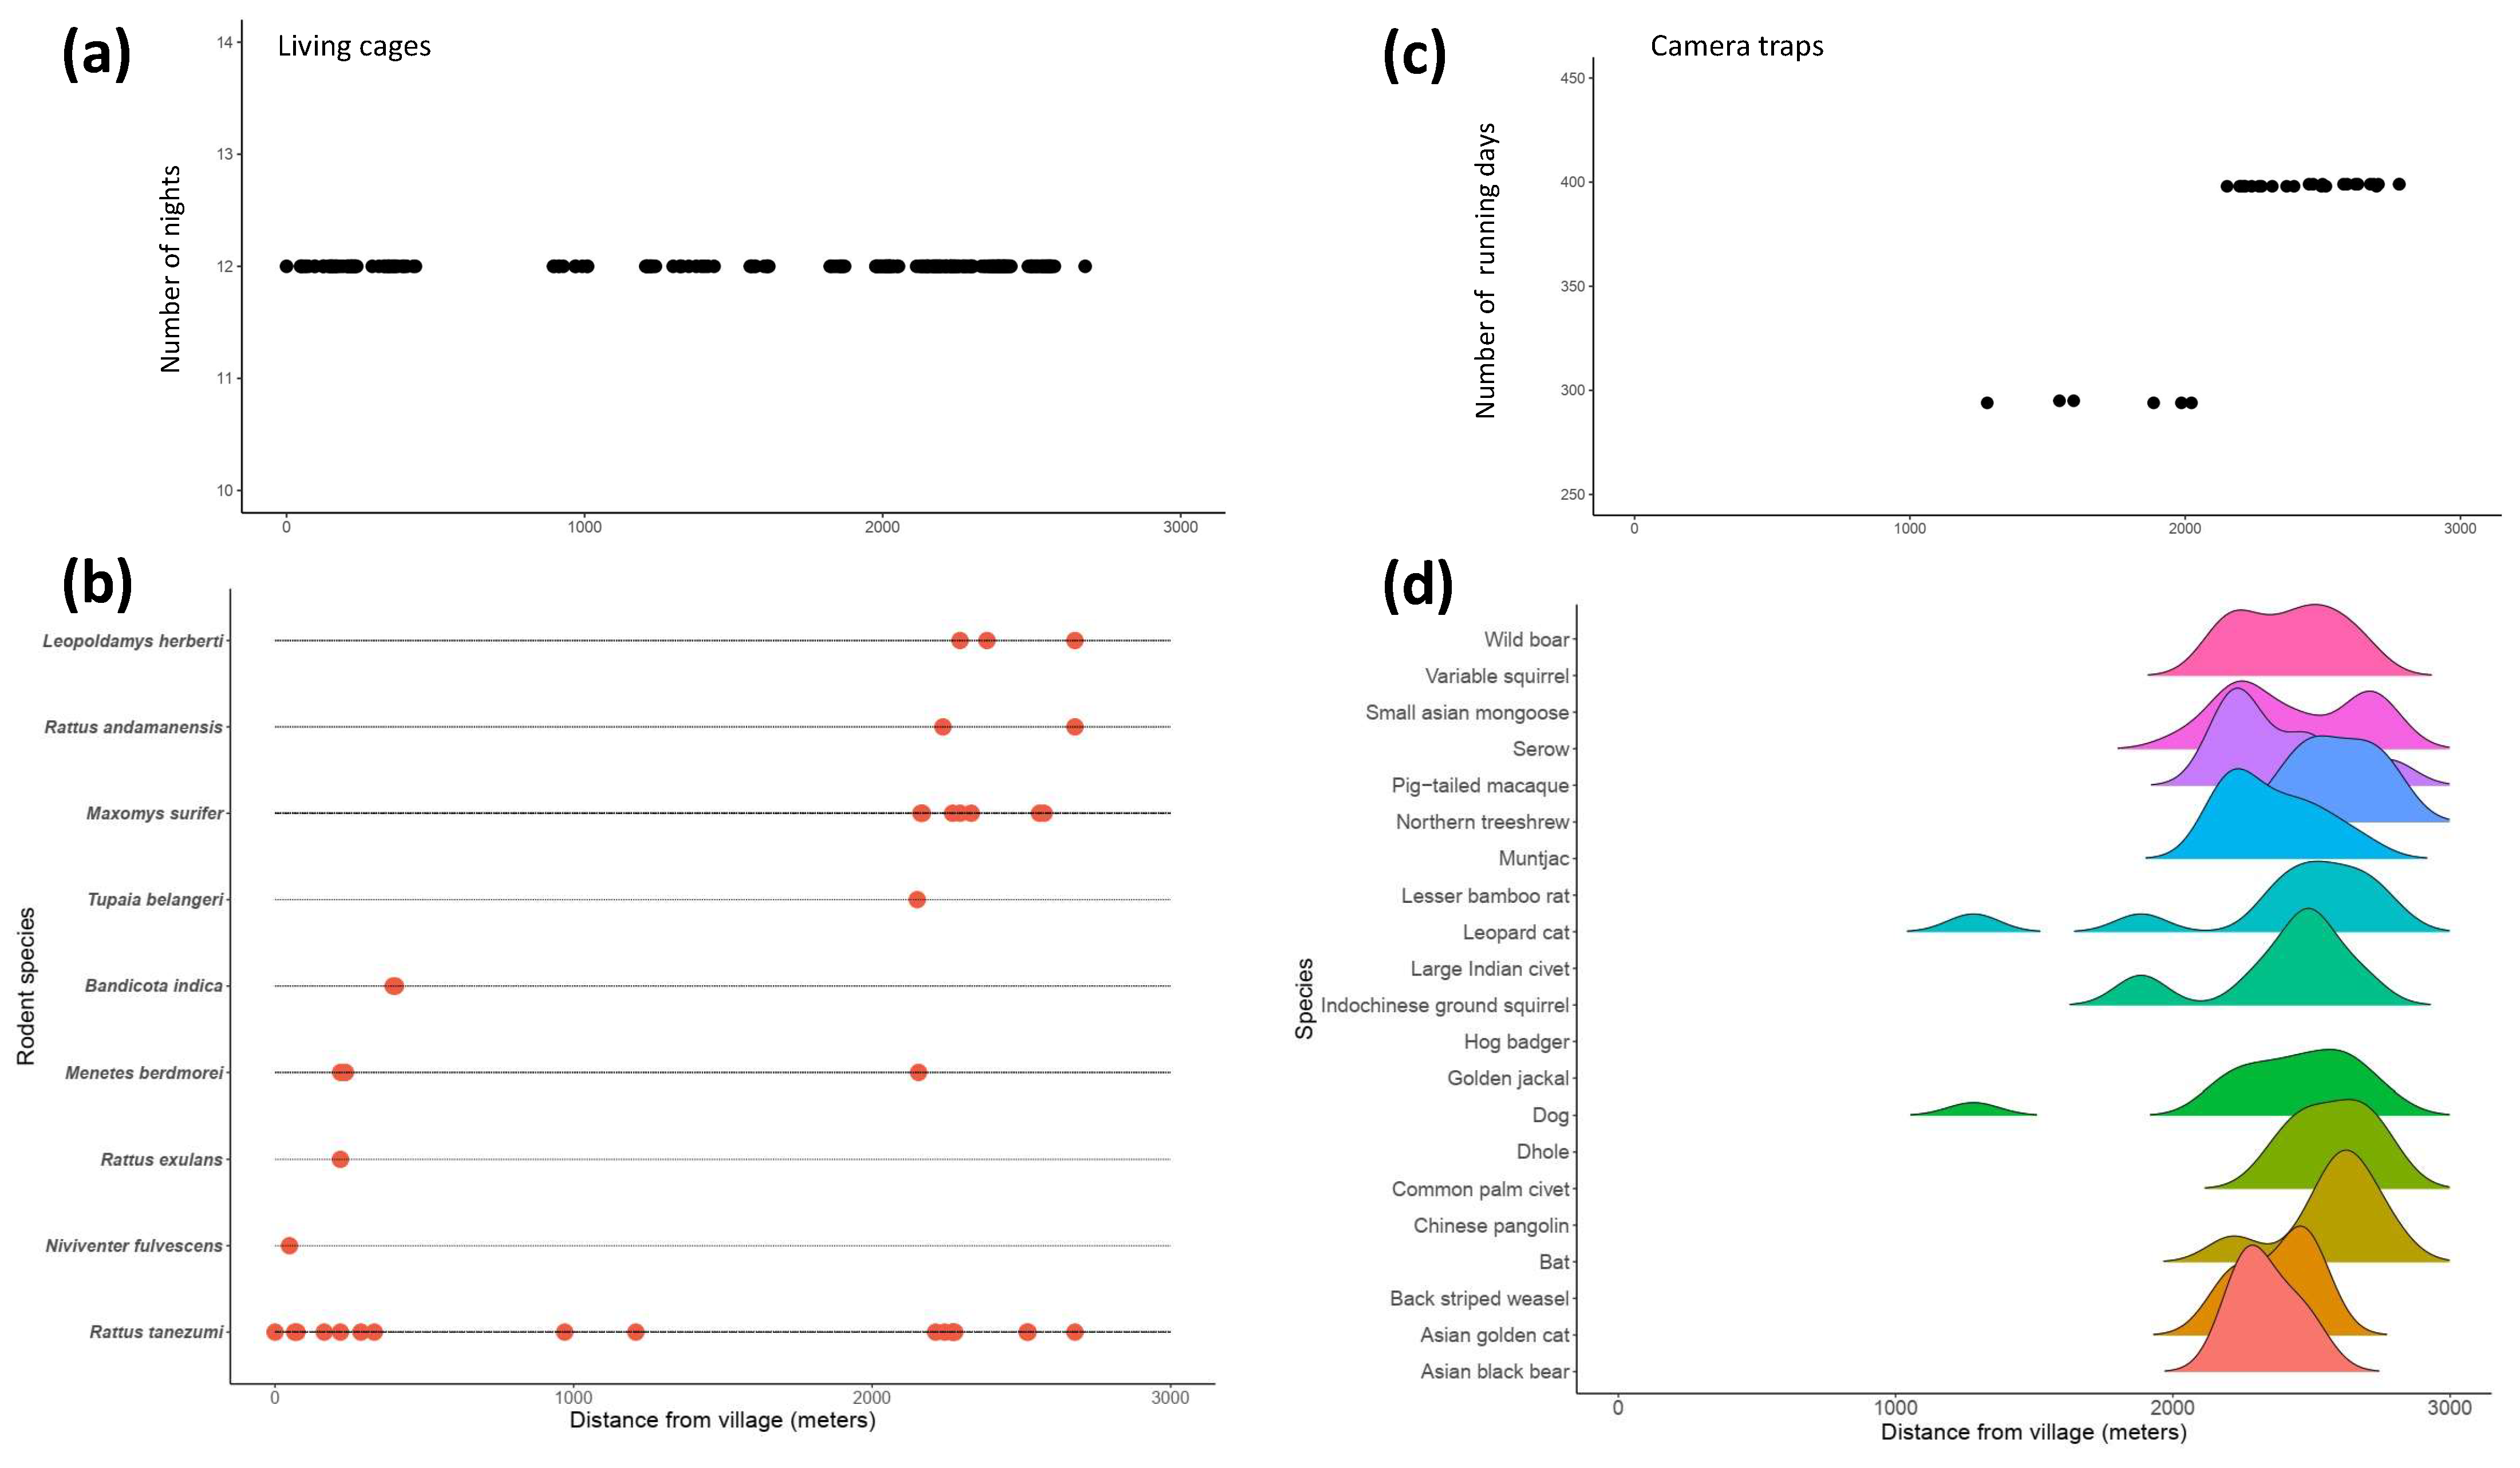
The sessions of the camera traps and the three sessions of the live traps gave a pattern of species diversity in relation to habitat (Table 1). High species richness was observed in the protected and reforested areas, situated in higher elevations and at more than 2000 m from the village (Figure 2 and Figure 7). A low number of species was recorded in plantations situated from 1000 to 2000 m from the village (Figure 2 and Figure 7), with only three species: domestic dog, oriental house rat (R. tanezumi), and leopard cat. The species diversity in croplands and settlements was assessed using only live traps with observations of five small mammals, although domestic dogs were constantly observed.
The live traps helped identify four groups of small mammal species: a first group of forest habitat specialists with L. herberti, M. surifer, and R. andamanensis; a second group of crop specialists with B. indica; a third group of settlement habitat specialists with R. exulans; a fourth group of habitat generalist species with R. tanezumi and M. berdmorei (Figure 5A). Tupaia belangeri (treeshrew) can also be considered as a generalist species as it was previously trapped in a settlement [14].
The camera traps showed that most identified species were forest specialists, with the exception of the leopard cat that roamed in plantations together with the domestic dog (Figure 7b), and more evenly with the serow and Indochinese ground squirrel (Figure 6).
The occurrence of species in relation to the habitats described in the land-use map (Figure 1b) was assessed at each location of the camera traps or rodent traps (Table 2). The forest land classes of the land-use maps were separated into three habitats in relation to our classifications during the field work (see Figure 2) as protected area, cave, and reforested area. The matrix of the occurrence of mammal species by habitat (Table 2) was then used for the network analyses (see below).

3.6. Network Analyses

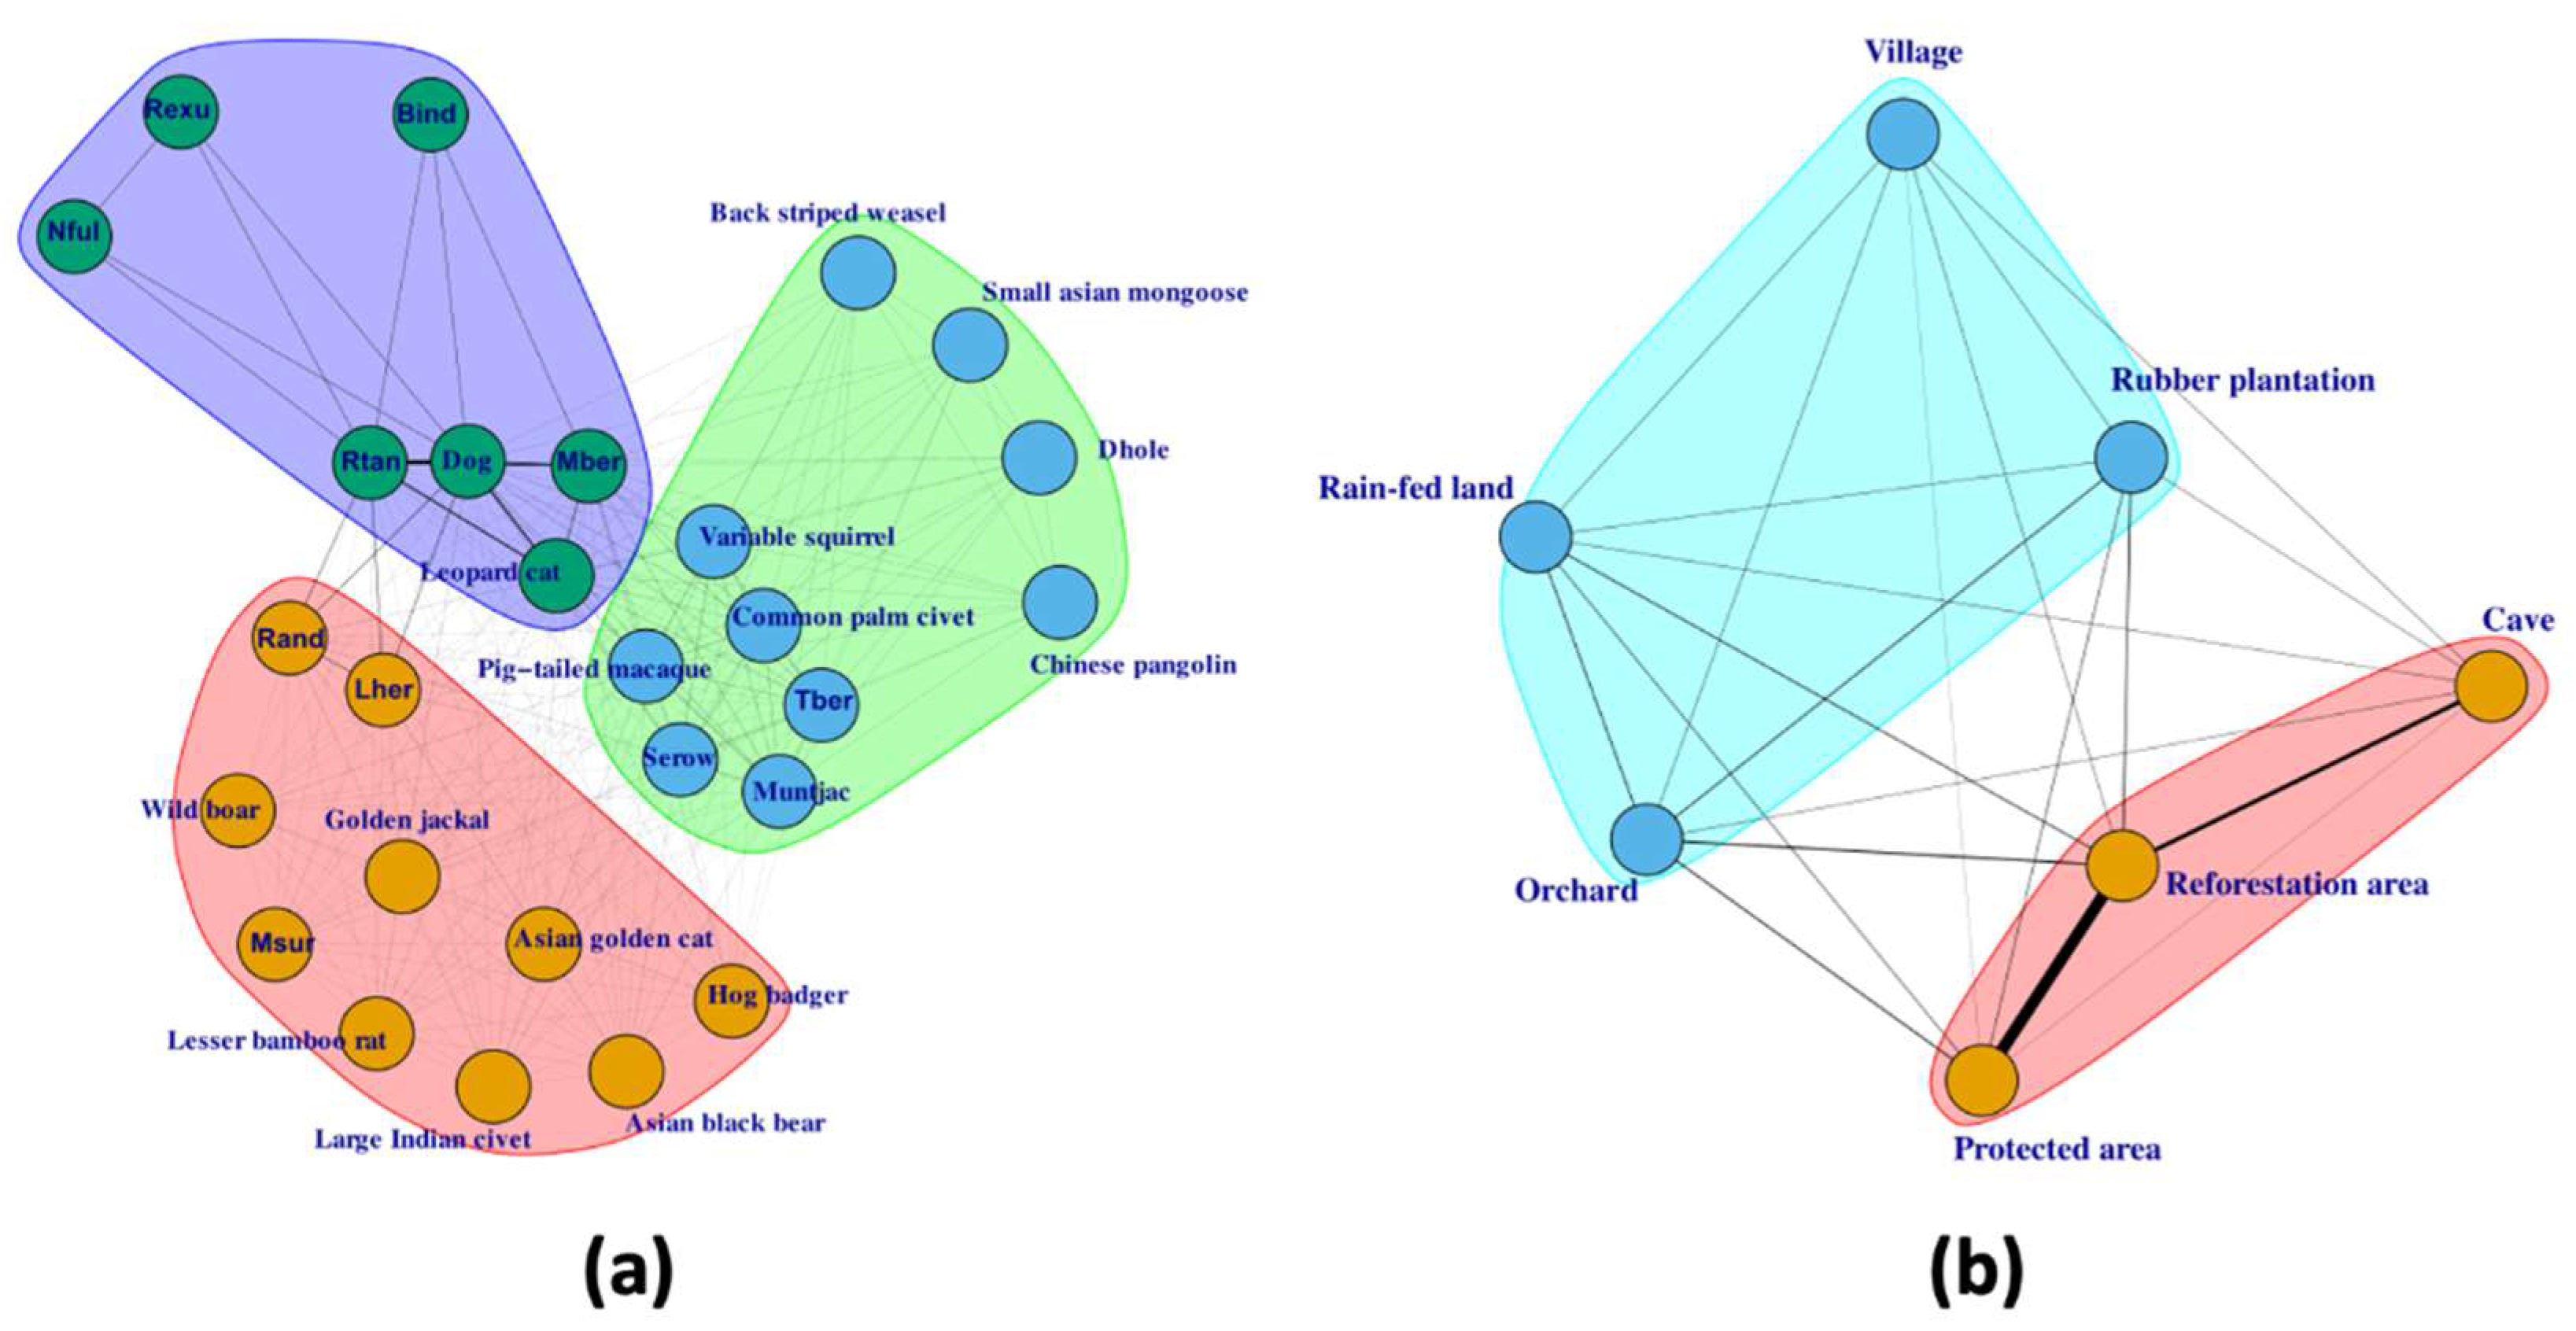
Unipartite network modularity. Three modules were identified in the unipartite network of mammals based on shared habitats (Figure 8a). A first module associated the domestic dog, leopard cat, and five rodent species: R. tanezumi, R. exulans, B. indica, N. mekongis, and M. berdmorei. A second module associated common palm civet, back-striped weasel, dhole, Chinese pangolin, small Asian mongoose, Northern treeshrew (T. belangeri), red muntjac, Indochinese serow, Northern pig-tailed macaque, and variable squirrel. The last module comprised the remaining observed species: Asian golden cat, golden jackal, greater hog badger, large Indian civet, Asian black bear, wild boar (Sus scrofa), and four rodent species: M. surifer, R. andamanensis, L. herberti, and the lesser bamboo rat.
Two modules were identified in the unipartite network of habitats based on the shared mammal species identified (Figure 8b). The first module associated the settlement (village), cropland (rain-fed land), and plantations (rubber tree and orchard). The second module associated the protected area, the cave, and the reforestation area.
Host centrality. The domestic dog and R. tanezumi had the highest values of centrality in the unipartite network of mammal species, followed by the ground squirrel M. berdmorei and leopard cat (Table A2). The lowest values of centrality were observed for several species with a low number of observations, such as the Chinese Pangolin, hog badger, large Indian civet, and lesser bamboo rat.
Habitat centrality. The reforestation area was the central habitat in the network of habitats followed by the protected area (Table A2). Human settlement (village), cropland (rain-fed land), and plantations (rubber tree and orchard) had the lowest values of centrality.
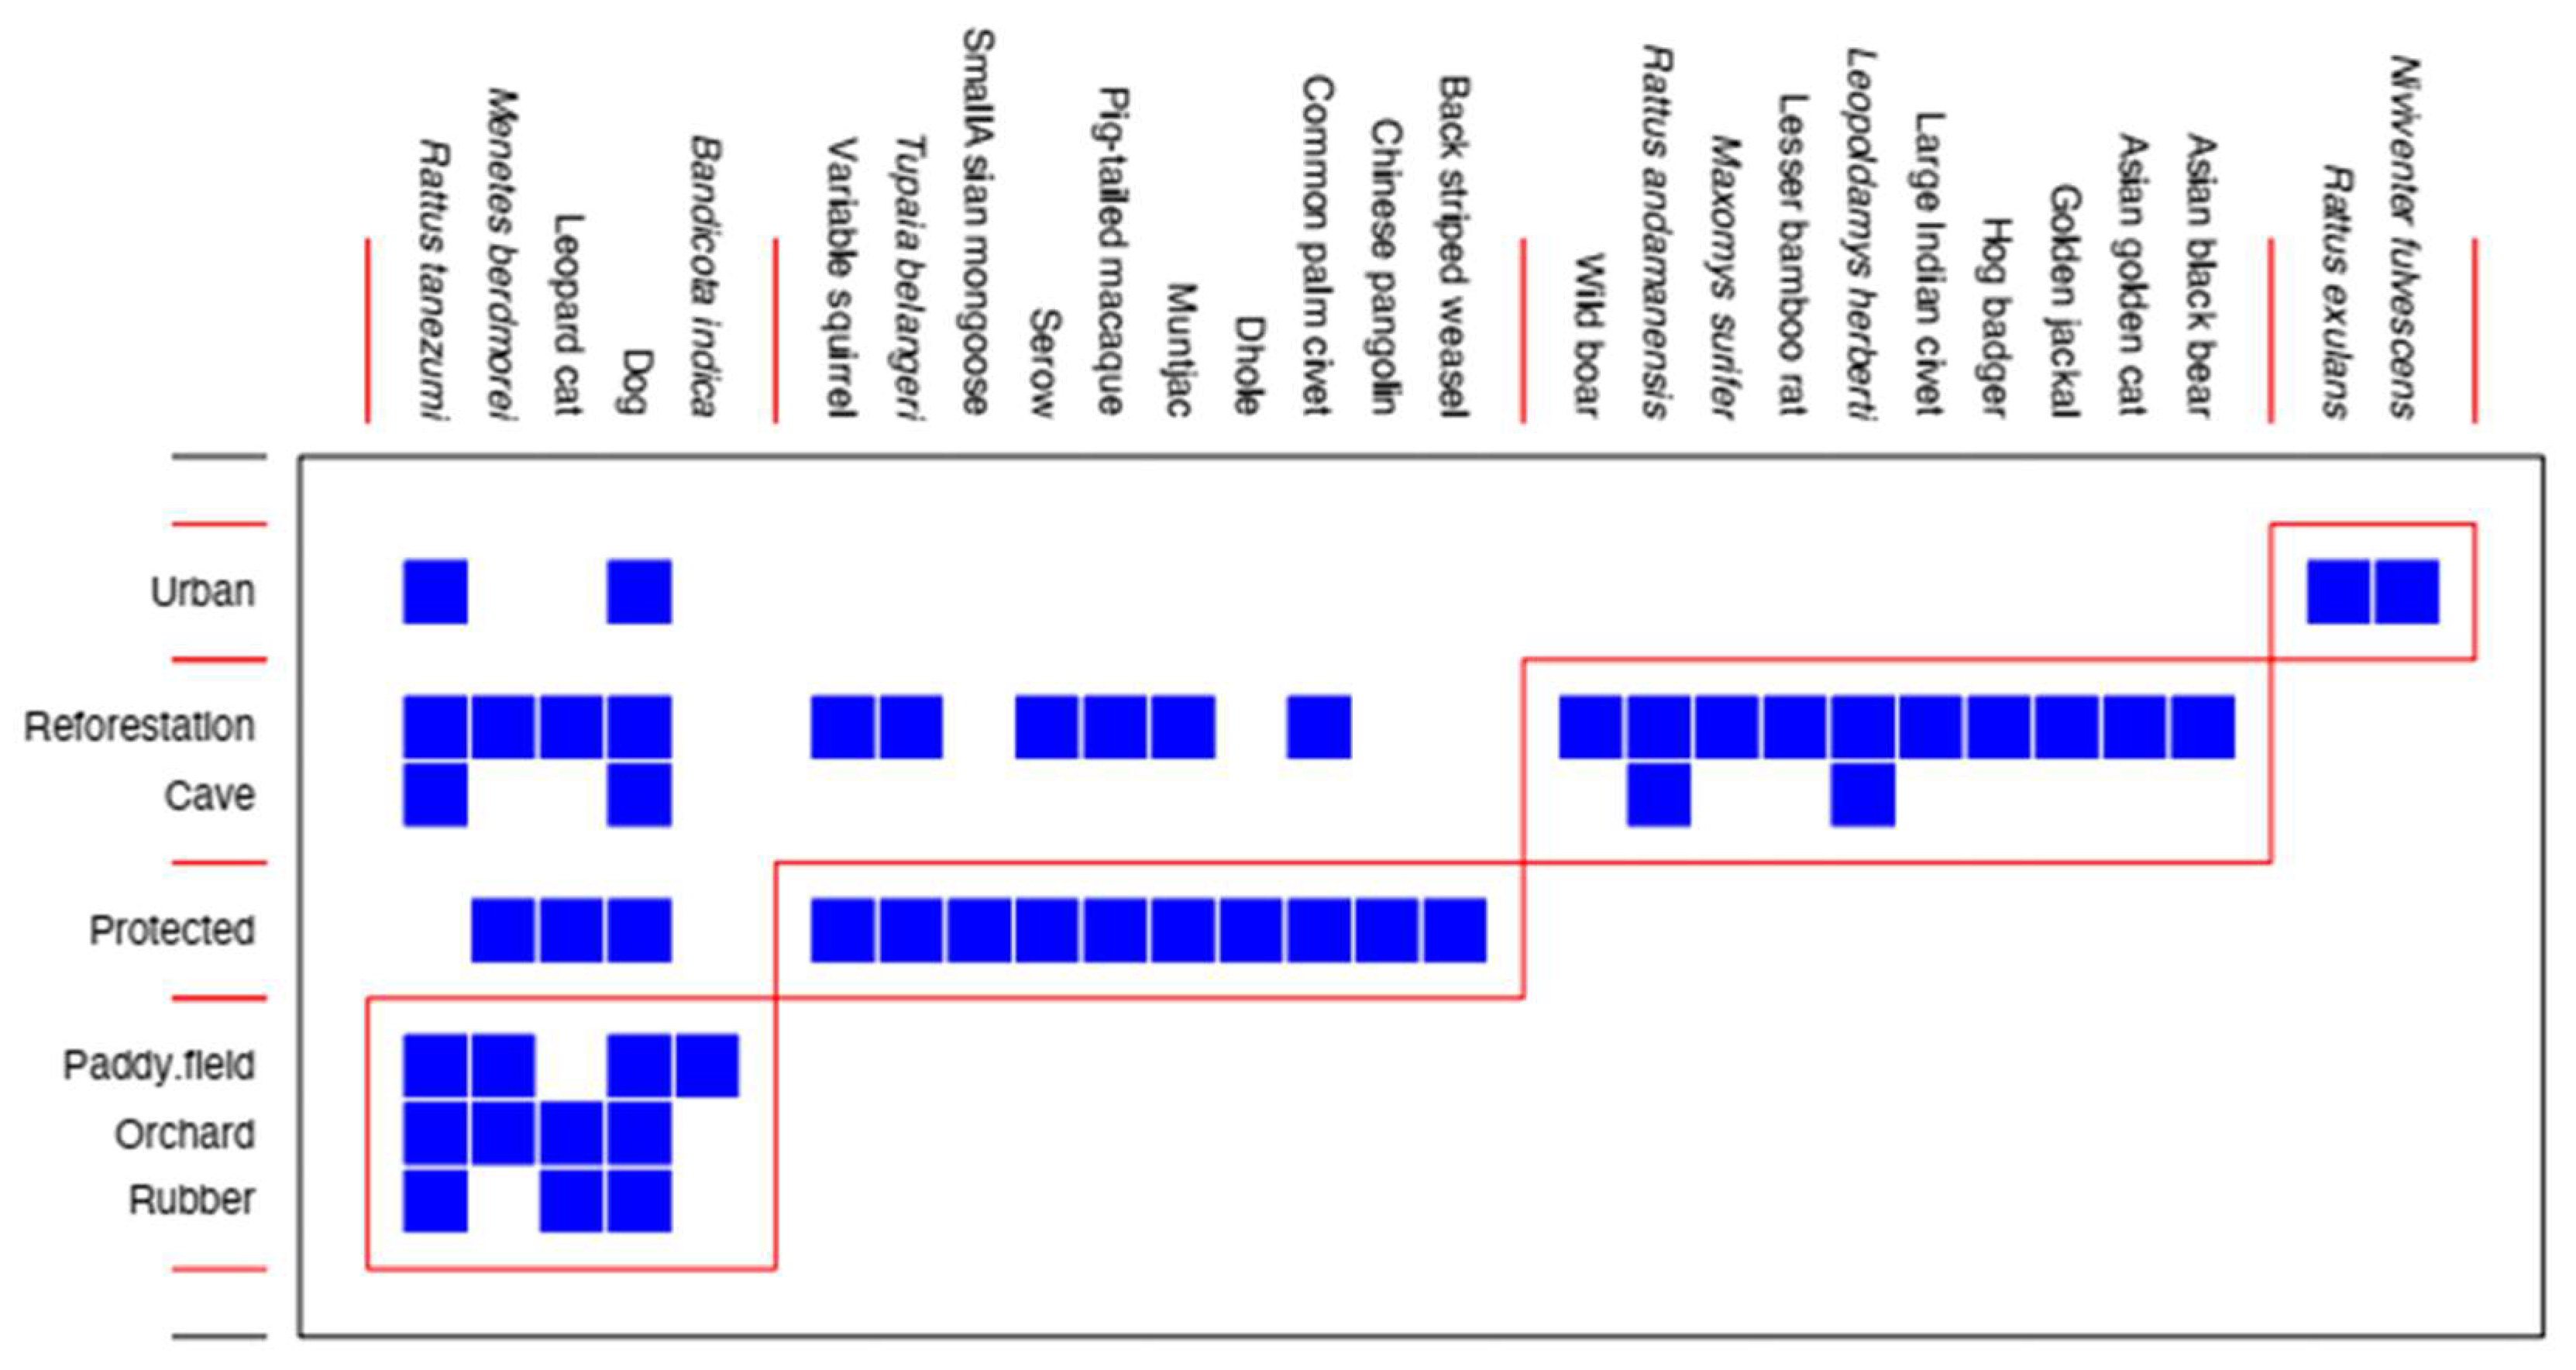
Bipartite network modularity. Using the data of Table 1, four modules were identified in the bipartite network of mammal species and shared habitats (Figure 9). A first module associated the urban habitat with two rodent species: R. exulans and N. mekongis. A second module associated the protected and forested habitats with ten species. A third module linked three human-dominated habitats (rain-fed crop, orchard, and rubber plantation) with five species, including the four top central species in the unipartite network of mammal species (Figure 8a and Table A2): domestic dog, R. tanezumi, M. belangeri, and leopard cat. The last module associated the reforestation area and the cave with the few remaining species. The reforestation area was also the most central habitat in the network of habitats (Figure 8b and Table A2).

4. Discussion

Land use changes are a major driver of biodiversity changes. While defaunation is linked to deforestation [26], refaunation may follow ecological restoration and reforestation [27]. Our study investigated the diversity of mammal communities along a gradient from a protected area to a human settlement through a reforested area. The use of data gathered from camera traps and live traps implemented for the Spillover Interface project [10] seems to confirm the role of reforestation in the refaunation process.
A high diversity of mammal species was observed in the reforested area. Moreover, based on the results of the network analysis, the reforested area appears to be central in the sharing of mammal species between human-dominated habitats, such as plantations, and the protected forested area. The reforested area is then an interface between protected area, plantations, and cropland. The cave is also an interface with both the protected and reforested areas, although hosting a low diversity of terrestrial mammal species. Several species, such as common palm civet and red muntjac, were observed only in the reforested and the protected areas, while some other species were observed in both the reforested area and plantations, such as leopard cat and synanthropic small mammals.
Synanthropic species are identified on the basis of their occurrence in human-dominated habitats [9]. Our results confirm that some synanthropic species were strictly associated with settlement habitats, such as the rodent R. exulans, and with cropland, such as the rodent B. indica. Some species were more habitat generalist, such as the rodents R. tanezumi and M. berdmorei. The case of R. tanezumi is of importance as this synanthropic species is a reservoir of several important zoonotic and emerging infectious diseases [7, 28]. The network analysis confirmed the high centrality of R. tanezumi in the sharing of habitats and its co-occurrence with various mammal species, including the domestic dog. This rodent species was previously mentioned as a bridge species favouring disease transmission between habitats [9,14]. The ground squirrel M. berdmorei should merit attention due to its synanthropic behaviour, its centrality in the network of sharing habitats, and its potential role in emerging infectious diseases [29].
Our study also reveals the importance of the domestic dog. Free-roaming dogs were observed in all habitats from the human settlement to the protected area. The domestic dog is a potential threat for wildlife worldwide [30]. The domestic dog is also central in the sharing of zoonotic diseases to humans [31,32].
One limitation of our design concerned the number of camera days between habitats with a lower number of running camera days between the reforested area (398 camera days by camera traps) and plantation and orchard (284 camera days per camera traps). However, the number of detections by day did not appear to differ between habitats for the four observed species, including the domestic dog, suggesting no bias in species detection between habitats. The actual number of species in Saen Thong is higher than the observed ones according to the estimators, but several species known to be present according to the live trapping cannot be confidently identified using camera traps. Finally, our design followed the findings of Kay et al. [33] with 25–35 camera sites needed for precise estimates of species richness and each camera running for 3–5 weeks.
The next step of the Spillover Interface project is to investigate the sharing of viruses among small mammals and domestic dogs. We hypothesise to find a high diversity of zoonotic agents in synanthropic small mammals (i.e., R. tanezumi and M. berdmorei) living in interface habitat (i.e., reforested habitat) according to the present study. However, further studies should also investigate how reforestation and associated refaunation may reduce the density of synanthropic species by predators (such as the leopard cat) and potentially mitigate the transmission of zoonotic diseases.

5. Conclusions

Our study helps to identify the role of reforestation in the refaunation process [4] using a design of camera traps [33] and live cage traps [14], which could contribute to the role of restoration to refaunation [34,35] and decrease zoonotic risk [36]. Our study suggests that the reforested habitat may act as an interface between human-dominated habitats and protected areas allowing contacts among synanthropic, domestic mammals, and wildlife. Our study is a first step to identify disease transmission or spillover at the interface of habitats and wildlife.

Author Contributions

Conceptualisation, C.T., K.C., A.K., W.P. and S.M.; methodology, C.T., K.C., A.K., W.P., M.L. and S.M.; software, C.T., M.L. and S.M.; validation, C.T., K.C. and S.M.; formal analysis, C.T., M.L. and S.M.; investigation, C.T., K.C., A.K., R.C., Y.P., P.M. and S.M.; resources, C.M.; data curation, C.T. and S.M.; writing—original draft preparation, C.T.; writing—review and editing, C.T. and S.M.; visualisation, C.T. and S.M; supervision, K.C., A.K., W.P. and S.M.; project administration, K.C., A.K. and S.M.; funding acquisition, K.C. and S.M. All authors have read and agreed to the published version of the manuscript.

Funding

This research was funded by the ANR for the project FutureHealthSEA, grant number ANR-17-CE35-0003-01, and by the National Research Council of Thailand, grant number NRCT: N42A650216. C.T. and S.M. were supported by the project “Innovative Animal Health” funded by the Thailand International Cooperation Agency.

Institutional Review Board Statement

Permission to enter the area and collect animal samples was given by The Department of National Parks, Wildlife and Plant Conservation and The Royal Forest Department. Permission to conduct research for SM was given by the National Research Council of Thailand (0401/2503). Field research permission was approved by the Royal Forest Department and the Department of National Parks, Wildlife and Plant Conservation. This permission approved the trapping of rodents in protected areas following the animal ethics approval.

Informed Consent Statement

Animal ethics approval for the trapping and investigation of rodents were provided by Kasetsart University (ACKU64-VTN-010).

Data Availability Statement

All data presented in this study are given in the Appendix (raw data are available on request to the corresponding authors).

Acknowledgments

This study benefited from the support and help of the staff of Nanthaburi National Park and local villagers for setting camera traps.

Conflicts of Interest

The authors declare no conflict of interest. The funders had no role in the design of the study; in the collection, analyses, or interpretation of data; in the writing of the manuscript; or in the decision to publish the results.

Appendix A

Table A1. List of mammal species identified using camera traps with number of detections and stations.
Mammal SpeciesScientific NameNumber of DetectionsNumber of Stations
Asian black bearUrsus thibetanus33
Asian golden catCatopuma temminckii55
Back-striped weaselMustela strigidorsa21
Chinese pangolinManis pentadactaly11
Common palm civetParadoxurus hermaphroditus207
DholeCuon alpinus21
Domestic dogCanis lupus domesticus1914
Golden jackalCanis aureus11
Greater hog badgerArctonyx collari21
Indochinese ground squirrelMenetes berdmorei236
Large Indian civetViverra zibetha11
Leopard catPrionailurus bengalensis2810
Lesser bamboo ratCannomys badius11
Red muntjacMuntiacus muntjak5012
Northern treeshrewTupaia belangeri1039
Northern pig-tailed macaqueMacaca leonina97
Indochinese serowCapricornis milneedwardsi4617
Small Asian mongooseHerpestes javanicus11
Variable squirrelCallosciurus finalaysonii4914
Wild boarSus scrofa11
Table A2. Ranked values of centralities of unipartite network of mammal species, based on shared habitats, and of habitats, based on shared mammal species (see also Figure 6).
Mammal SpeciesCentralityHabitatCentrality
Domestic dog1.000Reforestation area1.000
Rattus tanezumi0.962Protected area0.935
Leopard cat0.653Cave0.359
Menetes berdmorei0.592Orchards0.289
Leopoldamys herberti0.286Rice field0.206
Rattus andamanensis0.286Rubber plantation0.206
Bandicota indica0.240
Niviventer mekongis0.204
Rattus exulans0.204
Common palm civet0.156
Red muntjac0156
Northern pig-tailed macaque0.156
Indochinese serow0.156
Northern treeshrew0.156
Variable squirrel0.156
Back-striped weasel0.080
Chinese pangolin0.080
Dhole0.080
Small Asian mongoose0.080
Asian black bear0.078
Golden jackal0.078
Maxomys surifer0.078
Wild boar0.078
Asian golden cat0.078
Greater hog badger0.078
Large Indian civet0.078
Lesser bamboo rat0.078
Table A3. Number of small species trapped by sex.
SpeciesMales (n)Females (n)
Bandicota indica02
Leopoldamys herberti14
Maxomys surifer34
Menetes berdmorei32
Niviventer mekongis02
Rattus andamanensis146
Rattus exulans02
Rattus tanezumi1017
Tupaia belangeri01

References

  1. Dirzo, R.; Young, H.S.; Galetti, M.; Ceballos, G.; Isaac, N.J.B.; Collen, B. Defaunation in the Anthropocene. Science 2014, 345, 401–406. [Google Scholar] [CrossRef]
  2. Butti, M.; Pacca, L.; Santos, P.; Alonso, A.C.; Buss, G.; Ludwig, G.; Jerusalinsky, L.; Martins, A.B. Habitat loss estimation for assessing terrestrial mammalian species extinction risk: An open data framework. PeerJ 2022, 10, e14289. [Google Scholar] [CrossRef]
  3. Yue, S.; Brodie, J.F.; Zipkin, E.F.; Bernard, H. Oil palm plantations fail to support mammal diversity. Ecol. Appl. 2015, 25, 2285–2292. [Google Scholar] [CrossRef]
  4. Atkinson, J.; Brudvig, L.A.; Mallen-Cooper, M.; Nakagawa, S.; Moles, A.T.; Bonser, S.P. Terrestrial ecosystem restoration increases biodiversity and reduces its variability, but not to reference levels: A global meta-analysis. Ecol. Lett. 2022, 25, 1725–1737. [Google Scholar] [CrossRef]
  5. Morris, R.J. Anthropogenic impacts on tropical forest biodiversity: A network structure and ecosystem functioning perspective. Philos. Trans. R. Soc. Lond. B 2010, 365, 3709–3718. [Google Scholar] [CrossRef] [PubMed]
  6. Koerner, S.E.; Poulsen, J.R.; Blanchard, E.J.; Okouyi, J.; Clark, C.J. Vertebrate community composition and diversity declines along a defaunation gradient radiating from rural villages in Gabon. J. Appl. Ecol. 2017, 54, 805–814. [Google Scholar] [CrossRef]
  7. McFarlane, R.; Sleigh, A.; McMichael, T. Synanthropy of wild mammals as a determinant of emerging infectious diseases in the Asian-Australasian region. EcoHealth 2012, 9, 24–35. [Google Scholar] [CrossRef]
  8. Ecke, F.; Han, B.A.; Hörnfeldt, B.; Khalil, H.; Magnusson, M.; Singh, N.J.; Ostfeld, R.S. Population fluctuations and synanthropy explain transmission risk in rodent-borne zoonoses. Nat. Commun. 2022, 13, 7532. [Google Scholar] [CrossRef]
  9. Bordes, F.; Caron, A.; Blasdell, K.; de Garine Wichatitsky, M.; Morand, S. Forecasting potential emergence of zoonotic diseases in South-East Asia: Network analysis identifies key rodent hosts. J. Appl. Ecol. 2017, 5, 691–700. [Google Scholar] [CrossRef]
  10. Thinphovong, C.; Nordstrom-Schuler, E.; Soisook, P.; Kritiyakan, A.; Chakngean, R.; Saggapitakwong, S. A protocol and a data-based prediction to investigate virus spillover at the wildlife interface in human-dominated and protected habitats in Thailand: The Spillover Interface project. PLoS ONE.
  11. Francis, C.M. Field Guide to the Mammals of South-East Asia; Bloomsbury: London, UK, 2019. [Google Scholar]
  12. Niedballa, J.; Sollmann, R.; Courtiol, A.; Wilting, A. camtrapR: An R package for efficient camera trap data management. Methods Ecol. Evol. 2016, 7, 1457–1462. [Google Scholar] [CrossRef]
  13. R Development Core Team. The R Project for Statistical Computing, R Version 4.2.0. 2022. Available online: https://www.r-project.org (accessed on 5 January 2023).
  14. Morand, S.; Blasdell, K.; Bordes, F.; Buchy, P.; Carcy, B.; Chaisiri, K.; Chaval, Y.; Claude, J.; Cosson, J.-F.; Desquesnes, M.; et al. Changing landscapes of Southeast Asia and rodent-borne diseases: Decreased diversity but increased transmission risks. Ecol. Appl. 2019, 29, e01886. [Google Scholar] [CrossRef]
  15. Mahuzier, C.; Morand, S.; Chaisiri, K.; De Rouw, A.; Soulileuth, B.; Thinphovong, C.; Tran, A.; Valentin, C. Random Forest Land Cover Classifications of Sentinel Satellite Images in 2019, Saen Thong, Thailand; DataSuds: Paris, France, 2022. [Google Scholar] [CrossRef]
  16. VanDerWal, J.; Falconi, L.; Januchowski, S.; Shoo, L.; Storlie, C. SDMTools: Species Distribution Modelling Tools: Tools for Processing Data Associated with Species Distribution Modelling Exercises; R Package Version 1.1-221.2 2014. Available online: https://cran.r-project.org/src/contrib/Archive/SDMTools/ (accessed on 14 October 2023).
  17. Walther, B.A.; Morand, S. Comparative performance of species richness estimation methods. Parasitology 1998, 116, 395–405. [Google Scholar] [CrossRef] [PubMed]
  18. Oksanen, J.; Blanchet, F.G.; Friendly, M.; Kindt, R.; Legendre, P.; McGlinn, D.; Minchin, P.R.; OHara, R.B.; Solymos, P.; Stevens, M.H.H.; et al. Vegan: Community Ecology Package. R Package Version 2.5–3. 2018. Available online: https://CRAN.R-project.org/package=vegan (accessed on 14 October 2023).
  19. Kindt, R. Package for Community Ecology and Suitability Analysis. R Package Version 2.12–3. 2018. Available online: https://cran.r-project.org/web/packages/BiodiversityR/BiodiversityR.pdf (accessed on 14 October 2023).
  20. Dormann, C.F.; Fruend, J.; Bluethgen, N.; Gruber, B. Indices, graphs and null models: Analyzing bipartite ecological networks. Open Ecol. J. 2009, 2, 7–24. [Google Scholar] [CrossRef]
  21. Dormann, C.F.; Gruber, B.; Fruend, J. Introducing the bipartite Package: Analysing Ecological Networks. R News 2008, 8, 8–11. [Google Scholar]
  22. Opsahl, T. Structure and Evolution of Weighted Networks; University of London (Queen Mary College): London, UK, 2009; pp. 104–122. [Google Scholar]
  23. Csardi, G.; Nepusz, T. The igraph software package for complex network research. Int. J. Complex Syst. 2006, 1695, 1–9. [Google Scholar]
  24. Blondel, V.D.; Guillaume, J.L.; Lambiotte, R.; Lefebvre, É. Fast unfolding of community hierarchies in large networks. J. Stat. Mech. 2008, 10, 10008. [Google Scholar] [CrossRef]
  25. Dormann, C.F.; Strau, R. Detecting modules in quantitative bipartite networks: The QuaBiMo algorithm. arXiv 2013, arXiv:1304.3218. [Google Scholar]
  26. Magioli, M.; Paschoaletto, K.M.; de Barros Ferraz, M.; Chiarello, A.G.; Galetti, M.; Freire Setz, E.Z.; Paglia, A.P.; Abrego, N.; Ribeiro, M.C.; Ovaskainen, O. Land-use changes lead to functional loss of terrestrial mammals in a Neotropical rainforest. Perspect. Ecol. Cons. 2021, 19, 161–170. [Google Scholar] [CrossRef]
  27. Galetti, M.; dos Santos Pires, A.; Santin Brancalion, P.H.; Fernandez, F.A.S. Reversing defaunation by trophic rewilding in empty forests. Biotropica 2017, 49, 5–8. [Google Scholar] [CrossRef]
  28. Hornok, S.; Földvári, G.; Rigó, K.; Meli, M.L.; Gönczi, E.; Répási, A.; Farkas, R.; Papp, I.; Kontschán, J.; Hofmann-Lehmann, R. Synanthropic rodents and their ectoparasites as carriers of a novel haemoplasma and vector-borne, zoonotic pathogens indoors. Parasites Vectors 2015, 8, 27. [Google Scholar] [CrossRef]
  29. Nawtaisong, P.; Robinson, M.T.; Khammavong, K.; Milavong, P.; Rachlin, A.; Dittrich, S.; Dubot-Pérès, A.; Vongsouvath, M.; Horwood, P.F.; Dussart, P.; et al. Zoonotic Pathogens in Wildlife Traded in Markets for Human Consumption, Laos. Emerg. Infect. Dis. 2022, 28, 860–864. [Google Scholar] [CrossRef] [PubMed]
  30. Doherty, T.S.; Dickman, C.R.; Glen, A.S.; Newsome, T.M.; Nimmo, D.G.; Ritchie, E.G.; Vanak, A.T.; Wirsing, A.J. The global impacts of domestic dogs on threatened vertebrates. Biol. Cons. 2017, 210, 56–59. [Google Scholar] [CrossRef]
  31. Morand, S.; McIntyre, K.M.; Baylis, M. Domesticated animals and human infectious diseases of zoonotic origins: Domestication time matters. Infect. Genet. Evol. 2014, 24, 76–87. [Google Scholar] [CrossRef] [PubMed]
  32. Wells, K.; Morand, S.; Wardeh, M.; Baylis, M. Distinct spread of DNA and RNA viruses among mammals amid prominent role of domestic species. Glob. Ecol. Biogeogr. 2020, 29, 470–481. [Google Scholar] [CrossRef]
  33. Kays, R.; Arbogast, B.S.; Baker-Whatton, M.; Beirne, C.; Boone, H.M.; Bowler, M.; Burneo, S.F.; Cove, M.V.; Ding, P.; Espinosa, S.; et al. An empirical evaluation of camera trap study design: How many, how long and when? Methods Ecol. Evol. 2020, 11, 700–713. [Google Scholar] [CrossRef]
  34. Derhé, M.A.; Murphy, H.T.; Preece, N.D.; Lawes, M.J.; Menéndez, R. Recovery of mammal diversity in tropical forests: A functional approach to measuring restoration. Restor. Ecol. 2018, 26, 778–786. [Google Scholar] [CrossRef]
  35. Beirne, C.; Sun, C.; Tattersall, E.R.; Burgar, J.M.; Fisher, J.T.; Burton, A.C. Multispecies modelling reveals potential for habitat restoration to re-establish boreal vertebrate community dynamics. J. Appl. Ecol. 2021, 58, 2821–2832. [Google Scholar] [CrossRef]
  36. Prist, P.R.; Prado, A.; Tambosi, L.R.; Umetsu, F.; de Arruda Bueno, A.; Pardini, R.; Metzger, J.P. Moving to healthier landscapes: Forest restoration decreases the abundance of Hantavirus reservoir rodents in tropical forests. Sci. Total Environ. 2021, 752, 141967. [Google Scholar] [CrossRef]
Figure 1. Location of the study in Saen Thong subdistrict (Nan Province, Thailand), precisely (a) in the upland part of the subdistrict. A land-use map describes the different land classes: multispecific forests, plantations (rubber, teak, bamboo plantations, and orchards), fallows crops (corn, paddy rice, ginger, etc.), and urban infrastructural at (b) the upland part of the subdistrict.
Ecologies 04 00044 g001
Figure 2. Positions of (a) camera traps (in red) and (b) live rodent traps (in blue) along the gradient from the protected area and reforestation area (in orange) to plantations, agricultural land, and village (in red).
Ecologies 04 00044 g002
Figure 3. The camera traps and the rodent traps were installed along a gradient of 3000 m from the village (red arrow) through protected area (National Park of Nanthaburi) with a cave, reforested area, plantations (rubber, teak, and orchards), and agricultural lands (paddy fields) (blue arrow for each land type) with an elevation of 400 m above the village.
Ecologies 04 00044 g003
Figure 4. Number of camera detections (a) and rodent captures by species (b) (values in orange dots).
Ecologies 04 00044 g004
Figure 5. Number of mammal species detected by each camera trap (A) and trapped by each cage trap (C), allowing the estimation of species richness (B,D). Observed species, Jackknife 1 and bootstrap correspond to the rarefaction curve of species observed or trapped and estimators of species richness (yellow lines indicate confidence intervals).
Ecologies 04 00044 g005
Figure 6. Boxplots giving the Number of detections by day (* = multiplied by 100) between locations of the camera traps (plantation, reforestation, and protected area) for the four species detected in the three habitats: (A) leopard cat, (B) serow, (C) domestic dog, and (D) Indochinese ground squirrel (red dots for individual values).
Ecologies 04 00044 g006
Figure 7. Total number of trapping nights (individual values black dots) (a) for small mammal species trapped (individual values in red dots) by live cages (b) and total number of camera-running days (individual values black dots) (c) for mammal species recorded (d) in relation to the distance from village centre (see Figure 3).
Ecologies 04 00044 g007
Figure 8. Unipartite networks of (a) mammal species and (b) habitats with modules differentiated by colours. The links between mammal species depict shared habitats, while the links between habitats depict shared mammal species (vertices were placed according to the Fruchterman–Reingold algorithm). Bind: Bandicota indica; Lher: Leopoldamys herberti; Mber: Menetes berdmorei; Msur: Maxomys surifer; Nful: Niviventer mekongis; Rada: Rattus andamanensis; Rexu: Rattus exulans; Rtan: Rattus tanezumi; and Tber: Tupaia belangeri.
Ecologies 04 00044 g008
Figure 9. Modularity of the bipartite network of the occurrence of mammal species in habitats (data and occurrence of mammals from Table 2, habitat types obtained from land-use map and field observations to differentiation protected area, reforestation area, and cave). There is four modules (red square line) of the occurrence of mammal species in habitats (blue rectangles).
Ecologies 04 00044 g009
Table 1. Observed and estimated species richness (using Jackknife 1 and bootstrap methods) in relation to habitat, number of camera traps, and number of recording days by camera trap.
HabitatCameras
(n)
Set-Up to
Retrieval Dates
Number of Days
(by Camera)
Observed Species (n)Jackknife 1
±SE
Bootstrap
±SE
Reforestation, protected area2519 November 2021
22 December 2022
3982129.7 ± 4.024.3 ± 1.9
Plantation and orchard73 March 2022
22 December 2022
28446.0 ± 1.25.0 ± 0.7
All32--2129.7 ± 4.024.3 ± 1.9
Table 2. Presence and absence (1, 0) of mammal species by habitat. Habitats were characterised using the land-use map [15] (see Figure 1).
SpeciesUrbanPaddy FieldOrchardRubberReforestationCaveProtected
Asian black bear0000100
Asian golden cat0000100
Back-striped weasel0000001
Bandicota indica0100000
Chinese pangolin0000001
Common palm civet0000101
Dhole0000001
Domestic dog1111111
Golden jackal0000100
Greater hog badger0000100
Large Indian civet0000100
Leopard cat0011101
Leopoldamys herberti0000110
Lesser bamboo rat0000100
Maxomys surifer0000100
Menetes berdmorei0110101
Red muntjac0000101
Niviventer mekongis1000000
Northern pig-tailed macaque0000101
Rattus andamanensis0000110
Rattus exulans1000000
Rattus tanezumi1111110
Indochinese serow0000101
Small Asian mongoose0000001
Tupaia belangeri0000101
Variable squirrel0000101
Wild boar0000100
Disclaimer/Publisher’s Note: The statements, opinions and data contained in all publications are solely those of the individual author(s) and contributor(s) and not of MDPI and/or the editor(s). MDPI and/or the editor(s) disclaim responsibility for any injury to people or property resulting from any ideas, methods, instructions or products referred to in the content.