Abstract
Climate change poses serious challenges to Mediterranean crops such as the olive tree (Olea europaea L. subsp. europaea), underscoring the need for cultivars with improved drought tolerance and disease resistance. This study investigates variability in leaf and wood traits among Moroccan and introduced olive cultivars and their crossbreed genotypes grown under similar conditions. Specifically, we assessed (1) variation in key functional traits, (2) the effects of crossbreeding combinations, and (3) trait syndromes shaped by selection. Results showed substantial intraspecific variation in leaf traits, including specific leaf area (SLA), specific leaf water content (SLWC), stomatal size (SS), and density (SD), indicating diverse strategies for resource use and plasticity. Crossbreed genotypes generally displayed higher SLWC and lower SLA, reflecting adaptation to water stress. Wood traits, particularly vessel size (SVS) and number (NVS), also varied, revealing trade-offs between hydraulic efficiency and safety. Notably, an increase in vessel size and hydraulic conductivity was correlated with oil content (OC%), while OC% increased with higher vessel and stomatal densities. Larger stomata increased conductance and fruit growth, while lower SLA was linked to higher yield. Multivariate analysis distinguished two genotype groups, consistent with parental combinations. Overall, crossbreeding generated novel functional diversity that may enhance adaptive potential. These findings highlight the value of integrating functional and anatomical traits into olive breeding programs to improve resilience and productivity under climate change.
1. Introduction
Climate change is already exerting negative impacts on the yields of staple crops across agricultural regions worldwide [1,2,3]. As global temperatures rise, alterations in hydrological cycles are generally increasing aridity and the frequency of droughts [4,5,6]. In this context of global change, the vulnerability of plant species to both biotic and abiotic stresses is intensifying due to ongoing and projected climate shifts [7,8,9], as well as widespread outbreaks of pathogens and pests [10,11,12]. The rapid pace of climate change threatens the long-term persistence and resilience of plant species [7,13,14]. For example, the Mediterranean region is already experiencing pronounced effects of climate change combined with anthropogenic pressures [15,16,17]. These challenges pose severe risks for Mediterranean plants [17], especially those with narrow biogeographical ranges, such as the emblematic olive tree [9,18,19,20]. The increasing frequency of droughts stems from amplified interannual variability in precipitation and extended periods of reduced rainfall. Climate models consistently project a marked rise in drought occurrence, largely attributable to anthropogenic greenhouse gas emissions [21]. These disturbances are especially pronounced in southern Europe and northern Africa, making the Mediterranean basin a recognized climate change “hotspot” [21,22]. Notably, between 1990 and 2010, ten of the driest winters of the past century were recorded in this region [21].
Against this backdrop of rapid environmental change, agriculture must adapt to ensure efficient water use, the most critical resource for plants, while safeguarding global food security in the face of a growing population. Sustainable and climate-smart management of water, land, and biodiversity is therefore essential [23,24]. Developing crop varieties with improved water-use efficiency (WUE, the amount of CO2 assimilated during photosynthesis relative to the amount of water lost through transpiration) under future climate scenarios is particularly critical [8,25]. For instance, the shift toward modern olive cultivation, characterized by dense planting, advanced irrigation, and soluble fertilizers, has replaced traditional practices, narrowing the diversity of cultivars in use and threatening the genetic diversity of local varieties [26,27]. The genetic uniformity of many cultivars limits the effectiveness of clonal selection, underscoring the need to identify or develop olive varieties with unique traits that enhance adaptability and resilience to diverse stressors [26,28]. Expanding breeding programs to incorporate broader genetic resources is thus essential, despite the domestication bottlenecks that have reduced genetic diversity in modern populations [29].
Plant functional traits are increasingly recognized as central to crop breeding, offering a framework to address the complex challenges facing agriculture [30,31]. Traits such as leaf morphology, xylem architecture, and physiological properties govern plant performance under varying environmental conditions [32] and are key to understanding adaptation to both abiotic and biotic stresses [19,33,34,35,36,37]. Prioritizing traits related to drought tolerance, disease resistance, and nutrient-use efficiency can enhance crop yields and quality. Integrating trait-based approaches into breeding strategies can therefore produce robust crops capable of thriving under climate change, resisting pests and diseases, and maintaining high productivity [38].
A major advantage of trait-based breeding lies in optimizing resource use. For example, studies on leaf functional traits have revealed a fundamental trade-off between resource acquisition and conservation, described as the ‘Leaf Economic Spectrum’ (LES) [39,40]. Plants at the acquisitive end of this spectrum exhibit high resource investment in growth (high leaf nitrogen, high specific leaf area (SLA), low leaf dry matter content (LDMC)), coupled with high photosynthetic and respiration rates. In contrast, conservative species invest fewer resources but achieve greater persistence under stress [39,41]. Similar trade-offs occur in wood functional traits, reflecting a spectrum between hydraulic efficiency and safety [18,37,42,43,44]. These trade-offs manifest at both the interspecific [45] and intraspecific [46] level. For instance, Kassout et al. [34,36] demonstrated substantial intraspecific variation in leaf traits, with wild olive trees (Olea europaea subsp. europaea var. sylvestris) in Morocco spanning a wide resource acquisition–conservation spectrum along aridity gradients. Furthermore, Kassout et al. [18] highlighted variation in sap conduction linked to hydraulic safety–efficiency trade-offs in wild olives across these gradients. Similarly, in cultivated olives, Terral et al. [43] revealed variability in hydraulic traits associated with biogeography and evolutionary history. Thus, applying a trait-based approach provides valuable insights into the mechanisms that enhance resilience and adaptability to climate change in high-value crops such as the olive tree. It is also essential to assess the effects of crossbreeding on trait values, variability, and syndromes to refine the screening and selection of olive cultivars. The development of sustainable, low-input agricultural systems will increasingly depend on creating and deploying suitable varieties and mixtures, informed by functional trait knowledge [47,48].
Building on previous findings on functional trait variability [18,34,37,43], this study investigates whether plants obtained from crossbreeding Moroccan and introduced olive cultivars exhibit differential functional responses compared to their parental lines. Cultivated olive varieties have historically undergone long-term selection for agronomic traits such as yield and fruit quality, which may have led to distinct functional adaptations relative to newly developed crossbreed genotypes [43]. By analyzing both leaf and wood anatomical traits, we assess whether crossbreed genotypes display trait combinations that enhance productivity, water-use efficiency, or resilience to environmental stress. This approach provides a mechanistic understanding of trade-offs between growth, resource acquisition, and stress tolerance—key processes for optimizing breeding strategies. Furthermore, integrating functional trait analysis with agronomic performance metrics, such as yield and oil content, establishes a quantitative basis for selecting superior genotypes. Unlike traditional breeding approaches that rely largely on phenotypic selection, a trait-based framework enables breeders to identify individuals with high adaptive potential. This methodology increases selection efficiency and ensures that breeding programs address the challenges of climate variability while promoting sustainable olive production.
We hypothesize that different combinations of cultivars in the crossing process will generate distinct functional responses, potentially conferring greater plasticity under variable environmental conditions. To test this hypothesis, six crossbreed genotypes resulting from crosses between Moroccan and introduced cultivars, grown under similar conditions, were evaluated. The study had three main objectives. First, we aimed to characterize the extent and magnitude of leaf and wood functional trait variability among crossbreed genotypes and cultivars, and to assess potential functional differences between the two groups. Second, we examined the relationships between leaf and wood anatomical traits to identify key axes of variability that may enhance resilience in crossbreed genotypes, in line with breeding program objectives. Finally, we investigated the relationship between functional traits and agronomic performance, with a particular focus on yield and oil content. Overall, this study demonstrates the value of a trait-based approach for evaluating the effectiveness of crossbreeding programs and for developing new, climate-resilient olive cultivars.
2. Materials and Methods
2.1. Study Site and Plant Material
The study was conducted at the Saâda experimental field (31°37′33.6″ N, 8°08′45.6″ W, 411 m a.s.l.) of the National Institute of Agricultural Research (INRA) of Marrakech, Morocco. The study site is characterized by a Mediterranean climate, with arid to semi-arid conditions, hot and dry summers, low annual rainfall, and irregular precipitation patterns [49]. Most rainfall occurs between late November and March, with minimal precipitation during summer (Figure 1). The plant material used in the study consisted of six olive cultivars and six crossbreed genotypes (Table 1), planted in 2007 as a part of the INRA crossbreeding program. The cultivars could be categorized as introduced, comprising Arbequina, Manzanilla de Sevilla (hereafter Manzanilla), and Picholine du Languedoc, and Moroccan cultivars, including Haouzia, Menara, and M26 [50]. The Moroccan cultivars were developed by INRA and are widely used by Moroccan farmers (except M26). M26 is obtained from clonal selection of the Picholine marocaine cv., and not yet introduced to farmers, yet it shows very promising performance compared to both Haouzia and Menara cultivars [50]. These cultivars represent diverse geographical origins and distinct genetic profiles, reflecting varied biogeographical and evolutionary histories (Table 1). All trees were grown under similar environmental conditions. Hence, trees are planted at 7 × 4 m under a clay loam texture soil and submitted to the same cultural maintenance (drip irrigation, pruning and tillage). In total, 24 trees were assessed: three biological replicates per cultivar (18 trees) and one representative tree per crossbreed genotype (6 trees). Replicate cultivar trees were randomly selected from the plantation to minimize positional bias. In contrast, a single tree was chosen for each crossbreed genotype, consistent with early-stage breeding evaluations where the primary objective is to identify superior individuals rather than assess within-cross variability. This design is further justified by the relatively high heritability reported for agronomic and physiological traits in olive [51,52,53,54], meaning that a single tree can reliably represent the genetic potential of a given cross. Agronomic traits were evaluated, with yield (Kg/Tree) measured at harvest time. Fruit weight was assessed on 30 fruits per tree for cultivars and 100 for crossbreed genotypes. Oil content (expressed as a percentage of dry weight), was determined within 24 h of harvest using a laboratory-scale procedure. Fruits were pooled for each cultivar and crossbreed genotype, and subsamples of 15 g of dry weight equivalent were analyzed. Fruits were crushed with a hammer mill, and the resulting olive paste was homogenized and dried at 70 °C. Oil was extracted using a modified Soxhlet extraction system with hexane for 6 h at a solvent-to-sample ratio of 10:1 (v:w) under controlled conditions at 30 °C to minimize thermal degradation of compounds [49]. Each extraction was performed in duplicate, and results were averaged per cultivar and crossbreed genotype.
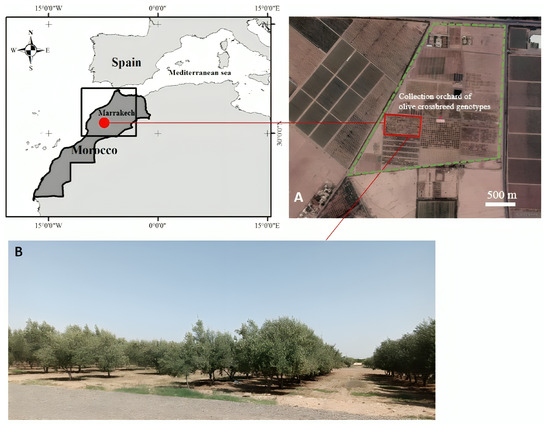
Figure 1.
Localization of the study site and olive collection of the Saâda experimental field. Green dashed line represents the limit of the Saâda experimental field (A) and overview of the olive crossbreed orchard (B).

Table 1.
Olive cultivars and genotypes (crosses) studied and their geographical origin and genetic profiles.
2.2. Traits Measurements
Following standardized protocols [54] and methodology outlined by Kassout et al. [34,36,37] for the olive tree, thirty fully expanded, mature, and healthy leaves were randomly selected from the sun-exposed side of the upper canopy of each tree. Sampling was carried out between 9 a.m. and 12 a.m. of the same day for each cultivar and crossbreed genotype. The leaves were sampled during spring of 2023 and collected in a cool, hydrated condition and transported to the laboratory for analysis [57]. Leaf fresh mass (LFM, g) was measured using an electronic balance. Leaf area was determined by scanning the leaves and analyzing the images with ImageJ software V. 1.53K [58]. After removing trichomes from the abaxial leaf surface and making impressions with clear nail polish, stomatal density (SD, no. mm−2), stomatal length (SL, µm), and stomatal width (SW, µm) were measured from four separate areas of the abaxial surface at 400× magnification using an Olympus BX43 microscope [34,59]. The leaves were then oven-dried at 70 °C for 72 h, and leaf dry mass (LDM, g) was measured. Specific leaf area (SLA, cm2 g−1) and specific leaf water content (SLWC, g H2O cm−2) were subsequently calculated as described by Kassout et al. [34]. Stomatal size (SS, µm2) was calculated using the formula SS = SL × SW × /4 [60]. Stomatal pore index (SPI, %) was determined to represent the leaf surface area covered by stomata and was calculated as SPI = SD × SL2 × 10−4 [61]. Consequently, SLA, SLWC, LA, SS, SD, and SPI were considered for further analysis.
Wood samples were collected from the same trees, with branch section diameters ranging from 2.24 to 9.4 mm for the cultivars and from 2.21 to 10.94 mm for the studied crossbreed genotypes. In total, 84 samples were analyzed in which 30 were from crossbreed genotypes (5 per genotype) and 50 from cultivars, where most trees contributed 3 samples, except for Picholine marocaine trees and one Menara tree, which were represented by only 2 samples. Branches were taken from mid-canopy, sun-exposed positions to standardize conditions. Following Kassout et al. [18], a sliding microtome (G.S.L.1, Microm International GmbH, Walldorf, Germany) was used to obtain thin transverse sections (10 µm) from the wood samples. Histological preparations involved staining these transverse sections with a one-to-one mixture of Fast Green (2%) and Safranin (1%) solutions. The sections were then dehydrated through a series of ethanol solutions (96%, 70%, and 40%), washed with xylene, and embedded in Canada balsam to create permanent slides for future observations, measurements, and analysis. Based on previous methodological developments [18,43,44,61], three anatomical characteristics relevant to sap conduction were measured for each wood sample and branch diameter (BD, mm): vessel density (DVS, number of vessels/mm2), the number of vessels grouped in radial files (NVS, number/group of vessels), and the surface area of vessels (SVS, µm2). Measurements were taken on the youngest (peripheral) wood section at magnifications of 100×, 200×, and 500× for DVS, NVS, and SVS, respectively. For each sample, we conducted 35 measurements for both SVS and NVS, and 20 measurements for DVS [34]. Vascular conductivity (CD) was calculated as CD = (SVS/)2/DVS [44].
2.3. Statistical Analysis
All statistical analyses were conducted using R software V. 4.3.1. In the present study SLA, SLWC, LA, SS, SD, SPI, SVS, DVS, NVS and CD were considered for further analysis as they capture different ecological information related to resource use strategies and hydraulic conduction [18,34,44]. Descriptive statistics, including mean and standard deviation, were used to identify general trends in leaf and wood traits. The coefficient of variation (CV) was calculated as CV (%) = (standard deviationtrait/meantrait) × 100 to evaluate trait variability. To test differences in individual traits among cultivars and crossbreed genotypes, one-way ANOVA was applied, followed by Tukey’s HSD post hoc test with a significance level of p = 0.05, using the multicomp and agricolae R packages. Normality and homogeneity of variances were checked with the Shapiro–Wilk and Levene’s tests, respectively; when assumptions were violated, log10-transformations were applied. Trait–trait and trait–yield correlations were evaluated applying Pearson correlations and using the cor function in R. Thus, an unpaired t-test was used in order to compare between the studied functional traits considering the two studied groups of crossbreed genotypes and cultivar. The phenotypic plasticity index (PI) was calculated as PI = (Traitmax− Traitmin)/Traitmax [62] to highlight the phenotypic responses in the studied functional traits between crossbreed genotypes and cultivars. Principal component analysis (PCA) was performed on scaled unit variance data to explore and evaluate overall differences among the studied cultivars and crossbreed genotypes, and to highlight their functional responses and trait syndromes.
3. Results
3.1. Variability in Functional Traits Among Cultivars and Crossbreed Genotypes
All studied leaf traits exhibited significant differences in mean values among the olive cultivars and crossbreed genotypes (Table 2). The coefficient of variation (CV) indicated substantial variability for these traits (Table 2). Stomatal-related traits displayed high variance ratios (F), with stomatal size (SS) and stomatal density (SD) demonstrating important variance (84.67 and 37.05, respectively) and CVs, with SS ranging from 7.26% to 18.42% and SD from 10.08% to 24.30%. SS values varied from 74.58 ± 6.31 µm2 in M26 to 137.12 ± 18.23 µm2 in C3. SD values ranged from 166.87 ± 39.77 pores mm−2 (C6) to 275.50 ± 37.82 pores mm−2 (C2). Specific leaf area (SLA) also exhibited significant variability (F = 43.41), ranging from 36.52 ± 3.08 cm2 g−1 (C4) to 54.83 ± 7.77 cm2 g−1 (Arbequina). Leaf area (LA) varied from 4.03 ± 0.83 cm2 (Manzanilla) to 5.62 ± 0.99 cm2 (Picholine du Languedoc). The stomatal pore index (SPI) ranged from 5.09 ± 0.78% (Picholine du Languedoc) to 7.30 ± 1.03% (C6). Specific leaf water content (SLWC) displayed notable variability, with CV values ranging from 9.52% in C1 to 44.44% in Manzanilla, despite having the lowest F-value (Table 2). When comparing two groups (crossbreed genotypes vs. cultivars), the t-test revealed significant differences for SLA, SLWC, SS, SD, and SPI (Table A1). For all leaf traits except SLA, the mean values were higher in crossbreed genotypes compared to cultivars. However, LA did not show significant differences between the two groups, although the CV remained high compared to SLA for both groups. Regarding wood anatomical traits, significant differences were observed only for vessel surface area (SVS) and the number of vessels in radial files (NVS), with F-ratios of 51.971 and 10.031, respectively (Table 3). The variability among the studied cultivars and crossbreed genotypes was higher for wood traits compared to leaf traits. For example, the CV for SVS ranged from 22.55% in Manzanilla to 36.02% in Haouzia, and for NVS, from 28.46% in Manzanilla to 36.31% in C2 (Table 3). A similar trend was observed when considering the two groups (crossbreed genotypes vs. cultivars), with mean values higher in genotypes compared to cultivars (Table 3). SVS ranged from 343.79 ± 90.98 (C2) to 578.69 ± 140.35 (C1). Regarding NVS, values ranged from 2.43 ± 0.73 (Arbequina) to 3.36 ± 1.22 (C2). Comparing the phenotypic plasticity index (PI) for cultivars (PICV) and crossbreed genotypes (PIGE) revealed a decline in plasticity in SLWC, SLA, LA, and SPI for cultivars, while the other studied traits exhibited higher plasticity in crossbreed genotypes compared to cultivars (Table A2). Notably, NVS and SVS in crossbreed genotypes showed a significant gain in plasticity compared to cultivars, followed by SS and SD.
Table 2.
Mean values of leaf- and stomatal-related traits of studied olive cultivars and genotypes.
Table 3.
Mean values of wood anatomical traits of the studied olive cultivars and genotypes.
3.2. Relationships Between Trait Values and Olive Cultivars and Crossbreed Genotypes
Significant correlations were observed among the studied leaf economic, hydraulic traits, and agronomic characteristics (Figure 2). Notably, a negative and significant correlation was found between SD and LA (−0.60), SS (−0.71), and SVS (−0.91), while SD was positively correlated with SPI (0.84) and DVS (0.75). Additionally, SS exhibited a negative correlation with DVS (−0.74) and a positive correlation with SVS (0.75) and SLWC (0.59). SPI was negatively correlated with SVS (−0.72) and positively correlated with NVS (−0.61). Specific leaf area (SLA) was negatively correlated with SLWC (−0.59). SVS showed a negative correlation with both DVS (−0.74) and NVS (−0.60), whereas DVS and NVS were positively correlated (0.58). When considering relationships within each type, our results showed that for cultivars, SLWC was positively correlated only with SS (0.85), while SVS was negatively correlated with NVS (−0.83) and CD (−0.90) (Figure A1). Meanwhile, in crossbreed genotypes, a significant negative correlation was found between SLWC and SLA (−0.83). Additionally, SS was negatively correlated with SD (−0.93) and DVS (−0.88) but positively correlated with SVS (0.92). SPI exhibited negative correlations with LA (−0.88) and SVS (−0.93), while showing positive correlations with SD (0.96) and DVS (0.84). Furthermore, DVS was positively correlated with NVS (0.86) and SD (0.89) but negatively correlated with LA (−0.82) and SVS (−0.90) (Figure A1).
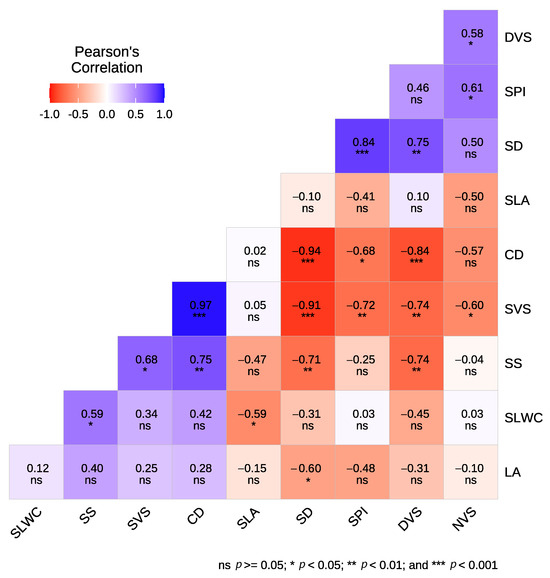
Figure 2.
Correlation analysis between leaf and wood traits of the studied olive cultivars and crossbreed genotypes.
The principal component analysis (PCA) of the leaf and wood traits revealed that the first three axes explained 87.55% of the total variance (Figure 3, Table A3). The first axis, accounting for 47.24% of the total variation, was positively correlated with SVS, SS, and LA, and negatively correlated with SD, SPI, and NVS. The second axis, capturing 28.66% of the total variation, was positively correlated with SLWC and negatively correlated with SLA. This axis shows also a positive correlation with SS and a negative correlation with NVS. The third axis, explaining 11.65% of the total variation, was positively correlated with LA (Table A3). The first PCA axis distinguished two groups of crossbreed genotypes: the first group (C1, C3, and C4) loaded on the positive side, and the second group (C2, C5, and C6) loaded on the negative side (Figure 3). This indicates that the first group has wider vessels, larger stomata, and bigger leaves compared to the second group. Meanwhile, the second group (C2, C5 and C6) is characterized by important stomatal density stomatal (SD), stomatal pore index (SPI), and higher vessels connected in radial files (NVS). Cultivars were positioned intermediate along the first axis, with a clear differentiation between Moroccan cultivars (Haouzia, Menara, and M26), loaded on the negative side, and introduced cultivars (Arbequina, Manzanilla, and Picholine du Languedoc) loaded on the positive side of PC1. The second PCA axis differentiated cultivars with higher SLA values, aligning with aspects of the ‘worldwide leaf economics spectrum,’ from the studied crossbreed genotypes. The second PCA axis also shows a positive correlation with SS and negative correlation with NVS.
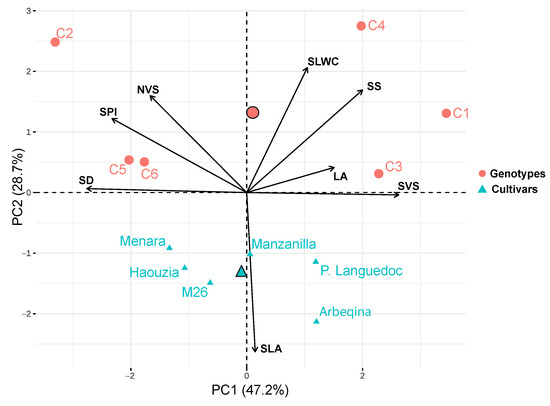
Figure 3.
Principal Keeps words in blue in normal. component analysis (PCA) of the studied traits of olive cultivars (triangles) and crossbreed genotypes (circles).
3.3. Relationships Between Functional and Agronomic Traits
Significant correlations were observed among the studied leaf traits, hydraulic traits, and agronomic characteristics (Table A4 and Table A5). Considering both cultivars and crossbreed genotypes, oil content (OC%) was positively correlated with SD (0.59), DVS (0.66), and NVS (0.74), while it showed a negative correlation with SVS (−0.75) and CD (−0.72). Meanwhile, fruit yield was positively correlated with NVS (0.59). When analyzing only cultivars, OC exhibited a positive correlation with NVS (0.89) and a significant negative correlation with SVS (−0.96) and CD (−0.93). Additionally, yield was positively correlated with SD (0.96) and negatively correlated with SLA (−0.83). For crossbreed genotypes, OC was positively correlated with NVS (0.86), while FIW showed a positive correlation with SS (0.84) and a negative correlation with DVS (−0.87).
4. Discussion
Employing functional traits as descriptors to capture fundamental trade-offs that define species’ functional responses and adaptations to environmental conditions has proven effective [63]. Assessing trait variability at both interspecific [64] and intraspecific levels [18,35,36,45,65,66] has revealed plant strategies related to resource capture and allocation under contrasting and challenging environmental conditions. Moreover, functional trait-based approaches have been suggested as efficient in understanding the effects of crop selection and breeding, and their performances under various ecological conditions [31,38,67]. While traditional breeding programs have primarily focused on agronomic traits, such as crop yield, a trait-based approach can provide an additional valuable framework for understanding the adaptive mechanisms of crops under varying environmental conditions [38,43,68,69]. In this study, we assessed the variability in leaf and wood functional traits at the intraspecific level in olive cultivars and crossbreed genotypes. We also examined their relationships to capture key dimensions of resource use and allocation under similar conditions. Our aim is to highlight the functional strategies in the crossbreed genotypes compared to their parent cultivars, which could prove valuable in incorporating selection criteria for drought resistance within olive breeding programs.
The study of wood hydraulic, economic, and anatomical leaf traits in olive crossbreed genotypes and cultivars revealed substantial variation. Specifically, leaf traits such as SLA, SLWC, and LA exhibited considerable variation. This reflects notable intraspecific variability, consistent with findings in wild olive trees [34,36,65], and cultivars [43,66]. This variability indicates significant phenotypic plasticity, suggesting different functional responses to environmental conditions [70]. The significant differences in SLA and SLWC among olive crossbreed genotypes and cultivars point to distinct resource-use strategies [34,36,71]. SLA, an important trait within the leaf economic spectrum (LES), is correlated with resource-use efficiency [39,72], light interception capacity, and heat balance during transpiration [71,73,74]. The observed decrease in SLA and increase in SLWC for most crossbreed genotypes likely reflect a water loss control strategy, as evidenced by the negative correlation between these traits (Figure 2), which can be beneficial under drier and warmer conditions. This functional strategy was also observed in wild olive trees along an aridity gradient in Morocco [34]. Hence, previous studies have shown that leaf water content is crucial for thermal regulation and CO2 assimilation [75,76], which is vital under warmer and drier conditions. Moreover, several studies showed that plant species from Mediterranean-type ecosystems, which face seasonal droughts, have developed diverse water usage strategies and distinctive leaf-level functional traits [15,77,78].
Stomatal traits, including stomatal size (SS) and stomatal density (SD), exhibited substantial variability and significant differences between the studied crossbreed genotypes and cultivars (Table 1 and Table A1). Variations in stomatal traits significantly influence plant adaptation and function [79,80,81]. Stomatal size and density are crucial for water use and carbon assimilation [82], directly impacting water use efficiency [83]. Changes in SD and SS also regulate stomatal conductance, with increased SD linked to reduced CO2 diffusion resistance [60,84], while smaller stomata enable rapid opening and closing, allowing for quick responses to environmental changes [85]. Therefore, low SD is often associated with improved water use, whereas smaller stomata (low SS) are linked to drought avoidance [86]. Although larger stomata can facilitate faster and more efficient CO2 uptake, enhancing photosynthesis and water and nutrient transport, they may also lead to higher water loss under drier and warmer conditions [87]. The negative correlation between SD and SS observed in our study aligns with previous findings [83,88]. This inverse relationship has also been documented as a plastic response of plants to environmental changes [81,89]. The positive correlation found between SD and stomatal pore index (SPI) was linked to reduced stomatal conductance [90]. Low SD and SPI are associated with reduced water loss under drier conditions [91,92]. Overall, our findings indicate that the studied crossbreed genotypes and cultivars might adopt different strategies for efficient water use through stomatal trait regulation. Notably, a reduction in SS can occur without altering SD [89].
Regarding wood anatomical traits, vessel size (SVS) and vessel number (NVS) varied the most between crossbreed genotypes and cultivars (Table 2), with SVS showing an important range of variability. These findings align with Kassout et al. [18], who identified SVS as a crucial factor in hydraulic conduction related to olive tree growth. Hence, increasing SVS was modulated by environmental conditions, especially water availability [18]. Higher SVS was linked to the increasing volume of plant parts to be nourished [93], leading to an overall increase in conducting tissue [94]. However, smaller SVS could represent an advantage forward-limiting rapid desiccation under drier conditions [95]. Both SVS and NVS showed significant differences and higher mean values in crossbreed genotypes compared to cultivars. The variability in NVS is linked to sap conduction safety, with higher NVS representing a mechanism to avoid gaseous embolism [44]. The correlation between SVS and NVS (and DVS) suggests a trade-off between conduction efficiency (SVS) and safety (NVS) [44,96]. Although DVS and vascular conductivity (CD) did not vary between crossbreed genotypes and cultivars, the negative correlation between SVS, DVS, and NVS supports this trade-off between safety and efficiency.
The principal component analysis (PCA) results indicate contrasting patterns of variability among the studied crossbreed genotypes and cultivars (Figure 3). The first PCA axis was associated with an increase in SVS, SS, and LA, and a decrease in SD, SPI and NVS (Table A3). Crossbreed genotypes C1, C3, and C4 showed high SVS values, with C3 and C4 exhibiting higher SS compared to other crossbreed genotypes. The correlation between xylem vessel size and stomatal size suggests coordination at the plant level to ensure sufficient water transport while maintaining balanced water use [77,97]. This relationship is crucial for maintaining balanced water exchange from the liquid to vapor phase [98,99]. Conversely, crossbreed genotypes C2 and C5 showed high SD and SPI, with C6 displaying an important SS value and C5 displaying an important NVS value (Table 3). Crossbreed genotypes C2, C5, and C6 showed higher NVS compared to other crossbreed genotypes and cultivars, with C6 exhibiting low SD and significant SS. Notably, genotype C5 resulted from crossing two Moroccan cultivars (Haouzia and Menara), both characterized by high SD, SPI, and NVS. Higher stomatal density and stomatal pore index correspond to higher photosynthetic rates and competitiveness for resources [90,91], while increasing NVS provides greater sap conduction security under drier conditions [18,44]. The first PCA axis also distinguished Moroccan from introduced cultivars, with Moroccan cultivars generally showing high NVS values, which are considered advantageous under drier conditions by preventing gaseous embolism and xylem cavitation [44,100]. The high phenotypic plasticity index (PI) observed in SVS, NVS, SD, and SS for the studied crossbreed genotypes (PIGE) compared to the cultivars (PICV) can be attributed to environmental variability [101] or genetic differences [102]. The expression of phenotypic traits is directly linked to the ecological plasticity of plant species, having a direct impact on their acclimation and resilience to environmental changes [103,104]. Phenotypic plasticity is therefore associated with the future adaptability of plant species [105]. Previous findings have shown higher plasticity in physiological traits compared to morphological allocation traits [106]. However, it is challenging to determine if these responses are functionally adaptive, as the phenotypic index (PI) measures phenotypic differences resulting from genetic and environmental interactions [102]. Thus, both intrinsic and extrinsic factors can constrain phenotypic plasticity in some traits while favoring others [105].
The second PCA axis, analogous to the LES, with a negative correlation between SLA and SLWC, clusters cultivars from crossbreed genotypes (Figure 3). This relationship, previously documented for wild olive [34,36], reflects the crossbreed genotypes’ rapid nutrient acquisition under favorable conditions, especially water availability. Thus, low SLA and high SLWC confer a reduction in water loss with more resource conservation and therefore less vulnerability to stressful conditions [78,107,108]. Moreover, SLWC was identified as a ‘mechanistic’ trait playing a key role in identifying mechanisms of climatic restriction in the olive tree [34]. Consequently, higher SLWC with low SLA could be more advantageous under drier conditions [34,36,109]. Finally, the crossbreed genotypes resulting from crossbreeding between cultivars exhibited different functional responses compared to cultivars, attributed to significant trait variability and trade-offs in leaf and wood traits. For instance, crossing between Moroccan cultivars (as for C5, (Haouzia * Menara)) resulted in important hydraulic security (high NVS) and much more important photosynthetic rates and competitiveness for resources. These findings demonstrate that the trait-based approach can be effectively applied for rapid screening of new olive cultivars under development. Meanwhile, our findings should be interpreted in light of the influence of cultivar origin and biogeographical history on olive tree functional responses. Previous work has shown that sap conduction traits and their sensitivity to climate stress are strongly shaped by the evolutionary background of varieties [43]. Thus, the observed variability in our study likely reflects both genetic background and phenotypic plasticity. Nevertheless, our aim here was not to assess biogeographical differentiation but rather to compare functional responses between crosses and their parental cultivars under common conditions. It is also well established that stress regimes can induce shifts in tree functional behavior, as demonstrated in Moroccan wild olive populations distributed along an aridity gradient [18]. In addition, it should be noted that only one tree per cross combination was studied, which could represent a limitation within the present study; therefore, further investigations are needed in order to evaluate the functional responses of crossbreed genotypes from crossbreeding under different environmental conditions.
Our findings suggest that variability in leaf and wood anatomical traits significantly influences the agronomic characteristics of the studied cultivars and crossbreed genotypes. When considering the full dataset, our results showed that an increase in vessel size (SVS) and hydraulic conductivity (CD) was associated with a decrease in oil content (OC), whereas OC increased with higher NVS, DVS, and SD. This pattern remained consistent when analyzing cultivars and crosses separately: in both cases, OC increased with NVS, while in cultivars, OC decreased with increasing SVS (Table A5). Since vessel size and hydraulic conductivity determine water transport efficiency, an increase in these traits facilitates greater water supply to leaves and fruits [18]. In addition, recent findings showed that the adjustment of the hydraulic system, and consequently sap conduction performances, in olive cultivars involve particularly changes in vessel size as a function of branch diameter [43]. Excess water availability can shift carbon allocation from oil accumulation to vegetative growth. These results align with previous studies showing that increased water availability can reduce oil content in olive trees. For instance, Grattan et al. [110] reported a linear decline in the percentage of oil extracted from Arbequina fruits with increasing irrigation. Similarly, Moroccan Menara cultivars exhibited a decrease in OC with higher irrigation levels [49], and Razouk et al. [66] observed a similar trend across four olive cultivars, comparing stressed trees with well-watered ones. Notably, olive trees are relatively drought-tolerant, and moderate water stress can enhance oil accumulation in the fruit [111,112], which suggests a resource allocation strategy allowing increased oil production under water-limited conditions, possibly as a metabolic response to stress.
The observed negative relationship between fruit yield and SLA in cultivars (Table A5) suggests a trade-off between reproduction and resource conservation [113]. Lower SLA is typically associated with thicker, more resource-conservative leaves, which can enhance water-use efficiency but may limit photosynthetic rates. In contrast, high SLA is often linked to rapid growth, which may support vegetative allocation rather than reproductive investment [114]. Additionally, our results indicate that in crosses, fruit weight increased with SS but decreased with DVS (Table A5). Larger stomata allow for greater stomatal conductance, which enhances photosynthetic rates and carbohydrate accumulation, both of which are critical for fruit growth and development [115,116,117]. A decrease in vessel density (DVS), which is negatively correlated with SVS, might limit the amount of water supply to fruits, and therefore cause a reduction in fruit weight.
Overall, our findings highlight the complex interplay between leaf and wood functional traits, and agronomic output in olive cultivars and crosses. These results underscore the importance of considering both anatomical and physiological traits when selecting crossbreed genotypes for improved agronomic performance under varying environmental conditions.
The main limitation of this study lies in its environmental scope. Because all trees were grown under common garden conditions at a single experimental site, the observed functional differences may not fully reflect the responses of cultivars and crossbreed genotypes under contrasting climates or management regimes. Previous studies have shown that stress intensity, particularly drought and heat, can strongly modify hydraulic behavior and leaf trait expression in the olive [18]. While this design enabled a controlled comparison, the generalization of our findings to diverse agroecosystems should be made with caution. A second limitation concerns the temporal scope: trait measurements were conducted during a single growing season, providing only a snapshot of functional performance. As the olive is a long-lived perennial species with strong interannual variability in yield and physiology, long-term monitoring would be valuable to assess the stability of trait–performance relationships across years with differing climatic conditions. In addition, because only one tree per cross was available, intra-genotype variability could not be fully addressed. This aspect will be evaluated in future stages of the INRA breeding program, once vegetative material allows for replicated trials. Finally, while we identified associations between functional traits and agronomic variables such as oil content and fruit yield, these relationships remain correlative. A more mechanistic understanding of the physiological and biochemical pathways linking water-use efficiency, hydraulic architecture, and oil biosynthesis will be necessary to establish causal connections. Integrating functional trait analysis with detailed physiological measurements and omics approaches will help refine selection criteria for breeding drought-resilient olive cultivars.
5. Conclusions
This study highlights the significant variability in leaf and wood functional traits among different olive cultivars and crossbreed genotypes, revealing distinct strategies in resource use and functional responses between the two types and among crossbreed genotypes. Our findings demonstrate that crossbreed genotypes, particularly those derived from crossbreeding Moroccan cultivars, exhibit higher phenotypic plasticity and trait values associated with hydraulic efficiency and water-use strategies compared to the studied olive cultivars. This suggests that these crossbreed genotypes may possess enhanced functional capabilities under drier and warmer conditions, making them valuable candidates for breeding programs aimed at improving drought resistance in olives. The observed trade-offs between leaf economic traits, such as specific leaf area (SLA) and specific leaf water content (SLWC), and wood anatomical traits, including vessel surface area (SVS) and number of vessels (NVS), underscore the complex coordination between plant hydraulic function and water-use efficiency. Notably, our results indicate that increased vessel size (SVS) and hydraulic conductivity (CD) are associated with lower oil content (OC), while higher NVS, DVS, and SD favor greater OC accumulation. This suggests that hydraulic adjustments influence resource allocation, with excessive water availability promoting vegetative growth at the expense of secondary metabolite production implicated in oil biosynthesis and accumulation. These findings align with previous studies reporting that increased water supply reduces oil yield in olive trees. Additionally, our results support the idea that moderate water stress may enhance oil accumulation as a metabolic response to drought, reinforcing the importance of optimizing irrigation strategies for maximizing oil content in olive cultivars. Moreover, we found a negative relationship between fruit yield and SLA in cultivars, suggesting a trade-off between reproduction and resource conservation. Crossbreed genotypes with higher SD and smaller SS tend to use water more efficiently. Larger vessel sizes and higher NVS, in turn, improve hydraulic conduction and safety. These functional adaptations may play a crucial role in determining the agronomic performance of different olive crossbreed genotypes under varying environmental conditions. The principal component analysis (PCA) further differentiated the studied crossbreed genotypes and cultivars, revealing that crossbreed genotypes, particularly those derived from Moroccan parental lines, display functional traits indicative of greater resilience to water stress. Selecting for traits such as high SLWC, low SLA, and optimal stomatal and vessel characteristics could enhance the development of drought-resistant olive varieties. Overall, this research provides valuable insights into olive functional strategies and supports trait-based breeding for improved performance under challenging conditions. However, a key limitation of this study lies in the evaluation of only one tree per cross, in contrast to the replicated sampling of cultivars. While this reflects the constraints of early-stage breeding programs—where superior individuals are first screened and replication becomes possible once vegetative material is available—it underscores the need for further investigation to validate these findings across different environments and under field conditions. Future studies should also explore the long-term effects of hydraulic adjustments on oil yield and tree productivity to refine selection criteria for breeding resilient olive cultivars.
Author Contributions
Conceptualization, J.K.; methodology, J.K.; software, J.K.; validation, J.K.; formal analysis, H.S. and J.K.; investigation, J.K., H.E.H., A.Z. and H.S.; resources, J.K.; data curation, J.K. and H.S.; writing—original draft preparation, J.K.; writing—review and editing, J.K., H.S., H.Z., V.A.B., R.H. and S.O.; visualization, J.K.; supervision, J.K. All authors have read and agreed to the published version of the manuscript.
Funding
This work has been supported by the Institut National de la Recherche Agronomique (INRA), PRMT 2021-2024 program.
Data Availability Statement
The datasets generated during the current study are available on reasonable request from the corresponding author.
Acknowledgments
The authors would like to thank Ater Mohammed and Jean-Frédéric Terral for providing wood eco-anatomical equipment and chemicals necessary for the study. We thank also the National Institute of Agricultural Research for providing the necessary conditions for conducting this research. Special thanks go to Reda Ouhboun and Karama Mohammed for facilitating the field work.
Conflicts of Interest
The authors declare no conflicts of interest.
Abbreviations
The following abbreviations are used in this manuscript:
| WUE | Water-Use Efficency |
| LES | Leaf Economic Spectrum |
| LDMC | Leaf Dry Matter Content |
| INRA | National Institute of Agricultural Research |
| LFM | Leaf Fresh Mass |
| LDM | Leaf Dry Mass |
| SLWC | Specific Leaf Water Content |
| SLA | Specific Leaf Area |
| SS | Stomatal Size |
| SL | Stomatal Length |
| SW | Stomatal Width |
| SPI | Stomatal Pore Index |
| SD | Stomatal Density |
| LA | Leaf Area |
| BD | Branch Diameter |
| DVS | Vessel Density |
| NVS | Number of Vessels Grouped in Radial Files |
| SVS | Surface Area of Vessels |
| CD | Vascular Conductivity |
| CV | Coefficient of Variation |
| PI | Phenotypic Plasticity Index |
| PCA | Principal Component Analysis |
| OC | Oil Content |
| GE | Genotype |
Appendix A
Table A1.
Means and standard deviations from the univariate t-tests of leaf traits per cultivars and crossbreed genotypes.
Table A1.
Means and standard deviations from the univariate t-tests of leaf traits per cultivars and crossbreed genotypes.
| Trait | Type | Mean | Std. Dev | CV% | t-Test Statistics | p-Value |
|---|---|---|---|---|---|---|
| SLA | GE | 41.62 | 5.69 | 13.67 | 14.507 | <0.0001 |
| CV | 48.57 | 6.63 | 13.65 | |||
| SLWC | GE | 0.019 | 0.003 | 15.78 | −9.936 | <0.0001 |
| CV | 0.018 | 0.004 | 22.22 | |||
| LA | GE | 4.56 | 1.22 | 26.75 | −0.826 | 0.409 n.s. |
| CV | 4.58 | 1.16 | 25.32 | |||
| SD | GE | 232.12 | 59.05 | 25.43 | −1.382 | 0.041 |
| CV | 227.70 | 34.74 | 15.26 | |||
| SS | GE | 112.41 | 25.83 | 22.97 | −12.453 | <0.0001 |
| CV | 86.62 | 10.04 | 11.58 | |||
| SPI | GE | 6.39 | 1.47 | 23.00 | −4.443 | <0.0001 |
| CV | 5.77 | 1.16 | 20.10 | |||
| SVS | GE | 459.44 | 159.09 | 34.62 | −1.914 | 0.041 |
| CV | 451.45 | 145.84 | 32.30 | |||
| DVS | GE | 342.31 | 87.51 | 25.56 | 0.868 | 0.321 n.s. |
| CV | 353.64 | 95.39 | 26.97 | |||
| NVS | GE | 2.83 | 0.98 | 34.62 | −4.71 | 0.001 |
| CV | 2.63 | 0.82 | 31.17 | |||
| CD | GE | 88.46 | 92.36 | 104.40 | 25.159 | 0.311 n.s. |
| CV | 69.15 | 38.23 | 55.28 |
GE: Crossbreed genotypes; CV: Cultivars; Std. Dev: Standard deviation; CV%, Coefficient of variation in
percentage; n.s.: Non-significant. For traits abbreviation and units, see Section 2. High mean values between
cultivars and genotypes are in bold. For traits measurements and calculations, see Section 2. SLA: Specific leaf
area; LA: Leaf area; SLWC: Specific leaf water content; SD: Stomatal density; SS: Stomatal size; SPI: Stomatal
pore index; SVS: Vessel surface area; DVS: Vessel density; NVS: Number of vessels grouped in radial files;
CD: Hydraulic conductivity.
Table A2.
Phenotypic plasticity index of the studied traits for cultivars (PICV) and crossbreed genotypes (PIGE).
Table A2.
Phenotypic plasticity index of the studied traits for cultivars (PICV) and crossbreed genotypes (PIGE).
| Trait | PICV | PIGE | PIGE − PICV |
|---|---|---|---|
| SLA | 0.67 | 0.63 | −0.04 * |
| SLWC | 0.95 | 0.78 | −0.17 * |
| LA | 0.80 | 0.77 | −0.02 |
| SD | 0.60 | 0.73 | 0.12 * |
| SS | 0.47 | 0.60 | 0.13 * |
| SPI | 0.71 | 0.69 | −0.02 * |
| SVS | 0.53 | 0.88 | 0.36 * |
| DVS | 0.59 | 0.56 | −0.03 |
| NVS | 0.19 | 0.71 | 0.52 * |
| CD | 0.88 | 0.89 | 0.02 |
* Significant differences found between cultivars and genotypes (see Table 2 and Table 3). For traits measurements and calculations, see Section 2. SLA: Specific leaf area; LA: Leaf area; SLWC: Specific leaf water content; SD: Stomatal density; SS: Stomatal size; SPI: Stomatal pore index; SVS: Vessel surface area; DVS: Vessel density; NVS: Number of vessels grouped in radial files; CD: Hydraulic conductivity.
Table A3.
Trait loading, percentage, and cumulative percentage of trait variation explained by the first three principal components (PCs).
Table A3.
Trait loading, percentage, and cumulative percentage of trait variation explained by the first three principal components (PCs).
| Trait | PC1 | PC2 | PC3 |
|---|---|---|---|
| SLA | 0.051 | −0.931 | −0.004 |
| SLWC | 0.370 | 0.730 | 0.038 |
| LA | 0.534 | −0.146 | 0.784 |
| SD | −0.978 | 0.022 | −0.018 |
| SS | 0.708 | 0.600 | 0.032 |
| SPI | −0.823 | 0.432 | −0.177 |
| SVS | 0.930 | −0.013 | −0.267 |
| NVS | −0.591 | 0.566 | 0.312 |
| Variance (%) | 47.24 | 28.66 | 11.65 |
| Cumulative Variance (%) | 47.24 | 75.90 | 87.55 |
For traits measurements and calculations, see Section 2. SLA: Specific leaf area; LA: Leaf area; SLWC: Specific leaf
water content; SD: Stomatal density; SS: Stomatal size; SPI: Stomatal pore index; SVS: Vessel surface area; NVS:
Number of vessels grouped in radial files.
Table A4.
Agronomic characteristics of the studied cultivars and crosses.
Table A4.
Agronomic characteristics of the studied cultivars and crosses.
| Cultivar/Crosses | Fruit Yield (Kg/Tree) | Oil Content (%) | Fruit Individual Weight (g) |
|---|---|---|---|
| Arbequina | 21.6 a | 16.1 | 1.35 |
| Manzanilla | 48.2 | 17.2 | 5.75 |
| Picholine du L. b | 30.3 | 18.2 | 5.10 |
| Haouzia | 50.8 | 19.8 | 3.72 |
| Menara | 47.2 | 20.1 | 3.43 |
| M26 | 46.3 | 19.1 | 3.22 |
| C1 | 40 | 16.8 | 3.52 |
| C2 | 60 | 21.8 | 2.95 |
| C3 | 50 | 18.9 | 4.04 |
| C4 | 45 | 14.6 | 4.27 |
| C5 | 40 | 17.9 | 3.52 |
| C6 | 32 | 19.0 | 3.31 |
a Mean values of three replicate trees. b Picholine du Languedoc. For traits measurements and calculations, see Section 2.
Table A5.
Correlation analysis between leaf and wood traits depending on all dataset (A), for cultivars (B) and crossbreeding genotypes (C) separately.
Table A5.
Correlation analysis between leaf and wood traits depending on all dataset (A), for cultivars (B) and crossbreeding genotypes (C) separately.
| LA | SLWC | SLA | SD | SPI | SS | SVS | DVS | NVS | CD | |
|---|---|---|---|---|---|---|---|---|---|---|
| A—All Dataset | ||||||||||
| OC (%) | −0.183 | −0.510 | 0.027 | 0.587 * | 0.401 | −0.488 | −0.752 ** | 0.666 * | 0.739 ** | −0.727 ** |
| Yield (Kg/Tree) | −0.255 | −0.089 | −0.551 | 0.241 | 0.340 | 0.067 | −0.246 | 0.134 | 0.597 * | −0.233 |
| FIW (g) | 0.258 | −0.077 | −0.302 | −0.117 | −0.222 | 0.143 | 0.139 | −0.207 | −0.109 | 0.032 |
| B—Cultivars | ||||||||||
| OC (%) | 0.197 | −0.676 | −0.504 | 0.781 | 0.445 | −0.666 | −0.967 ** | 0.350 | 0.891 * | −0.928 ** |
| Yield (Kg/Tree) | −0.202 | −0.691 | −0.829 * | 0.961 ** | 0.701 | −0.714 | −0.588 | 0.044 | 0.499 | −0.675 |
| FIW (g) | 0.269 | −0.245 | −0.762 | 0.217 | −0.186 | 0.046 | −0.098 | −0.008 | 0.255 | −0.401 |
| C—Crossbreed Genotypes | ||||||||||
| OC (%) | −0.540 | −0.566 | 0.301 | 0.559 | 0.488 | −0.601 | −0.677 | 0.786 | 0.860 * | −0.678 |
| Yield (Kg/Tree) | −0.553 | −0.043 | −0.387 | −0.012 | 0.144 | 0.173 | −0.062 | 0.307 | 0.726 | −0.077 |
| FIW (g) | 0.492 | 0.197 | −0.112 | −0.679 | −0.516 | 0.841 * | 0.718 | −0.870 * | −0.747 | 0.738 |
* significant correlation coefficient at p < 0.05. ** significant correlation coefficient at p < 0.01. For traits measurements and calculations, see Section 2. SLA: Specific leaf area; LA: Leaf area; SLWC: Specific leaf water content; SD: Stomatal density; SS: Stomatal size; SPI: Stomatal pore index; SVS: Vessel surface area; DVS: Vessel density; NVS: Number of vessels grouped in radial files.

Figure A1.
Correlation analysis between leaf and wood traits of the studied olive cultivars (A) and crossbreed genotypes (B).
Figure A1.
Correlation analysis between leaf and wood traits of the studied olive cultivars (A) and crossbreed genotypes (B).

References
- Lobell, D.B.; Baldos, U.L.C.; Hertel, T.W. Climate adaptation as mitigation: The case of agricultural investments. Environ. Res. Lett. 2013, 8, 015012. [Google Scholar] [CrossRef]
- Stocker, T.F.; Qin, D.; Plattner, G.K.; Tignor, M.M.B.; Allen, S.K.; Boschung, J.; Nauels, A.; Xia, Y.; Bex, V.; Midgley, P.M. Climate Change 2013: The Physical Science Basis: Working Group I Contribution to the Fifth Assessment Report of the Intergovernmental Panel on Climate Change; Cambridge University Press: Cambridge, UK, 2014. [Google Scholar]
- Jägermeyr, J.; Müller, C.; Ruane, A.C.; Elliott, J.; Balkovic, J.; Castillo, O.; Faye, B.; Foster, I.; Folberth, C.; Franke, J.A.; et al. Climate impacts on global agriculture emerge earlier in new generation of climate and crop models. Nat. Food 2021, 2, 873–885. [Google Scholar] [CrossRef] [PubMed]
- Dai, A. Increasing drought under global warming in observations and models. Nat. Clim. Change 2013, 3, 52–58. [Google Scholar] [CrossRef]
- Sherwood, S.; Fu, Q. A drier future? Science 2014, 343, 737–739. [Google Scholar] [CrossRef]
- Zhao, C.; Liu, B.; Piao, S.; Wang, X.; Lobell, D.B.; Huang, Y.; Huang, M.; Yao, Y.; Bassu, S.; Ciais, P.; et al. Temperature increase reduces global yields of major crops in four independent estimates. Proc. Natl. Acad. Sci. USA 2017, 114, 9326–9331. [Google Scholar] [CrossRef]
- Allen, C.D.; Macalady, A.K.; Chenchouni, H.; Bachelet, D.; McDowell, N.; Vennetier, M.; Kitzberger, T.; Rigling, A.; Breshears, D.D.; Hogg, E.T.; et al. A global overview of drought and heat-induced tree mortality reveals emerging climate change risks for forests. For. Ecol. Manag. 2010, 259, 660–684. [Google Scholar] [CrossRef]
- Wu, X.; Hao, Z.; Tang, Q.; Singh, V.P.; Zhang, X.; Hao, F. Projected increase in compound dry and hot events over global land areas. Int. J. Climatol. 2021, 41, 393–403. [Google Scholar] [CrossRef]
- Kassout, J.; Terral, J.F.; El Ouahrani, A.; Houssni, M.; Ivorra, S.; Kadaoui, K.; El Mahroussi, M.; Paradis, L.; Ater, M. Species distribution based-modelling under climate change: The case of two native wild Olea europaea subspecies in Morocco, O. e. subsp. europaea var. sylvestris and O. e. subsp. maroccana. In Climate Change in the Mediterranean and Middle Eastern Region; Springer: Berlin/Heidelberg, Germany, 2022; pp. 21–43. [Google Scholar] [CrossRef]
- Saponari, M.; Loconsole, G.; Cornara, D.; Yokomi, R.K.; De Stradis, A.; Boscia, D.; Bosco, D.; Martelli, G.P.; Krugner, R.; Porcelli, F. Infectivity and transmission of Xylella fastidiosa by Philaenus spumarius (Hemiptera: Aphrophoridae) in Apulia, Italy. J. Econ. Entomol. 2014, 107, 1316–1319. [Google Scholar] [CrossRef]
- Spence, N.; Hill, L.; Morris, J. How the global threat of pests and diseases impacts plants, people, and the planet. Plants People Planet 2020, 2, 5–13. [Google Scholar] [CrossRef]
- Azenzem, R.; Kassout, J. Climate change and insect pests: Economic damages and adaptive strategies in Mediterranean olive groves. In Climate Change and the Economic Importance and Damages of Insects; IGI Global: Hershey, PA, USA, 2023; pp. 14–47. [Google Scholar] [CrossRef]
- Vellend, M.; Baeten, L.; Becker-Scarpitta, A.; Boucher-Lalonde, V.; McCune, J.L.; Messier, J.; Myers-Smith, I.H.; Sax, D.F. Plant biodiversity change across scales during the Anthropocene. Annu. Rev. Plant Biol. 2017, 68, 563–586. [Google Scholar] [CrossRef]
- Zhan, J.; Ericson, L.; Burdon, J.J. Climate change accelerates local disease extinction rates in a long-term wild host–pathogen association. Glob. Change Biol. 2018, 24, 3526–3536. [Google Scholar] [CrossRef]
- Matesanz, S.; Valladares, F. Ecological and evolutionary responses of Mediterranean plants to global change. Environ. Exp. Bot. 2014, 103, 53–67. [Google Scholar] [CrossRef]
- Polade, S.D.; Pierce, D.W.; Cayan, D.R.; Gershunov, A.; Dettinger, M.D. The key role of dry days in changing regional climate and precipitation regimes. Sci. Rep. 2014, 4, 4364. [Google Scholar] [CrossRef]
- Lloret, F.; de la Riva, E.G.; Pérez-Ramos, I.M.; Marañón, T.; Saura-Mas, S.; Díaz-Delgado, R.; Villar, R. Climatic events inducing die-off in Mediterranean shrublands: Are species’ responses related to their functional traits? Oecologia 2016, 180, 961–973. [Google Scholar] [CrossRef]
- Kassout, J.; Ater, M.; Ivorra, S.; Barbara, H.; Limier, B.; Ros, J.; Girard, V.; Paradis, L.; Terral, J.F. Resisting aridification: Adaptation of sap conduction performance in Moroccan wild olive subspecies distributed over an aridity gradient. Front. Plant Sci. 2021, 12, 663721. [Google Scholar] [CrossRef]
- Kassout, J.; Terral, J.F.; Azenzem, R.; El Ouahrani, A.; Sahli, A.; Houssni, M.; Chakkour, S.; Kadaoui, K.; Ater, M. Olea europaea and stressful conditions. In Medicinal Plant Responses to Stressful Conditions; CRC Press: Boca Raton, FL, USA, 2023; pp. 243–272. [Google Scholar]
- Abou-Saaid, O.; El Yaacoubi, A.; Moukhli, A.; El Bakkali, A.; Oulbi, S.; Delalande, M.; Farrera, I.; Kelner, J.J.; Lochon-Menseau, S.; El Modafar, C. Statistical approach to assess chill and heat requirements of olive tree based on flowering date and temperatures data: Towards selection of adapted cultivars to global warming. Agronomy 2022, 12, 2975. [Google Scholar] [CrossRef]
- Hoerling, M.; Eischeid, J.; Perlwitz, J.; Quan, X.W.; Zhang, T.; Pegion, P. On the increased frequency of Mediterranean drought. J. Clim. 2012, 25, 2146–2161. [Google Scholar] [CrossRef]
- Gao, X.; Giorgi, F. Increased aridity in the Mediterranean region under greenhouse gas forcing estimated from high resolution simulations with a regional climate model. Glob. Planet. Change 2008, 62, 195–209. [Google Scholar] [CrossRef]
- Howden, S.M.; Soussana, J.F.; Tubiello, F.N.; Chhetri, N.; Dunlop, M.; Meinke, H. Adapting agriculture to climate change. Proc. Natl. Acad. Sci. USA 2007, 104, 19691–19696. [Google Scholar] [CrossRef] [PubMed]
- Lipper, L.; Thornton, P.; Campbell, B.M.; Baedeker, T.; Braimoh, A.; Bwalya, M.; Caron, P.; Cattaneo, A.; Garrity, D.; Henry, K.; et al. Climate-smart agriculture for food security. Nat. Clim. Change 2014, 4, 1068–1072. [Google Scholar] [CrossRef]
- Flexas, J.; Díaz-Espejo, A.; Conesa, M.A.; Coopman, R.E.; Douthe, C.; Gago, J.; Gallé, A.; Galmés, J.; Medrano, H.; Ribas-Carbó, M. Mesophyll conductance to CO2 and Rubisco as targets for improving intrinsic water use efficiency in C3 plants. Plant Cell Environ. 2016, 39, 965–982. [Google Scholar] [CrossRef] [PubMed]
- Lavee, S. Evaluation of the need and present potential of olive breeding indicating the nature of the available genetic resources involved. Sci. Hortic. 2013, 161, 333–339. [Google Scholar] [CrossRef]
- De la Rosa, R.; Klepo, T.; Arias-Calderón, R.; Toumi, A.; Domínguez-García, M.d.C.; León, L.; Belaj, A.; Mariotti, R.; Baldoni, L.; Satovic, Z. Current status of conservation, evaluation and usefulness of wild olive germplasm. In Proceedings of the VII International Symposium on Olive Growing, San Juan, Argentina, 24–29 September 2012; Volume 1057, pp. 515–520. [Google Scholar]
- Kaniewski, D.; Marriner, N.; Morhange, C.; Khater, C.; Terral, J.F.; Besnard, G.; Otto, T.; Luce, F.; Couillebault, Q.; Tsitsou, L. Climate change threatens olive oil production in the Levant. Nat. Plants 2023, 9, 219–227. [Google Scholar] [CrossRef]
- Allaby, R.G.; Stevens, C.J.; Kistler, L.; Fuller, D.Q. Genetic revelations of a new paradigm of plant domestication as a landscape level process. In Plant Breeding Reviews; Wiley: Hoboken, NJ, USA, 2021; Volume 45, pp. 321–343. [Google Scholar] [CrossRef]
- Isaac, M.E.; Nimmo, V.; Gaudin, A.C.; Leptin, A.; Schmidt, J.E.; Kallenbach, C.M.; Martin, A.; Entz, M.; Carkner, M.; Rajcan, I.; et al. Crop domestication, root trait syndromes, and soil nutrient acquisition in organic agroecosystems: A systematic review. Front. Sustain. Food Syst. 2021, 5, 716480. [Google Scholar] [CrossRef]
- Martin, A.R.; Miller, L.; Madigan, M.; Cui, B.; Cathline, K.A.; Robertson, G.P. Trait integration varies with resource acquisition strategies in a common perennial crop. Funct. Ecol. 2025, 39, 1112–1127. [Google Scholar] [CrossRef]
- Díaz, S. Plant functional traits and the entangled phenotype. Funct. Ecol. 2025, 39, 1144–1159. [Google Scholar] [CrossRef]
- Violle, C.; Navas, M.L.; Vile, D.; Kazakou, E.; Fortunel, C.; Hummel, I.; Garnier, E. Let the concept of trait be functional! Oikos 2007, 116, 882–892. [Google Scholar] [CrossRef]
- Kassout, J.; Terral, J.F.; Hodgson, J.G.; Ater, M. Trait-based plant ecology a flawed tool in climate studies? The leaf traits of wild olive that pattern with climate are not those routinely measured. PLoS ONE 2019, 14, e0219908. [Google Scholar] [CrossRef]
- Kassout, J.; Hmimsa, Y.; Fatehi, S.E.; Kadaoui, K.; Houssni, M.; Chakkour, S.; Sahli, A.; El Chami, M.A.; Ariza-Mateos, D.; Palacios-Rodríguez, G.; et al. Aridity gradients shape intraspecific variability of morphological traits in native Ceratonia siliqua L. of Morocco. Plants 2023, 12, 3447. [Google Scholar] [CrossRef]
- Kassout, J.; Terral, J.F.; Souali, H.; Ater, M. Environment-dependent and intraspecific variations in leaf and size traits of a native wild olive (Olea europaea L.) along an aridity gradient in Morocco: A functional perspective. Plant Ecol. 2024, 225, 943–959. [Google Scholar] [CrossRef]
- Kassout, J.; Terral, J.F.; Boselli, V.; Souali, H.; Ater, M. Roots of domestication: Unveiling the dynamics of domestication through trait-based analysis of olive trees in Northern Morocco. Philos. Trans. R. Soc. B Biol. Sci. 2025, 380, 20230316. [Google Scholar] [CrossRef]
- Martin, A.R.; Isaac, M.E. REVIEW: Plant functional traits in agroecosystems: A blueprint for research. J. Appl. Ecol. 2015, 52, 1425–1435. [Google Scholar] [CrossRef]
- Wright, I.J.; Reich, P.B.; Westoby, M.; Ackerly, D.D.; Baruch, Z.; Bongers, F.; Cavender-Bares, J.; Chapin, T.; Cornelissen, J.H.; Diemer, M.; et al. The worldwide leaf economics spectrum. Nature 2004, 428, 821–827. [Google Scholar] [CrossRef] [PubMed]
- Díaz, S.; Kattge, J.; Cornelissen, J.H.; Wright, I.J.; Lavorel, S.; Dray, S.; Reu, B.; Kleyer, M.; Wirth, C.; Colin Prentice, I.; et al. The global spectrum of plant form and function. Nature 2016, 529, 167–171. [Google Scholar] [CrossRef]
- Reich, P.B. The world-wide ‘fast-slow’ plant economics spectrum: A traits manifesto. J. Ecol. 2014, 102, 275–301. [Google Scholar] [CrossRef]
- Chave, J.; Coomes, D.; Jansen, S.; Lewis, S.L.; Swenson, N.G.; Zanne, A.E. Towards a worldwide wood economics spectrum. Ecol. Lett. 2009, 12, 351–366. [Google Scholar] [CrossRef]
- Terral, J.F.; Creusot, P.; Limier, B.; Bombeau, A.; Bernazeau, B.; Lochon-Menseau, S.; Ater, M.; Barbara, H.; Pinatel, C.; Paradis, L.; et al. The potential of sap conduction in the olive tree is linked to aridity conditions of the main cultivation area of varieties and allow to uncover their sensitivity to ongoing climate change. Sci. Hortic. 2025, 334, 113297. [Google Scholar] [CrossRef]
- Terral, J.F.; Badal, E.; Heinz, C.; Roiron, P.; Thiebault, S.; Figueiral, I. A hydraulic conductivity model points to post-Neogene survival of the Mediterranean olive. Ecology 2004, 85, 3158–3165. [Google Scholar] [CrossRef]
- Kuppler, J.; Albert, C.H.; Ames, G.M.; Armbruster, W.S.; Boenisch, G.; Boucher, F.C.; Campbell, D.R.; Carneiro, L.T.; Chacón-Madrigal, E.; Enquist, B.J.; et al. Global gradients in intraspecific variation in vegetative and floral traits are partially associated with climate and species richness. Glob. Ecol. Biogeogr. 2020, 29, 992–1007. [Google Scholar] [CrossRef]
- Albert, C.H.; Thuiller, W.; Yoccoz, N.G.; Douzet, R.; Aubert, S.; Lavorel, S. A multi-trait approach reveals the structure and the relative importance of intra-vs. interspecific variability in plant traits. Funct. Ecol. 2010, 24, 1192–1201. [Google Scholar] [CrossRef]
- Barot, S.; Allard, V.; Cantarel, A.; Enjalbert, J.; Gauffreteau, A.; Goldringer, I.; Lata, J.C.; Le Roux, X.; Niboyet, A.; Porcher, E. Designing mixtures of varieties for multifunctional agriculture with the help of ecology. A review. Agron. Sustain. Dev. 2017, 37, 13. [Google Scholar] [CrossRef]
- Wuest, S.E.; Peter, R.; Niklaus, P.A. Ecological and evolutionary approaches to improving crop variety mixtures. Nat. Ecol. Evol. 2021, 5, 1068–1077. [Google Scholar] [CrossRef]
- Ibba, K.; Kassout, J.; Boselli, V.; Er-Raki, S.; Oulbi, S.; Mansouri, L.E.; Bouizgaren, A.; Sikaoui, L.; Hadria, R. Assessing the impact of deficit irrigation strategies on agronomic and productive parameters of Menara olive cultivar: Implications for operational water management. Front. Environ. Sci. 2023, 11, 1100552. [Google Scholar] [CrossRef]
- El Antari, A.; Sikaoui, L. Catalogues des Variétés d’Olivier Cultivées et Autochtones du Maroc, 1st ed.; Institut National de la Recherche Agronomique: Rabat, Morocco, 2022. [Google Scholar]
- Miho, H.; Atallah, M.; Trapero, C.; Koubouris, G.; Valverde, P. Parental effect on agronomic and olive oil traits in olive progenies from reciprocal crosses. Plants 2024, 13, 2467. [Google Scholar] [CrossRef] [PubMed]
- Moret, M.; Serrano, A.; Belaj, A.; León, L.; de la Rosa, R.; Luque, F. Genetic markers of olive fruit weight selected to be used in breeding experiments. Mol. Breed. 2025, 45, 40. [Google Scholar] [CrossRef] [PubMed]
- Mousavi, S.; De la Rosa, R.; Moukhli, A.; El Riachy, M.; Mariotti, R.; Torres, M.; Pierantozzi, P.; Stanzione, V.; Mastio, V.; Zaher, H.; et al. Plasticity of fruit and oil traits in olive among different environments. Sci. Rep. 2019, 9, 16968. [Google Scholar] [CrossRef]
- Pérez-Harguindeguy, N.; Díaz, S.; Garnier, E.; Lavorel, S.; Poorter, H.; Jaureguiberry, P.; Bret-Harte, M.S.; Cornwell, W.K.; Craine, J.M.; Gurvich, D.E.; et al. New handbook for standardised measurement of plant functional traits worldwide. Aust. J. Bot. 2013, 61, 167–234. [Google Scholar] [CrossRef]
- Besnard, G.; Khadari, B.; Navascués, M.; Fernández-Mazuecos, M.; El Bakkali, A.; Arrigo, N.; Baali-Cherif, D.; Brunini-Bronzini de Caraffa, V.; Santoni, S.; Vargas, P.; et al. The complex history of the olive tree: From Late Quaternary diversification of Mediterranean lineages to primary domestication in the northern Levant. Proc. R. Soc. B Biol. Sci. 2013, 280, 20122833. [Google Scholar] [CrossRef] [PubMed]
- Khadari, B.; El Bakkali, A.; Essalouh, L.; Tollon, C.; Pinatel, C.; Besnard, G. Cultivated olive diversification at local and regional scales: Evidence from the genetic characterization of French genetic resources. Front. Plant Sci. 2019, 10, 1593. [Google Scholar] [CrossRef]
- Ryser, P.; Bernardi, J.; Merla, A. Determination of leaf fresh mass after storage between moist paper towels: Constraints and reliability of the method. J. Exp. Bot. 2008, 59, 2461–2467. [Google Scholar] [CrossRef]
- Schneider, C.A.; Rasband, W.S.; Eliceiri, K.W. NIH Image to ImageJ: 25 years of image analysis. Nat. Methods 2012, 9, 671–675. [Google Scholar] [CrossRef]
- Wang, R.; Yu, G.; He, N.; Wang, Q.; Zhao, N.; Xu, Z.; Ge, J. Latitudinal variation of leaf stomatal traits from species to community level in forests: Linkage with ecosystem productivity. Sci. Rep. 2015, 5, 14454. [Google Scholar] [CrossRef]
- Liu, C.; He, N.; Zhang, J.; Li, Y.; Wang, Q.; Sack, L.; Yu, G. Variation of stomatal traits from cold temperate to tropical forests and association with water use efficiency. Funct. Ecol. 2018, 32, 20–28. [Google Scholar] [CrossRef]
- Terral, J.F.; Arnold-Simard, G. Beginnings of olive cultivation in eastern Spain in relation to Holocene bioclimatic changes. Quat. Res. 1996, 46, 176–185. [Google Scholar] [CrossRef]
- Castro-Díez, P.; Navarro, J.; Pintado, A.; Sancho, L.G.; Maestro, M. Interactive effects of shade and irrigation on the performance of seedlings of three Mediterranean Quercus species. Tree Physiol. 2006, 26, 389–400. [Google Scholar] [CrossRef]
- Funk, J.L.; Larson, J.E.; Ames, G.M.; Butterfield, B.J.; Cavender-Bares, J.; Firn, J.; Laughlin, D.C.; Sutton-Grier, A.E.; Williams, L.; Wright, J. Revisiting the holy grail: Using plant functional traits to understand ecological processes. Biol. Rev. 2017, 92, 1156–1173. [Google Scholar] [CrossRef] [PubMed]
- Díaz, S.; Kattge, J.; Cornelissen, J.H.; Wright, I.J.; Lavorel, S.; Dray, S.; Reu, B.; Kleyer, M.; Wirth, C.; Prentice, I.C.; et al. The global spectrum of plant form and function: Enhanced species-level trait dataset. Sci. Data 2022, 9, 755. [Google Scholar] [CrossRef]
- Kassout, J.; Kadaoui, K.; Hmimsa, Y.; El Fatehi, S.; Chakkour, S.; Houssni, M.; Oulbi, S.; Azenzem, R.; Sahli, A.; Ater, M. The missing component: Intraspecific traits variation enhances wild fruit tree tolerance to climate change. In Water-Soil-Plant-Animal Nexus in the Era of Climate Change; IGI Global: Hershey, PA, USA, 2024; pp. 194–210. [Google Scholar] [CrossRef]
- Razouk, R.; Hssaini, L.; Alghoum, M.; Adiba, A.; Hamdani, A. Phenotyping olive cultivars for drought tolerance using leaf macro-characteristics. Horticulturae 2022, 8, 939. [Google Scholar] [CrossRef]
- Milla, R. Phenotypic evolution of agricultural crops. Funct. Ecol. 2023, 37, 976–988. [Google Scholar] [CrossRef]
- Milla, R.; Matesanz, S. Growing larger with domestication: A matter of physiology, morphology or allocation? Plant Biol. 2017, 19, 475–483. [Google Scholar] [CrossRef] [PubMed]
- Williams, A.; Langridge, H.; Straathof, A.L.; Muhamadali, H.; Hollywood, K.A.; Goodacre, R.; de Vries, F.T. Root functional traits explain root exudation rate and composition across a range of grassland species. J. Ecol. 2022, 110, 21–33. [Google Scholar] [CrossRef]
- Garnier, E.; Navas, M.L. A trait-based approach to comparative functional plant ecology: Concepts, methods and applications for agroecology. A review. Agron. Sustain. Dev. 2012, 32, 365–399. [Google Scholar] [CrossRef]
- Wilson, P.J.; Thompson, K.; Hodgson, J.G. Specific leaf area and leaf dry matter content as alternative predictors of plant strategies. New Phytol. 1999, 143, 155–162. [Google Scholar] [CrossRef]
- Liu, Z.; Zhao, M.; Zhang, H.; Ren, T.; Liu, C.; He, N. Divergent response and adaptation of specific leaf area to environmental change at different spatio-temporal scales jointly improve plant survival. Glob. Change Biol. 2023, 29, 1144–1159. [Google Scholar] [CrossRef]
- Garnier, E.; Laurent, G.; Bellmann, A.; Debain, S.; Berthelier, P.; Ducout, B.; Roumet, C.; Navas, M.L. Consistency of species ranking based on functional leaf traits. New Phytol. 2001, 152, 69–83. [Google Scholar] [CrossRef] [PubMed]
- Puglielli, G.; Varone, L.; Gratani, L.; Catoni, R. Specific leaf area variations drive acclimation of Cistus salvifolius in different light environments. Photosynthetica 2017, 55, 31–40. [Google Scholar] [CrossRef]
- Michaletz, S.T.; Weiser, M.D.; Zhou, J.; Kaspari, M.; Helliker, B.R.; Enquist, B.J. Plant thermoregulation: Energetics, trait–environment interactions, and carbon economics. Trends Ecol. Evol. 2015, 30, 714–724. [Google Scholar] [CrossRef]
- Wang, Z.; Huang, H.; Wang, H.; Peñuelas, J.; Sardans, J.; Niinemets, Ü.; Niklas, K.J.; Li, Y.; Xie, J.; Wright, I.J.; et al. Leaf water content contributes to global leaf trait relationships. Nat. Commun. 2022, 13, 5525. [Google Scholar] [CrossRef] [PubMed]
- Pivovaroff, A.L.; Cook, V.M.; Santiago, L.S. Stomatal behaviour and stem xylem traits are coordinated for woody plant species under exceptional drought conditions. Plant Cell Environ. 2018, 41, 2617–2626. [Google Scholar] [CrossRef]
- Valliere, J.M.; Nelson, K.C.; Martinez, M.C. Functional traits and drought strategy predict leaf thermal tolerance. Conserv. Physiol. 2023, 11, coad085. [Google Scholar] [CrossRef]
- Raven, J.A. Selection pressures on stomatal evolution. New Phytol. 2002, 153, 371–386. [Google Scholar] [CrossRef]
- Haworth, M.; Elliott-Kingston, C.; McElwain, J.C. Stomatal control as a driver of plant evolution. J. Exp. Bot. 2011, 62, 2419–2423. [Google Scholar] [CrossRef]
- Haworth, M.; Marino, G.; Materassi, A.; Raschi, A.; Scutt, C.P.; Centritto, M. The functional significance of the stomatal size to density relationship: Interaction with atmospheric [CO2] and role in plant physiological behaviour. Sci. Total Environ. 2023, 863, 160908. [Google Scholar] [CrossRef] [PubMed]
- Franks, P.J.; Farquhar, G.D. The mechanical diversity of stomata and its significance in gas-exchange control. Plant Physiol. 2007, 143, 78–87. [Google Scholar] [CrossRef] [PubMed]
- Franks, P.J.; Doheny-Adams, T.W.; Britton-Harper, Z.J.; Gray, J.E. Increasing water-use efficiency directly through genetic manipulation of stomatal density. New Phytol. 2015, 207, 188–195. [Google Scholar] [CrossRef]
- Bosabalidis, A.M.; Kofidis, G. Comparative effects of drought stress on leaf anatomy of two olive cultivars. Plant Sci. 2002, 163, 375–379. [Google Scholar] [CrossRef]
- Woodward, F.I.; Lake, J.A.; Quick, W.P. Stomatal development and CO2: Ecological consequences. New Phytol. 2002, 153, 477–484. [Google Scholar] [CrossRef]
- Durand, M.; Brendel, O.; Buré, C.; Le Thiec, D. Altered stomatal dynamics induced by changes in irradiance and vapour-pressure deficit under drought: Impacts on the whole-plant transpiration efficiency of poplar genotypes. New Phytol. 2019, 222, 1789–1802. [Google Scholar] [CrossRef]
- Lawson, T.; Vialet-Chabrand, S. Speedy stomata, photosynthesis and plant water use efficiency. New Phytol. 2019, 221, 93–98. [Google Scholar] [CrossRef]
- Liu, C.; Sack, L.; Li, Y.; Zhang, J.; Yu, K.; Zhang, Q.; He, N.; Yu, G. Relationships of stomatal morphology to the environment across plant communities. Nat. Commun. 2023, 14, 6629. [Google Scholar] [CrossRef]
- Doheny-Adams, T.; Hunt, L.; Franks, P.J.; Beerling, D.J.; Gray, J.E. Genetic manipulation of stomatal density influences stomatal size, plant growth and tolerance to restricted water supply across a growth carbon dioxide gradient. Philos. Trans. R. Soc. B Biol. Sci. 2012, 367, 547–555. [Google Scholar] [CrossRef] [PubMed]
- Sack, L.; Cowan, P.D.; Jaikumar, N.; Holbrook, N.M. The ‘hydrology’ of leaves: Co-ordination of structure and function in temperate woody species. Plant Cell Environ. 2003, 26, 1343–1356. [Google Scholar] [CrossRef]
- Sack, L.; Ball, M.C.; Brodersen, C.; Davis, S.D.; Des Marais, D.L.; Donovan, L.A.; Givnish, T.J.; Hacke, U.G.; Huxman, T.; Jansen, S.; et al. Plant hydraulics as a central hub integrating plant and ecosystem function: Meeting report for ‘Emerging Frontiers in Plant Hydraulics’ (Washington, DC, May 2015). Plant Cell Environ. 2016, 39, 2085–2094. [Google Scholar] [CrossRef]
- Petrík, P.; Petek, A.; Konôpková, A.; Bosela, M.; Fleischer, P.; Frýdl, J.; Kurjak, D. Stomatal and leaf morphology response of European beech (Fagus sylvatica L.) provenances transferred to contrasting climatic conditions. Forests 2020, 11, 1359. [Google Scholar] [CrossRef]
- Choat, B.; Jansen, S.; Brodribb, T.J.; Cochard, H.; Delzon, S.; Bhaskar, R.; Bucci, S.J.; Feild, T.S.; Gleason, S.M.; Hacke, U.G.; et al. Global convergence in the vulnerability of forests to drought. Nature 2012, 491, 752–755. [Google Scholar] [CrossRef]
- Ros, J.; Terral, J.F.; Ruas, M.P.; Ivorra, S.; Limier, B.; Ater, M.; Paradis, L.; Ettahiri, A.S.; Fili, A.; Van Staëvel, J.P. Understanding anatomical plasticity of argan wood features at local geographical scale in ecological and archaeobotanical perspectives. Sci. Rep. 2021, 11, 10830. [Google Scholar] [CrossRef]
- Kurjak, D.; Petrík, P.; Konôpková, A.; Link, R.M.; Gömöry, D.; Hajek, P.; Liesebach, M.; Leuschner, C.; Schuldt, B. Inter-provenance variability and phenotypic plasticity of wood and leaf traits related to hydraulic safety and efficiency in seven European beech (Fagus sylvatica L.) provenances differing in yield. Ann. For. Sci. 2024, 81, 9. [Google Scholar] [CrossRef]
- Terral, J.F.; Mengüal, X. Reconstruction of Holocene climate in southern France and eastern Spain using quantitative anatomy of olive wood and archaeological charcoal. Palaeogeogr. Palaeoclimatol. Palaeoecol. 1999, 153, 71–92. [Google Scholar] [CrossRef]
- Tombesi, S.; Nardini, A.; Frioni, T.; Soccolini, M.; Zadra, C.; Farinelli, D.; Poni, S.; Palliotti, A. Stomatal closure is induced by hydraulic signals and maintained by ABA in drought-stressed grapevine. Sci. Rep. 2015, 5, 12449. [Google Scholar] [CrossRef]
- Brodribb, T.J.; McAdam, S.A.; Carins Murphy, M.R. Xylem and stomata, coordinated through time and space. Plant Cell Environ. 2017, 40, 872–880. [Google Scholar] [CrossRef]
- Zhang, S.B.; Carins Murphy, M.R.; Cardoso, A.A.; Jordan, G.J.; Brodribb, T.J. Similar geometric rules govern the distribution of veins and stomata in petals, sepals and leaves. New Phytol. 2018, 219, 1224–1234. [Google Scholar] [CrossRef]
- Maherali, H.; Pockman, W.T.; Jackson, R.B. Adaptive variation in the vulnerability of woody plants to xylem cavitation. Ecology 2004, 85, 2184–2199. [Google Scholar] [CrossRef]
- Gratani, L.; Crescente, M.F. Phenology and leaf adaptive strategies of Mediterranean maquis plants. Ecol. Mediterr. 1997, 23, 11–19. [Google Scholar] [CrossRef]
- Waitt, D.E.; Levin, D.A. Genetic and phenotypic correlations in plants: A botanical test of Cheverud’s conjecture. Heredity 1998, 80, 310–319. [Google Scholar] [CrossRef]
- Li, X.; Li, Y.; El-Kassaby, Y.A.; Fang, Y. Diverse leaf functional and phenotypic traits in hybrid oak individuals: Unveiling genetic variation, adaptation, and evolutionary potential within Quercus species. For. Ecol. Manag. 2024, 561, 121830. [Google Scholar] [CrossRef]
- Yang, J.; Gao, Y.; Zhao, C.; Chen, H. Leaf phenotypic plasticity and integration balance plant adaptation to water table decline: A mesocosm experiment. Plant Soil 2024, 497, 611–627. [Google Scholar] [CrossRef]
- Gratani, L. Plant phenotypic plasticity in response to environmental factors. Adv. Bot. 2014, 2014, 208747. [Google Scholar] [CrossRef]
- Shi, X.; Qi, J.; Liu, A.; Zakari, S.; Song, L. Leaf phenotypic plasticity coupled with integration facilitates the adaptation of plants to enhanced N deposition. Environ. Pollut. 2023, 327, 121570. [Google Scholar] [CrossRef]
- Reich, P.B.; Walters, M.B.; Ellsworth, D.S. From tropics to tundra: Global convergence in plant functioning. Proc. Natl. Acad. Sci. USA 1997, 94, 13730–13734. [Google Scholar] [CrossRef]
- Pierce, S.; Brusa, G.; Vagge, I.; Cerabolini, B.E. Allocating CSR plant functional types: The use of leaf economics and size traits to classify woody and herbaceous vascular plants. Funct. Ecol. 2013, 27, 1002–1010. [Google Scholar] [CrossRef]
- Ordoñez, J.C.; Van Bodegom, P.M.; Witte, J.P.M.; Wright, I.J.; Reich, P.B.; Aerts, R. A global study of relationships between leaf traits, climate and soil measures of nutrient fertility. Glob. Ecol. Biogeogr. 2009, 18, 137–149. [Google Scholar] [CrossRef]
- Grattan, S.R.; Berenguer, M.J.; Connell, J.H.; Polito, V.S.; Vossen, P.M. Olive oil production as influenced by different quantities of applied water. Agric. Water Manag. 2006, 85, 133–140. [Google Scholar] [CrossRef]
- Greven, M.; Neal, S.; Green, S.; Dichio, B.; Clothier, B. The effects of drought on the water use, fruit development and oil yield from young olive trees. Agric. Water Manag. 2009, 96, 1525–1531. [Google Scholar] [CrossRef]
- Palese, A.M.; Nuzzo, V.; Favati, F.; Pietrafesa, A.; Celano, G.; Xiloyannis, C. Effects of water deficit on the vegetative response, yield and oil quality of olive trees (Olea europaea L., cv Coratina) grown under intensive cultivation. Sci. Hortic. 2010, 125, 222–229. [Google Scholar] [CrossRef]
- Obeso, J.R. The costs of reproduction in plants. New Phytol. 2002, 155, 321–348. [Google Scholar] [CrossRef]
- Berger, J.D.; Shrestha, D.; Ludwig, C. Reproductive strategies in Mediterranean legumes: Trade-offs between phenology, seed size and vigor within and between wild and domesticated Lupinus species collected along aridity gradients. Front. Plant Sci. 2017, 8, 548. [Google Scholar] [CrossRef]
- Urban, L.; Lu, P.; Thibaud, R. Inhibitory effect of flowering and early fruit growth on leaf photosynthesis in mango. Tree Physiol. 2004, 24, 387–399. [Google Scholar] [CrossRef]
- Wang, X.; Zhang, B.; Guo, S.; Guo, L.; Chen, X.; He, L.; Ma, R.; Yu, M. Effects of fruit load on photosynthetic characteristics of peach leaves and fruit quality. Sci. Hortic. 2022, 299, 110977. [Google Scholar] [CrossRef]
- Zhang, X.; He, C.; Yan, B.; Zuo, Y.; Zhang, T.; Chen, L.; Tan, X.; Li, Z. Effects of fruit load on growth, photosynthesis, biochemical characteristics, and fruit quality of Camellia oleifera. Sci. Hortic. 2023, 317, 112046. [Google Scholar] [CrossRef]


Disclaimer/Publisher’s Note: The statements, opinions and data contained in all publications are solely those of the individual author(s) and contributor(s) and not of MDPI and/or the editor(s). MDPI and/or the editor(s) disclaim responsibility for any injury to people or property resulting from any ideas, methods, instructions or products referred to in the content. |
© 2025 by the authors. Licensee MDPI, Basel, Switzerland. This article is an open access article distributed under the terms and conditions of the Creative Commons Attribution (CC BY) license (https://creativecommons.org/licenses/by/4.0/).