Next Article in Journal
Advancements in Designing the DEMO Driver Blanket System at the EU DEMO Pre-Conceptual Design Phase: Overview, Challenges and Opportunities
Previous Article in Journal
The Plutonium Temperature Effect Program
 
 
Correction published on 8 March 2024, see J. Nucl. Eng. 2024, 5(1), 111-113.
Article

Tritium Desorption Behavior and Microstructure Evolution of Beryllium Irradiated at Low Temperature Up to High Neutron Dose in BR2 Reactor

1
Karlsruhe Institute of Technology, Institute for Applied Materials, Hermann-von-Helmholtz-Plarz 1, 76344 Eggenstein-Leopoldshafen, Germany
2
Institute of Nuclear Materials Science, SCK CEN, 2400 Mol, Belgium
*
Author to whom correspondence should be addressed.
J. Nucl. Eng. 2023, 4(3), 552-564; https://doi.org/10.3390/jne4030036
Submission received: 19 April 2023 / Revised: 1 July 2023 / Accepted: 12 July 2023 / Published: 2 August 2023 / Corrected: 8 March 2024

Abstract

:
The present study investigated the release of tritium from beryllium irradiated at 323 K to a neutron fluence of 4.67 × 1026 m−2 (E > 1 MeV), corresponding up to 22,000 appm helium and 2000 appm tritium productions. The TPD tests revealed a single tritium release peak during thermal desorption tests, irrespective of the heating mode employed. The tritium release peaks occurred at temperatures ranging from 1031–1136 K, depending on the heating mode, with a desorption energy of 1.6 eV. Additionally, the effective tritium diffusion coefficient was found to vary from 1.2 × 10⁻¹² m2/s at 873 K to 1.8 × 10⁻¹⁰ m2/s at 1073 K. The evolution of beryllium microstructure was found to be dependent on the annealing temperature. No discernible differences were observed between the as-received state and after annealing at 473–773 K for 5 h, with a corresponding porosity range of 1–2%. The annealing at temperatures of 873–1373 K for 5 h resulted in the formation of large bubbles, with porosity increasing sharply above 873 K and reaching 30–60%.

1. Introduction

The BR2 material testing reactor utilizes a beryllium matrix that has undergone several replacements since 1963. The pieces of the irradiated beryllium matrix, replaced in 1995, were used for a study of beryllium swelling and creep behavior, as well as microstructural evolution [1,2,3,4]. These findings are crucial not only for ensuring the safe operation of the BR2 reactor and other research nuclear reactors that use beryllium reflectors and moderators [5,6,7,8] but also for fusion applications. Beryllium and beryllium-based materials, such as beryllides (e.g., TiBe12, CrBe12), are now considered for use as plasma-facing materials in ITER [9] and as neutron multipliers in both ITER and DEMO fusion reactors [10,11,12,13], due to their excellent neutron multiplication and thermal properties.
Over the past two decades, extensive research has been conducted on the tritium release and retention properties of the neutron-irradiated beryllium [14,15,16,17,18,19], establishing the primary features of tritium behavior at fusion-relevant temperatures of 630–1040 K. There are no publications dedicated to investigating the tritium release properties of beryllium irradiated at lower parameters, such as the operating temperatures of material testing reactors with water coolant. The aim of this study is to investigate the tritium release properties of beryllium exposed in the BR2 reactor at a temperature of 323 K, up to a high neutron dose and, accordingly, high tritium and helium productions under irradiation.

2. Materials and Methods

Beryllium samples with irregular shape utilized in this study were extracted from the second beryllium matrix exposed in the BR2 reactor between 1980 and 1995. The original material, S-200-E beryllium grade, was manufactured via the vacuum hot-pressing method and possessed an average grain size of 10–13 µm. The S-200-E beryllium grade consists of >98 wt. % Be, <2.0 wt. % BeO, <0.18 wt. % Fe, <0.15 wt. % C, <0.15 wt. % Al, <0.08 wt. % Mg, <0.08 wt. % Si and <0.04 wt. % of other elements.
The beryllium matrix was subjected to irradiation for 15 years at 323 K up to a fission neutron fluence of 5.32 × 1026 m−2, which can be converted to a fast neutron fluence of 4.67 × 1026 m−2 (E > 1 MeV) [1]. Consequently, the estimated production levels of helium and tritium in the irradiated beryllium matrix were 22,000 appm of 4He and 2000 appm of 3H. Due to the radioactive decay of tritium from 1995 to 2022, the content of tritium in beryllium to the time of the thermal desorption tests decreased to 440 appm.
A full cycle of preparing samples for research from the irradiated beryllium matrix includes the cutting at SCK·CEN of small plates from a place of the matrix with irradiation parameters indicated above, delivery of several plates to KIT, crushing one plate into fragments of irregular shape, choice among these fragments those that are more reminiscent of the shape of an equilateral polyhedron. The weight of all fragments selected for the research was within 0.0259–0.0347 g (see Table 1). For calculation of effective tritium diffusion coefficient (Section 4.2), those samples were selected which are most similar to a regular polyhedron. Then, assuming that it is a sphere with the same weight as the polyhedron, an approximate diameter of the spheres was calculated (see Table 1).
The temperature-programmed desorption (TPD) tests were carried out using a flow-through setup with an ionization chamber (IC) situated in the Fusion Materials Laboratory (FML) [20]. A helium purge gas containing 0.1 vol. % H2 was employed. The rate of the gas entry into the setup is 20 mL/min. The length of the pipeline through which the purge gas with the tritium released moves between the furnace and the IC is 2.8 m. The volume of the IC is 100 mL. The volume of the IC is filled with the purge gas in 5 min after start of the TPD test. Thus, at least t ~ 5 min should elapse from the moment the tritium leaves the sample until it reaches the IC. This time t can be specified using the real tritium release diagrams and taking into account the fact that an increase in the tritium release rate can occur only by start of the increase in the sample temperature. The specified value of this time is t ≈ 10 min.
The temperature was raised using heating rates of 1 K/min (0.017 K/s) and 7 K/min (0.117 K/s) up to a maximum temperature of 1373 K with a following 3-h exposure. A stepped heating mode was also used with a temperature step of 100 K for temperatures ranging from 473 to 1373 K, and the heating rate was set to 7 K/min (0.117 K/s) between steps for 1 h each. An average heating rate in the stepped test was calculated. It is 0.03 K/s. An accuracy of the temperature measurements in the TPD testing was ±0.5 K.
Several irradiated beryllium fragments with irregular shape were annealed at temperatures ranging from 473 to 1373 K with a 1-h exposure at each temperature in pure nitrogen atmosphere to investigate the microstructural evolution.
Cross-sections of the irradiated beryllium matrix fragments were analyzed using an optical microscope (OM) Olympus GX51 with remote control.

3. Results

3.1. Tritium Release

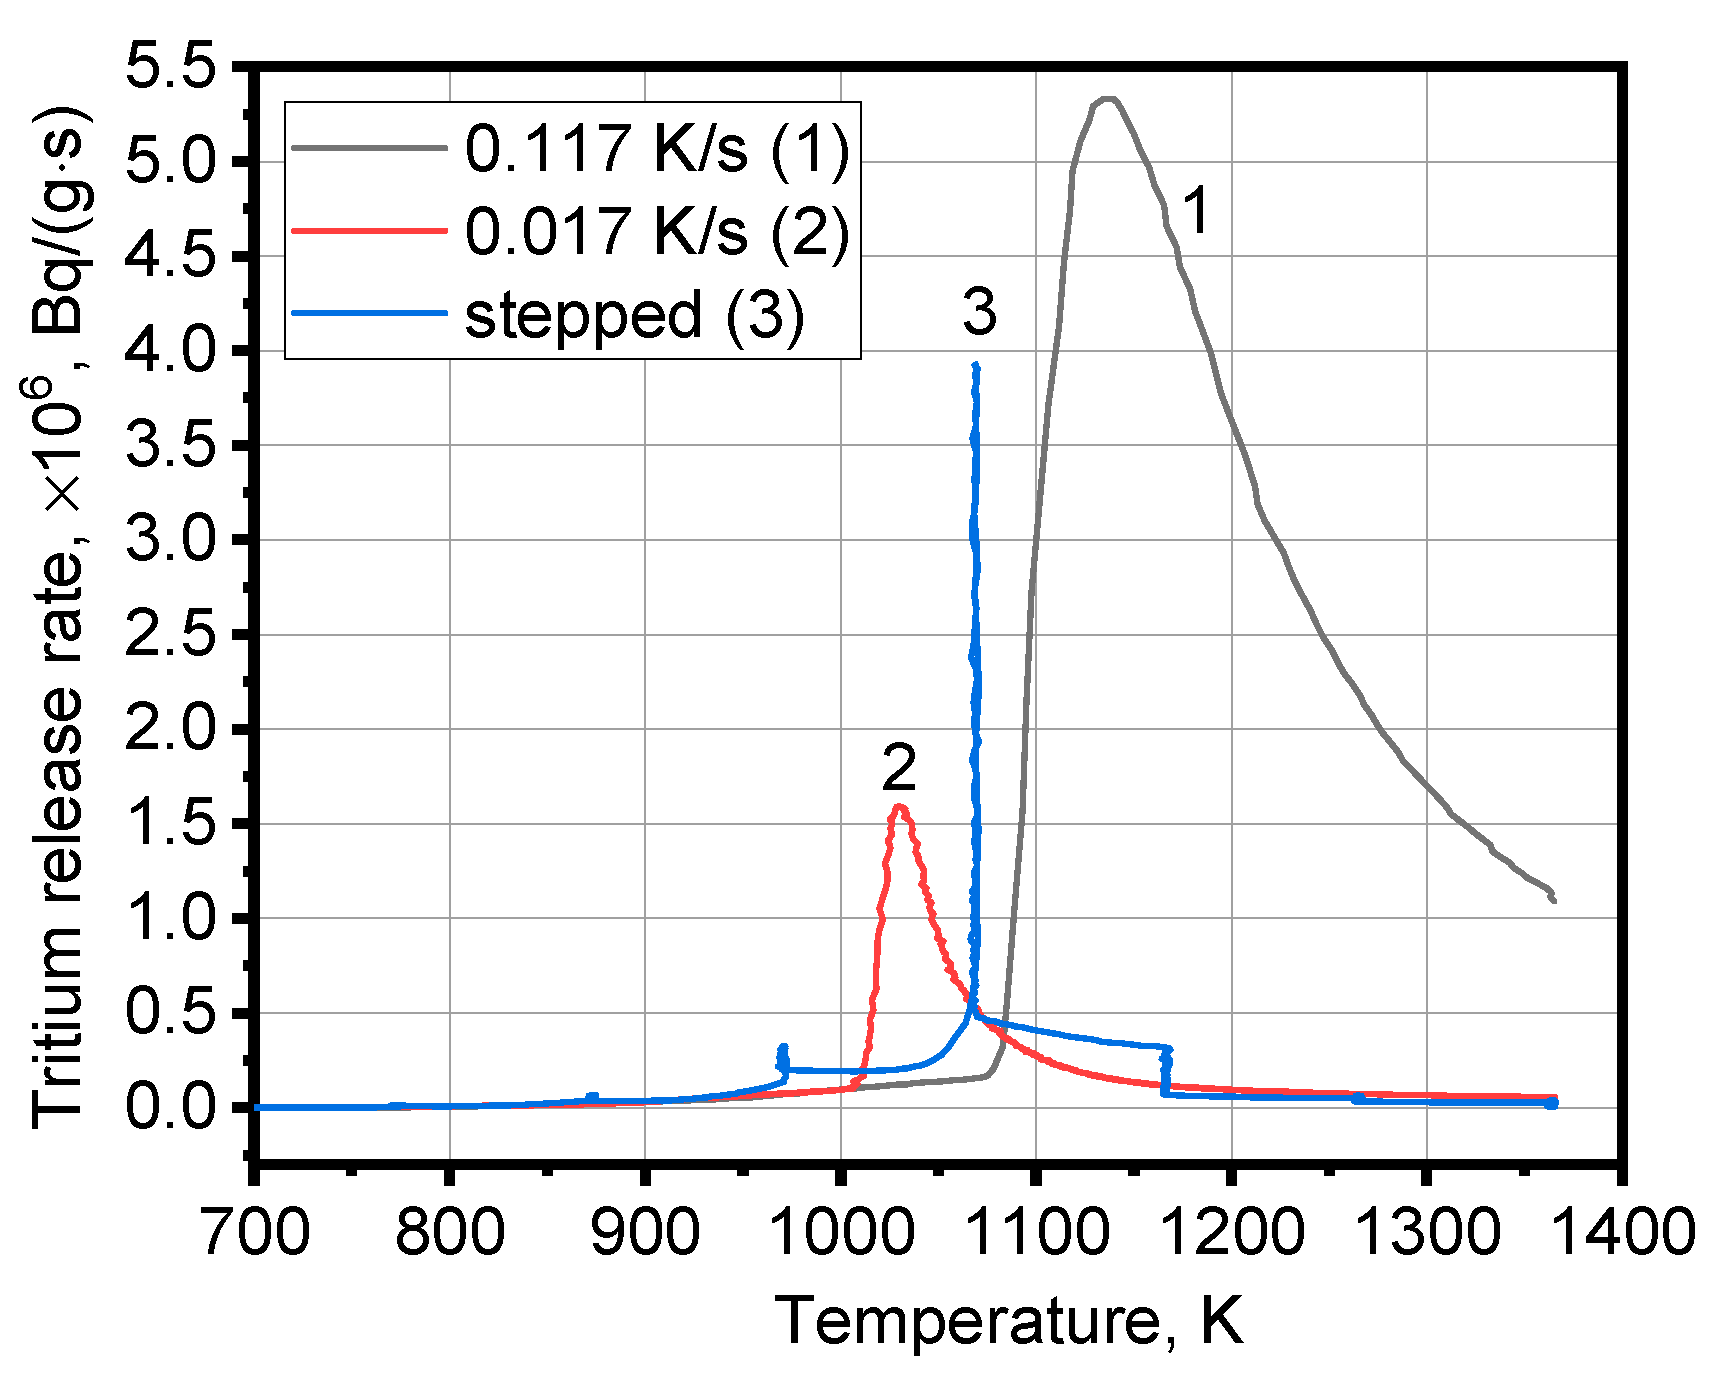
Figure 1 depicts the tritium release behavior of the beryllium matrix fragments that were irradiated in the BR2 reactor and subjected to various heating modes. It is noteworthy that a distinct single tritium release peak is observed in all three cases. These peaks have a similar shape and differ only in height. The peaks have a sharp shape, that is, the main release of tritium occurs in a narrow temperature-time interval. This is the so-called burst tritium release [15,21].
In Figure 2, the tritium release curves from Figure 1 are rearranged into two axes to facilitate comparison and analysis of the tritium release rate as a function of temperature.
Table 2 displays the characteristics of the tritium release peaks, namely, the peak temperature, the height of the peak and the peak width at half height for three heating modes. The start of tritium release for all heating modes occurs at approximately same temperatures. The peak temperature and the height of the peak for the stepped heating mode take intermediate values between two permanent heating modes. However, the peak width at half height for the stepped heating mode is significantly lower than that for both permanent heating modes. It seems that three peaks are visible in the stepped heating tritium spectrum. This is most likely the only peak that fell into three different temperature steps.

3.2. Optical Metallography

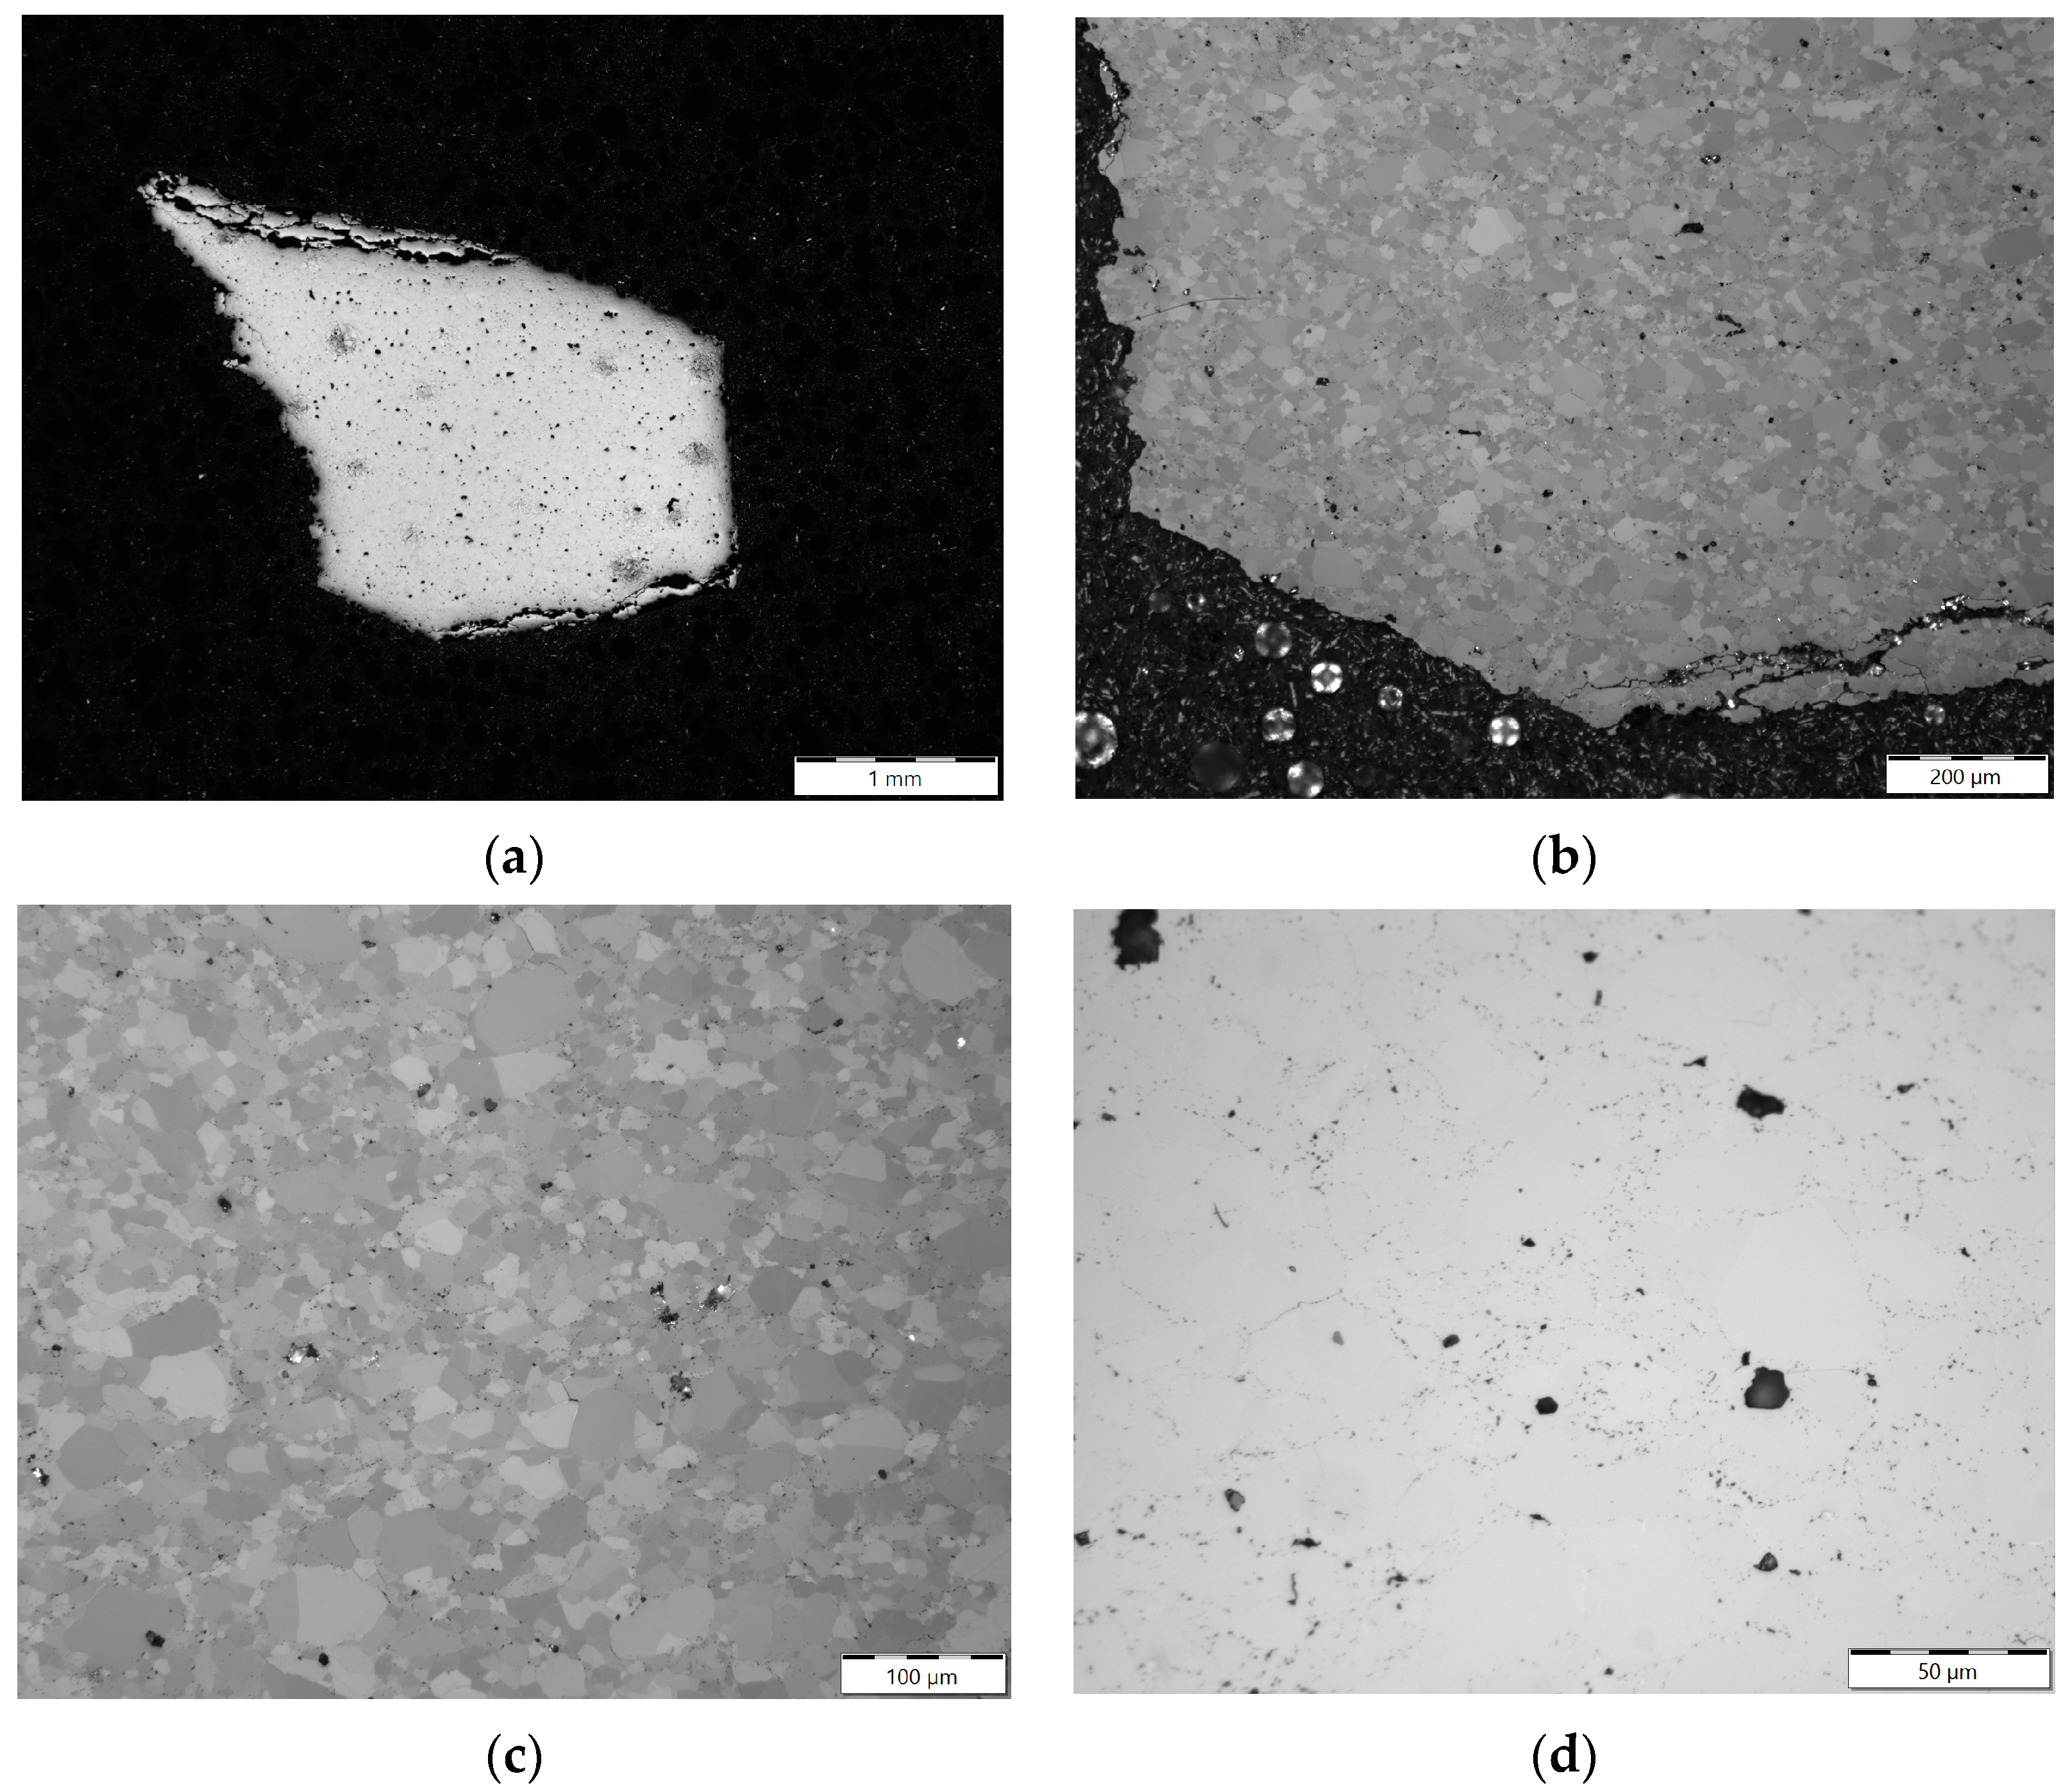
Figure 3 displays optical micrographs of an irradiated Be fragment in its as-received state. This fragment (a) was obtained by mechanically cutting a larger fragment using a remote machine in a hot cell. The mechanical impact on the brittle material resulted in the formation of cracks in areas close to the cut site (b). The microstructure of the fragment consists of equiaxed grains, which are approximately 12 µm in size (c). A few pores are mainly localized at the grain boundaries (d).
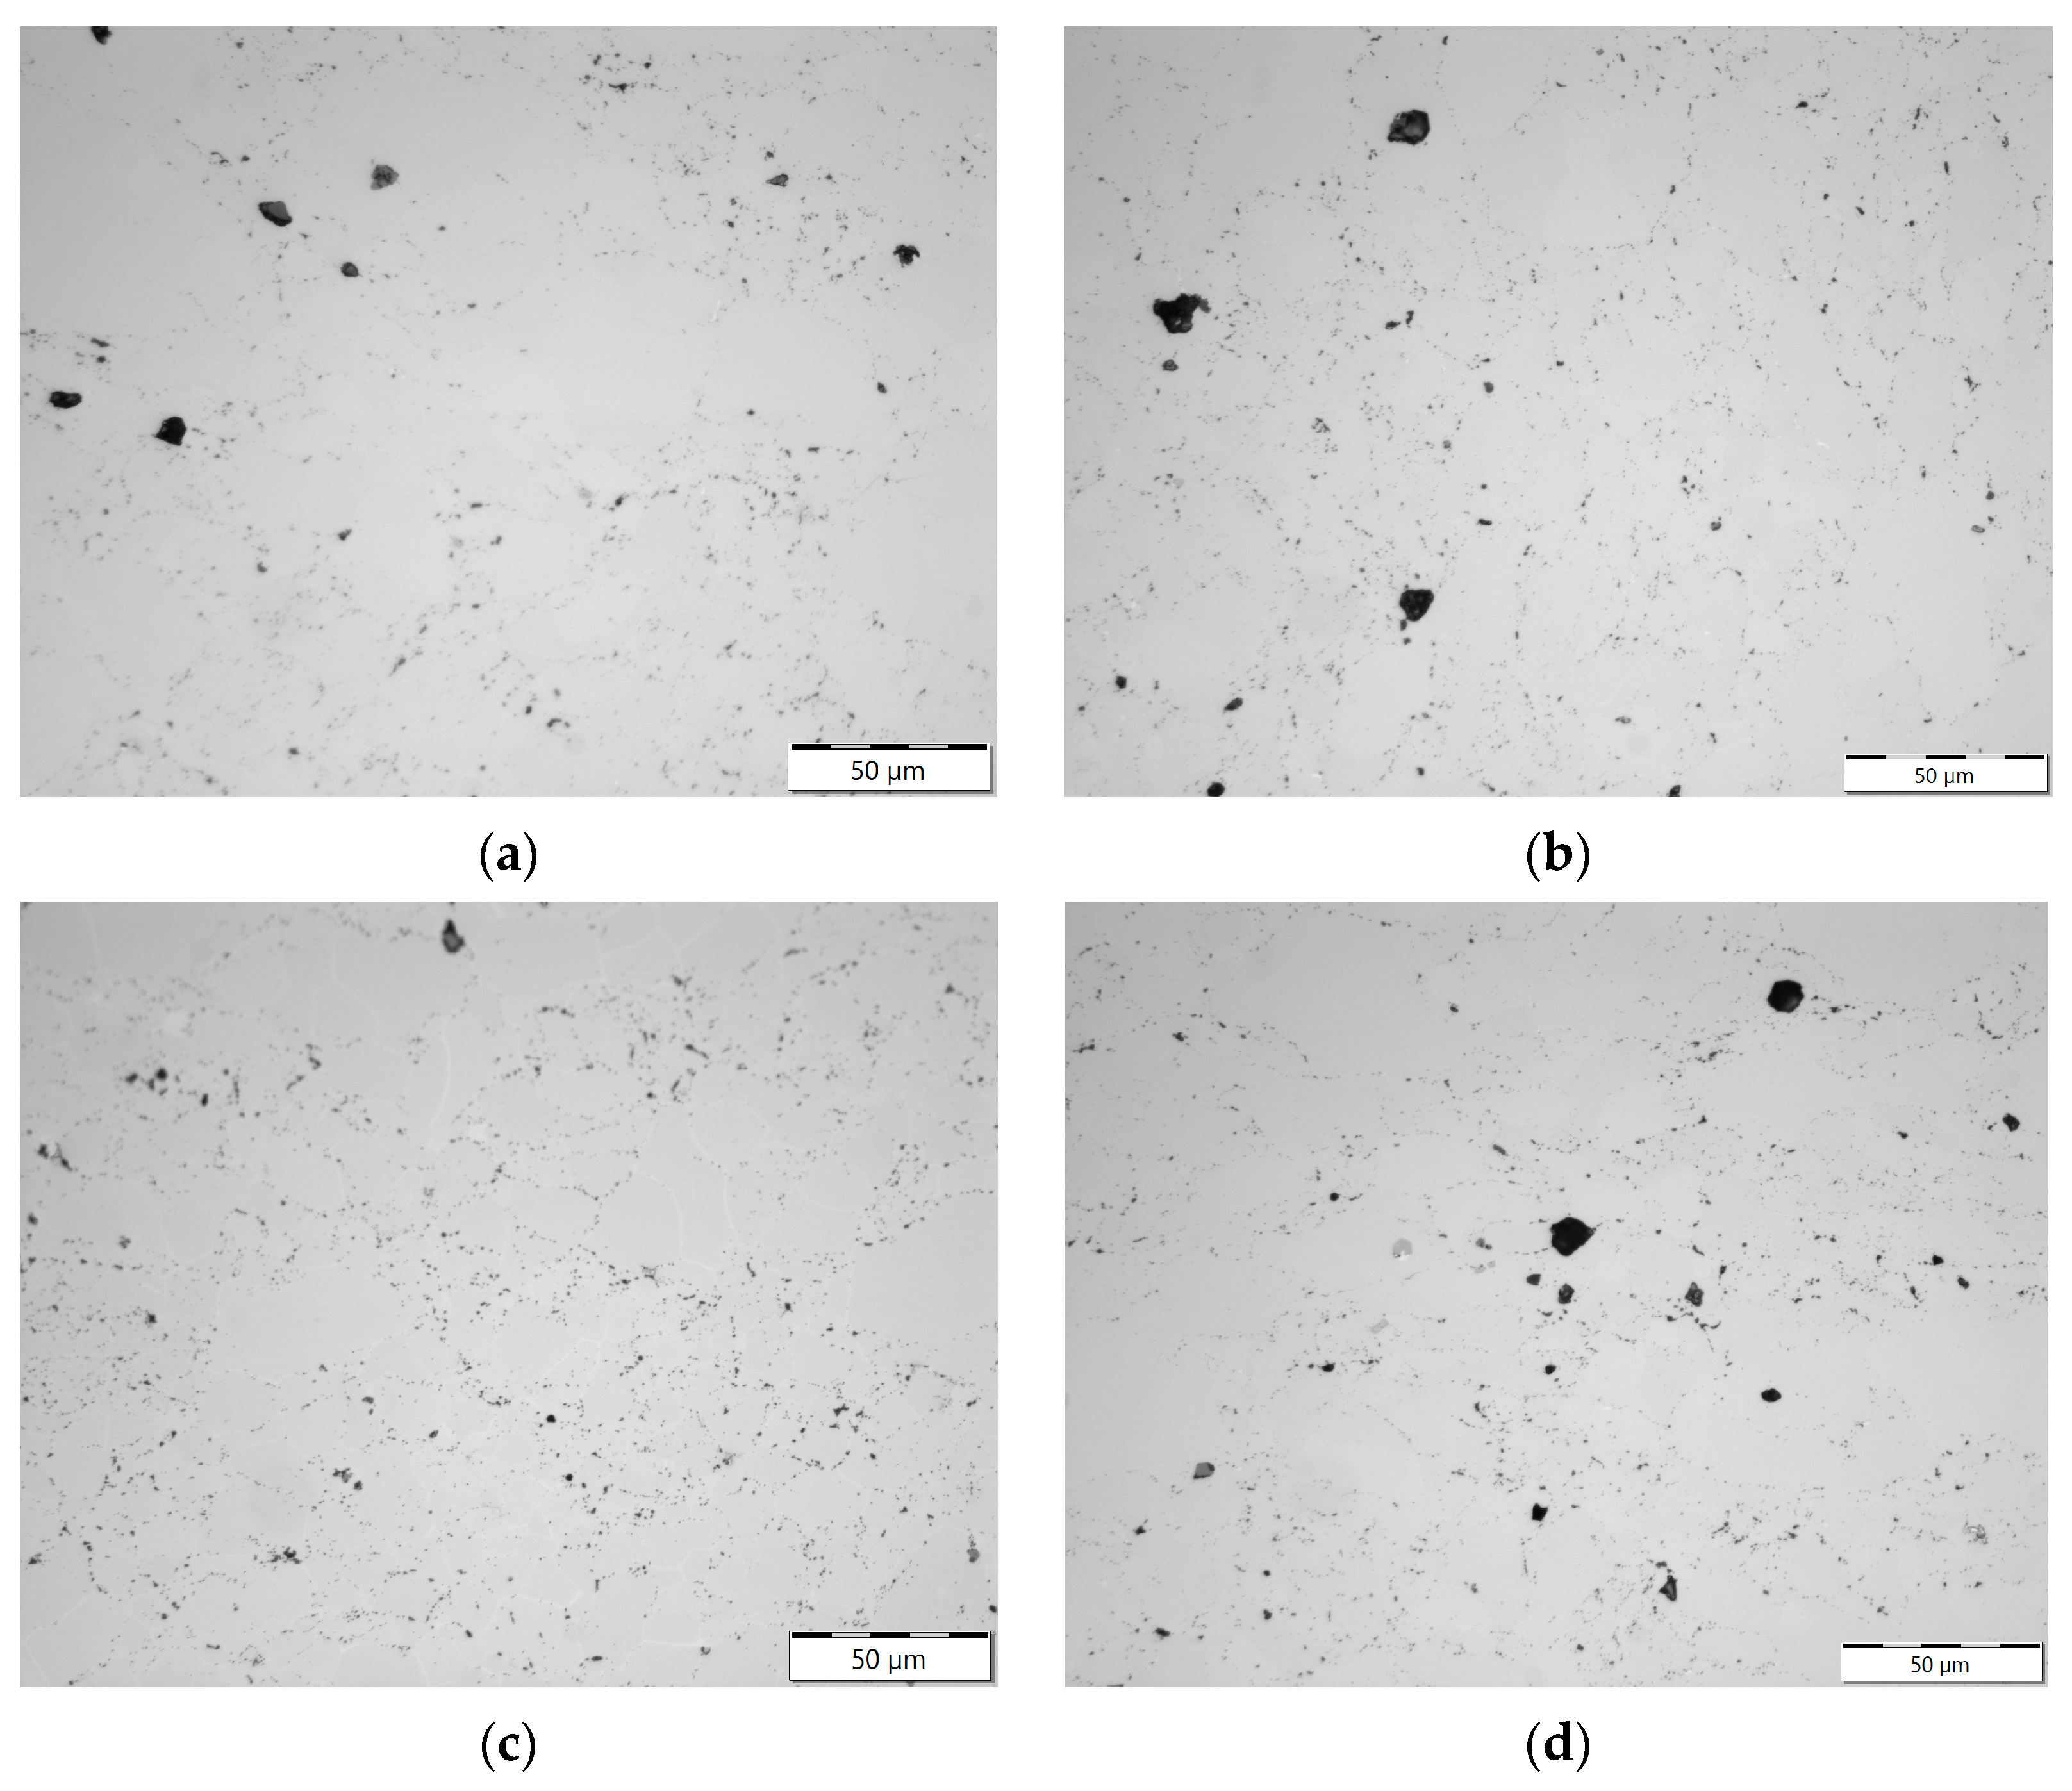
Figure 4 shows optical micrographs of irradiated Be fragments after annealing at temperatures of 473 K (a), 573 K (b), 673 K (c), 773 K (d) for 5 h. The microstructure images are very similar to the microstructure of the as-received state shown in Figure 3d, indicating that the microstructure did not change much during the annealing process up to a temperature of 773 K.
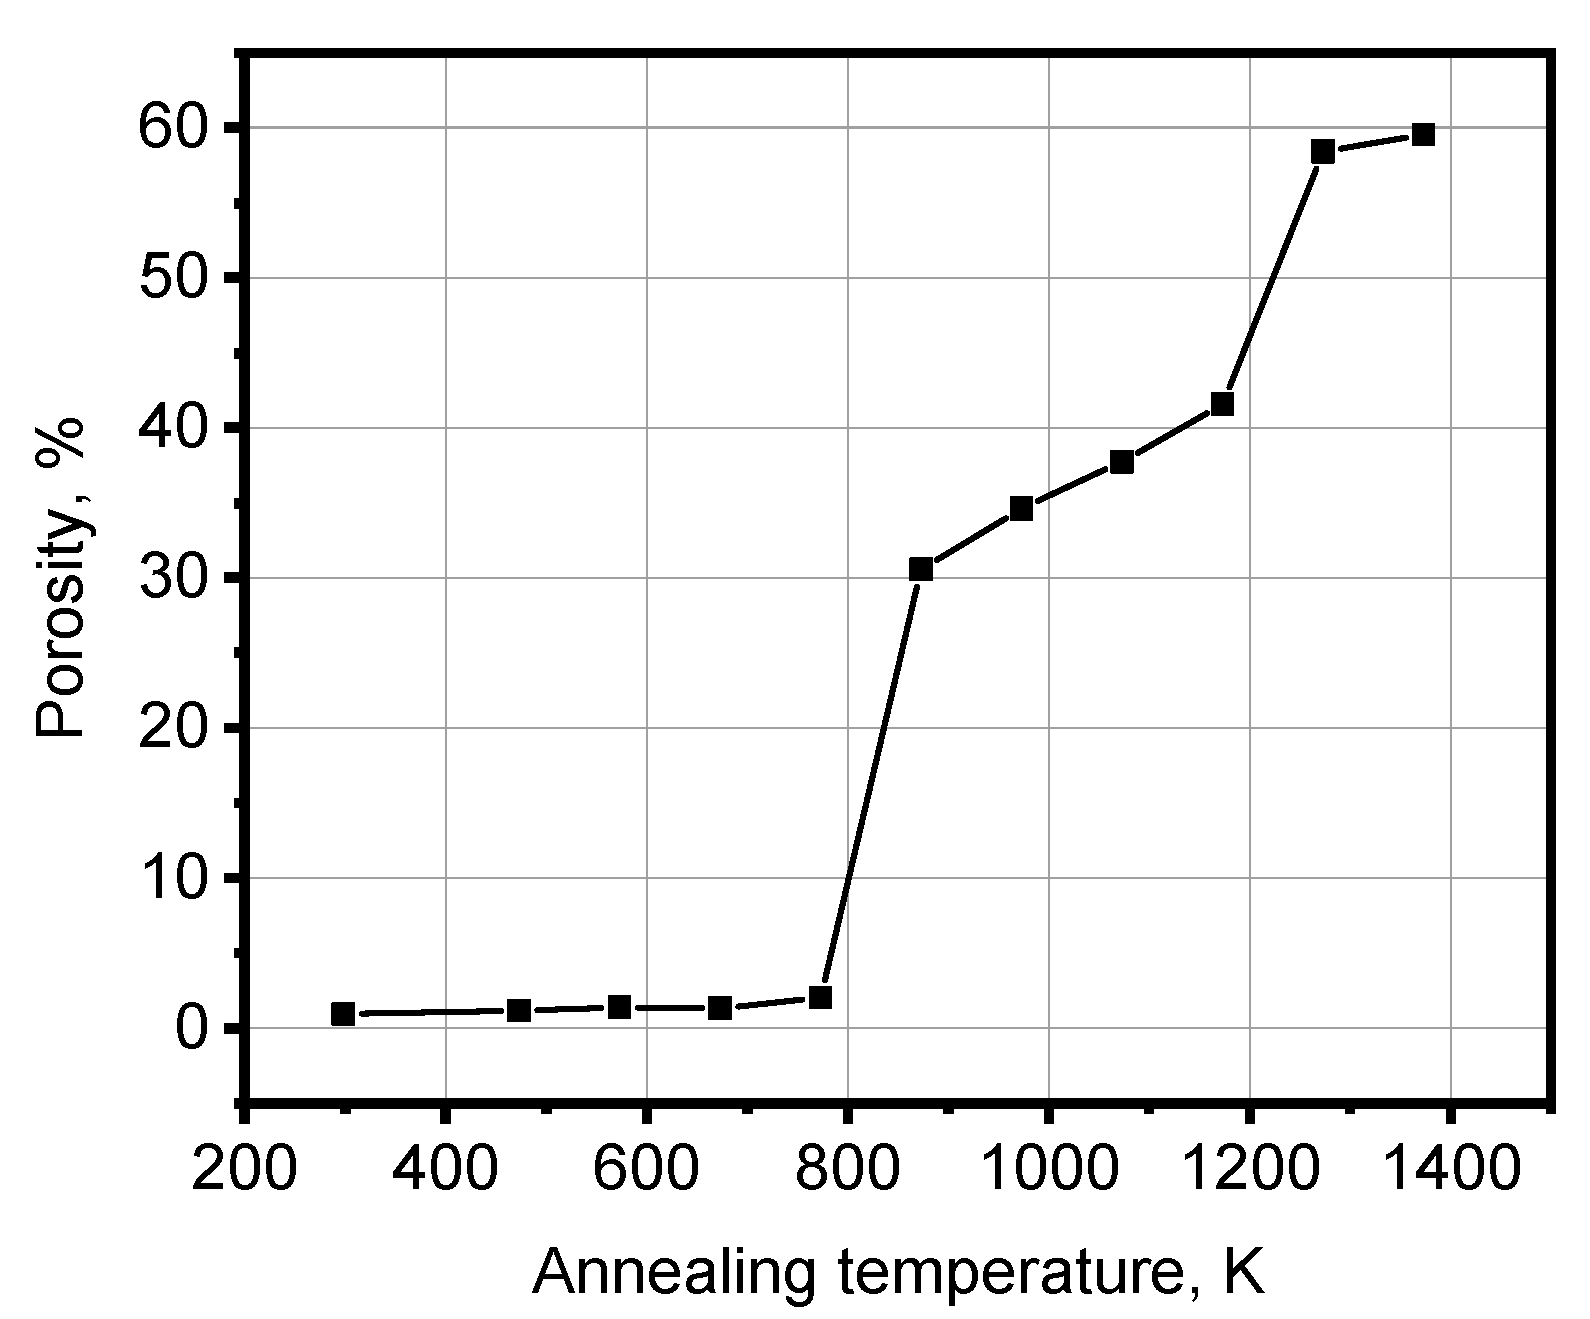
Figure 5 shows the porosity dependence versus annealing temperature. The porosity values increase from the as-received state to the annealing temperature of 773 K but remain at a level of 1–2%. However, a sharp increase in porosity is observed starting from 873 K. The porosity reaches 60% at the highest temperature of 1373 K.
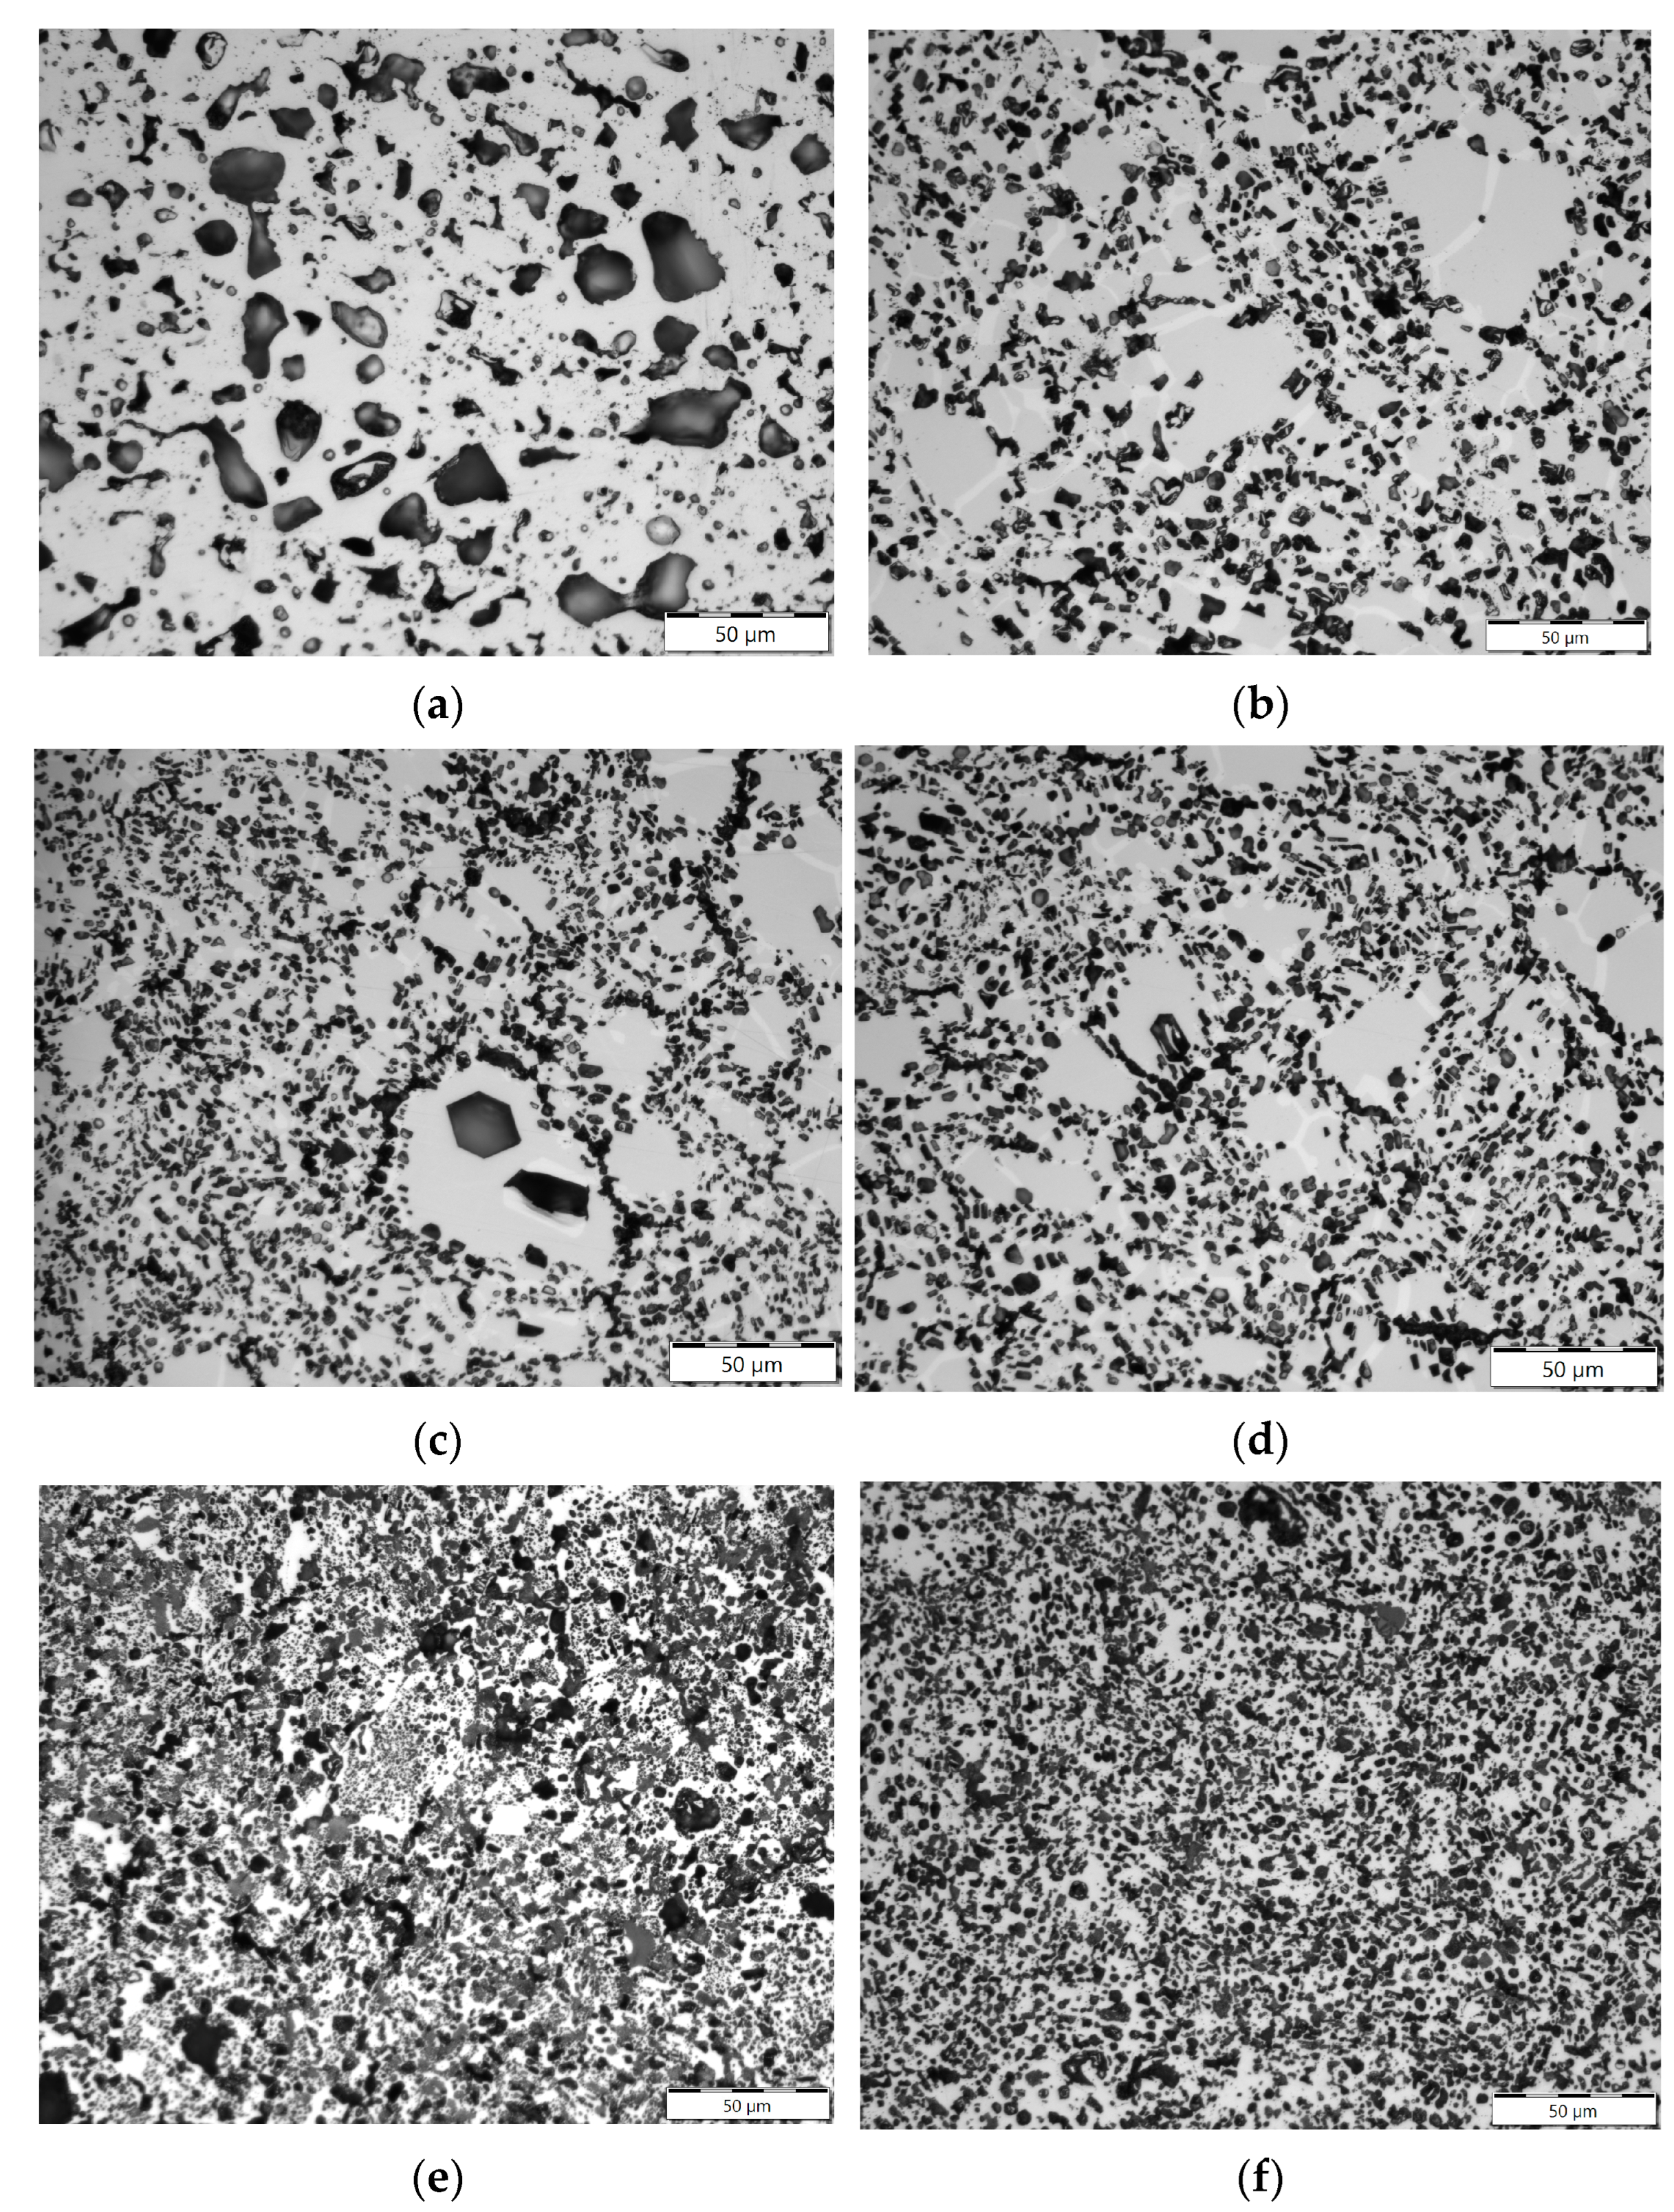
Figure 6 represents optical pictures of the irradiated Be fragments after annealing at temperatures ranging from 873 K to 1373 K for 5 h. A very developed porosity is observed in all images, with large pores and denuded zones around them. The porosity values increase sharply from 30% to 60% on increasing temperature from 873 K (a) to 1373 K (f). At the highest temperatures of 1273 K (e) and 1373 K (f), the pores are densely distributed throughout the structure, and large pores and denuded zones around them are practically absent.

4. Discussion

4.1. Tritium Desorption Energy

In [22,23], an approach using the Polany–Wigner Equation (1) was suggested to determine the tritium desorption energy Edes:
r(Ө) = −dӨ/dt = ν Өn·exp(−Edes/kT)
where r, Bq/(g·s) is the rate of desorption; Ө, Bq/g is the coverage (the integrated area under the desorption rate curve or more physically is “peak population per unit area”); n is the order of desorption (our case is the first order reaction, n = 1); ν, s−1 is the pre-exponential factor of desorption; Edes, eV is the activation energy of tritium desorption; T, K is the temperature; k = 8.61733 × 10⁻⁵, eV/K is the Boltzmann constant.
There are several methods to determine the tritium desorption energy Edes during TPD tests [24,25,26]. Edes can be found [24] by variating the heating rate β and using a linear relationship between ln(β/Tm2) and 1/Tm. In this study, three heating rates have been applied during the TPD tests obtaining a single peak at each rate (see Table 2). The calculated values of Edes for different combinations of heating rates, K/s: β1 = 0.117, β2 = 0.017, β3 = 0.03, are shown in Table 3.
The study [25] suggests that correlation (2) be applied for the calculation of Edes:
Edes = k·(lnβ12 + 2lnTm2/Tm1)/(1/Tm2 − 1/Tm1)
where Edes, eV is the activation energy of tritium desorption; k = 8.61733 × 10⁻⁵ eV/K is the Boltzmann constant; β, K/s is the heating rate; Tm is the tritium peak temperature.
Using different combinations of β1, β2, β3, the tritium desorption energy Edes can be calculated (see Table 4).
The third method [26] suggests the additional use of the peak width at half height W1/2 (see Table 2) for n = 1 as follows:
Edes = kTm [−1 + (Y1/2−2 + 5.832 Y1/2)1/2]
where Edes, eV is the activation energy of tritium desorption; Tm is the tritium peak temperature; Y1/2 = Tm/W1/2; W1/2 is the width at half peak height; k = 8.61733 × 10⁻⁵, eV/K is the Boltzmann constant. The calculated values of the activation energy Edes are shown in Table 5.
The value of Edes = 1.6 eV, obtained at this study (Tirr = 323 K, F = 4.67 × 1026 m−2, E > 1 MeV)), correlates well with the results of [18], where beryllium pebbles were irradiated at higher temperatures and lower neutron fluences (Edes = 1.4–1.6 eV for Tirr = 643 K, F = 1.06 × 1026 m−2, E > 1 MeV). Despite the different irradiation parameters and different manufacturing technology and, accordingly, the beryllium microstructure, the tritium desorption energies are very close each to other. This can mean that the tritium desorption mechanism is the same, and it is determined by detrapping energy from structural traps such as helium small clusters or bubbles.
The pre-exponential factor of desorption ν can be calculated using the relation (4) [26]:
ν = Edesβ/k(Tm)2 exp(Edes/kTm)
where Edes, eV is the activation energy of tritium desorption; β, K/s is the heating rate; Tm is the tritium peak temperature; k = 8.61733 × 10⁻⁵, eV/K is the Boltzmann constant.
The performed calculations of ν for the heating rates of 0.017 and 0.117 K/s are summarized in Table 6.
Finally, the correlation (1) for two heating rates used in this study has views:
for β1 = 0.117 K/s, r [Bq/(g·s)] = 2.02 × 10⁴ [s−1]·Ө [Bq/g]·exp(−1.6 eV/kT)
for β2 = 0.017 K/s, r [Bq/(g·s)] = 1.92 × 10⁴ [s−1]·Ө [Bq/g]·exp(−1.6 eV/kT)
where Ө, Bq/g is the coverage (the integrated area under the desorption rate curve); T, K is the temperature; k = 8.61733 × 10⁻⁵, eV/K is the Boltzmann constant.

4.2. Tritium Diffusion Coefficient

Using an approach proposed in [27], the effective tritium diffusion coefficient can be determined. The tritium atoms diffuse to the surface after being detrapped from the helium bubbles, while maintaining a constant temperature and uniform flow of the tritium atoms. This situation was realized during permanent heating testing at an exposure at 1373 K for 3 h as well as during stepped heating testing at four constant temperatures of 873, 973, 1073 and 1173 K with an exposure for 1 h on each (see Figure 1). The calculated values of the effective tritium diffusion coefficient D are within a range from 1.2318 × 10⁻¹² m2/s to 1.788 × 10⁻¹⁰ m2/s at temperatures of 873–1373 K (see Table 7).
These values are higher than those reported in [27], where D was found to be within the range of (2.6–5.1) × 10−13 m2/s at 1045–1089 K. However, previous tritium desorption experiments performed at KIT on beryllium pebbles loaded with hydrogen and tritium showed the similar values of the tritium diffusion coefficient ranging from 1.67 × 10⁻¹² m2/s at 466–572 K to 2.3 × 10⁻¹¹ m2/s at 1183–1329 K.
Figure 7 shows a linear approximation of the effective tritium diffusion coefficients D from Table 7 in the axes lg D to 1000/T.
Figure 8 demonstrates dependence of lg D on reverse temperature 1/T taken from the literature [28,29,30,31]. The results obtained in this study are more consistent with the data of Tazhibaeva [30] and Jones and Gibson [31].
Processing of the obtained experimental results gives the relation for calculating the effective tritium diffusion coefficient D in irradiated beryllium as follows:
D = 4.2412 × 10⁻¹⁰·exp (−0.47/kT)
where D, m2/s is the tritium diffusion coefficient; T, K is the temperature; k = 8.61733 × 10⁻⁵ eV/K is the Boltzmann constant.
Using a relation (8), one can estimate the diffusion path L of tritium atoms in the irradiated beryllium during thermal exposure at the TDS testing:
L ~ (Dt)1/2
where D, m2/s is the tritium diffusion coefficient; t, s is the exposure time.
The calculated L values are shown in Table 8. By comparing the calculated values of the tritium diffusion path L with radius R of the diameter d (see Table 1), it is possible to estimate the possibility for tritium total escaping the sample during the exposure time t at a given temperature T. Table 8 shows the results of these calculations. As follows from Table 8, the tritium atoms reach the outer surface of the samples after exposure at 1273 and 1373 K for 100 h as well as at 1473 K for 70 h. According to Table 2, the tritium release peaks are located in an interval of 1031–1136 K. Therefore, it is logical to use for detritiation of the irradiated beryllium waste the annealing temperatures that are higher than the tritium peak temperatures. Therefore, if there are fragments of irradiated beryllium with size of ~3 mm, a minimum annealing temperature for the tritium escaping can be 1273 K and an exposure time is 100 h. If sizes of irradiated beryllium fragments are larger than 3 mm, then, accordingly, the new annealing parameters can be selected using the relation (8).

4.3. Evolution of Beryllium Microstructure after Low-Temperature Irradiation and Following High-Temperature Annealing

TEM analysis of beryllium samples irradiated at 343–393 K to a neutron fluence of 5.7 × 1022 cm−2 (E > 0.1 MeV) [32] revealed the formation of dislocation loops in the microstructure. The initial irradiation did not produce any visible gas bubbles. The samples were then annealed at temperatures ranging from 573 to 1473 K for 1 h. The size of the dislocation loops increased while their density decreased as the annealing temperature was increased from 573 to 673 K. At 773 K, the loops transformed into a dislocation network. Although the concentration of transmuted helium was high (11,500 appm), the first tiny bubbles (≈1–4 nm) were visible by TEM only after annealing at 773 K. The average bubble diameter sharply increased to 12 nm after annealing at 873–973 K, which corresponds well with the temperature dependence of porosity obtained in this study (see Figure 5). The annealing temperature range of 773–873 K is critical in terms of a sharp increase in porosity and, consequently, swelling of low-temperature irradiated beryllium. At these temperatures, helium atoms attain high diffusion mobility, which becomes sufficient for significant microstructure rearrangement and the formation of large bubbles. Finally, an open porosity network is formed in the irradiated beryllium at annealing temperatures of 1000–1200 K that leads to a burst tritium release (see Figure 1 and Table 2).
When comparing the evolution of beryllium microstructure after low-temperature irradiation followed by high-temperature annealing to high-temperature irradiation, similar features were observed [33,34]. In both cases (Tirr = 343–393 K with following annealing at 873–1473 K for 1 h and Tirr = 686–968 K), the formation of large bubbles led to a sharp increase in swelling. This suggests that the accumulation of radiation-induced helium is the primary structural factor that determines the magnitude of beryllium swelling. Short-term high-temperature annealing of beryllium irradiated at low temperatures to achieve high helium accumulation, instead of expensive high-temperature irradiation, can yield significant results on the evolution of the beryllium microstructure and swelling with significant cost savings. It is worth noting that fragments of the BR2 beryllium matrix, as was used in this study, can serve as low-temperature irradiated beryllium, which, if not used in research, will be disposed of as radioactive waste.

5. Conclusions

The tritium release behavior from beryllium irradiated at 323 K up to a fast neutron fluence of 4.67 × 1026 m−2 (E > 1 MeV) can be characterized by a single peak during the thermal desorption tests. The location of the peak is at temperatures of 1031–1136 K depending on the heating mode. The calculated tritium desorption energy is 1.6 eV, consistent with previous literature reports. Additionally, the effective tritium diffusion coefficient was found to increase from 1.2 × 10⁻¹² m2/s at 873 K to 1.8 × 10⁻¹⁰ m2/s at 1073 K, in line with previously published data.
The microstructure evolution of irradiated beryllium was found to be highly dependent on the annealing temperature. Optical images showed no differences between the as-received state (after irradiation) and annealing temperatures up to 773 K, with porosity levels not exceeding 2%. However, at annealing temperatures of 873 K and above, the formation of large pores becomes more intensive, with porosity levels reaching 30–60% at annealing temperatures of 873–1373 K. These findings suggest that annealing at temperatures of 800–870 K may be sufficient for a start of tritium desorption, while higher temperatures may induce significant porosity and high swelling in beryllium leading to a burst tritium release at 1000–1150 K.

Author Contributions

Conceptualization, methodology, investigation, writing—original draft preparation, formal analysis, V.C.; methodology, formal analysis, investigation, R.R.; formal analysis, writing—review and editing, R.G.; resources, writing—review and editing, supervision, formal analysis, W.v.R. All authors have read and agreed to the published version of the manuscript.

Funding

This research received no external funding.

Institutional Review Board Statement

Not applicable.

Informed Consent Statement

Not applicable.

Data Availability Statement

The data presented in this study are available in the article.

Conflicts of Interest

The authors declare no conflict of interest.

References

  1. Sannen, L.; De Raedt, C.; Moons, F.; Yao, Y. Helium content and induced swelling of neutron irradiated beryllium. Fus. Eng. Des. 1994, 29, 470–474. [Google Scholar] [CrossRef]
  2. Leenaers, A.; Verpoucke, G.; Pellettieri, A.; Sannen, L.; Van den Berghe, S. Microstructure of long-term annealed highly irradiated beryllium. J. Nucl. Mater. 2008, 372, 256–262. [Google Scholar] [CrossRef]
  3. Van Renterghem, W.; Leenaers, A.; Van den Berghe, S. TEM investigation of long-term annealed highly irradiated beryllium. J. Nucl. Mater. 2008, 374, 54–60. [Google Scholar] [CrossRef]
  4. Scibetta, M.; Pellettieri, A.; Sannen, L. Experimental determination of creep properties of beryllium irradiated to relevant fusion power reactor doses. J. Nucl. Mater. 2007, 367–370, 1063–1068. [Google Scholar] [CrossRef]
  5. Melder, R.R.; Chakin, V.P.; Pokrovsky, A.S.; Shchuchkin, A.N. The SSC RIAR high-flux research reactors: Experience and possibilities of testing materials and mock-ups for fusion. Fus. Eng. Des. 2003, 69, 409–417. [Google Scholar] [CrossRef]
  6. Chakin, V.P. Radiation damage of beryllium blocks of the SM reactor. Phys. Metal Metallograph. 1999, 88, 200–204. [Google Scholar]
  7. Chakin, V.P.; Kupryanov, I.B.; Melder, R.R. State of beryllium after irradiation at low temperature up to extremely high neutron doses. J. Nucl. Mater. 2004, 329–333, 1347–1352. [Google Scholar] [CrossRef]
  8. Chakin, V.; Rolli, R.; Schneider, H.-C.; Moeslang, A.; Kurinskiy, P.; Van Renterghem, W. Pores and cracks in highly neutron irradiated beryllium. J. Nucl. Mater. 2011, 416, 3–8. [Google Scholar] [CrossRef]
  9. Federici, G.; Barabash, V.; Doerner, R.; Lorenzetto, P.; Matthews, G.; Raffray, A.R. Beryllium as a Plasma Facing Material for Near-Term Fusion Devices, Reference Module in Mater. Sc. Mater. Eng. 2016, refers Federici, G.; Doerner, R.; Lorenzetto, P.; Barabash, V. Beryllium as a Plasma-Facing Material for Near-Term Fusion Devices. Compreh. Nucl. Mater. 2012, 4, 621–666. [Google Scholar]
  10. Zmitko, M.; Vladimirov, P.; Knitter, R.; Kolb, M.; Leys, O.; Heuser, J.; Schneider, H.-C.; Rolli, R.; Chakin, V.; Pupeschi, S.; et al. Development and qualification of functional materials for the European HCPB TBM. Fus. Eng. Des. 2018, 136, 1376–1385. [Google Scholar] [CrossRef]
  11. Federici, G.; Boccaccini, L.; Cismondi, F.; Gasparotto, M.; Poitevin, Y.; Ricapito, I. An overview of the EU breeding blanket design strategy as an integral part of the DEMO design effort. Fus. Eng. Des. 2019, 141, 30–42. [Google Scholar] [CrossRef]
  12. Vladimirov, P.V.; Chakin, V.P.; Dürrschnabel, M.; Gaisin, R.; Goraieb, A.; Hernandez Gonzalez, F.A.; Klimenkov, M.; Rieth, M.; Rolli, R.; Zimber, N.; et al. Development and characterization of advanced neutron multiplier materials. J. Nucl. Mater. 2021, 543, 152593. [Google Scholar] [CrossRef]
  13. Gaisin, R.; Chakin, V.; Vladimirov, P.; Hernandez Gonzalez, F.A.; Udartsev, S.; Vechkutov, A.; Kolmakov, M. Industrial-scale Manufacturing Experience of Titanium Beryllide Block for DEMO Blanket Application. Fus. Eng. Des. 2020, 161, 111862. [Google Scholar] [CrossRef]
  14. Scaffidi-Argentina, F. Tritium and helium release from neutron irradiated beryllium pebbles from the EXOTIC-8 irradiation. Fus. Eng. Des. 2001, 58–59, 641–645. [Google Scholar] [CrossRef]
  15. Rabaglino, E.; Hiernaut, J.P.; Ronchi, C.; Scaffidi-Argentina, F. Helium and tritium kinetics in irradiated beryllium pebbles. J. Nucl. Mater. 2002, 307, 1424–1429. [Google Scholar] [CrossRef]
  16. Chakin, V.; Rolli, R.; Moeslang, A.; Klimenkov, M.; Kolb, M.; Vladimirov, P.; Kurinskiy, P.; Schneider, H.-C.; van Til, S.; Magielsen, A.J.; et al. Tritium release and retention properties of highly neutron-irradiated beryllium pebbles from HIDOBE-01 experiment. J. Nucl. Mater. 2013, 442, S483–S489. [Google Scholar] [CrossRef]
  17. Van Til, S.; Fedorov, A.V.; Stijkel, M.P.; Cobussen, H.L.; Mutnuru, R.K.; vd Idsert, P.; Zmitko, M. Tritium release from beryllium pebbles after high temperature irradiation up to 3000 appm He in the HIDOBE-01 experiment. J. Nucl. Mater. 2013, 442, S478–S482. [Google Scholar] [CrossRef]
  18. Chakin, V.; Rolli, R.; Klimenkov, M.; Zmitko, M. Tritium release and retention in beryllium pebbles irradiated up to 640 appm tritium and 6000 appm helium. J. Nucl. Mater. 2020, 542, 152521. [Google Scholar] [CrossRef]
  19. Chakin, V.; Rolli, R.; Gaisin, R.; Hoeppener-Kramar, U.; Nakamichi, M.; Zmitko, M. Tritium release and retention in beryllium and titanium beryllide after neutron irradiation up to damage doses of 23–38 dpa. Fus. Eng. Des. 2020, 161, 111938. [Google Scholar] [CrossRef]
  20. Chakin, V.; Rolli, R.; Vladimirov, P.; Moeslang, A. Tritium release from highly neutron irradiated constrained and unconstrained beryllium pebbles. Fus. Eng. Des. 2015, 95, 59–66. [Google Scholar] [CrossRef]
  21. Rabaglino, E.; Ronchi, C.; Cardella, A. Recent progress in the modelling of helium and tritium behaviour in irradiated beryllium pebbles. Fus. Eng. Des. 2003, 69, 455–461. [Google Scholar] [CrossRef]
  22. Redhead, P.A. Thermal desorption of gases. Vacuum 1962, 12, 203–211. [Google Scholar] [CrossRef]
  23. De Jong, A.M.; Niemantsverdriet, J.W. Thermal desorption analysis: Comparative test of ten commonly applied procedures. Surface Sci. 1990, 233, 355–365. [Google Scholar] [CrossRef]
  24. Falconer, J.L.; Madix, R.J. Flash desorption activation energies: DCOOH decomposition and CO desorption from Ni (100). Surf. Sci. 1975, 48, 393–405. [Google Scholar] [CrossRef]
  25. Booth, A.H. Calculation of electron trap depths from thermoluminescence maxima. Can. J. Chem. 1954, 32, 214. [Google Scholar] [CrossRef]
  26. Chan, C.-M.; Aris, R.; Weinberg, W.H. An analysis of thermal desorption mass spectra. I. Appl. Surf. Sci. 1978, 1, 360–376. [Google Scholar] [CrossRef]
  27. Vitins, A.; Kizane, G.; Matiss, A.; Pajuste, E.; Zubkovs, V. Tritium release behavior of beryllium pebbles after neutron irradiation between 523 and 823 K. J. Nucl. Mater. 2013, 442, S490–S493. [Google Scholar] [CrossRef]
  28. Macaulay-Newcombe, R.G.; Thompson, D.A.; Smeltzer, W.W. Thermal absorption and desorption of deuterium in beryllium and beryllium oxide. J. Nucl. Mater. 1992, 191–194 Pt A, 263–267. [Google Scholar] [CrossRef]
  29. Macaulay-Newcombe, R.G.; Thompson, D.A.; Smeltzer, W.W. Deuterium diffusion, trapping and release in ion-implanted beryllium. Fus. Eng. Des. 1991, 18, 419–424. [Google Scholar] [CrossRef]
  30. Tazhibaeva, I.L.; Shestakov, V.P.; Chikhray, E.V. Deuterium permeation through beryllium with surface element composition control. In Proceedings of the 18th Symposium on Fusion Technology, Karlsruhe, Germany, 22–26 August 1994; Newnes: Oxford, UK, 1994; pp. 427–431. [Google Scholar]
  31. Jones, P.M.S.; Gibson, R. Hydrogen in beryllium. J. Nucl. Mater. 1967, 21, 353–354. [Google Scholar] [CrossRef]
  32. Chakin, V.P.; Ostrovsky, Z.Y. Evolution of beryllium microstructure under high-dose neutron irradiation. J. Nucl. Mater. 2002, 307–311, 657–663. [Google Scholar] [CrossRef]
  33. Chakin, V.; Fedorov, A.; Gaisin, R.; Zmitko, M. Swelling of Highly Neutron Irradiated Beryllium and Titanium Beryllide. J. Nucl. Eng. 2022, 3, 398–408. [Google Scholar] [CrossRef]
  34. Klimenkov, M.; Chakin, V.; Moeslang, A.; Rolli, R. TEM study of beryllium pebbles after neutron irradiation up to 3000 appm helium production. J. Nucl. Mater. 2013, 443, 409–416. [Google Scholar] [CrossRef]
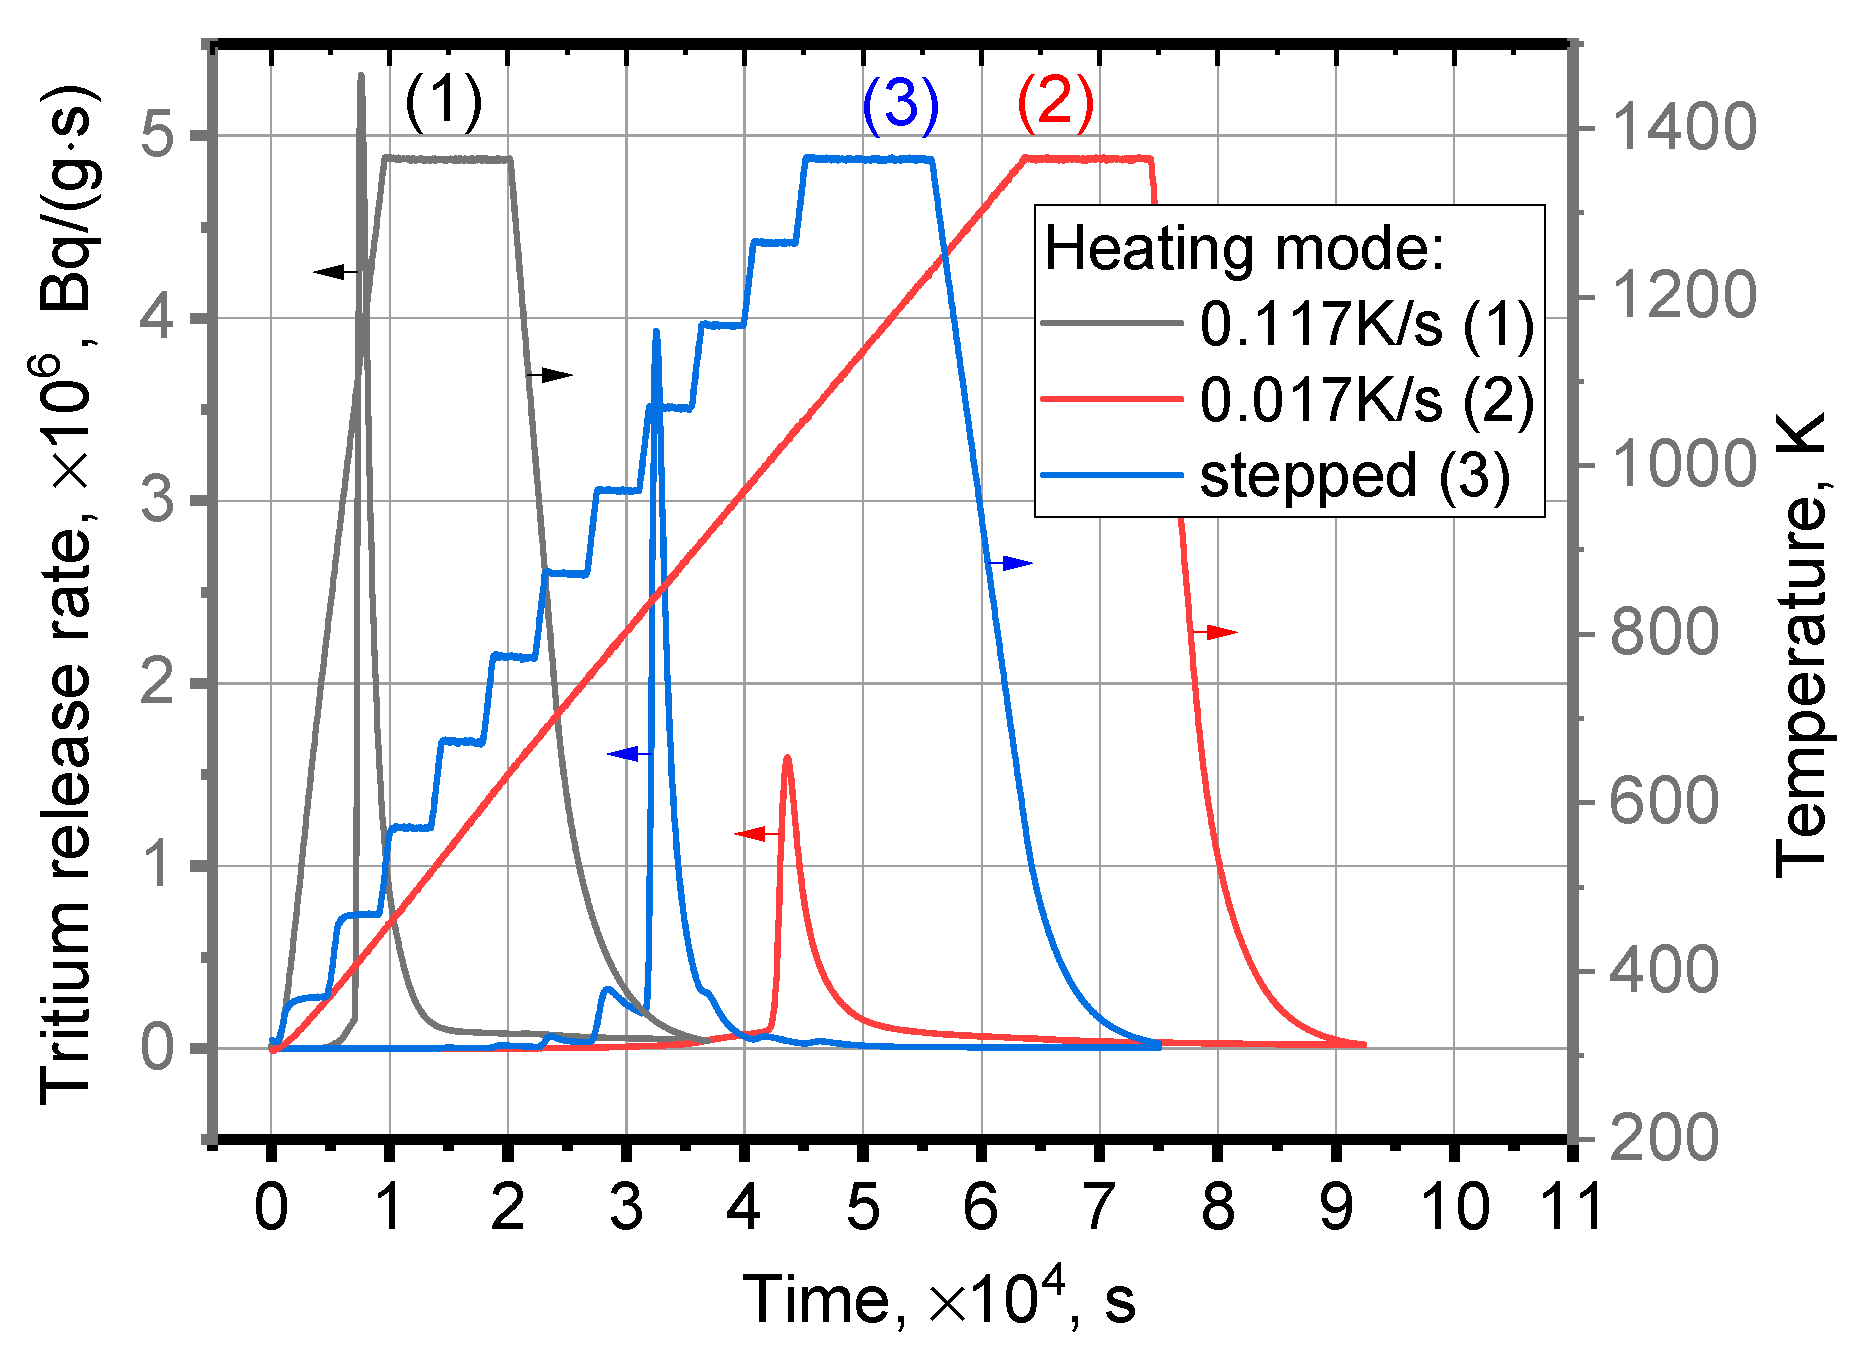
Figure 1. Tritium release rate from Be matrix fragments on temperature and time at permanent heating rates of 0.117 K/s (1) and 0.017 K/s (2) as well as for a stepped heating mode (3).
Jne 04 00036 g001
Figure 2. Tritium release rate at permanent heating rates of 0.117 K/s (1), 0.017 K/s (2) and a stepped heating mode (3) with an average heating rate of 0.03 K/s on temperature.
Jne 04 00036 g002
Figure 3. Optical micrographs of irradiated Be fragments, as received: (a) general view of a fragment with irregular shape; (b) cracks located close to cutting place (in polarized light); (c) view of grains (in polarized light); (d) view of pores (black objects).
Jne 04 00036 g003
Figure 4. Optical micrographs of irradiated Be fragments after annealing for 5 h at temperature: (a) 473 K; (b) 573 K; (c) 673 K; (d) 773 K.
Jne 04 00036 g004
Figure 5. Porosity of irradiated Be fragments after annealing at 473–1373 K for 5 h.
Jne 04 00036 g005
Figure 6. Optical micrographs of irradiated Be fragments after annealing for 5 h at temperature: (a) 873 K; (b) 973 K; (c) 1073 K; (d) 1173 K; (e) 1273 K; (f) 1373 K.
Jne 04 00036 g006
Figure 7. Dependence of lg D on 1000/T, where D, m2/s is the effective tritium diffusion coefficient, T, K is the temperature (D and T were taken from Table 7).
Jne 04 00036 g007
Figure 8. Dependence of lg D on 1000/T from literature [28,29,30,31] and this study, where D, m2/s is the effective tritium diffusion coefficient, T, K is the temperature.
Jne 04 00036 g008
Table 1. Parameters of irradiated beryllium samples.
Mode and Heating Rate, K/sWeight, gApproximate
Diameter d, mm
Permanent at rate 0.1170.02592.9915
Permanent at rate 0.0170.031153.1932
Stepped at average rate 0.030.03473.2979
Table 2. Characteristics of tritium release spectra.
Heating ModePeak Temperature Tm, KStart of Tritium Release, KHeight of Peak, ×106, Bq/(g·s)Peak Width at Half Height W1/2, K
Permanent at rate 0.117 K/s1136800–8705.34141
Permanent at rate 0.017 K/s1031800–8701.5836
Stepped at average rate 0.03 K/s1069800–8703.934
Table 3. Calculation of tritium desorption energy Edes according to [24].
Heating Rate
Combination
Peak Temperatures Tm, Ktgα, 104Edes, eVEdes/aver, eV
β1, β21136, 10311.93531.71.6
β1, β31136, 10692.24651.9
β2, β31031, 10691.43741.2
Table 4. Calculation of tritium desorption energy Edes according to [25].
Heating Rate CombinationPeak Temperatures Tm, KEdes, eVEdes/aver, eV
β1, β21136, 10311.71.6
β1, β31136, 10691.9
β2, β31031, 10691.2
Table 5. Calculation of tritium desorption energy Edes according to [26].
Heating Rate, K/sPeak Temperature Tm, KY1/2Edes, eVEdes/aver, eV
β111368.060.61.7
β2103128.641.1
β31069267.253.5
Table 6. Calculation of pre-exponential factor of desorption ν according to [26].
Heating Rate, K/sRelative Heating Rate, 10−5,
s−1
Peak Temperature Tm, Kν, 104, s−1
0.11710.83311362.02
0.0171.574110311.92
Table 7. The calculated effective tritium diffusion coefficient D.
T, KModeD, m2/s
873stepped1.2318 × 10−12
973stepped7.4859 × 10−12
1073stepped1.788 × 10−10
1173stepped7.3514 × 10−11
1373permanent at 0.017 K/s1.6781 × 10−11
1373permanent at 0.117 K/s1.7275 × 10−11
Table 8. Tritium diffusion path L in irradiated Be sample calculated using relation (8).
ModeT, Kt, hL, mmR, mm
Heating to T with following exposure for t12731001.45~1.5
137330.29
1373200.76
13731001.7
147350.43
1473501.37
1473701.62
Disclaimer/Publisher’s Note: The statements, opinions and data contained in all publications are solely those of the individual author(s) and contributor(s) and not of MDPI and/or the editor(s). MDPI and/or the editor(s) disclaim responsibility for any injury to people or property resulting from any ideas, methods, instructions or products referred to in the content.