Article

Multiscale Approach of Investigating the Density of Simulated Fuel for a Zero Power Reactor

by
Suneela Sardar
1,2,*,
Claude Degueldre
2 and
Sarah Green
3
1
School of Engineering and Physical Sciences, University of Lincoln, Lincoln LN6 7TS, UK
2
School of Engineering, Lancaster University, Lancaster LA1 4YW, UK
3
Faculty of Engineering & Environment, Northumbria University, Newcastle NE1 8ST, UK
*
Author to whom correspondence should be addressed.
J. Nucl. Eng. 2024, 5(3), 420-435; https://doi.org/10.3390/jne5030026
Submission received: 26 April 2024 / Revised: 12 September 2024 / Accepted: 14 September 2024 / Published: 20 September 2024

Abstract

:
With growing interest in molten salts as possible nuclear fuel systems, knowledge of thermophysical properties of complex salt mixtures, e.g., NaCl-CeCl3, NaCl-UCl3 and NaCl-UCl4, informs understanding and performance modelling of the zero power salt reactor. Fuel density is a key parameter that is examined in a multiscale approach in this paper. In the zero power reactor ‘core’ (cm level), the relative fuel density is estimated for the fuel pin disposition, as well as a function of their pitch (strong effect). Fuel density of the ‘pellet’ (mm–µm level) is first estimated on a geometrical basis, then through tracking pores and cracks using 2D (SEM) and 3D (laser microscopy, LM) techniques. For the nanoscale level, ‘grains’ analysis is done using X-ray diffraction (XRD), revealing the defects, vacancies and swelled grains. Initially, emphasis is on the near-eutectic composition of salt mixtures of CeCl3 with NaCl as the carrier salt. Cerium trichloride (CeCl3) is an inactive surrogate of UCl3 and PuCl3. The results were measured for the specific salt mixture (70 mol% NaCl and 30 mol% CeCl3) in this work, establishing that microscopy and XRD are important techniques for measurement of the physical properties of salts component pellets. This work is of significance, as densities of fuel components affect the power evolution through reactivity and the average neutronic behaviour in zero power salt reactors.

1. Introduction

Molten salt reactors (MSRs) are considered in the framework of the Generation IV International Forum [1]. Recently, advanced systems such as fast MSRs have been proposed [2,3], upgrading the nuclear energy label as renewable [4]. Most of the MSRs use fissile and fertile materials dissolved in a molten salts carrier that act together as coolant and fuel, presenting unconventional characteristics in the design, operation and safety of these systems.
Molten salt is a high-temperature fluid that may be used as electrochemical media for reprocessing of spent nuclear fuel [5,6], solar power plants [7], catalysis [8,9] and metal production [10,11]. It has many advantages, such as large specific heat, high thermal efficiency, high thermal conductivity and low viscosity. The melting temperature of salt mixtures can be significantly reduced [7,12], which widens the temperature range of their applications. Thermodynamic properties of molten salts allow MSRs to work at near-atmospheric pressure in the reactor primary loop, considering molten salts as efficient heat transfer media. Therefore, the recent emphasis is on safer, more economical generation of electricity and enhancing the operational lifetime of MSRs.
Molten salt reactors use fluoride or chloride-based salts with a focus on either solid-fuelled salt cooled design [13] or liquid salt-fuelled design [14]. In the MSR case, the salt is a fluid and extracts heat from the fuel, which is then removed in the primary heat exchanger and ultimately transported to the power generation system through the secondary coolant.
Recently, chloride salts have attracted attention as fuel and coolant systems for MSRs, particularly for molten salt fast reactors (MSFRs). Several ongoing reactor designs (Moltex Energy, Elysium Industries and TerraPower) are using NaCl-UCl3 as the reference system [15,16]. The NaCl-CeCl3 system has been chosen in many preliminary studies, because cerium chloride (CeCl3) is an inactive surrogate of UCl3 and PuCl3 and because NaCl is an attractive carrier salt due to its availability, low cost and neutronic properties.
The iMAGINE project considers a zero power salt reactor (ZPR) that operates at a very low neutron flux, producing very low thermal power [17]. For this, the fuel is a solid composite ceramic. Such a unit is a key reactor to investigate the neutronic properties of the fuel material and the effect of 37Cl enrichment, for example. The work reported here is of relevance to the understanding of such reactors, because under an uncontrolled temperature excursion, the solid salt fuel could move into an elevated temperature molten salt state.
Salt mixtures are considered suitable to meet the conditions required for the reactors, as individual salts are credited with very high melting points for coolant applications [18]. The selecting of the composition from the phase diagram allows to optimise the composition and melting temperatures. The melting temperature of CeCl3 is 817 °C (1090 K), and the eutectic melting point of NaCl-CeCl3 is 499 °C (772 K), as given by the FactSage modelled phase diagram in Figure 1, constructed from the data in [19,20,21]. During reactor operation, even small changes in the composition affect the associated physical properties of the salts; therefore, new methods must be developed for high purity sample preparation, and advanced analytical techniques should be applied for the reproducible measurement of each property. Density, melting temperatures, specific heat capacity, thermal diffusivity and thermal conductivity are the important salt characteristics that affect the design of MSRs, for both coolant and fuel salts. It is very challenging to optimise the molten salt mixtures experimentally for reactor applications, as salt properties are very sensitive to impurities, dissolved metals and oxygen-containing contaminants. Equally, it is difficult to model the data in the continuously changing environment associated with long-term reactor operation. Very limited data are available on the fundamental properties that inform fuels and coolants for MSRs. This significant knowledge gap must be addressed to accelerate the technical readiness level of the MSR design concepts [22,23,24]. Challenges associated with the homogeneity of the core for a zero power salts reactor need to be investigated.
Available density data are limited for molten salt systems, particularly those derived from analytical techniques. In this paper, the density of the NaCl-CeCl3 molten salt system is our focus, given the relevance to MSR design. Multiscale fuel density analyses are reported using geometric (fuel element or pellet, mm scale), then 2D and 3D microscopic surface investigation techniques (fuel specimen, µm size), along with bulk analysis for the analysis of defects (fuel grain, nm scale). Green pellets of salt mixture were prepared and analysed using Scanning Electron Microscopy (SEM), 3D Laser Microscopy (LM) and X-ray Diffraction (XRD) to yield density measurement at the micro and nanometre scale. The obtained results were compared with an actual and an ideal mixing density model [25]. Whilst analytical approaches are less preferred techniques for density measurement, when compared to conventional experimental methods, they have proven safe, reliable and suitable for the hygroscopic salts investigated in this work. Indeed, the use of these techniques can be used for data acquisition from different compositions and conditions of molten salt systems, contributing to the development and improvement of MSRs.

2. Materials and Methods

2.1. Methodology

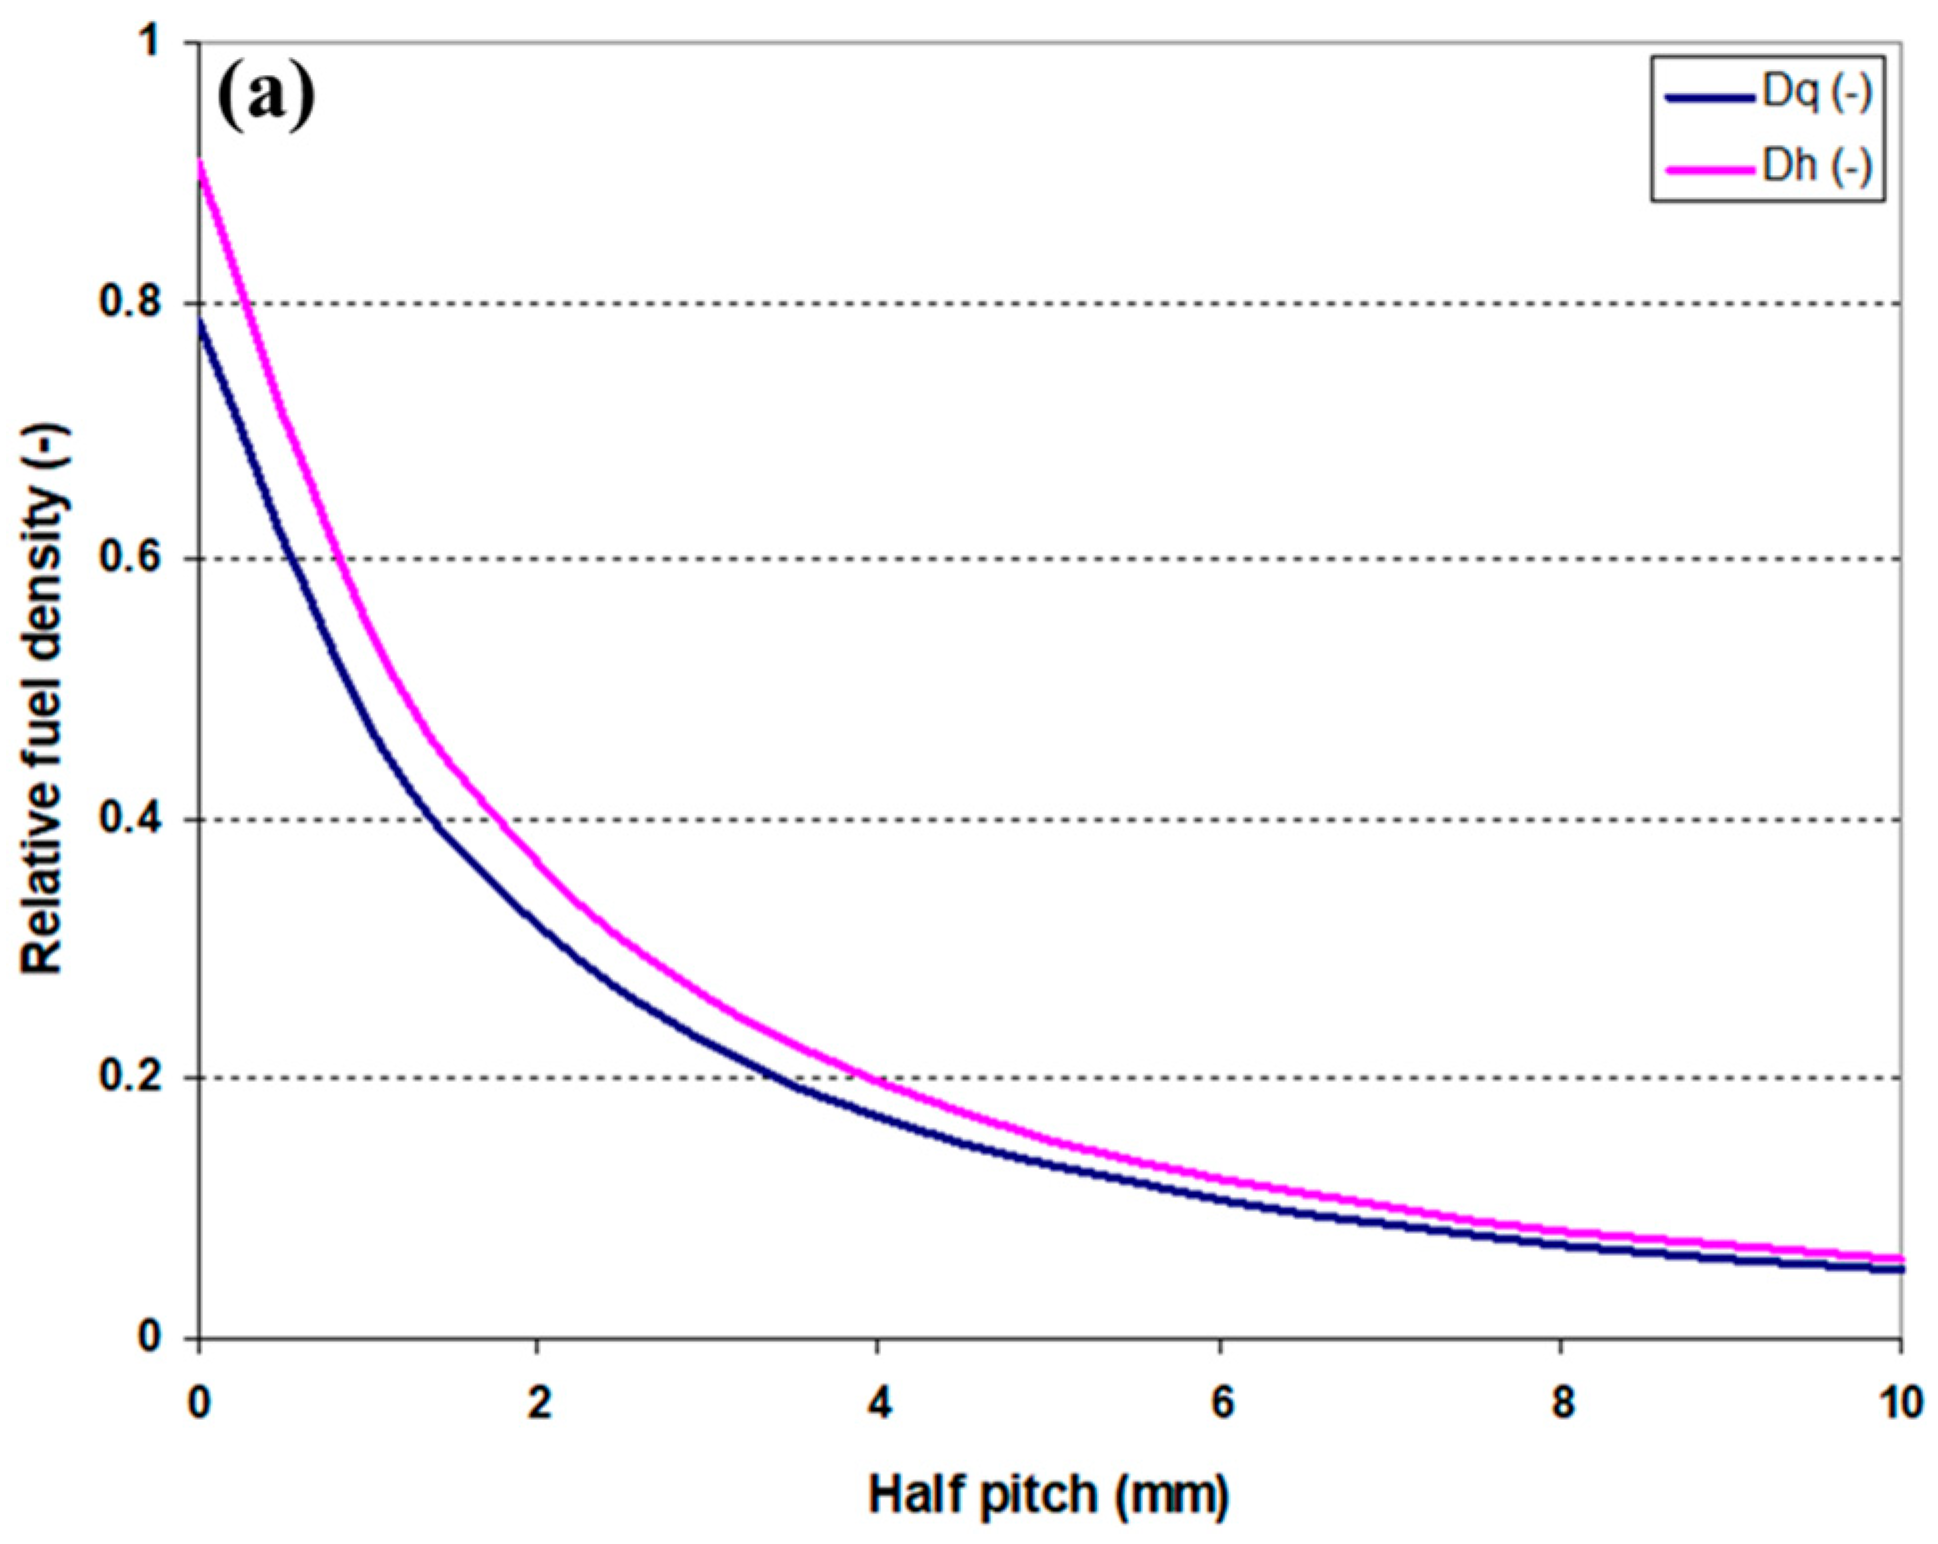
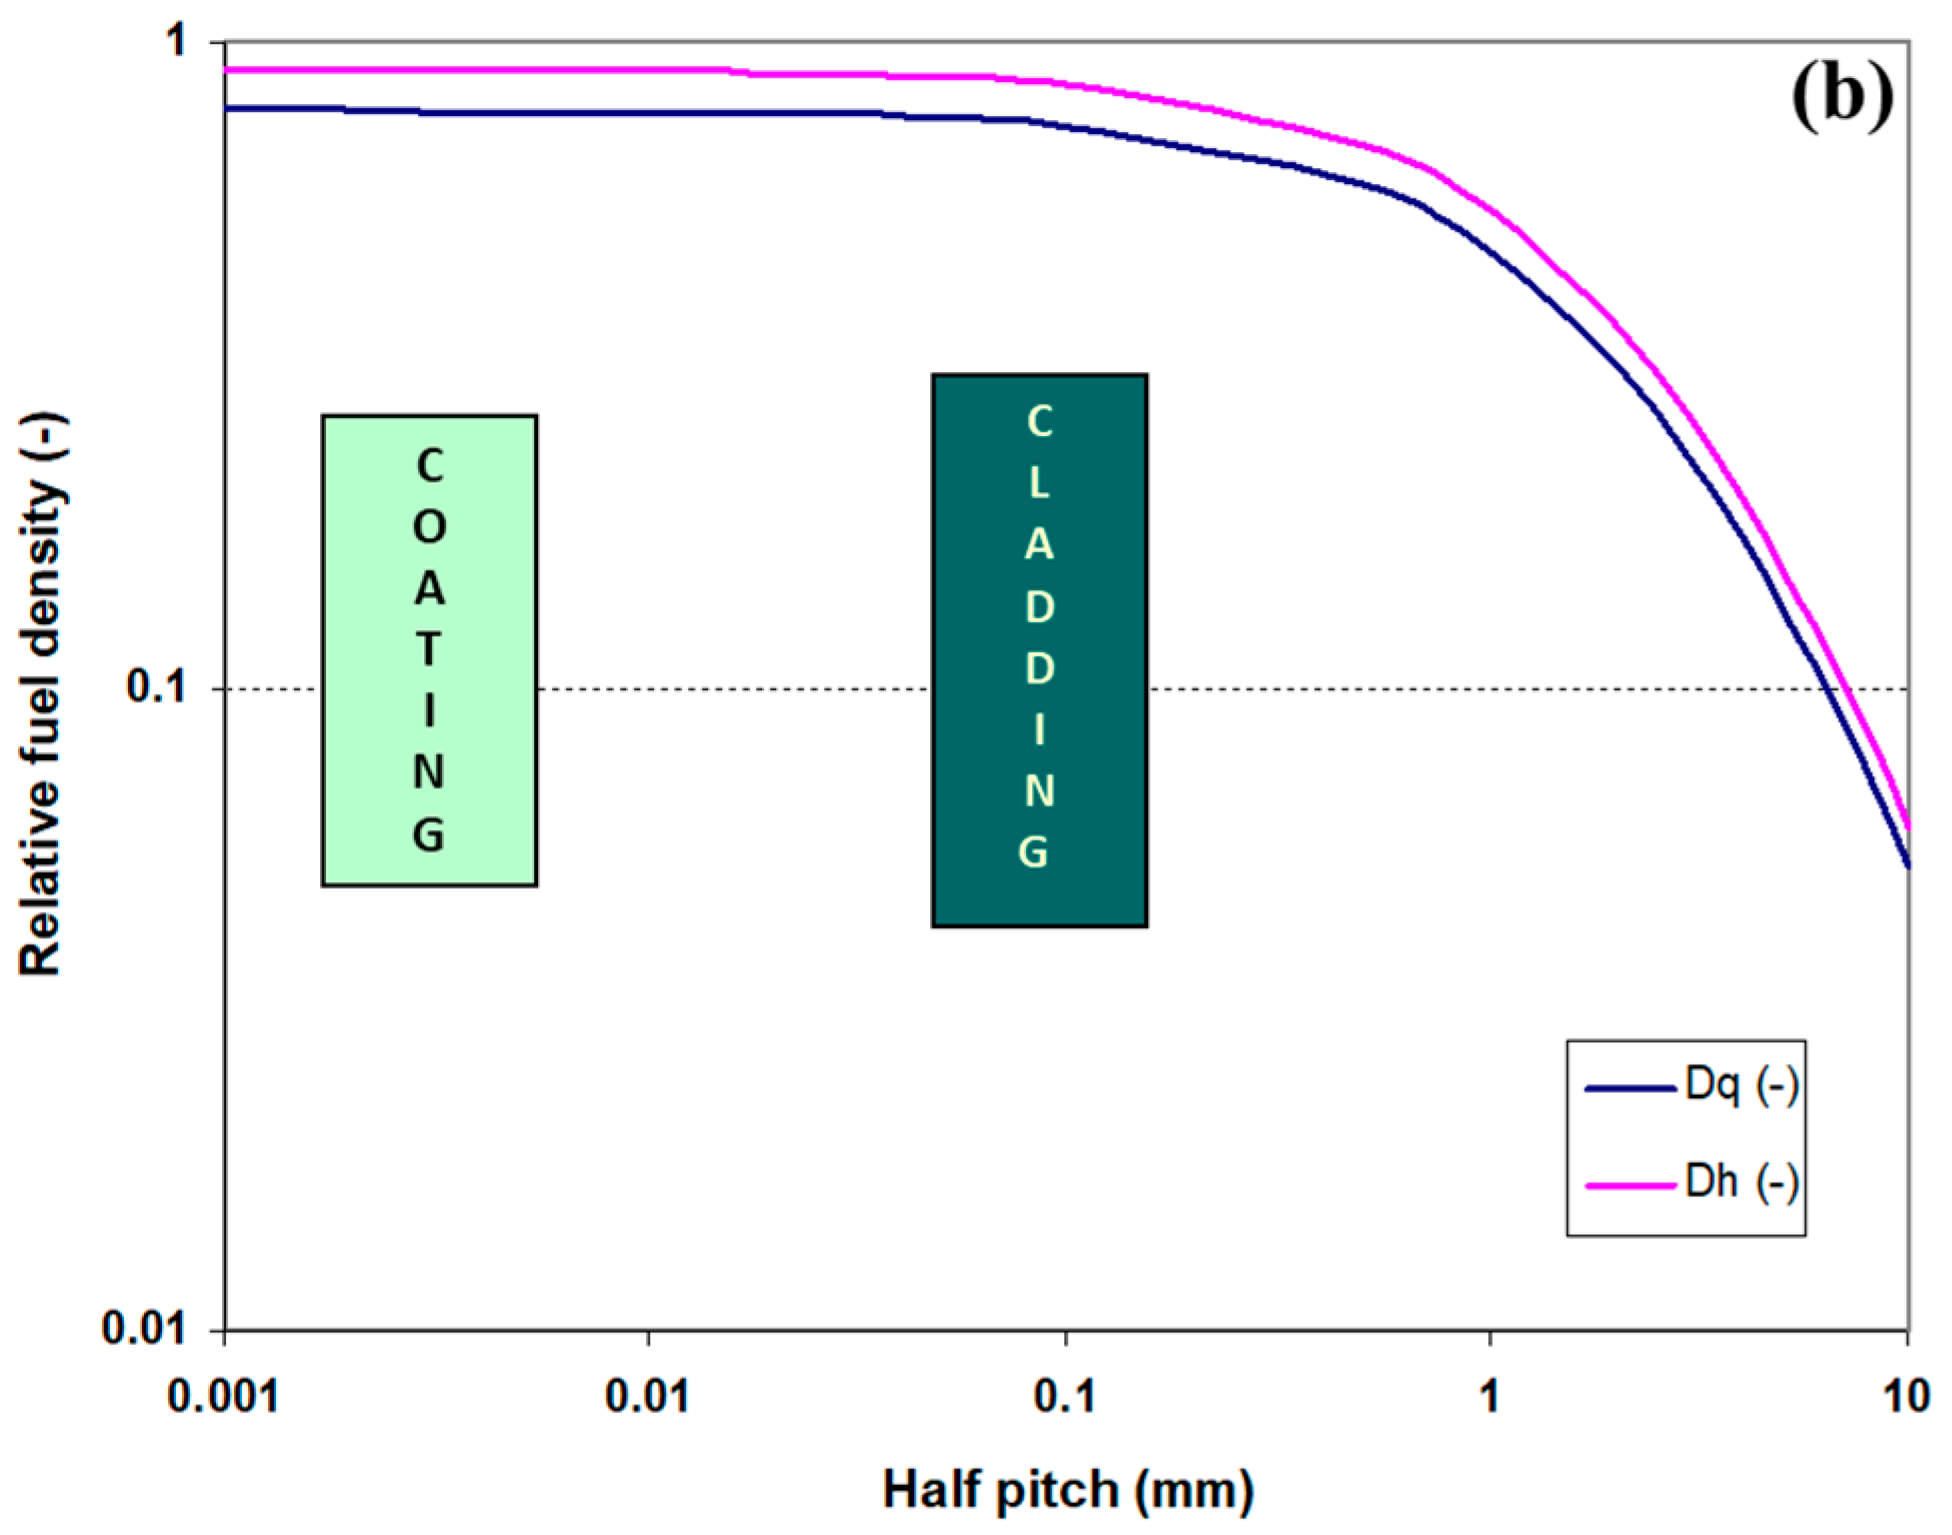
2.1.1. Fuel Element Geometry and Fuel Density in the Core

Here, pellets are considered in a first approach as a fuel element. This could be microspheres or cubes, such as in the first ZPR initiated by Fermi (1943) [26]. The relative packing types of fuel elements such as pellets in the reactor have a direct impact on the fuel relative density and, hence, on the intensity of the neutron flux. To avoid any geometrical 3D disorder of the pellets decreasing the fuel compactness and random disposition, fuel orientation in the core is mandatory. Fuel pellets must be ordered, forming vertical or horizontal arrays to increase compactness. Full compact assembly is the reference corresponding to the lowest void and to the highest material fraction in the core.
The mixed carrier fuel salts NaCl-CeCl3 simulating NaCl-UCl4 or NaCl-UCl3 are first considered. Since these materials react with oxygen and water vapour in the air, they are protected from the air by containment (capsule/cladding) filled with inert gas. These slim claddings of the outer diameter, and inner diameter, are made of fast neutron transparent material (e.g., Al, stainless steel or SiC), with thickness comparable to the LWR cladding (e.g., 0.6 mm). Pellets are piled up in these claddings over a height. A plenum with a spring is designed at the pin top. The design suggested mimics the classical zero power reactor as described by Yum et al. (2022) [27].
For a zero power fast reactor, the fuel cladding forms an array under inert gas atmosphere to avoid moderation. The approach suggested in this paper is ‘fuel pin close packing’. The case of a hexagonal compact bunch is given in Figure 2a and the quadratic compact system in Figure 2b. The hexagonal system is more compact, and with this system, the relative fuel density Dh becomes
D h = π   r f 2 4   s i n ( π 3 )   r f 2
The quadratic compact system is usually found for zero power reactors operating in the thermal domain. With such a system, the relative fuel density Dq becomes
D q = π   r f 2 4 r f 2
A separation between fuel pins has been kept to avoid any contact in case of thermal excursion. This separation 2Δ induces a reduction of the relative fuel density at the level of the core. The effect can be described by
D q = π   r f 2 2   r f 2 Δ 2
Similarly, for the hexagonal system, a separation (pitch) 2Δ may also be needed, inducing a reduction of the relative fuel density at the level of the core. The effect can be described by
D h = π   r f 2 4   s i n ( π 3 ) ( r f Δ ) 2  
Calculations of separation (pitch) effects are carried out in Section 3.1.

2.1.2. Geometry and Density of Fuel Pellet

Pellets are taken as an example the fuel pin could be filled by pellets or by a microsphere (dry pack). However, with salt, the production of pellets is easier than microspheres.
In a first step, after production, pellets are weighed (mass ‘m’), and their geometrical parameters (height ‘h’ and radius ‘rf’) are determined to calculate the geometrical volume (Vg), e.g., material volume, including pore volume, and then the geometrical density ( ρ g ):
ρ g = m π r f 2 h
Density measurement using 2D and 3D micro-investigation techniques will use Equation (6), where the density of the pellet material will be obtained by deducting the pore volume, VP, from the geometric volume, Vg.
ρ = m V g V P

2.1.3. Fuel Grain Density

Density of the pellet at the nanometre scale can be found out using the XRD technique. It will provide the fuel grain density. Equations (7)–(10) [28] will be used for density measurement of the known phases present in the mixture, starting from the phase quantification using intensities in the diffraction pattern and Reference Intensity Ratio (RIR) values of the phases in the salt mixture.
w b = I h k l , b I h k l , a w a R I R a , b
where w is the weight fraction of phase a or b, and I is the intensity of the hkl peaks of the corresponding ‘a’ and ‘b’ phases.
R I R a , b = R I R a , r R I R b , r
RIR values of the phases can be found out from the XRD reference patterns.
The volume percentages can be calculated using Equation (9)
V a = 100 w a ρ a w a ρ a + w b ρ b
where Va and ρ a are the corresponding volume fraction (%) and grain densities. wa is the XRD determined weight fraction (%).
The matrix density ( ρ s ) of the sample was calculated using Equation (10):
ρ s = V a . ρ a + V b . ρ b 100
Grain size was measured using Scherrer Equation (11), where ‘D’ represents the average crystallite size (nm), ‘K’ is the Scherrer constant (typically around 0.9, but it can vary depending on the shape of the crystallites), ‘λ’ is the X-ray wavelength for Cu Kα radiation (1.54 nm), ‘β’ is the full width at half-maximum (FWHM) of the diffraction peak (in radians) and ‘θ’ is the Bragg angle (the angle at which the diffraction peak occurs, measured from the sample surface).
D = K λ β c o s ( θ )

2.2. Experimental Detail

2.2.1. Salt Mixture Pellet Preparation

Eutectic composition of NaCl (70 mol%) and CeCl3 (30 mol%), see Figure 1, was considered throughout this case study.
Commercially available cerium (III) chloride anhydrous, CeCl3 (purity 99.9%) from Sigma-Aldrich (Merck, Feltham, UK Ltd.) and sodium chloride, NaCl (purity 99.998%) were purchased from Thermo Fisher Scientific (Heysham, Lancaster, UK).
The salt mixture pellets preparation was carried out inside a nitrogen atmosphere positive pressure glovebox (Glovebox technologies) operated at less than 0.4 ppm H2O and O2. Salt compounds (70 mol% NaCl and 30 mol%) CeCl3 were weighed, and masses were recorded to 0.1 mg precision (1 mg in glovebox) using a VEVOR Analytical Balance (200 g Analytical Scale, 0.1 mg). Salts were thoroughly mixed before being compacted into 7 mm diameter pellets in a hydraulic pellet press loaded to 2 tonnes, producing a nominal pressure of 519 MPa on the pellets.

2.2.2. Analytical Details

Microstructures of NaCl-CeCl3 mixture pellets were examined by Scanning Electron Microscopy (SEM) using JEOL 6010-LV (Herts, UK). Pellets were stacked on a sample holder using a conducting carbon tab inside an Ar-filled glovebox transferred to the SEM, having the least contact with air prior to the investigation. Examinations were performed at 20 keV combining secondary electron (SEI) and compositional backscatter imaging (BSE). The instrument resolution was ~5 nm. Micrographs were processed using ImageJ (1.46 r) software for porosity measurement.
The salt mixture pellets underwent optical measurement. In this case, a 3D laser microscope (LM) from the LEXT line-OLS5000 by Olympus was used. The general principle of operation of the microscope in confocal mode consisted of generating an image from the reflected light of the laser beam. The main source of light was a laser diode emitting a light beam in the range of the visible spectrum, with wavelength λ = 405 nm (optimise). Focusing of the light beams on the examined surface/interface was carried out as a result of a precise displacement of the measurement head in a vertical direction (axis z). The process of scanning was carried out by a special scanner with integrated Micro-Electro-Mechanical Systems (MEMS). LEXT (OLS5000, OLYMPUS) analysis software was used to evaluate the quantity and configuration of peaks and valleys in a pellet interface.
For XRD analysis, pellets of NaCl-CeCl3 mixture were sealed with Kapton tape onto an ABS carrier to avoid contact with the air. Samples were analysed using powder X-ray diffraction (Rigaku SmartLab) employing CuKα radiation (λ = 1.5418 Å) at ambient conditions. XRD data were analysed using Powder X-ray Diffraction Profile Analysis (PDXL 2.7) software. Quantification of the phases present in the salt mixture diffraction pattern was carried out using the Reference Intensity Ratio (RIR) method, which is independent of the experimental conditions.

3. Results and Discussion

The fuel specimen densities are investigated at the core, macro-, micro- and nano-level using a multiscale approach.

3.1. Fuel Element Geometry and Fuel Density at the Core Level

Pellets are considered in a first approach as fuel elements piled up in their claddings. As discussed in Section 2.1.1, they can form a quadratic or hexagonal array. For the hexagonal system, the relative fuel density Dh given by Equation (11) becomes
D h = π   4   s i n   ( π 3 )   = 0.907
The quadratic compact system is usually found for zero power reactors operating in the thermal domain. With such a system, the relative fuel density Dq becomes Equation (12) and shows that the hexagonal system is more compact than the quadratic one.
D q = π   4   = 0.785
In the real zero power reactor, the pins are not set in a close compact array. For the thermal zero power reactor, the system is quadratic, and pitches between the pin allow circulation of the moderator, and the relative fuel density may be estimated using Equation (3). Calculations for the 3.5 mm pellets radius (see the results in Section 3.2) gives the relative density results presented in Figure 3. Similar results are gained for the hexagonal array of fuel using Equation (4). It is noted that, for a compact array with a null pitch, the relative fuel density for the hexagonal array is 0.907, whereas, for the quadratic array, it is 0.785. The relative density decreases rapidly when the half pitch increases see lin-lin plot, Figure 3a. In addition, Figure 3b displays the same figure on the log-log plot. It underlines the relative densities for coated and for cladded fuel pins in compact arrangement.

3.2. Fuel Pellet Geometry and Fuel Density

The geometric volume of pellets of the NaCl-CeCl3 mixture were first measured using the vernier caliper. Theoretical density of the pellet was obtained using the densities of NaCl and CeCl3 from the literature and geometric volume as seen in Table 1. The density of the mixture was also calculated by assuming 5% porosity in the pellet structure (typical for LWR pellets), which changed the theoretical density from 3.325 to 3.160 g·cm−3. The purpose of the porosity assumption is to understand its effect on theoretical density given that fully dense (0 % porosity) is difficult to achieve via the conventional powder pressing manufacture route.
Amounts of the salts were weighed while preparing the pellets of the salt mixture. The true density of the pellets was calculated by using these weights and densities of respective salts. Table 2 shows that the pellet density is (as expected) less than the theoretical density.
The pellet density (Table 2) shows the influence of compacting the pressure. The density of the NaCl-CeCl3 salts mixture in a molar ratio of 70% and 30%, respectively, should be 3.065 g·cm−3, according to the ideal mixing density model (the mass fraction averaged density) [21]. Compacting the salts mixture into the pellet retains the interstitial voids, reducing the density from the theoretical value. Additional to the compaction pressure, the grain size and particle shape of the NaCl and CeCl3 constituents will also influence the mechanical densification of the pellet. The experimental density of the pellet shows 6.83 ~ 7.00% porosity as compared to the ideal mixing density model. From Table 1 (TD = 3.325 g·cm−3) and Table 2 (D = 2.855 g·cm−3), a relative density of 0.859 and a relative porosity of 0.141 were calculated, which is reasonable for a green pellet of salts powder.

3.3. Investigation at the Microscopic Level

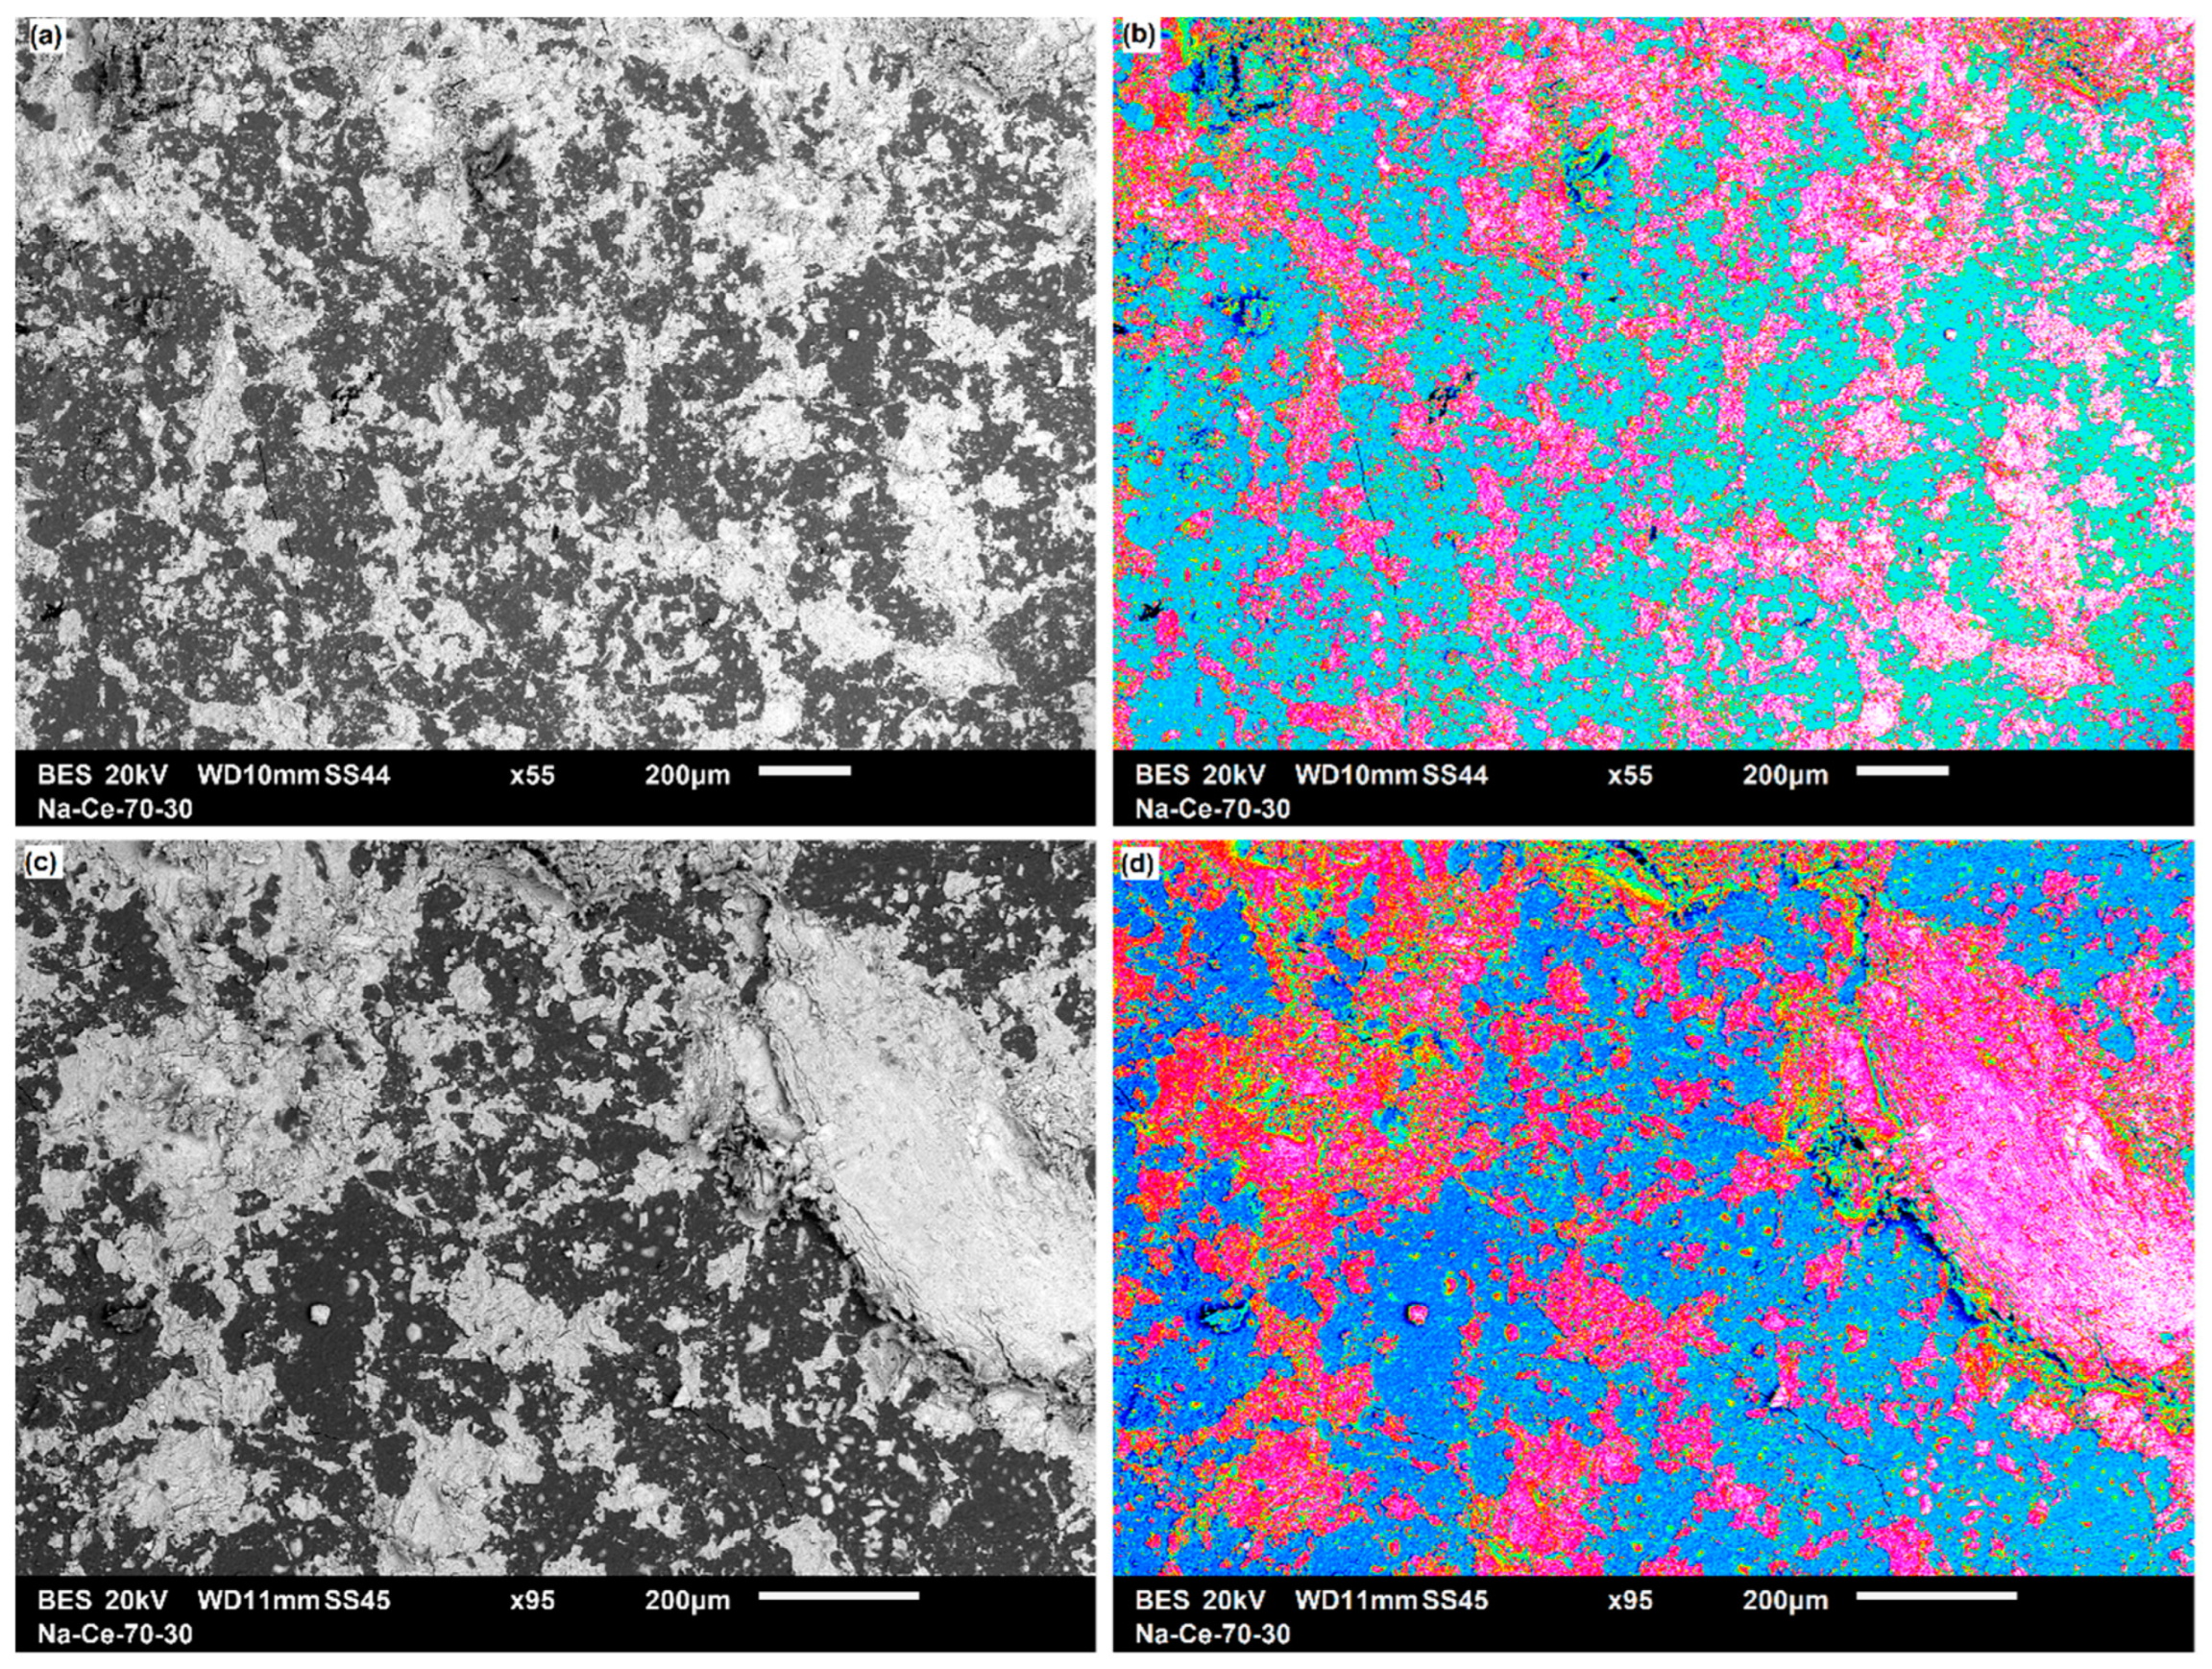
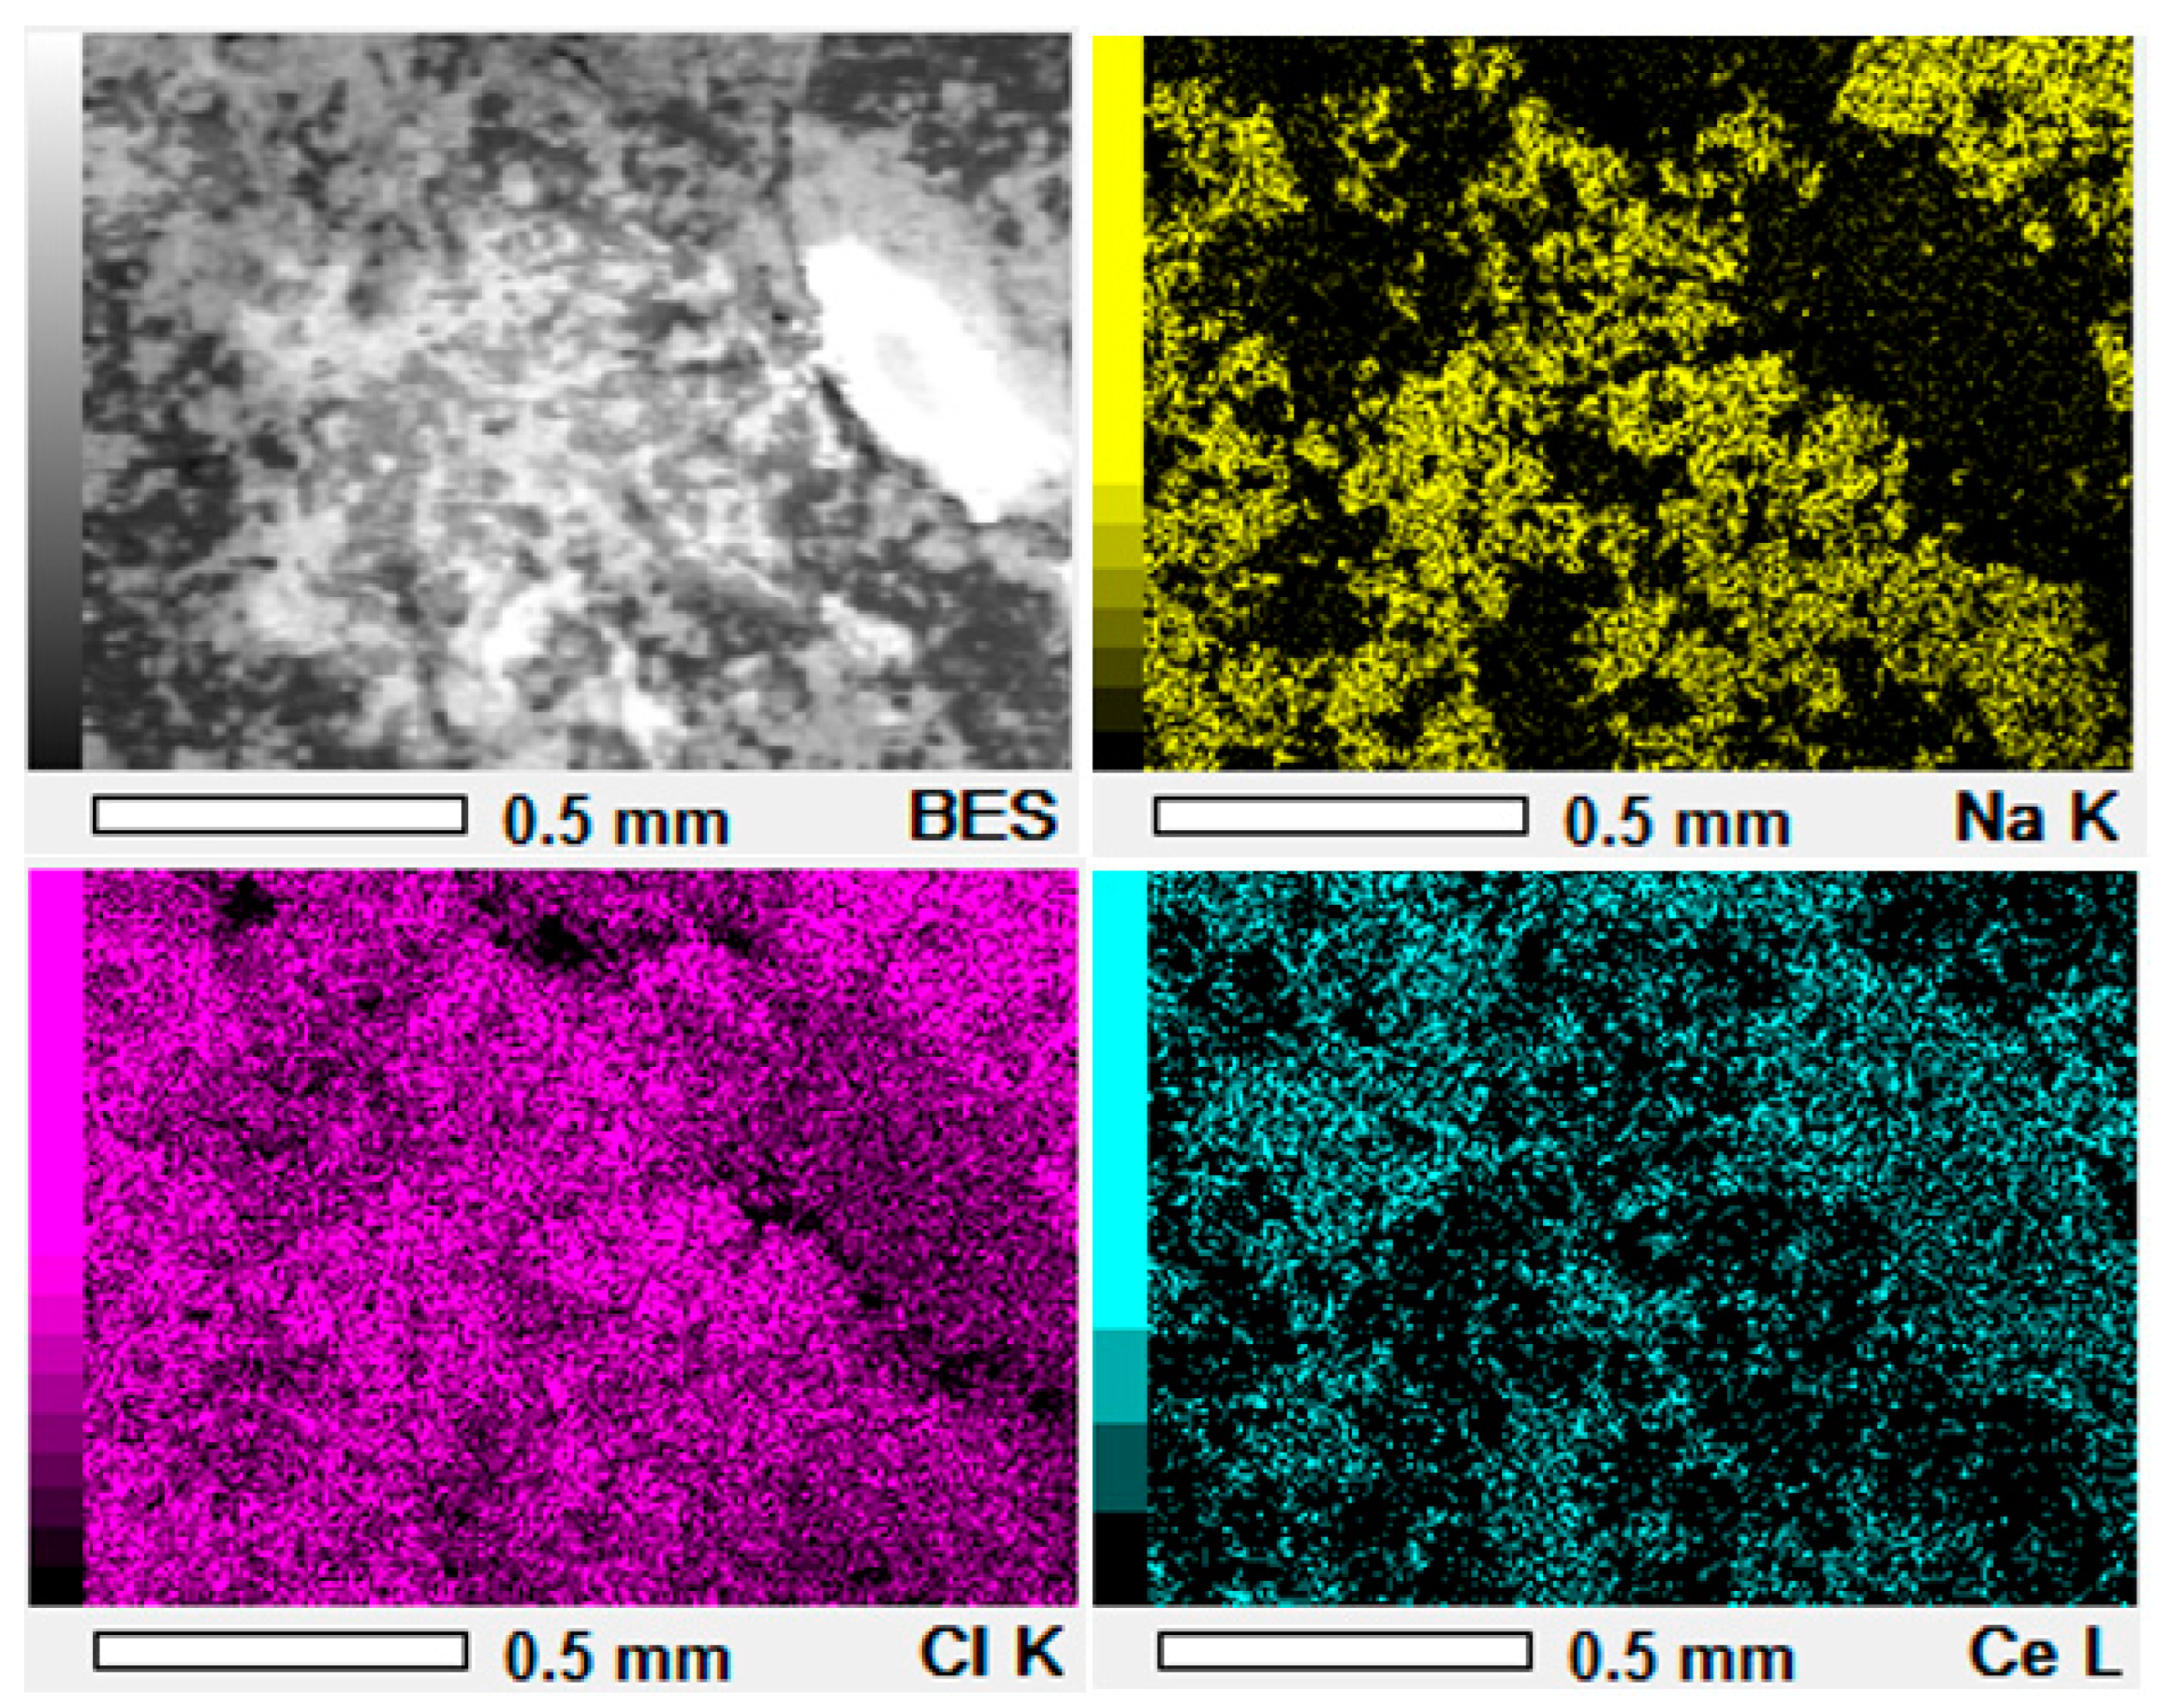
3.3.1. Two-Dimensional (2D) Surface Investigation

The surfaces of the pressed NaCl-CeCl3 pellets were analysed using SEM, as shown in Figure 4. Figure 4a,c represent images of two different areas (top surface) of a pellet, and Figure 4b,d are their coloured scans, respectively. The micrographs show some non-uniformities in the salt mixture. Pores and cracks in the pellet can be clearly seen in the dark blue colour. All the captured images were processed using ImageJ by adjusting the scales and threshold for pellet porosity quantification. The processed images cover almost 85% of the area of the pellet. The obtained porosity can be overestimated as well due to the overlapping of images of a certain point.
The number of pores (N) from the processed micrographs normalised for the size (min–max) increment as a function of their size reveals the role of the pore size in the porosity contribution.
Figure 5 shows the pore data obtained from the image processing. The plot exhibits the size (derived from their perimeters, P) distribution of pores with respect to the investigated area. The normalised pore distribution from 1.5 to 121 µm was translated in equivalent size d = P/π in a normalised pore size distribution (from 0.47 to 38.7 µm) that follows Pareto’s Law, see Figure 5a.
From 0.47 to 38.7 µm, the average slope of log (δN/δd) vs. log d was −2.3 (Figure 5b), which suggests that the contribution of the large pores is more significant than the small ones (Pareto distribution). Around and above 35 µm, the slope reaches −5, where the smaller pores than 40 µm contribute to the porosity.
SEM-EDX analysis was performed on the NaCl-CeCl3 mixture pellet, as shown in Figure 6. EDX mapping reveals the distribution of elements in the salt mixture. Element mapping has confirmed the presence of Na, Ce and Cl in the pellet with some non-uniformity at some points in the pellet.

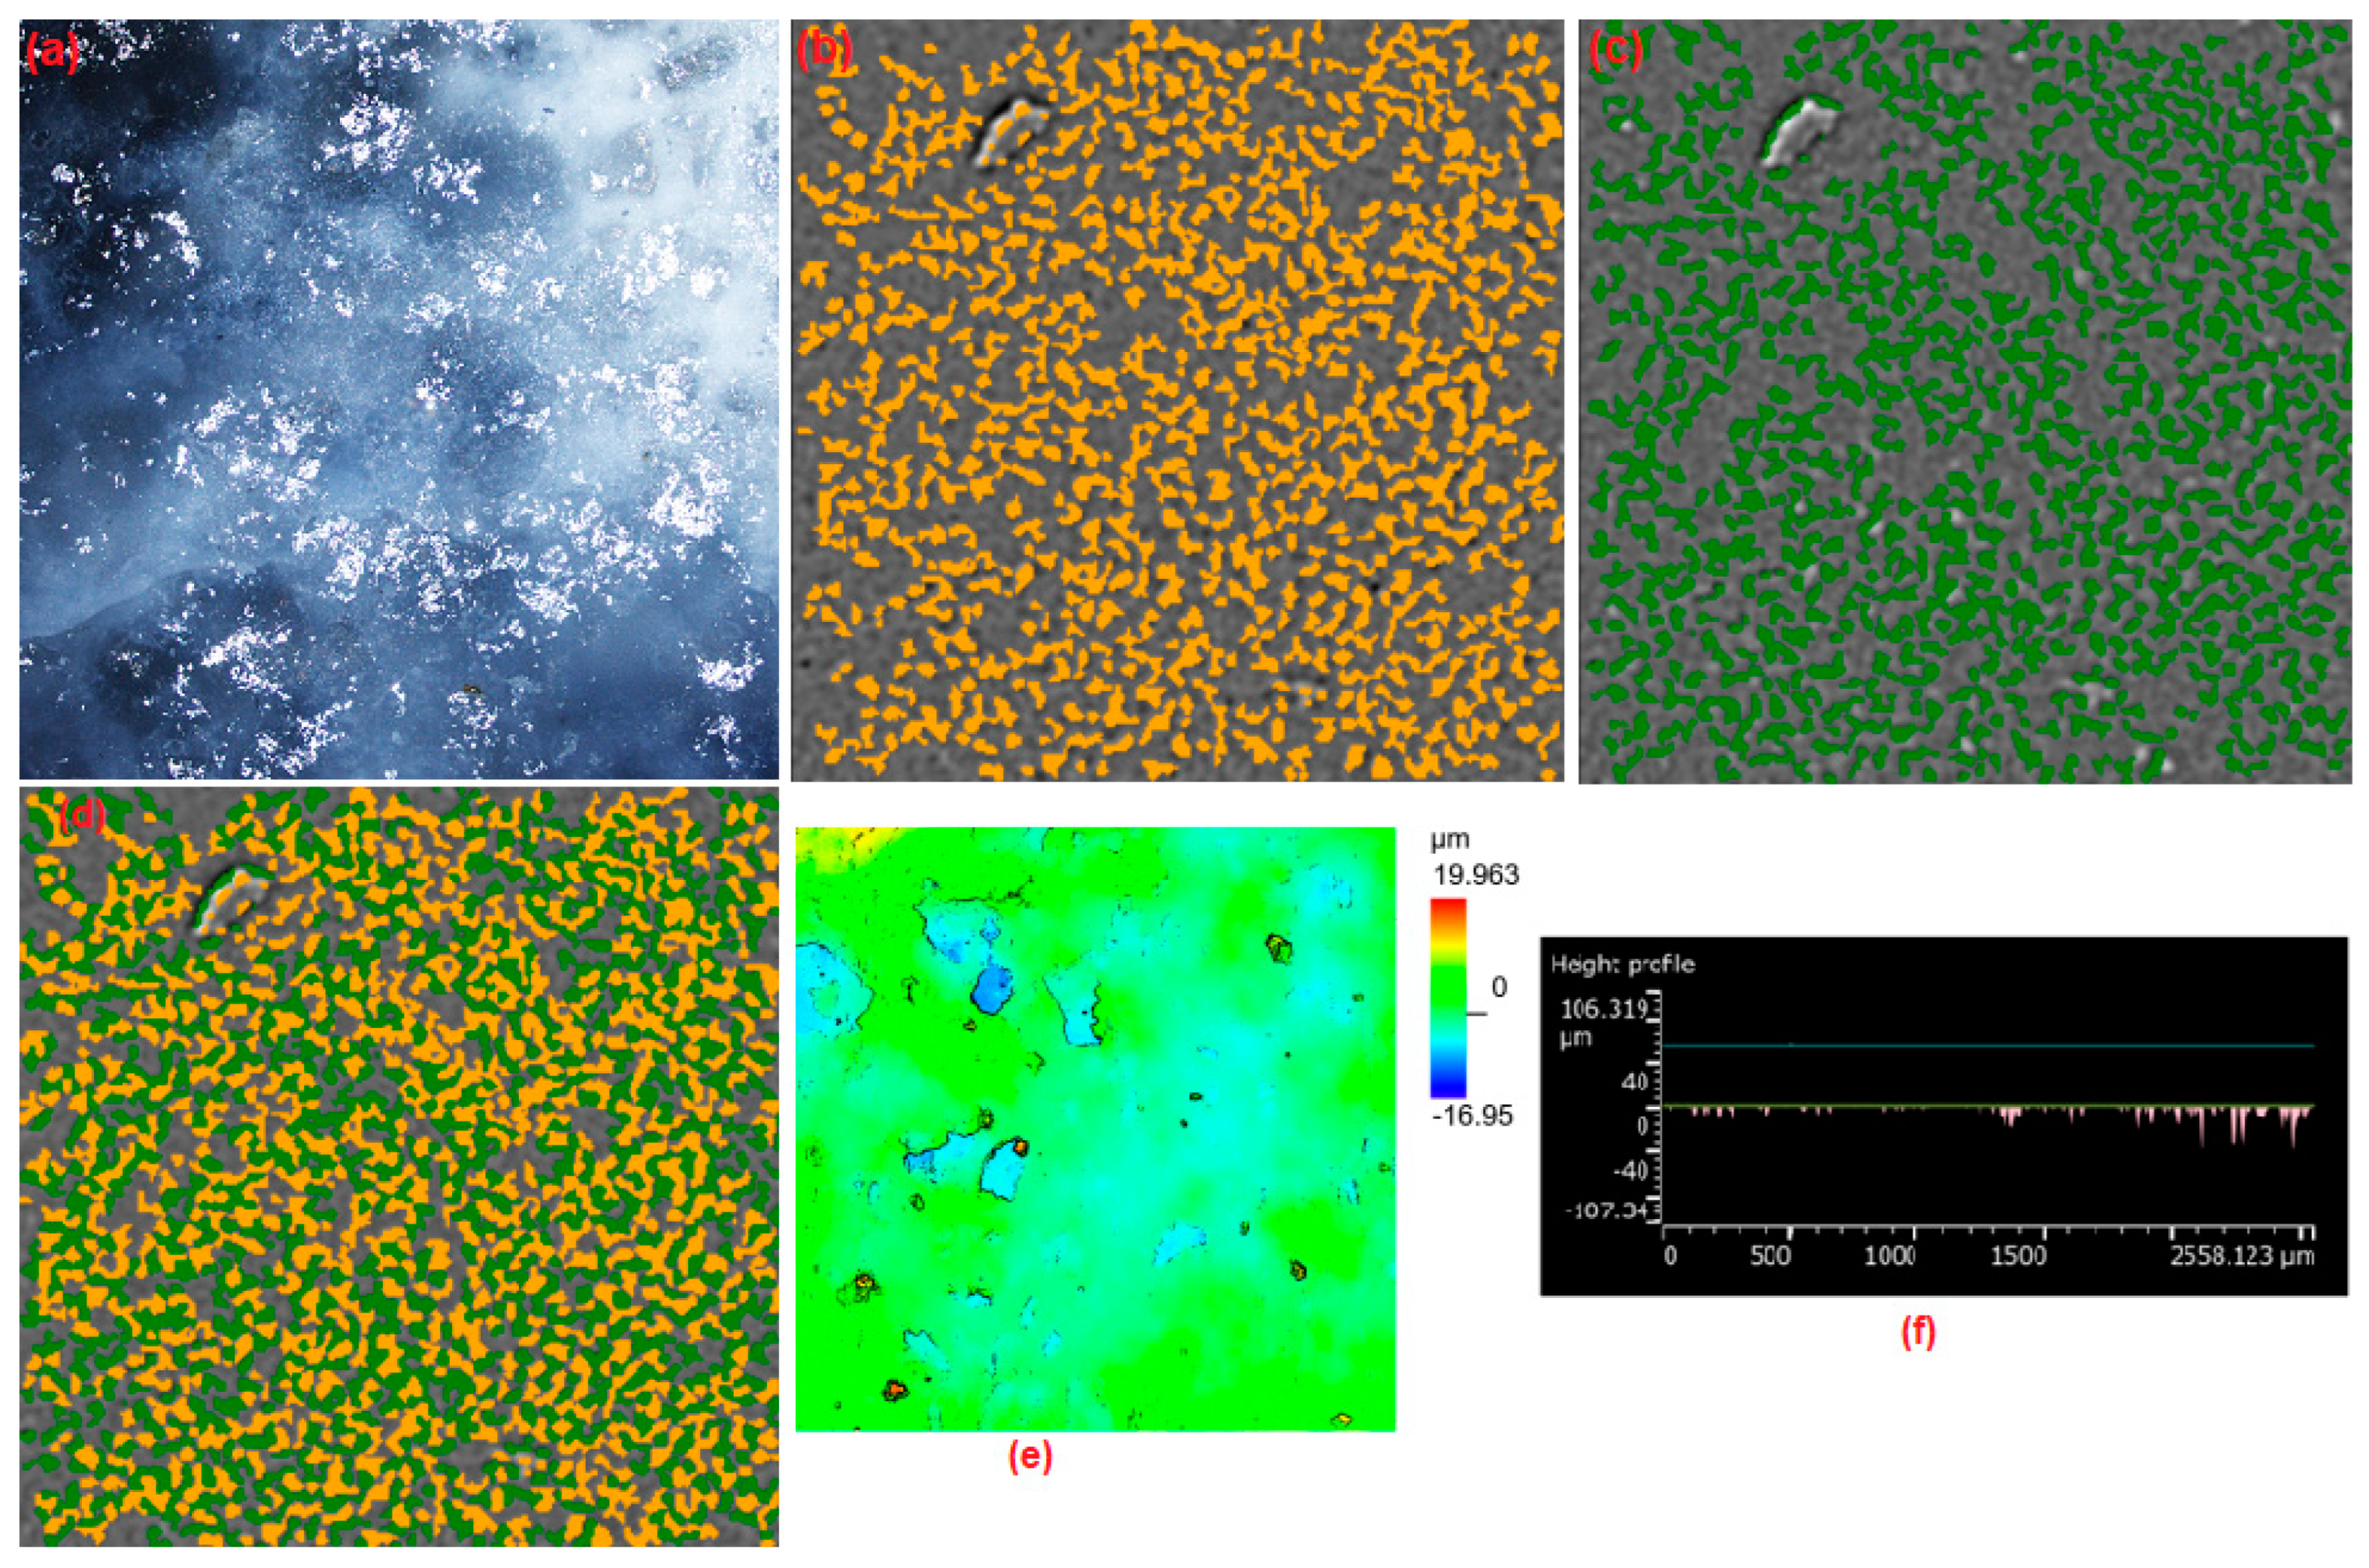
3.3.2. 3D Interface Investigation

Micrographs obtained from the SEM are two dimensional (2D), and the information from the third dimension is veiled. The 2D SEM images are maps of intensities of scattered electrons that originate from specific areas dependent to observation conditions. This fact leads to carrying out an analysis that generates a height map. Figure 7 shows the 3D laser microscopy (LM) analysis of pellet of NaCl-CeCl3 mixture. Figure 7a shows the extended colour image of the pellet, along with its height data in Figure 7e. Height data improves the visibility of the acquired data.
The focusing was determined through differentiating the changes in the intensity of the light beam reaching the detector through the circular pinhole aperture. Acquisition of spatial images and maps of the examined pellets’ surfaces were related to the procedure of precise scanning point by point in the x–y-axes.
The captured images from the 3D laser microscopy were processed using analysis application, and the interface was evaluated for peaks and valleys/voids. The images included in Figure 7b–d feature the categorised characteristics of peaks, valleys and peaks and valleys of the surface together, respectively. Peaks on the interface relate to the roughness, friction and similar phenomena. The valleys are to the pores on the interface and contribute towards the porosity of the pellet. Figure 7f shows the height profile of the voids present in the pellet, as the reference line is at 0 µm. The parameters obtained from the analysis are the volume of the voids (µm3/µm2), interface area and volume of the pellet. Porosity was calculated from these parameters obtained from a 3D technique, and a value of 11.0 ± 2.0% was found.
Mountain software has been used to analyse the 2D images obtained from the SEM. The obtained images were reconstructed in 3D, as shown in Figure 8a,b (top views), using Mountain SEM ® Premium. Particle analysis of the reconstructed images was carried out to detect and quantify the pores present in them, with several features of threshold segmentation, edge and circle detection. The pore volume of the pellet (47.5 mm3·g−1) was calculated from the obtained values, which ultimately helps to find the density of the pellet (3.00 g·cm−3), as reported in Table 3.
Images obtained from the 3D laser microscopy of the NaCl-CeCl3 mixture pellet were processed using MountainMap ® Premium, as shown in Figure 8c,d (tilted view). The particle analysis of the 3D reconstructed image was carried out, and the value of the pore volume obtained was 1.015 (±0.005) mm3. The density of the pellet was calculated using this value and found out to be 2.965 (±0.002) g·cm−3.

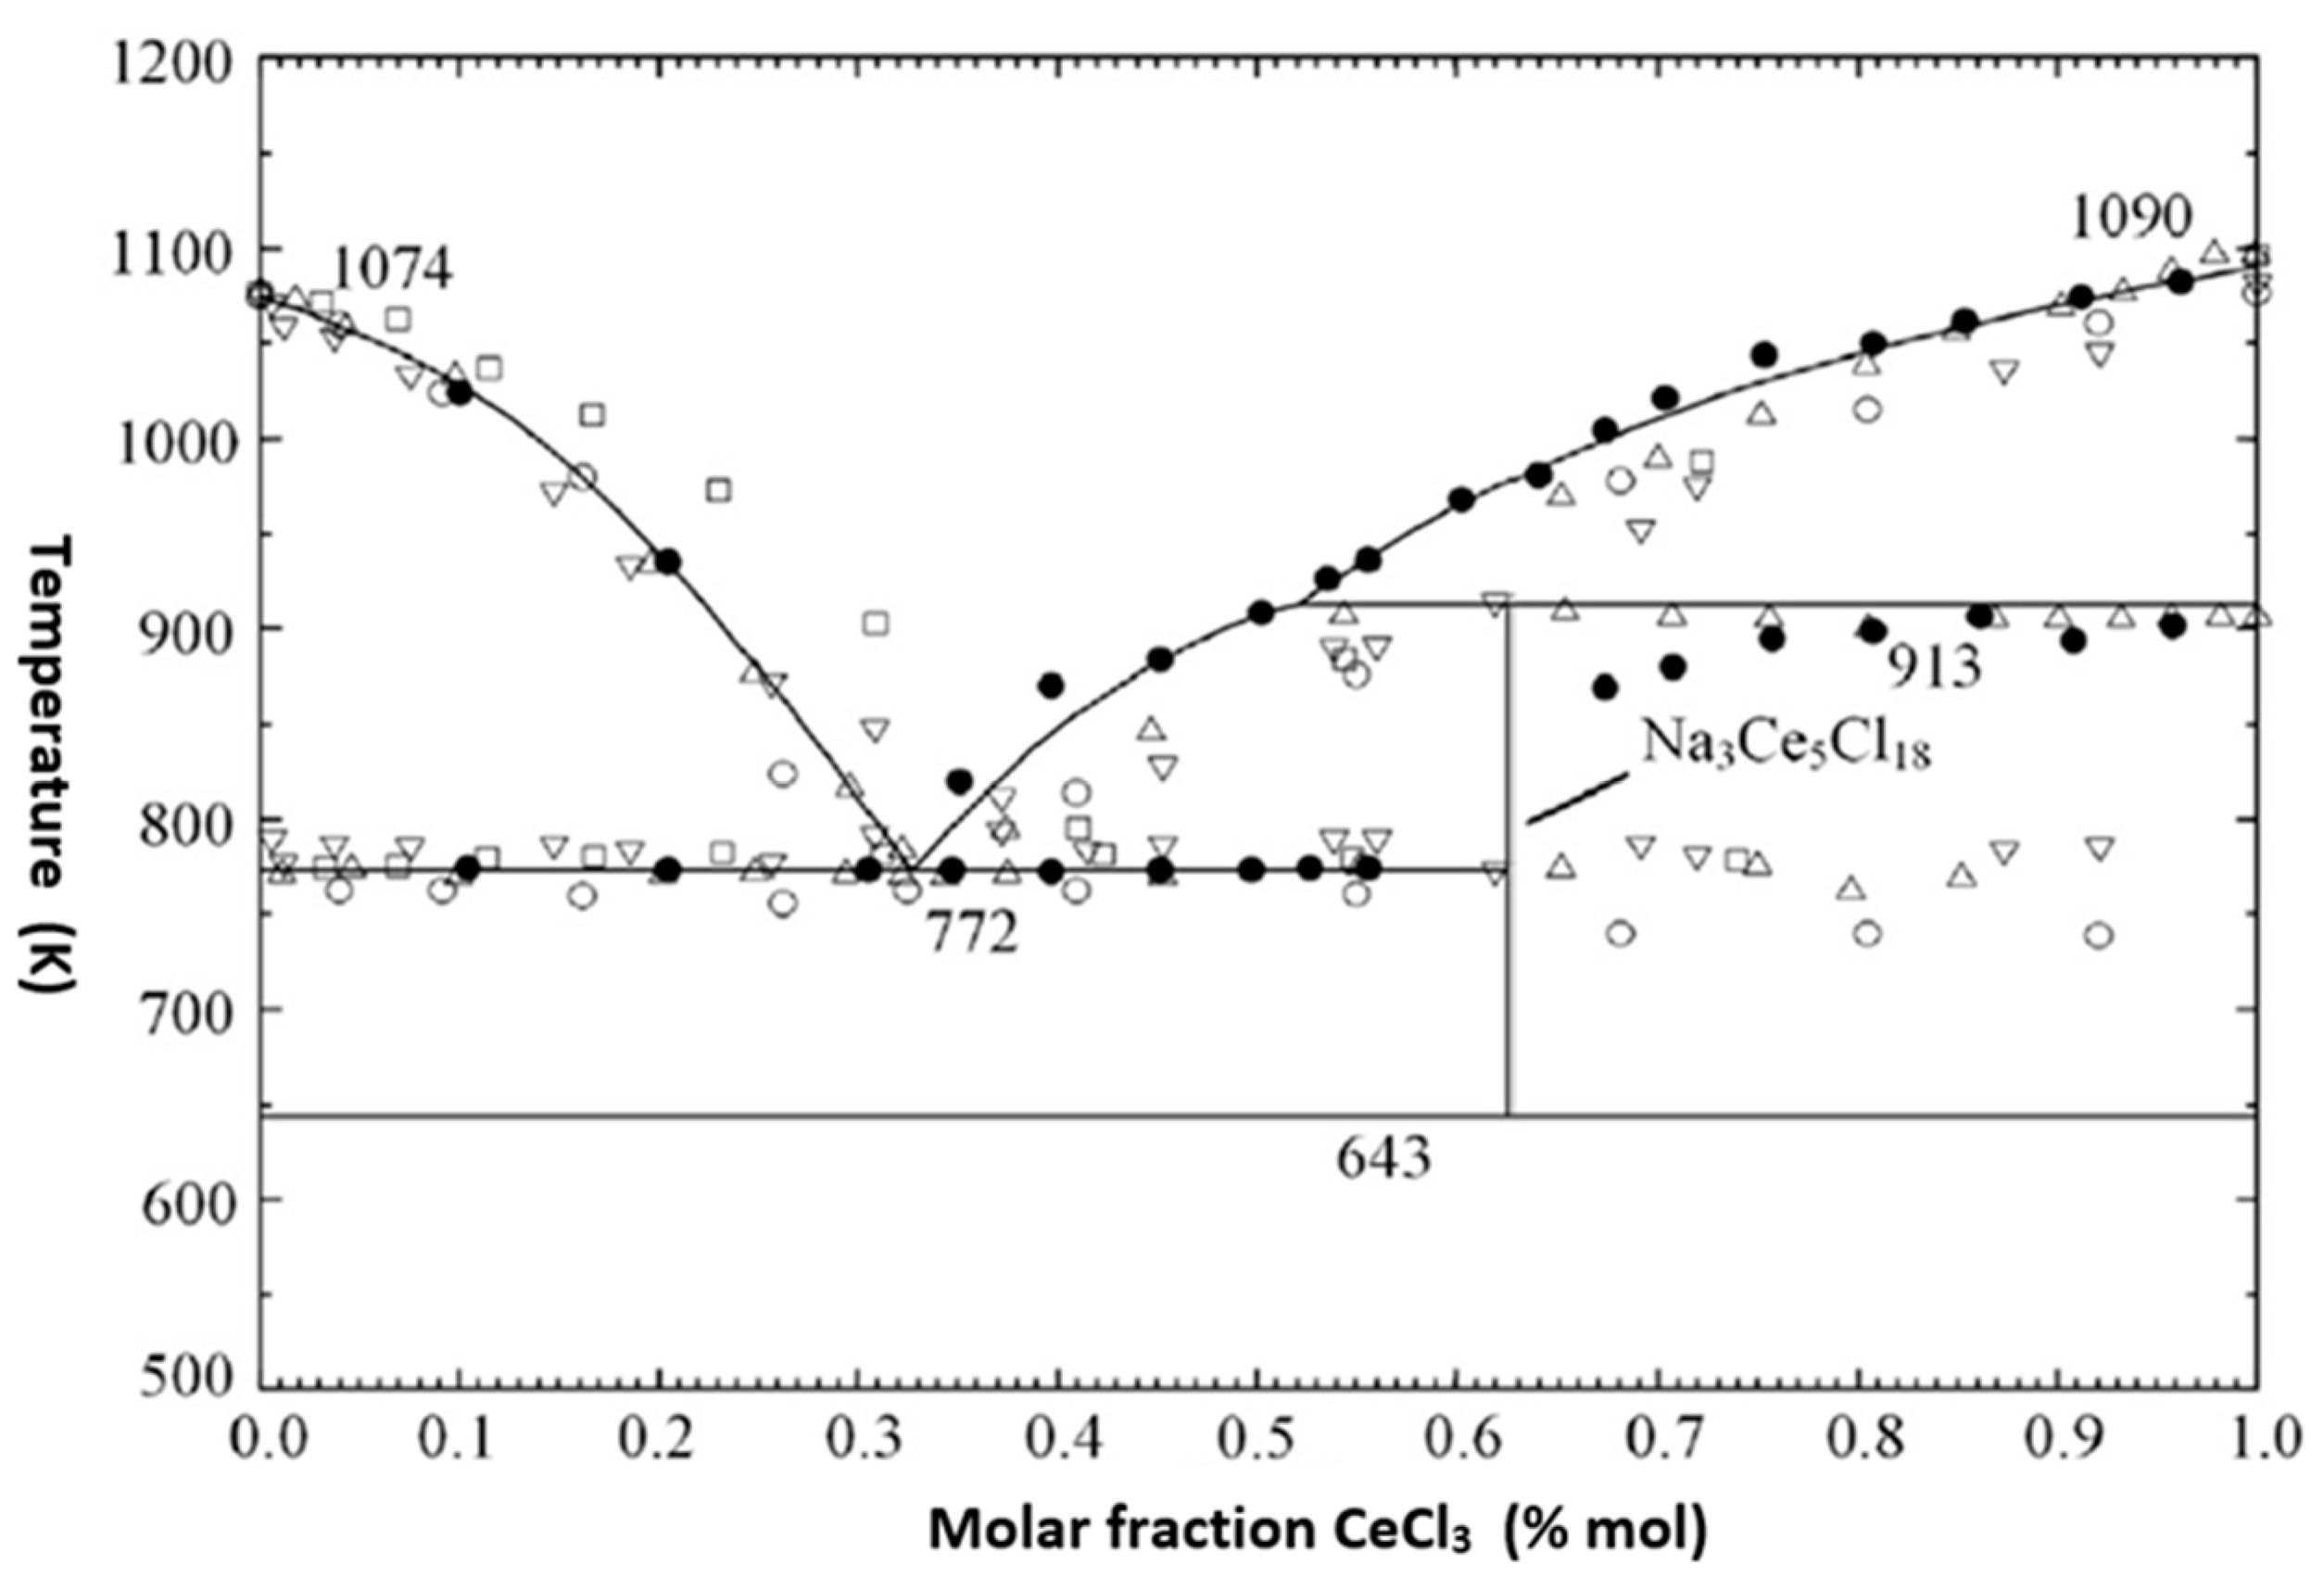
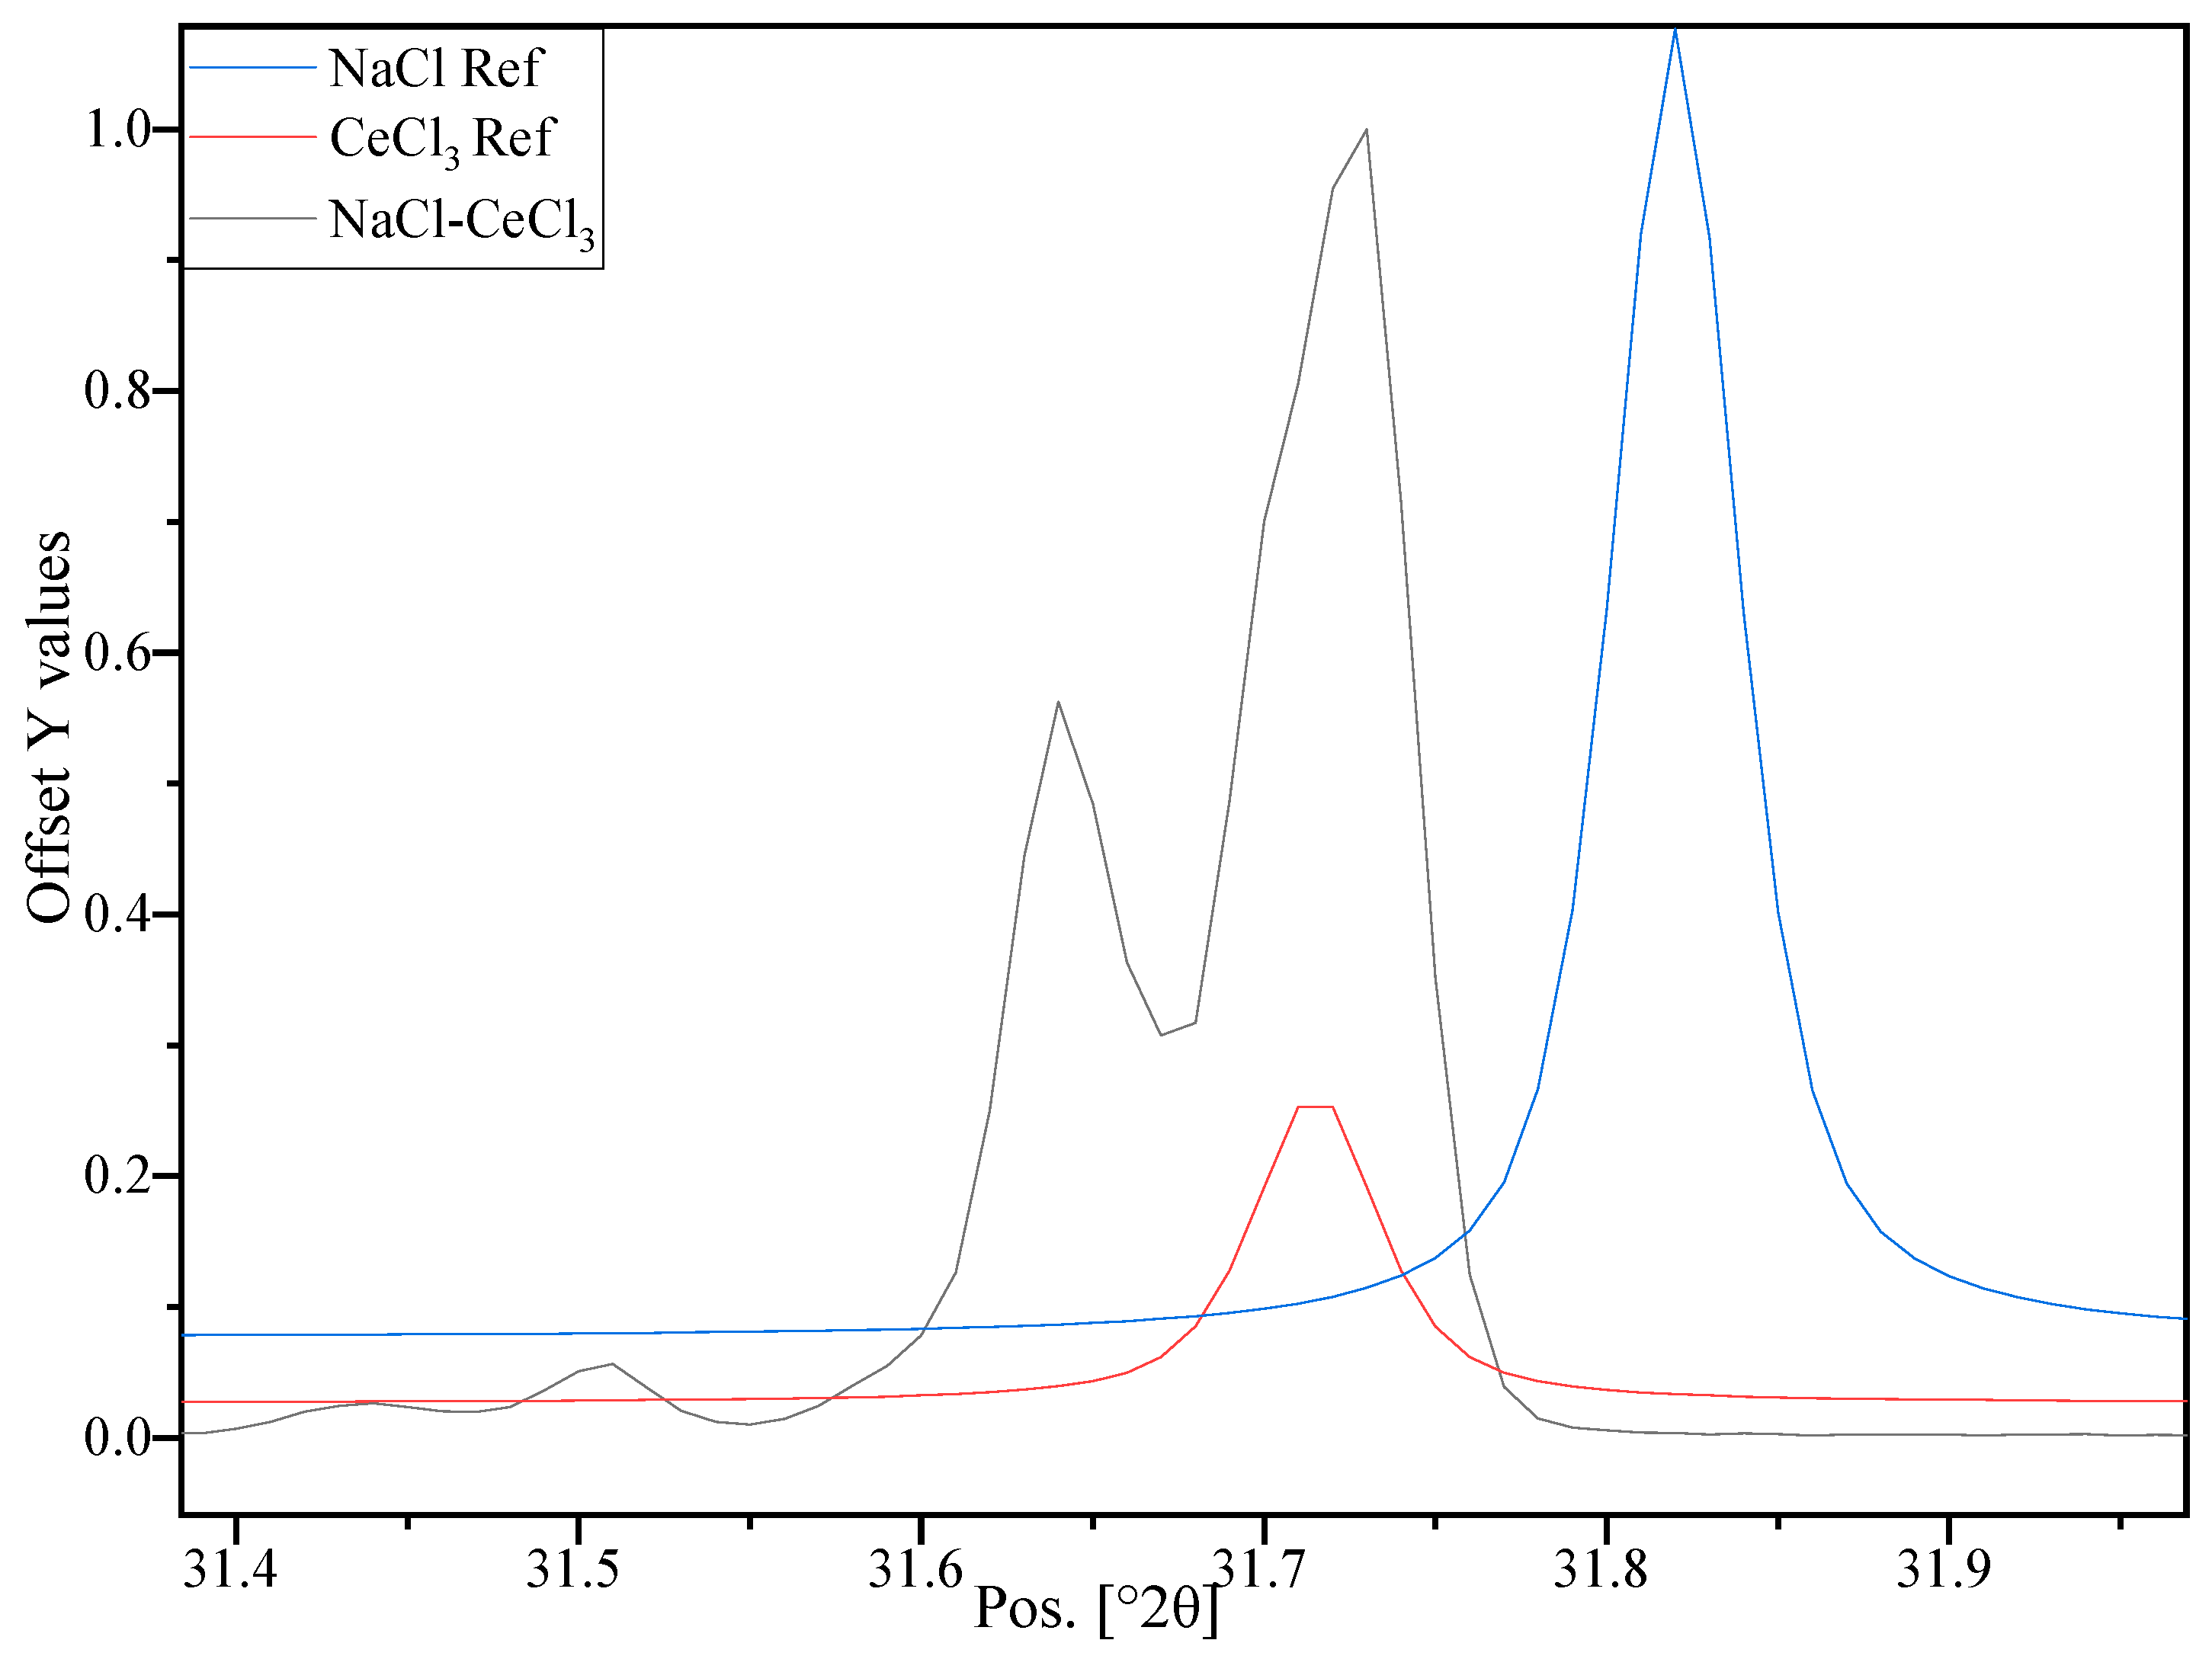
3.4. Investigation at the Nm Level—XRD Investigation

Pellets of the NaCl-CeCl3 mixture were examined by powder XRD. The sample scans were recorded for 2θ between 5 to 80° with a step size of 0.03°. The obtained pattern is shown in Figure 9, along with the peak positions. Figure 9 also shows the obtained scan indexed with pellet material reference patterns. The Miller indices reported on the top of the peaks identify the NaCl and CeCl3 salt components. Figure 10 shows the analysis of the (200) and (111) peaks from the NaCl-CeCl3 mixture (respectively) as compared to the reference patterns. A split was observed in the major peak shape as compared to the pure materials reference patterns. The position of a major peak was observed between the peaks of the reference patterns. After analysing the half width of the height maximum (FWHM) of the peaks and their intensities were measured, which ultimately led to the density measurement using Equations (7)–(10). The XRD has an advantage over surface techniques, as it measures the density at the nanoscale level (grain bulk), directly from the peak intensities of the sample scan. The density calculated from the XRD data is 2.75 ± 0.08 g·cm−3.
Figure 10 shows the analysis of the major peak in the XRD scan of a NaCl-CeCl3 pellet, along with pure materials reference patterns. The major peak of the scan has split and moved to the lower angle as compared to the reference material peaks. Many factors contribute towards this behaviour of the peak, including inhomogeneity of the sample, another phase and degree of swelling due to the amorphous or crystalline structure of the salts in the pellet. The crystallinity of the sample has been calculated by dividing the area of the crystalline peaks by the area of all the peaks after drawing the baseline. After analysing the crystalline peaks and the background of the XRD data, the crystallinity of the sample was found to be 75.3%. Consequently, 24.7% of the green pellet material was affected by defects corresponding to an amorphous material with a lower density than the crystallised grain. This corresponds to a density of 3.13 g·cm−3, as reported in Table 5. This latter value was obtained using Equations (7)–(10).
Table 4 shows the crystal size (ordered crystalline domains) of the peaks in the XRD scan obtained using the Scherrer equation. Here, the crystal mean size must be smaller than or equal to the grain size or the particle size. The shape factor has a typical value of about 0.9 but varies with the actual shape of the crystallite. The line FWHM is corrected from the instrumental line broadening.
By analysing the crystalline peaks of CeCl3 and NaCl, it is found that the average crystal size of CeCl3 in the sample is 58 (±12) nm and 76 (±15) nm for NaCl. The XRD approach considers the fraction of the amorphous part of the salt crystal that can be due to swelling of the sample from mechanical pressing of the pellet.
Table 5 shows the density, relative density and relative porosity of the (NaCl-CeCl3) fuel core assembly, pellets and grains measured using different approaches and techniques. The results obtained are quite close to the literature values [22,25], and these techniques have the advantages of containing the hygroscopic and radioactive samples better than the conventional one. These techniques can be modified for more accurate results by analysis of the fractured parts of the fuel pellet for a better understanding of the core. In addition, the high resolution of TEM could be applied to identify the amorphous and defect rich zone, completing the investigation at the nano level. Combining these techniques with the X-ray computed tomography will provide more detail and better understanding of the cracks/pores/holes/defects trapped inside the material structure.
The overall density of the fuel in the core is then dictated by its theoretical density corrected by the fuel relative density in the core, the relative density in the pellet and the relative density of the grains. This approach is expected to be useful for the neutronic calculations during zero power reactor operation.
The porosity estimated from the pore size distribution is 9.7% from 2D pore imaging by SEM and 10.8% from 3D pore imaging by the LM technique. The precision in both cases is very poor, however.
As expected, the experimental value of the geometrical porosity (about 15%) equals the pellet porosity estimated by 3D interface techniques that include pores (about 10%) plus the grain porosity, which includes defects (about 5%). However, the experimental errors are rather significant requiring some improvement of the analytical work (as suggested by Degueldre 2017 [29]) and the use of TEM and 3D tomographic techniques.

4. Conclusions

A multiscale approach of salt fuel density using structural analyses from the core level (cm scale) to the pellet (mm–µm scale) and to the grain (nm scale) has been applied in an illustrative way. At the core (cm) level, the fuel pin size and separation were analysed in terms of the relative density. As expected, the hexagonal system is more compact than the quadratic one. The space (pitch) between fuel elements (pins) plays a relevant role, however. At the pellet (mm–µm) level, density was measured using 2D and 3D microscopic techniques. These density values were compared with the density calculated from the ideal mixing density model (3.065 g·cm−3). Through density comparison, it is found out that the actual density has 9.7% porosity from the 2D SEM technique and 10.8% from 3D LM technique. However, the porosity values gained from the 2D and 3D techniques depend on the software chosen for the analysis of the data. The investigation carried out at the grain (nm) level using XRD found the porosity of the grain to be 5.9% more than the calculated one. Fuel density in the grain at the nm level can be evaluated on the basis of the XRD data, peak amplitude, broadness and X-ray background. This last approach considers the fraction of the amorphous part of the salt crystal that can be due to the mechanical effect or irradiation-induced swelling. It is concluded that density was sequentially analysed at the core, pellet and grain level. The data are presented in Table 5. The whole study focused on the multiscale investigations of fuel density and concluded that analytical techniques can be used for measuring salt properties at the micro and nanoscale. The investigations were performed as a feasibility study for a ‘zero power reactor experiment’.

Author Contributions

Conceptualisation, S.S. and C.D.; methodology, S.S.; software, S.S.; validation, S.S. and C.D.; formal analysis, S.S.; investigation, S.S. and C.D.; resources, S.S. and S.G.; data curation, S.S.; writing—original draft preparation, S.S.; writing—review and editing, S.S., C.D. and S.G.; visualisation, S.S. and S.G.; supervision, C.D. and S.G.; project administration, S.S. and S.G.; funding acquisition, C.D. All authors have read and agreed to the published version of the manuscript.

Funding

This research was funded by Engineering and Physical Sciences Research Council (EPSRC), grant number EP/V027239/1. The APC was funded by Lancaster University.

Data Availability Statement

The data related to this article are provided in the current manuscript.

Acknowledgments

Nathan Halcovitch, from the Department of Chemistry, Lancaster University, is thanked for the XRD. Richard Wilbraham is thanked for facilitating access to UTGARD laboratory, Lancaster University. An anonymous reviewer is thanked for his constructive comments.

Conflicts of Interest

The authors declare no conflicts of interest.

References

  1. Serp, J.; Allibert, M.; Beneš, O.; Delpech, S.; Feynberg, O.; Ghetta, V.; Heuer, D.; Holcomb, D.; Ignatiev, J.; Kloosterman, L.; et al. The molten salt reactor (MSR) in generation IV: Overview and perspective. Prog. Nucl. Energy 2014, 77, 308–319. [Google Scholar] [CrossRef]
  2. Merk, B.; Litskevich, D.; Whittle, K.R.; Bankhead, M.; Taylor, R.J.; Mathers, D. On a long term strategy for the success of nuclear power. Energies 2017, 10, 867. [Google Scholar] [CrossRef]
  3. Merk, B.; Litskevich, D.; Peakman, A.; Bankhead, M. IMAGINE—A disruptive change to nuclear or how can we make more out of the existing spent nuclear fuel and what has to be done to make it possible in the UK? ATW-Int. J. Nucl. Power 2019, 64, 353–359. [Google Scholar]
  4. Degueldre, C.; Dawson, R.; Najdanovic, V. Nuclear fuel cycle, with a liquid ore and fuel: Toward renewable energy. Sustain. Energy Fuels 2019, 3, 1693–1700. [Google Scholar] [CrossRef]
  5. Choi, E.-Y.; Jeong, S.M. Electrochemical processing of spent nuclear fuels: An overview of oxide reduction in pyroprocessing technology. Prog. Nat. Sci. 2015, 25, 572–582. [Google Scholar] [CrossRef]
  6. Uhlir, J.; Straka, M.; Szatmary, L. Development of pyro-processing technology for thorium-fuelled molten salt reactor. In Proceedings of the 2012 International Congress on Advances in Nuclear Power Plants—ICAPP ’12, Chicago, IL, USA, 24–28 June 2012; p. 2799. Available online: www.osti.gov/biblio/22107867 (accessed on 12 September 2024).
  7. Ren, N.; Wu, Y.; Ma, C.; Song, L. Preparation and thermal properties of quaternary mixed nitrate with low melting point. Sol. Energy Mater. Sol. Cells 2014, 127, 6–13. [Google Scholar] [CrossRef]
  8. Zhu, H. Rare Earth Metal Production by Molten Salt Electrolysis; Springer: New York, NY, USA, 2014. [Google Scholar] [CrossRef]
  9. Vahidi, E.; Zhao, F. Assessing the environmental footprint of the production of rare earth metals and alloys via molten salt electrolysis. Resour. Conserv. Recycl. 2018, 139, 178–187. [Google Scholar] [CrossRef]
  10. Jin, H.; Gu, Q.; Chen, B.; Tang, C.; Zheng, Y.; Zhang, H.; Jaroniec, M.; Qiao, S.-Z. Molten salt-directed catalytic synthesis of 2D layered transition-metal nitrides for efficient hydrogen evolution. Chem 2020, 6, 2382–2394. [Google Scholar] [CrossRef]
  11. Hu, X.; Hu, Y.; Xu, Q.; Wang, X.; Li, G.; Cheng, H.; Zou, X.; Lu, X. Molten salt-promoted Ni-Fe/Al2O3 catalyst for methane decomposition. Int. J. Hydrogen Energy 2020, 45, 4244–4253. [Google Scholar] [CrossRef]
  12. Sang, L.; Cai, M.; Ren, N.; Wu, Y.; Burda, C.; Ma, C. Improving the thermal properties of ternary carbonates for concentrating solar power through simple chemical modifications by adding sodium hydroxide and nitrate. Sol. Energy Mater. Sol. Cells 2014, 124, 61–66. [Google Scholar] [CrossRef]
  13. MacPherson, H.G. The molten salt reactor adventure. Nucl. Sci. Eng. 1985, 90, 374–380. [Google Scholar] [CrossRef]
  14. Forsberg, C.; Wang, D.; Shwageraus, E.; Mays, B.; Parks, G.; Coyle, C.; Liu, M. Fluoride-salt-cooled high-temperature reactor (FHR) using British advanced gas-cooled reactor (AGR) refuelling technology and decay heat removal systems that prevent salt freezing. Nucl. Technol. 2019, 205, 1127–1142. [Google Scholar] [CrossRef]
  15. Cisneros, A.T.; Czerwinski, K.; El-dasher, B.S.; Kerlin, W.M.; Kramer, K.; Latkowski, J.F.; Petroski, R.C.; Walter, J.C. Molten Nuclear Fuel Salts and Related Systems and Methods. U.S. Patent US20160189813A1, 30 June 2016. [Google Scholar]
  16. Advanced Reactors Information System (ARIS), Advances in Small Modular Reactor Technology Developments; Technical Report; IAEA: Vienna, Austria, 2018.
  17. Merk, B.; Detkina, A.; Litskevich, D.; Patel, M.; Noori-kalkhoran, O.; Cartland-Glover, G.; Efremova, O.; Bankhead, M.; Del Nevo, C.A. A First Step towards Zero Nuclear Waste—Advanced Strategic Thinking in Light of iMAGINE. Energies 2022, 15, 7209. [Google Scholar] [CrossRef]
  18. Capelli, E.; Bene, O.; Beilmann, M.; Konings, R. Thermodynamic investigation of the LiF-ThF4 system. J. Chem. Thermodyn. 2013, 58, 110–116. [Google Scholar] [CrossRef]
  19. Lu, G.; Robelin, C.; Chartrand, P.; He, M.; Wang, K. Thermodynamic evaluation and optimization of the (LiCl + NaCl + KCl + MgCl2 + CaCl2 + CeCl3) system. Fluid Phase Equilibria 2019, 487, 83–97. [Google Scholar] [CrossRef]
  20. Barner, H.E.; Scheuerman, R.V. Handbook of Thermochemical Data for Compounds and Aqueous Species; Wiley-Interscience: New York, NY, USA, 1978. [Google Scholar]
  21. Chartrand, P.; Sharma, R.; Talley, P.; Pelton, A. Coupled thermodynamic phase diagram optimizations. Calphad 1996, 20, 231–246. [Google Scholar]
  22. Janz, G.J. Thermodynamic and transport properties for molten salts: Correlation equations for critically evaluated density, surface tension, electrical conductance, and viscosity data. J. Phys. Chem. Ref. Data 1988, 17, 311. [Google Scholar]
  23. Fredrickson, G.L.; Cao, G.; Gakhar, R.; Yoo, T.-S. Molten Salt Reactor Salt Processing–Technology Status; Technical Report; Idaho National Lab. (INL): Idaho Falls, ID, USA, 2018. [Google Scholar]
  24. Beneš, O.; Konings, R. 3.13—Molten salt reactor fuel and coolant. In Comprehensive Nuclear Materials; Konings, R.J., Ed.; Elsevier: Oxford, UK, 2012; pp. 359–389. [Google Scholar]
  25. Mariani, R.D.; Vaden, D. Modeled salt density for nuclear material estimation in the treatment of spent nuclear fuel. J. Nucl. Mater. 2010, 404, 25–32. [Google Scholar] [CrossRef]
  26. Fermi, E. Experimental Production of a Divergent Chain Reaction. Am. J. Phys. 1952, 20, 536–558. [Google Scholar] [CrossRef]
  27. Yum, S.; Hursin, M.; Vasiliev, A.; Vinai, P.; Mylonakis, A.G.; Demazière, C.; Macián-Juan, R. Uncertainty analyses of neutron noise simulations in a Zero-Power reactor. Ann. Nucl. Energy 2022, 174, 109157. [Google Scholar] [CrossRef]
  28. Al-Jaroudi, S.S.; Ul-Hamid, A.; Abdul-Rashid, I.M.; Saner, S. Use of X-ray powder diffraction for quantitative analysis of carbonate rock reservoir samples. Powder Technol. 2007, 175, 115–121. [Google Scholar] [CrossRef]
  29. Degueldre, C. The Analysis of Nuclear Materials and Their Environment; Springer: Berlin/Heidelberg, Germany, 2017; p. 300. [Google Scholar]
Figure 1. Phase diagram of the NaCl-CeCl3 system adapted from Lu et al. [19], copyright 2019, with permission from Elsevier.
Jne 05 00026 g001
Figure 2. Cross-section through packing of the fuel pin bunch: (a) hexagonal system; (b) quadratic system.
Jne 05 00026 g002
Figure 3. Relative fuel density as a function of half pitch for quadratic (Dq) and hexagonal (Dh) systems: (a) lin-lin; (b) log-log. Radius of the fuel pellet: 3.5 mm. Cladding and coating domains are underlined.
Jne 05 00026 g003aJne 05 00026 g003b
Figure 4. SEM micrographs of a NaCl-CeCl3 powder pressed pellet mixture of composition of NaCl (70 mol%) and CeCl3 (30 mol%). (a) Indicative view, backscattered contrast, grey scale. (b) Backscattered contrast of the view (a): NaCl (turquoise), CeCl3 (pink) and porosity/voids (background, dark blue). (c) Indicative grey-scale grey image (higher magnification). (d) Backscattered contrast: NaCl (turquoise), CeCl3 (pink) and porosity/voids (background, dark blue).
Jne 05 00026 g004
Figure 5. Normalised pore size distribution from SEM images (a) and normalised distribution slope (b).
Jne 05 00026 g005
Figure 6. SEM-EDX mapping of NaCl-CeCl3 mixture pellet.
Jne 05 00026 g006
Figure 7. Three-dimensional laser microscopy of the NaCl-CeCl3 mixture pellet: (a) coloured image of the interface, (b) peaks on the surface, (c) valleys, (d) peaks and valleys, (e) height map, (f) height profile showing valleys below the average surface; composition NaCl (70 mol%) and CeCl3 (30 mol%).
Jne 05 00026 g007
Figure 8. Three-dimensional reconstructed images of (a) SEM micrographs of the NaCl-CeCl3 mixture of Figure 4a, (b) SEM micrographs of the NaCl-CeCl3 mixture of Figure 4c, (c) LM micrograph of the NaCl-CeCl3 mixture of Figure 7a and (d) LM micrograph of the NaCl-CeCl3 mixture of Figure 7a.
Jne 05 00026 g008
Figure 9. XRD scan of a NaCl-CeCl3 mixture pellet, along with the peak positions indexed using pellet material references. Composition: NaCl (70 mol%) and CeCl3 (30 mol%).
Jne 05 00026 g009
Figure 10. Peak detail analysis of the scans obtained from the NaCl-CeCl3 mixture pellet with the pure materials reference patterns. Composition: NaCl (70 mol%) and CeCl3 (30 mol%).
Jne 05 00026 g010
Table 1. Theoretical density and pellet density of NaCl-CeCl3 simulated fuel, assuming 5% porosity. Conditions: composition NaCl (70 mol%) and CeCl3 (30 mol%) 5% porosity.
Pellet ComponentsHeight (mm)Radius (mm)Volume (mm3)Density (g·cm−3)Mass (g)Material TD * (g·cm−3)Porosity (Φ)Mexp (g)Pellet Density
(g·cm−3)
70% NaCl0.71
(±0.01)
3.5
(±0.01)
27.32
(±0.53)
2.1600.02102
(±0.003)
3.325
(±0.003)
0.050.01997
(±0.003)
3.16
(±0.29)
30% CeCl33.9700.06983
(±0.003)
0.050.06634
(±0.003)
* TD: theoretical density.
Table 2. Pellet density (D) of the NaCl-CeCl3 pellet based on the actual weight of each salt component in the salt mixture. Conditions: composition NaCl (70 mol%) and CeCl3 (30 mol%).
Pellet ComponentsHeight (mm)Radius (mm)Volume (mm3)Mass (g)Pellet Density (g·cm−3)
70% NaCl0.71 (±0.01)3.5 (±0.01)27.32 (±0.53)0.028 (±0.003) 2.855 (±0.280)
30% CeCl30.050 (±0.003)
Table 3. Pellet density of the NaCl-CeCl3 material based on the actual weight of each salt component in the salt mixture compared with the density from surface investigation techniques (2D SEM and 3D LM) using Mountain ® software. Composition: NaCl (70 mol%) and CeCl3 (30 mol%).
Pellet ComponentsHeight (mm)Radius (mm)Volume (mm3)Mass (g)Density (g·cm−3)Pore Volume (mm3)Density (g·cm−3)
70% NaCl0.71 (±0.01)3.50 (±0.01)27.32 (±0.53)0.028 (±0.003)2.855 (±0.280)1.329 (±0.05)
2D/SEM
3.00 (±0.23)
30% CeCl30.050 (±0.003)1.015 (±0.005)
3D/LM
2.97 (±0.23)
Table 4. Crystal size derived from the peak’s properties gained from XRD scans of a composition NaCl (70 mol%) and CeCl3 (30 mol%) mixture pellet.
Diffraction Angle
2θ (°) ± 0.01
ComponentMiller Indices
(hkl)
FWHM
(°) ± 0.020
Crystal Size
(nm) ± 20%
13.67CeCl3(100)0.15751
23.88CeCl3(110)0.18145
24.72CeCl3(101)0.15154
27.55CeCl3(200)0.14457
31.71CeCl3(111)0.09686
34.74CeCl3(201)0.14657
45.41NaCl(220)0.11376
Table 5. Comparison of the simulated fuel densities estimated or measured over the scale explored in this study. Material composition: NaCl (70 mol%) and CeCl3 (30 mol%); NaCl density: 2.16 g·cm−3 and CeCl3: 3.97 g·cm−3.
Level Theoretical/MaterialFuel in Core/AssemblyGeometrical Density/Pellet2D SEM/Pellet3D LM/PelletXRD/Grains
Parameter
Density (g·cm−3)3.325# 3.0162.855 ± 0.282.51 ± 0.052.54 ± 0.053.13 ± 0.08
* 3.001 ± 0.23* 2.965 ± 0.23
Relative density (%)100.00# 90.785 ± 8.575.5 ± 2.076.4 ± 2.094.1 ± 3.0 °
* 90.3 ± 7.0* 89.2 ± 7.0
Porosity/void fraction (%)0.00# 9.315.0 ± 8.524.5 ± 2.023.6 ± 2.05.9 ± 3.0
* 9.7 ± 7.0* 10.8 ± 7.0
Size Objectdmcmmmµmµmnm
BulkCorePelletSurfaceInterfaceGrain
# Compact hexagonal with a pitch size of 0 cm; * Data analysed using Mountain Software; ° Assuming ±3% precision.
Disclaimer/Publisher’s Note: The statements, opinions and data contained in all publications are solely those of the individual author(s) and contributor(s) and not of MDPI and/or the editor(s). MDPI and/or the editor(s) disclaim responsibility for any injury to people or property resulting from any ideas, methods, instructions or products referred to in the content.

