1. Introduction
Staphylococcus aureus is a Gram-positive bacterium that occurs as a common member of microbiota of the body and is usually present in clinical sites across the world [
1]. About 30% of humans are asymptomatic carriers of
S. aureus in their upper respiratory tract [
2]. Additionally, around 80% of invasive
S. aureus infections arise from a strain of hosts’ microflora [
3]. Clinical diseases caused by
S. aureus infections range from mild to severe and may be manifested in the form of pneumonia, osteomyelitis, skin and deep tissue infections. The treatment of
S. aureus infections is becoming increasingly difficult due to antibiotic resistance. Antibiotic resistance does not only harm human health but also affects the economy of developing and developed countries [
4]. Every year, 95,000 invasive multidrug-resistant
S. aureus infections occur in the United States alone [
2]. According to WHO assessments, infections of multidrug-resistant
S. aureus account for more than 25,000 deaths each year, which will grow to a whopping 10 million in 2050 [
4]. An extremely virulent antibiotic-resistant strain of
S. aureus is the ampicillin-resistant strain [
5]. Several pharmaceutical formulations such as penicillins, sulfonamides, tetracyclines and glycopeptides are available for the treatment of
S. aureus infections. These antibiotics show several side effects and are expensive, especially in developing countries such as Pakistan, India and Bangladesh. Most importantly, resistance is developing against these potent antibiotics. To overcome these effects, bionanoformulations have been designed.
Nanotechnology is a developing division of pharmaceutical science wherein the particles are restricted to the nanosize [
6,
7]. Nanoparticles prepared via various physical and chemical methods are not highly recommended due to their toxic effects; however, those prepared via biological methods are preferred due to beneficial features including cost-effectiveness, biocompatibility, biodegradability and eco-friendliness, and green synthesis affords a good source for high productivity and purity, because toxic chemicals and hazardous substances are avoided in the manufacturing process of nanoparticles [
8].
Metallic nanoparticles are used for different pharmaceutical, agricultural and medicinal applications [
9]. Their essential features, such as physicochemical properties and electronic and optics properties, can be fine-tuned by altering the characterization of nanoparticles, for example, regarding their aspect format, size and shape [
10]. Numerous metals and their oxides are being used in biological systems as nanoparticles because of their easy production and promising optical properties [
11]. Moreover, metals derived from plants have extreme potential to improve human health if applied in the agricultural, food and biomedical fields [
12].
Green synthesis is the amalgamation of nanoparticles with plants and their metabolites. In green nanotechnology, biological substances are utilized to formulate nanoparticles for pharmaceutical purposes and other applications. The synthesis of nanoparticles via green biological methods is highly beneficial because the method has the ability to curtail the toxic effects of nanoparticles [
6]. Gold nanoparticles synthesized via green nanotechnology are biocompatible and biodegradable, as these nanoparticles are obtained from natural plant sources, and no toxic chemical agent is consumed during preparation [
13]. Green nanoparticles are economical as compared to conventional brands of drugs.
Antibacterial agents are basically significant in decreasing the load of infectious disorders. The development and spread of multidrug-resistant strains of pathogenic bacteria represent a significant and lethal public health hazard, as there are few or sometimes even no effective antibacterial agents accessible for the infection produced by resistant pathogenic bacteria [
14]. There is an ultimate need to develop a potent therapeutic agent for the treatment of such lethal pathogenic infections. We prepared and characterized gold nanoparticles from CSE and CNW and investigated the newly developed nanodrug against deadly
S. aureus infections.
2. Materials and Methods
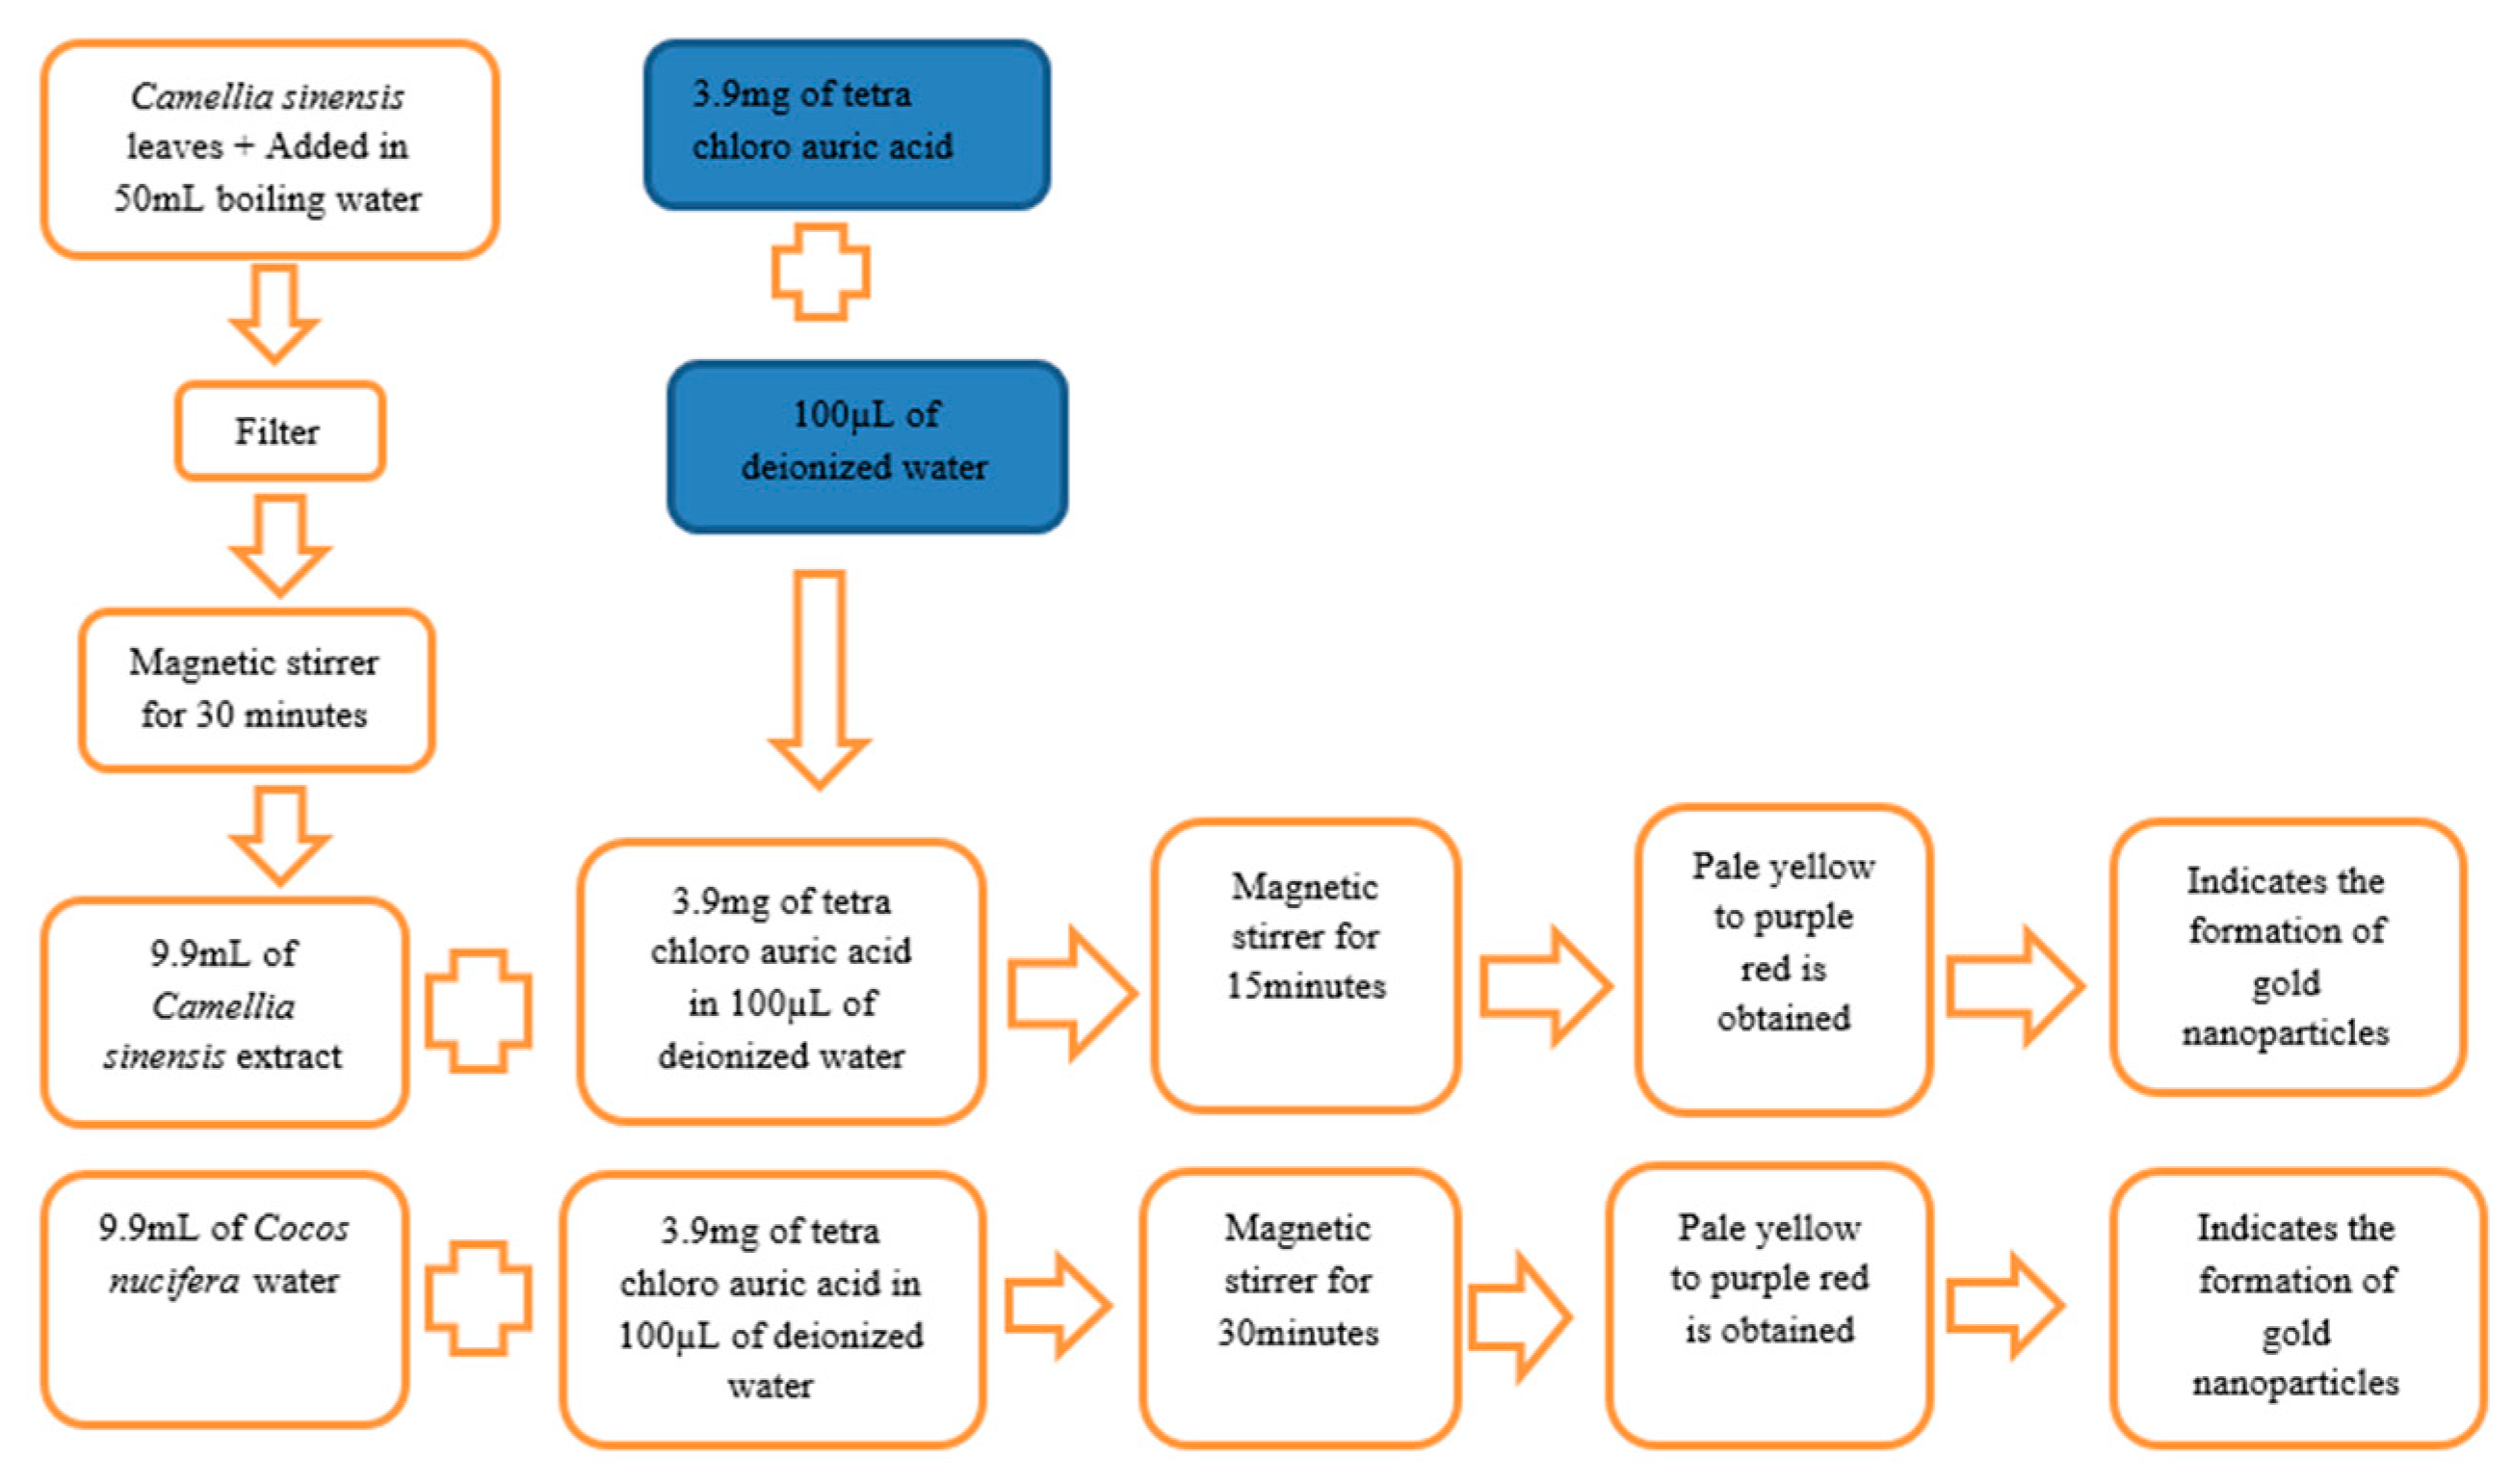
Preparation of Camellia sinensis extracts (CSEs):
Here, 1 g of
Camellia sinensis leaves was added to 50 mL of boiling water, the extract was filtered, and then the leaves were stirred with the help of a magnetic stirrer for 30 min [
10].
Preparation of Tetra chloro auric acid solution:
A total of 3.9 mg of tetra chloro auric acid was weighed and mixed with 100 µL of deionized water.
Preparation of gold nanoparticles via CS plant:
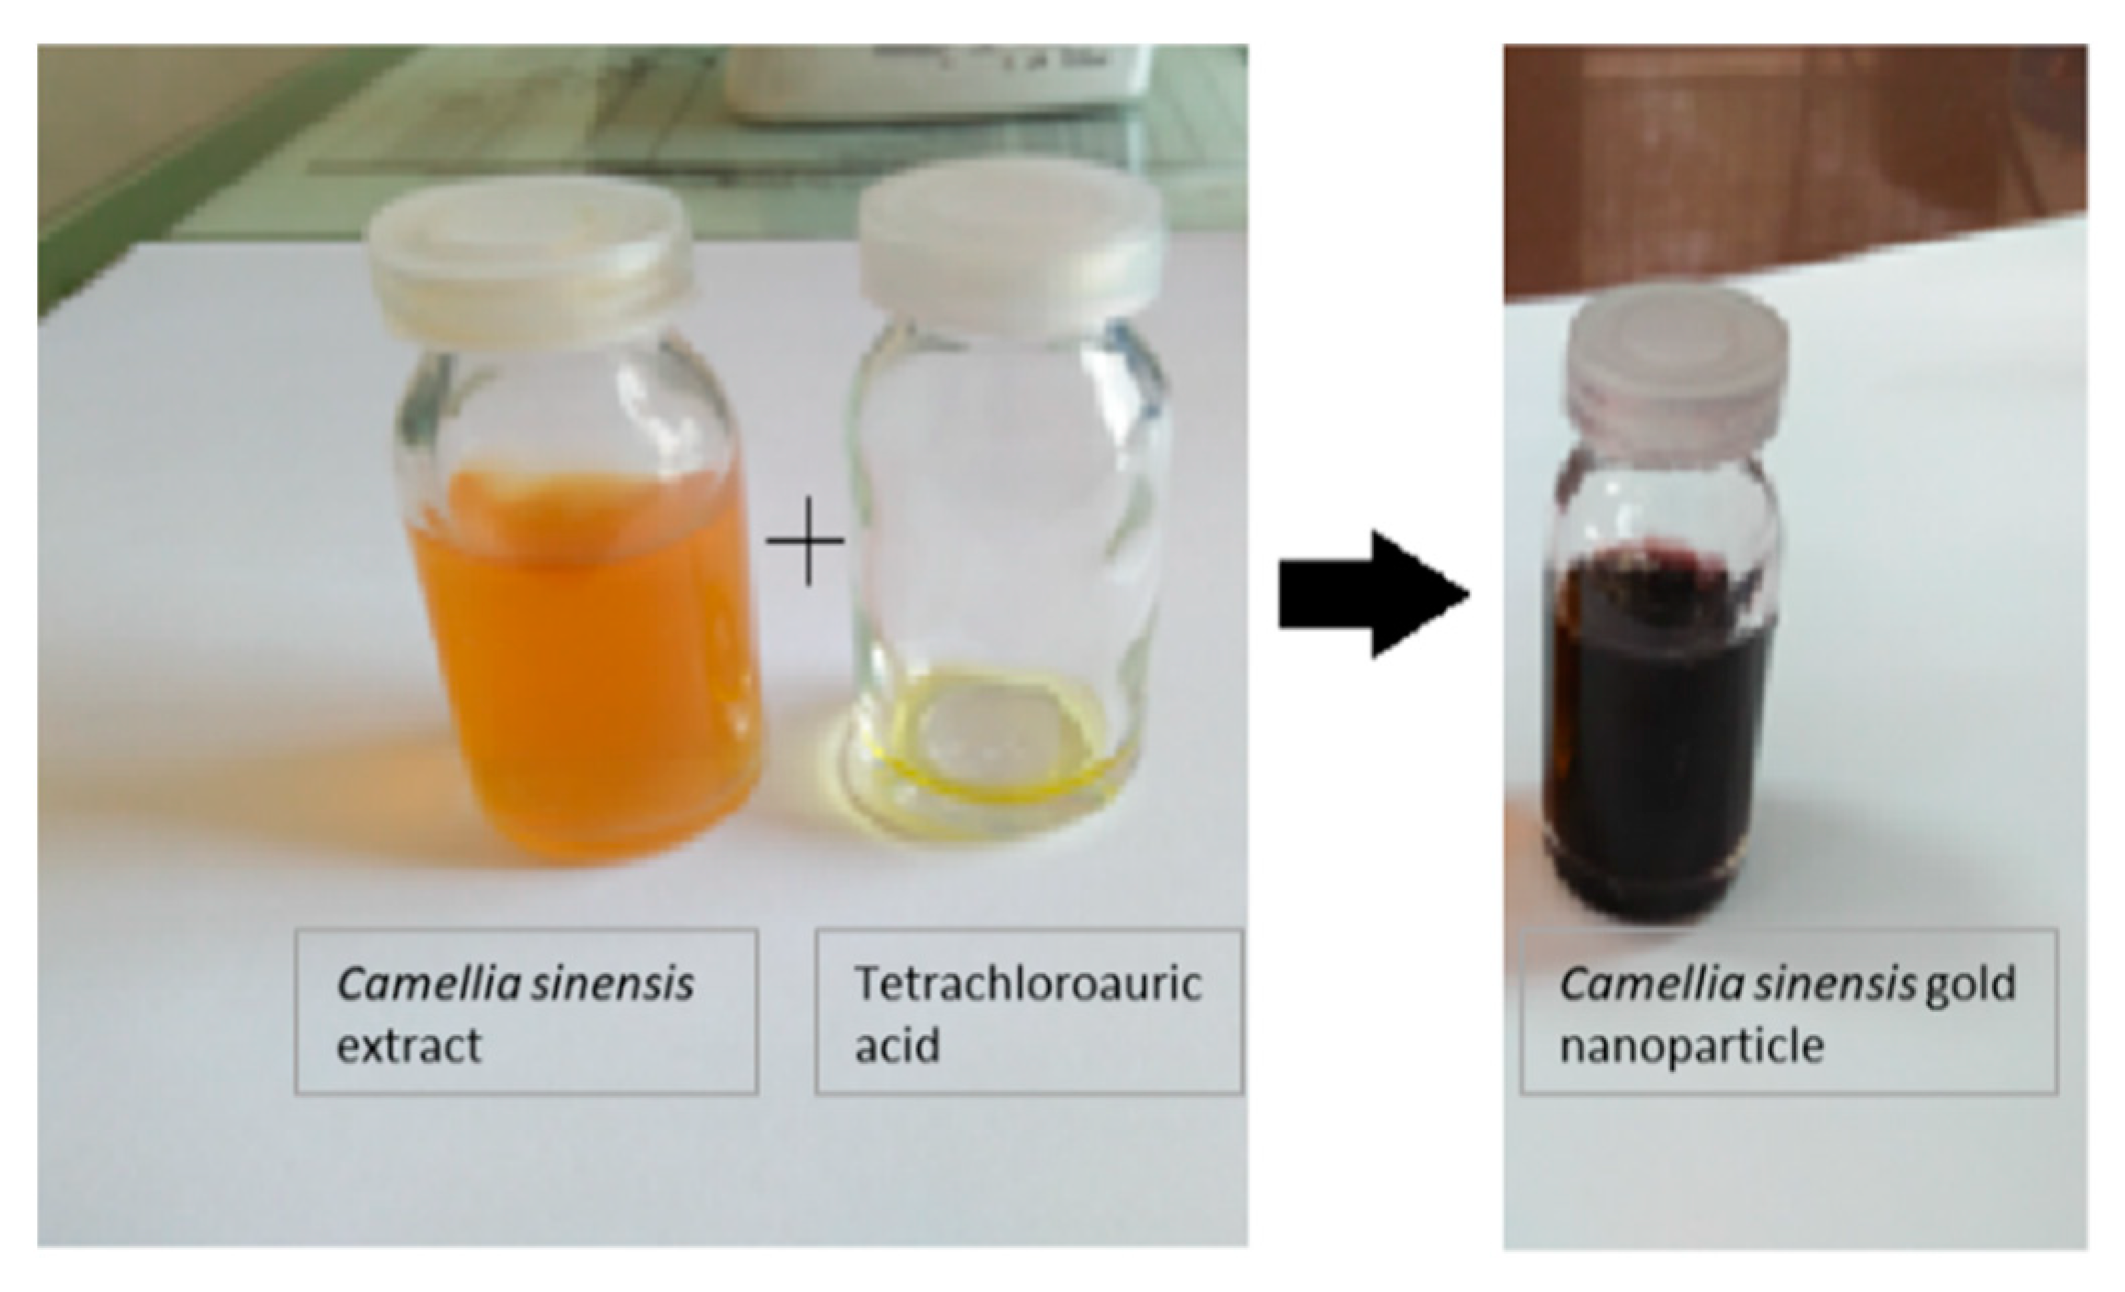
Camellia sinensis extract (9.9 mL) was placed in a beaker, and 3.9 mg of tetra chloro auric acid was added in 100µL of deionized water. This solution was stirred with the help of a magnetic stirrer for 15 min. The color of this solution initially changed from pale yellow to a purple red color, and this indicated the formation of gold nanoparticles. Additionally, this solution was mixed for 20 min.
Preparation of gold nanoparticles via CN plant:
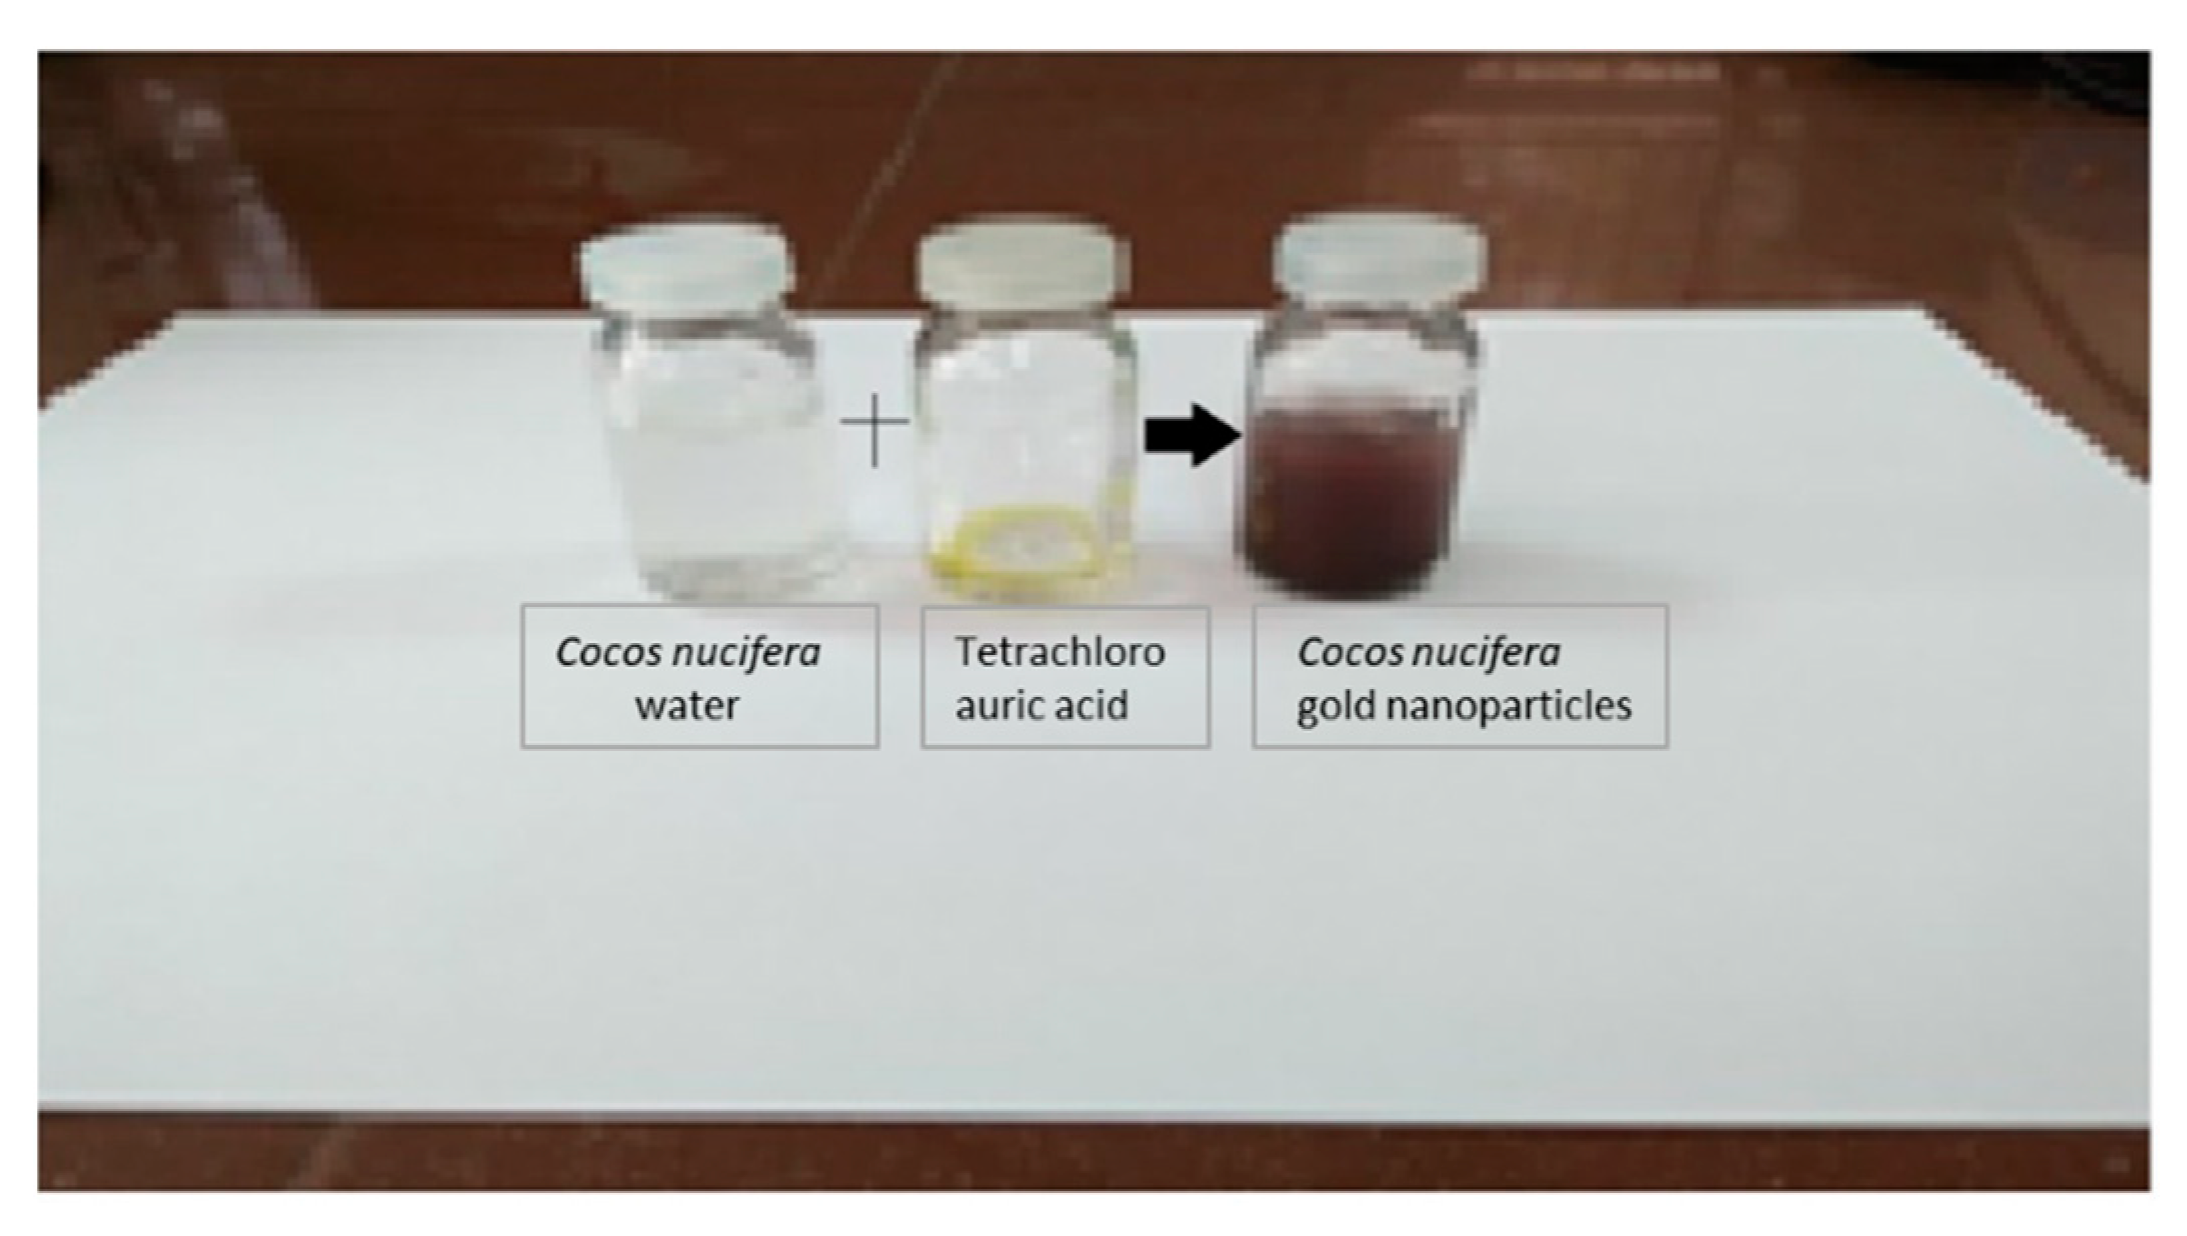
Cocos nucifera water (9.9 mL) was placed in a beaker, and 3.9 mg of tetra chloro auric acid was added in 100µL of deionized water. This solution was stirred with the help of a magnetic stirrer for 30 min. The color of this solution initially changed from pale yellow to a purple red color, and this indicated the formation of gold nanoparticles. Additionally, this solution was mixed for 20 min. The preparation of green gold nanoparticles from
Camellia sinensis and
Cocos nucifera is summarized in
Figure 1.
Dynamic light scattering:
Dynamic light scattering (DLS) was used to define the size dispersal profile of the gold NPs.
UV-Visible spectroscopy:
UV-Visible spectroscopy (UV-Vis spectroscopy) was used to determine the absorbance of the gold nanoparticles.
Fourier transform infrared spectroscopy:
Fourier transform infrared spectroscopy (FTIR) was used to provide information on the chemical composition and physical state of the gold NPs.
Scanning electron microscopy:
Scanning electron microscopy (SEM) was used to produce images of a sample by scanning the surface with a focused beam of electrons.
Transmission electron microscopy:
Transmission electron microscopy (TEM) (200 kV) was used to check the images of the gold NPs.
Energy-dispersive X-ray spectroscopy:
Energy-dispersive X-ray spectroscopy (XRD) was used to determine the crystallographic structure of the nanoparticles.
Antimicrobial activity:
The zone of inhibition was calculated using the well diffusion method on an agar plate. The pathogenic bacteria
Staphylococcus aureus was grown overnight at 4 °C on Mueller Hinton agar plates. Each bacterium was grown on its own sterile Mueller Hinton agar plate in this process. Using sterile cotton swabs, pathogenic bacteria were coated on the agar plate, and these plates were dried. A sterile well cutter (6 mm in diameter) was used to drill wells in each agar plate. The nanoparticle suspension was poured into the wells. For full diffusion, these plates were placed for 1 h and then incubated at 37 °C for 1 day, and the diameter of the inhibitory zones was measured in mm [
15].
Minimum inhibitory concentration (MIC):
A standard inoculum (10
5 CFU/mL) for the determination of the MICs was prepared using the Broth Micro Dilution method. A microtitration plate with 96 wells was filled with nutrient broth. Leaving one positive control and one negative control, serial two-fold dilutions of gold nanoparticles in concentrations ranging from 3.9 mg/µL, 10 mg/µL, 30 mg/µL and 50 mg/µL with adjusted bacterial concentrations were used to determine the MICs. This experiment incorporated a positive control with a nutrient broth medium and inoculum and a negative control with a nutrient broth medium. The plate was incubated at 37 °C and observed for 24 h. Optical density (OD) values before and after incubation were measured at a 625 nm wavelength using a spectrophotometer. The net OD value was determined and compared with the cutoff value to find the minimum inhibitory concentration of these preparations of gold nanoparticles [
16].
4. Discussion
Gold nanoparticles prepared using green plants do not require any external chemical agents for the reduction and stabilization of the nanoparticles. Phytochemical substances present in CNW or CSE are responsible for the formation of coatings on gold nanoparticles, and these nanoparticles are stable against agglomeration.
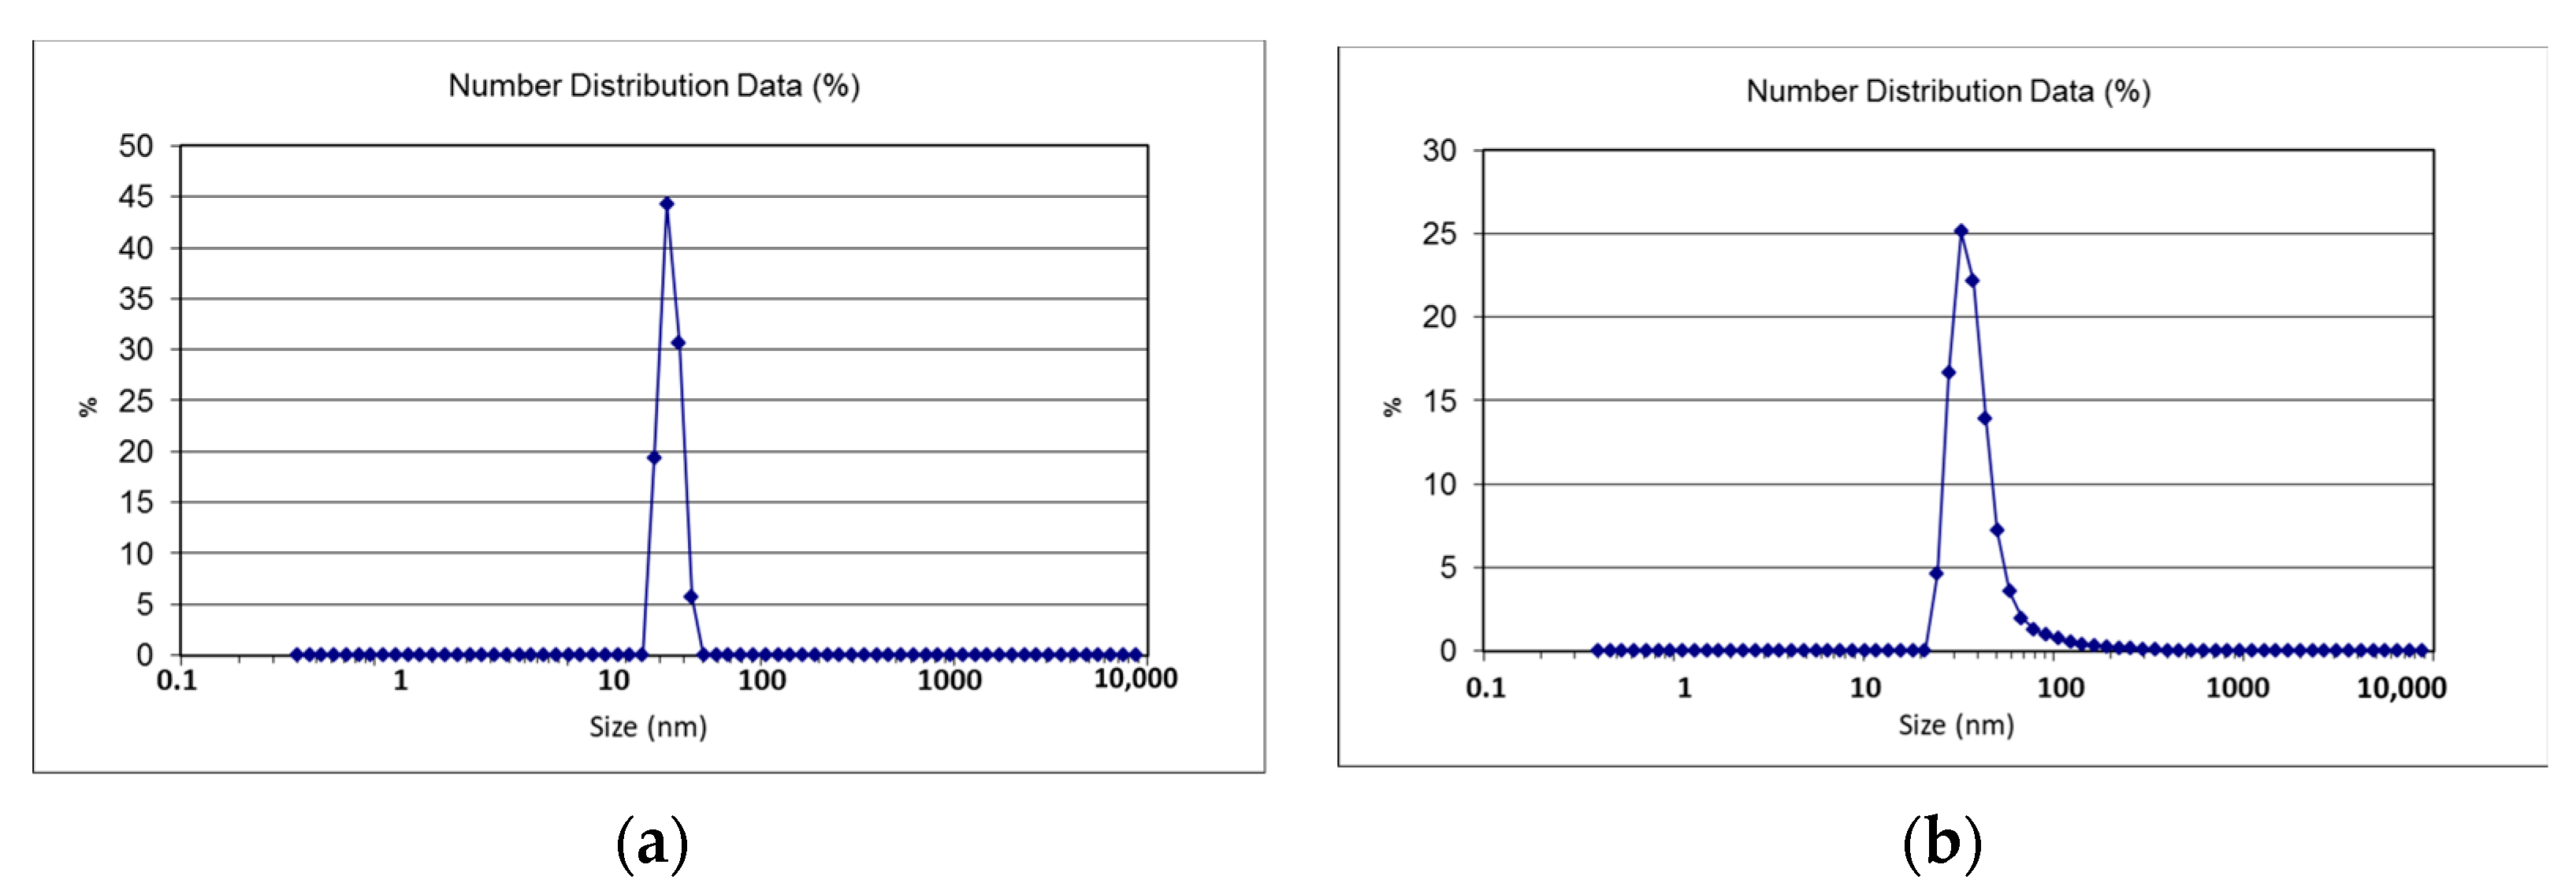
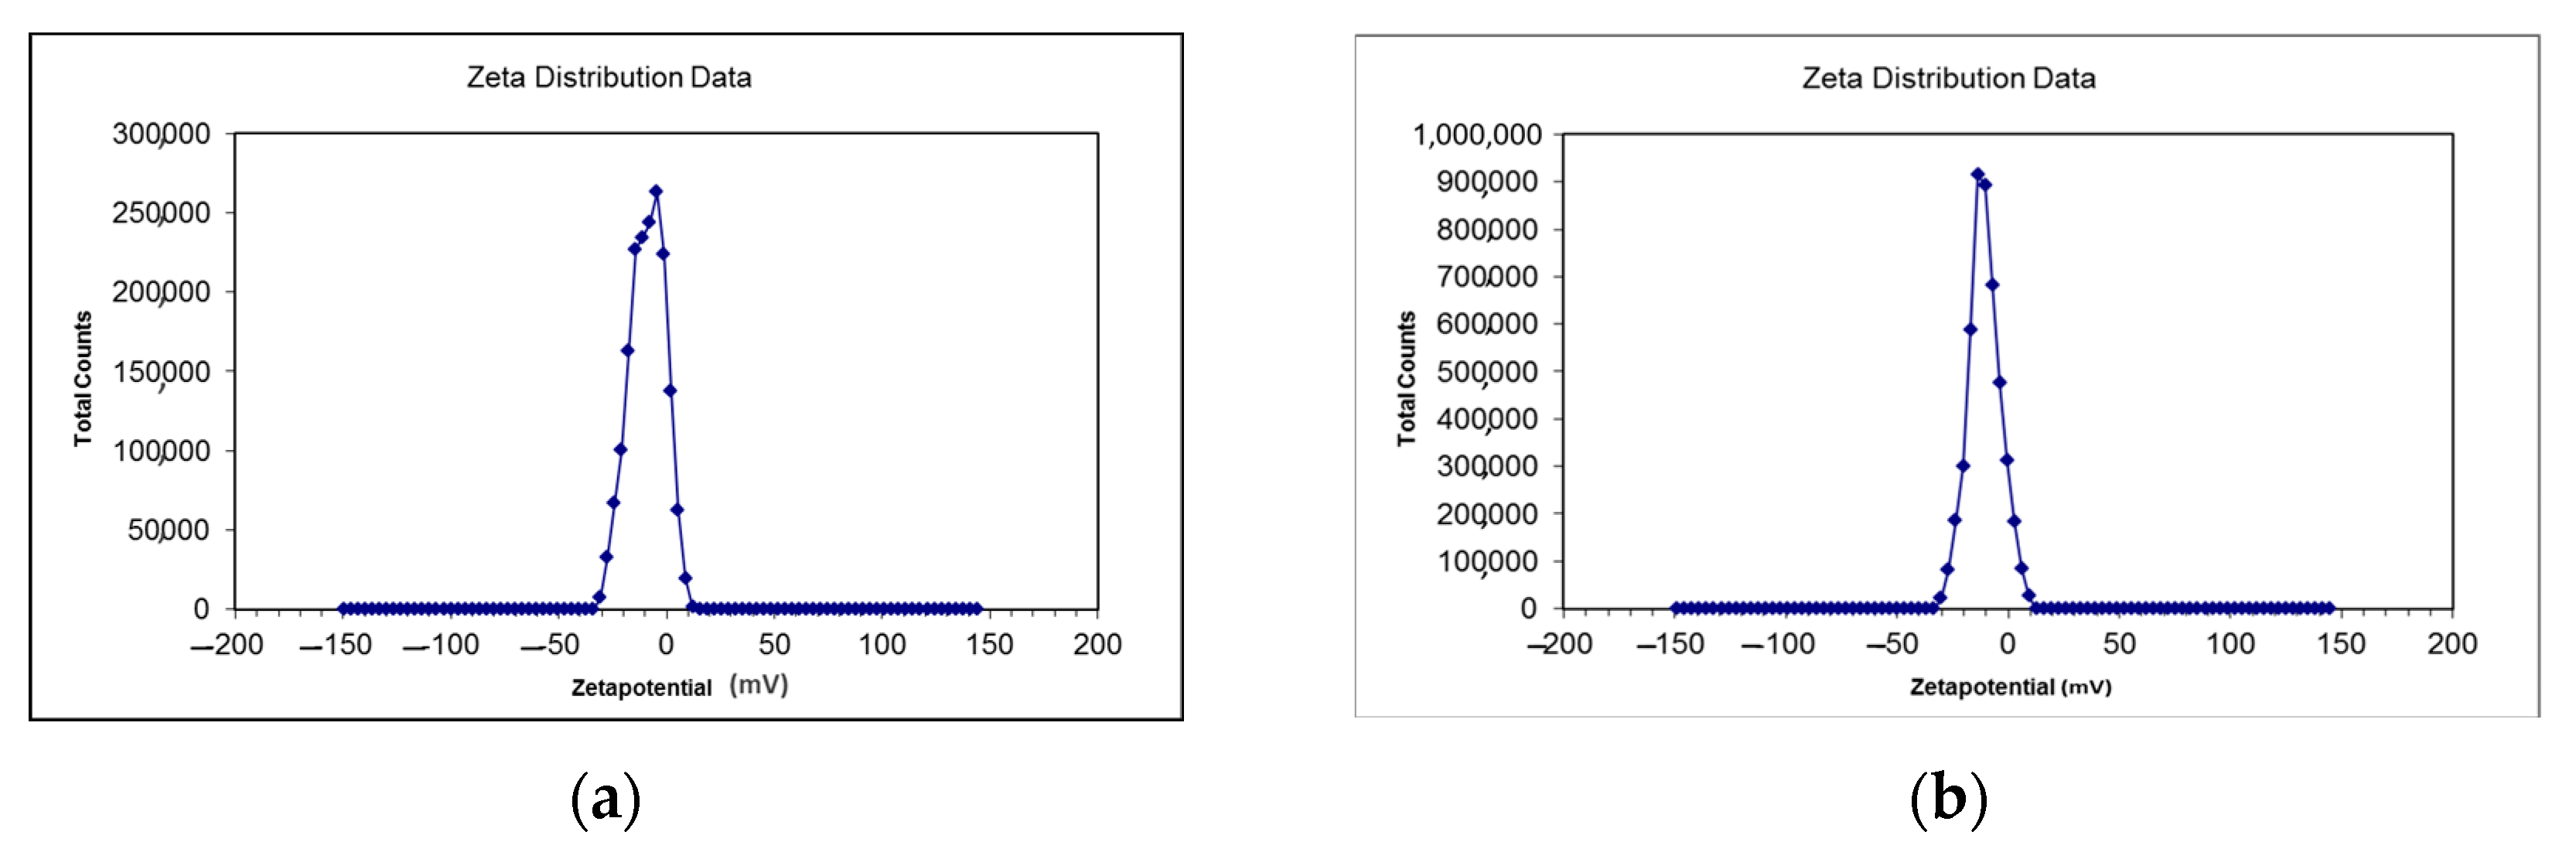
Nanoparticles have an extensive range of biological targets because of their smaller size, so the zeta size and zeta potential are the most important features of nanoformulations [
17]. Zeta potential was used to determine the surface charge of nanoparticles. The zeta sizes of CSNp and CNNp were 41.61 nm and 34.12 nm. The zeta potential values of CSNp and CNNp were −16.52 mV and −14.61 mV. These results are aligned with [
18,
19].
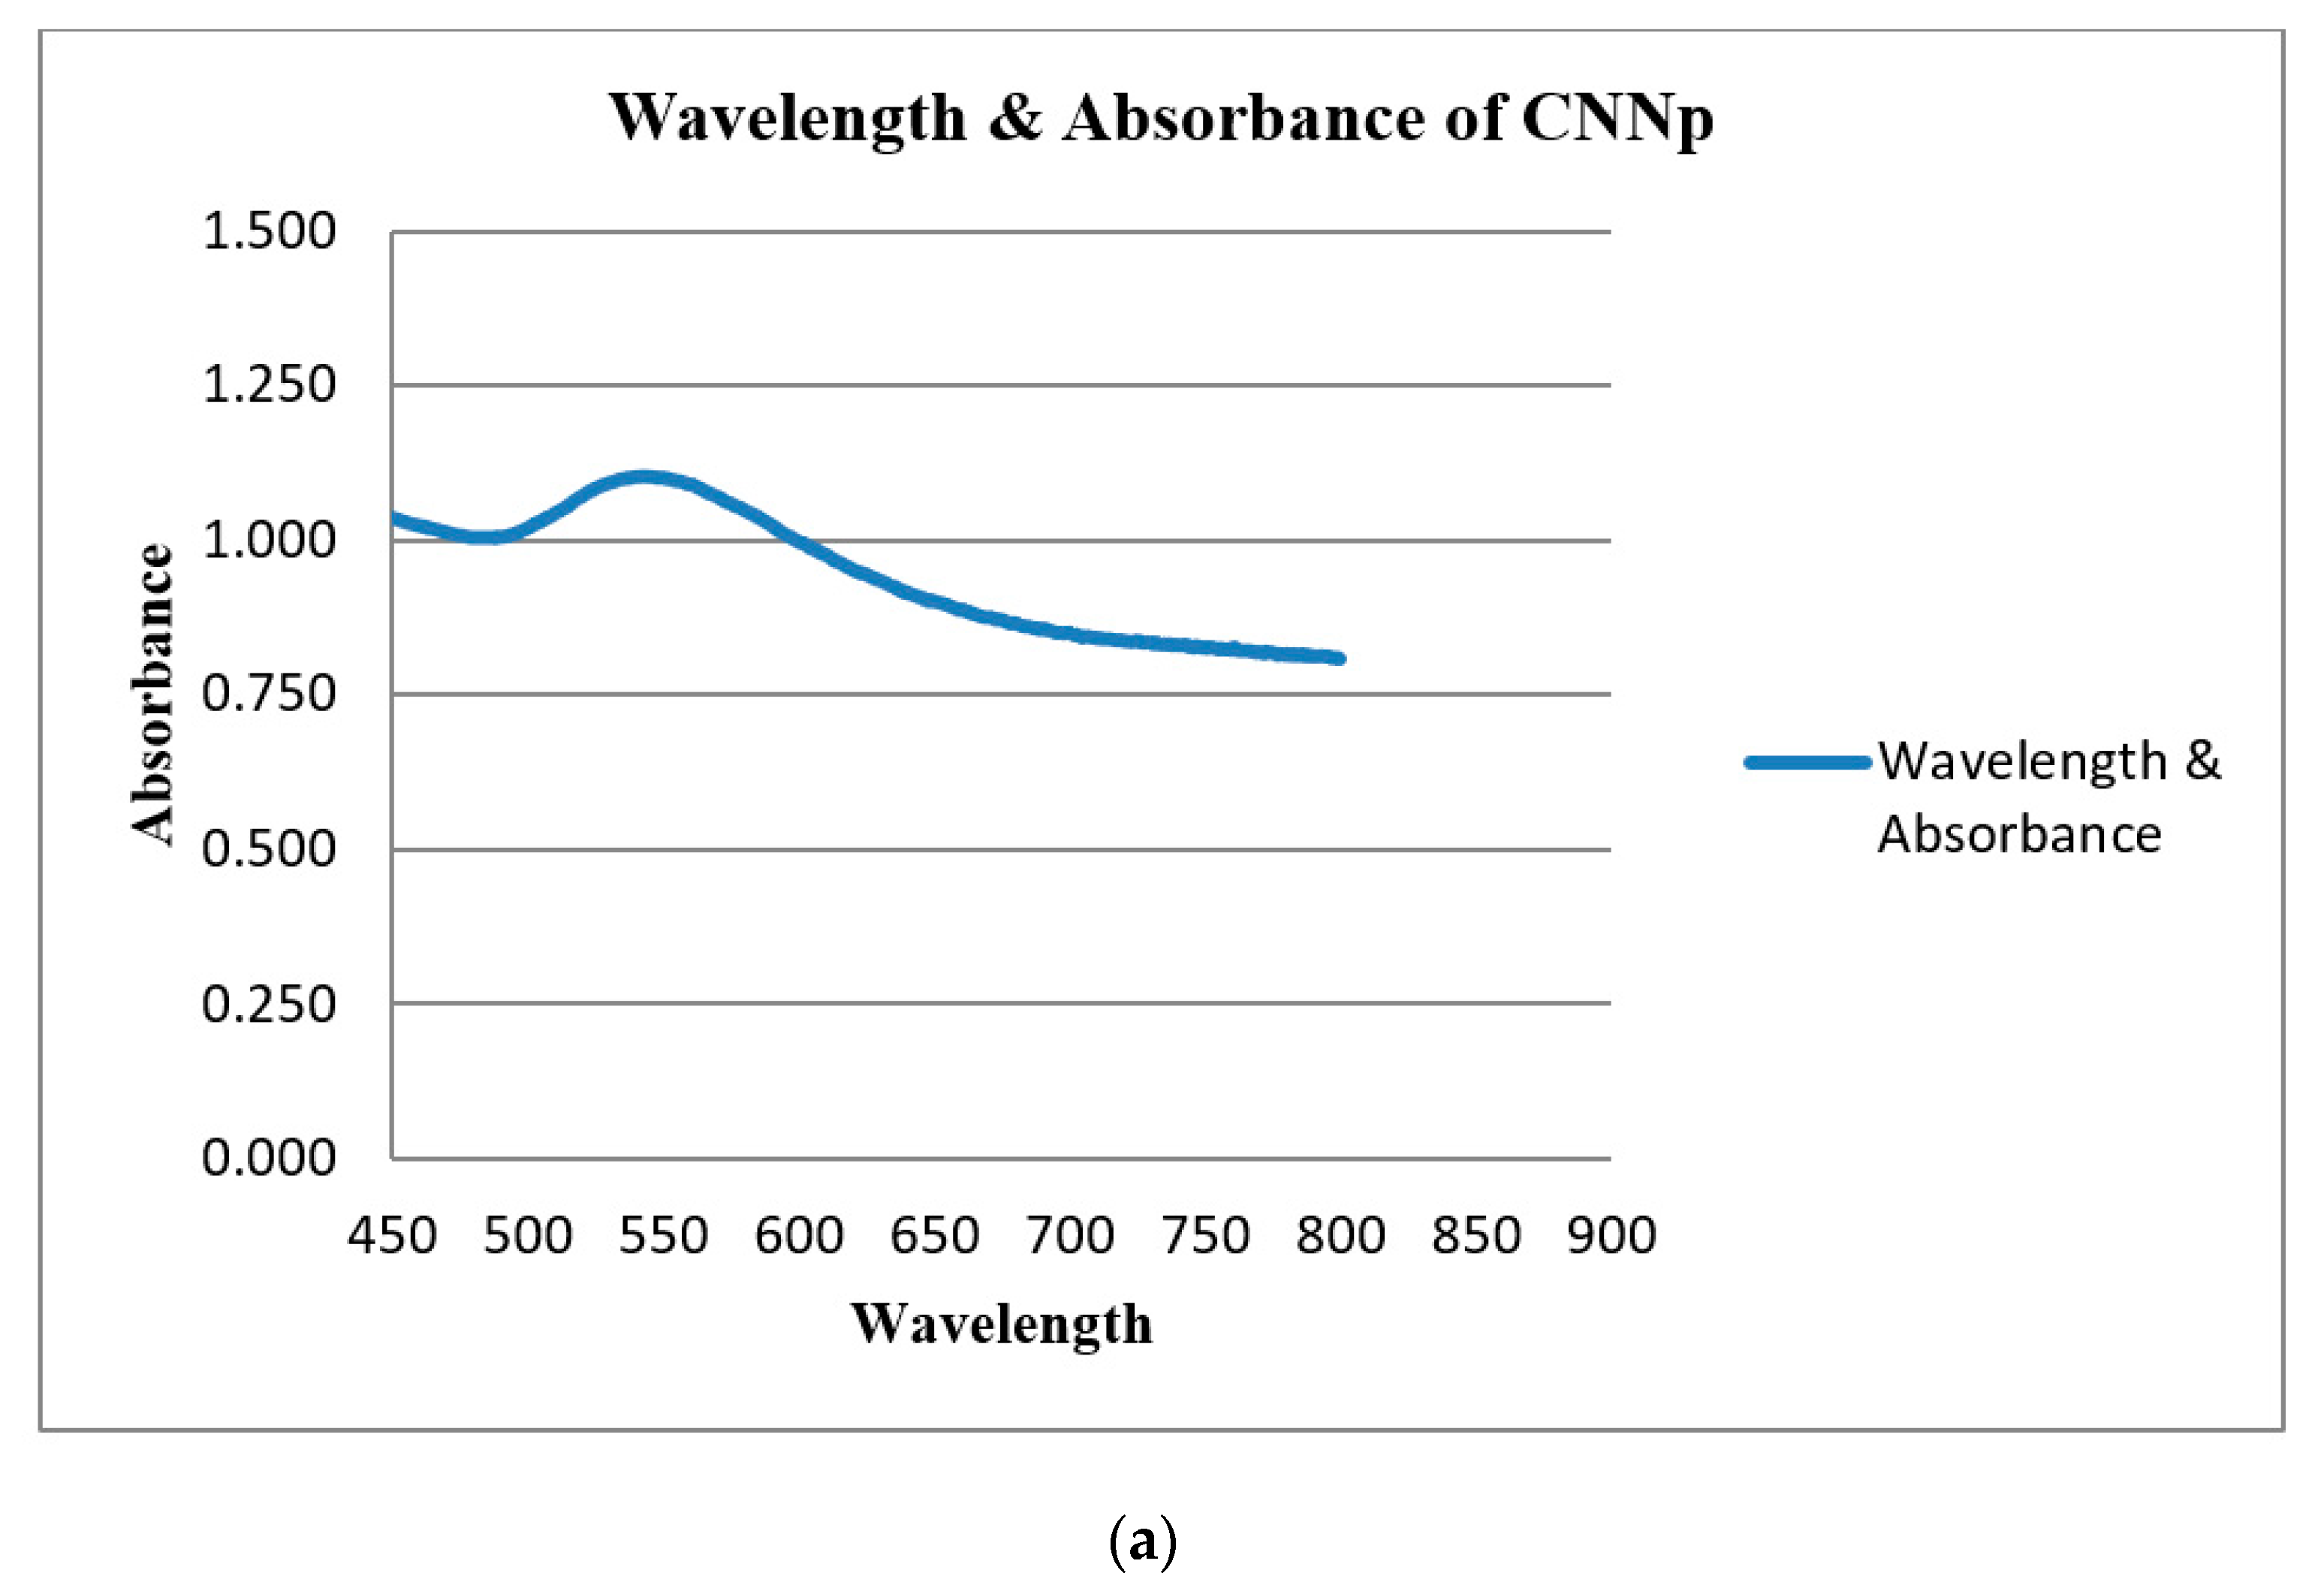
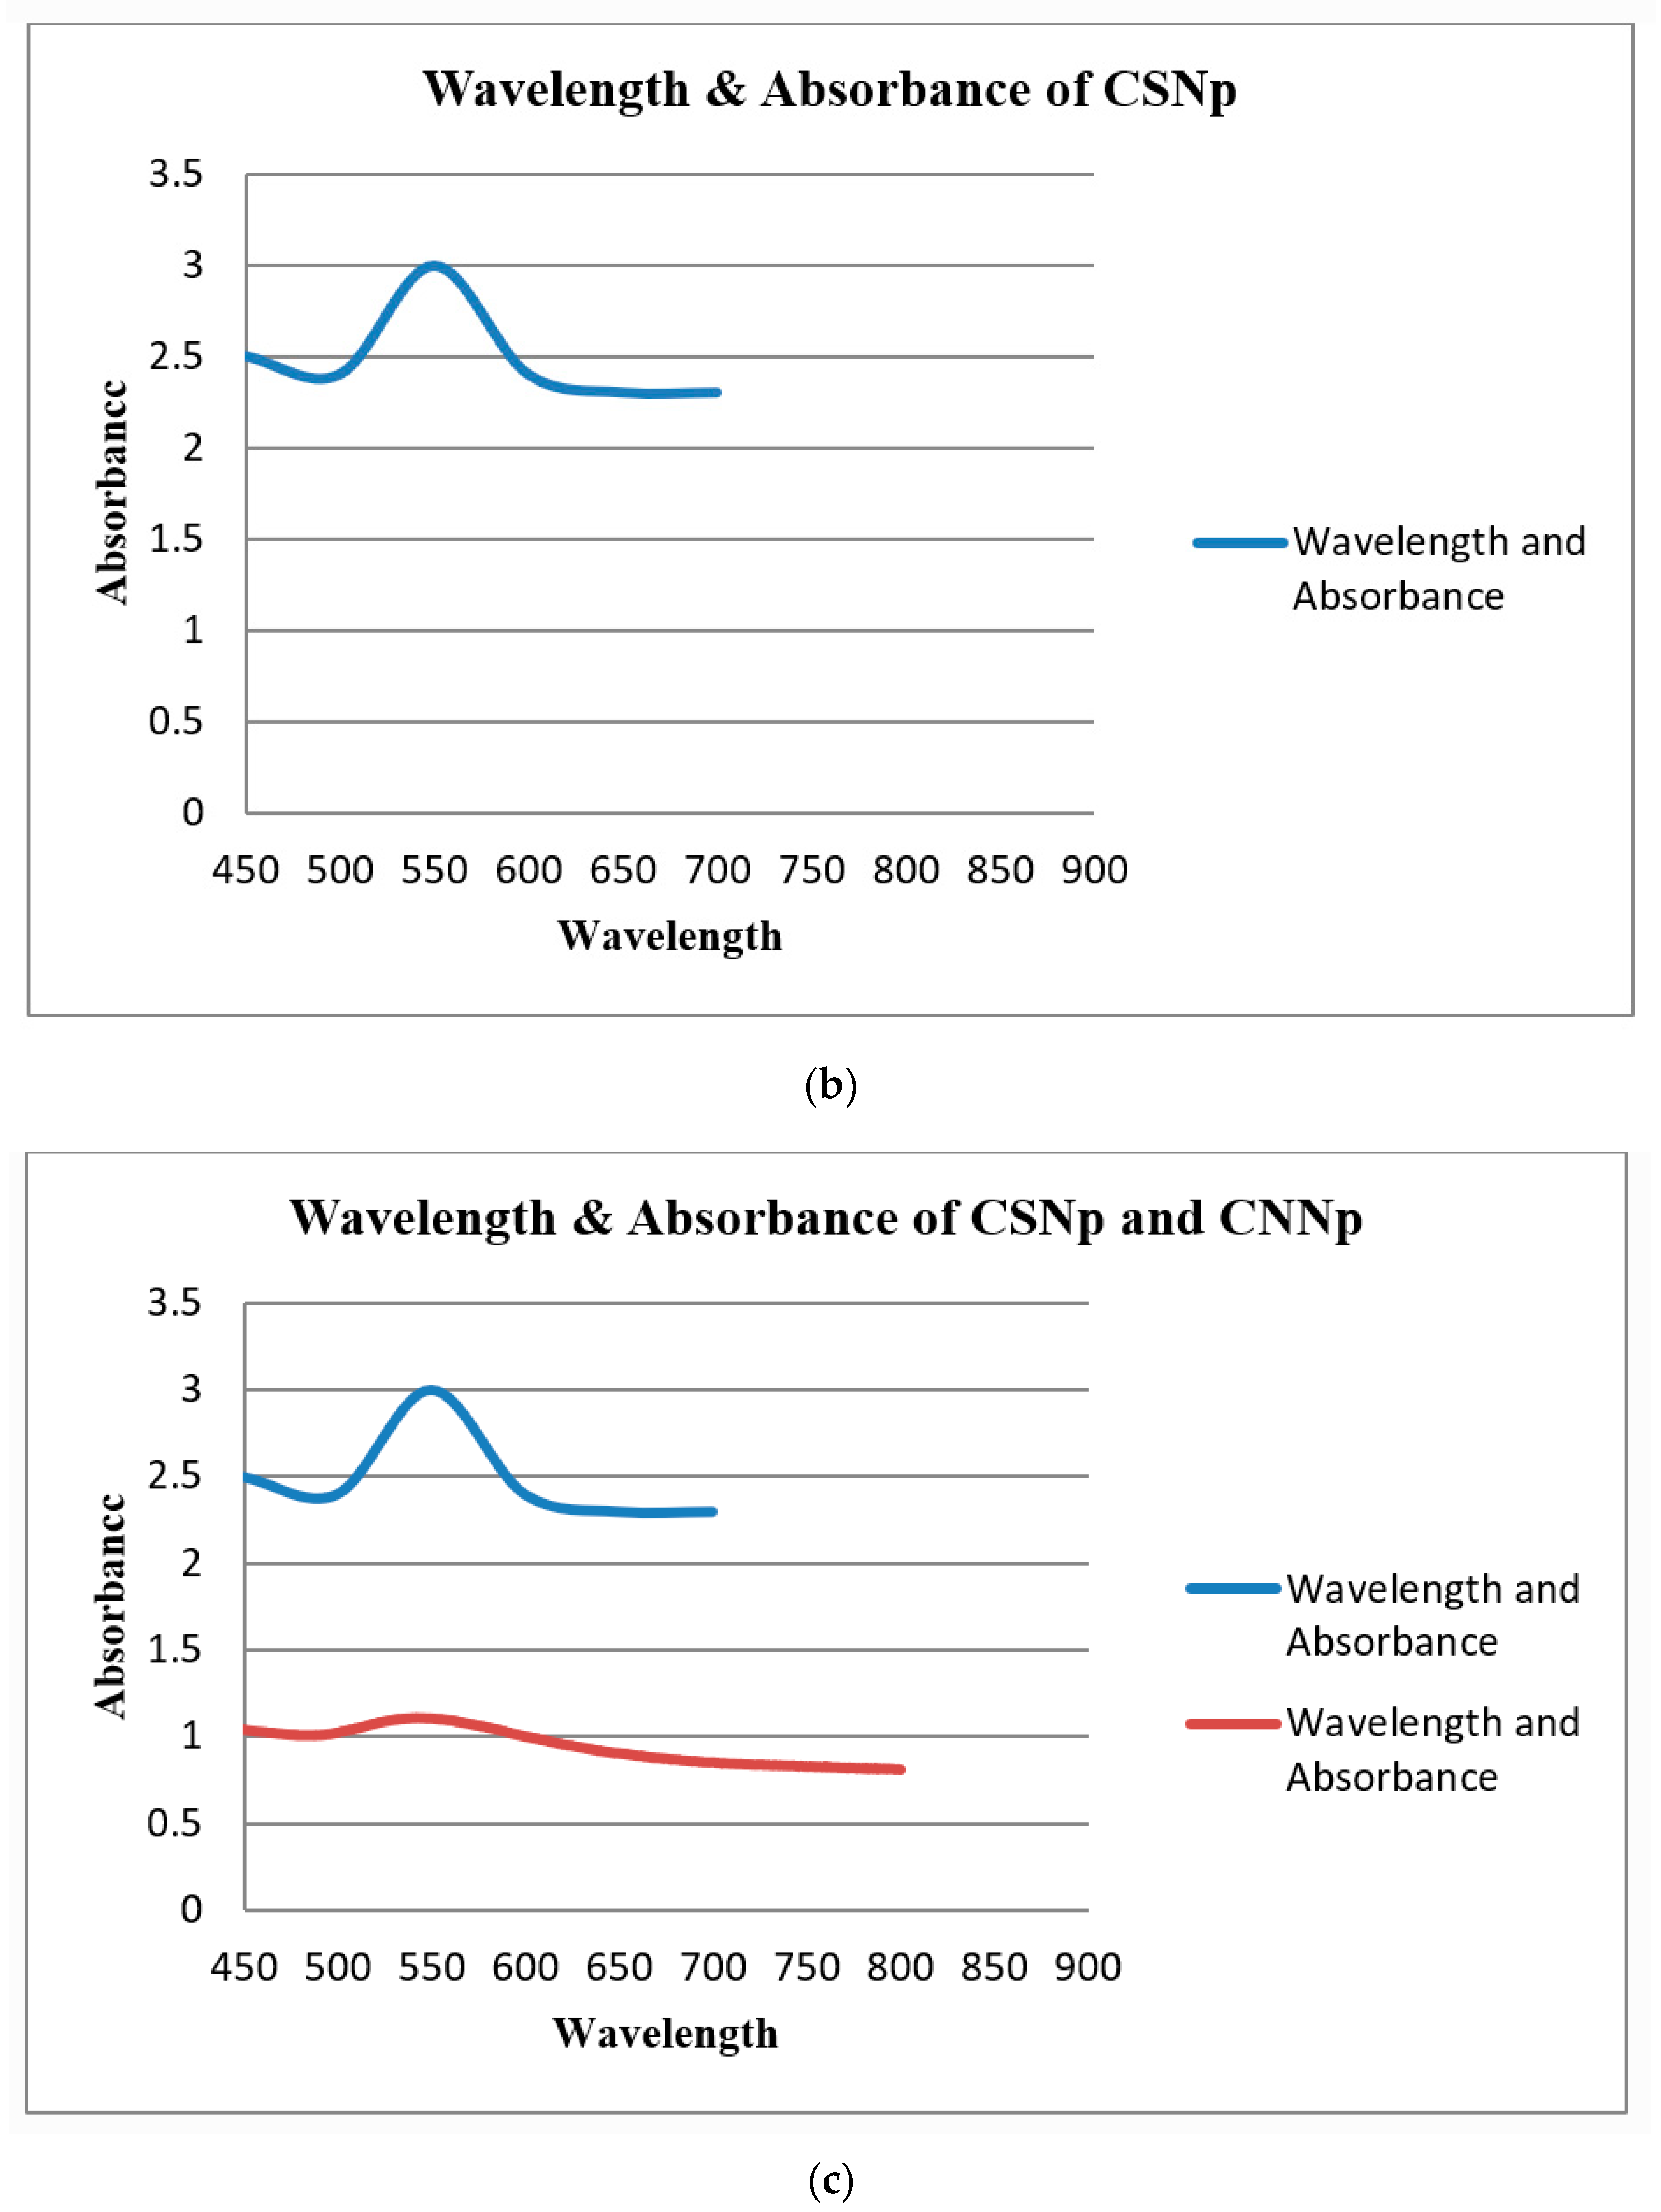
UV-Visible spectroscopy was used to determine the absorbance of gold nanoparticles. The maximum (λmax) of the localized surface plasmon resonance (LSPR) absorption band occurred in the range of 520–570 nm for gold nanoparticles. The λmax of CSNp was 540 nm, and for CNNp, it was 524 nm. These conclusions are related to the conclusions in [
20].
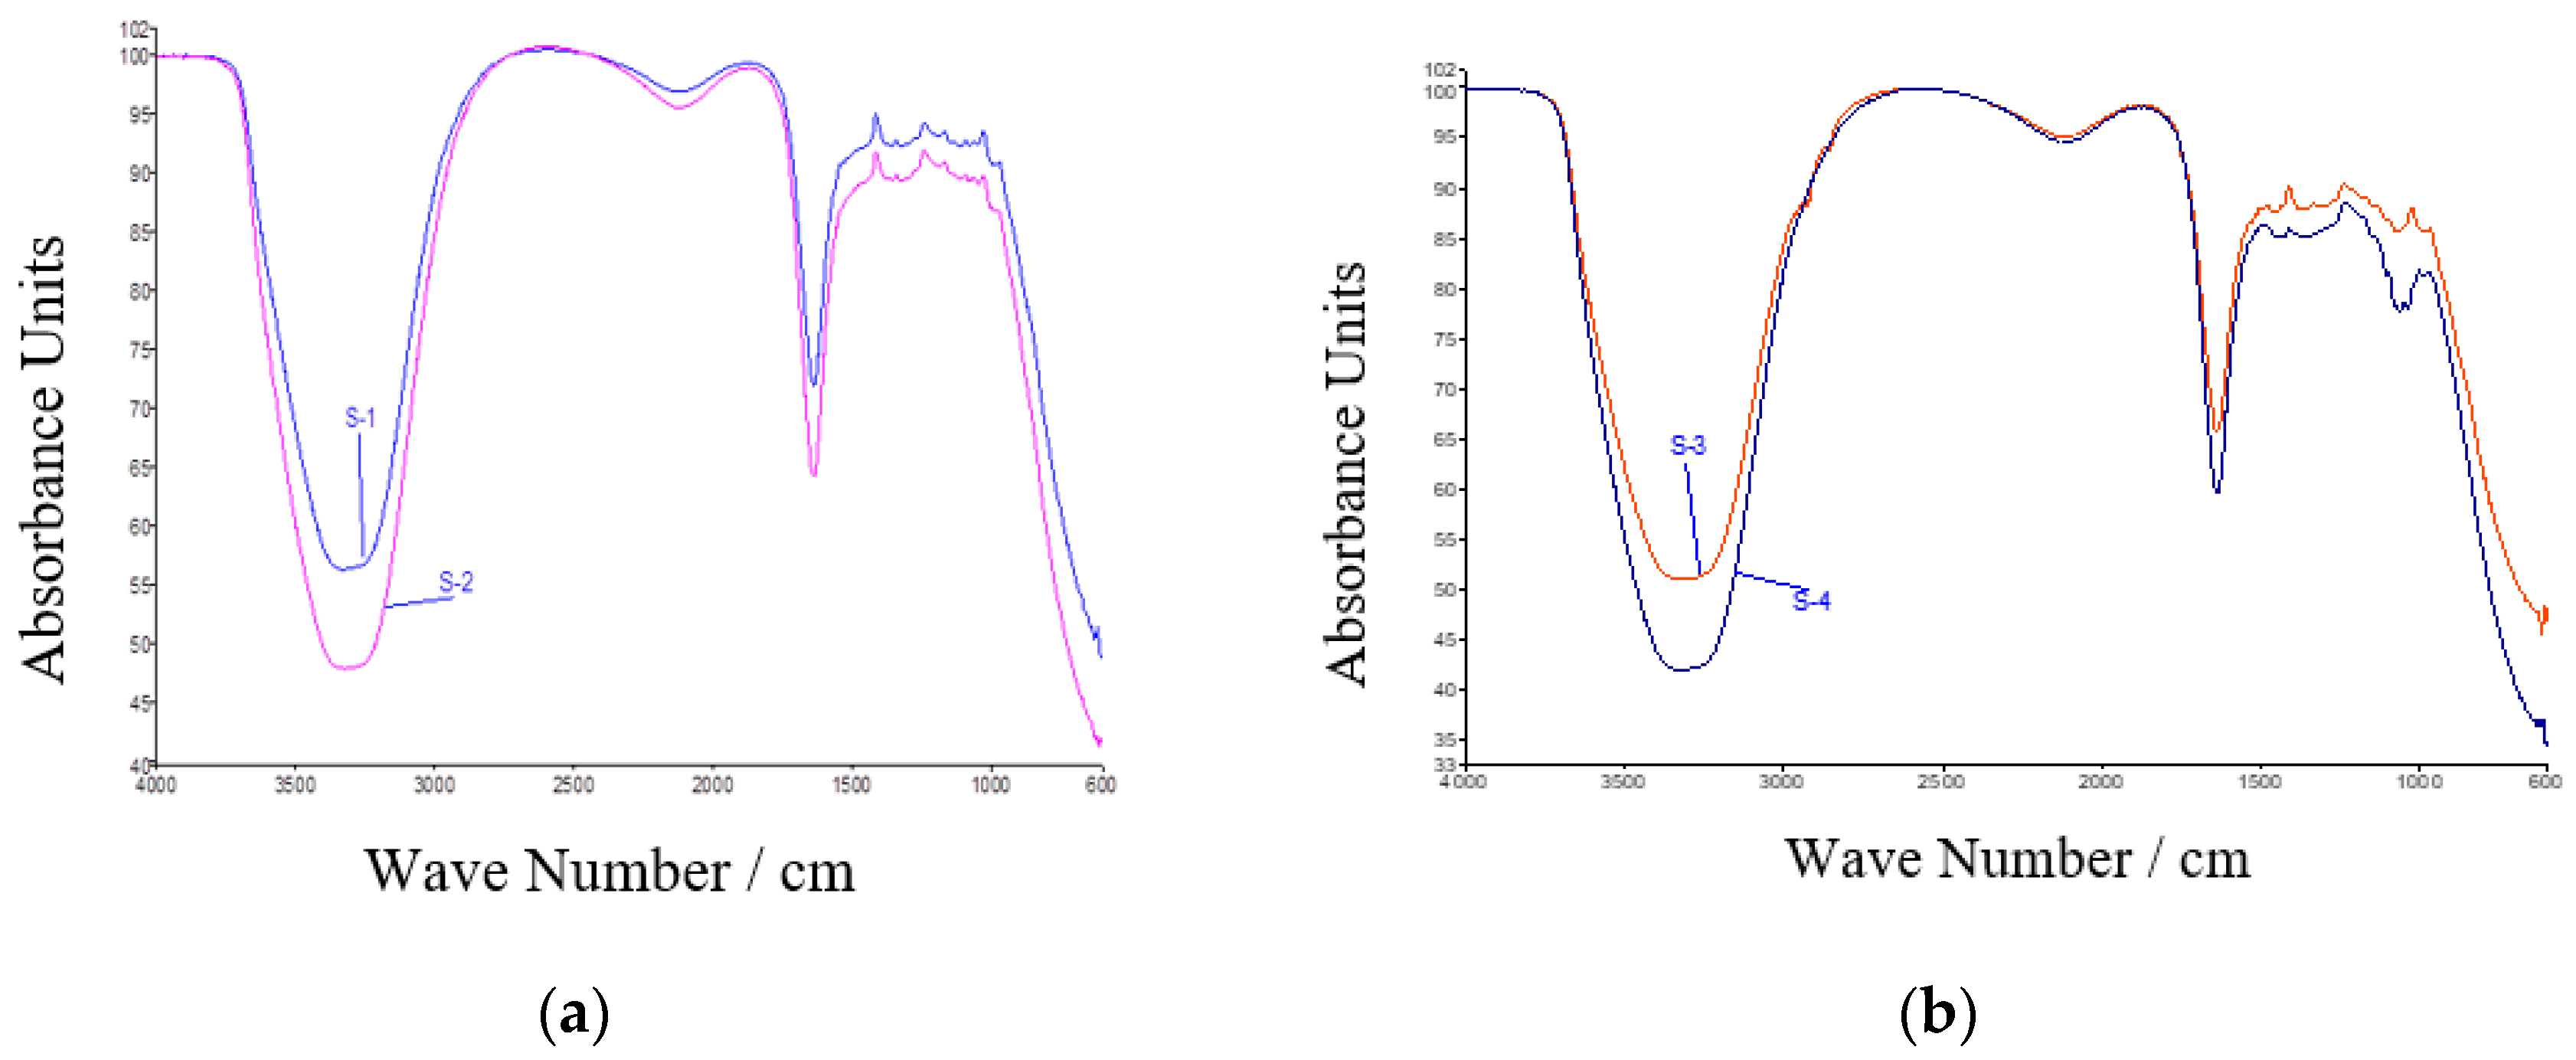
The peaks of the FTIR results confirmed that CSNp and CNNp both followed the same trends of peaks, which confirmed the preparation of green gold nanoparticles. These findings are similar to Ref. [
21].
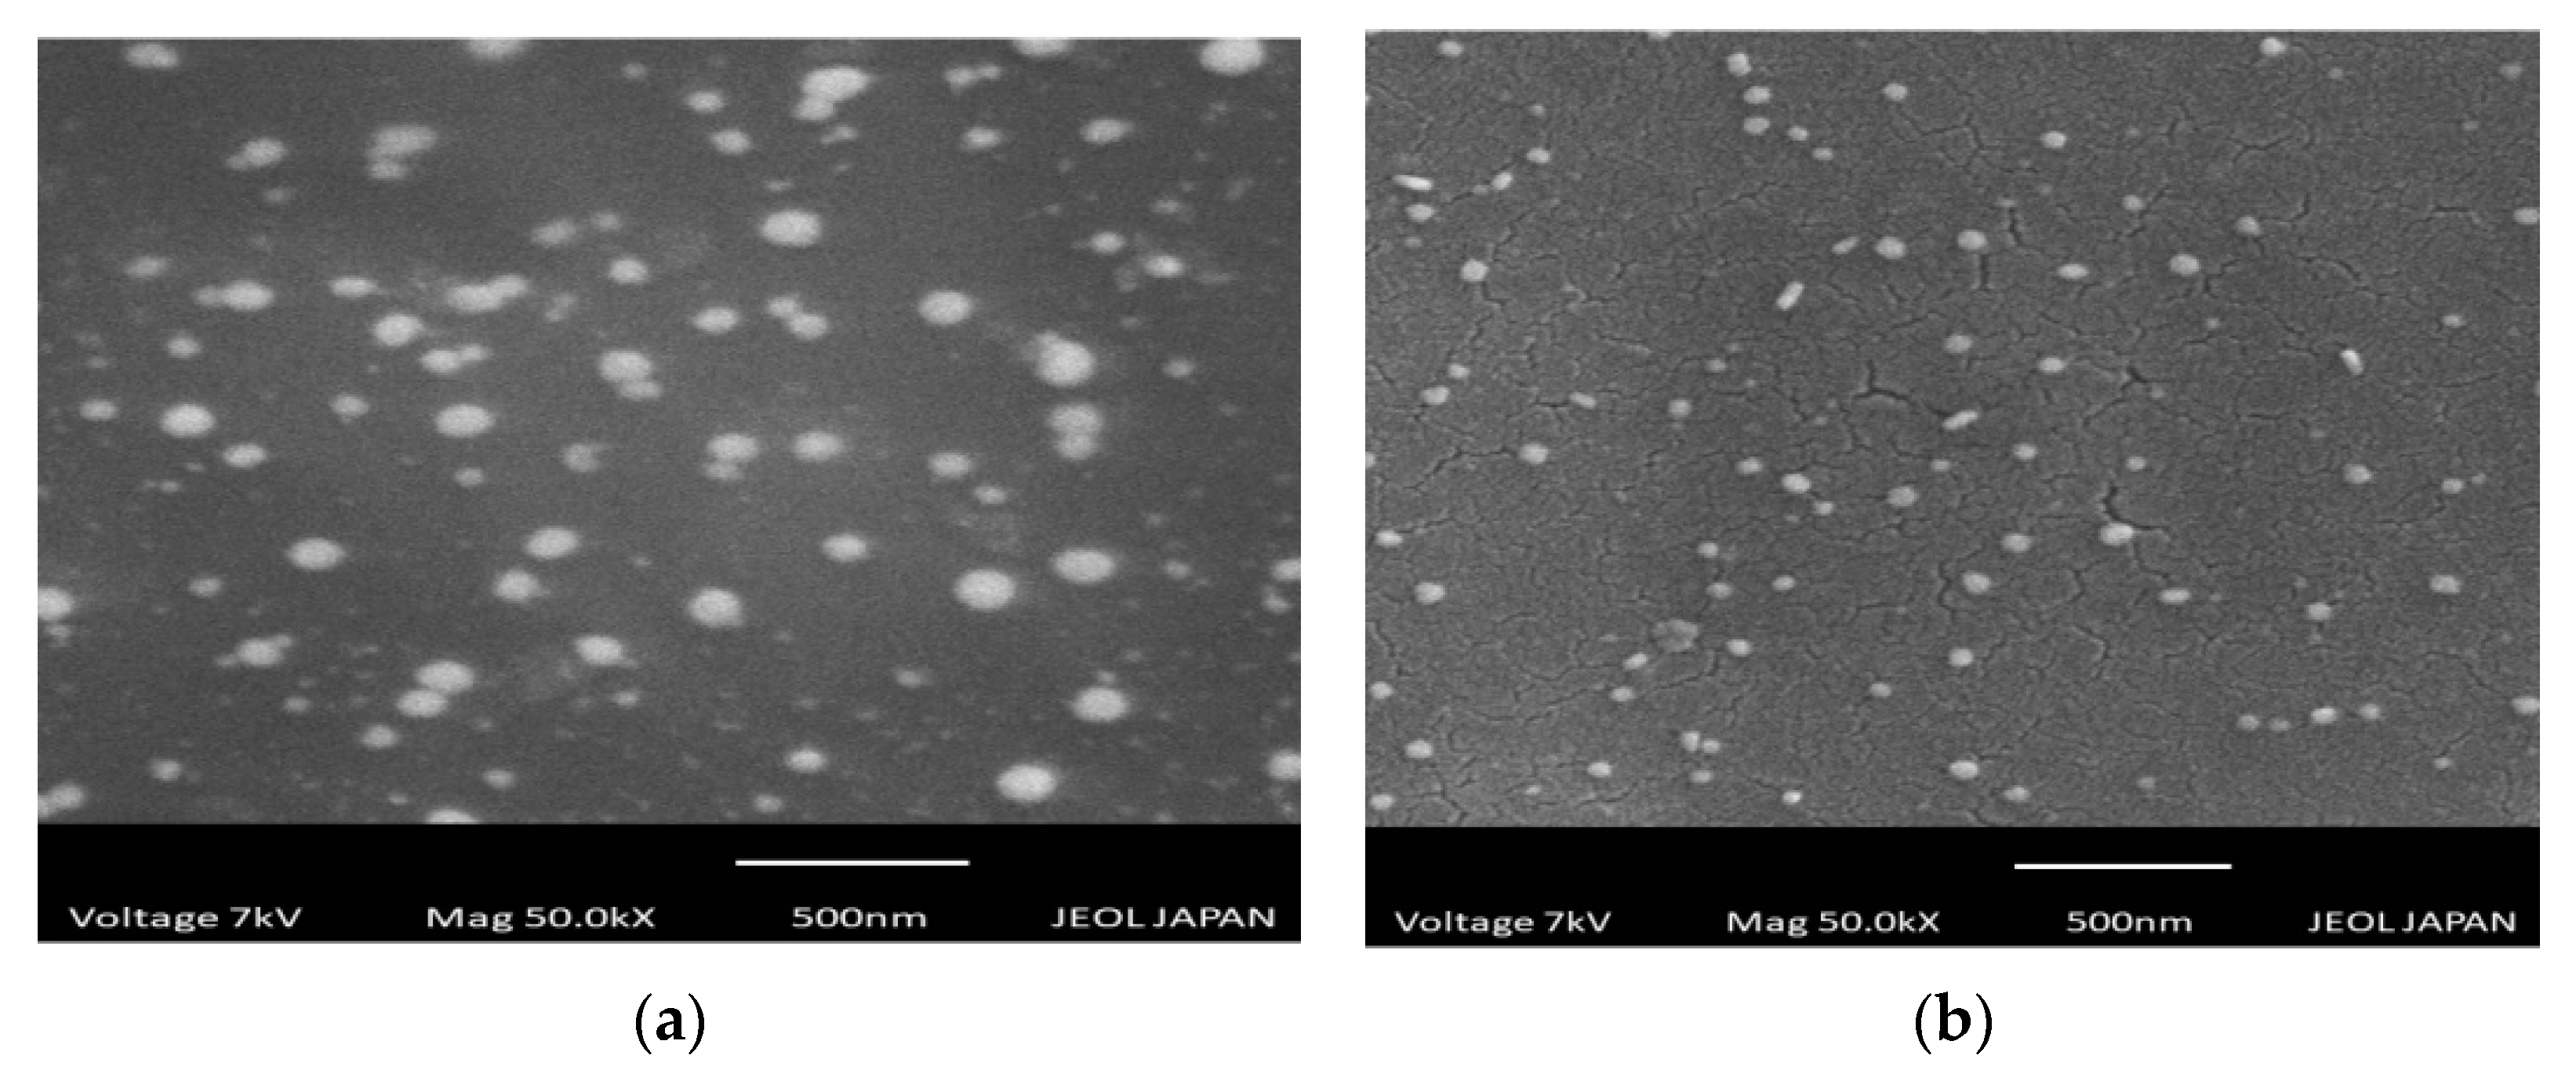
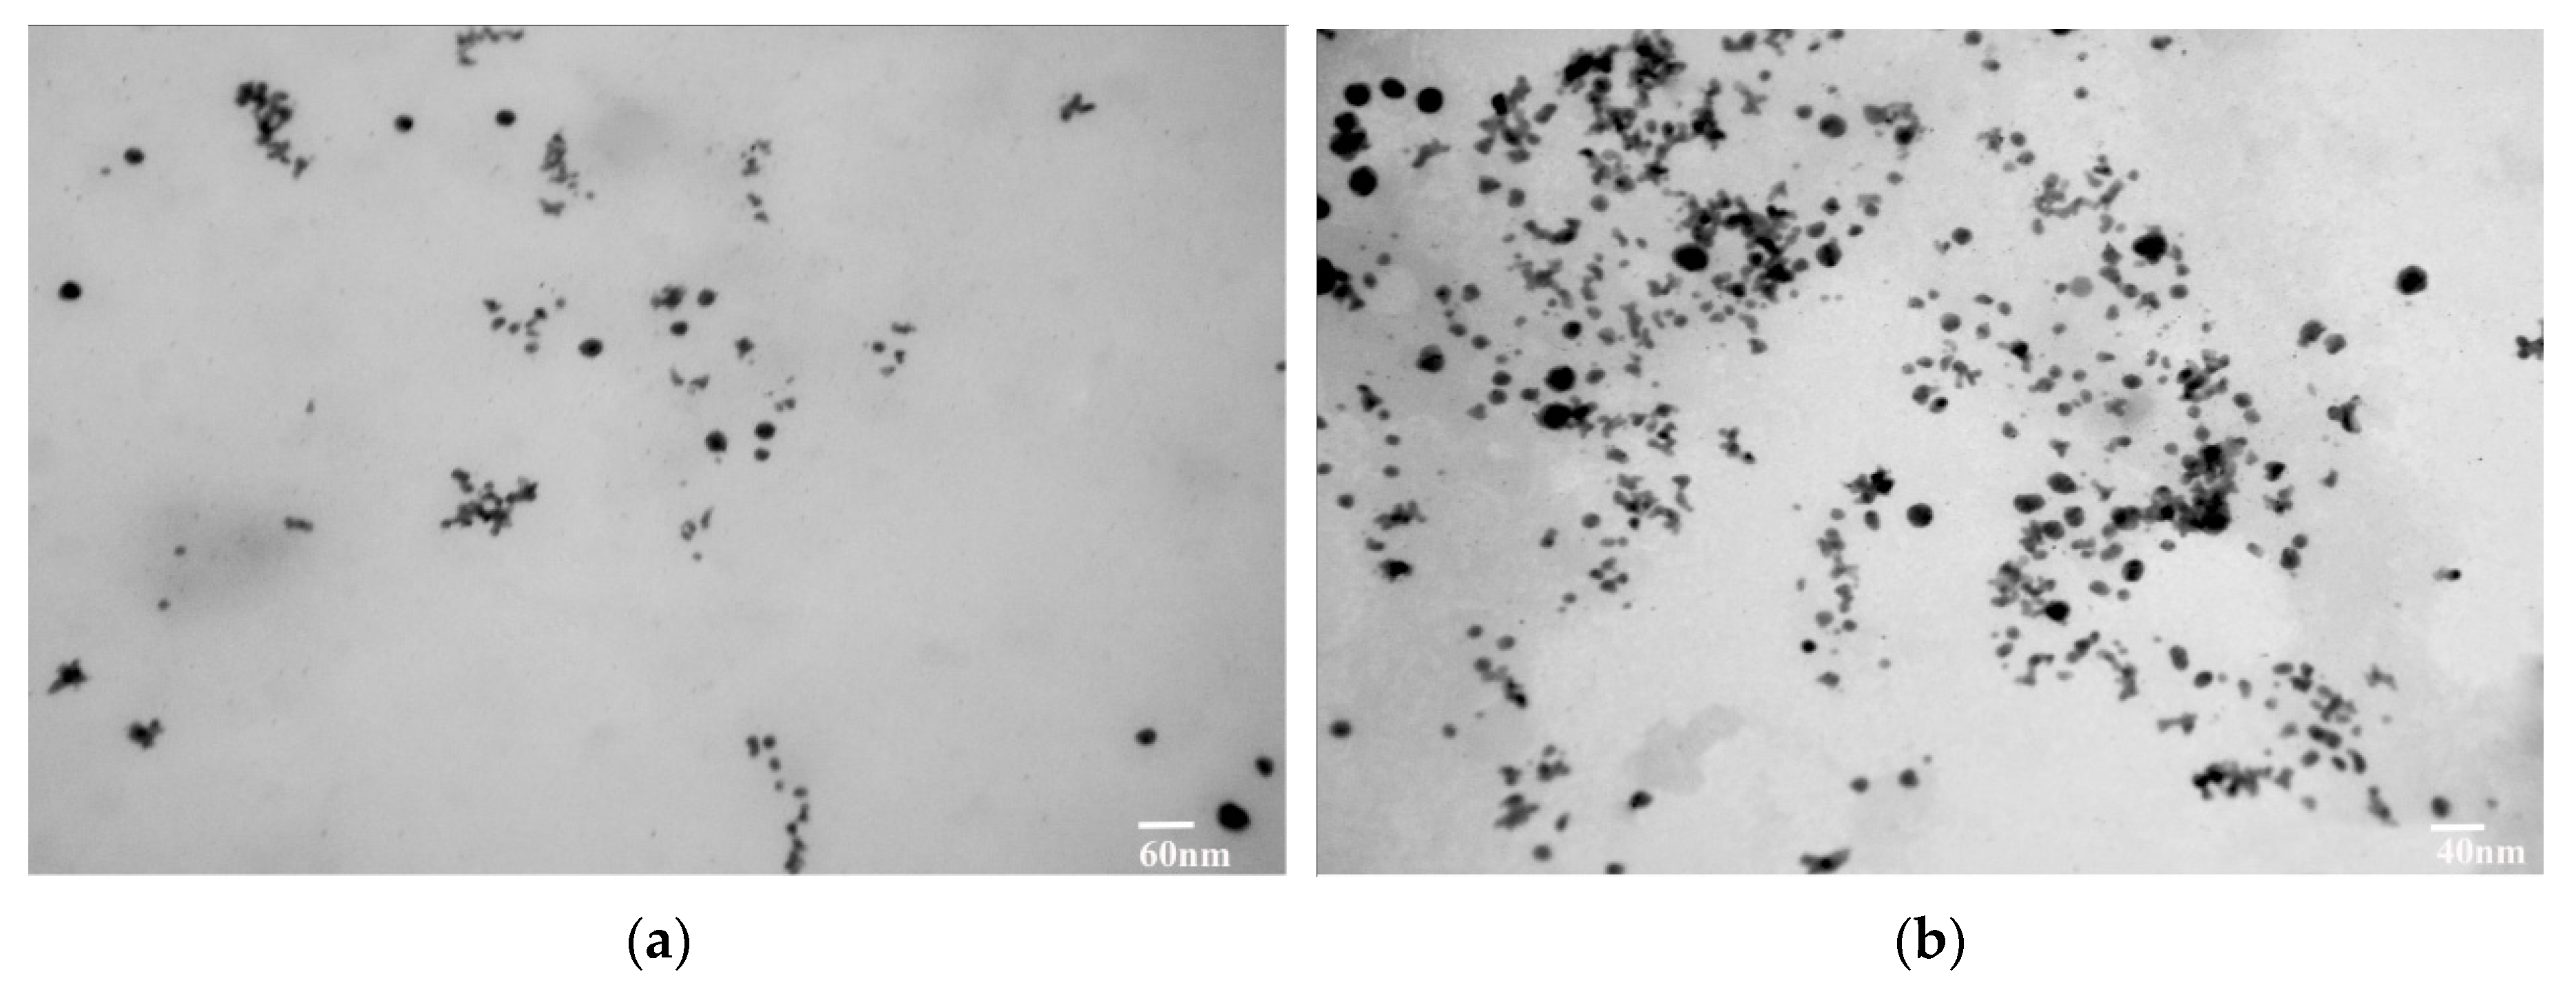
SEM gave information about the morphology of gold nanoparticles, which were spherical shapes; these observations are in agreement with Yadav et al., who prepared nanoparticles using
Camellia sinensis. CSNp showed no agglomerates. TEM gave highly magnified images of gold nanoparticles which were prepared using CSE and CNW. These outcomes are similar the conclusions of Ref. [
22].
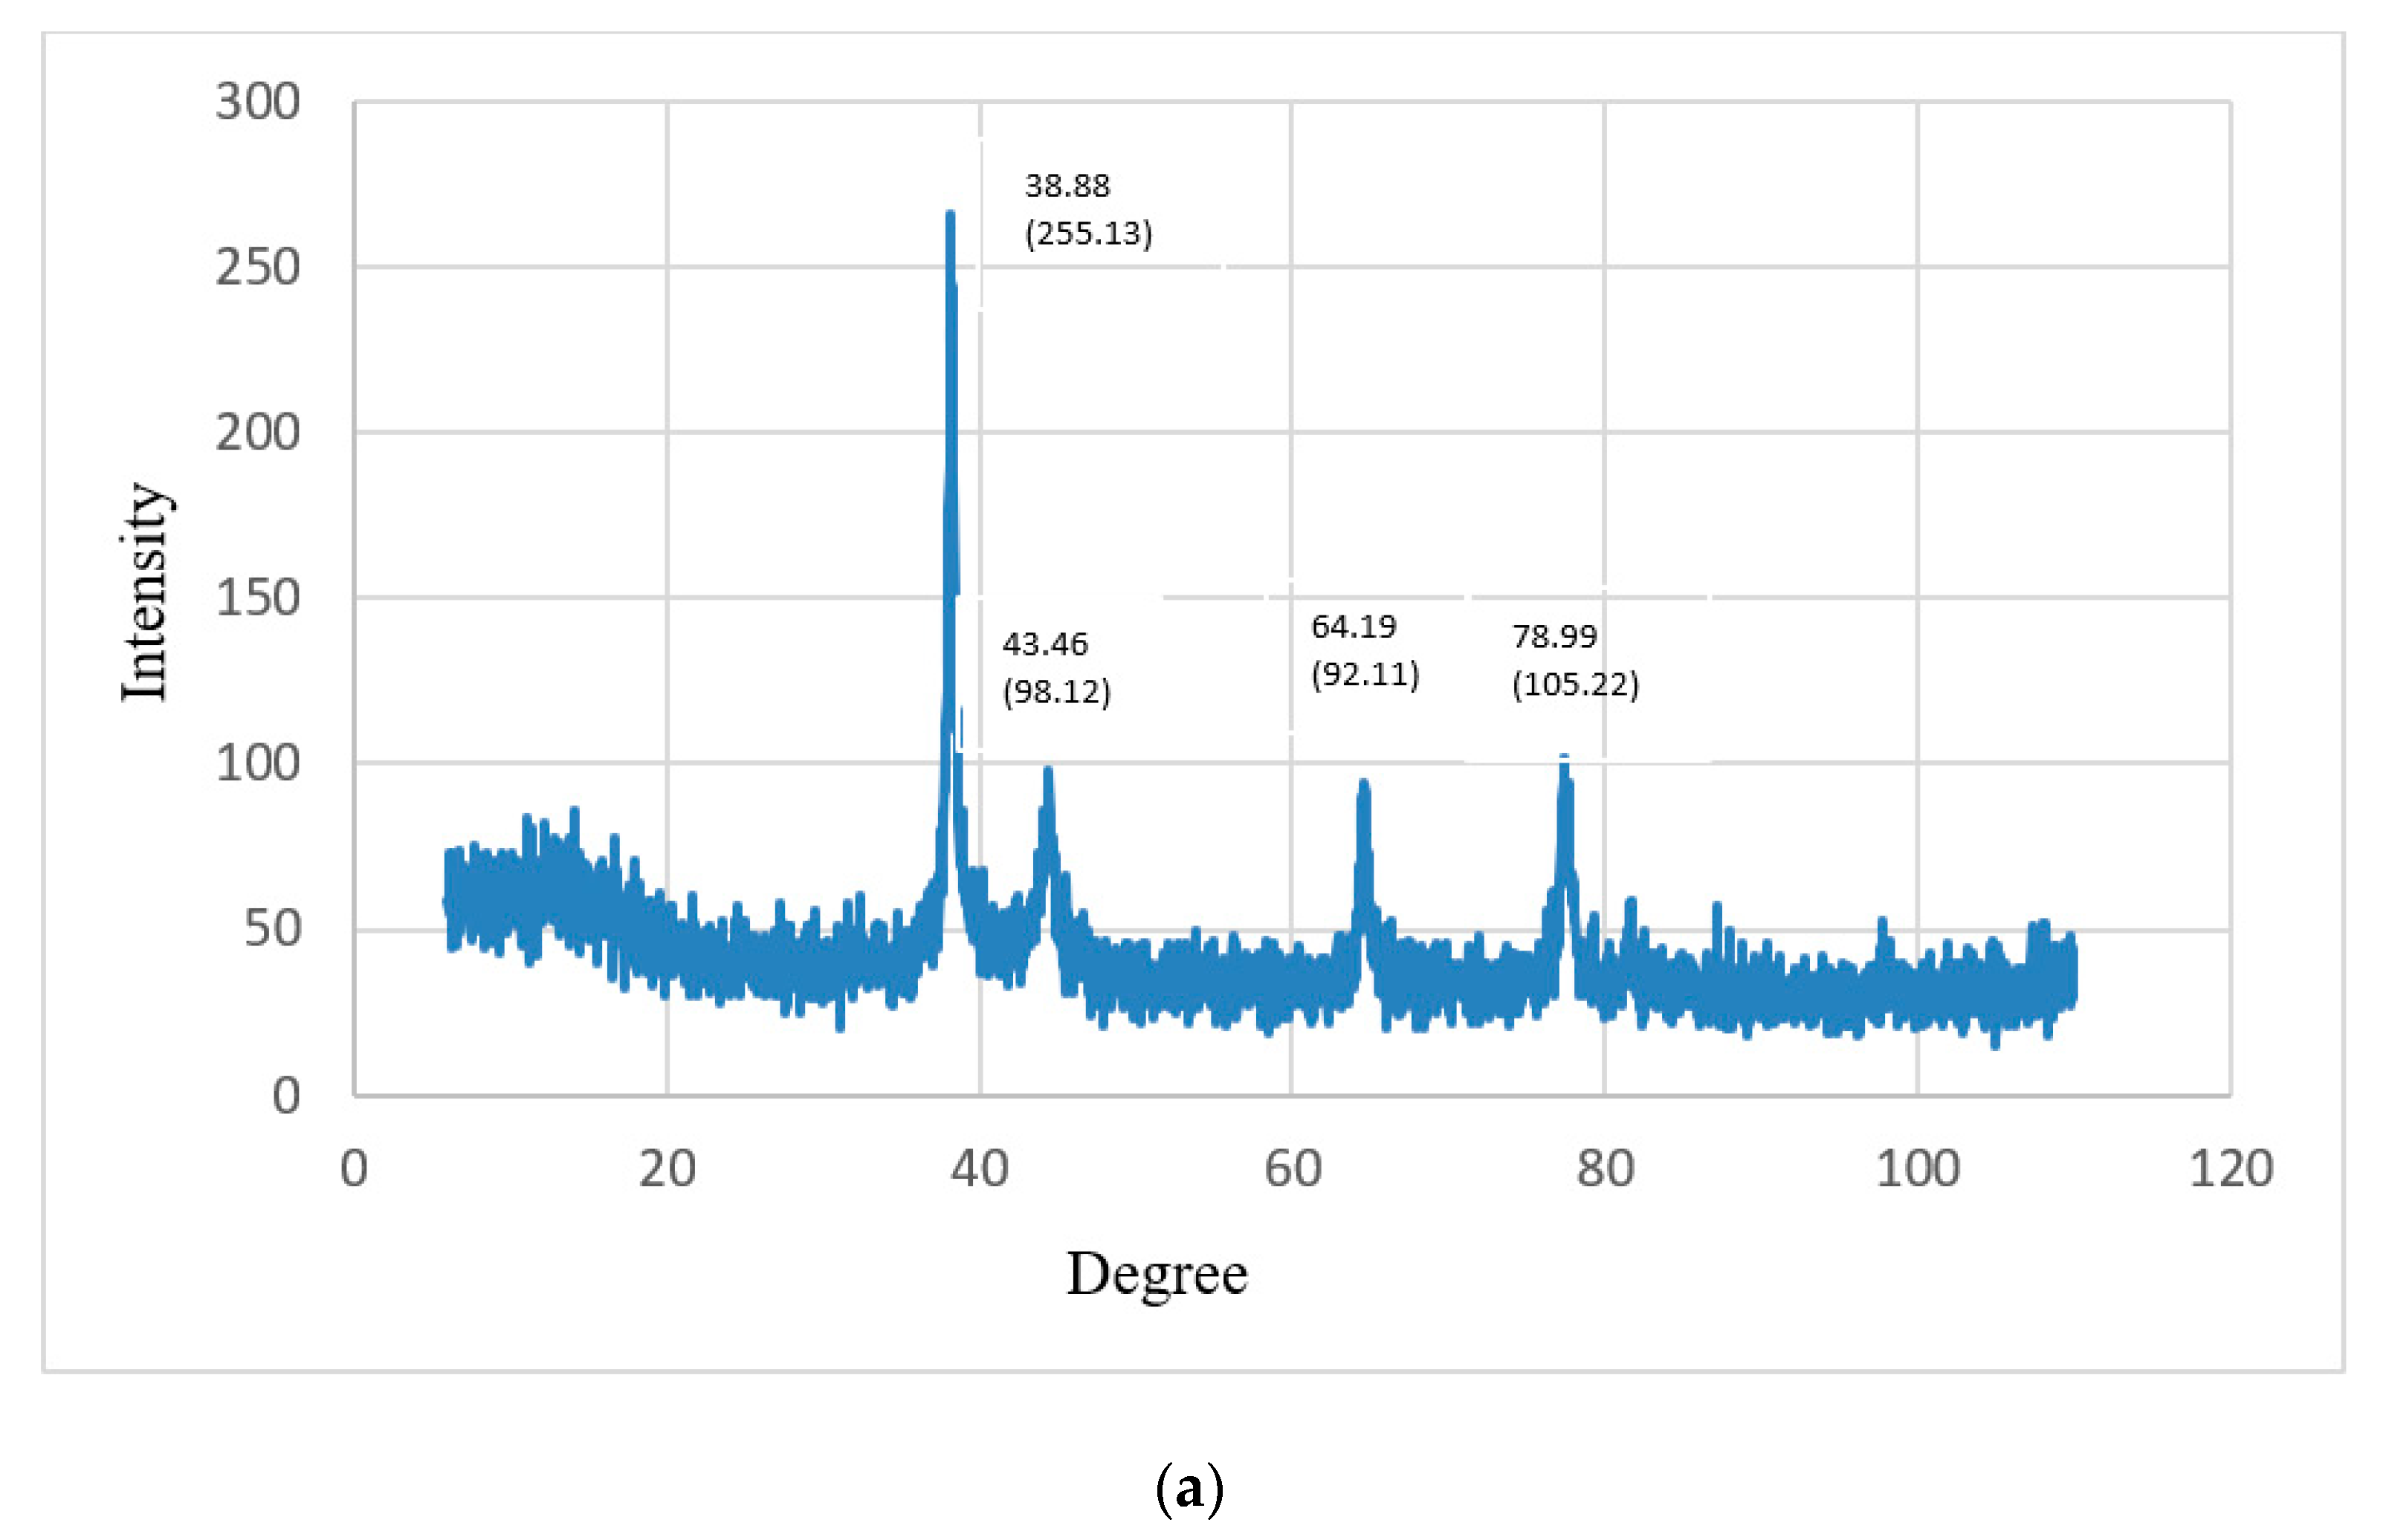
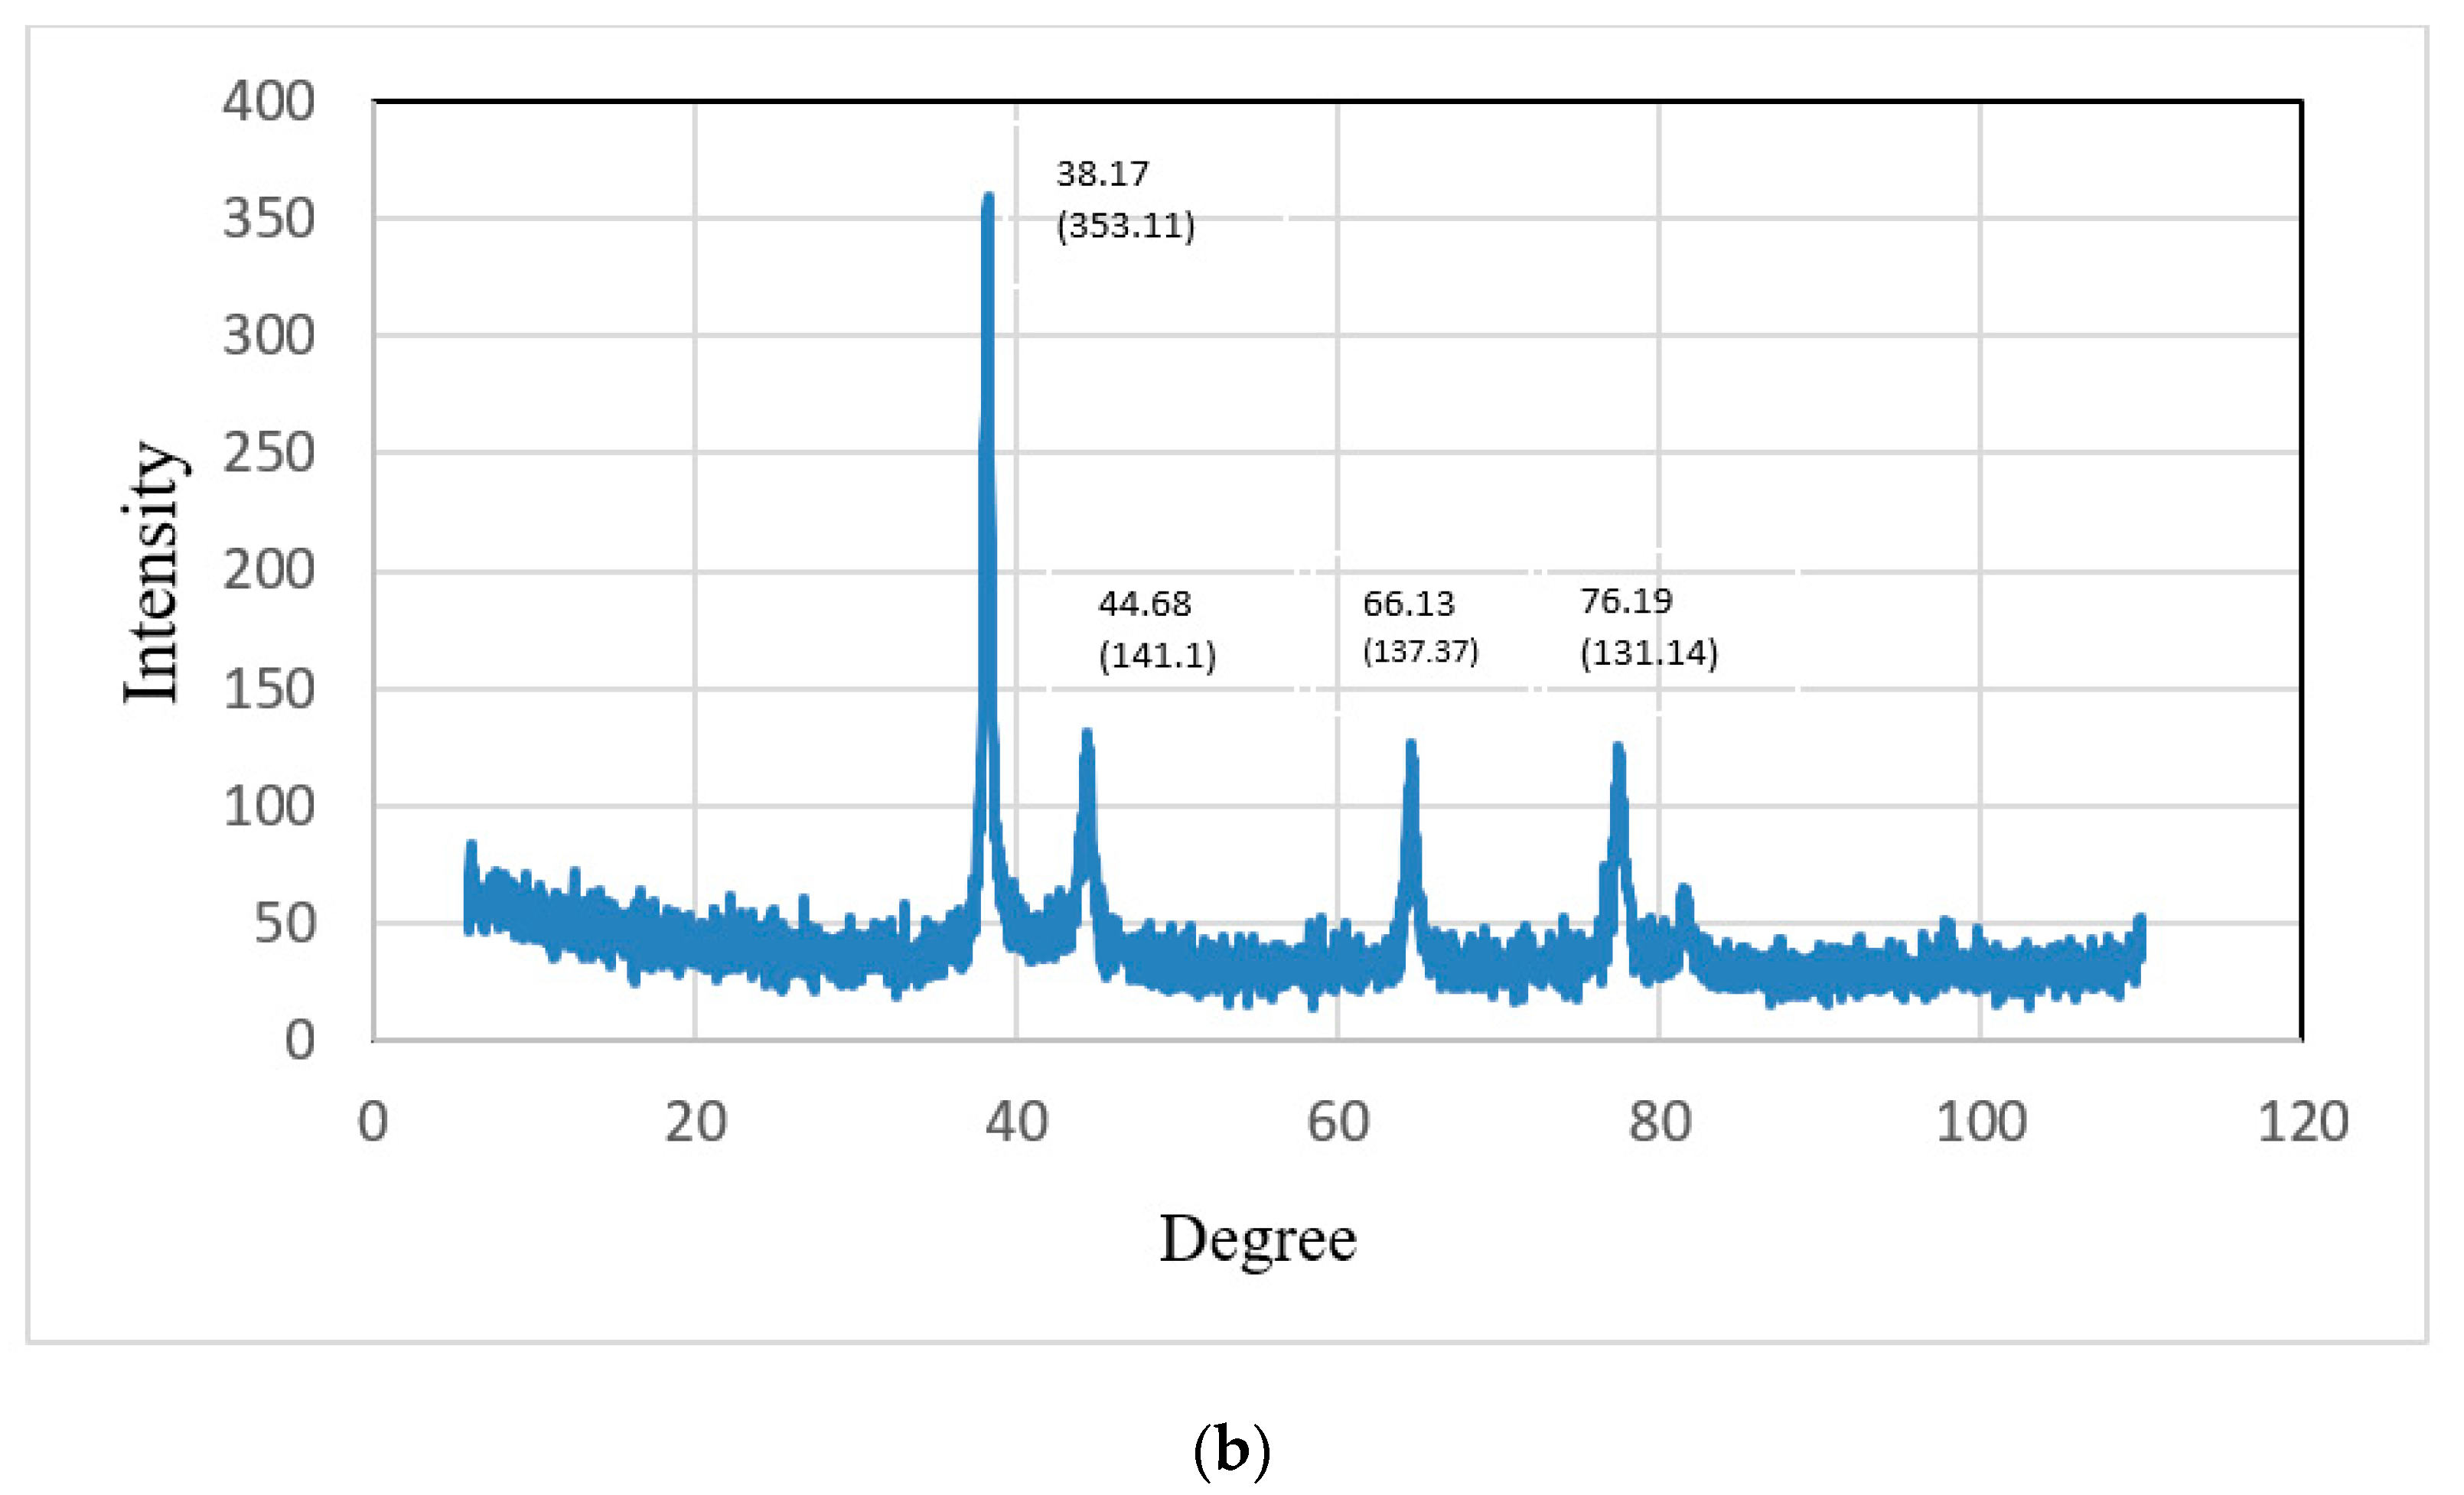
The crystal structures of the gold nanoparticles were presented via XRD. The diffraction peaks of green tea gold nanoparticles were observed at 38.17°, 44.66°, 66.13° and 76.19°, representing the intensities of (353.11), (141.1), (137.37) and (131.14). The diffraction peaks of green coconut gold nanoparticles were observed at 38.88°, 43.46°, 64.19° and 78.99°, representing the intensities of (255.13), (98.12), (92.11) and (105.22), which describe the crystalline structures of gold nanoparticles; these conclusions are comparable with those in Ref. [
23].
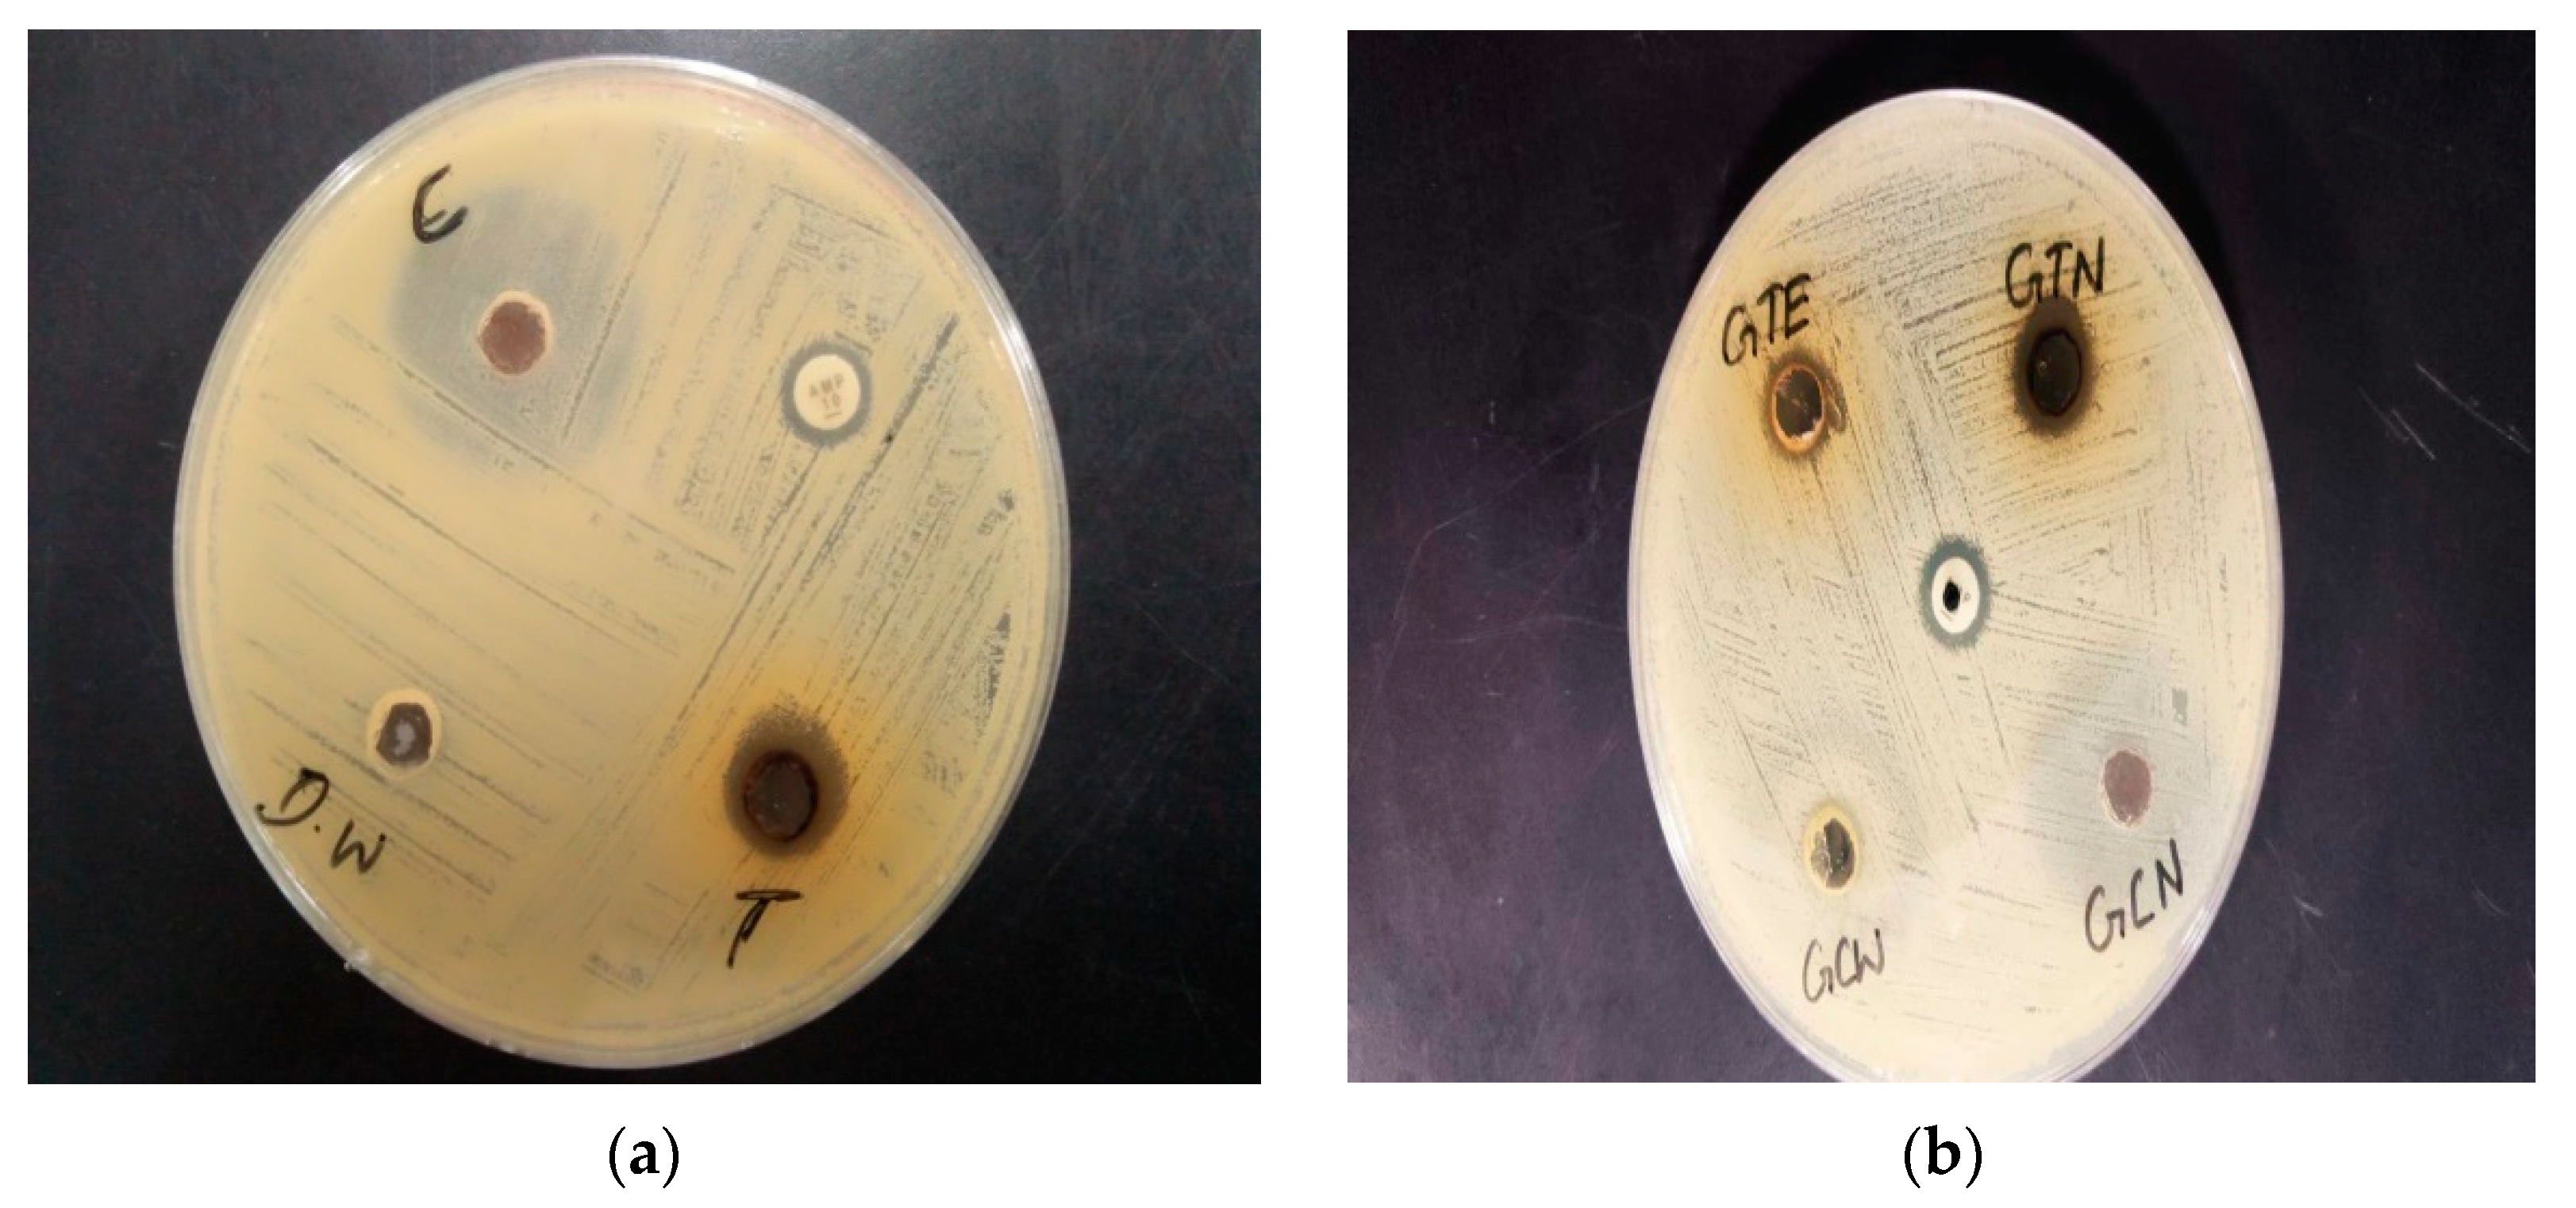
Using the well diffusion method on an agar plate, the antimicrobial actions of green gold nanoparticles with a size range between 30 and 80 nm were determined, and the zone of inhibition of
S. aureus was observed. The well diffusion method results for CSNp and CNNp against
S. aureus are shown in
Figure 11a,b, which clearly show the zones of inhibition. Additionally, the zone of inhibition of CNNp was greater than that of CSNp. These conclusions are similar with the discussion of Ref. [
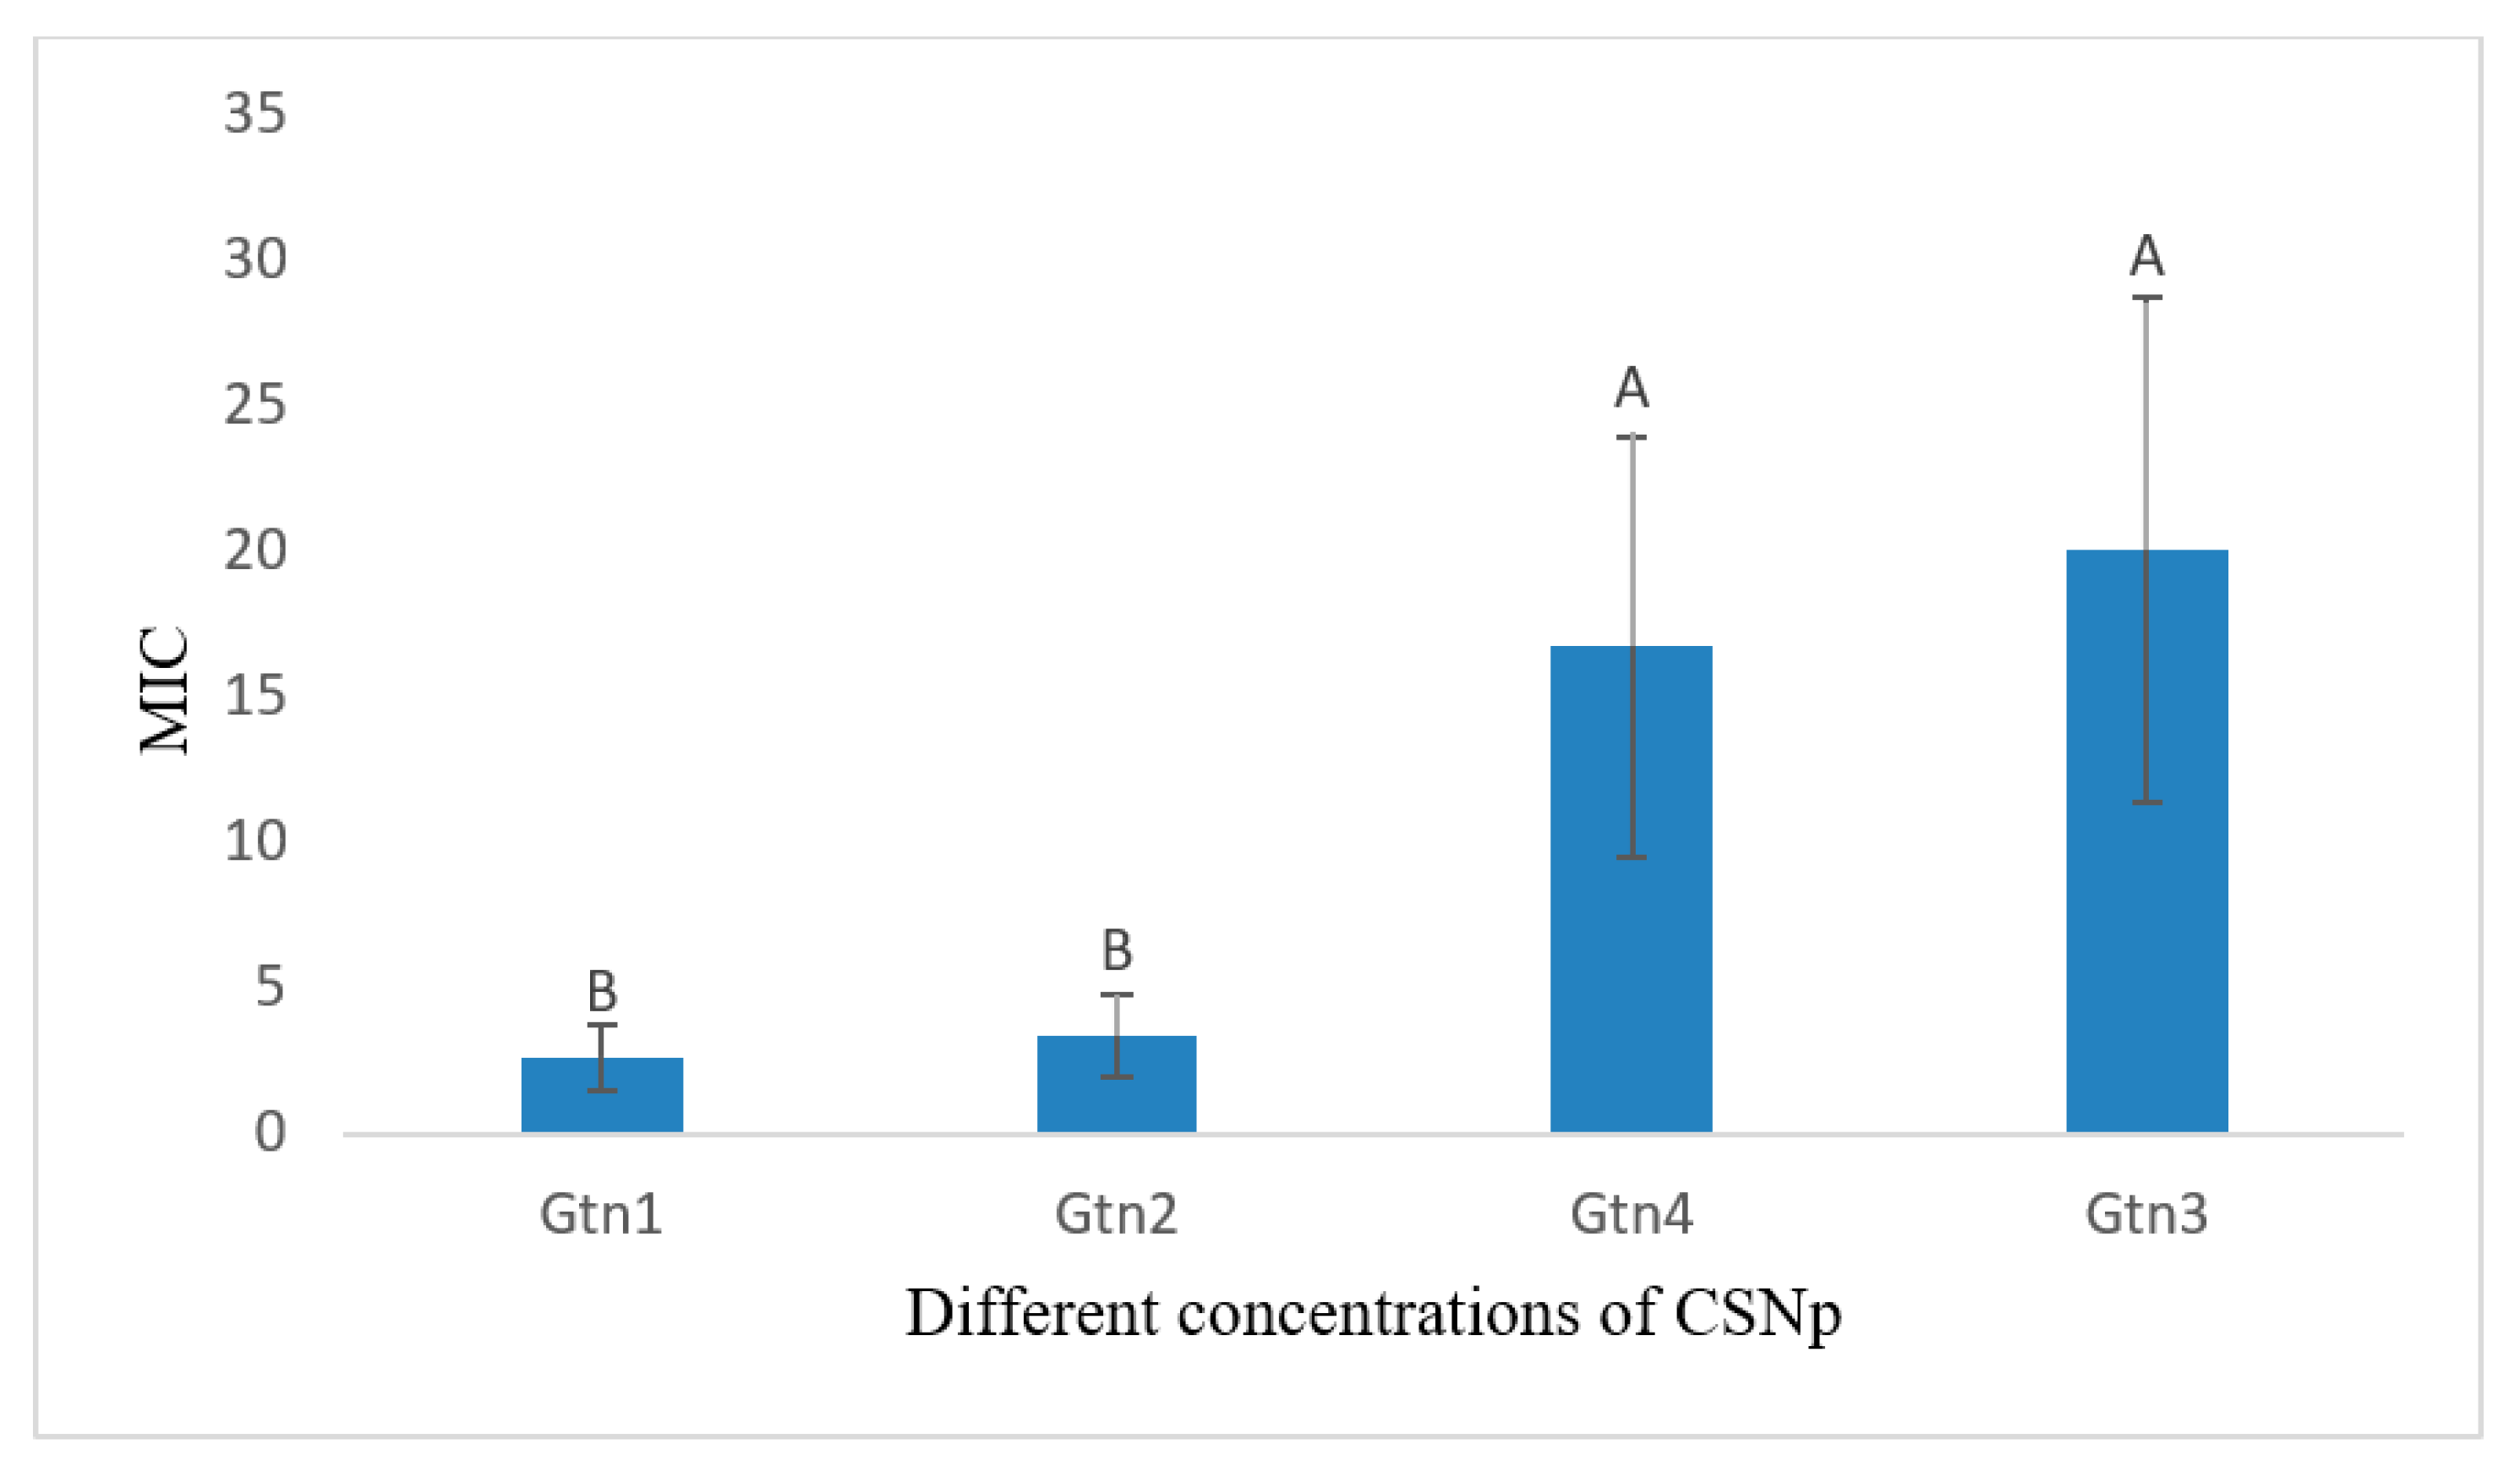
24]. The MIC is the lowest concentration of antibacterial agents that inhibit the growth of bacteria via serial dilution. In
Table 4, the MIC values of different concentrations of CSNp are shown. GTN1 (3.9 mg/µL) had the lowest value of MIC, which was (2.600 ± 1.126
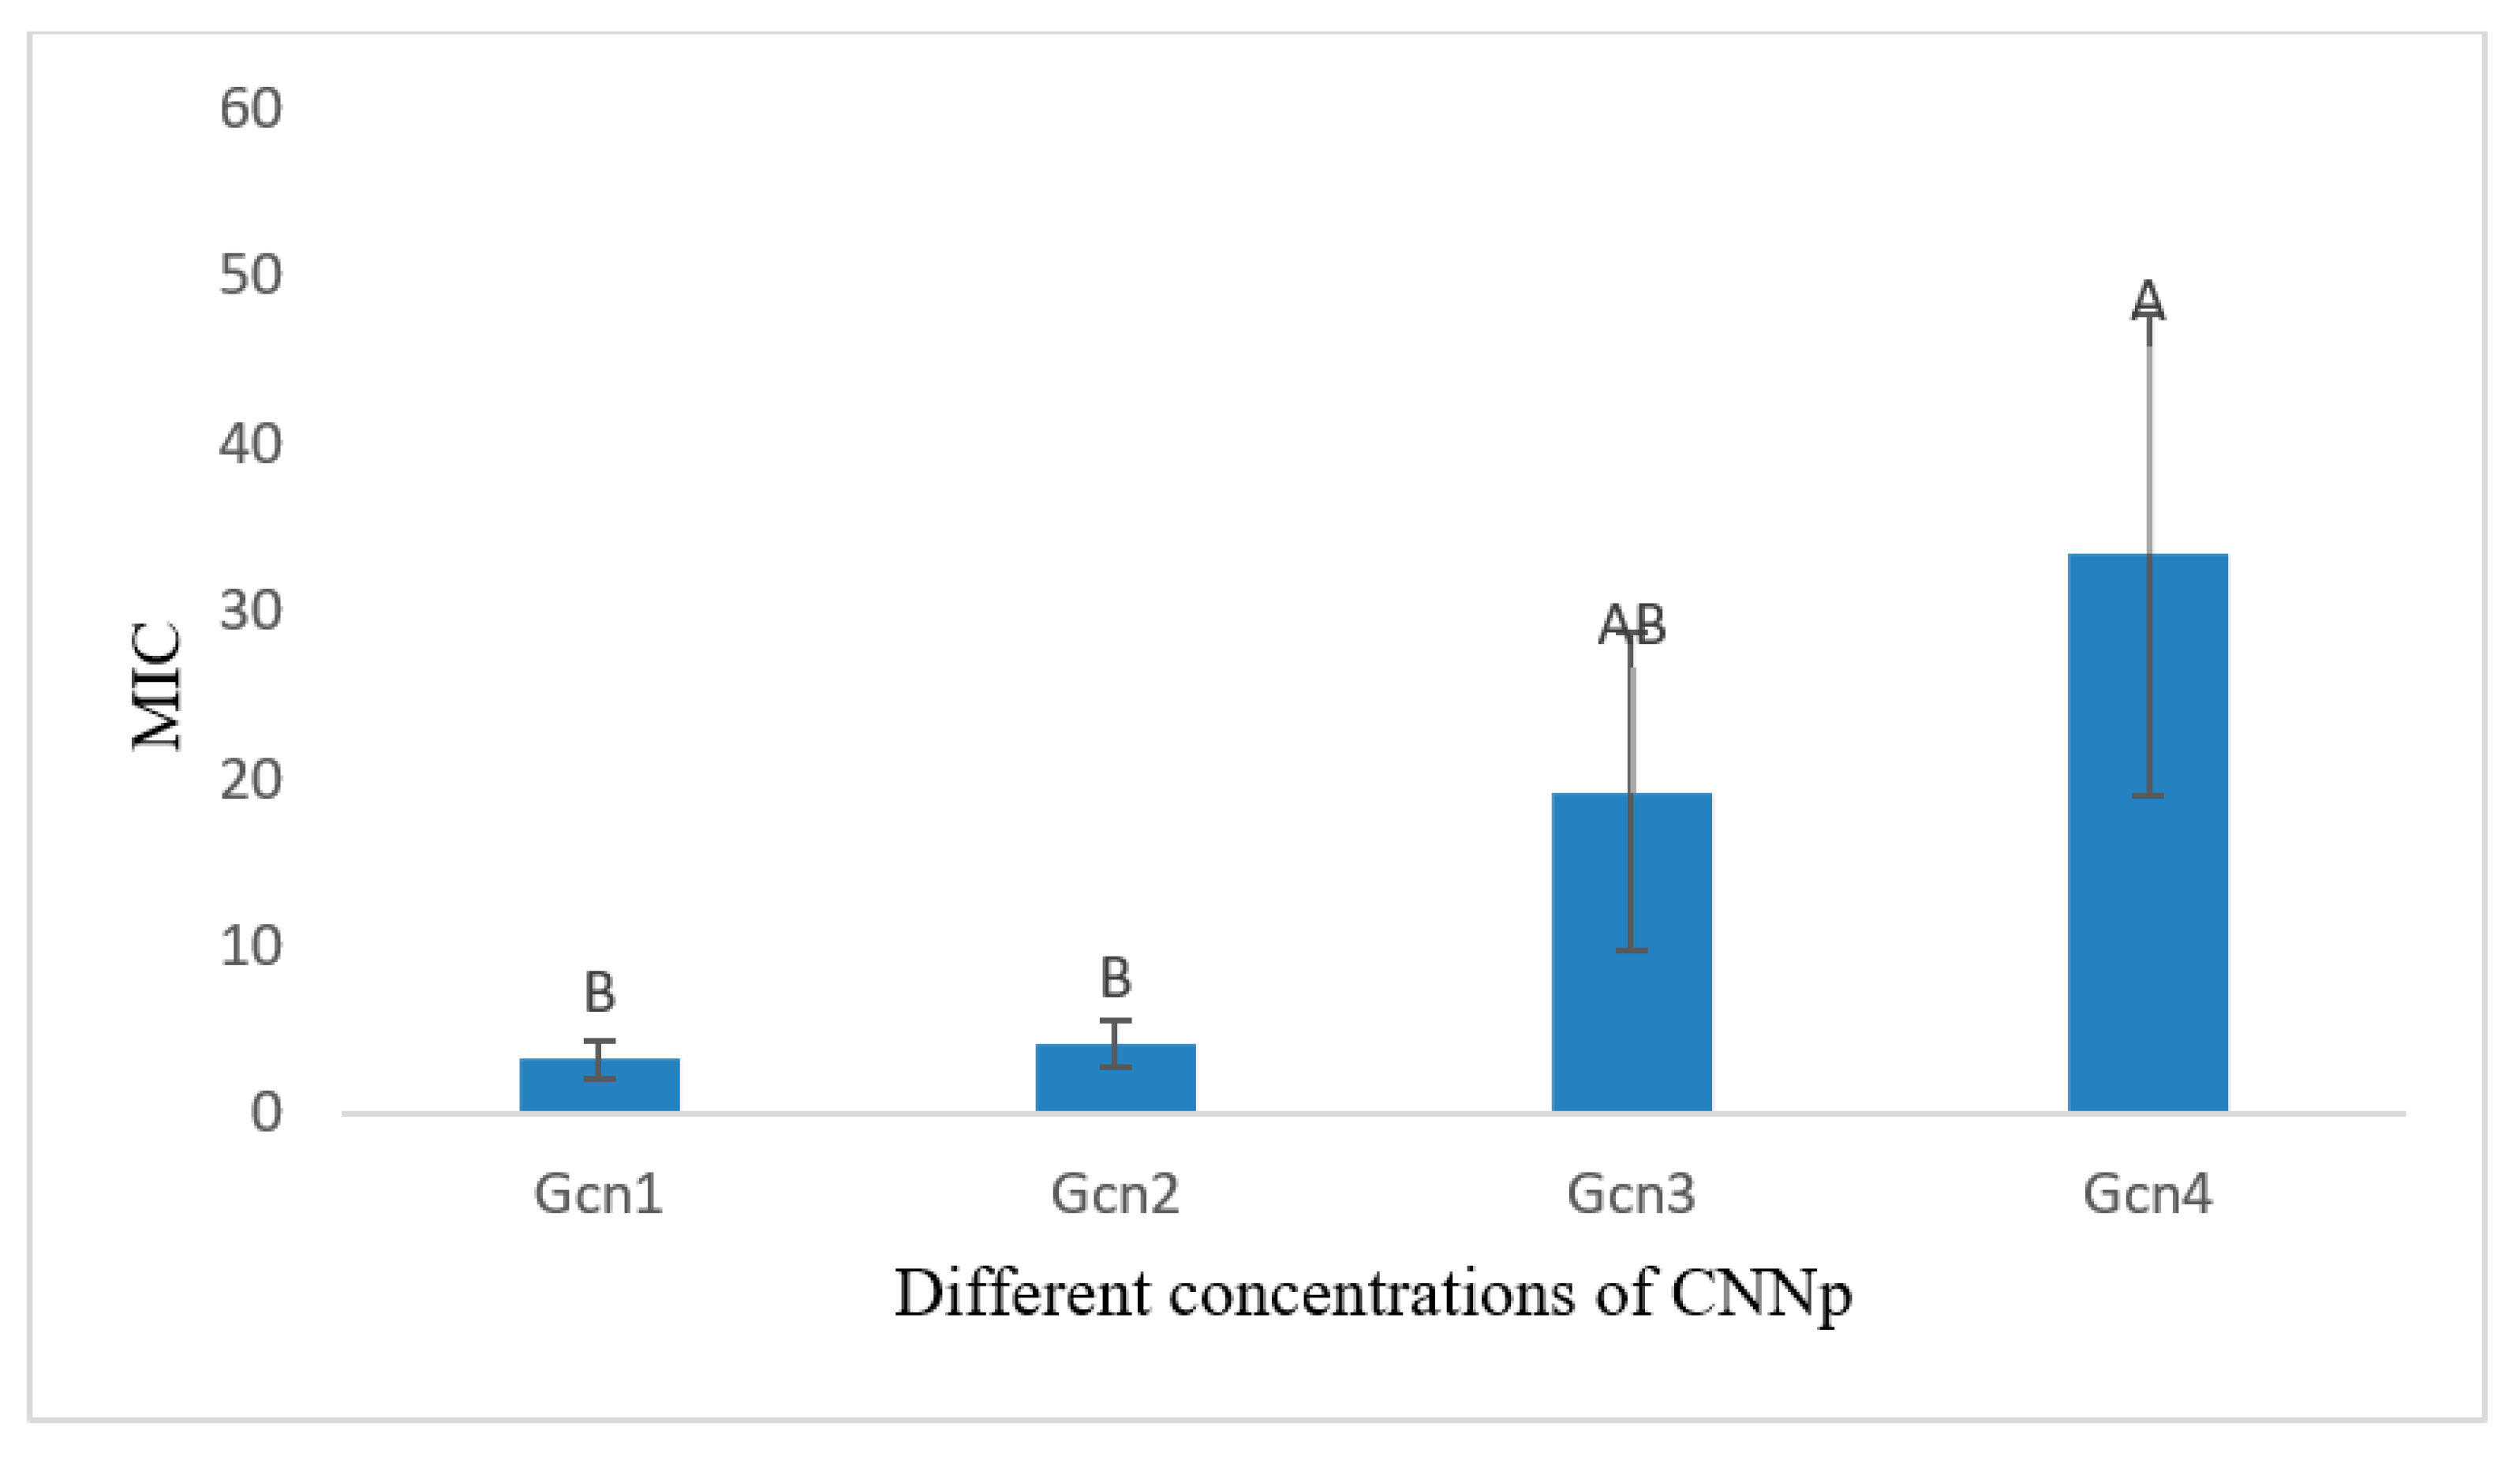
B). In
Table 6, the MIC values of different concentrations of CNNp are shown. GCN1 (3.9 mg/µL) had the lowest value of MIC, which was (3.250 ± 1.126
B). These findings are similar to Ref. [
25].
5. Conclusions
Gold nanoparticles of different sizes and shapes were synthesized via CSE and CNW, which act as reducing and stabilizing agents without implicating different physical and chemical methods. Gold nanoparticles were prepared via a biological method. This method is simple, eco-friendly and cost-effective and gives monodisperse, functional gold nanoparticles. The confirmation of gold nanoparticles was carried out via UV-Vis spectroscopy, DLS, FTIR, SEM, TEM and XRD. Camellia sinensis provided the formation of more stable nanoparticles and offered a wide range of particle sizes and shapes. In the current study, green gold nanoparticles showed excellent outcomes and maximum zones of inhibition against S. aureus. MICs were determined via the Broth Micro Dilution method against S. aureus. MIC outcomes were in accordance with the zone of inhibition; for example, the higher the zone of inhibition, the lower the MIC value, and vice versa.


 ,
, 


