Proceeding Paper

Application of Portable Spectroscopic Tools in the Exploration of Manganese Oxide Minerals: Preliminary Results from the Case Study of Drama Mn-Oxide Deposits, Northern Greece †

by
George Soulamidis
1,*,
Marjolene Jatteau
2,
Christina Stouraiti
1,
Panagiotis Voudouris
1,
Constantinos Mavrogonatos
1,
Konstantinos Soukis
1,
Cécile Fabre
2,
Marie-Camille Caumon
2,
Jean Cauzid
2 and
Alexandre Tarantola
2
1
Department of Geology and Geoenvironment, National and Kapodistrian University of Athens, 15784 Athens, Greece
2
GeoRessources, UMR 7359, Université de Lorraine-CNRS, 54000 Nancy, France
*
Author to whom correspondence should be addressed.
Presented at the 2nd International Conference on Raw Materials and Circular Economy “RawMat2023”, Athens, Greece, 28 August–2 September 2023.
Mater. Proc. 2023, 15(1), 54; https://doi.org/10.3390/materproc2023015054
Published: 27 November 2023

Abstract

:
In situ analysis techniques of ore and drill core samples provide fast results that can be used to facilitate the decision-making process during the geochemical exploration of ore deposits. This study applies the use of two portable devices, pXRF and Laser-Induced Breakdown Spectroscopy (pLIBS), to a small manganese oxide deposit situated in the Rhodope metamorphic complex, Kato Nevrokopi, northern Greece. The study provides an example of exploration of a variety of manganese minerals, including Mn-oxides, Mn-carbonates, and Mn-silicates. It tests the accuracy of mineral identification using these two techniques. The application of pXRF helped in the elemental identification of critical trace metals in certain Mn minerals and showed that there is Ag enrichment in the ore, which is associated with the mineral hetaerolite (ZnMn2O4). From the LIBS analysis, it can be seen that Mn minerals with different Mn valences (+2, +3, and +4) display distinct spectra. This observation will be further examined by expanding the sampling pool of the spectra of manganese oxides. It is postulated that the presence of trace elements in Mn minerals may differ according to the valence of the Mn, which in turn affects the LIBS signals of the sample.

1. Introduction

Due to their distinct structure, varied valence, and nanocrystallinity, manganese oxide minerals have a remarkable range of applications, with the most important being their energy storage uses. This is why, since 2023, manganese has been on the EU’s list of Critical Raw Materials (CRM) as a strategic metal [1]. Portable tools are important to geochemical exploration mainly because of their field accessibility, real-time analysis, and cost efficiency [2]. Through the use of Portable X-ray Fluorescence (pXRF) and Portable Laser-Induced Breakdown Spectroscopy (pLIBS), the elemental composition of the manganese minerals was investigated. X-ray fluorescence functions by subjecting the sample to X-rays and exciting its atoms, which subsequently emit distinct energies, aiding in identifying and quantifying elements within the sample. The advantages of pXRF include its versatility in handling various sample types (whole rock, powder, or pellet) and its semi-quantitative nature. However, it requires regular use of standardised samples for device calibration when precise quantitative results are necessary [3,4]. On the other hand, Laser-Induced Breakdown Spectroscopy operates by focusing a laser pulse on the sample, generating a small plasma spark composed of excited ions, electrons, and neutral atoms. As these components transition to lower energy states, they emit characteristic energies in the form of light, which the portable tool collects to determine the sample’s elemental composition. Portable LIBS offers the advantage of detecting all elements, both light and heavy, with peak intensity correlating to element concentration. Moreover, LIBS has the advantage of providing rapid compositional imaging at the microscale and for different geological materials [5]. Nonetheless, it is primarily a qualitative method, unlike pXRF. One drawback is that the laser creates a tiny crater on the sample’s surface [6,7].

2. Materials and Methods

Three samples of the manganese oxide ore were analysed. The samples were collected from the abandoned mining waste piles at Mavro Xylo and the 25th Km site in the Drama region of Northern Greece. The unmanaged deposition of waste rock and tailings containing high levels of manganese poses severe threats to the ecosystem and human health. On the other hand, the importance of recovering this valuable metal becomes more evident when considering its criticality [8]. Therefore, this study has double merit.
Mineralogical characterization was conducted via X-ray diffraction (Bruker D8 ADVANCE). XRD patterns were collected between 2θ angles of 5° and 75° (at Cu Κα radiation of 40 kV, 25 mA, and λ = 1.5406 Å). Mineral phases were identified using the Joint Committee for Power Diffraction Standards (JCPDS) file and the software DIFFRAC.EVA (https://www.bruker.com/en/products-and-solutions/diffractometers-and-x-ray-microscopes/x-ray-diffractometers/diffrac-suite-software/diffrac-eva.html accessed on 1 July 2023) provided by Bruker. All LIBS spectra acquisitions were obtained using a handheld instrument (Z300 SciAps © Instruments, Boston, MA, USA), while the XRF analyser used was a SciAps X-250 portable XRF.

3. Results and Discussion

The manganese ore samples were first analysed via X-ray diffraction to verify their mineralogy (Figure 1). Four manganese minerals were identified: pyrolusite (MnO2), hetaerolite (ZnMn2O4), rhodochrosite (MnCO3), and rhodonite (MnSiO3).

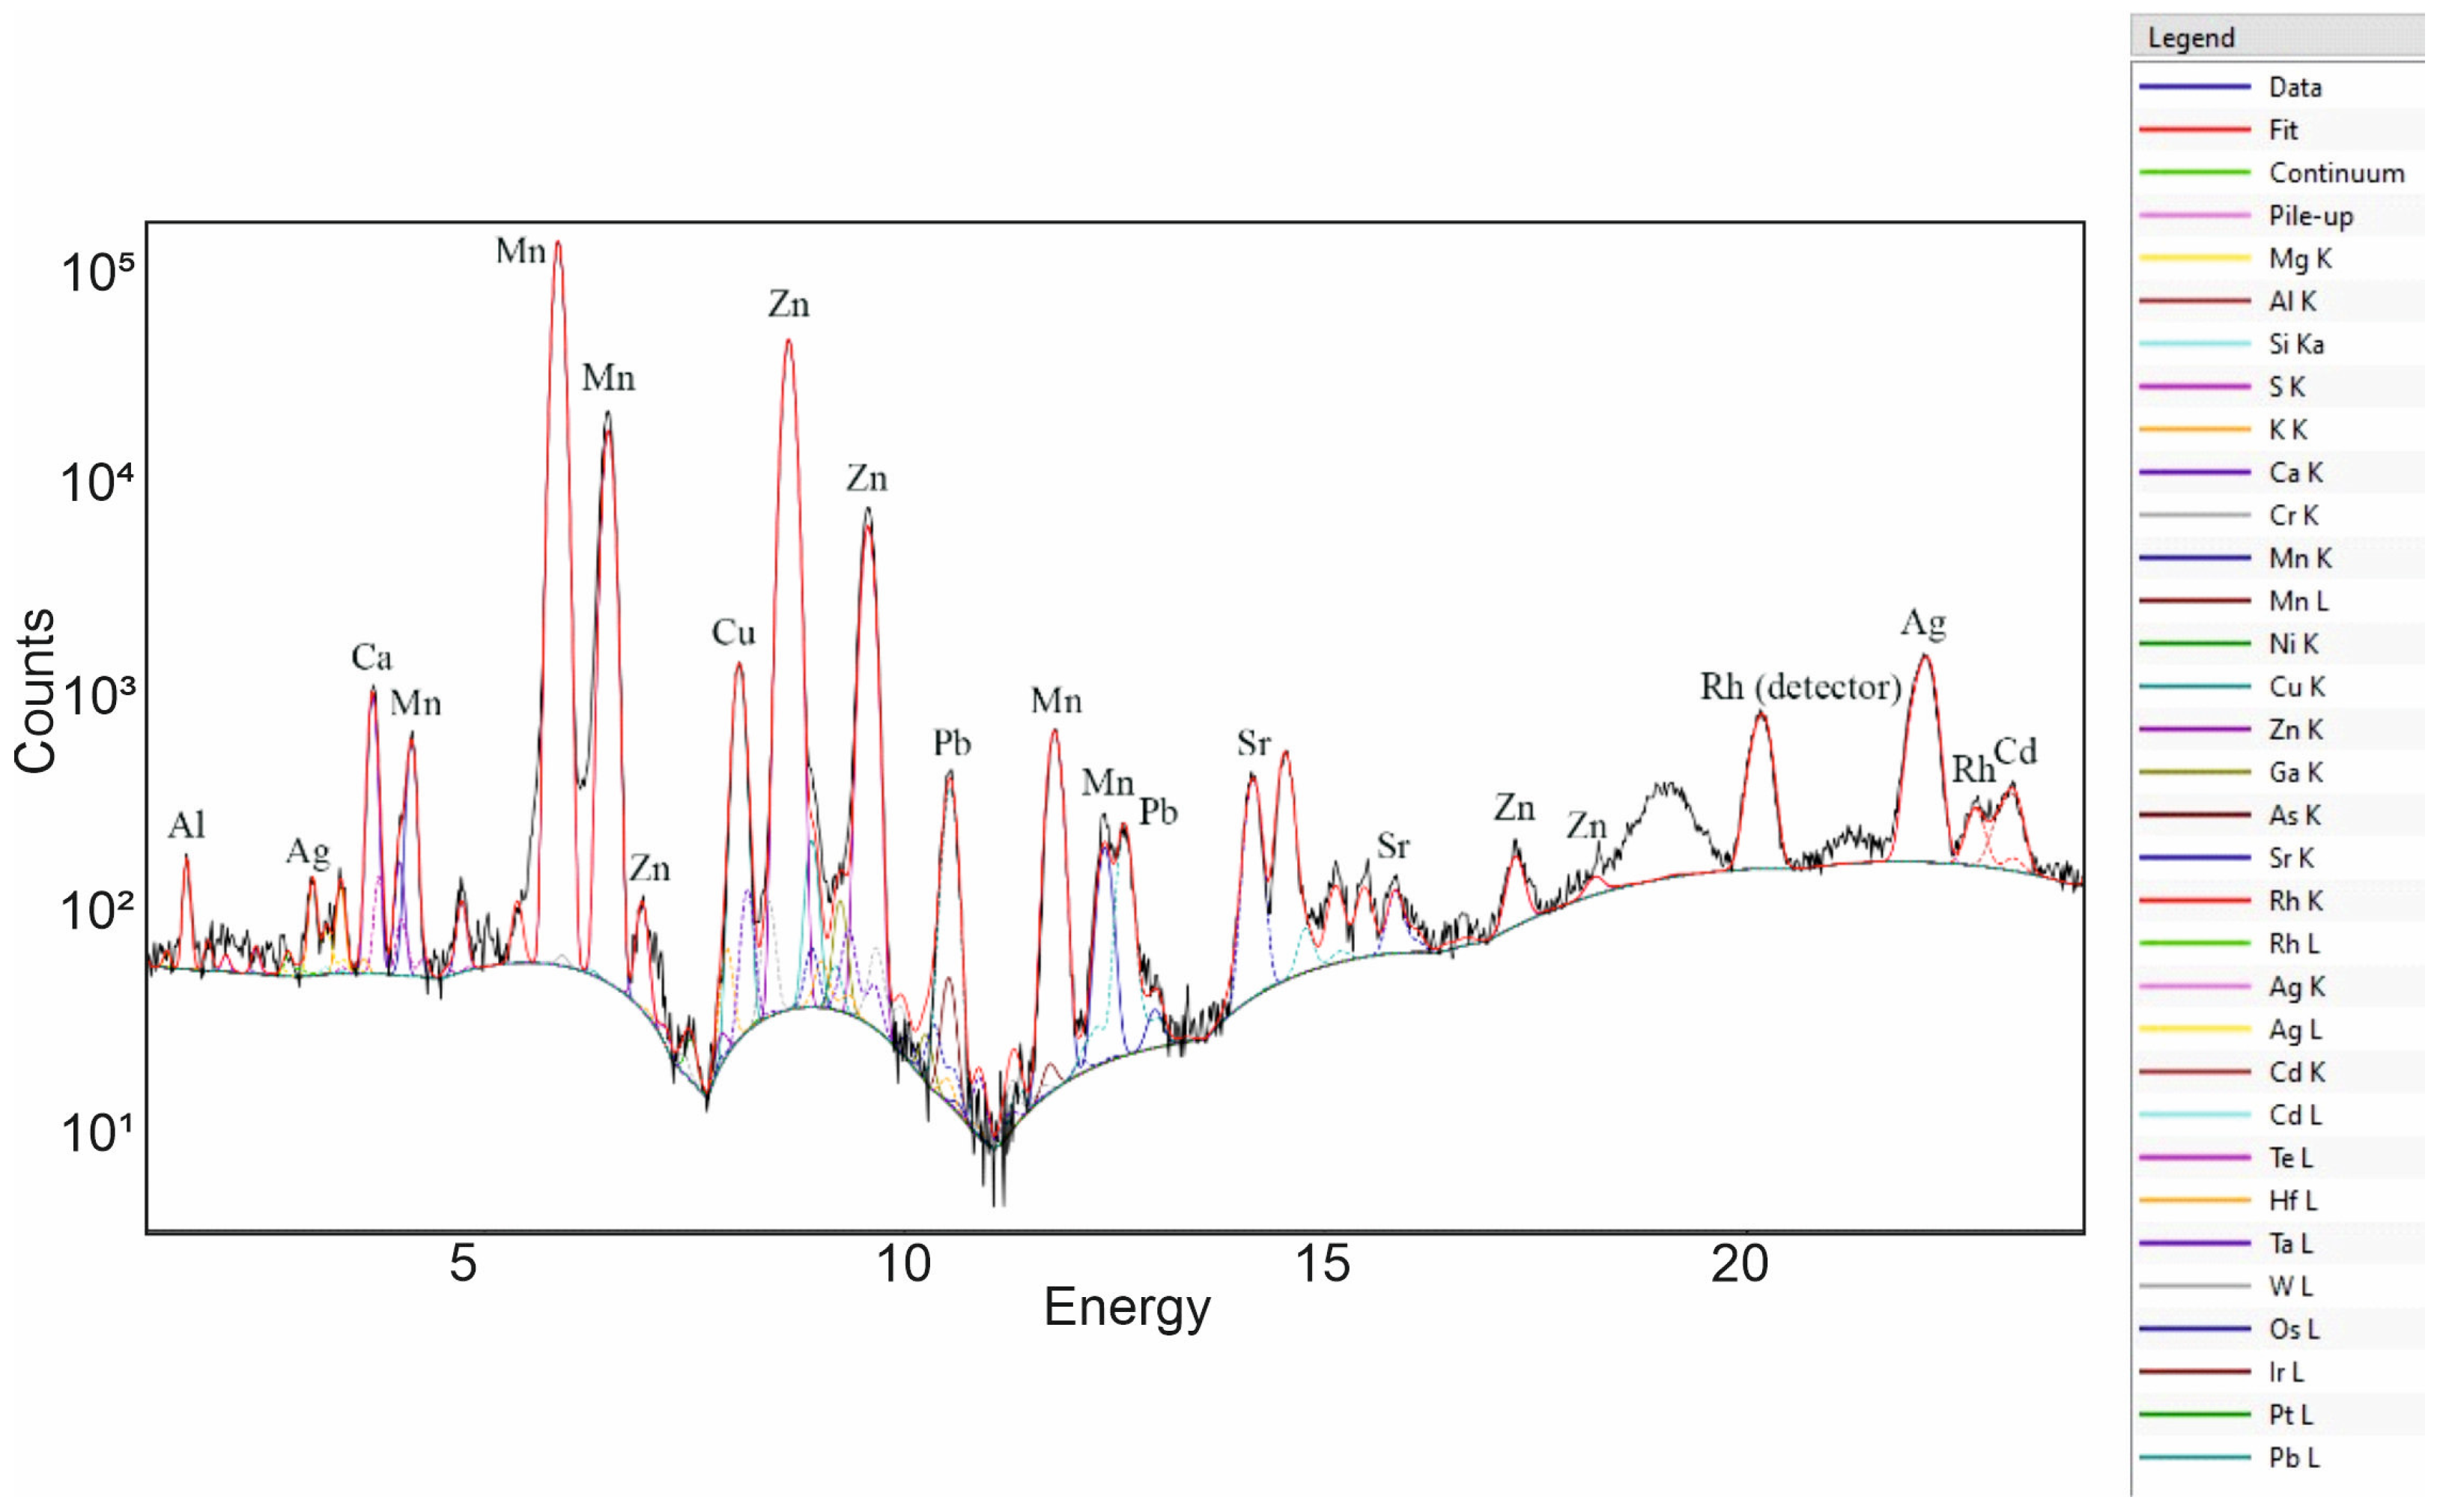
3.1. Portable X-ray Fluorescence

The samples of hetaerolite and pyrolusite were analysed using the portable XRF at a minimum of eight distinct spots per sample to obtain an average ore composition. The spectra of hetaerolite (Figure 2) contained numerous impurities (Cu, Ag, Pb, etc.), with the most important, in a significant amount, being that of silver (Table 1).

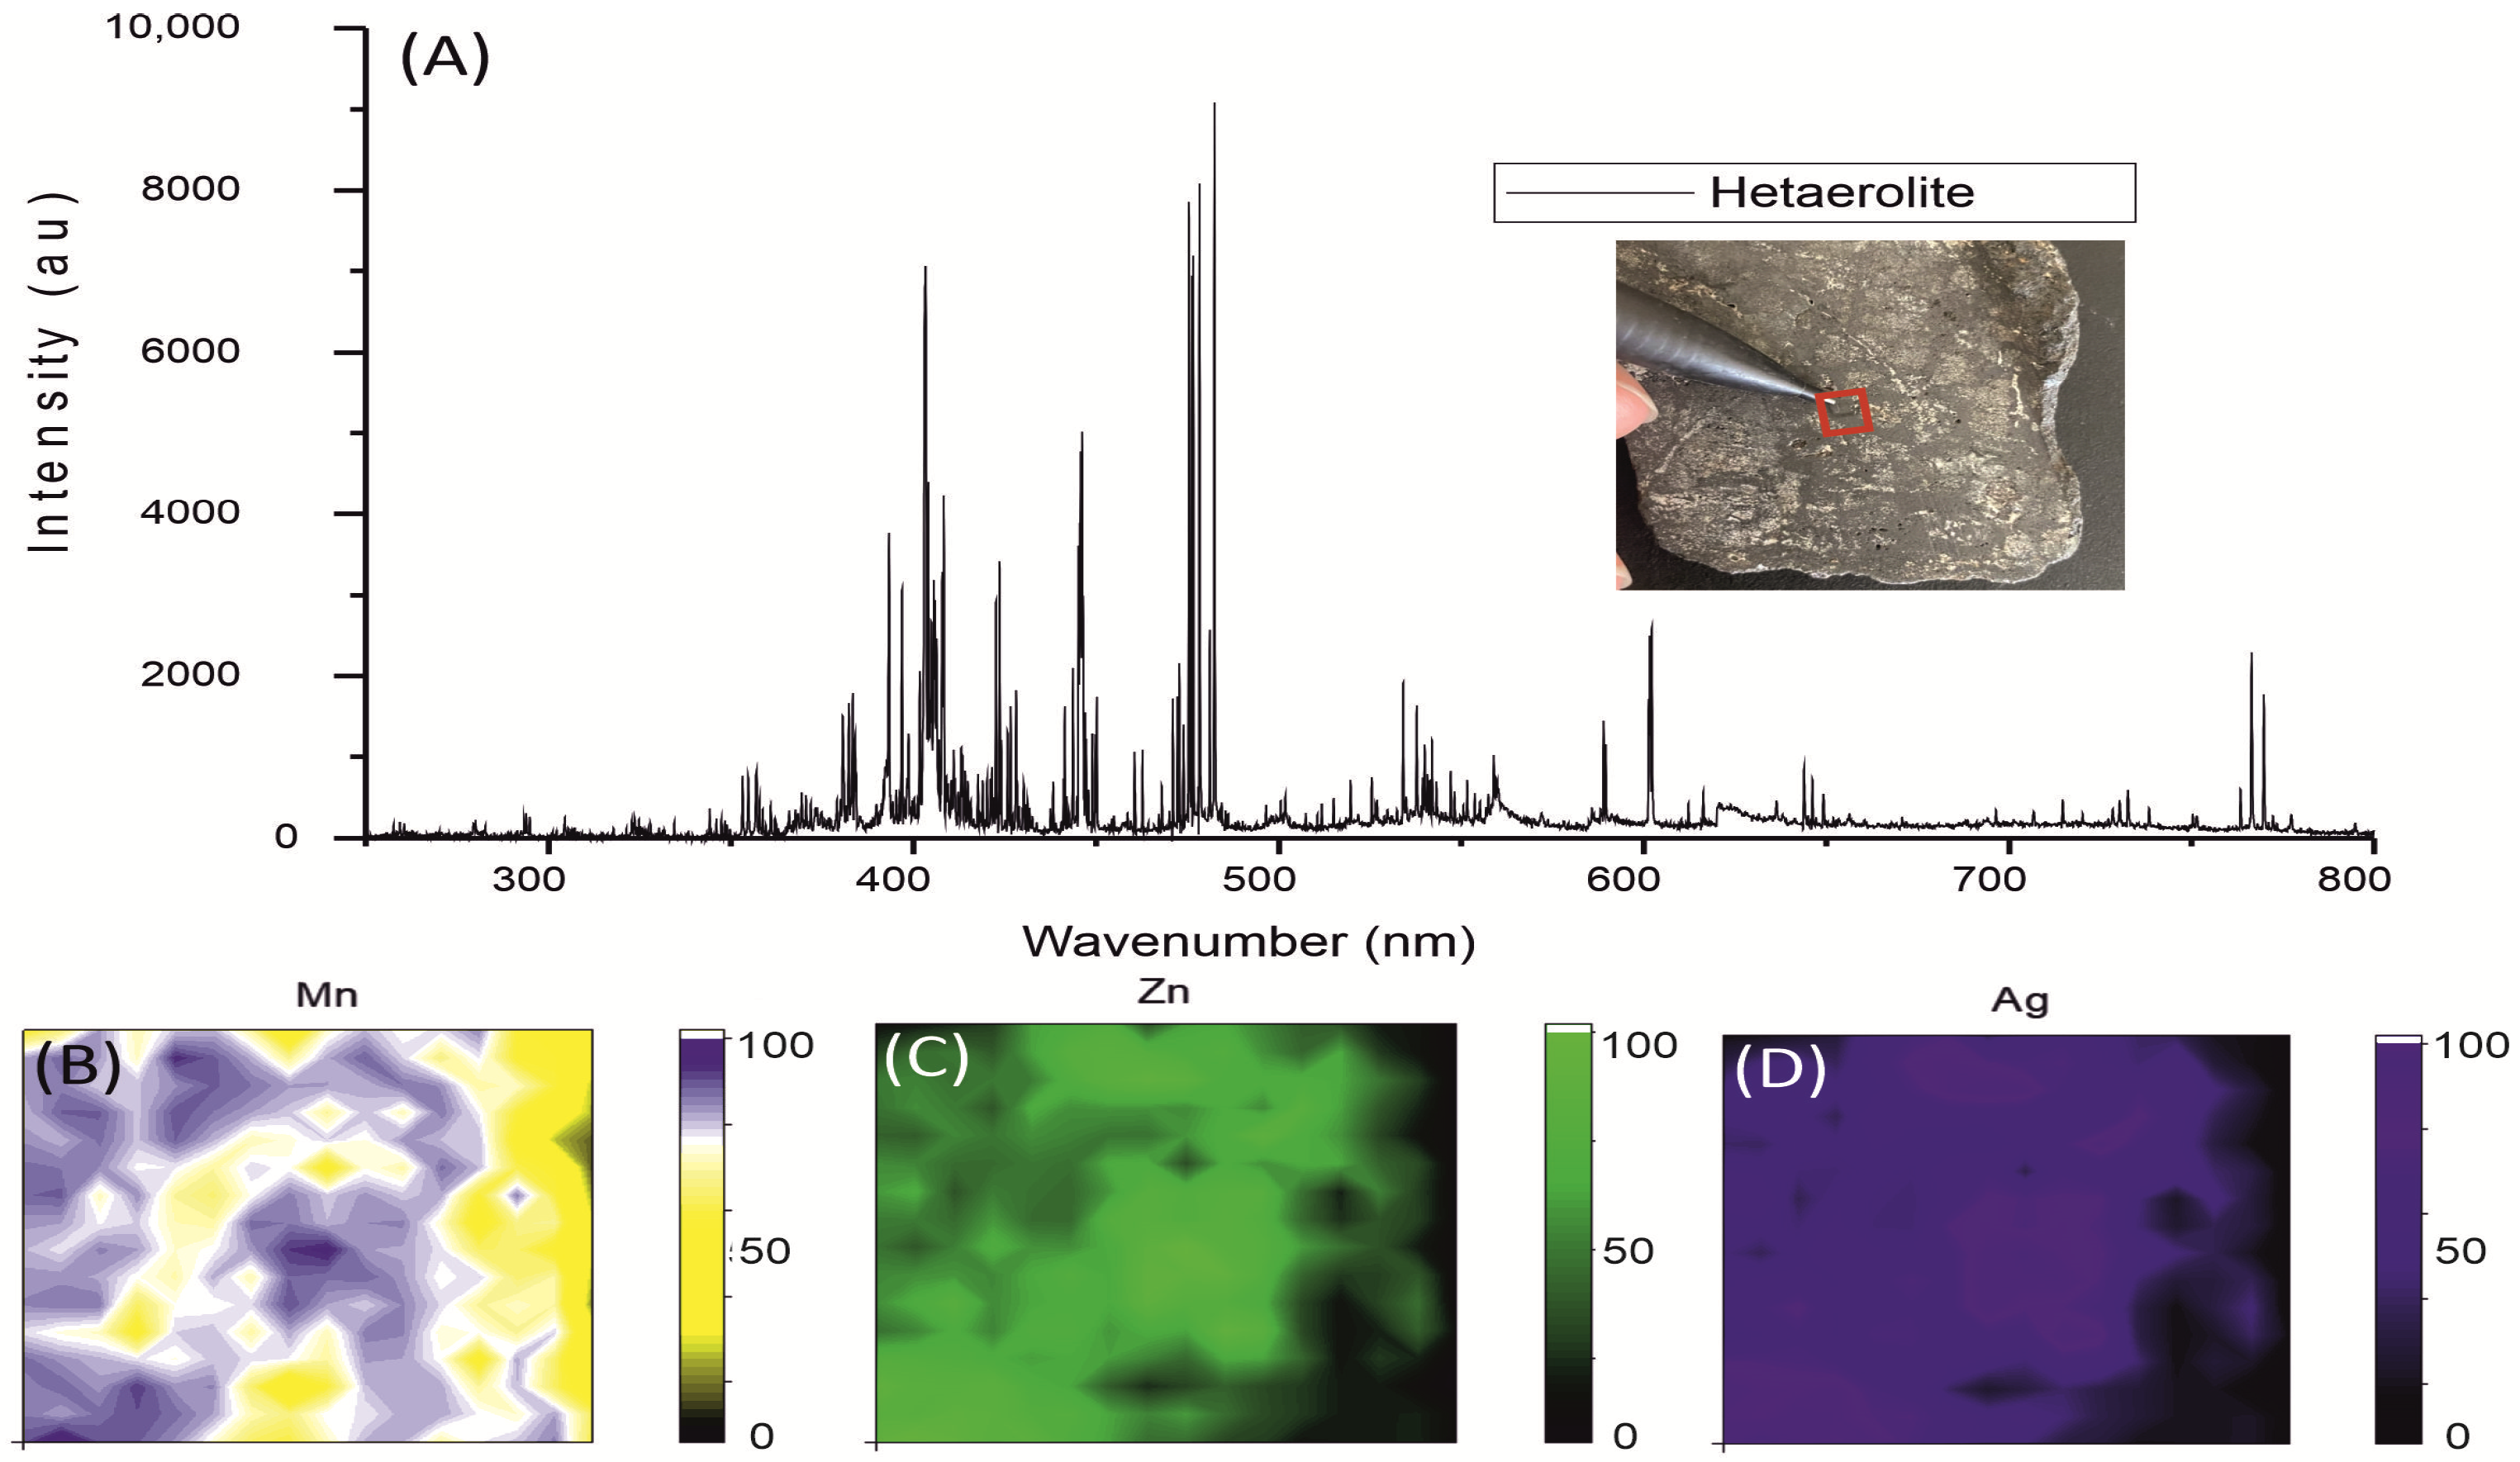
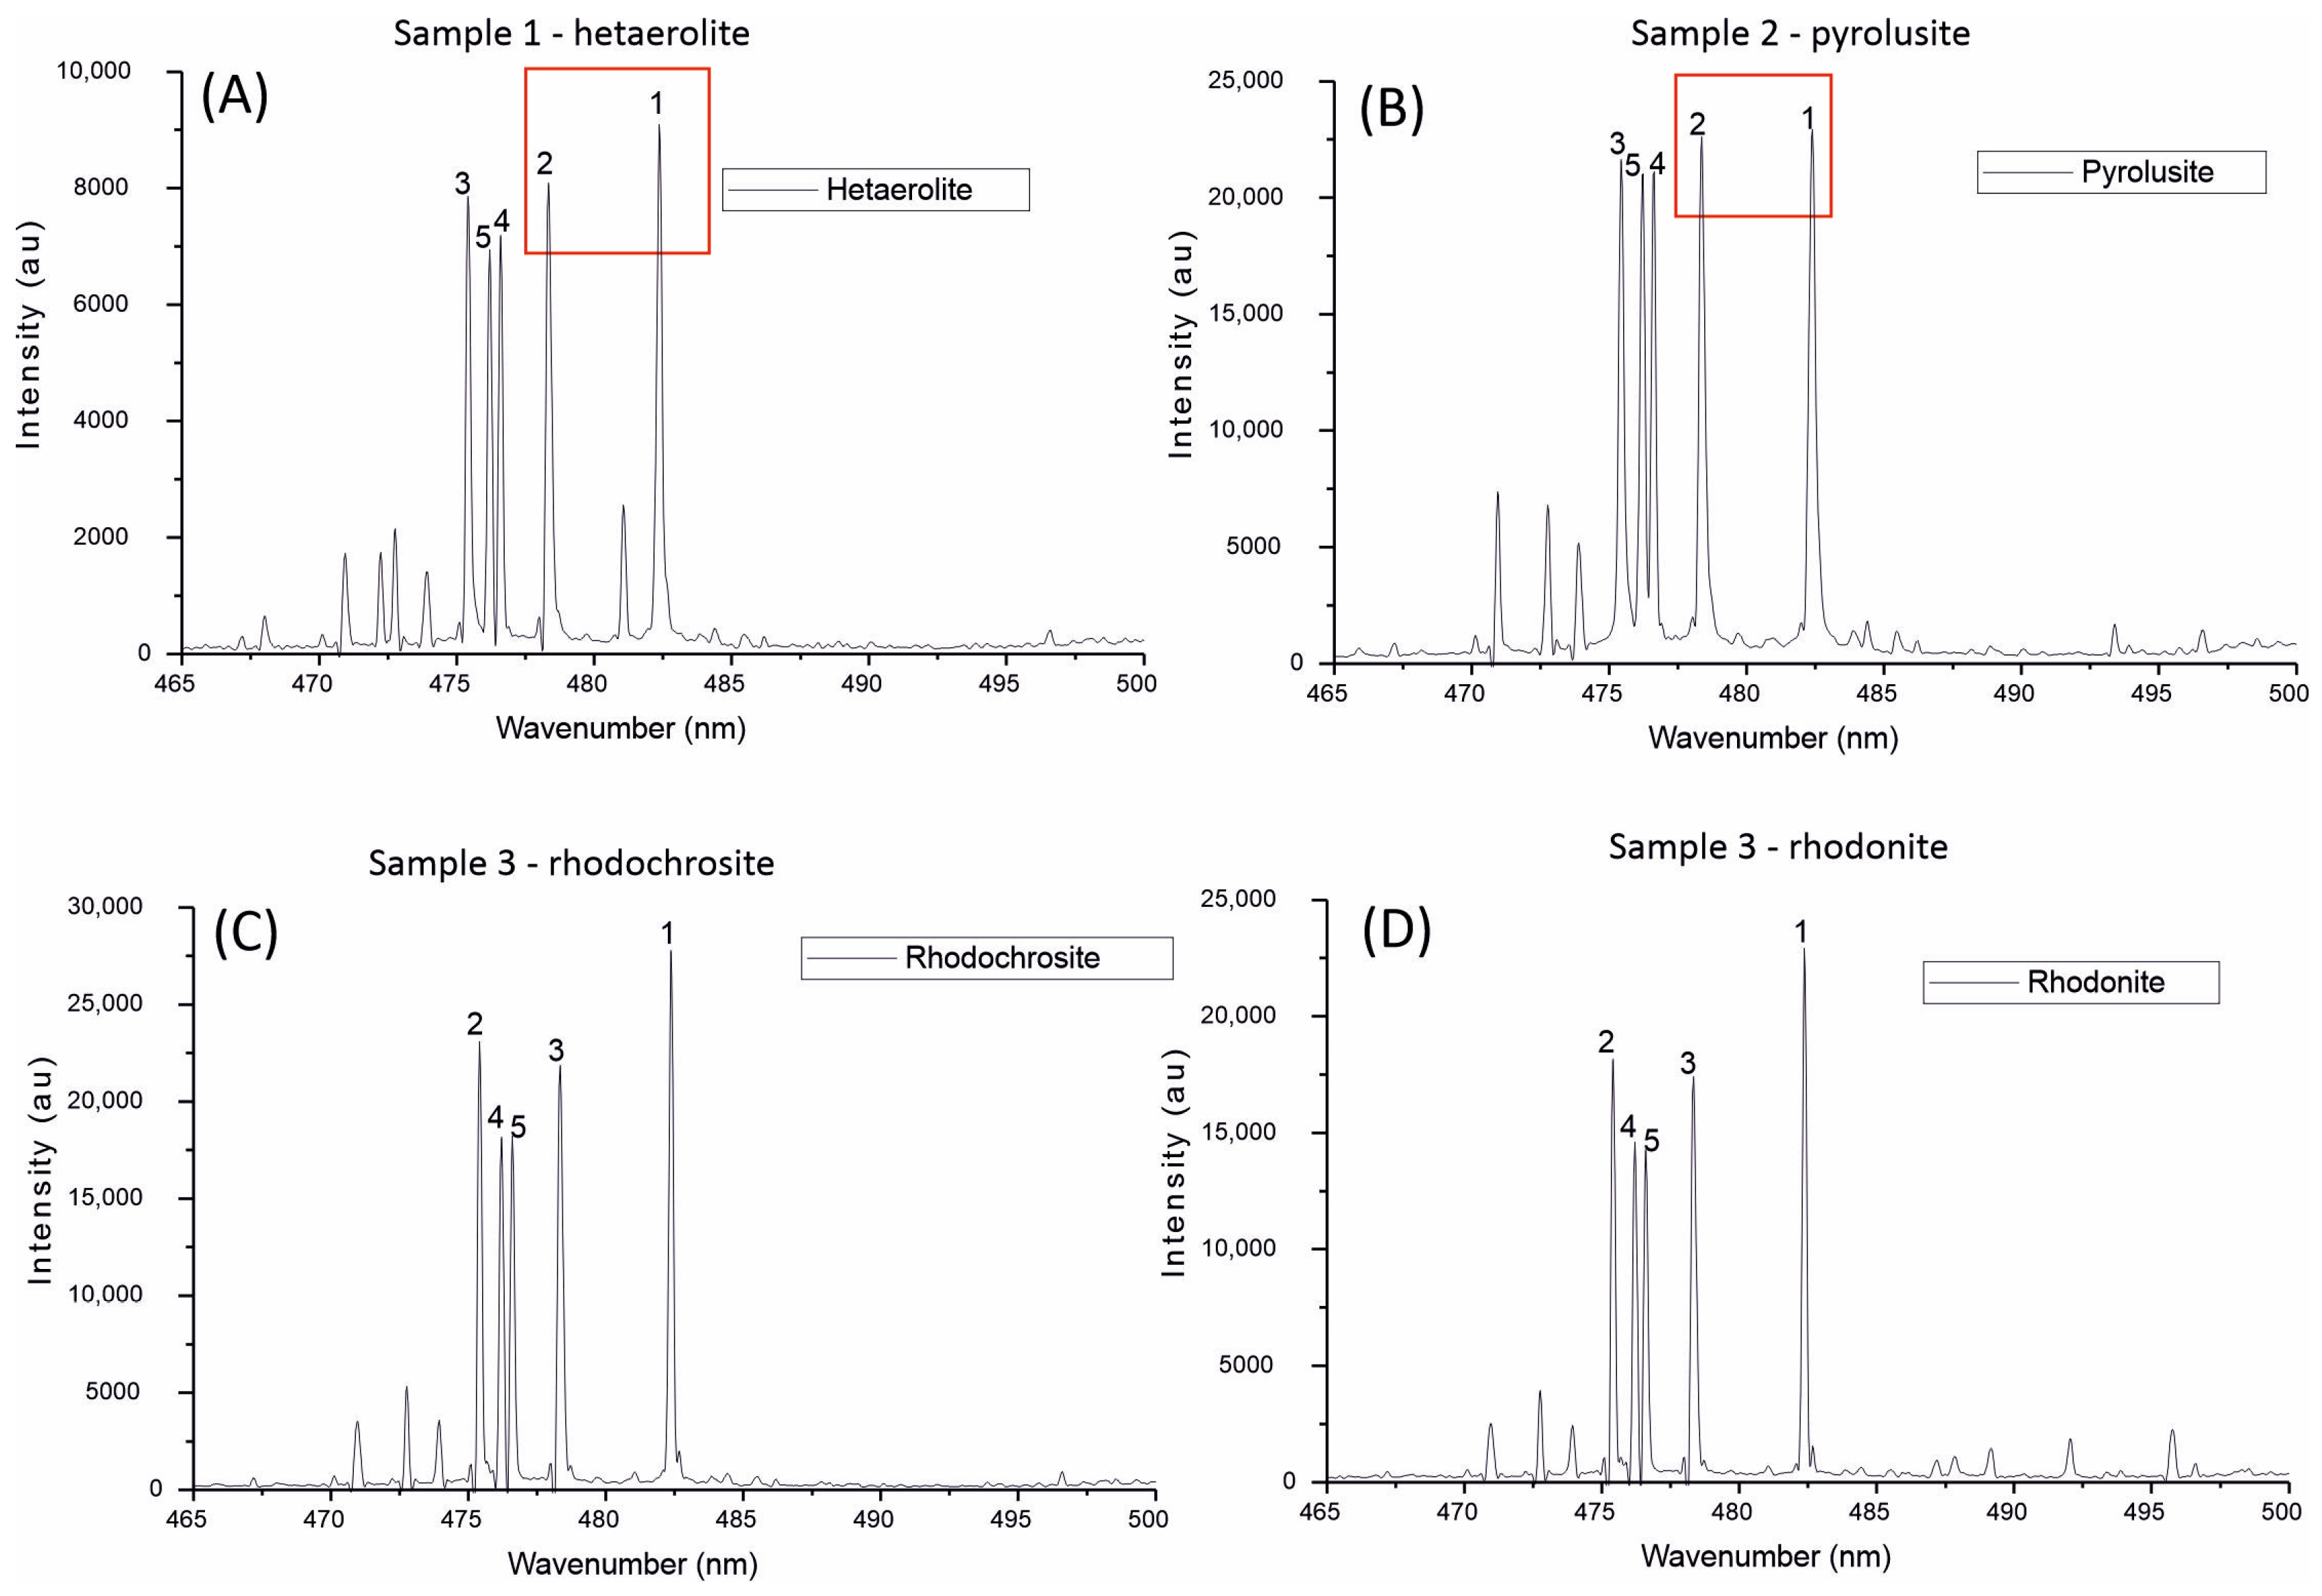
3.2. Portable Laser-Induced Breakdown Spectroscopy

The sample of hetaerolite was further investigated via elemental mapping to examine the distribution of different trace elements. The elemental map was constructed using a number of spot analyses in a grid of 16 × 16 spots in a location of our selection, with each spot having a scale of 100 μm. The elemental maps (Figure 3) show that manganese (Mn), zinc (Zn), and silver (Ag) have a similar intensity pattern, which indicates the presence of a silver-rich phase of hetaerolite.
Certain spots on the sample of the hetaerolite (Figure 4) show increased lithium (Li) concentration, which is spatially associated with aluminium (Al) and manganese (Mn). These three elements together indicate the possible occurrence of lithiophorite [(Al, Li)MnO2(OH)2]. This showcases the capabilities of mineral identification with portable LIBS on a microscale since it can give information that would not be possible to obtain with X-ray diffraction or X-ray fluorescence. In order to verify this occurrence, the sample will be further investigated, first with SEM (Scanning Electron Microscopy) and eventually with TEM (Transmission Electron Microscopy).
Solely from the LIBS spectra of the manganese minerals, which were identified with XRD (Figure 1), it is impossible to distinguish the different mineral phases of manganese. Having said that, it is indicated that it might be possible to determine the different manganese valences in the minerals (Figure 5). This indication is based on comparing the spectra of manganese minerals with known chemical composition and manganese valence. For each sample, at least nine measurements were performed in different areas, and each analysis was thoroughly investigated to find similarities or differences between the LIBS spectra of the manganese minerals. The samples of rhodochrosite and rhodonite, both consisting of divalent manganese, exhibited a similar intensity pattern that differed from the other two manganese oxides (tetravalent and trivalent). Despite their difference in valence, hetaerolite and pyrolusite have similar spectra, and their difference occurs only in the intensities of the first two manganese peaks.
To determine whether these observations were attributable to their distinct valences, three well-crystallised manganese oxide samples were analysed using portable LIBS provided by the Museum of Mineralogy and Petrology, NKUA (Figure 6). Two pyrolusites were selected, one originating from Germany and the other from Romania. Additionally, a manganite sample (Mn3+OOH) from Harz, Germany, was included as a mineral with the same Mn valence as hetaerolite. The findings revealed that the LIBS spectra of the well-crystallised pyrolusites (Museum samples) exhibited an identical intensity pattern to our pyrolusite sample. Compared to the tetravalent Mn oxides (pyrolusite), the trivalent manganese oxide minerals show a distinctly different pattern, which is a higher intensity difference between the first two manganese peaks.

4. Conclusions

The portable XRF provides a rapid semi-quantitative elemental composition of the ore sample, which can help organize a targeted geochemical exploration around a specific element, like silver (Ag), in this case. On the other hand, from the preliminary results of this research, portable LIBS’s primary outcome is that it might be possible to distinguish among the different valence manganese minerals. This indication needs further examination to be verified, with the next step being the expansion of the sampling pool for the manganese oxides. More samples of manganese minerals will be brought for analysis, originating from different areas of interest, while the same analyses will be conducted on their synthetic analogues to establish statistical significance. The combination of both portable spectroscopic techniques leads to easier mineral identification of the manganese phases. Furthermore, of greater significance is the indirect indication of the valence state of manganese in the ore mineral. Therefore, this data can be utilised to customise our mineral exploration for specific applications. For instance, manganese oxides with tetravalent manganese are the most suitable for energy storage purposes [9]. With this knowledge, we can strategically focus our exploration efforts on this particular objective.

Author Contributions

Methodology, G.S. and M.J.; validation, G.S., M.J., C.S., P.V., C.F. and A.T.; investigation, G.S. and M.J.; resources, G.S., M.J., P.V., J.C., C.F. and A.T.; data curation, G.S., M.J. and C.S.; writing—original draft preparation, G.S. and C.S.; writing—review and editing, G.S., M.J., C.S., P.V., K.S., C.M., J.C., C.F., M.-C.C. and A.T.; visualisation, G.S., C.S. and M.J.; supervision, G.S. and C.S. All authors have read and agreed to the published version of the manuscript.

Funding

The Hellenic Foundation for Research and Innovation (HFRI) supported GS’ research under the 4th Call for HFRI PhD Fellowships (Fellowship Number: 11210). This work was supported partly by the French PIA project “Lorraine Université d’Excellence”, reference ANR-15-IDEX-04-LUE.

Institutional Review Board Statement

Not relevant.

Informed Consent Statement

Not applicable.

Data Availability Statement

Data are contained within the article.

Acknowledgments

All powder diffraction data were collected in the National and Kapodistrian University of Athens X-ray Diffraction Core Facility. Additionally, we are grateful to the ARTeMIS ERASMUS+ project (Action for Research and Teaching Mineral Exploration Inclusive School), Grant Agreement No.: 2021-1-FR01-KA220-HED-000029934, which provided us with the scientific background and technological insight regarding the use of portable spectroscopic tools.

Conflicts of Interest

The authors declare no conflict of interest.

References

  1. European Commission. Regulation of the European Parliament and of the Council Establishing a Framework for Ensuring a Secure and Sustainable Supply of Critical Raw Materials and Amending Regulations (EU) 168/2013, (EU) 2018/858, 2018/1724 and (EU) 2019/1020 (COM/2023/160). EU Law—EUR-Lex. Available online: europa.eu (accessed on 10 August 2023).
  2. Balaram, V.; Sawant, S. Indicator Minerals, Pathfinder Elements, and Portable Analytical Instruments in Mineral Exploration Studies. Minerals 2022, 12, 394. [Google Scholar] [CrossRef]
  3. Kim, Y. Near Real-Time Reconciliation of Geochemical Data Acquired with Handheld Spectroscopic Devices: Application to Volcanogenic Massive Sulfide (VMS) Deposit from the Iberian Pyrite Belt. Ph.D. Thesis, Université de Lorraine, Lorraine, France, 2022. [Google Scholar]
  4. Lacroix, E.; Cauzid, J.; Teitler, Y.; Cathelineau, M. Near real-time management of spectral interferences with portable X-ray fluorescence spectrometers: Application to Sc quantification in nickeliferous laterite ores. Geochem. Explor. Environ. Anal. 2021, 21, 1–13. [Google Scholar] [CrossRef]
  5. Harmon, R.; Senesi, G. Laser-Induced Breakdown Spectroscopy—A geochemical tool for the 21st century. Appl. Geochem. 2021, 128, 104929. [Google Scholar] [CrossRef]
  6. Fabre, C.; Ourti, N.E.; Mercadier, J.; Cardoso-Fernandes, J.; Dias, F.; Perrotta, M.; Koerting, F.; Lima, A.; Kaestner, F.; Koellner, N.; et al. Analyses of Li-Rich Minerals Using Handheld LIBS Tool. Data 2021, 6, 68. [Google Scholar] [CrossRef]
  7. Fabre, C. Advances in Laser-Induced Breakdown Spectroscopy analysis for geology: A critical review. Spectrochem. Acta Part B At. Spectrosc. 2020, 166, 105799. [Google Scholar] [CrossRef]
  8. Bal, B.; Ghosh, S.; Das, A.P. Microbial recovery and recycling of manganese waste and their future application: A review. Geomicrobiol. J. 2018, 36, 85–96. [Google Scholar] [CrossRef]
  9. Guo, X.; Yang, S.; Wang, D.; Chen, A.; Wang, Y.; Li, P.; Liang, G.; Zhi, C. The energy storage mechanisms of MnO2 in batteries. Curr. Opin. Electrochem. 2021, 30, 100769. [Google Scholar] [CrossRef]
Figure 1. X-ray diffraction pattern of three different samples of manganese ore. (a) xrd pattern of the sample containing hetaerolite, (b) xrd pattern of the sample containing rhodonite, (c) xrd pattern of the sample containing pyrolusite, and (d) xrd pattern of the sample containing rhodochrosite.
Materproc 15 00054 g001
Figure 2. XRF spectrum of the sample of hetaerolite. In red is the fit line of the elements present in the sample; PyMCA was used for the elemental fitting. The unit of Energy is keV.
Materproc 15 00054 g002
Figure 3. Elemental map of the sample of hetaerolite created with the portable LIBS: (A) LIBS spectra of hetaerolite. Elemental maps of (B) Mn, (C) Zn, (D) and Ag.
Materproc 15 00054 g003
Figure 4. Elemental map of the sample of the hetaerolite, showing the presence of lithium (Li): (A) LIBS spectra of hetaerolite. (B) Photograph of the sample of hetaerolite; the red square is the position of the elemental map. (C) The enlarged LIBS spectra of hetaerolite show the two characteristic peaks of Li (610 nm and 671 nm). Elemental maps of (D) Mn, (E) Li, and (F) Al.
Materproc 15 00054 g004
Figure 5. Observations made from the spectra of manganese minerals. The LIBS spectra of the samples show only the five strongest peaks of Mn for (A) hetaerolite, (B) pyrolusite, (C) rhodochrosite, and (D) rhodonite.
Materproc 15 00054 g005
Figure 6. Portable LIBS analysis on well-crystallised manganese oxide minerals provided by the Museum of Mineralogy and Petrology (NKUA). (A) LIBS spectra of the sample of pyrolusite from Saxony (Germany). (B) LIBS spectra of the sample of pyrolusite from Transylvania (Romania). (C) LIBS spectra of the sample of manganite from Harz (Germany). (D,E) Photographs of the samples in the Museum of Mineralogy.
Materproc 15 00054 g006
Table 1. Semi-quantitative results from X-ray fluorescence analysis of the sample of hetaerolite (wt%).
Spot
Analysis
Mn (wt%)Zn (wt%)Ca (wt%)Ag (wt%)Cu (wt%)Pb (wt%)Cd (wt%)
154.5714.0718.550.220.410.070.08
256.1113.3711.380.250.450.080.07
355.8413.2324.290.220.180.170.08
432.303.2437.430.130.120.030.06
547.633.2424.960.160.170.110.06
666.8910.5416.880.330.340.060.07
766.0218.852.750.450.700.090.07
844.958.7433.230.160.150.100.07
Disclaimer/Publisher’s Note: The statements, opinions and data contained in all publications are solely those of the individual author(s) and contributor(s) and not of MDPI and/or the editor(s). MDPI and/or the editor(s) disclaim responsibility for any injury to people or property resulting from any ideas, methods, instructions or products referred to in the content.

